the role of calcium in the cell wall of grape berries€¦ · calcium grown berries demonstrated...
TRANSCRIPT

The Role of Calcium in the Cell
Wall of Grape Berries
By Bradleigh James Hocking
A thesis submitted in fulfilment of the requirements for the
degree of Doctor of Philosophy
School of Agriculture, Food & Wine
Faculty of Science
The University of Adelaide
September 2015
ii
Table of contents
Abstract…………………………………………………………………………………………………………….i
Declaration….. ...................................................................................................................................... iii
Acknowledgements .............................................................................................................................. iv
List of abbreviations .............................................................................................................................. v
Chapter 1 Apoplastic calcium influences hormonal signalling, fruit water status and cell wall
composition during fruit ripening ........................................................................................................ 1
1.1 Introduction ............................................................................................................................ 1
1.2 Plant calcium uptake, delivery and storage ......................................................................... 2
1.3 Calcium and water relations in fruit...................................................................................... 7
1.4 Calcium-cell wall interactions during fruit development .................................................. 11
1.5 Calcium-hormone interactions during fruit development................................................. 18
1.6 Conclusion ............................................................................................................................ 21
Chapter 2 Varietal differences in berry physical properties, nutrient accumulation and pectin
distribution…. ...................................................................................................................................... 23
2.1 Introduction .......................................................................................................................... 23
2.2 Materials and Methods ......................................................................................................... 23
2.2.1 Bunch and berry sampling ..................................................................................................... 23
2.2.2 Microscopy ............................................................................................................................ 24
2.2.3 Histological staining ............................................................................................................... 25
2.2.4 Immmunofluorescent staining ................................................................................................ 25
2.2.5 Berry physical testing ............................................................................................................. 26
2.2.6 Apoplast fluid centrifuge method............................................................................................ 27
2.2.7 Nutrient analysis; low volume apoplast method ..................................................................... 28
2.2.8 Total soluble sugars, pH and titratable acidity methods ......................................................... 29
2.2.9 Apoplastic ion selective electrode (ISE), pH and calcium activity measurements .................. 29
2.2.10 Principal component analysis ................................................................................................ 30
2.3 Results .................................................................................................................................. 30
2.3.1 Berry histological staining ...................................................................................................... 30
2.3.2 Berry immunofluorescent staining .......................................................................................... 31
2.3.3 Berry physical properties ....................................................................................................... 31
2.3.4 Berry tissue nutrient composition ........................................................................................... 35
2.3.5 Principal component analysis ................................................................................................ 39
2.4 Discussion ............................................................................................................................ 41
2.4.1 Berry phenolics ...................................................................................................................... 41
2.4.2 Berry cell morphology ............................................................................................................ 41
2.4.3 Berry pectin distribution ......................................................................................................... 42
2.4.4 Berry physical changes .......................................................................................................... 44
2.4.5 Berry apoplast interactions .................................................................................................... 44
2.5 Conclusion ............................................................................................................................ 46
Chapter 3 Grapevine calcium nutrition ........................................................................................... 48

iii
3.1 Introduction .......................................................................................................................... 48
3.2 Materials and Methods ......................................................................................................... 48
3.2.1 Fruiting cuttings; Mullins method modifications ...................................................................... 48
3.2.2 Hydroponics system design ................................................................................................... 49
3.2.3 Biomechanical testing ............................................................................................................ 50
3.2.4 Leaf water potential ............................................................................................................... 50
3.2.5 Gas exchange measurements ............................................................................................... 50
3.2.6 Root hydraulic conductance .................................................................................................. 51
3.2.7 ICP-AES analysis .................................................................................................................. 51
3.2.8 Bunch reproductive measures ............................................................................................... 51
3.3 Results .................................................................................................................................. 52
3.3.1 Effect of calcium treatments upon calcium uptake ................................................................. 52
3.3.2 Shiraz berry development responses to modified calcium nutrition ....................................... 55
3.3.3 Berry class diversity ............................................................................................................... 62
3.3.4 Vine physiology...................................................................................................................... 63
3.3.5 Chenin Blanc nutrient uptake from veraison to late harvest ................................................... 65
3.4 Discussion ............................................................................................................................ 70
3.4.1 Calcium deficiency accelerates berry ripening ....................................................................... 70
3.4.2 Elevated calcium impairs berry development......................................................................... 72
3.4.3 Calcium impact on vine fruitset and reproductive indices ...................................................... 73
3.4.4 Chenin Blanc nutrient accumulation consistent with other varieties ....................................... 74
3.5 Conclusion ............................................................................................................................ 74
Chapter 4 Berry ripening physiology; calcium uptake and cell wall modification ...................... 76
4.1 Introduction .......................................................................................................................... 76
4.2 Materials and Methods ......................................................................................................... 76
4.2.1 Grapevine material ................................................................................................................ 76
4.2.2 Immunogold labelling and transmission electron microscopy ................................................ 76
4.2.3 Berry staining methods; FDA and PI ...................................................................................... 77
4.2.4 MATLAB/ImageJ image analysis ........................................................................................... 78
4.2.5 Berry electrical impedance spectroscopy .............................................................................. 79
4.2.6 Berry rehydration assay ......................................................................................................... 79
4.2.7 Biomechanical testing ............................................................................................................ 80
4.2.8 Botrytis wounding assay ........................................................................................................ 80
4.3 Results .................................................................................................................................. 81
4.3.1 Cell wall modifications from veraison to late harvest ............................................................. 81
4.3.2 Fresh berry staining ............................................................................................................... 86
4.3.3 Berry electrical impedance spectroscopy .............................................................................. 89
4.3.4 Berry physical changes .......................................................................................................... 91
4.3.5 Berry water relations .............................................................................................................. 93
4.3.6 Botrytis susceptibility ............................................................................................................. 94
4.4 Discussion ............................................................................................................................ 95
4.4.1 Effect of calcium on pectin distribution ................................................................................... 95
4.4.2 Effect of calcium on berry softening ....................................................................................... 98

iv
4.4.3 Effect of calcium on berry water relations .............................................................................. 994.4.4 Effect of calcium on cell vitality ............................................................................................ 1004.4.5 Effect of calcium on Botrytis susceptibility ........................................................................... 1034.5 Conclusion.......................................................................................................................... 104
Chapter 5 General Discussion and Conclusion............................................................................ 1055.1 Grapevine calcium nutrition .............................................................................................. 1055.2 Berry calcium physiology.................................................................................................. 1075.3 Implications of calcium nutrition for fruit quality ............................................................ 1075.4 Future perspectives and Conclusion ............................................................................... 110
Appendices ........................................................................................................................................ 112Appendix 1 .....................................................................................................................................
.....................................................................................................................................
.....................................................................................................................................112
Appendix 2 113Appendix 3 114Appendix 4 ..................................................................................................................................... 123Appendix 5 ..................................................................................................................................... 125Appendix 6 ..................................................................................................................................... 129Appendix 7 ..................................................................................................................................... 133Appendix 8 ..................................................................................................................................... 134
Reference list ..................................................................................................................................... 135

i
Abstract
Calcium has defined roles in plant signalling, water relations and cell wall interactions. Calcium nutrition
impacts fruit quality by facilitating developmental and stress response signalling, stabilising
membranes, and modifying cell wall properties through cross-linking of de-esterified pectins. The
importance of calcium in fruit development and ripening is reviewed, experimental work probing the
relationship between calcium nutrition and fruit development in grape berries is undertaken.
Relationships between calcium uptake and pectin modification were investigated in a survey of red,
white, and table grape varieties collected from two sites varying in calcium levels. Grapes harvested at
the Barossa site showed higher calcium concentrations within apoplastic fluid, skin and mesocarp
tissues than those from Waite. Chenin Blanc had higher apoplastic calcium content than other varieties.
Fluorescent immuno-labelling revealed de-esterified pectin localisation in the middle lamella of all
varieties with punctillate staining patterns observed in Grenache and Thompson Seedless. A negative
correlation between apoplastic pH and apoplastic calcium concentration was observed. Shiraz was the
only variety to demonstrate any significant difference between sites in apoplastic pH and apoplastic
calcium activity.
Effects of low and high calcium supply in grapevines were investigated. Low calcium grown Shiraz
showed early berry softening and onset of berry weight loss. High calcium grown Shiraz showed
delayed and asynchronous fruit development. Berry hydration assays indicated that early onset of berry
weight loss in low calcium grown berries was a result of higher post-veraison berry transpiration. High
calcium grown berries demonstrated lower berry water uptake rate pre-veraison, and lower berry
transpiration rates throughout development. Whole vine physiology was assessed in Chenin Blanc;
high calcium grown vines demonstrated reduced transpiration and net assimilation rates compared to
basal and low calcium grown vines.
An image analysis macro was developed for quantification of cell vitality (with fluorescein diacetate;
FDA) and pectin de-esterification (with propidium iodide; PI) staining patterns. Chenin Blanc maintained
higher PI staining in skin tissue than Shiraz throughout development; higher magnification imaging
revealed this staining to be localised to the epidermis and peripheral vasculature of Chenin Blanc
berries.

ii
Transmission electron microscopy demonstrated cuticle localisation of de-esterified pectin in Chenin
Blanc and Shiraz berries, particularly of low calcium grown berries; low levels of calcium-pectin cross-
linkages and high rates of berry transpiration result in increased movement of de-esterified pectin from
the epidermis into the cuticle. Shiraz cuticle de-esterified pectin levels increased throughout
development, indicating pectin solubilisation. Chenin Blanc showed strong de-esterified pectin labelling
in epidermal and hypodermal cell walls, consistent with patterns visualised using PI staining. Low
calcium grown Chenin Blanc berries showed a higher Botrytis infection rate than basal or high calcium
grown berries.
Differences in calcium accumulation and pectin modification contribute to varietal diversity in ripening
physiology. Berries supplied with low calcium are early softening and susceptible to shrivel and Botrytis
infection, whereas high calcium supply results in changes in vine physiology, including delayed and
asynchronous berry development.

iii
Declaration
I certify that this work contains no material which has been accepted for the award of any other degree
or diploma in my name in any university or other tertiary institution and, to the best of my knowledge
and belief, contains no material previously published or written by another person, except where due
reference has been made in the text. In addition, I certify that no part of this work will, in the future, be
used in a submission in my name for any other degree or diploma in any university or tertiary institution
without the prior approval of the University of Adelaide and where applicable, any partner institution
responsible for the joint award of this degree.
I give consent to this copy of my thesis, when deposited in the University Library, being made available
for loan and photocopying, subject to the provisions of the Copyright Act 1968.
The author acknowledges that copyright of published works within this thesis resides with the copyright
holder(s) of those works.
I also give permission for the digital version to be made available on the web, via the University’s digital
research repository, the Library Search and also through web search engines, unless permission has
been granted by the University to restrict access for a period of time.
…………………………….. …………….
Bradleigh James Hocking

iv
Acknowledgements
I thank my supervisors Associate Professor Matthew Gilliham, Associate Professor Rachel Burton, and
Professor Steve Tyerman, for their ongoing guidance and support throughout this project. Particular
thanks go to Matt for his persistence and encouragement. I greatly appreciate the time Matt has spent
reading and discussing this work.
I thank the University of Adelaide, Wine 2030, and the Farrer Memorial Trust, for their support of this
project in the form of resources and funding.
I thank my lab colleagues for sharing their enthusiasm and expertise. Particular thanks go to Wendy
Sullivan for experimental assistance and Johannes Scharwies for sharing his designs.
I thank the various others who have made significant contributions; Dr Cassandra Collins for her
viticultural advice and guidance in data analysis, Cameron Nowell for his assistance in image analysis,
Chris Fiebiger for kindly providing experimental material from his vineyard.
I thank my family for their unshakeable faith in me, and all of the things they have taught me. I thank
Asmini Athman for her wonderful support and encouragement, without which I would not have
completed this journey. I thank my friends for expressing their love of life in conversation and
celebration.

v
List of abbreviations
ABA Abscisic acid AGJ Artificial grape juice ANOVA Analysis of variance apo apoplast Ara Arabinan BNS Basal nutrient solution Cel Cellulose Ca2+ Calcium ion CEC Cation exchange capacity CI Coulure Index Cm Membrane capacitance cyt cytosol DAA Days after anthesis DW Dry weight FDA Fluorescein di-acetate GA Gibberellic acid Gal Galactan HCS High calcium solution HG Homogalacturonan IAA Indole acetic acid ICP-AES Inductively coupled plasma atomic emission spectroscopy IRGA Infra-red gas analyser ISE Ion selective electrode LCS Low calcium solution LGO Live green ovary MI Millerandage Index OGA Oligogalacturonide PCA Principal component analysis PG Polygalacturonase PI Propidium iodide PID PINOID PIN PIN-FORMED PM Plasma membrane PME Pectin methyl-esterase PMEI Pectin methyl-esterase inhibitor QTL Quantitative trait loci Re Extracellular resistance Rh Hydraulic resistance Ri Intracellular resistance RT Xylem hydraulic resistance RG-I Rhamnogalacturonan-I RG-II Rhamnogalacturonan-II SD Standard deviation TEM Transmission electron microscopy WAK Wall associated kinase XG Xyloglucan
1
Chapter 1 Apoplastic calcium influences hormonal signalling, fruit water status
and cell wall composition during fruit ripening
1.1 Introduction
Calcium has defined roles in signalling, water relations and cell wall interactions. Although significant
research into these individual roles in various tissues has been carried out, the holistic role that calcium
plays in fruit ripening is not well defined. This review will provide a brief overview of many of the
fundamental roles of calcium in plant physiology, working towards an improved understanding of how
these processes can interact to influence fruit ripening, and proposes future research directions to fill
our knowledge gaps.
Calcium is a phloem immobile element that accumulates in fruit via the xylem (White, 2012). During
ripening stages, xylem influx into most fruit is minimal (Lang, 1990; McCarthy and Coombe, 1999),
resulting in potential for localised calcium deficiencies. Therefore, the partitioning of calcium within fruit
is important for normal fruit development. How hydraulic conductance of fruit vascular components
(Drazeta et al., 2004; Castellarin et al., 2011; Mazzeo et al., 2013) and turgor pressure of tissues
(Thomas et al., 2008; Castellarin et al., 2011) can change throughout development due to solute
unloading, cellular expansion, and cell wall modification are important factors for determining the
distribution of calcium within fruit will be specifically discussed.
Calcium is a vital secondary messenger in a vast array of plant signalling pathways (Dodd et al., 2010).
Calcium is known to interact with gibberellic acid, auxin, and abscisic acid to regulate fruitset, initiation
of ripening, cell division, cell expansion, and fruit softening (Ferguson, 1984; Saure, 2005; Yu et al.,
2006). Additionally, hormonal regulation of cell expansion, cell wall modification, xylem development,
and sugar unloading from the phloem can affect calcium distribution within the fruit (Saure, 2005; de
Freitas et al., 2014).
The role of the cell wall in calcium signalling and fruit ripening is highlighted. The cell wall is a dynamic
structure that responds to both developmental and environmental stimuli by structural remodelling;
different cell types exhibit different cell wall compositions that perform specific roles within the plant
(Hoson, 1998). Cell wall modification can be triggered by a wide range of environmental stimuli and

2
stresses, including pathogen attack, light, and touch (Hoson, 1998; Seifert and Blaukopf, 2010). Cell
expansion is tightly controlled by selective secretion of components into the cell wall matrix and
subsequent modifications; regulation of cell turgor pressure is also postulated to be an important factor
in such growth (Cosgrove, 2005). The role of cytosolic calcium in signal transduction and cell wall
polysaccharide interactions indicates that it is a key factor in cell wall growth and remodelling
processes. As an important pool of calcium for cytosolic signalling, apoplastic calcium will not only have
an impact on the regulation of cell wall assembly, but also a direct impact through physical interaction
with the cell wall.
1.2 Plant calcium uptake, delivery and storage
Calcium plays two important roles in plants; as a secondary messenger in a myriad of signalling
networks and as a structural element in cell walls and membranes (White and Broadley, 2003). Calcium
ions (Ca2+) are taken up as a soil nutrient and transported primarily through the apoplast and xylem to
aerial tissues (Clarkson, 1984; White, 2001). Calcium demonstrates low phloem mobility; calcium
accumulation in aerial sink tissues such as fruit occurs primarily through the xylem (Rogiers et al., 2000;
Drazeta et al., 2004). Symplastic transport mechanisms for calcium and water (including transpiration)
also contribute to calcium accumulation in a species dependent manner (Gilliham et al., 2011).
The Casparian strip is a zone of suberin and/or lignin-enriched cell wall in the root endodermis that
forms a physical barrier to apoplastic movement of water and solutes into the transpiration stream
(Nawrath et al., 2013). An Arabidopsis (Arabidopsis thaliana) mutant esb1 that lacks expression of a
dirigent scaffold protein required for correct patterning of lignin deposition in the Casparian strip also
demonstrates ectopic deposition of suberin lamellae between the cell walls and plasma membrane of
root endodermal passage cells. This results in decreased transpiration and Ca2+ accumulation in the
leaf, presumably through a reduction in the level of water and Ca2+ movement into the root xylem
(Baxter et al., 2009; Hosmani et al., 2013). Another Arabidopsis mutant (sgn3) lacks a functional
Casparian strip due to knockout of a receptor-like kinase important for localising transmembrane
proteins along the endodermal Casparian strip domain (Pfister et al., 2014). Interestingly, the apoplastic
bypass route provided by the dysfunctional Casparian strip in sgn3 led to an increase in magnesium
accumulation (possibly due to increased uptake through the apoplastic pathway) and a decrease in
potassium accumulation (possibly due to loss of potassium from root stelar tissues); however

3
homeostasis of calcium appeared to be maintained. The authors hypothesized that other barriers to
calcium movement within the apoplast (e.g. interactions with cell walls) may be responsible for this
observation (Pfister et al., 2014).
Studies of radial ion transport using radioactive Ca2+ in onion (Allium cepa) roots showed no detectable
Ca2+ translocation through the root tips (which lack mature Casparian strips, suberin lamellae and
mature xylem vessels), low calcium translocation (0.87 nmol Ca2+ per mm root length) through the old
root zone containing both mature Casparian strips and suberin lamellae, and high calcium translocation
(2.67 nmol Ca2+ per mm root length) through the young root zone containing Casparian strips but no
suberin lamellae (Cholewa and Peterson, 2004). This supports the idea that Ca2+ primarily moves from
the extracellular space of the outer root into the stele via a symplastic route, utilising Ca2+ channels and
Ca2+-ATPase pumps to bypass the Casparian strip, but in some root zones becomes limited by the
presence of suberin lamellae (Cholewa and Peterson, 2004; Hayter and Peterson, 2004). Perturbing
the normal pattern of suberin deposition (e.g. in the esb1 and sgn3 mutants) can therefore affect plant
nutrient accumulation profiles. Compartmentation and hydraulic resistance in the apoplast also occurs
in many other tissues. Examples of this include; formation of pectin hydrogels in xylem conduit pit
membranes (Zwieniecki et al., 2001; Plavcova and Hacke, 2011; van Doorn et al., 2011), separation of
the leaf xylem from the leaf apoplast by bundle sheath cells, and separation of external surfaces of the
plant and the underlying apoplast by the cuticle (Nawrath et al., 2013). This effective compartmentation
of the apoplastic space highlights the importance of understanding physical transport barriers as well as
cellular transport mechanisms for controlling Ca2+ movement and utilisation.
The delivery of calcium to leaves is dependent on a number of interacting factors including leaf
hydraulic conductivity, transpiration rate, calcium transporter activity, calcium tissue compartmentation,
xylem architecture, and cell wall composition (Sattelmacher, 2001; Saure, 2005; Gilliham et al., 2011).
Cation exchange within the xylem plays an important role in calcium delivery. The cation exchange
capacity (CEC) for calcium of cell walls from different root and shoot tissues of Picea abies was
measured using transmission electron microscopy energy-dispersive microanalysis (Fritz, 2007). Wide
variation between root and shoot tissue CEC was observed, however CEC of the secondary cell wall of
xylem tracheids was consistently low ( ~24 meq/kg wall material) (Fritz, 2007), suggesting that the
composition of other zones within the xylem (e.g. pit membranes) may be more important for
determining calcium transport and buffering fluctuations in xylem calcium concentration. Factors
contributing to patterns of calcium delivery and distribution in aerial tissues include; rate of mass flow,

4
competition between ions for xylem vessel cell wall binding sites (including H+, making pH an important
factor), formation of lowly-soluble or in-soluble complexes (e.g. calcium oxalate) and water transport in
and out of the xylem (Franceschi and Nakata, 2005; Saure, 2005; Gilliham et al., 2011). It is important
to understand the relative contributions of these factors to the calcium nutrition of individual tissues.
The impact of transpiration upon delivery and the lack of phloem mobility ensure that calcium generally
accumulates to high concentrations in the leaf tissues, often in a cell-type specific manner (Conn and
Gilliham, 2010; Dayod et al., 2010; Gilliham et al., 2011). Monocots and dicots exhibit different cell-type
specific patterns of calcium and potassium accumulation in the leaf (Karley et al., 2000; Conn and
Gilliham, 2010). In leaves, it appears that plants of the order Poales (including grasses and the
economically important cereals) accumulate calcium primarily in the epidermal cells, whereas other
monocots and dicots accumulate calcium primarily in the mesophyll cells (Karley et al., 2000). This
profile has been observed to hold true in a large number of different species (R. Leigh, Pers. Comm.).
Calcium accumulation in the trichomes of some dicots has been observed, possibly as a way to
maintain the apoplastic calcium concentration surrounding guard cells in order to avoid inducing
stomatal closure (De Silva et al., 1996).
Regulated expression of a number of membrane ion transporters is responsible for mesophyll calcium
accumulation in Arabidopsis (Conn and Gilliham, 2010). Knockout of the vacuolar Ca2+/H+ antiporters
AtCAX1 and AtCAX3 resulted in lower mesophyll Ca2+ sequestration and higher apoplastic Ca2+, with
physiological impacts ranging from reduced stomatal aperture, stomatal conductance and CO2
assimilation to reduced cell wall extensibility and leaf growth rate (Conn et al., 2011). Calcium also
accumulates primarily in the mesophyll of Brassica rapa (Rios et al., 2012). Differences in leaf calcium
accumulation between tip-burn susceptible and resistant lines of Brassica oleracea were correlated with
expression changes in calcium transporters BoCAX1, BoACA4, and BoACA11 (Lee et al., 2013).
Expression QTL analysis of a mapping population of Brassica rapa under altered calcium supply
identified an ortholog of AtCAX1 (BraA.CAX1a). Lines carrying missense mutations in BraA.CAX1a
demonstrated changes in shoot calcium accumulation, indicating potential for the use of this gene as a
tool for the bio-fortification of calcium in Brassica crops (Graham et al., 2014). The importance of these
and other related calcium transport mechanisms in other tissues and species require further
investigation.
Regulation of calcium transport across the plasma membrane and organelle membranes is tightly
controlled by the expression pattern, interaction and post-transcriptional control of many Ca2+

5
transporters (Kudla et al., 2010). The major calcium transport mechanisms are represented in Figure 1.
Tight control of calcium transport is necessary in order to keep cytosolic calcium ([Ca2+]cyt) within the
range (~0.1-10 µM) required for signal transduction (Evans et al., 1991; White, 2000; Dodd et al.,
2010). Regulated fluctuations in [Ca2+]cyt form the “calcium signature” which is a major determining
factor in the specificity of downstream transcriptional and physiological responses (McAinsh and
Pittman, 2009; Dodd et al., 2010; Kudla et al., 2010). Different environmental stimuli create specific
calcium signatures (Dodd et al., 2010). Electrically-induced calcium transients with different amplitudes
and frequencies were shown to induce distinct patterns of gene expression (Whalley and Knight, 2013),
indicating that environmental stimuli can translate into specific expression profile changes in calcium
signalling components. There is considerable evidence indicating that Ca2+ signalling transients also
occur in compartments other than the cytosol, e.g. the nucleus, chloroplasts and the apoplast (Johnson
et al., 1995; Johnson et al., 2006; Tang et al., 2007; McAinsh and Pittman, 2009). However, these
mechanisms are not nearly as well characterised as the cytosolic pathways.
Figure 1. Major mechanisms involved in apoplastic and sub-cellular calcium partitioning. Reproduced
from (de Freitas and Mitcham, 2012).
Changes in apoplastic calcium can have impacts on the duration and amplitude of [Ca2+]cyt oscillations,
and ABA-dependent stomatal closure pathways, thereby affecting the dynamics of stomatal movements
(Allen et al., 2001; Webb et al., 2001). High apoplastic calcium ([Ca2+]apo) is known to close stomata in

6
vitro (Webb et al., 2001). It has also been shown that in planta manipulation of free [Ca2+]apo can affect
CO2 assimilation and transpiration rate (Conn et al., 2011). Components of an extracellular calcium
sensing pathway have been described; plastid localised CAS protein mediates stomatal closure in
response to changes in extracellular calcium (Han et al., 2003; Wang et al., 2012). The importance of
the extracellular calcium signalling pathway in optimising photosynthesis and water use has recently
been demonstrated; antisense CAS lines show reduced water use efficiency and photosynthetic
electron transport rate, due to reduced control of stomatal aperture and transcription of electron
transport components (Wang et al., 2014). Therefore, the supply of apoplastic calcium to fruit is likely to
have an impact on the signalling capacity and water relations of the fruit.
Both calcium deficiency and toxicity can affect the productivity of horticultural systems, and the quality
of the products. Common examples of the effects of calcium deficiency include; tipburn in leafy tissues,
blossom end rot in tomatoes, bitter pit in apples, and increased susceptibility to fruit cracking (White
and Broadley, 2003). These calcium deficiency disorders are demonstrated in Figure 2. Calcium
deficiency occurs due to an insufficient mobilisation of calcium from internal stores or a reduced supply
of calcium through the xylem due to low transpiration rates (White and Broadley, 2003). Calcium toxicity
occurs due to high concentrations of available calcium in the soil solution and can result in reduced
germination and growth rates, and the ectopic deposition of calcium oxalate crystals (White and
Broadley, 2003). Understanding of the mechanisms of plant resistance or susceptibility behind calcium
toxicity and deficiency are limited at this point.

7
Figure 2. Calcium disorders in horticultural crops: (a) cracking in tomato fruit; (b) tipburn in lettuce; (c)
calcium deficiency in celery; (d) blossom end rot in immature tomato fruit; (e) bitter pit in apples; (f) gold
spot in tomato fruit with calcium oxalate crystals (inset). Reproduced from White and Broadley (2003).
1.3 Calcium and water relations in fruit
The link between water and calcium transport becomes particularly apparent when looking at sink
tissues with relatively low transpiration rates, such as fruit. During later stages of fruit ripening in most
species, delivery of water, sugar, and basic nutritional inputs occurs largely via phloem influxes
(Drazeta et al., 2004; Rogiers et al., 2006b; Choat et al., 2009). Kiwifruit appears to be somewhat
different, with both phloem and xylem contributing to fruit hydration during late development; their
relative contributions are affected by environmental conditions (Clearwater et al., 2012). The low
phloem mobility of calcium can create a situation that leads to localised calcium deficiencies in fruit.
Examples of this include blossom end rot in tomatoes and bitter pit in apples. Calcium concentration
can have an impact upon water transport processes; aquaporins have been shown to be highly
sensitive to cytosolic calcium concentration (Gilliham et al., 2011). In order to address fruit calcium
nutrition disorders it is important to understand the physical and molecular pathways of water and

8
calcium delivery, and the impact of calcium signalling and cell wall interactions on transpiration and
water transport.
Fruit are strong sink organs; as such vascular flows into fruit can be substantial. Accumulation of ionic
nutrients into fruit is determined not only by water import rates, but also by their relative prevalence and
mobility in the phloem and xylem. Potassium and calcium are examples of two major ions that exhibit
very different pathways of vascular movement. In grapes, potassium is both xylem and phloem-mobile,
with concentrations in the phloem up to ten times that found in the xylem (Hocking, 1980). Grape berry
potassium accumulation occurs throughout berry development, reaching a maximum uptake rate during
early post-veraison with uptake continuing throughout ripening (Rogiers et al., 2006b). In contrast,
calcium is observed to be phloem-immobile and berry calcium content generally does not increase after
veraison (Rogiers et al., 2006a). The reduction in calcium import is a result of the large drop in xylem
hydraulic conductance into the berry post-veraison which is correlated with loss of cell vitality and berry
shrivel (Tyerman et al., 2004; Rogiers et al., 2006b; Tilbrook and Tyerman, 2009). A varietal survey
revealed genotype differences in the occurrence of cell vitality loss and berry shrivel in mature grapes
(Fuentes et al., 2010). The shift away from xylem water delivery during ripening also effectively buffers
the fruit against fluctuations in plant water status and water stress events that may affect the plant
during the ripening season (Thomas et al., 2006; Choat et al., 2009). Determining the hydraulic
pathways of ionic delivery to fruit is vital for understanding patterns of distribution and accumulation that
are important determinants of fruit quality.
Characterisation of changes in apoplastic and vacuolar solute composition supports the notion of a
switch from symplastic to apoplastic unloading of phloem solutes being linked to the loss of mesocarp
membrane integrity observed in some varieties during late ripening (Keller and Shrestha, 2014). The
table grape variety Concord maintains high apoplastic pH (relative to vacuolar pH) late into ripening; in
shrivel susceptible variety Merlot the pH difference between these compartments is reduced to zero
during late ripening, suggesting a loss of membrane viability in this variety (Keller and Shrestha, 2014).
The switch to apoplastic phloem unloading enables accumulation of high sugar levels in ripening fruit;
Merlot demonstrates a dramatic jump in apoplastic glucose and fructose concentrations during the
transition from red to ripe berries (Keller and Shrestha, 2014). The accumulation of sugars in the
apoplast activates cell wall localised invertases and hexose/proton transport pathways in berries
(Hayes et al., 2007). Loss of cell turgor, vitality, and membrane integrity in the locular tissues during
ripening may be related to the apoplastic unloading of solutes from the adjacent central vasculature

9
(Tyerman et al., 2004; Krasnow et al., 2008). However, berry cell death is normally observed after the
transition to apoplastic unloading. Additionally, cell membrane capacitance in the berry is maintained
through the cell death phase, indicating intact membranes (Caravia Bayer et al., 2015). This suggests
that rather than ‘cell death’, the loss of cell vitality often observed may actually represent an increase in
cell membrane porosity, with loss of membrane selectivity allowing distribution of some solutes (e.g.
sugars, ions, and perhaps the cell vitality stain fluorescein diacetate) into the apoplast. How the
accumulation of solutes in the apoplast and associated changes in cell turgor affect fruit water relations
requires further investigation.
Changes in the hydraulic resistance (Rh) of components of the bunch and berry vascular architecture
may account for some of the observed varietal differences in susceptibility to berry shrivel. By studying
the Rh of each component the contributions of particular structural and ionic variables to observed
changes in xylem flows may be identified (Tyerman et al., 2004; Choat et al., 2009; Mazzeo et al.,
2013) J. Scharwies, Pers. Comm.). These variables may include; physical barriers (i.e. pit membrane
porosity and xylem vessel diameter), structural changes (i.e. formation of pectin gels within the xylem),
cellular water permeability (i.e. through changes in temporal and spatial expression of aquaporins), and
ionic factors (i.e. solute driven changes in the osmotic potential of the cell wall).
In grapes, a decrease in mesocarp turgor coincides with the onset of veraison. However, after veraison
berry mesocarp turgor does not appear to respond to vine water deficit (Thomas et al., 2006). This
supports the notion that a switch to phloem water delivery reduces the link between water status of the
plant and fruit water relations, and that this relationship is dynamic through different stages of
development. When pre-veraison berries were physically boxed to restrict veraison associated cell
expansion, both sugar accumulation and the drop in mesocarp turgor pressure were delayed; when the
box was ventilated to allow transpiration, delayed sugar accumulation was not observed and the turgor
drop delay effect was moderated (Matthews et al., 2009). This suggests that fruit transpiration is
required to assist in phloem sugar loading into fruit (by removing excess water) (Lang and Thorpe,
1989), and that ripening related changes in mesocarp cell turgor pressures are linked to both rapid cell
expansion and sugar accumulation (Matthews et al., 2009). This function may act a surrogate for the
xylem water delivery that occurs in other plant tissues and earlier in fruit development. Calcium is
involved in the regulation of cell expansion and elongation during pollen tube growth through dynamic
pectin binding (Jiang et al., 2005; Rounds et al., 2011), signalling proteins and ion channels (Konrad et
al., 2011). This suggests that calcium may also be involved in the changes in cell turgor pressure and

10
cell expansion observed during the progression of fruit ripening. The relative contributions of turgor and
cell wall changes to fruit softening are still a major point of discussion; however it is clear that both
factors contribute through complex interactive pathways and feedback mechanisms to the onset and
development of ripening processes in fruit.
Fruit water relations and ripening-linked shifts in fruit hydraulic conductance vary between species.
Kiwifruit maintains positive water fluxes from both the phloem and xylem into the fruit throughout
development, with each pathway contributing approximately equally to the water balance (Clearwater et
al., 2012). However, when grown in high vapour pressure deficit conditions Actinidia chinensis var.
chinensis ‘Hort16A’ exhibits late ripening shrivel, similar to the phenomenon observed in Shiraz grapes.
This may be attributable to the high surface conductance and transpiration rate observed in this variety,
causing an imbalance between water delivery to the fruit and transpiration losses (Clearwater et al.,
2012). Additionally, kiwifruit does not accumulate sugars until late in the ripening phase; this difference
may explain its ability to maintain xylem flow from the plant into the fruit throughout development.
A study of kiwifruit xylem hydraulic resistance (RT) throughout development using pressure chamber
and flow meter techniques showed a general increase in RT during the second half of fruit development,
consistent with previous reports in grapevine and kiwifruit (Tyerman et al., 2004; Choat et al., 2009;
Mazzeo et al., 2013). However, the increase in RT began prior to ripening, indicating that decreasing
xylem inflows in kiwifruit may be attributable to increasing xylem hydraulic resistance (Mazzeo et al.,
2013). This contrasts to observations in grape, where increases in RT were observed after veraison,
therefore not accounting for drops in xylem flow rates into the berry (Tyerman et al., 2004; Choat et al.,
2009). The parallel use of pressure chamber and flow meter techniques (Mazzeo et al., 2013), and an
evaporative flux method (Clearwater et al., 2012), showed differences in the magnitude of resistance
measured depending on the methodology employed; the flow meter technique may underestimate
xylem resistance and subsequent calculations regarding berry hydraulic isolation and potential for
xylem backflow may be imprecise (Mazzeo et al., 2013). Despite difficulties in accurately and
consistently measuring hydraulic resistance, it is clear that differences in xylem composition can
contribute to fruit water relations.
Changes in cuticle composition can affect fruit mechanical properties and transpiration rate. Fruit
cuticles are typically thicker (but also more water permeable) than leaf cuticles; the scarcity of stomata
on fruit also suggests that cuticle composition is important for fruit water relations (Martin and Rose,
2014). A tomato cultivar (‘Delayed Fruit Deterioration’) with altered cuticle architecture was shown to
11
have low fruit transpiration and increased cell turgor pressure, leading to delayed softening despite
undergoing normal ripening related cell wall modifications (Saladie et al., 2007). Application of
gibberellins was also shown to increase cuticle thickness in tomato (Knoche and Peschel, 2007). In
grapes (cv. Riesling), a drop in the transpiration permeability of the cuticle occurs from pre-veraison to
post-veraison (Becker and Knoche, 2011), and this drop is strongly correlated with increased cuticle
deposition (Becker and Knoche, 2012). The composition of the cuticle changes throughout
development in cherry tomato (cv. Cascada); cuticle mass per unit fruit surface area increased rapidly
from 10 days after anthesis to reach a maximum 15 days after anthesis (subsequent increases in
cuticle thickness were attributed to reduced cuticle density) (Dominguez et al., 2008). Interestingly,
another study in the same cultivar looking at the cuticle mechanical properties found a shift from elastic
to predominantly viscoelastic behaviour from 10 to 15 days after anthesis. These changes in the cuticle
mechanical properties were correlated with the ratio of cutin:polysaccharide present; high ratios were
associated with cell enlargement growth stages, and lower ratios (approaching 1:1) were associated
with stages where cell expansion is minimal (i.e. early cell division and later ripening phases) (Espana
et al., 2014). As such, it is hypothesised that polysaccharides in the cuticle contribute elastic properties,
and cutin confers viscoelastic properties. It is clear that cuticle composition is an important variable in
determining both fruit physical properties and transpiration water losses.
1.4 Calcium-cell wall interactions during fruit development
The cell wall is composed of a diverse array of complex polysaccharides. In dicots, the primary cell wall
consists of cellulose microfibrils bound in a matrix of pectins and hemicelluloses. Cellulose is extruded
through the plasma membrane by cellulose synthase complexes, whereas pectins and hemicelluloses
undergo primary synthesis within the Golgi apparatus, and are transported to the cell surface where
further synthesis and modification may take place (Gendre et al., 2013). The matrix polysaccharides
are very diverse in their composition, with a variety of sugar residues, linkages and side chains present;
their synthesis and modification is therefore accomplished by a large number of genes (Burton et al.,
2010). Fruit softening is often attributed to changes in the composition of the cell wall. Cell wall
modifying enzymes activated at different stages of development, and under certain conditions (e.g.
heat, pH changes in the apoplast), are responsible for modification and degradation of cell wall
polysaccharides (Grignon and Sentenac, 1991; Brummell, 2006).

12
The chemical changes that occur in fruit cell walls during development include; modification of pectin
side chains, depolymerisation of pectins, and degradation of xyloglucan (a hemicellulose). Together
with other ripening related processes (such as the accumulation of solutes); this leads to a number of
physical and textural changes in fruit that can help us to delineate different types of fruit by their
ripening mechanisms. Some species (e.g. strawberry and plum) exhibit cell wall swelling during
ripening which results in a soft textured fruit, whereas other species (e.g. watermelon and apple) do not
exhibit swelling and maintain crisp textured fruit (Redgwell et al., 1997). Physical changes in fruit cell
walls are associated with ongoing modification and solubilisation of pectins. The importance of pectin
structure for determining the hydraulic and elastic properties of pectin gels has been examined mostly
in vitro; understanding the complexity of these cell wall interactions in planta requires further research.
Fruit cell walls contain a high proportion of pectin, a complex family of polysaccharides that are
structurally related by the occurrence of (1,4)-α-linked galacturonan in the backbone (commonly as
homogalacturonan, or as the rhamnose/galacturonan disaccharide repeat rhamnogalacturonan-I)
(Mohnen, 2008). The galacturonan residues of the backbone may be methyl-esterified or acetylated;
homogalacturonan is secreted into the cell wall in an esterified form (Willats et al., 2001). A wide variety
of linear and branched side chains are also observed, forming the pectin structural classes
rhamnogalacturonan-II, xylogalacturonan and apiogalacturonan. Rhamnogalacturonan-II is the most
complex pectin, it can include up to 12 different sugar residues and more than 20 different linkage
types. These have been reviewed previously (Mohnen, 2008; Burton et al., 2010). The distribution of
various cell wall components within a model cell wall is represented in Figure 3. The structural
complexity of pectin, enabled by the expression of a range of pectin synthesising and modifying
enzymes throughout development, implicates pectin in an array of potential interactions and functional
roles.
The prevalence of ionic and ester bonds between adjacent pectins play an important role in the
physical properties of fruit cell walls. These bond interactions influence the solubility of pectins. Suitable
ions for cross-linking adjacent pectins include calcium forming junctions between de-esterified
homogalacturonans and boron forming di-ester bonds between rhamnogalacturonan II units.
Associations between adjacent homogalacturonans ionically linked by calcium ions have been
characterised as forming an “egg-box” structure. Although this structure has been demonstrated in
pectin extracts (Tibbits et al., 1998), the diversity of side chains and modifications within the pectic
13
polysaccharides as well as the complexity of other cell wall components makes such interactions
difficult to characterise in planta.
The majority of pectins occur in the middle lamella (outermost part of the extracellular matrix; where cell
junctions occur), with smaller amounts observed in the primary cell wall (Ferguson, 1984). Micro-
domain localisation of calcium in particular spaces is hypothesised to affect cell wall loosening and cell
separation, with potential impacts upon fungal infection (Roy 1995). This may be particularly prevalent
at three way cell junctions where turgor pressure is driving the separation of cells and the formation of
large intra-cellular spaces (Willats 2001). It has been suggested that the major physical effects of pectin
modification will therefore be in cell-cell adhesion rather than strength of the primary cell wall
(Ferguson, 1984). However, species and tissue differences in patterns of pectin deposition and
modification (through controlled expression of an array of cell wall modifying enzymes) indicate that the
situation may be much more complex.

14
Figure 3. Plant cell wall model. Primary cell walls are constructed of cellulose microfibrils (Cel),
crosslinked by hemicullose xyloglucan (XG), and a diverse array of pectins, adjacent to the plasma
membrane (PM). The predominant pectin backbones are homogalacturonan (HG) and
rhamnogalacturonan I (RGI); their complexity is increased by the occurrence of rhamnogalacturonan II
(RGII), arabinan (Ara), and galactan (Gal) side chains. The middle lamella is composed of mostly RGI
and HG, with adjacent de-esterified HG often cross-linked ionically by calcium (Ca2+). Reproduced from
Vorwerk et al. (2004).
Throughout fruit ripening, pectin de-esterification occurs by the action of pectin methyl-esterases
(PMEs). This exposes carboxyl residues which can be cross-linked by calcium. The level of PME
15
activity and Ca2+ availability within the apoplast has a direct impact on cell wall strength and expansion.
Studies in grapes suggest that PME expression begins before veraison and continues throughout
ripening (Barnavon et al., 2001; Schlosser et al., 2008). Mesocarp and skin tissues exhibit different
patterns of PME expression in grapes (Nunan et al., 1998; Schlosser et al., 2008; Lacampagne et al.,
2010). During the initiation of ripening a raft of cell wall modifying and hydraulic regulatory genes in
grape (including expansins EXP3 and EXPL, pectate lyase, a PME, and aquaporin PIP2;1) are
upregulated (Schlosser et al., 2008). This occurs initially in mesocarp; the delay in skin activation of
these genes suggests a role for the skin in moderating berry growth during ripening. The degree of
pectin de-esterification also varies between varieties (Ortega-Regules et al., 2008).
Plant and fungal PMEs have different modes of function; plant PMEs generally operate in a blockwise
manner, de-esterifying multiple homogalacturonan residues along a single chain, whereas fungal
PME’s operate in a non-blockwise manner (Willats et al., 2001). Patterning of pectin modification and
calcium binding may affect the binding and rate of pectin cleavage by polygalacturonases. Three
Botrytis isolates exhibited calcium inhibition of polygalacturonase activity. The calcium concentration
required to inhibit enzyme activity varied between isolates (Chardonnet et al., 2000). The pathogenicity
of these isolates also varied between four apple varieties, indicating that the interaction between the
pathogen cell-wall degrading enzymes and the composition of the fruit cell wall is important for
determining pathogenicity (Chardonnet et al., 2000). It has been demonstrated that the calcium content
of grape skin cell walls is negatively correlated with susceptibility to Botrytis enzymatic digestion
(Chardonnet and Doneche, 1995). Calcium infiltration reduced the level of pectin degradation by
Botrytis in grapes (Chardonnet et al., 1997), and reduced the level of decay in apples (Chardonnet et
al., 2000). The interaction of these factors contribute to the diversity of pectin profiles seen when
characterising cell wall composition from different species, varieties, tissues, developmental points, and
treatments, as well as influencing susceptibility to fungal pathogens.
The expression and activity patterns of cell wall modifying enzymes in grapes change throughout
development, as well as varying between varieties. In both Cabernet Sauvignon and Semillon,
polygalacturonase activity appears correlated with ABA levels, reaching maximum at veraison
(Deytieux et al., 2005). Polygalacturonase activity in skin was not detected, however transcripts of two
isoforms showed different expression patterns, with a common feature being strong expression late in
development (100 days after anthesis), indicating a variety of roles for the polygalacturonase family,
and a concerted role in cell wall disassembly at maturity (Deytieux-Belleau et al., 2008). Other research

16
has also indicated that transcript expression of polygalacturonases does not necessarily translate to
detectable enzyme activity (Nunan et al., 2001). In vitro calcium has an inhibitory effect on
polygalacturonase activity; drops in calcium concentration and availability following veraison may be
linked to increasing polygalacturonase activity at this time (Cabanne and Doneche, 2001). In skin
tissue, pectin methylesterase is present throughout ripening, with enzyme activity reaching a peak at
the beginning of veraison, decreasing sharply in the subsequent ten days, and increasing steadily
thereafter (Deytieux-Belleau et al., 2008). Low levels of polygalacturonase and pectate lyase activity
are observed during some stages of ripening; however, hormonal cues may regulate the targeted
expression of specific isoforms to produce the depolymerisation of pectin observed during ripening
(Nunan et al., 2001).
The combinatorial effects of pectin enzyme activity, apoplast pH and calcium concentration determine
various mechanical properties of pectin gels; compressive strength, water holding capacity, porosity
and elasticity (Tibbits et al., 1998; Willats et al., 2001; Ngouemazong et al., 2012). The strength of
calcium crosslinks is pH dependent, with the strongest bonds forming at apoplastic pH 6–7. Formation
and dissolution of pectin gels by calcium crosslinks is highly dependent on the level of de-esterification
(i.e. available carboxyl groups) and free calcium ion concentration (Tibbits et al., 1998). Gel swelling
can be observed during dissolution, due to both the osmotic pressure created by free carboxyl groups
in the pectin matrix (occurring when ionic strength is low), and the disassociation of calcium cross-
linked pectins. This can be expressed as the ratio of free calcium ions to carboxyl groups (i.e. if [Ca2+]
free: COO- <0.05 significant swelling is likely to occur). As gel dissolution and swelling occurs, the
breakdown of calcium crosslinks reduces the stiffness of the gel. Swelling of a gel is generally at
maximum around pH 3, which is also the pH at which calcium crosslinking and gel shear strength are at
a minimum (Tibbits et al., 1998). Some work has been done with pectin concentrations similar to those
observed in plant cell walls (films with ~30% pectin), demonstrating that pectin hydration status (or
degree of swelling) has a linear inverse relationship with tensile strength (Zsivanovits et al., 2004).
Additionally, the hydraulic properties and susceptibility to swelling of the pectin matrix are determined
by both the pectin composition and the ionic composition of the space (Zsivanovits et al., 2004).
Through understanding the pectin ion interaction effects on gel properties in vitro it is likely we will
advance our comprehension of fruit ripening processes.
Cell wall acidification promotes cell growth and expansion by displacing pectin bound Ca2+ through
protonation of pectin carboxyl groups. The pH of the apoplast may be affected by the pH of the xylem

17
sap when water delivery is high. Control of apoplast pH largely occurs through the activity of the
plasma-membrane localised H+-ATPase (this transport is regulated by auxin; covered in section 1.5).
Saline conditions initially decrease the leaf growth rate of a salt-sensitive maize cultivar by reducing H+-
ATPase activity, resulting in increased apoplastic pH; a tolerant hybrid cultivar showed none of these
effects (Pitann et al., 2009). This finding is contrasted by work measuring ion fluxes in bean leaf, which
showed an activation of H+ efflux from the mesophyll upon addition of NaCl (Shabala, 2000).
Amelioration of the effects of salinity on growth by high calcium has been observed; this may result
from interactive effects with plasma membrane transport proteins (such as H+/cation exchangers), or
through a reduction in the rate of Ca2+ displacement from pectin crosslinkages by Na+ and H+ ions
(Shabala, 2000). Additionally, cell wall localised expansins show optimal activity at low pH. They are
believed to act by reducing hydrogen bonding between primary cell wall components, allowing slippage
between adjacent polysaccharides and hence cell wall expansion (Sampedro and Cosgrove, 2005; Dal
Santo et al., 2013). Thus changes in apoplastic pH can have significant effects on the dynamics and
composition of the cell wall.
In addition to the de-esterification of pectins observed in fruit cell walls during ripening,
depolymerisation of pectins to shorter sub-units is also an important factor. By using a chelator (e.g.
CDTA) followed by size exclusion chromatograghy to extract and characterise ionically bound pectins,
the diversity in timing and degree of depolymerisation that occurs between species can be observed.
Some species show almost no change in pectin composition or solubilisation throughout development
(e.g. capsicum), whilst others (e.g. tomato) show high degrees of depolymerisation and high levels of
chelator soluble pectins (i.e. high levels of Ca2+ bound pectins) (Brummell, 2006). This
depolymerisation is achieved through the action of polygalacturonases and pectate lyases.
Polygalacturonases are absent or detected at very low levels in the fruit of some species; this may
account for some of the species differences in levels of pectin solubilisation. Additionally, it has been
demonstrated that reduced expansin activity (normally responsible for loosening of xyloglucan and
cellulose networks in the primary cell well during cell expansion) decreases solubilisation of primary cell
wall pectins, possibly through reduced access of polygalacturonases to their substrates in this space
(Brummell et al., 1999). This finding suggests that it is important to consider more than just transcript
levels or enzyme activity when considering potential for degradation of particular components; Ca2+
availability and activity of other cell wall enzymes may influence substrate accessibility.

18
Degradation of pectic homogalacturonan backbones generates short chain molecules known as
oligoglacturonides (OGAs). These have been implicated in pathogen defence signalling activation. This
role is carried out through OGA binding by the wall-associated kinase (WAK) family (Decreux and
Messiaen, 2005). It is of particular interest in fruit ripening, as the high pectin content, and the appeal of
ripening fruit to a variety of pathogens, suggests that functional OGAs may be quite prevalent in fruit.
Many factors influence the defence response eliciting capacity and specificity of OGAs, including;
calcium availability, length of OGA, degree of methyl-esterification and degree of acetylation (Decreux
and Messiaen, 2005; Vallarino and Osorio, 2012). The extracellular domain of Arabidopsis WAK1 binds
OGAs only in the presence of calcium and calcium crosslink forming conditions (Decreux and
Messiaen, 2005). Expression of a fruit-specific PME from cultivated strawberry in transgenic wild
strawberry resulted in a modified pattern of OGA esterification in the transgenic fruit. This change was
sufficient to constitutively activate defence responses in the transgenic, thereby increasing Botrytis
resistance (Osorio et al., 2008). A variety of evidence suggests that in addition to WAKs binding
specific OGAs during pathogen responses, WAKs also bind cell wall pectins during normal
development to regulate cell expansion (e.g. antisense reduction in WAK expression has been shown
to reduce cell size) reviewed in Kohorn and Kohorn (2012). It is apparent that the specificity of calcium-
pectin-WAK interactions may facilitate multiple signalling pathways important in pathogen defence
activation as well as during normal developmental control of cell expansion.
1.5 Calcium-hormone interactions during fruit development
Calcium is a known secondary messenger involved in hormone signalling. The various levels of control
exhibited in plant calcium relations combined with the complexity and concentration dependence of
hormone responses dictates that changes in calcium nutrition may create multiple plant hormonal
responses that are difficult to characterise. Although the physiological pathways and interactions of
plant hormones and calcium are still being uncovered, many hormone and calcium treatments are
already used for horticultural improvement. The role of plant hormones in fruit development and
ripening processes has been extensively reviewed (Ruan et al., 2012; McAtee et al., 2013; Osorio et
al., 2013; Wang and Ruan, 2013; Kumar et al., 2014; Leng et al., 2014). This section will therefore
articulate the current knowledge and gaps in our understanding of calcium and hormone interactions in
fruit.

19
Auxin has key roles in fruitset, cell division and cell expansion. These developmental pathways both
utilise calcium as a secondary messenger and affect patterns of calcium distribution. Fruitset and early
development are triggered by auxin synthesis in the ovules during fertilisation, which induces (GA)
synthesis, reviewed in Kumar et al. (2014). GA signalling in the pericarp of Arabidopsis fruit has been
demonstrated to activate a pathway degrading the growth inhibiting DELLA proteins (Fuentes et al.,
2012; Kumar et al., 2014). The relationship between GA and auxin is complex, with a GA independent
pathway for fruitset being demonstrated in tomato (Serrani et al., 2008; McAtee et al., 2013). High
levels of GA are commonly associated with rapid cell expansion, this has also been linked to low or
reduced calcium concentrations by disrupting calcium transport (Saure, 2005); the mechanism through
which this occurs requires further investigation.
Calcium acts as a secondary messenger downstream of auxin through the acid growth pathway. This
pathway has been demonstrated in Arabidopsis; auxin efflux from cells is facilitated by PIN-FORMED
(PIN) membrane proteins. PIN activity and targeted endocytotic transport of PIN are regulated by
PINOID (PID) protein kinase and PP2A phosphatase complex mediated phosphorylation (Fozard et al.,
2013). Extracellular auxin (possibly though the binding of ABP1) activates plasma membrane calcium
transport in wheat embryos, creating [Ca2+]cyt transients that activate the plasma membrane localised
H+-ATPase to reduce apoplastic pH. Lower apoplastic pH activates pH sensitive cell wall loosening
enzymes (Rober-Kleber et al., 2003; Shishova and Lindberg, 2010; Wang and Ruan, 2013). This proton
influx into the cell wall compartment also increases competition with calcium for binding sites on de-
esterified pectin, resulting in looser cell walls; as such higher levels of calcium can inhibit auxin-
activated acid growth (Ferguson, 1984). H+-ATPase transport also activates voltage dependant
potassium channels; potassium levels increase, causing osmotically driven movement of water into the
cell, increasing cell turgor pressure. The acid growth pathway is responsible for cell elongation and
expansion; it has been observed during growth of many tissues, including root tip growth, and
hormone-stimulated cell expansion.
Auxin is also involved in calcium uptake and distribution in fruit. Application of CME (an auxin transport
inhibitor) reduced calcium uptake into developing fruit of some tomato cultivars differing in susceptibility
to blossom end rot (Brown and Ho, 1993). This reduced calcium uptake may occur through modification
of cellular transport activity or perturbed cell expansion (disrupting xylem development). Calcium is also
involved in fruit basipetal auxin transport. CME induced reductions in basipetal IAA efflux were only
observed in tomato fruit grown under high salinity conditions where Ca2+ uptake was reduced (Brown

20
and Ho, 1993). In kiwifruit, light induction of higher levels of auxin-protecting hydroxycinnamic acids
decreased auxin degradation, resulting in increased calcium uptake (Montanaro et al., 2006). These
results suggests tomato susceptibility to blossom end rot may be determined not just by differences in
capacity for Ca2+ uptake and distribution, but also by related factors such as auxin transport and
metabolism, and rate of cell enlargement.
Fruit ripening processes typically involve ABA and ethylene signalling. Non-climacteric fruit show a
greater reliance upon ABA for initiation of ripening processes and do not demonstrate the same extent
of ethylene responsiveness as climacteric fruit. ABA signalling in Arabidopsis acts through a network of
calcium binding signal receptors including PP2C protein phosphatases ABI1 and ABI2 (Leung et al.,
1994; Allen et al., 1999), and an array of CBL (Pandey et al., 2004), CIPK (Kim et al., 2003), and CDPK
(Zhu et al., 2007) protein kinases. Concentration of ABA in grapes increases dramatically at the
beginning of veraison; it is possible that the drop in cell turgor that occurs at this time triggers increases
in ABA levels (Castellarin et al., 2011). There are varietal differences in the time during veraison (
measured as % colour change) at which maximal berry ABA is reached; Merlot (10 % colour change),
Cabernet Sauvignon (50% colour change), and Semillon (100% colour change) (Deytieux-Belleau et
al., 2008). The partitioning of ABA between mesocarp and skin shifts from 100% in mesocarp prior to
veraison, to approximately 40% in skin by maturity (Deytieux-Belleau et al., 2008). In non-climacteric
fruit (e.g. strawberries and grapes) several other factors have been identified as potential ripening
signal elements; auxin treatment of unripe fruit delays ripening (Boettcher et al., 2011) whilst reactive
oxygen species accumulate in grape berries at the onset of ripening (Pilati et al., 2014). The
transduction of these ripening triggers through the calcium signalling network suggests that calcium
also plays a role in sugar accumulation and fruit softening, evidence for these functions are examined
below.
Increased ABA levels at ripening leads to increased hexose accumulation through up-regulation of
hexose transporters and increased apoplastic invertase activity (Pan et al., 2005; Deluc et al., 2009;
Hayes et al., 2010). ABA activates sugar cell wall bound invertases at the initiation of grape ripening,
catalysing sucrose cleavage, decreasing the apoplastic sucrose concentration, and thereby allowing for
continued phloem unloading of sucrose into the berry apoplast (Pan 2005). Phloem unloading of sugars
becomes crucial for driving expansion, as well as efficiently maintaining the accumulation of sugars in
the fruit. It has been demonstrated that ABA activates the calcium dependent protein kinase (ACPK1) in
grape mesocarp through a complex mechanism involving influx of apoplastic calcium to the cytosol (Yu

21
et al., 2006). ACPK1 in turn activates plasma membrane H+-ATPase in the berry mesocarp, possibly
energising the cell for solute uptake (Yu et al., 2006). A transient decrease in calcium concentration is
observed in the apoplast of Vicia faba leaves following ABA treatment, providing further evidence for
apoplastic calcium as a transducer of ABA signalling (Felle et al., 2000). The timing of ABA
accumulation, metabolic responses and the drop in turgor varies between varieties with differing
ripening profiles (Deluc et al., 2009; Castellarin et al., 2011).
Endogenous hormone levels influence fruit softening by altering expression levels of enzymes that
modify cell turgor pressure, apoplast solute accumulation, and cell wall modification. Suppression of a
key enzyme involved in tomato ABA biosynthesis (9-cis-epoxycarotenoid dioxygenase) resulted in the
transcriptional down regulation of polygalacturonase, pectin methylesterase, expansin, and many other
cell wall modifying enzymes (Sun et al., 2012; Osorio et al., 2013). Application of gibberelic acid has
been shown to increase berry firmness and shelf life in the table grape variety Thompson Seedless
(Marzouk and Kassem, 2011). Conversely, in Cabernet Sauvignon berries treated with sucrose or
sucrose and ABA, a drop in berry firmness (as occurs at the onset of ripening in the field) was only
observed in the sucrose and ABA treated berries (Gambetta et al., 2010). The combined effect of ABA-
activation of sugar invertases and cell wall modifying enzymes in the apoplast is to simultaneously
reduce cell turgor pressure and loosen cell walls (Pan et al., 2005; Gambetta et al., 2010).
1.6 Conclusion
The complex nature of the multiple roles of calcium in fruit ripening highlights the requirement for further
research efforts towards understanding calcium nutrition for improvement of fruit quality outcomes in
horticultural systems. Changes in the polysaccharide composition of the cell wall are responsible for
some of the softening associated with fruit ripening. A range of modifications within the primary cell wall
and middle lamella cause both a loss of cellular structural integrity and weakened intercellular linkages.
Cell turgor pressure changes with solute accumulation during fruit ripening; similarly the rigidity of the
cell wall and maintenance of cell membrane integrity changes during ripening. As fruit cell walls
generally have high pectin content, the structural modification and depolymerisation of pectins is of
particular importance in fruit ripening. Increases in pectin de-esterification in the middle lamella during
ripening indicate that proper calcium nutrition is required for formation of calcium cross linkages and
maintenance of cell-cell adhesion. Localised calcium deficiencies have been implicated as the cause of
22
many significant fruit quality disorders, including blossom end rot, bitter pit, and tip burn. Through
furthering understanding of the combined effects of calcium nutrition upon fruit water relations, cell wall
properties, and developmental signalling, horticultural approaches to address these problems can be
more readily formulated.
In this study, grapevines will be used a model for plant and fruit calcium nutrition responses. As the
underlying relationships between calcium levels and fruit cell wall and physical properties have not
been elucidated, this study will determine if the indirect evidence suggesting that high calcium growth
leads to firmer cell walls is supported. Furthermore, the hypothesis that differences in berry calcium
uptake contribute to variety specific differences in susceptibility to physiological disorders will be tested.
This study will also attempt to overcome the difficulties of assessing nutritional responses by utilising a
hydroponics system that tightly controls nutritional inputs, allowing for manipulation of calcium supply to
vines. It is believed that this will assist in disentangling non-specific effects and allow the role of calcium
in vine water relations and fruit ripening to be clearly resolved.

23
Chapter 2 Varietal differences in berry physical properties, nutrient
accumulation and pectin distribution
2.1 Introduction
In grapes, cell wall properties are key determinants of grape and wine quality; extensive cell wall
disassembly occurs during ripening, this developmental stage is also associated with increased
pathogen susceptibility, berry splitting and berry shrivel (Cabanne and Doneche, 2002; Cantu et al.,
2008; Fuentes et al., 2010). Calcium nutrition impacts berry quality by facilitating stress signalling,
stabilising membranes, and imparting cell wall strength by cross-linking de-methylated pectins
(Cabanne and Doneche, 2003). A broad aim of this research is to understand how varietal differences
in calcium uptake and distribution may relate to the previously observed differences in maintenance of
berry hydraulic conductivity and cell vitality late into the season. Some varieties (e.g. Shiraz) show a
high propensity to lose mesocarp cell vitality and shrivel during late ripening, whereas other varieties
(e.g. Thompson Seedless and Chenin Blanc) are able to maintain mesocarp cell vitality and berry
integrity (Tilbrook and Tyerman, 2008; Fuentes et al., 2010). Varietal differences in mesocarp vitality
may be related to xylem hydraulic conductivity and capacity to re-distribute mineral nutrients within the
berry for maintenance of osmotically competent membranes (Rogiers et al., 2006a; Tilbrook and
Tyerman, 2008). In this chapter, the role of berry nutrition (particularly calcium nutrition and distribution
within the berry) and its relationship to berry physical qualities and maturity indicators will be
investigated between varieties differing in their susceptibility to berry shrivel. In addition, berry
properties of three varieties from two sites that differ in their calcium nutrition are studied in an attempt
to disentangle site-specific and variety-specific effects.
2.2 Materials and Methods
2.2.1 Bunch and berry sampling
Bunches were collected from the Coombe vineyard variety block (34°58’3” S, 138°37’59” E) located on
the Waite Campus of the University of Adelaide, and a commercial vineyard (34°29’57” S, 139°01’20”
E) located in Angaston in the Barossa Valley (courtesy of Chris Fiebiger) during the 2011-12 and 2012-
2013 seasons. Both vineyards had a vertically shoot positioned trellis system with all varieties planted
on own roots. Waite vineyard soil type is classified as Dr2.23 hard red duplex with clay subsoil
(Northcote, 1988). Row orientation is north-south and vines are planted at 1.8 m between vines and 3.0
24
m between rows under drip irrigation receiving 0.8 ML/ha of irrigation per season and pruned to 50
nodes per vine. Barossa vineyard soil type is classified as Uc2.21 bleached sand with deep calcareous
subsoil (Northcote, 1988). Row orientation is northwest-southeast and vines were planted at 3.0 m and
3.6 m between rows under drip irrigation receiving 0.25 ML/ha (Grenache) or 0.5 ML/ha (Shiraz and
Chenin Blanc) of irrigation per season and pruned to 30 nodes per vine. Varieties collected from the
Waite were Shiraz, Grenache, Chenin Blanc, Chardonnay, and Thompson Seedless. Varieties collected
from the Barossa were Shiraz, Grenache, and Chenin Blanc. Vines were selected randomly (avoiding
end of row cordons) following anthesis and two bunches per vine were tagged. Tagged bunches were
typically mid-sized (i.e. appeared to have good fruit set) and mid-vine (i.e. not exposed to excessive
sun). Picking of Barossa samples was timed to coincide with commercial harvest; Waite samples were
picked at a similar stage of maturity as Barossa samples, as determined by total soluble sugar content
using a digital refractometer. Picked bunches were placed in a cooler box pre-chilled with ice to
approximately 10 °C for transport to the laboratory. Berries selected for experimental analysis were
intact, mid-bunch berries that did not show any visible signs of physical damage, biological damage,
sunburn, or other anomalies.
2.2.2 Microscopy
Berry pieces (approximately 3 X 3 X 3 mm) were removed by cutting a triangular pattern into the berry
halfway up the side with a fresh razor blade. The resulting ‘pyramidal’ piece came away on the edge of
the blade. The piece was placed into TEM fixative (4% sucrose, 1 X PBS, 4% paraformaldehyde,
0.25% glutaraldehyde), where it was stored at 4 °C overnight (or at 4 °C for up to 2 weeks until
processing). Samples were rinsed with 1 X phosphate buffered saline (PBS) buffer at 4 °C (2-3
changes in 8 hours) to remove excess fixative. Ethanol dehydration was carried out using a series of
changes at 20 minutes each (3 X 70%, 3 X 90%, and 3 X 95%), followed by 3 X 100% dry ethanol
changes of 4 hours, 16 hours, and 8 hours each. The 100% dry ethanol was prepared using a 3A bead
size 8-12 mesh molecular sieve (Sigma Aldrich, Australia). Infiltration with hard grade LR resin
(Proscitech, Thuringowa, Australia) was carried out in a 50:50 mix of 100% ethanol/LR white resin
incubated overnight then with 3 X 100% resin incubations of 8 hours each. Resin-infiltrated samples
were positioned in size 1 gelatine capsules (Proscitech, Thuringowa, Australia) filled with fresh resin.
Berry pieces were consistently placed in the same orientation to achieve similar planes of view for cross
sectioning and ease of microtomy. Polymerisation was undertaken in an oven at 56 °C for 48 hours.
Resin blocks were trimmed with a razor blade to give a trapezoid face. Sections for light and
fluorescence microscopy (1 µm thick) were cut on a Leica EM UC6 ultra-microtome (Leica, Germany)

25
with glass knives. Sections were transferred to Polysine slides (Thermo Scientific, Massachusetts,
USA) for staining as detailed in the following section. Immunofluorescent stained slides were imaged
using a Zeiss Axio Imager M2 (Zeiss, Germany) as detailed in the figure legends.
2.2.3 Histological staining
Toluidine blue staining- Slides were placed on a hot plate (90-100 °C). Sections were covered with a
drop of toluidine blue O (Proscitech, Thuringowa, Australia) working solution (containing 5 mL of 10 g/L
toluidine blue O in 70% ethanol, and 45 mL of 10 g/L NaCl, pH 2.3), stained for 15–20 seconds, rinsed
well with RO water, and replaced on the hot plate to dry.
Methylene blue/basic fuchsin staining- Slides were placed on a hot plate (90–100 °C). Sections were
covered with a drop of Methylene blue solution (containing 0.13 g methylene blue, 0.02 g Azure II, 10
mL glycerol, 10 mL methanol, 30 mL 0.15 M phosphate buffer (pH 6.9), 50 mL distilled water:
Proscitech, Thuringowa, Australia) stained for 40 seconds, rinsed well with RO water, and replaced on
the hot plate to dry. Phosphate buffer (50 mL) was prepared by adding 28 mL 0.15 M Na2HPO4 to 22
mL 0.15 M NaH2PO4 to achieve pH 6.9. Sections were covered with a drop of basic fuchsin stain;
freshly prepared 0.125 g basic fuchsin (Proscitech, Thuringowa, Australia) and 0.125 g borax in 100 mL
distilled water. Sections were stained for 30 seconds, rinsed well with RO water, and replaced on the
hot plate to dry. Coverslips were sealed onto dried slides using Entellan™ new rapid mounting medium
according to manufacturer’s instructions (Merck, Darmstadt, Germany).
2.2.4 Immmunofluorescent staining
A PAP paraffin pen (Sigma Aldrich, Australia) was used to encircle sections on the slide, creating a well
for antibodies. Slides were placed in a slide holder filled with 1 X PBS for 5 minutes. The PBS was
replaced with 0.05 M glycine for 20 minutes, then with incubation buffer (1% BSA in 1 X PBS) twice for
10 minutes. Slides were removed and wick-dried on Kimwipes (Kimberly-Clark, Dallas, USA) and 50 µL
of primary antibody solution (1:50 dilution of Rat IgM LM19 or LM20, Plant Probes, Leeds, UK) was
added and the slide placed in a humidity chamber (plastic box lined with wet paper) for 1 hour. Primary
antibody was washed off with incubation buffer using a plastic Pasteur pipette, followed by 3 X 10
minute washes with incubation buffer in the slide box. Slides were removed and wick-dried on
Kimwipes, 50 µL of secondary antibody solution (1:200 dilution of Goat anti-rat IgG Alexa Fluor488, Life
Technologies, California, USA) was added, and the slide was placed in a humidity chamber (plastic box
lined with wet paper) for 2 hours, with the chamber wrapped in aluminium foil to protect the slides from

26
light. The secondary antibody was washed off with incubation buffer using a plastic Pasteur pipette,
followed by 3 X 10 minute washes with incubation buffer in the slide box. Coverslips received a drop of
90% glycerol before dried slides were inverted over them.
2.2.5 Berry physical testing
Physical testing of berries was undertaken using an Instron Model 5943 with proprietary Bluehill
software (Instron Corporation, Massacheusetts, USA). The Instron is a single column tabletop system
for performing precision tensile and compression materials testing.
2.2.5.1 Test protocols
For all Instron measurements, representative berries were taken from the bunch and basic physical
parameters measured prior to testing; berry weight with a digital balance, berry height (measured in the
distal to proximal axis, i.e. from pedicel to stylar end) and diameter (measured in mid-section of the
berry perpendicular to the distal-proximal axis) with a digital micrometer. For soft or shrivelled berries,
diameter was measured as the widest point (i.e. no compression from micrometer) in the axis that was
to be subsequently tested by the Instron. Berries were removed from the bunch with grape snips,
leaving a small section of pedicel (1-2 mm) still attached to prevent wounding at the pedicel end that
might affect test progress. Test protocols were designed around previously published test protocols for
berry strength testing (Rolle et al., 2012a) using the Bluehill software and available test probes.
For berry hardness tests a 50 N load cell and drill-chuck attachment was fitted. Whole berry
compression was tested using a 12.75 mm diameter flat faced fitting. Berries were positioned directly
under the fitting, and the test proceeded at a rate of 1 mm per second.
For skin hardness tests a 50 N load cell and drill-chuck attachment was fitted. Skin compression was
tested using a 2 mm diameter needle point fitting. Intact berries were positioned directly under the
fitting, and the test proceeded at a rate of 1 mm per second.
For skin thickness tests a 5 mm X 10 mm rectangular strip of skin tissue (composed of epidermal and
hypodermal cell layers) was cut on the berry using a razor blade. The strip was then carefully peeled off
using forceps. Excess fluids were removed by gently dabbing the strip on a Kimwipe. A 50 N load cell
and drill-chuck attachment was fitted. Skin thickness was tested using a 12.75 mm diameter flat faced
fitting. The skin strip was placed on a flat plate directly under the fitting, and the test proceeded at a rate
of 1 mm per second.

27
2.2.5.2 Instron data analysis
A method for manually calculating berry Young’s Modulus from raw Instron data was formulated. This
approach factored in berry dimensions and shape, unlike the automated calculations on the Bluehill
software. Briefly, raw test data and berry dimensions were copied into Microsoft Excel. A stress-strain
curve was generated, with compressive extension (mm) on the X-axis and compressive load (N) on the
Y-axis. The linear portion prior to maximum load and/or break was selected (consisting of at least 10
data points with a linear regression R2 value of >0.99). The linear regression slope and the berry
deformation, D (mm), over the linear portion were used to calculate the force applied, F (N). Poisson
ratio (v) was assumed to be 0.5. An example stress-strain curve is provided in Appendix 1. These
factors, together with the undeformed berry radius (R) were used to calculate Young’s Modulus, E
(MPa), as per Wada et al. (2009), according to the formula;
𝐸(𝑀𝑃𝑎) =3F(1 − 𝑣2)
√2𝑅𝐷
2.2.6 Apoplast fluid centrifuge method
Apoplastic fluids were collected from berries using a modified version of a previously published low-
speed centrifuge method (Wada et al., 2008). Individual berries were cut from the bunch with grape
snips, leaving the pedicel attached. A 3 mm slice was then removed from the distal end of the berry
using a fresh razor blade. The flat surface of the cut berry was then dabbed on a lint-free Kimwipe to
remove cellular fluids from cut cells. The berry was then placed on a stage for low speed centrifugation.
The stage was constructed from the modified cap and screw thread of a 10 mL tube. The top of the lid
and the section of the tube below the screw thread were removed using a scalpel. A square of nylon
mesh (30 mm X 30 mm) was then placed on top of the tube and the open top cap screwed down onto
the thread, producing a tight mesh filter screen. The cut berry was gently placed inside this filter, which
was then placed upright inside a 50 mL falcon tube (with cut berry surface resting against filter mesh
pointing downwards towards the conical base of the falcon tube. This filter method was settled upon
after trialling a variety of other materials for supporting the cut berry in the tube. Plastic ring supports
made from 2 mL Eppendorf tubes and lids were found to damage the berry circumference, producing
contamination of apoplastic extract with cellular fluids. The mesh screen ably distributed the force of
centrifugation across the cut surface; it also provides a greater surface area for wicking of apoplastic
extract away from the berry. Various centrifuge speeds and times were trialled, with it being necessary

28
to optimise these variables for berries of different maturity (i.e. veraison, post-veraison, over-ripe) and
variety (e.g. Shiraz, Thompson Seedless). Both potassium concentration and pH were used as
diagnostics for cellular fluid contamination of collected samples; pH was tested using a micro-pH probe,
pH of collected apoplast samples were compared to pH of juice squeezed from the same berry after
centrifugation. If significant cellular contamination of the apoplast samples was occurring, then the two
readings would be expected to be similar. The apoplast fluid obtained typically had a pH value 0.3-1.0
higher than the respective mixed cellular fluid (predominantly vacuolar fluid). Centrifuge times trialled
were 5 minutes and 20 minutes, with centrifuge forces of 100, 200, 400, and 1000 x g. Volumes
collected were typically 15-50 µL. Standard protocol was 5 minutes at 200g, yielding consistent
uncontaminated samples for most varieties post-veraison. However, Thompson Seedless failed to yield
sufficient volume for analysis using the standard protocol; the firmness of this table grape variety
throughout maturation meant that it was able to withstand greater centrifugation speeds without
suffering cell damage and contaminating apoplast samples. Consequently, for Thompson Seedless,
centrifugation for 5 minutes at 1000 g was used. Chenin Blanc also yielded very low volumes using the
standard protocol. Unlike Thompson Seedless, Chenin Blanc does soften during veraison and ripening,
and does show cell damage when centrifuged at higher speeds. In order to extract uncontaminated
apoplastic fluid from Chenin Blanc, samples were collected over longer centrifugation times (20 minutes
at 200 g). This still yielded reasonably low volumes, and individual berry samples were bulked together
to achieve sufficient volume for analysis.
2.2.7 Nutrient analysis; low volume apoplast method
A low volume protocol was designed for inductively coupled plasma atomic emission spectroscopy
(ICP-AES) analysis of apoplast fluid samples. An electronic dilutor-dispenser (Gilson model 402,
Wisconsin, USA) was used for measurement of apoplast sample volume and dilution with 2% nitric acid
to a final volume of 5 mL. After flushing the tube with diluent and drawing a 20 µL air gap, the diluter
was set to aspirate at 0.1 mL/min, the probe was inserted into the sample and aspirated until the whole
sample was drawn up, the volume was recorded (generally 20-50 µL), then diluted out into a fresh 10
mL tube with 2% nitric to a volume of 5 mL. This approach allowed for accurate measurement of initial
volumes and eliminated loss of sample. Due to the high level dilution in these samples, the ICP-AES
was cleaned prior to each run, and a low-drift method employed. This established a low background
level of detection and allowed for more confidence in assessing samples near the limit of quantification.
Initial tests were performed using 5 mL water to rinse nylon mesh squares and newly prepared filters
screens then performing ICP on the rinse solutions to test the contribution of these components to

29
background elemental detection. The contribution of new screens was negligible and triple rinsing used
screens in milliQ water and storing in 2% nitric acid was sufficient to remove any contamination and
allow reuse (data not shown).
2.2.8 Total soluble sugars, pH and titratable acidity methods
Bunch juice samples were collected by pressing 10-15 randomly selected intact berries from each
bunch in a small hand press. Pressed juice was clarified by centrifugation for 5 min at 3500 rpm. Total
soluble sugar measurements were taken from pressed juice samples (or individual berries where
appropriate) using a digital refractometer with automatic temperature correction. pH measurements of
bunch samples were taken using a digital pH probe. Individual berry juice was collected using a garlic
press. pH measurements from individual berries and apoplastic fluid samples were taken using a Micro
Combination pH electrode (Lazar Research Labs, California, USA). pH and titratable acidity (TA) were
also measured concurrently from bunch juice samples using a Crison Compact auto-titrator (Crison
Instruments, Barcelona, Spain). 10 mL of centrifuged grape juice was diluted with 40 mL of RO water
in plastic sample cups. The auto-titrator was calibrated at pH 4 and pH 7; outputs of initial pH, titre
volume, and final TA were recorded.
2.2.9 Apoplastic ion selective electrode (ISE), pH and calcium activity
measurements
Apoplast fluids were collected as per protocol described in 2.2.6. Micro-pH PHR-146B, calcium
microelectrode ion selective electrode (ISE) ISM-146A, and reference microelectrode DJM-146 (Lazar
Research Labs, Los Angeles, USA) were used to measure the pH and Ca2+ activity of individual berry
and apoplastic fluid samples. The pH of all samples was measured first, followed by Ca2+ activity. ISEs
were connected to a micro-voltmeter (Hanna Instruments H2211; Rhode Island, USA). It was observed
that the readings taken with the calcium microelectrode were prone to fluctuation by electrical
interference and proximity of the user and readings took several minutes to stabilise. A Faraday cage
placed around the electrodes eliminated interference and the influence of electrode drift was negated
by regular calibration. It was also found that the background composition of the solution being
measured (i.e. H2O or berry juice) had a large impact on the readings. This proved problematic for
calibrating the calcium ISE as the background of standards would ideally be similar to the samples
being measured. To address this, an ‘Artificial Grape Juice’ containing the major constituents of grape
juice with a range of calcium concentrations was created to serve as a background for ISE
measurements. Adjustments were made to ensure stability of the solution and eliminate tartrate

30
precipitation. Fresh solutions were made and calibrations carried out on each day of use. Artificial
grape juice composition was as follows; 555 mM D-(+)-Glucose, 555 mM D-Fructose, 26.6 mM cream
of tartar (KC4H5O6), 22.4 mM L-malic acid, 1.04 mM citric acid, 12.9 mM KH2PO4, 2 mM MgSO4, CaCl2
concentrations from 0-10 mM, pH adjusted to 3.2. Example calibration curves for 0-100 mM CaCl2
water based solutions and 0-5 mM CaCl2 artificial grape juice solutions are shown in Appendix 2.
2.2.10 Principal component analysis
Principal component analysis was performed using Unscrambler X (CAMO Software, Oslo, Norway).
Data was pre-processed to scale variables by the inverse of the standard deviation (producing a
standardized variance of 1.0 for all variables) (Esbensen, 2004). Mean centering was applied to the
principal components (Esbensen, 2004). Means were calculated from bunches from 10 replicate vines
per sample. Instron data represents mean values from measurement of five individual berries per
bunch. All other data represents pooled berry measurements, where five (ICP-AES data, apoplast pH,
apoplast Ca2+ activity) or ten (brix, pH, TA) berries from each bunch were pooled to give a single
measurement per bunch.
2.3 Results
2.3.1 Berry histological staining
Staining of grape berries with toluidine blue O can reveal details of phenolic distribution between cell
types and also highlight cell walls. Toluidine blue O stains phenolics bluish-green and cell walls
reddish-purple (Cadot et al., 2011). Shiraz demonstrated the strongest staining pattern for phenolics,
with cells of the outer epidermal layer displaying fine granulations and some spherical vacuolar
inclusions, hypodermal layers displaying large dense staining vacuolar inclusions, and outer mesocarp
cells displaying smaller dispersed inclusions (Figure 2.1A). Shiraz also had a much more rounded
epidermal cell shape than all other varieties surveyed. Grenache demonstrated additional layers of
epidermal cells showing small inclusions, lower staining intensity in hypodermal cell inclusions, and a
mix of small inclusions, granulation and uniform staining in outer hypodermal cells (Figure 2.1B).
Chenin Blanc demonstrated mostly granular staining in the epidermis, uniform vacuolar staining in the
hypodermis, and uniform staining of select cells of the outer mesocarp (Figure 2.1C). Thompson
Seedless demonstrated very low phenolic staining by toluidine blue O with some granulations occurring
irregularly across various cell types (Figure 2.1D). Chardonnay had small vacuolar inclusions containing

31
phenolics in the epidermis, and uniform or granular staining in the hypodermis and outer mesocarp
(Figure 2.1E). Toluidine blue O staining also highlighted some differences between cell walls. Cell wall
thickness of Shiraz cells decreased from the periphery of the berry to the interior from thick walled
epidermal cells to moderately thick walled hypodermal cells to thin walled mesocarp cells (Figure 2.1A).
In contrast, Grenache had thick cell walls in epidermal, hypodermal, and mesocarp cell types (Figure
2.1B, G); Thompson Seedless had relatively thin walls surrounding all cell types (Figure 2.1D, I).
Methylene blue/basic fuchsin stains phenolics blue, cytoplasm pink, and cell walls and lipids red (Kraus
et al., 1998) The pattern of methylene blue-basic fuchsin phenolic staining and cell wall morphology
was consistent with that observed using toluidine blue O (Figure 2.1).
2.3.2 Berry immunofluorescent staining
Immunofluorescence microscopy using the pectin specific antibodies LM19 and LM20 demonstrated
that pectin was distributed throughout berry epidermal and hypodermal cell walls across all varieties
surveyed (Figure 2.2). LM19 (which binds de-esterified pectins) showed a diversity of staining patterns
between varieties. Shiraz, Chenin Blanc and Chardonnay showed a banded staining pattern, with
patches of intense staining observed in the middle lamella of lateral walls and at tri-cellular junctions
(Figure 2.2 A, C, E). Grenache and Thompson Seedless demonstrated a strong punctate pattern
throughout the walls of both epidermal and hypodermal cells (Figure 2.2B, D). LM20 (which binds highly
esterified pectins) showed less clear differences in staining pattern between varieties. Some areas of
stronger staining were observed in the middle lamella and transverse walls of hypodermal cells in a
number of varieties (Shiraz, Grenache, and Thompson Seedless) (Figure 2.2F, G, I).
2.3.3 Berry physical properties
Instron tests were used to analyse the hardness and elasticity of both whole berries and skins, as well
as to measure skin thickness. Shiraz showed low berry and skin hardness, as well as high elasticity of
berries and skins compared to other varieties (Figure 2.3A-D). Instron measurements indicated that
Grenache had significantly higher skin hardness and thicker skin than other varieties (Figure 2.3C, E).
These attributes may be related to the greater number of epidermal/hypodermal layers with thick cell
walls in Grenache (Figure 2.1B, G) compared to Shiraz, Chenin Blanc and Thompson Seedless berries
(Figure 2.1A, C, D, F, H, I). Chenin Blanc samples from the Waite vineyard showed greater berry-to-
berry variation in some measurements (e.g. skin thickness by Instron; Figure 2.3E). Thompson
Seedless had the hardest and least elastic berries of surveyed varieties (Figure 2.3A, B).

32
Figure 2.1. Representative images of varietal differences in grape cell morphology. Toluidine blue O (A-
E) and methylene blue/basic fuchsine (F- J) stained berry sections of Shiraz (A, F), Grenache (B, G),
Chenin Blanc (C, H), Thompson Seedless (D, I) and Chardonnay (E, J). Tissue fixed in LR resin and
visualised by light microscopy. Scale bars represent 50 µm. Similar sections were obtained from three
replicate berries from separate vines.

33
Figure 2.2. Representative images showing varietal differences in distribution of de-esterified and
esterified pectin epitopes. De-esterified homoglacturonan (LM19; A-E) and highly esterified
homogalacturonan (LM20; F-J) immuno-labelled sections of Shiraz (A, F), Grenache (B, G), Chenin
Blanc (C, H), Thompson Seedless (D, I), and Chardonnay (E, J) berries. Tissue fixed in LR resin and
visualised using immuno-fluorescence. Scale bars represent 50 µm). Similar sections were obtained
from three replicate berries from separate vines.

34
Figure 2.3. Instron measurement of berry physical characteristics reveals varietal differences. Separate
tests were performed for berry hardness (A), skin hardness (C), and skin thickness (E). Young's
modulus calculated using Instron software for berry (B), and skin (D) elasticity. Different colours indicate
different varieties (Shiraz; red, Grenache; purple, Chenin Blanc; yellow, Thompson Seedless; green,
Chardonnay; white).Mean + SD (n=10 replicate bunches, bunch means from 5 berries per bunch).
Columns with different notation are significantly different using one way analysis of variance and a
Tukey posthoc test at 95 % CI.
Interestingly, it showed low hardness in the skin (measured by maximum breaking energy using a
needle probe) (Figure 2.3C, D). Chardonnay had the second highest skin hardness after Grenache
0 .0 0
0 .0 2
0 .0 4
0 .0 6
0 .0 8
Be
rry
ha
rd
ne
ss
(J
)
b cb c
c
b
a
A
0 .0 0 0
0 .0 0 2
0 .0 0 4
0 .0 0 6
Sk
in h
ard
ne
ss
(J
)
b
c c
a
c
C
0 .0
0 .1
0 .2
0 .3
0 .4
Be
rry
Yo
un
g's
mo
du
lus
(N
mm
-1)
c
b
c
b
a
B
0 .0 0
0 .0 5
0 .1 0
0 .1 5
Sk
in Y
ou
ng
's m
od
ulu
s (
Nm
m-1
)b c
b
c
a a
D
Sk
in t
hic
kn
es
s (
M)
0
5 0
1 0 0
1 5 0
b
c
ba
b
E
S h ira z
G re n a c h e
C h e n in B la n c
T h o m p s o n S e e d le ss
C h a rd o n n a y

35
(Figure 2.3C) and moderately thick skin (Figure 2.5E). Similar to Grenache, Chardonnay was observed
to have multiple epidermal layers and relatively thick cell walls compared to other varieties (Figure 2.1).
2.3.4 Berry tissue nutrient composition
A number of analyses were carried out on extracted apoplast fluid to characterise the composition of
this compartment (Figure 2.4). Full ICP-AES data for apoplastic fluids, skin and mesocarp tissues, as
well as juice parameters of all varieties collected from the Waite vineyard are detailed in Table 2.1.
Shiraz showed the highest potassium concentration of all varieties in all tissues sampled (apoplast,
mesocarp, and skin) (Table 2.1). In Chenin Blanc, [Ca]apo and Ca2+ activity were relatively high (Figure
2.4A, C). Thompson Seedless demonstrated much higher [Ca]apo and Ca2+ activity than both Shiraz and
Grenache (Figure 2.4A, C). Both the mesocarp and apoplast of Thompson Seedless had a high
calcium concentration relative to other varieties (Table 2.1).
To assess the level of cellular breakdown (and contamination or dilution of apoplastic samples with
cellular fluid) the ratio of [K]mesocarp: [K]apo was calculated. No differences in this ratio were observed
between Thompson Seedless, Grenache and Shiraz (Table 2.1). The [K]mesocarp: [K]apo ratio in Chenin
Blanc from Waite vineyard was much lower than other varieties and also lower than Chenin Blanc from
the Barossa (Table 2.2), suggesting that some cellular breakdown may have been occurring.
Additionally, the variation in [K]apo, [Ca]apo, apoplastic Ca2+ activity, and apoplastic pH measurements
was high in Waite Chenin Blanc, suggesting an effect upon some berries but not others. Some Botrytis
infection was observed in Waite Chenin Blanc samples, and this may have been a factor.
Barossa samples showed higher calcium concentrations in apoplast fluids, mesocarp, and skin tissues
than Waite samples (Table 2.2). An exception to this was in Chenin Blanc, where the occurrence of
some Botrytis infection in Waite samples may have been responsible for elevated apoplast calcium
level, resulting in no significant difference being detected between sites. Additionally, the differences in
calcium levels between sites were not significant in Grenache apoplast and mesocarp samples,
although significant differences in the skin were observed (Table 2.2). This indicates that Grenache
either exhibits less site sensitivity in calcium uptake or greater translocation of calcium to the skin than
Shiraz. Potassium accumulation is usually correlated with sugar concentration over development;
Chenin Blanc demonstrated higher [K]mesocarp and sugar concentration in Barossa samples.
Interestingly, Barossa Shiraz demonstrated lower [K]mesocarp and higher sugar concentration than Waite
Shiraz. Sodium levels were also consistently higher in Barossa samples, indicating the soil and/or water
conditions here had an impact on uptake of sodium into the berry skins, mesocarp and apoplast. No

36
significant differences in berry juice pH within varieties were detected between sites. The only variety to
show any significant differences between sites in apoplastic pH or apoplastic Ca2+ activity was Shiraz,
with lower apoplastic pH and higher apoplastic Ca2+ activity in Barossa samples (Table 2.2).
Similar patterns were seen between Waite samples and Barossa samples with regards to skin and
berry physical properties (Table 2.2). At both sites, Grenache had the hardest berries and skins and the
highest Young’s Modulus (i.e. least elastic) berries and skins. Shiraz demonstrated the softest berries,
and also showed the lowest Young’s Modulus (i.e. most elastic) berries and skins. Differences in skin
thickness measured by the Instron were only apparent in Waite samples; the Botrytis infection of Waite
Chenin Blanc may have resulted in a lower calculated skin thickness.
Figure 2.4. Varietal differences in apoplastic ion composition from Waite vineyard berries. Total calcium
(A) and potassium (B) concentration (mM) in apoplastic fluid measured by ICP-AES. Free calcium ion
activity (mM Ca2+) (C) and pH (D) in apoplastic fluid measured with ISE. Different colours indicate
different varieties (Shiraz; red, Grenache; purple, Chenin Blanc; yellow, Thompson Seedless; green,
Chardonnay; white). No ICP-AES samples were collected for Chardonnay due to early ripening and
time constraints. Mean + SD. Columns with different notation are significantly different using one way
analysis of variance and a Tukey posthoc test at 95 % CI.
0
1
2
3
Ap
op
las
t c
alc
ium
co
nc
en
tra
tio
n (
mM
)
a
b b
a
A
0
1 0
2 0
3 0
4 0
5 0
Ap
op
las
t p
ota
ss
ium
co
nc
en
tra
tio
n (
mM
) a a
bb
B
0 .0
0 .5
1 .0
1 .5
2 .0
2 .5
Ap
op
las
t fr
ee
ca
lciu
m
(Ca
2+
) a
cti
vit
y (
mM
)
ccb c
a
a b
C
0
1
2
3
4
5
Ap
op
las
t p
H
a b ba bab
D

37
Shiraz Grenache Chenin Blanc Thompson Seedless Chardonnay
Mean SD Mean SD Mean SD Mean SD Mean SD
Berry juice parameters Brix 22.3 b 1.4 26.6 a 1.0 22.4 b 1.5 22.0 b 1.6 23.6 b 0.7
pH 3.23 b 0.13 3.40 a 0.09 3.25 b 0.12 3.19 b 0.13 3.19 b 0.07
TA 0.62 c 0.06 0.68b c 0.04 0.63 c 0.07 0.76 ab 0.10 0.84 a 0.07
Apoplast pH ISE pH 4.18 ab 0.12 4.26 a 0.15 4.11 ab 0.34 3.94 b 0.19 3.99 b 0.06
Apoplast Ca2+ activity ISE
(mM)
Ca2+ 0.60 c 0.18 0.91 bc 0.25 1.23 ab 0.60 1.65 a 0.58 0.64 c 0.22
Apoplast fluid ICP-AES
(mM)
B 0.66 a 0.21 0.41 b 0.09 0.59 ab 0.13 0.44 b 0.14
Ca 1.44 b 0.58 1.39 b 0.27 2.21 a 0.61 2.22 a 0.48
Mg 3.17 a 0.38 2.18 b 0.23 3.49 a 0.74 3.06 a 0.30
Na 0.61 ab 0.25 0.69 a 0.13 0.45 b 0.11 0.40 b 0.10
K 40.2 a 2.0 27.9 b 3.0 37.1 a 5.9 27.2 b 9.3
P 3.39 a 0.84 0.79 b 0.20 2.94 a 0.53 4.16 a 2.17
S 1.13 a 0.23 0.70 b 0.11 0.74 b 0.16 0.94 ab 0.57
Mesocarp tissue ICP-AES
(mM)
B 0.66 a 0.19 0.39 b 0.08 0.49 b 0.08 0.51 ab 0.09
Ca 1.64 b 0.41 1.28 bc 0.38 0.85 c 0.17 2.39 a 0.77
Mg 3.08 b 0.31 2.90 b 0.34 2.27 c 0.49 3.67 a 0.27
Na 0.76 a 0.38 0.68 a 0.09 0.35 b 0.10 0.28 b 0.18
K 55.1 a 2.6 42.7 b 3.9 39.7 b 2.6 37.8 b 9.7
P 5.04 b 0.63 2.17 c 0.27 4.21 b 0.54 6.88 a 2.30
S 2.51 a 0.27 1.77 b 0.32 1.60 b 0.18 1.91 b 0.56
Fe 0.030 b 0.003 0.045 b 0.005 0.026 b 0.006 0.208 a 0.048
Cu 0.025 a 0.002 0.007 c 0.002 0.016 b 0.003 0.019 b 0.005
Zn 0.007 a 0.001 0.007 a 0.002 0.004 b 0.001 0.007 a 0.002
Skin tissue ICP-AES (mM) B 2.83 a 0.90 1.84 b 0.28 1.87 b 0.38 2.35 ab 0.44
Ca 10.5 ab 1.9 12.2 a 2.1 7.8 c 1.8 8.1 bc 2.2
Mg 5.35 bc 1.57 8.50 a 0.72 4.93 c 0.17 6.42 b 1.08
Na 0.49 a 0.28 0.34 ab 0.07 0.15 b 0.03 0.39 ab 0.29
K 238 a 29 203 bc 15 213 ab 20 180 c 18
P 17.6 b 3.9 6.4 c 1.1 14.8 b 2.2 22.6 a 2.8
S 9.75 a 2.15 6.94 b 0.74 6.32 b 0.87 6.19 b 1.47
Fe 0.155 ab 0.043 0.198 a 0.023 0.110 b 0.015 0.171 ab 0.087
Cu 0.073 a 0.012 0.035 b 0.006 0.041 b 0.009 0.054 b 0.028
Zn 0.029 ab 0.005 0.030 ab 0.0047 0.017 b 0.005 0.044 a 0.041
[K]mesocarp:[K]apoplast 1.37 a 0.09 1.55 a 0.25 1.09 b 0.14 1.42 a 0.16
Table 2.1. Varietal differences in berry juice, apoplast, mesocarp and skin composition at harvest
maturity from Waite vineyard berries. No ICP-AES samples were collected for Chardonnay due to early
ripening and time constraints. Each bunch value determined as mean value from five individual berry
measurements, or single measurement of five or ten pooled berries, depending on variable (see
Materials and Methods). Bunch mean and SD from n=10 replicate vines. Columns with different
notation are significantly different using one way analysis of variance and a Tukey posthoc test
(P<0.05).

38
Sh
iraz
G
ren
ach
e
Ch
enin
Bla
nc
Site
1
Site
2
Sign
ific
ant
dif
fere
nce
(P
<0
.05
)
Site
1
Site
2
Sign
ific
ant
dif
fere
nce
(P
<0
.05
)
Site
1
Site
2
Sign
ific
ant
dif
fere
nce
(P
<0
.05
) M
ean
SD
M
ean
SD
M
ean
SD
M
ean
SD
M
ean
SD
M
ean
SD
Ber
ry ju
ice
pa
ram
ete
rs
Bri
x 2
2.3
1
.4
24
.0
0.8
*
2
6.6
1
.0
28
.3
0.9
*
2
2.4
1
.5
24
.5
1.5
*
pH
3
.24
0
.14
3
.28
0
.07
3.4
0
0.0
9
3.3
4
0.0
7
3
.25
0
.12
3
.35
0
.07
TA
0.6
2
0.0
5
0.9
2
0.0
5
*
0.6
8
0.0
4
0.6
9
0.0
5
0
.63
0
.07
0
.97
0
.07
*
Ap
op
last
pH
ISE
p
H
4.1
8
0.1
2
3.8
3
0.0
2
*
4.2
6
0.1
5
4.1
9
0.3
5
4
.12
0
.34
4
.10
0
.15
Ap
op
last
Ca2
+ act
ivit
y IS
E (m
M)
Ca2
+ 0
.60
0
.18
1
.72
0
.48
*
0
.91
0
.25
1
.01
0
.33
1.2
3
0.6
0
1.1
5
0.2
6
Ap
op
last
flu
id IC
P-A
ES (
mM
) B
0
.66
0
.21
0
.52
0
.08
*
0
.41
0
.09
0
.37
0
.07
0.5
9
0.1
3
0.5
8
0.0
8
Ca
1.4
4
0.5
8
2.1
6
0.6
7
*
1.3
9
0.2
7
1.8
1
0.5
0
2
.21
0
.61
2
.16
0
.33
Mg
3.1
7
0.3
8
2.9
1
0.2
7
2
.18
0
.22
1
.88
0
.34
3.4
9
0.7
3
3.2
2
0.3
6
Na
0.6
1
0.2
5
0.9
2
0.2
6
0
.69
0
.13
1
.29
0
.49
*
0
.45
0
.11
1
.29
0
.40
*
K
40
.2
2.0
2
7.2
3
.3
*
27
.9
3.0
2
5.5
4
.7
3
7.1
5
.9
32
.4
3.2
*
P
3.3
9
0.8
4
1.8
2
0.4
2
*
0.7
9
0.2
0
1.4
5
0.4
1
*
2.9
4
0.5
3
1.9
7
0.5
8
*
S 1
.12
9
0.2
27
1
.06
0
0.2
30
0.6
99
0
.10
6
0.8
39
0
.19
0
0
.73
8
0.1
63
1
.40
3
0.2
32
*
Mes
oca
rp IC
P-A
ES (
mM
) B
0
.66
0
.19
0
.53
0
.11
*
0
.39
0
.08
0
.47
0
.04
0.4
9
0.0
8
0.5
1
0.0
6
Ca
1.6
4
0.4
1
2.2
8
0.4
5
*
1.2
8
0.3
8
1.5
1
0.3
8
0
.85
0
.17
1
.33
0
.24
*
Mg
3.0
8
0.3
1
3.2
6
0.4
3
2
.90
0
.34
3
.01
0
.25
2.2
7
0.4
9
2.7
3
0.1
9
*
Na
0.7
6
0.3
7
1.4
0
0.5
4
*
0.6
8
0.0
9
1.8
0
0.8
9
*
0.3
5
0.1
0
1.4
4
0.5
3
*
K
55
.1
2.6
4
3.6
8
.8
*
42
.7
3.9
4
0.5
2
.8
3
9.7
2
.6
47
.7
5.7
*
P
5.0
4
0.6
3
4.2
5
0.9
7
*
2.1
7
0.2
7
3.9
8
0.6
0
*
4.2
1
0.5
4
4.0
2
0.6
9
S 2
.51
0
.27
2
.77
0
.27
1.7
7
0.3
2
2.0
6
0.2
0
1
.60
0
.18
2
.83
0
.39
*
Fe
0.0
30
0
.00
3
0.0
27
0
.00
5
0
.04
5
0.0
05
0
.04
0
0.0
05
0.0
26
0
.00
6
0.0
37
0
.00
4
*
Cu
0
.02
5
0.0
02
0
.01
4
0.0
02
*
0
.00
7
0.0
02
0
.01
1
0.0
01
*
0
.01
6
0.0
03
0
.01
1
0.0
02
*
Zn
0.0
07
0
.00
1
0.0
06
0
.00
2
0
.00
8
0.0
02
0
.00
5
0.0
02
*
0
.00
4
0.0
01
0
.00
6
0.0
02
*
Skin
tis
sue
ICP
-AES
(m
M)
B
2.8
3
0.9
0
1.8
1
0.3
9
*
1.8
4
0.2
8
1.9
3
0.2
6
1
.87
0
.38
1
.68
0
.22
Ca
10
.5
1.9
1
3.8
1
.7
*
12
.2
2.1
1
8.3
2
.9
*
7.8
1
.8
10
.3
2.1
*
Mg
5.4
1
.6
5.9
0
.8
8
.5
0.7
1
1.4
2
.0
*
4.9
0
.2
5.8
0
.8
Na
0.4
9
0.2
8
0.8
1
0.3
9
0
.34
0
.07
1
.29
0
.96
*
0
.14
0
.03
0
.96
0
.32
*
K
23
8
29
1
71
2
6
*
20
3
15
1
99
2
1
2
13
2
0
20
6
38
P
17
.6
3.9
2
4.1
5
.0
*
6.4
1
.1
17
.3
2.6
*
1
4.8
2
.2
16
.7
2.7
S 9
.75
2
.15
9
.71
1
.05
6.9
4
0.7
4
7.7
4
0.8
3
6
.32
0
.87
9
.31
1
.43
*
Fe
0.1
55
0
.04
3
0.1
65
0
.01
8
0
.19
8
0.0
23
0
.17
6
0.0
55
0.1
10
0
.01
5
0.1
46
0
.02
8
Cu
0
.07
3
0.0
12
0
.03
7
0.0
05
*
0
.03
5
0.0
06
0
.03
1
0.0
04
0.0
41
0
.00
9
0.0
29
0
.00
5
*
Zn
0.0
29
0
.00
5
0.0
17
0
.00
4
*
0.0
30
0
.00
5
0.0
18
0
.00
5
*
0.0
17
0
.00
5
0.0
15
0
.00
4
[K]m
eso
carp
:[K
]ap
op
last
1.3
7
0.0
9
1.6
3
0.4
1
1
.55
0
.25
1
.65
0
.41
1.0
9
0.1
4
1.4
8
0.1
6
*
Ber
ry h
ard
nes
s
J 0
.01
1
0.0
03
0
.01
6
0.0
02
*
0
.02
4
0.0
04
0
.02
4
0.0
03
0.0
14
0
.00
3
0.0
19
0
.00
3
*
Ber
ry Y
ou
ng’
s m
od
ulu
s
Nm
m-1
0
.13
3
0.0
37
0
.17
0
0.0
27
0.2
07
0
.02
7
0.3
52
0
.03
1
*
0.1
82
0
.03
2
0.2
53
0
.05
2
*
Skin
har
dn
ess
J
0.0
01
0
0.0
00
3
0.0
02
1
0.0
00
3
*
0.0
04
6
0.0
00
7
0.0
04
6
0.0
00
7
0
.00
10
0
.00
02
0
.00
22
0
.00
02
*
Skin
Yo
un
g’s
mo
du
lus
N
mm
-1
0.0
48
0
.00
5
0.0
51
0
.00
7
0
.08
6
0.0
97
0
.09
8
0.0
13
*
0
.05
9
0.0
10
0
.07
6
0.0
10
*
Skin
th
ickn
ess
µ
M
91
.5
6.5
9
2.5
9
.5
1
03
.5
3.2
9
4.9
5
.5
7
1.5
1
1.9
8
7.0
8
.7
*
Tab
le 2
.2. S
ite s
peci
fic d
iffer
ence
s in
ber
ry ju
ice,
apo
plas
t, m
esoc
arp,
and
ski
n co
mpo
sitio
n at
har
vest
mat
urity
. Com
paris
on o
f dat
a fr
om
Wai
te v
iney
ard
(Site
1)
and
Bar
ossa
vin
eyar
d (S
ite 2
). S
ite 1
dat
a is
rep
eate
d fr
om T
able
2.1
in o
rder
to h
ighl
ight
site
spe
cific
diff
eren
ces
in
nutr
ient
acc
umul
atio
n. E
ach
bunc
h va
lue
dete
rmin
ed a
s m
ean
valu
e fr
om fi
ve in
divi
dual
ber
ry m
easu
rem
ents
, or
sing
le m
easu
rem
ent o
f fiv
e
or te
n po
oled
ber
ries,
dep
endi
ng o
n va
riabl
e (s
ee M
ater
ials
and
Met
hods
). B
unch
mea
n an
d st
anda
rd d
evia
tion
from
n=
10 r
eplic
ate
vine
s.
Diff
eren
ces
wer
e te
sted
usi
ng tw
o w
ay a
naly
sis
of v
aria
nce
and
Sid
ak’s
pos
thoc
test
, * in
dica
tes
sign
ifica
nt d
iffer
ence
(P
<0.
05)
with
in a
varie
ty b
etw
een
site
s ac
cord
ing
to S
idak
’s p
osth
oc te
st.

39
2.3.5 Principal component analysis
Principal component analysis of the major berry variables gives a picture of the site and variety
differences in nutrient uptake and maturity, as well as demonstrating correlations between variables
(Figure 2.5 A). Shiraz samples separate strongly by site along PC-1, mostly due to differences in tissue
K and Ca levels. Grenache samples separated from all other samples on PC-2, due to the higher
maturity and skin calcium levels found in these samples. Instron measurements were included in the
PCA analysis (Figure 2.5 B) to examine relationships between berry and skin strength, berry maturity,
and tissue calcium levels. PC-1 explains 47% of the variation and is largely comprised of potassium
concentration measurements from mesocarp, skin and apoplast clustering together on one end of the
axis, and Instron measurements (berry/skin hardness and YM, skin thickness), berry maturity measures
(brix and pH), and skin calcium concentration at the other extreme. PC-2 explains 28% of the variation,
demonstrating a strong correlation between TA, [Ca2+]apo, [Ca2+]mesocarp, and apoplastic Ca2+ activity;
these measures demonstrate a strong negative correlation with apoplastic pH. Shiraz samples show
the strongest separation by site, with Barossa Shiraz showing high [Ca2+]apo and apoplastic Ca2+
activity. Grenache samples showed the least separation by site; this may be due to the consistently
high Instron values, maturity measures, and skin calcium concentration that Grenache demonstrated at
both sites (Table 2.2). Inclusion of boron measurements in PCA analysis (Figure 2.5 C) revealed that
boron concentrations in all tissues largely correlate with potassium concentrations, as would be
expected for nutrients that follow similar paths of phloem-fed berry uptake. Interestingly, TSS does not
correlate with potassium and boron concentrations, suggesting that independent cellular transport
mechanisms operate for accumulation of phloem mobile ions and sugars. Inclusion of sodium
measurements in PCA analysis (Figure 2.5 D) revealed that sodium concentration is very highly
correlated in all tissues; [Na+]mesocarp, [Na+]skin, and [Na+]apo, all clustered together. Inclusion of sodium
measurements in the analysis also provided very clear separation of varieties by site; indicating that
berry sodium uptake is highly site dependent.

40
A C
B D
Fig
ure
2.5.
Bi-p
lot o
f sco
res
(in b
lue)
and
var
iabl
e lo
adin
gs (
in r
ed)
for
prin
cipa
l com
pone
nts
of b
erry
var
ieta
l sur
vey
data
. PC
A p
erfo
rmed
usi
ng a
set
of
core
var
iabl
es (
juic
e m
easu
rem
ents
, tis
sue
calc
ium
and
pot
assi
um c
once
ntra
tions
) (A
), a
s w
ell a
s w
ith a
dditi
onal
Inst
ron
mea
sure
men
ts (
B),
bor
on
mea
sure
men
ts (
C),
and
sod
ium
mea
sure
men
ts (
D).
Dat
a re
pres
ents
sco
res
(in r
ed)
of 3
var
ietie
s (S
hira
z, G
rena
che
and
Che
nin
Bla
nc)
from
two
diffe
rent
si
tes
(site
1: W
aite
, site
2: B
aros
sa).
Var
iabl
e lo
adin
g (in
blu
e); a
po =
apo
plas
t, m
eso
= m
esoc
arp
(e.g
. pH
apo
= A
plop
last
pH
, fre
e C
a ap
o =
apo
plas
t fr
ee C
a2+ a
ctiv
ity, C
a ap
o =
apo
plas
t to
tal [
calc
ium
], C
a m
eso
= m
esoc
arp
tota
l [ca
lciu
m])
. Oth
er v
aria
bles
incl
ude;
K =
pot
assi
um, B
= b
oron
, Na
=
sodi
um, p
H =
ber
ry ju
ice
pH, T
A =
ber
ry ju
ice
titra
tabl
e ac
idity
, T
SS
= b
erry
juic
e T
SS
(°
Brix
), B
erry
YM
= b
erry
You
ng’s
mod
ulus
, Ber
ry h
ard
= b
erry
ha
rdne
ss, S
kin
hard
= s
kin
hard
ness
, Ski
n th
ick
= s
kin
thic
knes
s.

41
2.4 Discussion
2.4.1 Berry phenolics
In Shiraz grapes, the level of total phenolics in the skin has been observed to increase from veraison to
reach a maximum at 110-120 days after anthesis (Ristic and Iland, 2005). The composition of the cell
wall has an impact on extractability of an important group of pigmented phenolics called anthocyanins
(which are largely located in skin cell vacuoles), which subsequently impact wine colour (Ortega-
Regules et al., 2008). Indeed, skin mechanical properties have been linked to anthocyanin
extractability, with berries possessing harder skins demonstrating higher anthocyanin extractability
(Rolle et al., 2012b). When looking at histological sections of mature grapes, it would be expected to
see more phenolics (including anthocyanin) in the skin cells. High levels of skin phenolics were
detected in Shiraz berry tissue harvested at maturity and stained with toluidine blue O (Figure 2.1A).
Different phenolic staining patterns were observed between the epidermal, hypodermal, and outer
mesocarp cells of different varieties. Large inclusions were only found in the hypodermal cells of the
two red grape varieties, Shiraz and Grenache (Figure 2.1A, B). These red varieties also exhibited a
variety of small inclusions, granulations, and uniformly stained cells throughout the tissue (Figure 2.1A,
B). The white wine varieties Chenin Blanc and Chardonnay exhibited mostly uniformly staining cells in
the hypodermis and mesocarp, with some epidermal cells containing granular and small inclusions
(Figure 2.1C, E). This contrasts to the white table grape variety Thompson Seedless, which showed
very little staining in all cell types (Figure 2.1D). It has been shown that the occurrence of different
forms of phenolic deposits changes over the course of berry development and also in response to
water availability and environmental differences between sites (Cadot et al., 2011). As the samples
collected for this study were all from the same site and season, we can also conclude that the
occurrence of different phenolic forms varies greatly between varieties, with cells containing large
inclusions only occurring in red varieties, white wine varieties exhibiting cells containing mostly fine
granular or uniform staining, and the white table grape variety exhibiting very little phenolic staining.
2.4.2 Berry cell morphology
Varieties also showed differences in the morphology of epidermal, hypodermal and outer mesocarp cell
layers. Most noticeably, Shiraz demonstrated 1-2 layers of large, rounded epidermal cells, whereas
most other varieties had 1-2 layers (Chardonnay had 4 layers) of small, elongate epidermal cells
(Figure 2.1). A previous survey of table grape varieties found a correlation between the number and
thickness of epidermal and hypodermal cell layers and varietal resistance to Botrytis cinerea (Gabler et

42
al., 2003). This previous study also found correlations between cuticle and wax content and resistance,
but no relationship between phenolic content and Botrytis resistance (Gabler et al., 2003). Thompson
Seedless was identified as a variety highly susceptible to Botrytis, with relatively few epidermal and
hypodermal cell layers, and relatively low total skin thickness. Comparison of the skin cell morphology
of Thompson Seedless (Figure 2.1D, I) with the wine grape varieties revealed Thompson Seedless to
have the thinnest skins and the least epidermal and hypodermal cell layers. The diversity of
morphology in epidermal and hypodermal cell layers of the wine grapes may be one of many factors
determining their susceptibility to Botrytis. In the present study, some Botrytis infection was found in
Waite Chenin Blanc. However, many other factors are important in determining infection rates in the
field, so this should not be taken as an indicator of Chenin Blanc susceptibility to Botrytis per se.
2.4.3 Berry pectin distribution
Pectic polysaccharides are major components of grape berry cell walls; higher concentrations of the
basic pectin subunit galacturonic acid have been found in skin cell walls compared to mesocarp cell
walls (Vidal et al., 2001). However, mesocarp cell walls contain more soluble pectin than skin cell walls,
indicating that although pectins are more prevalent in the skin, they are also more tightly bound to the
cell wall matrix (Vidal et al., 2001). Pectin is secreted into the cell wall in an esterified form, the action of
pectin methyl esterases (PMEs) de-esterifies pectin, allowing cross linking of adjacent pectin by
calcium. By studying the patterns of pectin distribution in skin and outer mesocarp cell walls using
antibody labelling specific for esterified and de-esterified pectin, it is possible to unravel some of the
complex differences between grape varieties relating to changes in the properties of cell walls during
ripening.
LM19, which binds de-esterified pectin, was localised most strongly to the middle lamella in all varieties
(Figure 2.2). The disassembly of the cell wall matrix and weakening of intercellular bonds in the middle
lamella has previously been identified in ripening berries (Huang et al., 2005). The middle lamella of
fruit cell walls is believed to consist mostly of homogalacturonan and structural proteins, its relatively
simple polysaccharide composition compared to the primary cell wall suggests that the role of pectin
modification and binding in this space is crucial for determining cell adhesion (Brummell, 2006). The
strong punctate pattern of de-esterified pectin observed in the middle lamella of Grenache and
Thompson Seedless berries may indicate areas of high PME activity where adjacent cells are anchored
together by crosslinking of de-esterified pectin (Figure 2.2B, D). These areas may be plasmodesmatal
pit fields between adjacent cells. Pit fields of tomato fruit contain high levels of homogalacturonan
(Orfila and Knox, 2000). Another study identified high levels of PME epitope localisation to the
43
plasmodesmata in flax hypocotyl, suggesting that pectins in these domains are highly de-esterified
(Morvan et al., 1998). Similar results have been found in potato cortex and kiwifruit, where high levels
of Ca2+-pectin crosslinks were hypothesised to act as “spot-welds” protecting plasmodesmata from
damage during cell expansion (Bush and McCann, 1999; Sutherland et al., 1999). The more diffuse
banded pattern of de-esterified pectin distribution observed in Shiraz, Chenin Blanc, and Chardonnay
indicates that long strips of middle lamella are de-esterified along lateral cell walls and in tricellular
junctions, leading to cell-cell binding along the length of the cell boundaries (Figure 2.2A, C, E). Cellular
junctions have been previously identified as zones of high pectin de-esterification (Morvan et al., 1998;
Bush and McCann, 1999).
LM20 binds esterified pectin epitopes and differences between varieties were less clear using this
antibody tag. Some varieties (Shiraz, Grenache, and Thompson Seedless) showed slightly stronger
staining for LM20 (relative to the cell wall as a whole) in the middle lamella and transverse cell walls
(Figure 2.2F, G, I). This concurs with the high concentration of homogalacturonan found in the middle
lamella (Brummell, 2006; Hyodo et al., 2013); the preferential de-esterification of pectin observed in the
lateral walls of some varieties would logically leave relatively higher concentrations of esterified pectin
in the transverse walls. Particularly low amounts of esterified pectin staining was observed in
Chardonnay (Figure 2.2J), mostly in the transverse cell walls and as patches in the lateral primary cell
wall. This suggests that the large majority of pectin is de-esterified in this variety, leaving small areas
that have not been exposed to PME activity. The variety-specific nature of pectin distribution and
modification may help explain some ripening phenomena and deserves greater investigation.
Different patterns of pectin de-esterification have been observed using LM19 and LM20 antibodies on
tomato tissues (Hyodo et al., 2013). High pectin densities were observed in the skin, with the level of
de-esterification increasing throughout ripening. Increased expression of tomato PME1 in the skin
during the mature green stage is believed to be responsible for increased pectin de-esterification,
formation of Ca2+-pectin cross-links and maintenance of skin firmness (Brummell and Harpster, 2001;
Hyodo et al., 2013). The polygalacturonase β-subunit binds polygalacturonase PG2 to modify patterns
of pectin metabolism. Suppression of the polygalacturonase β-subunit therefore results in higher
amounts of polygalacturonide formation and increased softening during ripening phases. During normal
ripening, this polygalacturonase β-subunit is believed to suppress PG2 activity and pectin solubilisation
in the middle lamella, which leads to increased cell adhesion (Brummell and Harpster, 2001). Spatial
and temporal differences in pectin modification, degradation activity, and calcium localisation combine
to endow each tissue with different physical traits throughout development.

44
2.4.4 Berry physical changes
Grenache is a late ripening variety that is capable of attaining very high sugar levels during extended
on-vine maturation. The ability of Grenache to ripen slowly over long periods may be primarily
attributable to its skin traits, compared to Thompson Seedless where maintenance of mesocarp vitality
(Fuentes et al., 2010), membrane viability and high apoplastic calcium may play a role. The relatively
thick skins of Grenache, as observed by microscopy (Figure 2.1B) and measured using the Instron
(Figure 2.3E), as well as the high skin hardness (or skin break energy; Figure 2.3C), may contribute to
reduced water loss, even in the case of hydraulic isolation from the vine. Grenache has previously been
identified as a variety with high resistance to splitting due to the physical properties and skin thickness
of the berries (Giacosa et al., 2013). Another survey correlated higher skin break force of fresh berries
with slower berry dehydration rates off-vine (Giacosa et al., 2012). The table grape Thompson Seedless
may be an exception to this since it has low skin hardness (Figure 2.3C) and a relatively thin single
epidermal layer skin (Figure 2.1D, I) but good storage qualities. The low shrivel susceptibility of this
variety is reflected in the low elasticity (i.e. high firmness) measurements of berry and skin (Figure 2.3B,
D). The ability of Thompson Seedless to maintain cell vitality (Fuentes et al., 2010), membrane integrity,
hydraulic conductance into the berry (Tilbrook and Tyerman, 2009), low apoplastic pH, and high
apoplastic calcium, is likely to be a major contributing factor to the berry hardness (or firmness)
observed even during extended vine maturation.
2.4.5 Berry apoplast interactions
During grape development, the pH of berry pulp juice (composed of mainly vacuolar fluids) increases
from ~2.5 at green berry stage, to ~3.5 at harvest maturity, to ~4.0 when overripe. Berry apoplast pH is
typically higher (~4.5-5 during development), indicating a separation of compartments and regulation of
proton gradients between the apoplast, cytosol, and vacuole (Wada et al., 2008; Keller and Shrestha,
2014). In wine grapes maintenance of the proton gradient is seen to break down during late ripening as
pH values for apoplast extracts approach that of pulp juice (Wada et al., 2008; Keller and Shrestha,
2014). During berry development, active control of apoplast pH is primarily through plasma membrane
H+-ATPase activity. Auxin activated calcium transients are believed to promote this transport activity;
with the resulting decrease in apoplastic pH activating cell wall loosening and modifying enzymes
(Wang and Ruan, 2013). During late ripening or pathogen infection, extensive disassembly of the cell
wall may lead to destabilisation of the plasma membrane and/or loss of cell vitality. A more detailed
time course to pinpoint the drop in apoplastic pH and the onset of membrane porosity increases or cell
vitality loss would determine if this is the case.
45
Chenin Blanc at both sites demonstrated higher [Ca2+]apo and apoplast Ca2+ activity than the red
varieties Shiraz and Grenache (Figure 2.4 A, C). Chenin Blanc had mesocarp calcium concentration
that was lower than other varieties, indicating that the observed high apoplastic calcium may have been
a result of increased cell wall degradation and/or increased allocation of berry calcium into the apoplast
rather than higher overall berry calcium uptake (Table 2.1). Previously, knockout of Arabidopsis
vacuolar calcium transporters CAX1 and CAX3 has been shown to result in higher apoplastic calcium
(Conn et al., 2011). Reduced expression of vacuolar calcium transporters in Chenin Blanc may explain
the observed pattern of calcium distribution. Some Botrytis infection was observed in Chenin Blanc
Waite samples. Breakdown of cell wall components and membrane leakage caused by fungal enzymes
may help to account for the high level of apoplastic calcium and low ratio of [K]mesocarp: [K]apo observed
in these samples (Table 2.2). Further investigation would be required to confirm whether this was a
Botrytis effect or simply that the Waite Chenin Blanc samples had a different pattern of potassium and
calcium allocation compared to the other samples. Botrytis susceptibility testing of Shiraz and Chenin
Blanc berries was carried out to probe the effect of different levels of calcium nutrition on cell wall
composition (Chapter 5). It has been previously established that differences in endogenous cell wall
disassembly can affect Botrytis susceptibility in grapes (Cantu et al., 2008), and that varieties differ in
activity levels of a variety of cell wall enzymes, translating to dynamic changes in cell wall composition
throughout development (Nunan et al., 2001; Ortega-Regules et al., 2008; Zoccatelli et al., 2013).
Thompson Seedless also exhibited high [Ca]apo and Ca2+ activity, although it also had a high [K]mesocarp:
[K]apo and a low apoplastic pH. These relationships were further probed using principal component
analysis.
The pH of the apoplast fluid is normally lower than that of bulk fluids obtained from fruit (composed of
predominantly vacuolar fluid) (Ruan et al., 1996; Almeida and Huber, 1999; Wada et al., 2006). It has
been observed in tomato that apoplastic pH decreases during ripening, approaching that of the bulk
pericarp and locule tissue extract (Almeida and Huber, 1999). As the fruit ripens the compartmentation
between apoplast and symplast begins to break down; this may be due to changes in membrane
permeability (Lang and During, 1991; Almeida and Huber, 1999). Whether this drop is a trigger for the
breakdown of compartmentation or a result of it remains unclear. The decrease in apoplast pH in
tomato occurs simultaneously with the cessation of xylem calcium import and increasing PME activity in
the apoplast; low pH in the apoplast would also serve to increase competition between free Ca2+ and H+
ions for binding of de-esterified pectin. These factors may result in a negative correlation between
apoplast pH and available Ca2+ in the apoplast. This relationship becomes apparent in grapes when
PCA analysis is performed on the present data; apoplastic pH and apoplastic Ca2+ activity are strongly
46
negatively correlated, as shown in Figure 2.5A. Regression analysis of apoplastic pH and apoplastic
Ca2+ activity data from all varieties across both sites confirmed this negative correlation (data not
shown).
Whilst the impacts of unaccounted for and potentially confounding variables between the two sites may
reduce the possibility of drawing strong conclusions about site-specific effects, some interesting
observations were made. Shiraz was the only variety to show any significant difference between sites in
apoplastic pH and apoplastic Ca2+ activity (Table 2.2). Barossa Shiraz had the lowest apoplastic pH
and the highest apoplastic Ca2+ activity measured. Both Waite and Barossa Shiraz had higher
mesocarp calcium concentrations than Grenache and Chenin Blanc from the same site. The high
calcium conditions at the Barossa site may have exceeded the capacity for Shiraz to redistribute xylem-
derived calcium from the apoplast to the vacuole or to bind calcium in the cell wall, resulting in much
higher levels of free Ca2+ in the apoplast compared to Waite Shiraz. Potentially, Shiraz exhibits cell
walls with a low cation exchange capacity; under high calcium conditions, high levels of calcium
accumulate in the vacuole through the action of Ca2+-H+ exchangers and H+-ATPase activated calcium
channels in the PM and the tonoplast. This may result in accumulation of H+ occurs in the apoplast,
acidifying the cell wall, and increasing binding competition with pectin bound Ca2+ and further
increasing free Ca2+ levels. Conversely, the relatively low apoplastic pH may indicate that plasma
membrane and tonoplast breakdown is already occurring, and that collected apoplastic fluids are
contaminated with vacuolar calcium.
2.5 Conclusion
Clear differences in skin cell morphology between red, white and table grape varieties were revealed by
light microscopy. Varieties with high skin break energy (e.g. Grenache) generally have higher [Ca]skin
than varieties with weaker skin (e.g. Thompson Seedless). Thompson Seedless exhibits the hardest
grapes, highest [Ca]mesocarp and highest [Ca]apo, probably related to maintenance of hydraulic
conductivity and cell vitality (Tilbrook and Tyerman, 2009; Fuentes et al., 2010). In samples where
some Botrytis infection was observed, [Ca]apo was difficult to estimate accurately, possibly due to cell
wall degradation and loss of cell vitality. These results demonstrate that differences between grape
varieties in Ca2+ uptake, cell wall composition, pectin modification, membrane porosity and/or cell
vitality can be linked to physical and qualitative traits (Rogiers et al., 2006a; Tilbrook and Tyerman,
2009; Fuentes et al., 2010). Interesting differences between sites indicate that some varieties do

47
respond differently to calcium nutrition; however a more controlled system is required to test these
impacts. Further studies to ascertain the effects of different levels of calcium nutrition on bunch quality
and cell wall properties including pectin modification are required to understand these relationships.

48
Chapter 3 Grapevine calcium nutrition
3.1 Introduction
The effect of varying grapevine calcium nutrition on vine function has not been previously explored. By
designing a system in which calcium availability is manipulated, whilst minimising potential confounding
changes in availability of other nutrients, the impact of differing calcium supply on the vine was
investigated. By studying the effects of calcium upon grapevine growth and berry development, it
becomes possible to identify the physiological and developmental signs indicating that calcium nutrition
may be sub-optimal. This may provide opportunities for ameliorative steps to improve fruit quality. In
this chapter, the design and optimisation of a hydroponics system for probing vine calcium relations
using a modified fruiting cutting method will be described. The effects of high and low calcium supply
were investigated using this system. Changes in petiole nutrient profiles, vine phenology, root and
shoot function, reproductive performance, and berry development were all assessed. Shiraz was
studied as it is highly susceptible to berry shrivel; Chenin Blanc was also studied as it has a very low
susceptibility to berry shrivel. New data is presented here of the petiole nutrient accumulation of Chenin
Blanc under different calcium regimes.
3.2 Materials and Methods
3.2.1 Fruiting cuttings; Mullins method modifications
Cuttings were collected from Waite Campus Vineyard (Shiraz) and Barossa Valley Vineyard (Chenin
Blanc). Cuttings were 40-70 cm length and contained 4-7 nodes. An angled cut was made at the distal
end to indicate orientation. Cuttings were stored in sealed plastic bags in a dark cool room (4 °C) for up
to 12 months.
Fruiting cuttings were produced according to a modified version of the Mullins protocol (Mullins and
Rajasekaran, 1981). The modifications to this method were published in Baby et al. (2014); Appendix
3). Briefly, when planting stored cuttings, a fresh cut was made 2-3 cm from the proximal end, and the
fresh cut end was dipped in Clonex Green Hormone Gel for softwood cuttings (Growth Technology Ltd.,
Devon, England) to a depth of ~5 cm, including the first node. These cuttings were planted to a depth of
10-15 cm in a heated sand bed located in a dark cool room (4 °C). Heat bed temperature at cutting end
depth was maintained at 25-28 °C. Heat beds were watered twice a week to maintain moisture content
in the sand. Callus and root development in the heat beds continued for 6-8 weeks. This enabled
49
extensive root development and rapid establishment of bud burst and aerial development when
transferred to glasshouses or growth rooms. Rooted cuttings were transferred into pots and filled with
perlite.
3.2.2 Hydroponics system design
Full details of modifications to Mullins method with specific reference to the use of 100% perlite media
and automated hydroponics system design are detailed in Appendix 3.
3.2.2.1 Perlite growth media
In order to tightly control the nutrient inputs in the hydroponic system, use of 100% perlite media was
pursued as an alternative to 50:50 perlite:vermiculite mix. When subjected to a mildly acidic growth
solution (i.e. pH 5.6), perlite:vermiculite media releases additional Na, Mg, and Mn through cation
exchange (Baby et al., 2014). By comparison, 100% perlite is relatively inert when used as the growth
media (Baby et al., 2014).
3.2.2.2 Nutrient solution design
Hydroponic solutions were based on a modified ¼ strength Hoagland’s mix used for hydroponic growth
of Arabidopsis (Conn et al., 2013). A variety of solutions were designed with the aim of adjusting
available calcium whilst keeping other ion availabilities within the solution relatively constant (and within
the recommended ranges for grapevine nutrition). This was achieved using Visual MINTEQ software
(KTH Royal Institute of Technology, Stockholm, Sweden), that uses an equilibrium speciation model.
Solutions designed were; Low Calcium Solution (LCS), Basal Nutrient Solution (BNS), High Calcium
Solution (HCS). See Appendix 4 for solution compositions.
3.2.2.3 Hydroponics growth issues
The timer circuits used allowed for 15 minute watering intervals on a 24 hour cycle. Concerns about the
lower water holding capacity of perlite (compared to a perlite/vermiculite mix) led to a more intensive
watering schedule being trialled initially. Cuttings were watered for 15 minutes every hour. Although this
watering schedule did not appear to affect the growth of Shiraz, Chenin Blanc, and Thompson
Seedless; Grenache suffered from root rot and epinasty. Grenache is colloquially known as a variety
that does not like to have “wet feet”; this trait was evident in this system. Grenache demonstrated
reduced leaf and bunch turgor and reduced leaf angle over the growing period, eventually drying out
and senescing. Upon inspection, the root systems of affected Grenache vines were brown and

50
decaying. Excess watering had caused root rot, with aerial symptoms being a result of reduced
capacity for water uptake. Watering schedules were adjusted to eliminate this problem. It was observed
that one 15 minute watering interval a day was sufficient to saturate the media for an established root
system, and sufficient moisture was still available for no obvious signs of water stress to be present
after 24 hours. Whilst Thompson Seedless vines appeared to grow healthily in this system, many
bunches failed to set fruit and shrivelled after flowering. The use of gibberellic acid (GA) to encourage
fruitset and increase berry size in Thompson Seedless is a common commercial practice; the unreliable
fruitset of this variety make it unsuitable for these trials. If further work was to be carried out on
Thompson Seedless fruit in hydroponics, the use of GA sprays would need to be investigated.
3.2.3 Biomechanical testing
Harpenden Skinfold calipers HSK-B1 (British Indicators, West Sussex, UK) were used to measure berry
deformability, and subsequently calculate berry Young’s Modulus. A single spring set applying a 110 g
load (i.e. 1.078 N) was used. Due to the lack of stress/strain resolution using this method relative to
Instron methods, Young’s Modulus calculations assumed that during caliper compression the
stress/strain curve was linear in its entirety.
3.2.4 Leaf water potential
A Scholander pressure chamber was used to measure midday leaf water potential. Measurements
were taken between 11:00 am and 2:00 pm. Mature and undamaged leaves were cut from the vine with
a fresh razor blade. The cut petiole was tightly secured protruding through the lid seal of the pressure
chamber. Pressure from a CO2 cylinder was applied and a pressure measurement taken upon visual
observation of sap appearing on the surface of the cut petiole. Two leaves were measured per vine.
3.2.5 Gas exchange measurements
Leaf gas exchange measurements were carried out using an ADC LCpro-SD Infra-red gas analyser
(IRGA) fitted with a small leaf chamber (ADC Bioscientific Limited, Hertfordshire, England). Light
intensity (as photosynthetically active radiation, Qset) was set at 1000 µmol m-2 s-1. CO2 was set at 400
ppm with a CO2 cartridge inserted. Air supply unit flow rate was set at 200 µmol s-1. Fully mature,
undamaged, unshaded leaves were selected; the leaf chamber was clamped halfway along the leaf
adjacent to the mid vein. Three leaves per vine were measured. After attaching to the leaf, sufficient
time was allowed for the chamber conditions to stabilise (usually 2-4 minutes) prior to taking
measurements. This was determined by plotting transpiration rate (E) against time on the IRGA display;

51
after four subsequent stable intervals (with the display updating at 15 second intervals) were observed,
the measurement was taken.
3.2.6 Root hydraulic conductance
Root hydraulic conductance measurements were taken on the root system of decapitated plants with a
hydraulic conductance flow meter (HCFM) (Dynamax, Houston, TX, USA) as detailed in Vandeleur et
al. (2009) and Vandeleur et al. (2014). Briefly, the transient method was used whereby pressure was
ramped and flow into the root system was recorded simultaneously. The protocol was performed as
rapidly as possible to minimise the reduction in conductance that occurs after decapitation of the shoot
system (Vandeleur et al., 2014). The linear region of flow versus pressure was used to calculate
hydraulic conductance. Three consecutive measurements were taken and the average conductance
obtained per root sample. Hydraulic conductance was then normalized by dividing the conductance by
the total root dry weight. The soil was washed from the roots before drying at 60°C for 48 hours.
3.2.7 ICP-AES analysis
Leaf petioles of Chenin Blanc were dried at 70°C for 48 hours. Dried petioles were then ground in an
ESSA LM1-P pulverising mill (FLSmidth, Welshpool, Western Australia). Ground samples were
analysed using ICP-AES by Waite Analytical Services (Urrbrae, South Australia). Elemental
concentrations in dry petiole samples are expressed as % dry weight.
3.2.8 Bunch reproductive measures
Fruitset, Coulure Index and Millerandage Index of Shiraz were calculated as previously described in Dry
et al. (2010), formulas used for the calculations are reproduced below:
Fruitset (%) = (total berry number per bunch / number of flowers per inflorescence) X 100
Coulure Index = 10 – [(no. of seeded berries per bunch + no. of seedless berries per bunch + no. of
LGOs* per bunch) X 10 / no. of flowers per inflorescence]
Millerandage Index = 10 – [(no. of seeded berries per bunch X 10) / (no. of seeded berries per bunch +
no. of seedless berries per bunch + no. of LGOs per bunch)]
*LGO = live green ovary

52
Briefly, developing bunches were enclosed in mesh bags prior to flowering. After completion of
flowering, the bags were removed and flower caps counted. At harvest, berries were divided into berry
classes and counted. The following classes were used; live green ovary (stunted growth, no seeds, less
than 4 mm diameter), seedless berry (no seeds, greater than 4 mm diameter), green berry (contains 1
or more seeds, no red colouration), veraison berry (contains 1 or more seeds, 0 - 75 % berry red
colouration), ripe berry (contains 1 or more seeds, 75-100 % berry red colouration, no visible shrivel),
shrivelled berry (contains 1 or more seeds, 100 % berry red colouration, visible signs of berry shrivel).
3.3 Results
3.3.1 Effect of calcium treatments upon calcium uptake
Vine mineral nutrient composition of Chenin Blanc vines grown hydroponically in Basal Nutrient
Solution (BNS), High Calcium Solution (HCS), and Low Calcium Solution (LCS) was characterised by
ICP-AES analysis of petioles at harvest. The results showed that these treatments pushed calcium
levels outside of the normal range. As calcium nutrition is poorly understood in grapevines, calcium
levels required for deficiency or toxicity were previously undefined. Table 3.1 demonstrates the full suite
of plant mineral nutrients analysed relative to previously published recommended ranges in petioles at
anthesis (Robinson et al., 1997) and petiole measurements at harvest (Smith et al., 2014).
Calcium nutritional requirements of vines are not particularly well documented, with a speculated
adequate range at flowering of 1.2-2.5 % dry weight (DW) (Robinson et al., 1997), and a measured
mean concentration in Chardonnay increasing from 1.35 % DW at flowering to 2.9 % DW at harvest
(Smith et al., 2014). Mean calcium levels observed in these treatments at harvest were as follows; 0.75
% DW in LCS, 3.2 % DW in BNS, and 3.55 % DW in HCS (Figure 3.9A). Whilst the BNS and HCS
levels are above the “adequate” levels at flowering, they are not much higher than that measured in
Chardonnay at harvest, in line with normal increases in leaf petiole calcium concentration over the
course of the growing season. However, the LCS levels measured at harvest are much lower than the
adequate levels suggested at flowering, indicating that these vines were operating under a calcium
deficit throughout the growing season, with minimal calcium being stored in leaf petioles.
Phosphorus is considered adequate in the range 0.25-0.5 % DW. Phosphorus has been shown to
decrease over the growing season in Chardonnay from 0.7 % DW at flowering to 0.2 % DW at harvest.
53
LCS demonstrated adequate mean phosphorous levels at 0.47 % DW, whereas BNS and HCS mean
phosphate levels were high at 0.76 % DW and 1.37 % DW, respectively.
The adequate range for potassium is 1.8-3.0 % DW at flowering. The concentration in Chardonnay at
harvest was 2.3 % DW. The lack of significant differences between treatment means and the closeness
to recommended range (LCS 2.77, BNS 3.15, HCS 2.75 % DW) suggests that potassium levels are
sufficient and well-regulated in this experiment.
Sodium is considered toxic at >5000ppm (i.e. >0.5 % DW). Mean sodium levels in LCS, BNS, and HCS
petioles at harvest were 0.91, 0.62, and 0.25 % DW, respectively. The high levels of sodium in LCS and
BNS may be a concern for growth, or may be indicative of other factors at play; high soil calcium can
reduce sodium uptake, low soil calcium may result in poor root membrane selectivity and high sodium
accumulation. Excess sodium may be loaded into leaves prior to abscission for removal from the plant.
In the LCS treatment, the low availability of calcium in the nutrient solution may have resulted in
increased root uptake of sodium as a surrogate divalent cation for maintenance of osmotic equilibrium.
A similar relationship may be responsible for the higher magnesium levels observed in LCS.
Magnesium is considered adequate above 0.4 % DW. All samples exceeded this lower limit.
Two other ions will also be considered. Manganese is considered adequate in the range of 30-60ppm
(i.e. 0.003-0.006 % DW), and toxic at >500ppm (i.e. >0.05 % DW). All treatments exceeded the target
range; however none reached ‘toxic’ levels. Boron is considered adequate at 35-70ppm (i.e. 0.0035-
0.007 % DW), and toxic at >100ppm (i.e. >0.01 % DW). All treatments boron levels fell within the range
0.002-0.0026 % DW, which puts them borderline deficit/marginal, but similar across treatments.
Unfortunately, Shiraz petioles were not collected in this experiment. Chenin Blanc is therefore used as
a representative variety in this respect. Analysis of Shiraz petioles would have provided a further insight
into the calcium responses of this variety and possibly mitigated concerns about chloride levels in the
high calcium treated vines.

54
Tab
le 3
.1. M
iner
al n
utrie
nt c
ompo
sitio
n of
Che
nin
Bla
nc p
etio
les
at h
arve
st m
atur
ity. P
etio
le a
naly
sis
was
car
ried
out b
y IC
P-A
ES
on
bulk
ed s
ampl
es o
f 6 p
etio
les
per
vine
, exp
ress
ed a
s m
g/kg
on
a dr
y w
eigh
t bas
is. C
hard
onna
y m
ean
petio
le n
utrie
nt c
ompo
sitio
n at
har
vest
ada
pted
from
Sm
ith e
t al.
(201
4). R
ange
of p
etio
le m
iner
al n
utrie
nt
com
posi
tions
for
petio
les
at fl
ower
ing
adap
ted
from
Rob
inso
n et
al.
(199
7). M
ean
and
SD
from
n =
4 r
eplic
ate
vine
s. *
indi
cate
s si
gnifi
cant
diff
eren
ce fr
om B
NS
con
trol
usi
ng o
ne w
ay a
naly
sis
of v
aria
nce
and
a D
unne
tt’s
mul
tiple
com
paris
on p
osth
oc te
st a
t 95
% C
I (P
<0.
05
C
hen
in B
lan
c p
eti
ole
ICP
at
har
vest
C
har
do
nn
ay a
t h
arve
st.
Smit
h e
t al
. (2
01
4)
Gen
eral
pe
tio
le n
utr
ien
t co
mp
osi
tio
n r
ange
at
flo
wer
ing.
R
ob
inso
n e
t al
. (1
99
7)
Low
cal
ciu
m
solu
tio
n
Bas
al n
utr
ien
t so
luti
on
H
igh
cal
ciu
m
solu
tio
n
Def
icie
nt
Mar
gin
al
Ad
equ
ate
Hig
h
Toxi
c
Mea
n
SD
Mea
n
SD
Mea
n
SD
Mea
n
% D
W
P
0.4
7
0.0
4
0.7
6
0.1
2
1.3
7*
0.2
8
~0.2
7 <0
.2
0.2
-0.2
4 0
.25
-0.5
0 >0
.50
-
K
2.7
7 0
.64
3.1
5 0
.71
2.7
5 0
.42
~2.4
9 <1
.0
1.0
-1.7
1
.8-3
.0
-
Mg
2.1
1*
0.2
4 0
.79
0.0
7 0
.58
0.1
4 ~1
.23
<0.3
0
.3-0
.39
>0.4
-
Ca
0.7
5*
0.0
9 3
.20
0.2
9 3
.55
0.5
6 ~3
.0
- -
1.2
-2.5
-
Cl
1.2
2*
0.0
5 1
.77
0.2
2 2
.55
* 0
.31
- -
- -
- -
mg/
kg
Fe
53
.2
13
.6
41
.5
7.8
5 4
6.0
1
4.4
~4
8
- -
>30
-
Mn
4
20
62
.7
36
5 4
6.5
1
00
* 2
2.6
~3
85
<2
0
20
-29
30
-60
- >5
00
B
23
.0
1.8
3 2
6.0
2
.83
20
.2*
0.5
0 ~6
7
<25
2
6-3
4 3
5-7
0 7
1-1
00
Zn
50
.5
10
.8
85
.0
30
.8
54
.0
10
.5
~10
0
<15
1
6-2
5 >2
6
- -
Na
91
25
* 2
46
0 6
22
5 6
29
25
45
* 6
32
~28
60
- -
- -
>50
00

55
3.3.2 Shiraz berry development responses to modified calcium nutrition
Vines grown under high calcium conditions showed a range of differences in growth and vine
performance. Two-way analysis of variance with Tukey’s multiple comparison test was used to test the
significance of differences observed between time points and treatments; the following results summary
states the key differences observed at a significance level of P < 0.05. HCS berry weights were lower
than BNS from veraison to harvest; at 108 DAA, berry weight loss and shrivel in LCS berries resulted in
berry weights that were not significantly different to HCS berry weights (Figure 3.1A). Onset of berry
weight loss occurred earlier in LCS than in BNS, with an average weight loss between 93 DAA and 108
DAA in LCS of 24%. During the same period, BNS exhibited an average weight gain of 9%. The berry
weight loss and shrivel observed in LCS was so severe that at the last time point (123 DAA) it was not
possible to collect sufficient juice for total soluble solids (TSS) and osmolality measurements. Berry
weight change in HCS bunches was difficult to characterise; the erratic profile of berry weight gain
observed in Figure 3.1A was the result of asynchronous ripening. Some HCS berries ripened rapidly
between 78 and 93 DAA and shrivelled in subsequent stages, whilst other berries were still undergoing
veraison and ripening.
Accumulation of TSS was delayed in HCS bunches, onset of veraison occurred approximately 4 weeks
after BNS and LCS grown vines (Figure 3.1B). Between 78 and 93 DAA HCS berries showed a rapid
accumulation of sugars as they progressed quickly through veraison. The TSS in LCS are seen to
increase rapidly from 93 DAA to 108 DAA due to berry shrivel and water loss causing concentration of
sugars. At 123 DAA HCS berries show large standard deviation for TSS and osmolality due to the
asynchronicity of ripening observed; high calcium bunches contained berries at all stages of
development, including green, veraison, ripe, and shrivelled. The osmolality of berries showed the
same trends between treatments as TSS, indicating that the high and low calcium treatments were not
a major influence on the osmolality of the berries with sugar accumulation dominating (Figure 3.1C).
Calculation of sugar content per berry revealed that sugar uptake ceased in LCS berries between 93
and 108 DAA and in BNS berries between 108 to 123 DAA, whilst still increasing in HCS berries from
108 to 123 DAA (Figure 3.1D).
56
Figure 3.1. Berry development parameters of Shiraz grown under different calcium regimes. High
(HCS), basal (BNS), and low (LCS) calcium grown berry weight (A), total soluble sugars (B), osmolality
(C), and berry sugar content (D). Mean ± SD. N = 14-30 individual berries per sample date per
treatment.
Differences were also observed between treatments in the time taken to reach developmental time
points such as anthesis and veraison. The distribution of anthesis and veraison dates was studied
using the date of the first vine to reach that particular stage as a zero point. Anthesis was measured at
50% cap fall or 50% visibly swollen ovaries (whichever came first). No significant differences in anthesis
dates were found between Shiraz treatments in two consecutive years (Figure 3.2A). In both years,
high calcium treated vines demonstrated later veraison occurrence (measured at 50% of berries
coloured per bunch) than BNS vines (Figure 3.2B). In 2013, HCS treated vines had bunches that
showed much greater variation both within bunches and between vines (i.e. lower synchronicity) in
veraison timing than other treatments. Although the later veraison period for HCS treated vines may
suggest a simple delay in berry development, it would be more accurate to say that veraison in HCS
vines was both delayed and asynchronous, with some berries ripening on a similar timeframe as control
berries and others up to a month later. In 2014, LCS vines had earlier onset of veraison than BNS
D A A
Be
rry
we
igh
t (g
)
4 9 6 4 7 8 9 3 1 0 8 1 2 3
0 .0
0 .5
1 .0
1 .5
2 .0
2 .5L C S
B N S
H C S
D A A
TS
S (
°B
rix
)
4 9 6 4 7 8 9 3 1 0 8 1 2 3
0
1 0
2 0
3 0
D A A
Os
mo
lali
ty (
mm
ol/
Kg
)
4 9 6 4 7 8 9 3 1 0 8 1 2 3
0
5 0 0
1 0 0 0
1 5 0 0
2 0 0 0
2 5 0 0
A B
C
D A A
Su
ga
r c
on
ten
t (g
/be
rry
)
4 9 6 4 7 8 9 3 1 0 8 1 2 3
0 .0
0 .2
0 .4
0 .6
D

57
vines. Due to the similarities observed in date of anthesis occurrence, the gap between individual
bunch anthesis and veraison dates (Figure 3.2C) reflects similar trends to veraison date (Figure 3.2B).
Figure 3.2. Distribution of anthesis and veraison occurrence in Shiraz bunches grown under different
calcium regimes in two consecutive years (2013 and 2014). Anthesis date distribution (as days from the
date of first observation) (A). Veraison date distribution (as days from the date of first observation) (B).
Anthesis to veraison period calculated as difference in days between observations of these two
developmental points (C). Whiskers indicate data minimum and maximum. * indicates significant
difference of treatment mean from BNS mean (P<0.05) using two way analysis of variance with
Dunnett's posthoc test. n = 12-40 individual vines per treatment per year.
An
the
sis
da
te d
istr
ibu
tio
n
(da
ys
fro
m f
irs
t o
bs
erv
ati
on
)
S h ira z 2 0 1 3 S h ira z 2 0 1 4
0
5
1 0
1 5
2 0
B N S
H C S
L C S
An
the
sis
to
ve
ra
iso
n
pe
rio
d (
da
ys
)
S h ira z 2 0 1 3 S h ira z 2 0 1 4
4 0
6 0
8 0
1 0 0
1 2 0
*B N S
H C S
L C S*
*
A
B
C
Ve
ra
iso
n d
ate
dis
trib
uti
on
(da
ys
fro
m f
irs
t o
bs
erv
ati
on
)
S h ira z 2 0 1 3 S h ira z 2 0 1 4
0
1 0
2 0
3 0
4 0
5 0
*
B N S
H C S
L C S
*
*

58
The treatment effects upon berry ripening were visible in Shiraz bunches; early onset of shrivel in LCS
bunches, and asynchronous and delayed ripening in HCS bunches (Figure 3.3C and 4.3D), relative to
BNS grown bunches (Figure 3.3B) was observed.
Measurements of reproductive performance were taken on whole bunches harvested at the first signs
of shrivel occurring (corresponding to 113 DAA on average). Bunch weights of HCS vines were
significantly lower than BNS or LCS (Figure 3.4A). Flower cap counts were not significantly different
between treatments (Figure 3.4B). Similarly, no significant differences were found between treatments
for number of seeds per berry (Figure 3.4C). Fruitset was lower in HCS vines (Figure 3.4D). Large
variation was observed in Millerandage (Figure 3.4E) and Coulure (Figure 3.4F) indices, however no
significant differences between treatments were observed in these measures. Similar changes in bunch
development and composition were observed in Chenin Blanc, however no measurements were taken.
Figure 3.3. Calcium treatment effect upon ripening of Shiraz bunches. Low calcium treatment (A), basal
nutrient solution (B), and high calcium treatment (C) at 93 days after anthesis. Diversity of berry classes
harvested from a single high calcium grown bunch (D).

59
Figure 3.4. Bunch reproductive indexes of Shiraz grown under different calcium regimes. Bunch weight
(A), flower cap count per bunch (B), seed count per berry (C), Fruitset % (D), Millerandage Index (E),
Coulure Index (F). Mean ± SD. * indicates significant difference using one way analysis of variance with
Dunnett's posthoc test (P<0.05), except 4.3D which used a Fischer LSD posthoc test on Log
transformed data. n = 7-9 individual bunches per treatment.
The consistency of berry ripeness within bunches at harvest varied between treatments. This was
quantified by counting the prevalence of designated berry classes within harvested bunches. It is
interesting to note that, although not statistically significant, both LCS and HCS had slightly higher
flower cap counts than BNS (Figure 3.4B), and that these treatments also exhibited higher rates of
flower abortion (Figure 3.5A). The distribution of different berry classes are represented as; berry class
Bu
nc
h w
eig
ht
(g)
L C S B N S H C S
0
1 0 0
2 0 0
3 0 0
* B N S
H C S
L C S
Co
ulu
re
In
de
x
L C S B N S H C S
0
2
4
6
8
1 0
Mil
lera
nd
ag
e I
nd
ex
L C S B N S H C S
0
1
2
3
4
Flo
we
r c
ap
co
un
t
L C S B N S H C S
0
2 0 0
4 0 0
6 0 0
8 0 0
A B
C D
E F
No
. s
ee
ds
/be
rry
L C S B N S H C S
0
1
2
3
Lo
g1
0(F
ru
its
et
%)
L C S B N S H C S
0 .0
0 .5
1 .0
1 .5
2 .0
*

60
count per bunch (Figure 3.5B), and berry class incidence as a % of total berry count (Figure 3.5C). In
terms of total berry numbers per bunch, HCS had the lowest, and LNS had the highest (Figure 3.5B).
All treatments showed 15-25 % of berries as live green ovaries (Figure 3.5C). The majority of berries
(>70 % of total berry count) on LCS bunches were shrivelled (Figure 3.5C). The predominant berry
class in BNS (also >70 % of total berry count) was (i.e. berries which were fully coloured but did not
show signs of shrivel). Interestingly, HCS bunches showed higher rates of berry shrivel than BNS, as
well as higher rates of green and veraison berry incidence (Figure 3.5C).
61
Figure 3.5. Flower and berry development of Shiraz grown under different calcium regimes and
harvested at 114 DAA. Flower fate; incidence of mature berries (ripe/shrivelled), stunted berries
(LGO/seedless/green/veraison), and aborted flowers calculated as % of total flowers per bunch at time
of harvest (A). Incidence of individual berry classes, presented as berry numbers per bunch (B) and
berry class incidence as % of total berry count (C).
62
3.3.3 Berry class diversity
A number of measures were taken on individual berries from Shiraz bunches divided by berry class.
Mean berry weight was measured in each berry class; due to the classing system, it was unsurprising
that the mean berry weight of shrivelled LCS and HCS berry classes were lower than that of their
respective ripe berry classes (Figure 3.6A). TSS levels increased according to berry class (Figure
3.6B). LCS berries at veraison, ripe, and shrivelled stages showed higher berry deformability than BNS
and HCS berries at the same stage (Figure 3.6C). Berry Young’s Modulus was generally lower (i.e.
more elastic) in the more mature berry classes; LCS berries were more elastic at all maturity levels
(Figure 3.6D). Seed counts per berry showed no discernible differences between treatments or berry
maturity class (Figure 3.6E).
63
Figure 3.6. Measures of berry variability within Shiraz bunches grown in high, basal and low calcium
conditions and harvested at 114 DAA, divided by berry class. Berry weight (A), total solubles sugars
(°Brix) (B), berry deformability (C), berry elasticity (skin fold caliper calculations; D), seeds per berry
(E). Mean ± SD. Replicate numbers vary due to scarcity/prevalence of some berry classes in some
treatments.
3.3.4 Vine physiology
HCS treated Shiraz and Chenin Blanc vines had lower transpiration rate (E), net assimilation rate (A),
stomatal conductance (Gs), and sub-stomatal CO2 (Ci) than BNS vines (Figure 3.7A-D). LCS grown
Chenin Blanc vines had higher A and Gs than BNS vines (Figure 3.7B, C). Midday leaf water potential
Be
rry
we
igh
t (g
)
G re e n V e ra is o n R ip e S h r iv e lle d
0
1
2
3
B N S
H C S
L C S
TS
S (
°B
rix
)
G re e n V e ra is o n R ip e S h r iv e lle d
0
1 0
2 0
3 0
4 0
5 0
Be
rry
de
form
ati
on
(% d
iam
ete
r)
G re e n V e ra is o n R ip e S h r iv e lle d
0
1 0
2 0
3 0
4 0
5 0
Be
rry
Yo
un
g's
mo
du
lus
(N
mm
-1)
G re e n V e ra is o n R ip e S h r iv e lle d
0 .0 1
0 .1
1
1 0
Se
ed
s p
er b
erry
G re e n V e ra is o n R ip e S h r iv e lle d
0
1
2
3
A B
C D
E

64
of HCS vines was more negative than BNS in both varieties (Figure 3.7E). No significant differences
between treatments were identified in root hydraulic conductance (Figure 3.7F).
Figure 3.7. Whole vine physiology measures of Shiraz grown in high and basal calcium conditions and
Chenin Blanc grown in high, basal and low calcium conditions. Infra-red gas analyser used to measure
transpiration rate (A), net assimilation rate (B), stomatal conductance (C), sub-stomatal CO2 (D).
Pressure bomb measurements of leaf water potential (E). HCFM measurements of root hydraulic
conductance (F). Mean ± SD. * indicates significant difference from BNS (P<0.05) using unpaired t-test
(Shiraz), and one way analysis of variance with Dunnett's posthoc test (Chenin Blanc). n = 3 - 4
individual vines per treatment, 4 leaves per vine were selected for IRGA measurements, 2 leaves per
vine were selected for leaf water potential measurements.
Tra
ns
pir
ati
on
ra
te E
(mo
l m
-2 s
-1)
S h ira z C h e n in B la n c
0
1
2
3
4
5
*
*
Ne
t a
ss
imil
ati
on
ra
te A
(
mo
l m
-2 s
-1)
S h ira z C h e n in B la n c
0
5
1 0
1 5
2 0
B N S
L C S
H C S
*
*
*
Sto
ma
tal
co
nd
uc
tan
ce
of
H2
O g
s
(mo
l m
-2 s
-1)
S h ira z C h e n in B la n c
0 .0
0 .1
0 .2
0 .3
0 .4
0 .5
*
*
*
Su
b-s
tom
ata
l C
O2
cI
(vp
m)
S h ira z C h e n in B la n c
0
1 0 0
2 0 0
3 0 0
4 0 0
v p m = v o lu m e s p e r m illio n v o lu m e s o f a ir
**
Le
af
wa
ter p
ote
nti
al
le
af
(MP
a)
S h ira z C h e n in B la n c
-1 .5
-1 .0
-0 .5
0 .0
*
*
Ro
ot
hy
da
uli
c c
on
du
cta
nc
e
(K
25
;g
DW
(K
g s
ec
-1M
pa
-1)
g-1
)
S h ira z C h e n in B la n c
-2 .01 0 -9
0
2 .01 0 -9
4 .01 0 -9
6 .01 0 -9
8 .01 0 -9
n s n s
A B
C D
E F
65
3.3.5 Chenin Blanc nutrient uptake from veraison to late harvest
Chenin Blanc grown in BNS was sampled throughout development to study calcium accumulation
patterns. Berry weight and osmolality steadily increased from veraison at ~55 DAA to 120 DAA,
showing no signs of shrivel or weight loss (Figure 3.8A, B). Berry juice pH started increasing at ~70
DAA to reach ~3.6 at 120 DAA (Figure 3.8C). Total soluble sugars increased from veraison (Figure
3.8D).
Measurement of berry ionic composition using ICP-AES demonstrated differences between phloem-
immobile and phloem-mobile nutrient accumulation. Total berry calcium content was stable from
veraison to late harvest; regression analysis revealed that the slope did not significantly vary from zero
(P=0.654) (Figure 3.8E).The increase in berry weight during this period resulted in decreasing whole
berry calcium concentration (Figure 3.8F). This contrasts to phloem mobile potassium, which was seen
to increase in both total berry content (Figure 3.8G) and concentration (Figure 3.8H) throughout
development. As TSS and ICP-AES data was not collected on the same berries, osmolality was used to
test for a correlation with berry [K+] instead. A positive correlation between berry osmolality and berry
[K+] was observed; regression analysis revealed that the slope significantly varied from zero
(P<0.0001).

66
Figure 3.8. Chenin Blanc berry development from veraison to harvest. Individual berry measurements
of berry weight (A), osmolality (B), pH (C), total soluble sugars (°Brix; D), total berry Ca2+ (E), berry
[Ca2+] (F), total berry K+ (G), berry [K+] (H). Days after anthesis (DAA); anthesis taken as date of 50%
capfall.
4 0 6 0 8 0 1 0 0 1 2 0
0
1
2
3
D A A
Be
rry
we
igh
t (g
)
4 0 6 0 8 0 1 0 0 1 2 0
0
5 0 0
1 0 0 0
1 5 0 0
2 0 0 0
D A A
Os
mo
lali
ty (
mm
ol/
Kg
)
4 0 6 0 8 0 1 0 0 1 2 0
2 .0
2 .5
3 .0
3 .5
4 .0
D A A
pH
4 0 6 0 8 0 1 0 0 1 2 0
0
1 0
2 0
3 0
D A A
TS
S (
°B
rix
)
4 0 6 0 8 0 1 0 0 1 2 0
0 .0
0 .1
0 .2
0 .3
0 .4
0 .5
D A A
To
tal
be
rry
Ca
2+
(m
g)
4 0 6 0 8 0 1 0 0 1 2 0
0
2
4
6
8
D A A
Be
rry
[C
a2
+]
(mM
)
4 0 6 0 8 0 1 0 0 1 2 0
0
2
4
6
8
1 0
D A A
To
tal
be
rry
K+
(m
g)
4 0 6 0 8 0 1 0 0 1 2 0
0
5 0
1 0 0
1 5 0
D A A
Be
rry
[K
+]
(mM
)
A B
C D
E F
G H

67
Petiole ionic composition of hydroponically grown Chenin Blanc was measured at harvest using ICP-
AES. This revealed many differences in petiole nutrient accumulation between treatments. Interestingly,
although calcium levels in the hydroponic solutions were vastly different, only petioles from LCS vines
showed significant difference in calcium concentration from BNS petioles (Figure 3.9A). Phosphate
levels in HCS petioles were significantly higher than BNS (Figure 3.9B). LCS had lower chloride, and
HCS higher chloride than BNS (Figure 3.9C), possible due to differences in chloride concentration in
hydroponics solutions. No significant differences in potassium were observed (Figure 3.9D). LCS had
higher sodium, and HCS lower sodium, than BNS (Figure 3.9E). Petiole magnesium levels in LCS vines
were much higher than in BNS vines (Figure 3.9F). Petioles from HCS vines had lower manganese and
boron than from BNS vines (Figure 3.9G, H).
Basic berry juice parameters and ICP-AES data for Chenin Blanc whole berries, mesocarp, and skin
are detailed in Table 3.2.

68
Figure 3.9. Chenin Blanc petiole ion composition at harvest. Concentration of nutrient ions in dried
petiole samples as determined by ICP-AES analysis. All units are % dry weight; calcium (A),
phosphorus (B), chloride (C), potassium (D), sodium (E), magnesium (F), manganese (G), boron (H). *
indicates significant difference from BNS using one-way ANOVA with Dunnett's multiple comparison
test (P<0.05). n = 4 vines per treatment, ICP-AES carried out bulked samples of 6 petioles per vine.
K
% D
W
L C S B N S H C S
0
1
2
3
4
5
N a
% D
W
L C S B N S H C S
0 .0
0 .5
1 .0
1 .5
*
*
M g
% D
W
L C S B N S H C S
0 .0
0 .5
1 .0
1 .5
2 .0
2 .5 *
M n
% D
W
L C S B N S H C S
0 .0 0
0 .0 2
0 .0 4
0 .0 6
*
B
% D
W
L C S B N S H C S
0 .0 0 0
0 .0 0 1
0 .0 0 2
0 .0 0 3
0 .0 0 4
*
C l
% D
W
L C S B N S H C S
0
1
2
3
4
*
*
A B
C D
E F
G H
C a%
DW
L C S B N S H C S
0
1
2
3
4
5
*
P
% D
W
L C S B N S H C S
0 .0
0 .5
1 .0
1 .5
2 .0
*

69
Low calcium solution Basal nutrient solution High calcium solution
Mean SD Mean SD Mean SD
Berry juice
parameters
Brix 19.58 3.316 19.86 1.964 17.83 1.402
pH 3.705 0.1718 3.602 0.07004 3.106** 0.2951
Ca2+ activity
ISE (mM)
0.1263* 0.02626 0.2985 0.05225 0.797**** 0.1736
Whole grape
ICP-AES
(mg/kg)
B 0.4862 0.1276 0.5302 0.1070 0.2454** 0.01311
Ca 1.110**** 0.08731 4.055 0.8201 10.04**** 0.5533
Mg 7.207** 0.1634 4.486 0.4821 5.608**** 0.2266
Na 1.227 0.4028 1.533 0.9438 0.3164* 0.01979
K 106.8 13.27 92.08 8.088 100.4 3.218
P 11.62 2.190 11.95 0.6457 27.36**** 1.612
S 4.889 0.2473 5.167 1.327 6.165 0.3524
Fe 0.1886 0.02609 0.1757 0.07184 0.1589 0.07644
Mn 0.02369 0.004854 0.02320 0.004911 0.02925 0.001620
Zn 0.01413 0.002013 0.01536 0.002772 0.02054* 0.002043
Mesocarp
tissue ICP-AES
(mg/kg)
B 0.3267 0.04836 0.3821 0.09942 0.1904** 0.02270
Ca 0.2607* 0.01920 0.6618 0.1334 1.604*** 0.3028
Mg 4.281*** 0.1975 2.385 0.5069 3.378* 0.4210
Na 1.273 0.3498 1.611 0.5720 0.2959** 0.04700
K 58.25 15.67 60.11 4.898 60.11 4.430
P 6.820 1.845 6.360 0.4367 13.08**** 1.071
S 2.872 0.2117 3.657 0.8121 3.680 0.1222
Fe 0.1742 0.07272 0.1683 0.05213 0.1565 0.05540
Mn 0.008656 0.002136 0.007543 0.001739 0.009967 0.001903
Cu 0.006913 0.002031 0.008926 0.001480 0.006325 0.0008032
Zn 0.009965 0.001238 0.01158 0.001001 0.008683** 0.0008661
Skin tissue
ICP-AES
(mg/kg)
B 1.088 0.3350 1.377 0.3131 0.4781** 0.08148
Ca 1.945**** 0.2569 5.608 0.5292 13.97**** 0.4555
Mg 9.715** 1.468 6.549 0.4013 5.690 0.7387
Na
K 390.7* 44.47 305.0 31.42 370.2* 26.11
P 30.99 9.013 32.28 9.646 102.5**** 8.890
S 10.45 1.496 9.669 2.836 12.24 1.121
Fe 0.2013 0.03363 0.2193 0.03950 0.2193 0.07980
Mn 0.06337 0.01553 0.05743 0.006415 0.05915 0.003566
Cu 0.01601 0.007563 0.01914 0.002881 0.01571 0.0002091
Zn 0.02429 0.009513 0.03471 0.004552 0.02704 0.0004426
Table 3.2. Ionic composition of Chenin Blanc whole grape, mesocarp, and skin tissues at harvest
maturity. Brix, pH and calcium activity measurements carried out on juice from 10 bulked berries per
bunch. Whole grape, mesocarp, and skin analysis was carried out on five individual berries per bunch
expressed as a mean, or as a single measurement of five or ten pooled berries, expressed as mg/kg on
a fresh weight basis. Mean and SD from n = 4 replicate bunches. Columns with asterisks are significantly
different from BNS control using one way analysis of variance and a Dunnett’s multiple comparison
posthoc test at 95 % CI (* P=0.05-0.01, ** P=0.01-0.001, *** P=0.001-0.0001, **** P <0.0001).

70
3.4 Discussion
The differences in berry ripening phenology between vines grown under different calcium regimes
indicate that calcium contributes to fruit development through previously identified roles as a signalling
element and cell wall component. Although calcium has been identified as a factor in several fruit
disorders, few previous studies have focused on the effects of calcium nutrition levels on fruit
development. Response to changes in calcium nutrition were investigated in two varieties; Shiraz is an
economically important variety that demonstrates susceptibility to the late ripening disorder berry
shrivel, whereas even under late harvest conditions, Chenin Blanc maintains berry cell vitality and does
not succumb to berry shrivel.
Petiole analysis of Chenin Blanc provided interesting insights into the effects of the three nutritional
regimes on ion accumulation and vine nutrition. Whilst petiole sampling for field vine nutritional analysis
is typically carried out at flowering, the results presented here give a snapshot of a later developmental
phase (i.e. at harvest). This time point may reveal more about the long term effects of the treatments,
as the vines have been exposed for longer, allowing greater accumulation of “excess ions” into the leaf
prior to abscission. Petiole concentration of some ions has been shown to change from flowering to
harvest (Smith et al., 2014).
3.4.1 Calcium deficiency accelerates berry ripening
Previous studies examining the effects of low calcium supply on fruit development are scarce, with most
focused on localised calcium deficiency disorders such as blossom end rot in tomatoes and bitter pit in
apples (White and Broadley, 2003). Whilst many studies (and indeed horticultural practices) have
utilised direct application of calcium to leaves and fruit to alleviate calcium deficiency disorders (often
as calcium chloride or calcium nitrate sprays), the results have been inconsistent (Saure, 2005). It is
broadly accepted that calcium applied to leaves does not increase fruit calcium. Direct uptake of
calcium from the fruit surface is also problematic, affected by variety and developmental stage (Saure,
2005). Additionally, high levels of surface calcium can cause skin injury. Although soil calcium is
generally thought of as sufficient in most agricultural soils, the prevalence of localised calcium deficit
disorders indicate that plant calcium interactions affecting calcium uptake and translocation often result
in low calcium supply situations that are detrimental to fruit development.
The research undertaken here demonstrates that low or deficient calcium supply in Shiraz results in
accelerated ripening through changes to the physical properties and water relations of berries. Early

71
onset of berry weight loss and shrivel were the clearest signs that low calcium supply had perturbed
normal berry functions (Figure 3.1). The causes for this are believed to be related to calcium-cell wall
interactions and water transport in the berries (investigated further in Chapter 4). This cannot be
explained by general water stress on the vine caused by low calcium supply, as indicated by the leaf
gas exchange data, leaf water potentials and root hydraulic conductance.
There were no signs that low calcium supply in Shiraz affected fruitset or reproductive indices relative to
basal nutrient supplied vines (Figure 3.4). In bunches harvested at an approximation of commercial
harvest point (114 DAA), the majority of berries in low calcium grown bunches had progressed into the
shrivelled berry class, indicating that calcium deficient growth shortens the developmental window of
grapes or exacerbates cell vitality loss and berry shrivel. Very few berries from the BNS treatment were
shrivelled at this point, with the dominant berry class being ripe (Figure 3.5).
Low calcium grown Chenin Blanc vines had higher leaf net assimilation rate and stomatal conductance
than basal grown vines, but no significant difference in transpiration rate, sub-stomatal CO2, leaf water
potential, or root hydraulic conductance (Figure 3.7). Calcium plays an important role in leaf stomatal
movement. Antisense knockout of the extracellular calcium sensor CAS exhibited increased stomatal
aperture and decreased stomatal response to water stress, leading to higher transpiration and stomatal
conductance (Wang et al., 2014). The higher transpiration rate may serve to increase delivery of
calcium to the leaf; the relationship between leaf calcium supply and transpiration has been previously
reviewed in Gilliham et al. (2011).The reduction in sensitivity to extracellular calcium observed in CAS
knockouts mimics the response to low calcium supply observed in grapevines. Additionally, the
increased net assimilation rate may advance the ripening schedule of berries, with sugar signalling
linked to regulation of cell division and expansion (Wang and Ruan, 2013).
By studying individual berry qualities in particular berry classes of Shiraz from all three treatments we
were able to distinguish developmental differences from other influences. Conclusions about some
classes and treatments are speculative due to low berry numbers. Importantly, in all berry classes, low
calcium berries showed higher levels of deformation and lower Young’s Modulus values than basal
nutrient berries (Figure 3.6).
Previous research has demonstrated that grapevines have the capacity to mobilise calcium stores in
the roots and trunks to supply aerial tissues throughout the growing season (Conradie, 1981). The
delivery mechanisms for this calcium are as yet unknown; however it is clear that under these

72
conditions, movement from other tissues did not enable sufficient calcium transport into berries after
veraison to ameliorate the low calcium supply.
3.4.2 Elevated calcium impairs berry development
Some studies have directly applied calcium sprays throughout development in an attempt to modify
post-harvest storage traits. Direct application of calcium chloride sprays (as calcium-EDTA) at pre-
veraison stage to the table grape variety Italia increased skin, mesocarp, and seed calcium
concentrations, and increased berry firmness and breaking force. Post-veraison calcium treatments
delivered less consistent results (Ciccarese et al., 2013). Spray treatment of Thompson Seedless with
CaCl2 at pea-size and veraison resulted in increased berry firmness and berry adherence strength,
whilst simultaneously increasing sugar accumulation (Marzouk and Kassem, 2011). However, that
study had minimal replication and all treatments appeared to increase sugar accumulation with various
shifts in harvest ripeness compared to control vines. Calcium infiltration has been shown to delay fruit
softening in Golden Delicious apples, possibly due to strengthening of cell-walls (Sams and Conway,
1984). It is clear that variations in calcium response occur at the species and even variety level, as well
as being dependent upon stage of fruit development at the time of application. Exogenously applied
calcium does not produce consistent changes in fruit physiology and observed changes are not
necessarily representative of soil calcium nutritional responses.
Both sodium and chloride ions affect grapevine growth under saline conditions, with different rootstocks
exhibiting different capacities for exclusion of these ions (Walker et al., 2014). Although the effects of
salinity on plants are often characterised in terms of the osmotic and ionic effects of sodium, the
injurious effects of chloride are more prominent in grapevines, particularly in the context of Australian
viticulture, where chloride is the major anion in irrigation water (Downton, 1977; Teakle and Tyerman,
2010). Work to understand the molecular mechanisms of chloride exclusion in grapevine is currently
being undertaken, with several chloride transporters being characterised (Henderson et al., 2014). The
level of chloride in the high calcium hydroponics treatment may have exceeded levels for normal
growth. Petiole chloride concentrations at flowering from a variety of field sites were measured in own-
rooted Chardonnay (0.9-1.22 % DW), and own-rooted Shiraz (0.98-1.43 % DW) (Walker et al., 2010). In
this study, Chenin Blanc petioles were sampled at harvest, with 1.22 % DW in LCS, 1.77 % DW in BNS,
and 2.55 % DW in HCS (Figure 3.9). The later sampling date (at harvest rather than flowering) may
account for some of the extra chloride accumulation. Excess potassium, sodium and chloride ions can
be retained in senescing leaves for removal from the plant (Downton, 1977). Although, attempts were
made to limit chloride supply to the vines, the high levels of petiole chloride observed (particularly in the

73
high calcium treatment) may indicate that chloride toxicity is responsible for some of the treatment
effects observed.
Berry development of high calcium grown vines was delayed; lower berry weights, brix, and osmolarity
were observed at every time point (Figure 3.1). This delayed development translated into lower bunch
weights at harvest, which can be at least partially attributed to lower fruitset, higher CI, resulting in lower
berry numbers per bunch (Figure 3.4). At an approximation of commercial harvest point (114 DAA), the
high calcium bunches exhibited a mixture of berry classes, including shrivelled, ripe, and significant
numbers of green berries (Figure 3.5). HCS grown Shiraz also had lower berry weight and TSS than
BNS in all berry classes (Figure 3.6). Grapevine irrigation with saline water can result in reduced berry
weight (Prior et al., 1992) , delayed sugar accumulation and onset of veraison (Hawker and Walker,
1978), indicating that some of the effects observed here may be a result of the high chloride content of
the HCS solution. Shiraz berry deformability and elasticity of HCS was similar to BNS at all berry
maturity levels (Figure 3.6).
The effects of high calcium treatment on Shiraz and Chenin Blanc vine physiology included reductions
in transpiration rate, net assimilation rate, stomatal conductance, sub-stomatal CO2, and leaf water
potential (Figure 3.7). This suggests that the high levels of calcium present in leaves of HCS grown
vines may reduce transpiration rates through perturbed stomatal responses or ionic effects upon water
transport. The reduced net assimilation rate may well explain the lower rate of sugar accumulation
observed in HCS berries.
3.4.3 Calcium impact on vine fruitset and reproductive indices
Although significant differences in individual measures of reproductive performance were minimal, a
cumulative effect produced very different bunch characteristics. Neither Coulure Index (the proportion
of aborted/un-fertilised flowers) nor Millerandage Index (the proportion of seedless berries and live
green ovaries in a bunch) showed significant differences between HCS and BNS Shiraz vines in this
study. However, there were indicators of reduced reproductive performance, including reduced bunch
weight and lower fruitset in high calcium Shiraz vines (Figure 3.4). Repeating the experiment with
higher replicate numbers would help to elucidate this. The effects of high calcium upon flowering,
fruitset and berry development are similar to salinity responses. For instance, in navel oranges irrigated
with excess sodium chloride, lower flower numbers, lower fruitset, and slower/delayed fruit growth and
sugar accumulation was observed (Howie and Lloyd, 1989). Differences in veraison synchronicity
observed in high calcium grown fruit are carried out by differences in berry sugar accumulation rates
74
and bunch composition at harvest. The lack of significant differences between treatments with regards
to reproductive measures may be an artefact of the fruiting cutting system, or the relatively low bunch
numbers used in these measurements. Additionally, as bud formation occurs in the previous season
(prior to treatment), treatment effects on some reproductive measures may be mitigated.
3.4.4 Chenin Blanc nutrient accumulation consistent with other varieties
Calcium accumulation in grapes appears consistent across varieties that differ in ripening phenology.
Previous work has identified calcium as a predominantly xylem mobile element in Shiraz grapes
(Rogiers et al., 2000; Rogiers et al., 2006a). The majority of calcium accumulation in grapes occurs
prior to veraison, with total berry calcium reaching a maximum at veraison. The continued growth of
berries post-veraison leads to a reduced concentration of calcium in the skin and mesocarp tissues.
Some evidence suggests that during later phases of ripening berry mesocarp calcium is mobilised and
transported to the skin (Cabanne and Doneche, 2003). The lack of post-veraison calcium accumulation
has been observed in a number of varieties. Varieties differ in susceptibility to loss of mesocarp cell
vitality and berry shrivel (Fuentes et al., 2010), this may be caused by differences in post-veraison
calcium import. To test this hypothesis, the nutrient accumulation of Chenin Blanc, a variety that shows
very low susceptibility to loss of cell vitality loss and berry shrivel, was studied. These results
demonstrated that Chenin Blanc had a similar calcium accumulation profile to previously surveyed
varieties Shiraz (Rogiers et al., 2006b) and Grenache Noir (Etchebarne et al., 2009). Although the
uptake of calcium into Chenin Blanc berries throughout development does not appear to differ from
other varieties, translocation of calcium between tissues and cell wall binding of calcium is a potential
factor warranting further investigation.
3.5 Conclusion
It has been demonstrated that low calcium supply can cause a number of changes in Shiraz and
Chenin Blanc grape development and vine physiology. Whilst some of the osmotic effects of low
calcium supply may be moderated by increased uptake of other divalent cations (e.g. sodium and
magnesium), sufficient calcium is still required to carry out specific roles in cellular signalling and
modifying cell wall properties. Specifically, low calcium supply resulted in increased vine photosynthesis
and stomatal conductance, accelerated fruit ripening, early onset of berry shrivel, higher berry
deformation, and higher berry elasticity. Changes in berry cell wall properties are unlikely to affect leaf

75
photosynthesis and stomatal conductance, suggesting that these changes were a result of perturbed
cellular signalling or other calcium interactions in the leaf. As fruit cell wall changes and signalling are
interconnected, it is difficult to determine whether effects observed in the fruit are direct or indirect
responses to deficient calcium supply.
The high calcium treatment applied resulted in an array of changes in Shiraz berry and vine physiology.
Some of these changes may be attributable to high chloride levels in the solution; however levels of
calcium were so far above the norm as to be expected to exert an influence. Changes in high calcium
grown berry development included; lower fruitset, lower bunch weights, delayed (measured by reduced
berry weights, brix, and osmolarity) and asynchronous (observed in the diversity of berry classes
present at harvest) berry ripening. High calcium grown vines also exhibited lower transpiration,
photosynthesis, stomatal conductance, sub-stomatal CO2, and leaf water potential. The combination of
developmental defects and reduced vine performance is a result of high calcium (and chloride) levels
perturbing hormonal developmental signalling and stomatal operation, as well as the ionic effects which
affects water transport. Interactions of calcium with berry cell walls may also play a role in reducing
berry cell expansion and delaying ripening. The relationships between berry calcium, cell walls, and
berry water relations will be further investigated in Chapter 4.
Investigation of the post-veraison nutrient accumulation of Chenin Blanc berries demonstrated similar
patterns to previously studied varieties; no obvious indication was discovered that the observed low
susceptibility of Chenin Blanc to berry cell vitality loss and shrivel (Fuentes et al., 2010) was due to
differences in berry calcium uptake. However, the increased berry shrivel observed in low calcium
grown Shiraz indicated that processes affecting the distribution and utilisation of calcium within the
berry may still exert an influence on membrane viability, susceptibility to cell vitality loss and shrivel.
Low or high calcium supply was shown to affect the uptake and translocation of other nutrient ions,
particularly other divalent cations and the chloride counter-ion.
76
Chapter 4 Berry ripening physiology; calcium uptake and cell wall modification
4.1 Introduction
The link between cell wall modification and ripening has been explored in a number of fruits (Brummell,
2006). Although it has been shown that calcium interacts with de-methyl esterified pectin to change the
physical properties of the cell wall (Willats et al., 2001), how exactly this process affects ripening in fruit
is unknown. Changes in calcium nutrition will not just affect cell wall properties of ripening fruit, but also
water relations (Gilliham et al., 2011) and transduction of cellular signals (including those of ripening
related phytohormones) (Yu et al., 2006). In this chapter, the effects of changes in calcium nutrition on
grape berry ripening will be investigated. Vines were grown in hydroponics and subjected to three
different nutritional regimes; high calcium solution (HCS), low calcium solution (LCS), and basal nutrient
solution (BNS). The impact of these treatments on aspects of berry physiology (including ripening
phenology, water relations, and cell wall modification) and fruit quality traits (such as berry shrivel and
Botrytis cinerea susceptibility) were investigated.
4.2 Materials and Methods
4.2.1 Grapevine material
Fruiting cuttings were produced according to the Mullins method modifications described in Baby et al.
(2014) (Appendix 3) and elaborated on in Chapter 3.2.1 and 3.2.2. At least 24 biological replicate vines
were grown per treatment. For time course experiments, 3 biological replicate vines were sampled per
treatment per time point; other experiments comprised 3-4 biological replicate vines per treatment. The
number of technical replicates (i.e. berries sampled from each biological replicate vine) varied from
depending on the experiment; technical replicate numbers are noted in figure legends.
4.2.2 Immunogold labelling and transmission electron microscopy
Berry sections were prepared as per Chapter 2.2.2, except for changes to ethanol dehydration. Ethanol
dehydration was carried out using a series of changes at 20 minutes each (2 X 30%, 2 X 50%, 2 X
70%, 2 X 90%, and 2 X 95%), followed by 3 X 100% dry ethanol changes of 4 hours, 16 hours, and 8
hours each.
Immunolabelling was undertaken for TEM of berry sections. Sections for TEM (70-90 nm thick) were cut
on a Leica EM UC6 ultra-microtome (Leica, Germany) using a diamond knife. Sections were transferred
77
to 100 bar nickel grids coated with 2% collodion in amyl acetate (Electron Microscopy Sciences,
Pennsylvania, USA). Grids were incubated on 50 µL drops of 0.05 M glycine for 20 minutes (drops
were placed on parafilm with a Pasteur pipette and grids inverted onto the drops). This was followed by
3 X 10 minute washes on drops of incubation buffer (1 X PBS, 0.2% AURION BSA-c) (AURION,
Wageningen, Netherlands). Grids were blotted and wick-dried on filter paper after the third wash. Grids
were then inverted onto 20 µL drops of primary antibody solution (LM19 and LM20 diluted 1/20 in
incubation buffer) on parafilm for 90 minutes, followed by 3 X 10 minute washes on drops of incubation
buffer (1 X PBS, 0.2% AURION BSA-c). Grids were blotted and wick-dried on filter paper after the third
wash. Grids were then inverted onto 20 µL drops of gold conjugate solution (Goat Anti-Rat IgM diluted
1/30 in incubation buffer) on parafilm for 90 minutes, followed by 3 X 10 minute washes on 50 µL drops
of incubation buffer (1 X PBS, 0.2% AURION BSA-c). Grids were blotted and wick-dried on filter paper
after the third wash then washed on 50 µL drops of distilled water twice for 5 mins, blotted after the
second wash, and stored face-up in a petri dish. Prior to microscopy, grids were stained with uranyl
acetate by inverting them on drops of 4% aqueous uranyl acetate solution for 15 minutes, followed by
three rinses on water drops, then wick-dried on filter paper and air-dried.
TEM microscopy was carried out on a Philips CM100 with Megaview II imaging system (Philips,
Eindhoven, Netherlands) at Adelaide Microscopy Waite Campus.
4.2.3 Berry staining methods; FDA and PI
Staining methods on fresh berries were utilised to capture developmental changes in cell vitality and
cell wall composition. Fluorescein diacetate (FDA), a cell vitality stain, was used for this purpose. FDA
staining method was modified from Fuentes et al. (2010). Stock solution of FDA (4.8 mM) was made up
in acetone on the day of staining. Sucrose solutions spanning the range of osmolality observed in the
berries were made up. FDA stock solution was added to each sucrose solution for a final FDA
concentration of 4.8 µM. Propidium iodide (PI) was used to stain de-esterified pectins in fresh berries. A
stock solution of 2 mg/mL (3 mM) PI was made up in milliQ water. PI stock solution was added to FDA
sucrose solution for a final concentration of 30 µM. Individual berries were cut in half longitudinally with
a ‘Diplomat’ double-edged razor blade (Personna, USA) following removal of the pedicel. Efforts to
avoid seeds when cutting were made by illuminating the berry underside using an LED torch to show
seed location. Only berries that were cut cleanly through with, other than the cut face, no or negligible
tissue damage or deformation were used for staining. Juice was expressed from one half of the berry
by squeezing. TSS was measured using a digital refractometer and osmolality using a Wescor 5500B
Vapour Pressure Osmometer (Wescor Inc. Utah, USA). The other berry half was carefully positioned in

78
a holding rack, 100-150 µL of PI/FDA/sucrose solution of appropriate osmolality (within 100 mmol/Kg)
was pipetted onto the cut berry surface. Berries were stained for 2 hours in darkness before imaging.
Shorter staining times (e.g. 15 minutes) also produced good staining patterns. However, no loss of
staining intensity was observed using longer stain times, and this allowed a greater number of berries
to be stained and imaged in each experiment. After staining, berries were imaged using a Leica
MZFLIII Stereo Fluorescence Dissecting Microscope with Fluo III camera unit (Leica, Wetzlar,
Germany). Sequential imaging on each half berry was undertaken at 1X magnification; FDA staining
with GFP Plant filter, PI staining with dsRed2 filter, and combination FDA/PI with wide pass GFP Plus
filter, a bright field (BF) image was also taken for edge detection in image analysis software.
Microscope settings were optimised for maximum contrast of stains to background and for balance of
stain intensity in GFP Plus images (FDA typically stained more strongly than PI). Fluorescence image
exposure time was 596.6 ms, BF exposure time was 10 ms. Check colour/colour correction was set to
100%/0% (i.e. red emphasis) to balance the lower fluorescent signal strength of red PI fluorescence
against the stronger green FDA fluorescent signal.
4.2.4 MATLAB/ImageJ image analysis
A Matlab macro developed by Fuentes et al. (2010) was used initially for determining berry area, %
berry area FDA stained, and % berry area PI stained. The development of a more detailed staining
analysis macro was undertaken in order to capture the tissue specific co-staining patterns of PI. The
ImageJ platform (ImageJ, NIH, USA) was used. The macro utilised the combined FDA/PI images
captured with wide pass GFP Plus filter to detect berry edges, to manually exclude seed areas, and
quantify levels of PI and FDA staining in skin and mesocarp. Skin tissue was determined as a band of
nominal width (30 pixels) around the circumference of the berry; this band contained the epidermal and
hypodermal tissues in their entirety, as well as some outer mesocarp cells and peripheral vasculature.
The following outputs were extracted from individual images; berry area, berry area (- seeds), % berry
area FDA stained, % berry area PI stained, % berry area FDA/PI co-stained, skin (epidermis and
hypodermis) area, % skin area FDA stained, % skin area PI stained, and % skin area FDA/PI co-
stained. Assistance with scripting and de-bugging the macro was generously provided by Cameron
Nowell (Monash Institute of Pharmaceutical Sciences, Melbourne, Australia). The ImageJ Macro script
is provided in Appendix 5.

79
4.2.5 Berry electrical impedance spectroscopy
Berry impedance was measured using an impedance analyser (Bode 100 Vector Network Analyser,
OMICRON Lab, Hong Kong) attached to two silver/silver chloride 8 mm disc electrodes (SDR Scientific,
Sydney, Australia). The electrodes were calibrated with an open circuit, a short circuit, and a 49.6 Ω
resistor according to the manufacturer’s instructions. Berries were prepared by slicing thin sections
(approximately 3 mm diameter) with a razor blade from opposite sides of the berry on the axis
perpendicular to the pedicel end to blossom end axis. A drop of 0.1 M KCl was applied to both cut
surfaces before being placed on the bottom electrode. The top electrode was lowered using a
calibrated micrometer screw until it contacted the berry surface. The electrical path distance (i.e. the
distance between the electrodes) was recorded from the micrometer screw. The impedance was
measured at 100 frequencies across a range from 1 Hz to 1 MHz. After impedance measurement, berry
weight and total soluble solids were measured.
Modelling of berry electrical circuits to determine Re, Ri, and Cm was performed as per Caravia Bayer et
al. (2015) from the Bode impedance analyser raw data.
4.2.6 Berry rehydration assay
A custom assay to measure the water uptake, transpiration rate, and berry weight change of individual
berries in vitro was carried out as per the design published in detail by Scharwies (2013). Single berries
with pedicel attached were cut from the bunch under degassed milliQ water; the pedicel was then cut
again underwater with a sharp razor to provide a clean undamaged interface for water transport. The
cut pedicel was then inserted underwater into the flared end of an artificial pedicel; a 40 mm long piece
of 2 mm external diameter X 1 mm internal diameter polyethylene tubing pre-filled with degassed milliQ
water. The junction of pedicel and artificial pedicel tubing was dabbed dry with absorbent paper towel
and sealed with adhesive free silicone glue (3140 RTV Coating, Dow Corning Corp, Missouri, USA).
Care was taken to exclude air bubbles from the tube at all stages. The open end of the artificial pedicel
was placed into a water reservoir constructed from a modified pipette tip box filled with degassed milliQ
water, and left overnight for the glue to dry. The following morning berry height and berry diameter were
measured with digital calipers. Berry holders were constructed of a 5 mm moulded blue tube (formed
from Xantopren L Blue polysiloxane impression material; Hereaus Kulzer, Hanau, Germany) glued to
the cap of 2 mL microcentrifuge tube with a 2 mm hole drilled through it. The microcentrifuge tube was
fixed into a falcon tube lid with a hole drilled in the top. Berry and artificial pedicel weight, berry holder
weight and assembled weight were measured using an OHAUS Explorer (OHAUS, New Jersey, USA)

80
precision analytical digital balance (increments in 0.0001 gram graduations). The assembled berry
holder was then screwed into a custom transpiration chamber (constructed of a transparent plastic
container with falcon tube threads glued onto holes in the container lid, filled with 140 g of dried silica
gel, holding up to 24 berries). This chamber seeks to maintain a constant relative humidity of 20%;
temperature was maintained at 20 °C. After 24 hours, the berry holder assembly was unscrewed from
the transpiration chamber and the following measurements were taken; assembled weight, berry holder
weight, berry and tube weight, berry TSS. Any berries which showed signs of poor seal between
pedicel and tubing (e.g. water coming out of artificial pedicel junction, air bubbles in tubing), were
excluded from analysis. Berry volume and surface area was calculated from berry diameter and height,
approximating berry shape as a prolate sphere. Transpiration rate (µmol m-2 s-1), water uptake rate
(mmol m-2 s-1), and net flux rate (rate of net berry water loss or gain; µmol m-2 s-1) were then calculated.
4.2.7 Biomechanical testing
Physical testing of berries was undertaken using an Instron materials testing machine (as per Chapter
2.2.5) and skin fold calipers (as per Chapter 3.2.3).
4.2.8 Botrytis cinerea infection assay
An infection assay was developed with and without wounding to determine the rate of Botrytis cinerea
infection spread and the impact of Ca nutrition, based on the mycelial plug method described in
Deytieux-Belleau et al. (2009). The infection assay without wounding was intended to estimate the rate
of infection spread on intact berries, including penetration of the cuticle and epidermal cell walls by
mycelia (e.g. as would occur when an uninfected berry comes into contact with an infected berry). The
use of mycelial plugs rather than spore culture droplets provided a high level of active mycelia and a
nutrient source. This allowed assessment of the rate of mycelial spread through the cell wall rather than
a measure of the rate of spore germination and pathogen development on the berry surface.
Fresh Botrytis cinerea culture plates were prepared by scraping spores across potato dextrose agar
plates (40 g/L H2O, autoclaved at 121 °C for 20 minutes) 24 hours prior to its application to fruit. Using
a 4 mm hole punch, mycelial plugs were stamped out on the leading edge of mycelial growth from the
fresh plates. Assays were carried out in 12-well white ceramic plates; mycelial plugs were carefully
inverted onto berries (with or without wounding). Wounding consisted of a single hole penetrating the
berry skin and underlying the mesocarp using a syringe needle. The mycelial plug was placed over the
puncture wound. A negative control was prepared using agar plugs from uninfected plates. Progression

81
of infection spread was scored visually every 24 hours, with the percentage of berry surface area
discoloured (browning) due to infection classified into the following classes; 0 = 0%, 1 = 1-25%, 2 = 26-
50%, 3 = 51-75%, 4 = 76-100% of total berry surface area.
4.3 Results
4.3.1 Cell wall modifications from veraison to late harvest
Immunolabelling and TEM of pectin epitopes in grapes revealed interesting differences between BNS,
HCS, and LCS treatments in Shiraz and Chenin Blanc at 100 DAA. Immunolabelled gold particles can
be observed as black dots in TEM images. In the epidermal cells, de-esterified pectin (labelled with
LM19) was found predominantly in the cuticle of Shiraz epidermal sections (Figure 4.1A). Chenin Blanc
exhibited much lower cuticle labelling intensity of LM19 compared to Shiraz, with labelling occurring
predominantly in the epidermal cell wall (Figure 4.1B). LM19 cuticle labelling was slightly higher in the
low calcium treated Chenin Blanc than basal and high calcium treated Chenin Blanc (Appendix 6.1). In
contrast, fully esterified pectin (labelled with LM20) was not found in the cuticle; instead its distribution
in the epidermal zone was clearly restricted to the cell walls (Figure 4.2). The pattern with LM20 was
consistent across all treatments and varieties.
Distribution of pectin epitopes in the hypodermal layers was also studied at 100 DAA in both varieties.
De-esterified pectin was distributed throughout the hypodermal cell walls, with areas of stronger LM19
labelling in the middle lamella (Appendix 6.1D-F, J-L). Esterified pectin labelling with LM20 was evenly
distributed throughout the hypodermal cell walls, with no pattern of stronger staining in the middle
lamella (Appendix 6.2D-F, J-L). Slightly stronger labelling of both LM19 and LM20 in the hypodermis
was observed in Chenin Blanc compared to Shiraz; no discernible differences were observed between
treatments.
The LM19 epitope was used to study changes in epidermal de-esterified pectin localisation in Shiraz
throughout development. In early post-veraison (75 DAA) Shiraz LM19 was found predominantly in the
outer epidermal cell wall, with much lower labelling intensity observed in the cuticle (Figure 4.3A). By
harvest point (100 DAA) the de-esterified pectin label was observed much more strongly in the cuticle
(Figure 4.1A). This trend continued til a later harvest date (118 DAA), with higher staining intensity
found in the cuticles (Figure 4.3B). High calcium grown samples appeared to have slightly higher LM19
labelling intensity in the outer cell wall at 118 DAA, with cuticle labelling mostly confined to the inner

82
cuticle layer (Appendix 6.3H). The distribution of esterified pectin (LM20) epitope was largely
constrained to the epidermal cell wall throughout development (Appendix 6.4). However, some low level
cuticle labelling was observed in the low calcium grown late harvest sample (Appendix 6.4F).

83
Figure 4.1 TEM images of Shiraz and Chenin Blanc berry epidermal and hypodermal tissue grown
under basal conditions at 100 DAA immunogold labelled with LM19. LM19 binds de-esterified pectin
Shiraz (A) and Chenin Blanc (B) demonstrate differences in labelling pattern. Immunogold labelling
present as small black dots, examples are indicated by white arrows. cu indicates cuticle. p indicates
primary cell wall. Multiple berries (at least 3) were examined for each treatment. Representative images
are shown. Scale bars represent 2 µm.
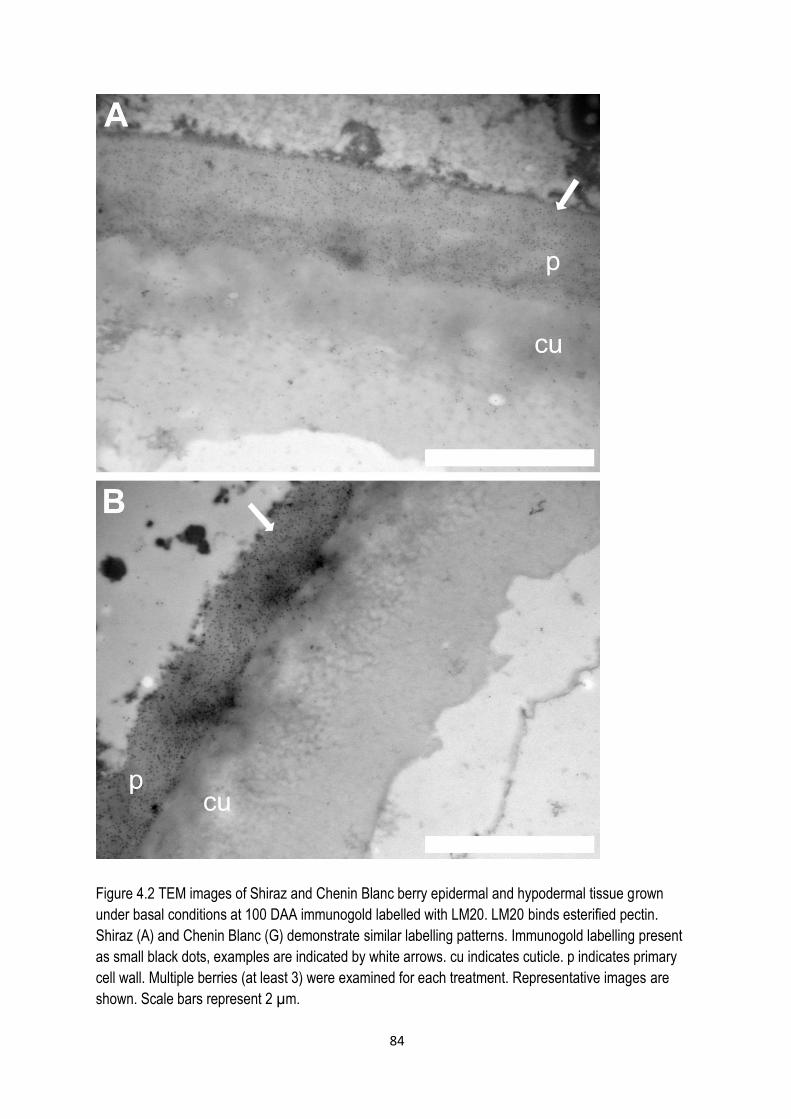
84
Figure 4.2 TEM images of Shiraz and Chenin Blanc berry epidermal and hypodermal tissue grown
under basal conditions at 100 DAA immunogold labelled with LM20. LM20 binds esterified pectin.
Shiraz (A) and Chenin Blanc (G) demonstrate similar labelling patterns. Immunogold labelling present
as small black dots, examples are indicated by white arrows. cu indicates cuticle. p indicates primary
cell wall. Multiple berries (at least 3) were examined for each treatment. Representative images are
shown. Scale bars represent 2 µm.

85
Figure 4.3 TEM images of Shiraz berry epidermal tissue grown under basal calcium conditions at post-
veraison (75 DAA; A), and late harvest (118 DAA; B) immunogold labelled with LM19. LM19 binds de-
esterified pectin. Immunogold labelling present as small black dots, examples are indicated by white
arrows. cu indicates cuticle. p indicates primary cell wall. Multiple berries (at least 3) were examined for
each treatment and time point. Representative images are shown. Scale bars represent 2 µm.

86
4.3.2 Fresh berry staining
Changes in Shiraz FDA staining throughout development were very similar in whole berry, skin and
mesocarp tissues, with a decrease in staining intensity occurring after veraison. Representative images
of stained Shiraz and Chenin Blanc berries grown in BNS at veraison (58 DAA) and late harvest (110
and 114 DAA, respectively) are presented (Figure 4.5). Closer inspection of the images reveals that the
difference between Chenin Blanc and Shiraz skin staining patterns detected by image analysis is due to
prominent staining of the Chenin Blanc peripheral vasculature. Example images demonstrate the
intensity of PI staining of epidermis and peripheral vasculature of Chenin Blanc relative to Shiraz in
berries sampled from BNS grown vines (Figure 4.6).
As the mesocarp occupies the vast majority of cut berry surface area, it is unsurprising that such close
resemblance is seen between mesocarp and whole berry staining patterns. Both BNS and LCS grown
Shiraz exhibit a rapid drop in mesocarp FDA staining from 100% at 49 DAA to ~75% at 63 DAA;
veraison occurred at ~55 DAA (Figure 4.7E). Subsequent decreases in FDA staining intensity were
more gradual in BNS than in LCS. HCS Shiraz demonstrated a later drop in FDA staining, consistent
with the delay in veraison. Interestingly, Chenin Blanc did not exhibit the same drop in FDA staining
intensity concurrent with veraison, instead maintaining at least 90% mesocarp staining intensity
throughout development (Figure 4.7E). Levels of FDA staining were lower in skin tissue than in
mesocarp across all time points (Figure 4.7C).
BNS and LCS grown Shiraz exhibited similar changes in PI staining intensity throughout development;
PI staining intensity of BNS Shiraz mesocarp decreased from 60% at 35 DAA to 16% at 64 DAA (Figure
4.7F). HCS Shiraz PI staining patterns were different; staying between 65 - 82% until 78 DAA, a rapid
drop to 28% occurred at 93 DAA (Figure 4.7F). Chenin Blanc exhibited a pattern of steadily decreasing
mesocarp PI staining from 75% at 64 DAA to 32% at 108 DAA. Visual observations of Chenin Blanc PI
images indicated that there were much higher levels of PI staining in the skin tissues than was
observed in Shiraz; this was supported by the data from the image analysis. PI skin staining was
consistently higher in BNS Chenin Blanc (32-42%) than BNS Shiraz (maximum 11% during the same
period) (Figure 4.7D). Unlike Shiraz, Chenin Blanc exhibited no discernible decrease in skin PI staining
intensity throughout development.

87
Fig
ure
4.5.
Rep
rese
ntat
ive
imag
es o
f sta
inin
g pa
ttern
s of
fres
h be
rrie
s. B
errie
s sa
mpl
ed fr
om v
ines
gro
wn
hydr
opon
ical
ly in
bas
al
nutr
ient
sol
utio
n. S
hira
z at
ver
aiso
n (5
8 D
AA
; A-C
) an
d ha
rves
t (11
0 D
AA
; D-F
). C
heni
n B
lanc
at v
erai
son
(58
DA
A; G
-I)
and
harv
est
(114
DA
A; J
-L).
Com
bine
d P
I and
FD
A s
tain
ing
(A, D
, G, J
), P
I sta
inin
g (B
, E, H
, K),
FD
A s
tain
ing
(C, F
, I, L
). S
cale
bar
rep
rese
nts
5
mm
.

88
Figure 4.6. Representative images demonstrating FDA and PI staining of berry skin and peripheral
vasculature. Berries sampled from vines grown hydroponically in basal nutrient solution. Panels
demonstrate combined PI and FDA staining (A, D, G), PI staining (B, E, H), and FDA staining (C, F, I)
of Shiraz at 30.6 Brix (A-C), and Chenin Blanc at 28.7 °Brix (D-F) and 23.5 °Brix (G-I). Panels G-I are
provided as further demonstration of the high levels of peripheral vascular staining observed in Chenin
Blanc. Scale bar represents 500 µm.

89
Figure 4.7. Cell vitality and pectin staining of Shiraz and Chenin Blanc fresh berries. Fluorescein
diacetate (A, C, E) and propidium iodide (B, D, F) fluorescence as % of; whole berry area (A, B), skin
area (C, D), and mesocarp area (E, F). n = 3 vines per treatment, 3-5 berries per vine, per time point.
Mean ± SD.
4.3.3 Berry electrical impedance spectroscopy
Using electrical modelling, components representing extracellular resistance (Re), intracellular
resistance (Ri), and cell membrane capacitance (Cm) were extracted from berry resistance/reactance
data of berries sampled at 95 DAA. No significant difference in Re was observed between treatments.
However, a significant difference between varieties was observed, with Chenin Blanc demonstrating
higher extracellular resistance than Shiraz (Figure 4.8A). Significant differences in Ri were found
D A A
FD
A s
tain
(%
be
rry
are
a)
3 5 4 9 6 4 7 8 9 3 1 0 8 1 2 3
0
2 0
4 0
6 0
8 0
1 0 0
D A A
PI
sta
in (
% b
erry
are
a)
3 5 4 9 6 4 7 8 9 3 1 0 8 1 2 3
0
2 0
4 0
6 0
8 0
1 0 0
D A A
FD
A s
tain
(%
sk
in a
re
a)
3 5 4 9 6 4 7 8 9 3 1 0 8 1 2 3
0
2 0
4 0
6 0
8 0
1 0 0
D A A
PI
sta
in (
% s
kin
are
a)
3 5 4 9 6 4 7 8 9 3 1 0 8 1 2 3
0
2 0
4 0
6 0
8 0
1 0 0
D A A
FD
A s
tain
(%
pu
lp a
re
a)
3 5 4 9 6 4 7 8 9 3 1 0 8 1 2 3
0
2 0
4 0
6 0
8 0
1 0 0
S h ira z L C S
S h ira z B N S
S h ira z H C S
C h e n in B la n c B N S
D A A
PI
sta
in (
% p
ulp
are
a)
3 5 4 9 6 4 7 8 9 3 1 0 8 1 2 3
0
2 0
4 0
6 0
8 0
1 0 0
A B
C D
E F

90
between treatments, but not between varieties (Figure 4.8B). However, this may be due to differences
in sugar content; intracellular resistance is positively correlated with sugar levels (Caravia Bayer et al.,
2015). A correlation between TSS and Ri in these samples was characterised (R2=0.6011) in Appendix
7.
Figure 4.8. Modelling of resistance and capacitance components of Chenin Blanc and Shiraz grapes
across calcium treatments, harvested at 95 DAA. Components include extracellular resistance (Re; A),
intracellular resistance (Ri; B), and cellular membrane capacitance (Cm; C). n = 3-4 vines per
treatment, 3 berries per vine. Mean ± SD.
Re
(
)
C h e n in B la n c S h ira z
0
1 0 0 0 0
2 0 0 0 0
3 0 0 0 0
B N S
L C S
H C S
H C S V e ra is o n
H C S G re e n
Ri
( )
C h e n in B la n c S h ira z
0
1 0 0
2 0 0
3 0 0
4 0 0
B N S
L C S
H C S
H C S V e ra is o n
H C S G re e n
Cm
(F
)
C h e n in B la n c S h ira z
0
1 .01 0 -9
2 .01 0 -9
3 .01 0 -9
4 .01 0 -9
B N S
L C S
H C S
H C S V e ra is o n
H C S G re e n
A
C
B

91
4.3.4 Berry physical changes
Berry biomechanical properties were investigated using both an Instron materials testing machine and
skinfold calipers to determine berry hardness, deformability, and elasticity. Young’s modulus of
elasticity was calculated both manually from the raw data (Figure 4.9A), and automatically by the
Instron (Figure 4.9B). The Instron automatic calculations do not take into account differences in size
and shape of berries, and were therefore somewhat inaccurate. However, they do demonstrate similar
trends to what is observed using manual calculations (Figure 4.9A). Differences between time points
and treatments were calculated using two way analysis of variance with Tukey’s multiple comparison
test (P<0.05). All treatments demonstrated very similar berry elasticity pre-veraison (49 DAA). The
elasticity of BNS and LCS berries increased significantly (i.e. lower Young’s Modulus values) from 49 to
64 DAA. This berry elasticity increase was delayed in HCS berries, concurrent with the delay in
reaching veraison (Figure 4.9A, B, C). By 93 DAA, elasticity levels of HCS berries were once again
similar to BNS and LCS berries. Significant increases in berry deformability (measured with skinfold
calipers) after veraison were observed in BNS and LCS berries; this increase was also delayed in HCS
berries (Figure 4.9D). LCS berries exhibited a larger increase in berry deformability than BNS or LCS
from 93 DAA to 108 DAA, concurrent with onset of shrivel in LCS berries at this time (Figure 4.9D).
Maximum berry compressive load of HCS berries was on average slightly lower than BNS and LCS
berries; this is probably due at least in part to the smaller berry size (Figure 4.9E). Both BNS and LCS
berries showed a rapid increase in skin maximum compressive load from 43 DAA to 64 DAA, with
subsequent decreases. At 64 and 93 DAA HCS berries had much significantly lower skin maximum
compressive load than the other treatments (Figure 4.9F). HCS berries showed slow but steady
increases in skin maximum compressive load throughout development, reaching similar levels to BNS
berries at 93 DAA.
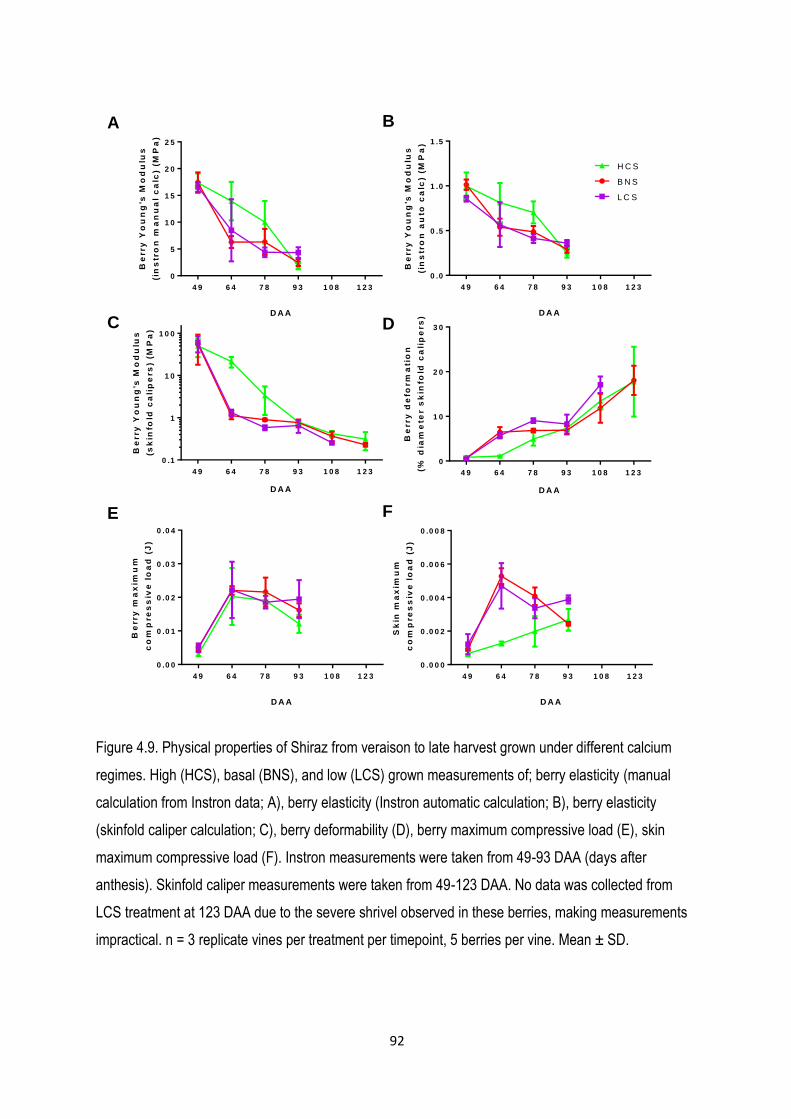
92
Figure 4.9. Physical properties of Shiraz from veraison to late harvest grown under different calcium
regimes. High (HCS), basal (BNS), and low (LCS) grown measurements of; berry elasticity (manual
calculation from Instron data; A), berry elasticity (Instron automatic calculation; B), berry elasticity
(skinfold caliper calculation; C), berry deformability (D), berry maximum compressive load (E), skin
maximum compressive load (F). Instron measurements were taken from 49-93 DAA (days after
anthesis). Skinfold caliper measurements were taken from 49-123 DAA. No data was collected from
LCS treatment at 123 DAA due to the severe shrivel observed in these berries, making measurements
impractical. n = 3 replicate vines per treatment per timepoint, 5 berries per vine. Mean ± SD.
D A A
Be
rry
Yo
un
g's
Mo
du
lus
(in
str
on
ma
nu
al
ca
lc)
(MP
a)
4 9 6 4 7 8 9 3 1 0 8 1 2 3
0
5
1 0
1 5
2 0
2 5
D A A
Be
rry
Yo
un
g's
Mo
du
lus
(in
str
on
au
to c
alc
) (M
Pa
)
4 9 6 4 7 8 9 3 1 0 8 1 2 3
0 .0
0 .5
1 .0
1 .5
L C S
B N S
H C S
D A A
Be
rry
ma
xim
um
co
mp
re
ss
ive
lo
ad
(J
)
4 9 6 4 7 8 9 3 1 0 8 1 2 3
0 .0 0
0 .0 1
0 .0 2
0 .0 3
0 .0 4
D A A
Sk
in m
ax
imu
m
co
mp
re
ss
ive
lo
ad
(J
)
4 9 6 4 7 8 9 3 1 0 8 1 2 3
0 .0 0 0
0 .0 0 2
0 .0 0 4
0 .0 0 6
0 .0 0 8
A
C
E F
D
D A A
Be
rry
de
form
ati
on
(% d
iam
ete
r s
kin
fold
ca
lip
ers
)
4 9 6 4 7 8 9 3 1 0 8 1 2 3
0
1 0
2 0
3 0
D A A
Be
rry
Yo
un
g's
Mo
du
lus
(sk
info
ld c
ali
pe
rs
) (M
Pa
)
4 9 6 4 7 8 9 3 1 0 8 1 2 3
0 .1
1
1 0
1 0 0
B

93
4.3.5 Berry water relations
Berry transpiration assays at pre-veraison (49 DAA), post-veraison (78 DAA), and harvest maturity (108
DAA) in Shiraz were performed. Transpiration rate of HCS berries was significantly lower than BNS
berries at all three time points. Transpiration rate of LCS berries was significantly higher than BNS
berries at 78 DAA (Figure 4.10A). HCS berries exhibited significantly lower water uptake than BNS
berries at 49 DAA, no differences were discernible post-veraison (Figure 4.10B). LCS berries exhibited
more negative net flux rates (i.e. greater net water loss) than BNS berries in this assay at 49 and 78
DAA (Figure 4.10C).
Comparisons of Shiraz and Chenin Blanc berry water relations at harvest maturity (108 DAA) were
made. LCS Chenin Blanc berries had significantly higher transpiration and water uptake rates than all
other samples (Figure 4.11A, B). BNS grown Chenin Blanc berries had relatively low transpiration and
water uptake rates. Although no significant net water balance differences were observed between
treatments in either variety, BNS Chenin Blanc berries had significantly less net water loss than all
three Shiraz treatments (Figure 4.11C).
Figure 4.10. Berry rehydration assay of Shiraz berries. Transpiration rate (A), water uptake rate (B), and
net flux rate (C), of individual Shiraz berries grown in high, basal and low calcium conditions was
measured. Rates were calculated from berry weight loss and berry water uptake after 24 hours in
custom transpiration chambers. n = 3 replicate vines per treatment per time point, 3-6 berries sampled
per vine. * indicates significant difference from BNS using two way ANOVA with Dunnett post-hoc test
(p<0.05).
D A A
Tra
ns
pir
ati
on
ra
te
(mm
ol
m-2
s-1
)
4 9 7 8 1 0 8
0 .0 0
0 .0 5
0 .1 0
0 .1 5
0 .2 0
0 .2 5
S h ira z B N S
S h ira z L C S
S h ira z H C S
*
*
* *
D A A
Wa
ter u
pta
ke
ra
te
(mm
ol
m-2
s-1
)
4 9 7 8 1 0 8
0 .0
0 .1
0 .2
0 .3
*
D A A
Ne
t fl
ux
ra
te
(
mo
l m
-2s
-1)
4 9 7 8 1 0 8
-1 0 0
-5 0
0
5 0
* *
*
A B C

94
Figure 4.11. Berry rehydration assay of Shiraz and Chenin Blanc berries at 108 DAA. Transpiration rate
(A), water uptake rate (B), and net flux rate (C), of individual berries grown in high, basal and low
calcium conditions was measured. Rates were calculated from berry weight loss and berry water
uptake after 24 hours in custom transpiration chambers. n = 3-4 replicate vines per treatment, 3-6
berries sampled per vine. Mean + SD. Letters indicate significant difference using two way ANOVA with
Tukey's post-hoc test (p<0.05).
4.3.6 Botrytis cinerea susceptibility
No treatment effect upon initial susceptibility to infection (i.e. time taken to show initial signs of infection)
was observable in Chenin Blanc berries at the resolution offered by this assay; all berries showed initial
signs of infection within the first 24 hours, with or without wounding (Figure 4.12). However, a treatment
effect was observed over the full time course of the assay in both intact (Figure 4.12A) and wounded
(Figure 4.12B) berries when a two way ANOVA was performed (P<0.05). Infection had spread further in
LCS berries than in both BNS and HCS berries at all test points after initial infection; this suggests that
the rate of infection spread is higher in the low calcium berries than those with basal or high calcium
levels.
Botrytis cinerea assays were also carried out in Shiraz berries; although these results indicate similar
patterns to Chenin Blanc, a limited number of replicates prevent statistical analysis (Appendix 8).
Tra
ns
pir
ati
on
ra
te
(mm
ol
m-2
s-1
)
S h ira z C h e n in B la n c
0 .0 0
0 .0 5
0 .1 0
0 .1 5
0 .2 0
0 .2 5
a
bb c
b cc
d
L C S
B N S
H C S
Wa
ter u
pta
ke
ra
te
(mm
ol
m-2
s-1
)
S h ira z C h e n in B la n c
0 .0 0
0 .0 5
0 .1 0
0 .1 5 a
b
b c
b
cc
Ne
t fl
ux
ra
te
(
mo
l m
-2s
-1)
S h ira z C h e n in B la n c
-1 0 0
-8 0
-6 0
-4 0
-2 0
0
a cb cc
a b
c
a
A B C
H o u rs a fte r in n o c u la t io n
Infe
cti
on
sta
ge
2 4 4 8 7 2 9 6
0
1
2
3
4
B
C h e n in L C S
C h e n in B N S
C h e n in H C S
+ w o u n d in g
H o u rs a fte r in n o c u la t io n
Infe
cti
on
sta
ge
2 4 4 8 7 2 9 6
0
1
2
3
4
A
N o in n o c u la tio n c o n tro l
C h e n in L C S
C h e n in B N S
C h e n in H C S
- w o u n d in g

95
Figure 4.12. Botrytis cinerea assay of Chenin Blanc berries grown under different calcium regimes.
Assay was carried out over 96 hours, with inspection of berries every 24 hours after Botrytis cinerea
inoculation. Assay was performed on intact (A) and wounded (B) berries. Berries were scored by visual
assessment of percentage berry surface area discoloured/infected; 0 = 0%, 1 = 1-25%, 2 = 26-50%, 3 =
51-75%, 4 = 76-100%. Mean + SD. n = 4 replicate vines, 6 berries per vine.
4.4 Discussion
In this study the importance of calcium availability for determining berry properties has been examined.
The complex nature of calcium’s role in fruit ripening will be addressed with specific focus on the
impacts of calcium nutrition on pectin distribution, fruit softening, fruit water relations and pathogen
susceptibility.
4.4.1 Effect of calcium on pectin distribution
Calcium is able to cross link de-esterified pectin, modifying cell wall properties (Willats et al., 2001).
However, pectin de-esterification without formation of calcium cross-links can lead to increased
solubilisation of pectins and irregular distribution of solubilised fragments (Decreux and Messiaen,
2005; Brummell, 2006). Interestingly, in this study de-esterified pectin was found in the cuticle of Shiraz
and Chenin Blanc berries. Low calcium growth resulted in higher levels of de-esterified pectin in the
cuticle. Reduced calcium supply resulted in multiple changes in pectin modification and solubilisation,
as well as modifying berry water relations. The lower degree of ionic cross-linking in low calcium grown
fruit would presumably allow greater access of polygalacturonases (PGs) to the pectin backbone. The
de-polymerisation of the pectin backbone creates smaller fragments of soluble pectin (Brummell, 2006).
The disassembly of pectin structures in xylem vessels may have contributed to the relatively high berry
transpiration rate (Figure 4.10 and 4.11) of low calcium berries, resulting in movement of soluble pectin
fragments out of the epidermal cell wall and into the cuticle. In Shiraz berries grown under high calcium,
de-esterified pectin is retained in the cell wall (rather than cuticle). The high levels of available calcium
may cross-link de-esterified pectins and limit access of PGs to the pectin backbone. High calcium
supply also reduced berry transpiration. These factors combine to result in low solubilisation of pectin,
increasing retention of pectin within the epidermal cell wall with minimal distribution into the cuticle.
Previous characterisation of the tomato cuticle showed presence of pectin, hemicellulose, and cellulose
(Lopez-Casado et al., 2007). High levels of pectin methyl esterases (PME) have been observed in the

96
outer pericarp tissue of tomato at the breaker stage; the combined action of PMEs during breaker
stage, and PGs during ripening lead to a reduction in total insoluble pectin within the cell wall (Blumer
et al., 2000). As pectin from the primary cell wall of epidermal cells is de-esterified by PMEs, the
release of hydrogen ions locally reduces the pH, stimulating polygalacturonase and pectate lyase
activity (Bosch and Hepler, 2005). Polygalacturonase activity in Sauvignon Blanc and Semillon
increased during ripening (Cabanne and Doneche, 2001). Additionally, cell wall modifying enzyme
expression changes throughout development. In grape mesocarp PME expression increases from
stage II of berry development (veraison), with subsequent increases in levels of pectate lyase
expression (Schlosser et al., 2008). These expression changes were somewhat delayed in exocarp
tissue, suggesting that berry growth during ripening may be controlled and/or limited by cell wall
loosening and expansion in the exocarp tissue. Fragmentation and solubilisation of long chain pectins
during ripening caused by this change in PME activity may lead to distribution of pectin labelling into
ectopic locations such as the cuticle.
Studies in tomato demonstrated that the presence of polysaccharides in the cuticle resulted in higher
elastic modulus and higher maximum breaking stress in cuticles from both mature green and red ripe
fruit, relative to cuticles stripped of their polysaccharide content (Lopez-Casado et al., 2007). These
results indicate that the presence of polysaccharides (in this case, a mixture of cellulose, hemicellulose
and pectin) in the cuticle contribute to the stiffening of this matrix, however the contribution of each
polysaccharide component is difficult to determine. A comprehensive timeline of changes in tomato
cuticle mechanical properties is provided in Espana et al. (2014). Differences between two varieties
(‘Cascada’ and ‘Moneymaker’) were observed from green mature to red ripe growth stages, with both
showing a decrease in viscoelastic strain, whilst elastic strain remained relatively constant. Elastic
modulus of Cascada generally increased throughout development, reaching a maximum at red ripe. It
was noted that the ratio of cutin to polysaccharides in the cuticle decreased over development,
although no further insights into the contribution of polysaccharides to the mechanical properties were
offered.
A survey of the chemical composition and mechanical properties of the cuticle in 27 Japanese
persimmon (Diospyros kaki) cultivars revealed a negative correlation between polysaccharide content
and maximum strain, and a positive correlation between polysaccharide content and elastic modulus
(Tsubaki et al., 2012). This indicates that in Japanese persimmon cuticles, polysaccharides serve to
increase the stiffness, reducing the maximum breaking strain. Although these studies looked broadly at
the effect of cuticle polysaccharide content on cuticle biomechanical properties, the impact of the

97
presence of particular cell wall components (e.g. de-esterified pectin fragments) was not elucidated.
Additionally, the impact of cuticle composition changes on water permeability and pathogen
susceptibility were not investigated.
In the work presented here, it was observed that Chenin Blanc maintains higher levels of de-esterified
pectin in the skin throughout ripening than Shiraz (Figure 4.7D). Varietal differences in expression of
PMEs create differences in the distribution of de-esterified pectin in the skin. Propidium iodide (PI)
stains de-esterified pectin; fresh berry staining with PI was performed to study distribution of de-
esterified pectin. Chenin Blanc showed much higher levels of PI staining in the skin throughout
development; closer examination revealed strong staining in both the epidermal cell walls and the
underlying peripheral vasculature (Figure 4.6). High levels of de-esterified pectin in the berry
vasculature may affect water movement and distribution through the berry, contributing to low shrivel
susceptibility in Chenin Blanc. Indeed, under low calcium conditions, Chenin Blanc exhibited higher
berry transpiration and water uptake rates than basal or high calcium Chenin Blanc, or all treatments of
Shiraz (4.11A, B). Both basal and high calcium grown Chenin Blanc exhibited lower net water flux than
low calcium Chenin Blanc (Figure 4.11C). This may indicate that the higher levels of de-esterified pectin
in Chenin Blanc vasculature affect this variety’s ability to moderate berry water relations; under low
calcium, high berry transpiration and water uptake are observed, when sufficient calcium is present,
berry transpiration and water uptake is reduced.
High resolution TEM of hypodermal cell walls revealed the esterified pectin epitopes were distributed
fairly evenly throughout the primary cell walls. De-esterification of pectin was more highly observed in
the middle lamella and tri-cellular junctions of apples, consistent with the postulated role of pectin
modification in cell-cell adhesion (Roy et al., 1995; Willats et al., 2001).
Previous work has looked at some of the chemical composition changes in berry cell walls during
ripening. Nunan et al. (1998) indicated that berry galacturonan (the main pectin residue) content
increases during ripening, with the level of de-esterification decreasing slightly pre-veraison then
remaining relatively constant thereafter. This work also found that the level of type I arabinogalactan (a
pectic side chain) as a mol % of total cell wall extract decreased from 21% pre-veraison (44 DAA) to 4%
in ripe (114 DAA) berries (Nunan et al., 1998). Comparison of Thompson Seedless and NN107 (a
variety which demonstrates reduced softening) revealed that NN107 had higher levels of
homogalacturonan (including de-esterified homogalacturonan) at late ripening stages, correlated with
higher PME activity (Balic et al., 2014). These results indicate that a range of pectin modifications may
be important in ripening and softening processes.

98
In two apple cultivars, both de-esterified and esterified pectin were localised to the middle lamella (Ng
et al., 2013). A decrease in the molecular weight of chelator soluble pectin in Scifresh was postulated to
be related to the increased cell expansion/larger cell size observed in this cultivar (Ng et al., 2013). In
apples, PME activity has been shown to increase during growth and decrease during ripening. The
firmer variety, Scifresh also exhibited greater cell-cell adhesion and occurrence of esterified pectin in
tricellular junctions. In homogalacturonan with a high degree of esterification, gels can form through
hydrogen bonds and hydrophobic interactions (Braccini et al., 2005). The higher level of PME activity
and pectin de-esterification in Royal Gala may have allowed for greater access to the pectin matrix for
pectin degrading pectin lyases and polygalacturonases. Their action would decrease the amount of
pectin in the walls, resulting in rapid softening.
Studies in grapes demonstrated that the activities of polygalacturonases was inversely correlated to
calcium content; enzyme inhibition was also observed in vitro in the presence of 1 mM calcium
(Cabanne and Doneche, 2001). The mechanism of this inhibition may be direct binding of the enzyme
or binding of homogalacturonan restricting enzyme access to the pectin substrate. In tomatoes, PME
activity in skin tissues has been linked with calcium binding and increased cell-cell adhesion (Hyodo et
al., 2013). Pectin de-esterification in skin and mesocarp tissues increased throughout development.
Total calcium content of alcohol insoluble residue cell wall extracts was much higher in skin tissue than
mesocarp. Skin cell wall calcium content increased throughout development, until decreasing slightly
when overripe. Mesocarp cell wall calcium content remained fairly constant throughout development. It
is clear that a complex relationship exists between pectin, PME activity, calcium availability, and pectin
degrading enzyme activity. The differential tissue localisation of pectin modifying enzymes and calcium
facilitates developmental changes in cell wall properties, cell-cell adhesion, water permeation through
the cell wall and the cuticle, and ostensibly fruit softening.
4.4.2 Effect of calcium on berry softening
Shiraz berry elasticity was shown to increase in all treatments concurrent with veraison; this increase in
berry elasticity was delayed in HCS berries, consistent with the delayed onset of veraison in this
treatment (Figure 4.9A, B, C). Berry deformability increased at veraison in all treatments; a large
subsequent increase in LCS berry deformability was indicative of the early onset of berry shrivel
occurring in these bunches (Figure 4.9D). Skin properties changed throughout development and were
affected by calcium levels. A large increase in skin maximum compressive load was observed at
veraison in BNS and LCS berries, followed by slight reductions in later ripening (Figure 4.9F). In
contrast, HCS showed a gradual increase in skin maximum compressive load, reaching similar

99
elasticity levels to BNS berries at 93 DAA. Both cell wall properties and cell turgor contribute to
biomechanical properties of the berry (Redgwell et al., 1997; Matthews et al., 2009). By utilising two
different test protocols, differences between whole berry and skin properties were elucidated here. The
effect of high calcium upon skin physical properties may further confirm that calcium nutrition affects
cell wall modification and pectin distribution. Potentially, high calcium leads to higher calcium-pectin
cross linking, restricting access of cell wall degrading enzymes, delaying softening related changes in
cell wall architecture, and reducing elasticity and skin maximum compressive load.
One unusual table grape variety (NN107) demonstrates an increase in berry firmness during late
ripening, and shows higher PME activity and calcium content than Thompson Seedless (Balic et al.,
2014). The authors hypothesised that in NN107, PME activity during late ripening stages increases the
prevalence of calcium-pectin crosslinkages, reducing cell wall access of polygalacturonases,
consequently increasing firmness. This is supported by previous work which showed a negative
correlation between calcium content and polygalacturonase activity in Sauvignon Blanc and Semillon
grapes (Cabanne and Doneche, 2001). Tomato fruit with transgenically suppressed expression of
expansin gene Exp1 showed increased firmness during ripening; pectin depolymerisation was
substantially decreased in these fruit (Brummell et al., 1999). The degree of pectin de-esterification and
depolymerisation varies widely between species, as such the role of calcium in softening processes will
also differ (Brummell, 2006).
It has also been shown that some measurements of fruit elasticity or berry firmness can be highly
correlated with cell turgor pressure and berry water relations (Matthews et al., 2009). The impact of
calcium nutrition on berry water relations is discussed below.
4.4.3 Effect of calcium on berry water relations
Hydrostatic gradient from the xylem in the pedicel to the terminal xylem vessels in the berry is required
for effective xylem flow into the berry. It has previously been hypothesised that as the berry develops,
physical disruption of xylem connectivity and/or loss of the hydrostatic gradient into the berry, causes a
reduction, if not cessation, of xylem flow into the berry around the time of veraison (Chatelet et al.,
2008). The results presented here suggest that cell wall modifications in the berry vasculature and
epidermis also impact upon water delivery and distribution in the berry. Higher levels of de-esterified
pectin present in the peripheral vasculature of Chenin Blanc berries may enable formation of pectin
gels when sufficient calcium is present, reducing water distribution to the epidermis and subsequent
water loss through the berry surface. In basal and high calcium treatments, Chenin Blanc demonstrated
100
lower net water loss than the respective treatments in Shiraz (Figure 4.11). In low calcium, Chenin
Blanc demonstrated much higher berry water uptake and berry transpiration rates than basal or high
calcium treatments, however the greater net water loss exhibited in these berries resulted in reduced
berry weight and shrivel at later stages. That this pattern was not followed in Shiraz suggests that both
pectin de-esterification and calcium concentration in the peripheral vasculature play interacting roles in
regulating berry water relations.
It has been shown previously that kiwifruit transpiration rate decreased rapidly from growth stage II,
concurrent with cessation of calcium accumulation (Montanaro et al., 2006). This may suggest that
cumulative fruit transpiration is a very good predictor for calcium accumulation in fruit (Montanaro et al.,
2012). However, changing growth conditions would disrupt this relationship as transpiration is not the
only factor affecting calcium accumulation. For instance, in apricot fruit, bagging of fruit to prevent fruit
transpiration resulted in a 55% reduction in fruit calcium, suggesting that 45% accumulates
independent of transpiration (Montanaro et al., 2010). Modelling of kiwifruit transpiration rates indicated
that transpiration varies diurnally and decreases throughout the growing season; relative humidity, air
temperature, and skin conductance were significant factors, whereas wind speed and light were not
(Montanaro et al., 2012). The model suggests that reducing relative humidity and increasing
temperature in the orchard may result in increased fruit calcium content. Similar work in grapes also
demonstrated diurnal patterns of berry volume increases and water loss, implicating xylem backflows
and surface transpiration as the two sources of water loss from berries (Lang and Thorpe, 1989).
4.4.4 Effect of calcium on cell vitality
Using FDA as a cell vitality stain and analysing staining patterns with ImageJ, FDA staining intensity of
Shiraz berries was observed to decrease at veraison in skin and mesocarp, with high calcium treatment
delaying the drop in staining intensity (Figure 4.7C, E). FDA staining intensity in Chenin Blanc berries
was maintained throughout development (Figure 4.7C, E). FDA staining of fresh berries has been used
previously to determine cell vitality (Krasnow et al., 2008; Tilbrook and Tyerman, 2008). FDA is
membrane permeable, and upon entering the cytoplasm, esterases cleave acetate groups to produce
the membrane impermeable fluorescein, which emits a bright fluorescent signal within the cytoplasm.
For determination of cell vitality this technique relies on the presence of active esterases limited to the
cytoplasm of vital cells and the maintenance of membrane impermeability to fluorescein. Recent work
has indicated that membrane integrity is maintained even during periods of “cell death”, this suggests
that observations of cell death or vitality loss may in fact be due to increases in membrane porosity
(Caravia Bayer et al., 2015). With this in mind, it should be noted that these (and previous)

101
observations of vitality loss using FDA may rather be indicators of increases in plasma membrane
porosity. This technique has indicated that normally developing berries maintain high levels of
mesocarp cell vitality up to commercial harvest dates, whereas shrivelling berries showed a rapid loss
of cell vitality (Krasnow et al., 2008). Varietal differences in cell vitality were observed at a tissue level
between the table grape Thompson Seedless, and the shrivel-susceptible wine grape variety Shiraz
(Tilbrook and Tyerman, 2008). A large varietal survey suggested that there was a high correlation
between levels of cell vitality loss and susceptibility to shrivel (Fuentes et al., 2010). A bilinear model
has been used to describe cell death dynamics (Bonada et al., 2013b). Key factors used were; date of
onset of rapid cell death, rates of cell death before and after onset of rapid cell death. Two
environmental factors were proposed to affect cell death; high temperature can advance the onset of
rapid cell death and the rate of rapid cell death, water stress can increase the rate of rapid cell death
(Bonada et al., 2013a; Bonada et al., 2013b). These relationships were not consistent between
varieties; Chardonnay did not demonstrate a detectable period of rapid cell vitality loss under control
conditions, and although heat treated Chardonnay did demonstrate rapid cell vitality loss there was no
concomitant increase in the rate of shrivel (Bonada et al., 2013b). The lack of a linear relationship
between shrivel and FDA staining in Chardonnay (Bonada et al., 2013b) may indicate that; (a) the FDA
staining intensity methodology used is not a reliable indicator for cell vitality, or (b) berry physiological
factors other than cell vitality are also important for determining potential for berry shrivel.
In Krasnow et al. (2008) assessment of cell viability was calculated as fluorescent area (determined
using a binary threshold and image analysis software) as a percentage of total berry area. Changes in
cell size and membrane permeability are potentially confounding issues in this methodology.
Throughout berry development the permeability of membranes and the relative size of cytosol to
vacuole changes greatly. Both of these factors will affect the intensity of FDA staining in berries. As
such, the resolution of images being analysed and the threshold method for image analysis will
contribute to the determination of “cell vitality”. A more diffuse staining pattern, as apparent in post
veraison mesocarp cells (Figure 4.5), may result in a determination of non-vital tissue. However, this
may occur as a result of increasing membrane permeability during ripening and irregular distribution of
esterases and/or FDA into the apoplast and vacuole, rather than a drop in cell vitality. Furthermore, as
the cells expand rapidly post veraison, the relative contribution of the vacuole to the surface area of cut
berries increases, meaning that cell vitality calculated as a percentage of total surface area may be
skewed by these normal physiological changes. Higher resolution imaging of “non-vital” cells revealed
that FDA staining is still present, albeit more diffuse and with lower intensity than “vital” cells in adjacent
tissues (Figure 4.6). The issues presented here suggest that results of FDA staining and image

102
analysis must be carefully interpreted, and drops in staining intensity are not necessarily representative
of drops in cell vitality.
The counter-stain (propidium iodide) used to confirm cell vitality loss in Tilbrook and Tyerman (2008)
stains both DNA and cell walls. As PI exhibits a fluorescence shift upon DNA binding, specific
microscope filter setups can help distinguish staining of these two components. Predominantly cell wall
staining of PI was observed by Krasnow et al. (2008), and as such PI was subsequently discounted as
a useful vitality stain using their methodology. The imaging setup used in the work presented in this
chapter (see Chapter 4.2.4 for details) captured PI staining of the cell wall with minimal interference
from DNA binding (Figure 4.6). This was determined by the absence of the punctate pattern typical of
nuclear DNA staining.
Electrical impedance spectroscopy has been used to model relative contributions of various
components of plant tissue to water and ionic relations of that tissue (Ando et al., 2014; Caravia Bayer
et al., 2015). The application of this technique to grapes allows for estimation of the resistance to
electrical current offered by extracellular and intracellular pathways, as well as the cellular membrane
capacitance. This methodology utilises modelling of reactance (i.e. changes in impedance as a function
of changes in frequency), as it relates to the preferential passage of high frequency currents through
cellular membranes (intracellular) and the passage of low frequency currents through the apoplast
(extracellular). Chenin Blanc demonstrated higher extracellular resistance in all treatments than Shiraz.
The structure and composition of the extracellular space (such as cell wall thickness, hydration of the
cell wall, and ionic composition) determine extracellular resistance. Potentially, formation of pectin gels
with low hydration in Chenin Blanc may be responsible for the observed difference. Additionally, Shiraz
may exhibit ion leakage from cells, increasing the solute content of the apoplast and decreasing the
resistance. This is supported by the observation that Chenin Blanc had significantly higher cellular
membrane capacitance (Cm; an indicator of membrane integrity) than Shiraz, however no significant
differences were found between treatments in this component (Figure 4.8C). Differences in Cm may be
due to differences in berry size (measured as distance between electrodes) however no correlation was
found between these two variables (Appendix 7). Differences in cell size may contribute to Cm
differences; berries with smaller cells would contain proportionally more membrane in the electrical path
than similarly sized berries with larger cells. Looking more closely at cell and tissue morphology may
help to determine the cause of these differences.

103
4.4.5 Effect of calcium on Botrytis cinerea susceptibility
The cell wall forms a significant barrier to pathogens. Many pathogens secrete cell wall degrading
enzymes to aid infection; as such the composition of fruit cell walls is important in determining pathogen
susceptibility (Lionetti et al., 2012). In the final part of this study, the impact of calcium nutrition on
Chenin Blanc berry susceptibility to the fungal pathogen Botrytis cinerea was examined. The results
demonstrated that low calcium growth led to increased spread of Botrytis cinerea infection (Figure
4.12). Most previous studies have focused on the effect of external calcium applications upon fruit
Botrytis cinerea susceptibility, and this is believed to be the first study demonstrating increased
susceptibility associated with reduced calcium nutrition.
Calcium applications to bunches at pre- and post-veraison phases were found to decrease occurrence
of Botrytis cinerea post-harvest, also increasing berry firmness (Ciccarese et al., 2013). The pre-
veraison treatments were found to be particularly effective; much lower levels of calcium accumulation
(and uptake from sprays) were observed after veraison. Infiltration of grapes with calcium prior to
Botrytis cinerea infection assays did not affect levels of infection, however changes in pectin
fractionation suggest that there is an underlying impact on the progression of the infection (Chardonnet
et al., 1997). Calcium pre-treatment reduced levels of water soluble pectin and chelator soluble (i.e.
calcium bound) pectin whilst increasing levels of acid soluble pectin in Botrytis cinerea infected berries
compared to uninfected controls (Chardonnet et al., 1997). This suggests that calcium cross-linkage of
pectin serves to protect long chain water insoluble pectins from enzymatic degradation, resulting in
preservation of the cell wall integrity, and reduced formation of water soluble and weakly bound short
chain chelator soluble pectins. It should also be noted that the levels of both water soluble and chelator
soluble pectin fractions were higher in both calcium treated and untreated infected berries than they
were in calcium treated and untreated uninfected berries.
Pectin has two modes of plant protection; (1) esterified pectin forms a barrier to pathogen degradation,
and (2) short soluble fragments of de-esterified pectin (oligogalacturonides; often released by pathogen
enzymatic action) elicit plant defence responses. De-esterified pectin is more susceptible to
degradation by pathogen enzymes (Lionetti et al., 2012). As such, some research has focused on
blocking the action of pathogen enzymes by expression of inhibitors; overexpression of pectin methyl
esterase inhibitors in Arabidopsis increased resistance to Botrytis cinerea (Lionetti et al., 2007),
constitutive expression of a polygalacturonase inhibiting protein (VvPGIP1) in tobacco increased
resistance to Botrytis cinerea (Nguema-Ona et al., 2013). Some research has suggested that perturbed
cell wall modelling processes can produce oligogalacturonides that constitutively activate plant defence

104
responses, priming them against pathogen attack (Curvers et al., 2010). In this study, the increased
rate of Botrytis cinerea infection progress in low calcium grown fruit may be attributable to the low level
of calcium crosslinkages, allowing increased accessibility of the pectin matrix to cell wall degrading
enzymes, offering less resistance to pathogen infection.
4.5 Conclusion
Distribution of pectin within the cell wall varies with a number of factors. Calcium nutrition has a
multitude of effects on cell wall biology in fruit development. Through cross-linking of de-esterified
pectins, calcium can affect the degradation and distribution of pectins. High calcium nutrition resulted in
retention of de-esterified pectin within the primary cell wall of outer epidermal cells. Low calcium
nutrition resulted in higher net water loss from berries and distribution of solubilised de-esterified pectin
into the berry cuticle. The role of pectin gel formation in xylem vessels is also discussed; levels of
pectin de-esterification in berry peripheral vasculature are higher in Chenin Blanc than in Shiraz. This
suggests that Chenin Blanc may exert greater control over water transport in the berry during ripening,
explaining its low susceptibility to berry shrivel. The formation of calcium crosslinked pectin gels in
xylem vessels may also explain the differences in berry transpiration and water uptake rates observed
under different calcium growth regimes. Use of fresh berry staining techniques revealed PI as a useful
tool for studying de-esterified pectin distribution, and highlighted some reliability issues with FDA as a
quantifiable cell vitality stain. The role of calcium in pathogen susceptibility was also investigated; low
calcium nutrition led to higher Botrytis cinerea susceptibility, due to increased pathogen degradation of
the pectin matrix. This study has highlighted the importance of understanding pectin-calcium
interactions and their impact upon grape berry development and physiology.
105
Chapter 5 General Discussion and Conclusion
5.1 Grapevine calcium nutrition
Calcium is a plant macronutrient with a variety of important roles in plant physiology. The impact of
calcium nutrition upon grapevines is poorly understood, soil calcium availability is not often obviously
limiting or detrimental to plant growth. However, identification of sub optimal calcium nutrition as a key
factor in several fruit disorders (e.g. blossom end rot in tomatoes and bitter pit in apples) suggests that
a better understanding of calcium nutrition in grapevines may allow for improved horticultural practices
and fruit quality outcomes in wine and table grape production. The aims of this thesis were to examine
the effect of variety on calcium uptake and to study the response of vines to different calcium supply
levels. Differences in calcium accumulation and response to high calcium soils were examined in
several varieties. As grapevines do not usually show obvious signs of calcium toxicity or deficiency in
vineyard soils, it was also necessary to perturb normal calcium nutrition to elicit physiological responses
that elucidate the impact of calcium on vine growth.
Varietal differences in berry calcium uptake and distribution, cell morphology, cell wall composition, and
biomechanical properties were investigated at two sites purportedly differing in calcium availability.
Chenin Blanc demonstrated relatively high levels of calcium in apoplastic fluid (Figure 2.4). Analysis of
berry skin, mesocarp, and apoplast fluid composition revealed higher concentration of calcium in
samples from the Barossa site than from the Waite site. Differences between varieties were observed in
their response to different growing conditions. Grenache demonstrated a significant difference between
sites in skin calcium concentration, but not in mesocarp calcium concentration, suggesting that this
variety has low site sensitivity with regards to calcium uptake, or a high capacity for translocation of
calcium to the skin. Shiraz was the only variety surveyed that demonstrated any significant difference
between sites in apoplastic pH and apoplastic Ca2+ activity, Waite berries had higher apoplast pH and
lower apoplast Ca2+ activity than Barossa berries (Table 2.2). A negative correlation between apoplast
pH and apoplast Ca2+ availability was also demonstrated across the full dataset. Availability of calcium
in the cell wall determines the level of cross linking that occurs between adjacent chains of de-esterified
pectin (Figure 2.5). Differences between varieties in basic cell wall morphology, as well as patterns of
de-esterified pectin distribution within the cell wall, were observed (Figure 2.1 and 2.2). Punctate pectin
de-esterification in the middle lamella of Grenache and Thompson Seedless may indicate the location
of plasmodesmatal pit fields, where pectin crosslinkages are important for cell-cell adhesion in these
varieties. Chenin Blanc demonstrated high levels of de-esterified pectin in the epidermis and peripheral

106
vasculature of the berry (Figure 4.6 and 4.7), possibly contributing to this varieties low shrivel
susceptibility.
A hydroponics system was designed to subject fruiting cuttings of grapevines to abnormally high and
low levels of calcium nutrition. The impact of these treatments upon vine physiology and development
were examined. Deficit calcium supply in Chenin Blanc increased net assimilation rate and stomatal
conductance (Figure 3.7). It was also observed to accelerate berry ripening in Shiraz through changes
in cell wall modification and berry water relations. This resulted in an early onset of berry weight loss
and berry shrivel (Figure 3.1). Under an approximation of a commercial harvest schedule (i.e. at ~114
DAA) this level of calcium nutrition would result in very low yields, high sugars, and poor fruit quality
due to extensive shrivel (Figure 3.5). Low calcium supply affects the physical properties of berries;
when compared to berries at the same stage of development grown under basal calcium conditions low
calcium berries showed higher deformability and elasticity (Figure 3.6). Whilst the low calcium treatment
and the hydroponics system used in these experiments may not be directly applicable to field
conditions, these results do serve to further our understanding of the impact of reduced or deficit
calcium nutrition on vine function and berry development.
Elevated calcium supply in Chenin Blanc reduced vine transpiration rate, net assimilation rate, stomatal
conductance, and sub-stomatal CO2 (Figure 3.7). Berry ripening in high calcium grown Shiraz vines
was delayed and asynchronous; high calcium bunches showed, on average, later veraison date
occurrence, as well as a wider range of occurrence dates (Figure 3.2). High calcium bunches had lower
bunch weights (Figure 3.4), smaller berries, and lower TSS (Figure 3.1). Interestingly, when harvested
at 114 DAA, these bunches demonstrated a wide variety of berry class occurrence; both pre-veraison
green berries and overripe shrivelling berries were prevalent in these bunches (Figure 3.5). Petiole
nutrient analysis revealed that the high calcium treatment did indeed increase calcium uptake. Chloride
content was also increased and this is a potentially confounding issue; some of the effects were similar
to that observed when grapevines are grown under saline conditions (Hawker and Walker, 1978).
Both the field and controlled environment approaches used in this study have their drawbacks and
limitations. Whilst the field-based study was an important starting point for understanding the varietal
diversity in grapevine calcium relations, it is also difficult to make strong conclusions where many
environmental variables may have an influence, particularly when comparing different sites. The
reductionist approach using hydroponics, fruiting cuttings and glasshouse growth allowed for
elimination of some of these variables and elucidation of the physiological responses of the grapevine
to calcium nutrition. It is important to note that the responses of established, field grown vines to similar

107
treatments may differ. However, these results do provide an understanding of underlying physiology
around which viticultural practices modifying calcium nutrition for optimal vine health and grape quality
may be developed.
5.2 Berry calcium physiology
The importance of calcium in normal plant nutrition and development has been established. Substantial
evidence is presented here that calcium plays crucial and complex roles in fruit physiology through its
influence on fruit water relations, cell wall modification and phytohormonal signalling.
Low calcium growth resulted in changes in levels of pectin modification and distribution of de-esterified
pectin in Shiraz and Chenin Blanc. Higher levels of de-esterified pectin were observed in the cuticles of
low calcium grown fruit (Chapter 4.3.1). These fruit also exhibited a higher berry transpiration rate
(Chapter 4.3.5). Due to the lower availability of calcium in the apoplast of low calcium grown fruit, lower
levels of pectin-calcium crosslinkage are believed to arise, resulting in greater access to the cell wall
structure for pectin solubilising polygalacturonases and pectate lyases. Additionally, reduced formation
of calcium cross-linked pectin gels in xylem vessel pit membranes increases berry transpiration. These
effects combine to produce berries with a high deformability and susceptibility to berry shrivel (Chapter
4.3.4).
High calcium grown Shiraz did not demonstrate occurrence of any de-esterified pectin in the cuticle,
indicating that the high levels of available calcium in the cell wall effectively cross-linked de-esterified
pectins and limited the activity of polygalacturonases and pectate lyases. The effect of calcium on cell
wall properties was also supported by results of biomechanical tests; high calcium berries
demonstrated later increases in berry elasticity and skin strength relative to basal and low calcium
grown berries. High calcium grown berries also had reduced berry transpiration, supporting the role of
calcium in xylem vessel gel formation for moderation of water relations (Chapter 4.3.5).
5.3 Implications of calcium nutrition for fruit quality
Understanding the role of calcium in fruit development helps to address ripening disorders (e.g. berry
shrivel in Shiraz grapes), tissue localised calcium deficiencies (e.g. blossom end rot in tomatoes, bitter

108
pit in apples), and pathogen susceptibilities (e.g. Botrytis cinerea). Improved understanding of the
calcium nutritional requirements of plants may also aid in optimising fruit quality outcomes.
Emerging evidence suggests that the cell wall composition of intervessel pit membranes in the xylem
play an important role in determining fruit water relations and resistance to plant vascular diseases. Ion
binding changes the properties of pectic gels at the pit membranes, forming an important regulatory
point for xylem hydraulic conductance. Evidence for this hypothesis has been reviewed in van Doorn et
al. (2011) and Nardini et al. (2011). Potassium and sodium ions affect the hydration status of the gel
through their interactions with negatively charged pectin carboxyl residues, resulting in gel shrinkage
(and transition to an amorphous solid), increasing the pore size of pit membranes and hydraulic
conductance of the xylem (Nardini et al., 2011). This effect is often decreased or suppressed by the
presence of the divalent cation calcium, presumably due to crosslinking of pectins resulting in gel
formation (Nardini et al., 2007; Cochard et al., 2010). Grapevine genotype differences in pit membrane
polysaccharide composition affect susceptibility to Pierce’s disease. The pathogen responsible for
Pierce’s disease (Xylella fastidiosa) spreads through the vascular system of the grapevine, secreting
polygalacturonases and endoglucanases to degrade the cell walls of pit membranes. Resistant
varieties showed high levels of esterified homogalacturonan (Sun et al., 2011). Esterified
homogalacturonan is more resistant to PG degradation, forming a barrier at the pit membrane to the
spread of the pathogen. These effects demonstrate the importance of cell wall composition and calcium
distribution for plant water relations and pathogen resistance.
Calcium accumulation in tomato fruit has been shown to be dependent on rates of xylem sap flow,
influenced by transpiration and growth rates (Ho et al., 1993; de Freitas et al., 2014). The strength of
other calcium sinks in the plant can affect calcium accumulation in the tomato, and lead to calcium
related physiological disorders such as blossom end rot (Ho and White, 2005). ABA treatment of whole
plants reduces transpiration, root water uptake and calcium uptake into the leaves, whilst increasing
stem water potential (de Freitas et al., 2014). This may be due to continuation of photosynthesis and
phloem mediated solute accumulation. This continued solute accumulation could decrease the fruit
apoplastic solute potential and fruit total water potential, enabling increased xylem flows into the fruit
from the stem and accumulation of xylem-mobile solutes such as calcium (de Freitas et al., 2014).
An ABA deficient tomato mutant (sitiens; which exhibits Botrytis cinerea resistance) exhibit a lower
degree of epidermal cell wall pectin de-esterification, reduced cuticle thickness, and increased cuticle
permeability, when compared to wild type (Asselbergh et al., 2007; Curvers et al., 2010). The
consequent reduction in Botrytis cinerea susceptibility of sitiens may be as a result of; (a) plant

109
detection of defective cuticle, prompting constitutive expression of chitinases and beta-glucosidases
into the cell wall, enabling rapid release of fungal elicitors upon infection, and/or (b) a lower level of de-
esterification in sitiens cell walls providing a source of more bio-active oligogalacturonide (OGA)
elicitors upon infection; thereby producing a more rapid and effective response to pathogen attack
(Curvers et al., 2010). The level of esterification in OGAs is one of several factors that determine their
activity and specificity in triggering plant responses; it has been shown that the level of de-esterification
in strawberry OGAs contributes to their capacity to elicit defence responses (Osorio et al., 2008).
Although the exact mechanism of Botrytis cinerea resistance in sitiens is unknown, it is clear that the
interaction between epidermal cell wall derived pectins and the cuticle, either as defence signalling
oligogalacturonides or as structural components, is important. In addition to the processes controlling
deposition of cutin into the cuticle, processes affecting polysaccharide solubilisation and movement into
the cuticle, such as pectin de-esterification and calcium crosslinking, will modify fruit mechanical
properties and pathogen susceptibility.
GA treatment of tomatoes leads to increased occurrence of blossom end rot while treatment with GA
biosynthesis inhibitor prohexadione-calcium eliminated blossom end rot (de Freitas et al., 2012). GA
treated tomatoes showed increased expression of CAX and Ca-ATPase genes and reduced apoplastic
Ca2+, whereas GA inhibitor treated fruit showed higher pericarp calcium levels and an increased
number of functional fruit xylem vessels (de Freitas et al., 2012). GA-induced expression of CAX and
Ca-ATPase genes results in depletion of the apoplastic calcium pool, possibly below the critical
concentration required for membrane stabilisation and moderation of cell expansion through pectin-
Ca2+ crosslinks in the cell wall. In addition to the localised drop in calcium concentration, rapidly
expanding tissue (such as the blossom end of tomatoes) may further impede normal fruit calcium
distribution due to cellular intrusions causing obstruction or breakage of xylem vessels (Drazeta et al.,
2004; de Freitas et al., 2012). Apogee-treated fruit showed increased numbers of functional xylem
vessels; the impact of GA on xylem differentiation and development modifies normal pathways for
calcium distribution (Saure, 2005). Additionally, GA triggers increased cuticle deposition (Knoche and
Peschel, 2007), potentially modifying fruit water relations and calcium uptake. All of these factors
provide possible linkages between GA responses and changes in calcium localisation leading to
blossom end rot.
The apple industry has significant interest in increasing fruit sugar content and post-harvest shelf life;
applications of exogenous calcium have been proposed as one way to achieve this. However, the
relationship between calcium and sugar accumulation is complex and many factors appear to affect the

110
effectiveness of this strategy including soil calcium availability, timing of spray/application, apple variety,
tree calcium status and in planta interactions with other ions (e.g. boron) (Lu et al., 2013).
Levels of apple tree shading also have a complex effect, with conflicting reports as to whether fruit
calcium uptake is increased or decreased with shading (Chen et al., 1997; de Freitas et al., 2013).
Calcium accumulation is also reduced by progressive breakdown of xylem connectivity as the result of
growth related damage, potentially increasing occurrence of bitter pit disorder (Drazeta et al., 2004). In
contrast, dye studies in post-veraison grapes indicate that xylem not only remains relatively intact, but
also continues to develop and mature (Chatelet et al., 2008).
Melons suffer from a water-soaking condition that has been linked to calcium deficiency. It has been
hypothesised that depletion of apoplastic calcium supply can lead to insufficient pectin crosslinks in the
middle lamella of the mesocarp, resulting in water-soaked tissue (Madrid et al., 2004; Nishizawa et al.,
2004). It is also suggested that in climacteric fruits, depletion of unbound calcium may, through
secondary signalling mechanisms, lead to increased ethylene production, promoting ripening
mechanisms, however water-soaking appears to develop in calcium deficient conditions regardless of
ethylene status (Nishizawa et al., 2004).
5.4 Future perspectives and Conclusion
The delayed and asynchronous bunch development observed in high calcium grown vines suggests
that the calcium treatment disrupted several aspects of vine physiology. By studying the levels of
hormone accumulation and expression patterns of ripening pathway components (especially calcium
binding proteins) around ripening, the trigger for ripening initiation in these bunches could be
elucidated. It is possible that calcium transduction of hormonal developmental signals for ripening
initiation is perturbed. ABA levels in high calcium bunches may differ between berries. Alternatively, the
high calcium levels and pectin gel formation in xylem vessels may selectively limit vascular flows within
the bunch, resulting in reduced and variable rates of water uptake, reduced berry size, and delayed
ripening.
This study has uncovered high and low calcium levels at which physiological deficiency and toxicity
traits can be observed. Re-formulation of hydroponics solutions to achieve these effects whilst
moderating unwanted effects of other ion imbalances may allow for a clearer observation of the
individual effect of calcium. This is particularly relevant in the high calcium solution, where the necessity
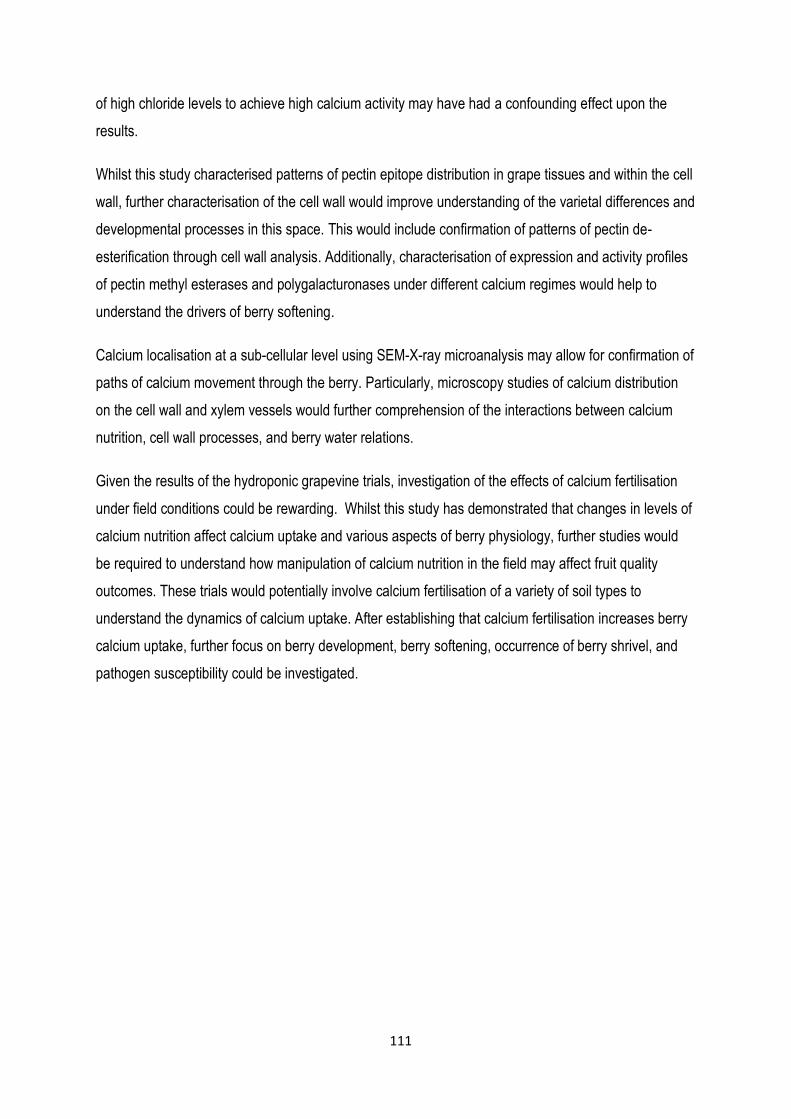
111
of high chloride levels to achieve high calcium activity may have had a confounding effect upon the
results.
Whilst this study characterised patterns of pectin epitope distribution in grape tissues and within the cell
wall, further characterisation of the cell wall would improve understanding of the varietal differences and
developmental processes in this space. This would include confirmation of patterns of pectin de-
esterification through cell wall analysis. Additionally, characterisation of expression and activity profiles
of pectin methyl esterases and polygalacturonases under different calcium regimes would help to
understand the drivers of berry softening.
Calcium localisation at a sub-cellular level using SEM-X-ray microanalysis may allow for confirmation of
paths of calcium movement through the berry. Particularly, microscopy studies of calcium distribution
on the cell wall and xylem vessels would further comprehension of the interactions between calcium
nutrition, cell wall processes, and berry water relations.
Given the results of the hydroponic grapevine trials, investigation of the effects of calcium fertilisation
under field conditions could be rewarding. Whilst this study has demonstrated that changes in levels of
calcium nutrition affect calcium uptake and various aspects of berry physiology, further studies would
be required to understand how manipulation of calcium nutrition in the field may affect fruit quality
outcomes. These trials would potentially involve calcium fertilisation of a variety of soil types to
understand the dynamics of calcium uptake. After establishing that calcium fertilisation increases berry
calcium uptake, further focus on berry development, berry softening, occurrence of berry shrivel, and
pathogen susceptibility could be investigated.

112
Appendices
Appendix 1
Example stress-strain curve of berry hardness test from Instron materials testing machine. Slope of
regression line over linear portion prior to break used to calculate berry Young’s Modulus according to
the formula presented in Chapter 2.2.5.
y = 3.8495x - 19.504 R² = 0.9975
1
2
3
4
5
6
7
8
0 1 2 3 4 5 6 7 8
Stre
ss (
N)
Strain (mm)
Instron raw data
Linear portion

113
Appendix 2
Standard background [Ca2+] mM [Ca2+] M pCa (-LOG([Ca2+]) mV
H2O 100 0.1 1 47
10 0.01 2 14.2
5 0.005 2.30103 9.6
1 0.001 3 -6.5
0.25 0.00025 3.60206 -20
0 0 -59.6
Artificial grape juice (AGJ)
5 0.005 2.30103 1
4 0.004 2.39794 -3.2
3 0.003 2.522879 -8.1
2 0.002 2.69897 -15
1 0.001 3 -22.2
0.5 0.0005 3.30103 -28.4
0.25 0.00025 3.60206 -37.8
0 0 -62
Calcium selective electrode calibration with CaCl2 in H2O and CaCl2 in artificial grape juice (AGJ) (A)
and calibration curves (B) as outlined in Chapter 2.2.9.
y = -0.0345x + 2.2719 R² = 0.9875
0
0.5
1
1.5
2
2.5
3
3.5
4
-60 -40 -20 0 20 40 60
pC
a
mV
CaCl2
AGJ
Linear (AGJ)
B
A

114
Appendix 3

115

Baby, T., Hocking, B., Tyerman, S.D., Gilliham, M. and Collins, C. (2014) Modified Method for Producing Grapevine Plants in Controlled Environments. American Journal of Enology and Viticulture, v. 65 (2), pp. 261-267, June 2014
NOTE: This publication is included in the print copy of the thesis
held in the University of Adelaide Library.
It is also available online to authorised users at:
http://dx.doi.org/10.5344/ajev.2014.13121

123
Appendix 4
Grapevine Basal Nutrient Solution (BNS)
Macronutrients MW
g added to make 75L sol. Final conc (mM)
NH4NO3 80
6 1
KNO3 101.1
10.6155 1.4
KCl 74.55
8.386875 1.5
Ca(NO3)2•4H20 236.1
38.94 2.2
MgSO4•7H20 246.5
18.4875 1
KH2PO4 136.1
4.083 0.4
NaCl 58.44
8.766 2
NaOH TO pH 5.6 0 0.05
Micronutrients MW g added to make 1L stock mL stock added to make 75L sol. Final conc (uM)
NaFe(III)EDTA 367.1 96.6 9.375 35
H3BO3 61.8 9.27 9.375 20
MnCl2•4H20 197.9 7.425 9.375 5
ZnSO4•7H20 287.5 25.875 9.375 12
CuSO4•5H20 249.7 2.25 9.375 1.2
Na2MoO3 242 0.18375 9.375 0.1
Final Conc of ion mM Activity (mM) Final Conc of ion mM
K 3.3 2.8815 Fe-EDTA-2 0.035
Ca 2.2 1.2108 Mn 0.005
Mg 1 0.582 Zn 0.012
NH4 1 0.87611 Cu 0.0012
Cl 3.51 3.0692 Mo 0.0001
NO3 6.8 5.9545
SO4 1.013 0.48568
H2PO4- 0.4 0.3177
Na 2.085 1.8264
Grapevine Low Calcium Nutrient Solution (LCS)
Macronutrients MW
g added to make 75L sol. Final conc (mM)
NH4NO3 80
6 1
KNO3 101.1
22.7475 3
CaCl2 147
3.3078285 0.3
MgSO4•7H20 246.5
14.79 0.8
KH2PO4 136.1
3.572625 0.35
Mg(NO3)2.6H20 256.4
5.769225 0.3
HNO3 1M solution nitric acid 150mL 2
NaOH TO pH 5.6 0 1.91
Micronutrients MW g added to make 1L stock mL stock added to make 75L sol. Final conc (uM)
NaFe(III)EDTA 367.1 96.6 9.375 35
H3BO3 61.8 9.27 9.375 20
MnCl2•4H20 197.9 7.425 9.375 5
ZnSO4•7H20 287.5 25.875 9.375 12
CuSO4•5H20 249.7 2.25 9.375 1.2
Na2MoO3 242 0.18375 9.375 0.1
Final Conc of ion mM Activity (mM) Final Conc of ion mM
K 3.35 2.985 Fe 0.035
Ca 0.3 0.178 Mn 0.005
Mg 1.1 0.674 Zn 0.012
NH4 1 0.893 Cu 0.0012
Cl 0.61 0.545 Mo 0.0001
NO3 6.6 5.908
SO4 0.813 0.465
H2PO4- 0.35 0.292
Na 1.945 1.737

124
High Calcium Nutrient Solution (HCS)
Macronutrients MW
g added to make 75L sol. Final conc (mM)
CaCl2 147
88.20876 8
Ca(NO3)2•4H20 236.1
70.83 4
MgSO4•7H20 246.5
14.79 0.8
KH2PO4 136.1
37.76775 3.7
NH4Cl 53.49
4.01175 1
CaSO4.2H20 172.2
12.91275 1
MgCl2.6H2O 203.3
12.198 0.8
NaCl 58.44
8.766 2
NaOH pH5.6
0 0.435
Micronutrients MW g added to make 1L stock mL stock added to make 75L sol. Final conc (uM)
NaFe(III)EDTA 367.1 96.6 9.375 35
H3BO3 61.8 9.27 9.375 20
MnCl2•4H20 197.9 7.425 9.375 5
ZnSO4•7H20 287.5 25.875 9.375 12
CuSO4•5H20 249.7 2.25 9.375 1.2
Na2MoO3 242 0.18375 9.375 0.1
Final Conc of ion mM Activity (mM) Final Conc of ion mM
K 3.7 3.0592 Fe 0.035
Ca 13 3.1407 Mn 0.005
Mg 1.6 0.72438 Zn 0.012
NH4 1 0.8337 Cu 0.0012
Cl 20.61 17.08 Mo 0.0001
NO3 8 6.6354
SO4 1.813 0.62319
H2PO4- 3.7 0.079511
Na 2.521 2.0907

125
Appendix 5
//This macro is designed for quantifying staining levels of Propidium Iodide (PI) and Fluorescein di-acetate (FDA) in grapes. //Cam Edit - Store the name of the original image in nameStore variable and the path into dirStore nameStore=getTitle; dirStore=getInfo("image.directory"); //Cam Edit - Store file separator in fs variable to make code cross platform (PC/Mac/Linux) complatible for file saving operations fs=File.separator; //waitForUser("Select BERRY image"); run("Properties...", "channels=1 slices=1 frames=1 unit=mm pixel_width=0.0131579 pixel_height=0.0131579 voxel_depth=0.0131579 frame=[0 sec] origin=0,0"); run("Set Measurements...", "area mean standard min area_fraction limit display redirect=None decimal=3"); rename("Berry"); setTool("polygon"); waitForUser("Select seed 1 for exclusion"); run("Fit Spline"); run("Create Mask"); selectWindow("Mask"); rename("Seed 1"); selectWindow("Berry"); run("Select None"); waitForUser("Select seed 2 for exclusion"); run("Fit Spline"); run("Create Mask"); selectWindow("Mask"); rename("Seed 2"); imageCalculator("Add create", "Seed 1", "Seed 2"); selectWindow("Result of Seed 1"); rename("Seeds"); run("8-bit"); //cam edit - close seed 1 and seed 2 images selectWindow("Seed 1"); close(); selectWindow("Seed 2"); close(); selectWindow("Berry"); run("Select None"); run("Duplicate...", "title=[Split]"); selectWindow("Berry"); run("8-bit"); run("Gaussian Blur...", "sigma=8"); setAutoThreshold("Default dark"); run("Threshold..."); setThreshold(6, 255); selectWindow("Berry"); selectWindow("Threshold"); waitForUser("Select BERRY threshold. Range 1-12."); //setOption("BlackBackground", true); run("Convert to Mask");

126
run("Fill Holes"); run("Analyze Particles...", "size=50-Infinity circularity=0.00-1.00 show=Masks"); rename("BerryArea"); //cam edit - invert LUT to stop binary being made backwards run("Invert LUT"); setThreshold(1,255); run("Measure"); resetThreshold(); run("Duplicate...", "title=[Erode]"); run("Options...", "iterations=30 count=1 black edm=Overwrite do=Erode"); imageCalculator("Subtract create", "BerryArea","Erode"); selectWindow("Result of BerryArea"); rename("SkinArea"); //setOption("BlackBackground", true); setThreshold(1,255); run("Measure"); resetThreshold(); selectWindow("BerryArea"); imageCalculator("Subtract create", "BerryArea", "Seeds"); selectWindow("Result of BerryArea"); rename("BerryNoSeeds"); setThreshold(1,255); run("Measure"); resetThreshold(); selectWindow("Split"); run("Split Channels"); selectWindow("Split (green)"); run("Profile Plot Options...", "width=450 height=200 minimum=0 maximum=0 auto-close vertical list"); makeRectangle(0, 0, 50, 400); waitForUser("Select berry transect"); run("Plot Profile"); selectWindow("Plot Values"); //Cam Edit - save plot profiles to excel files based on orignal name with suffix of FDA or PI added saveAs("Text", dirStore+fs+nameStore+" - FDA Profile.xls"); selectWindow("Plot Values"); run("Close"); selectWindow("Split (red)"); run("Restore Selection"); run("Plot Profile"); selectWindow("Plot Values"); saveAs("Text", dirStore+fs+nameStore+" - PI Profile.xls"); selectWindow("Plot Values"); run("Close"); selectWindow("Split (blue)"); close(); selectWindow("Split (red)"); run("Select None"); run("Duplicate...", "title=[PI]"); run("8-bit");

127
setAutoThreshold("Default dark"); run("Threshold..."); selectWindow("PI"); setThreshold(20,255); selectWindow("Threshold"); waitForUser("Select PI threshold. Range 6-24."); run("Convert to Mask"); imageCalculator("AND create", "PI","BerryNoSeeds"); selectWindow("Result of PI"); rename("BerryPI"); //setOption("BlackBackground", true); //run("Convert to Mask"); setThreshold(1,255); run("Measure"); resetThreshold(); imageCalculator("AND create", "SkinArea","PI"); selectWindow("Result of SkinArea"); rename("SkinPI"); //setOption("BlackBackground", true); setThreshold(1,255); run("Measure"); resetThreshold(); selectWindow("Split (green)"); run("Select None"); run("Duplicate...", "title=[FDA]"); run("8-bit"); setAutoThreshold("Default dark"); run("Threshold..."); selectWindow("FDA"); setThreshold(8,255); selectWindow("Threshold"); waitForUser("Select FDA threshold. Range 6-12."); run("Convert to Mask"); imageCalculator("AND create", "FDA", "BerryNoSeeds"); selectWindow("Result of FDA"); rename("BerryFDA"); //setOption("BlackBackground", true); //run("Convert to Mask"); setThreshold(1,255); run("Measure"); resetThreshold(); imageCalculator("AND create", "SkinArea","FDA"); selectWindow("Result of SkinArea"); rename("SkinFDA"); //setOption("BlackBackground", true); //run("Convert to Mask"); setThreshold(1,255); run("Measure"); resetThreshold(); imageCalculator("AND create", "BerryFDA","BerryPI"); selectWindow("Result of BerryFDA"); rename("BerryCo-stain"); //setOption("BlackBackground", true); //run("Convert to Mask"); setThreshold(1,255); run("Measure");

128
resetThreshold(); imageCalculator("AND create", "SkinFDA","SkinPI"); selectWindow("Result of SkinFDA"); rename("SkinCo-stain"); //setOption("BlackBackground", true); //run("Convert to Mask"); setThreshold(1,255); run("Measure"); resetThreshold(); //Cam Edit - save are information to excel files based on original name with suffix of FDA or PI added run("Close All"); selectWindow("Results"); saveAs("Text", dirStore+fs+nameStore+" - Area Info.xls"); selectWindow("Results"); run("Close");

129
Appendix 6
Appendix 6.1 TEM images of Shiraz and Chenin Blanc berry epidermal and hypodermal tissue grown
under low, basal, and high calcium conditions at 100 DAA immunogold labelled with LM19. LM19 binds
de-esterified pectin with immunogold labelling present as small black dots. Due to print resolution
limitations, viewing of staining patterns on a monitor may be preferable. Shiraz (A-F) and Chenin Blanc
(G-L) demonstrate differences in labelling pattern between epidermal (A-C, G-I) and hypodermal (D-F,
J-L) tissue when grown in LCS (A, D, G, J), BNS (B, E, H, K), and HCS (C, F, I, L). cu indicates cuticle.
p indicates primary cell wall. m indicates middle lamella. Multiple berries (at least 3) were examined for
each treatment. Representative images are shown. Scale bars represent 2 µm.

130
Appendix 6.2 TEM images of Shiraz and Chenin Blanc berry epidermal and hypodermal tissue grown
under low, basal, and high calcium conditions at 100 DAA immunogold labelled with LM20. LM20 binds
esterified pectin with immunogold labelling present as small black dots. Due to print resolution
limitations, viewing of staining patterns on a monitor may be preferable. Shiraz (A-F) and Chenin Blanc
(G-L) demonstrate differences in labelling pattern between epidermal (A-C, G-I) and hypodermal (D-F,
J-L) tissue when grown in LCS (A, D, G, J), BNS (B, E, H, K), and HCS (C, F, I, L). cu indicates cuticle.
p indicates primary cell wall. m indicates middle lamella. Multiple berries (at least 3) were examined for
each treatment. Representative images are shown. Scale bars represent 2 µm.
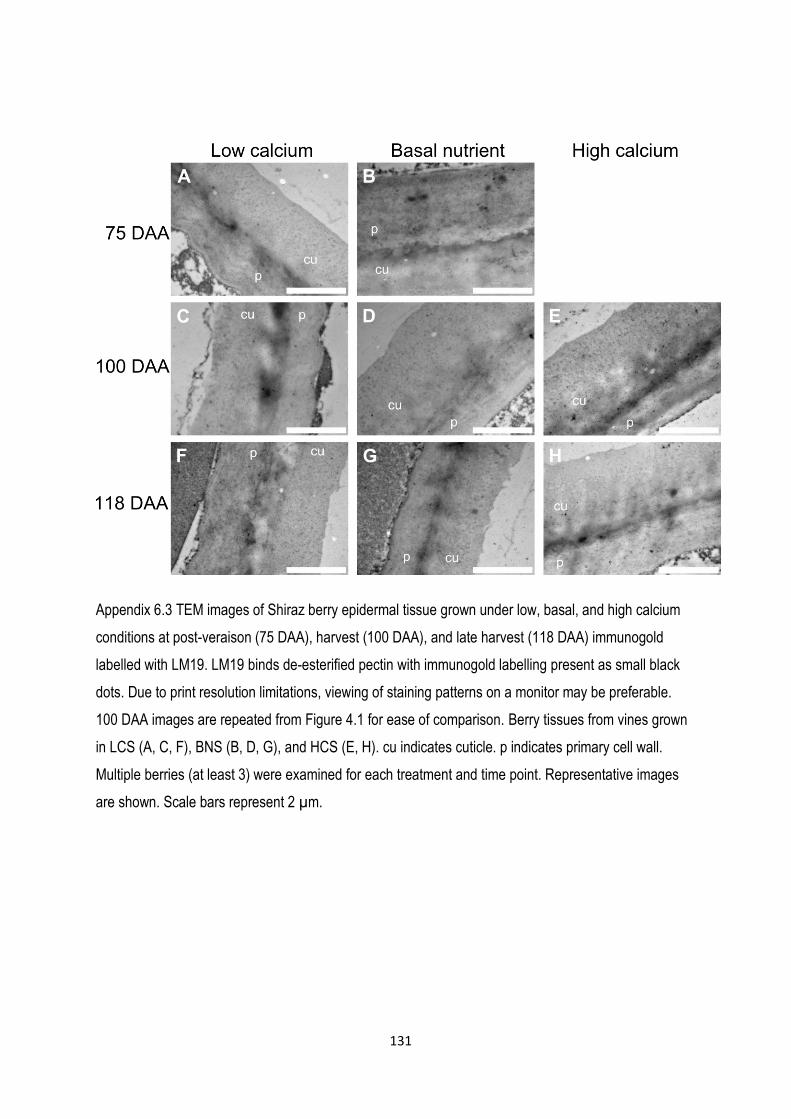
131
Appendix 6.3 TEM images of Shiraz berry epidermal tissue grown under low, basal, and high calcium
conditions at post-veraison (75 DAA), harvest (100 DAA), and late harvest (118 DAA) immunogold
labelled with LM19. LM19 binds de-esterified pectin with immunogold labelling present as small black
dots. Due to print resolution limitations, viewing of staining patterns on a monitor may be preferable.
100 DAA images are repeated from Figure 4.1 for ease of comparison. Berry tissues from vines grown
in LCS (A, C, F), BNS (B, D, G), and HCS (E, H). cu indicates cuticle. p indicates primary cell wall.
Multiple berries (at least 3) were examined for each treatment and time point. Representative images
are shown. Scale bars represent 2 µm.

132
Appendix 6.4 TEM images of Shiraz berry epidermal tissue grown under low, basal, and high calcium
conditions at post-veraison (75 DAA), harvest (100 DAA), and late harvest (118 DAA) immunogold
labelled with LM20. LM20 binds esterified pectin with immunogold labelling present as small black dots.
Due to print resolution limitations, viewing of staining patterns on a monitor may be preferable. 100 DAA
images are repeated from Figure 4.2 for ease of comparison. Berry tissues from vines grown in LCS (A,
C, F), BNS (B, D, G), and HCS (E, H). cu indicates cuticle. p indicates primary cell wall. Multiple berries
(at least 3) were examined for each treatment and time point. Representative images are shown. Scale
bars represent 2 µm.
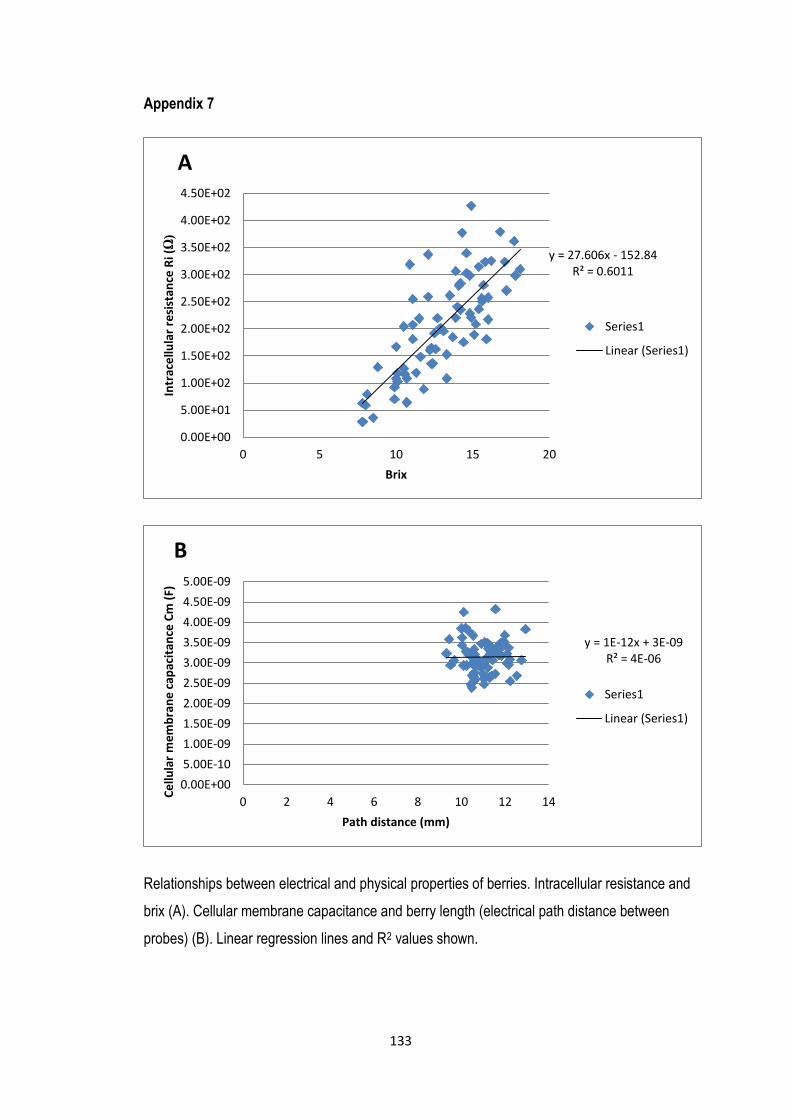
133
Appendix 7
Relationships between electrical and physical properties of berries. Intracellular resistance and
brix (A). Cellular membrane capacitance and berry length (electrical path distance between
probes) (B). Linear regression lines and R2 values shown.
y = 27.606x - 152.84 R² = 0.6011
0.00E+00
5.00E+01
1.00E+02
1.50E+02
2.00E+02
2.50E+02
3.00E+02
3.50E+02
4.00E+02
4.50E+02
0 5 10 15 20
Intr
ace
llula
r re
sist
ance
Ri (Ω
)
Brix
A
Series1
Linear (Series1)
y = 1E-12x + 3E-09 R² = 4E-06
0.00E+00
5.00E-10
1.00E-09
1.50E-09
2.00E-09
2.50E-09
3.00E-09
3.50E-09
4.00E-09
4.50E-09
5.00E-09
0 2 4 6 8 10 12 14
Ce
llula
r m
em
bra
ne
cap
acit
ance
Cm
(F)
Path distance (mm)
B
Series1
Linear (Series1)

134
Appendix 8
Appendix 8. Botrytis cinerea assay of Shiraz berries grown under different calcium regimes. Assay was
carried out over 96 hours, with inspection of berries at 48, 72, and 96 hours after Botrytis cinerea
inoculation. Assay was performed on intact (A) and wounded (B) berries. Berries were scored by visual
assessment of percentage berry surface area discoloured/infected; 0 = 0%, 1 = 1-25%, 2 = 26-50%, 3 =
51-75%, 4 = 76-100%. Mean + SD. 3 berries from each of 3 (BNS), 1 (LCS), or 4 (HCS) vines.
H o u rs a fte r in n o c u la t io n
Infe
cti
on
sta
ge
4 8 7 2 9 6
0
1
2
3
4
5
A
H o u rs a fte r in n o c u la t io n
Infe
cti
on
sta
ge
4 8 7 2 9 6
0
1
2
3
4
5
S h ira z B N S
S h ira z L C S
S h ira z H C S
B

135
Reference list
Allen, G.J., Chu, S.P., Harrington, C.L., Schumacher, K., Hoffman, T., Tang, Y.Y., Grill, E., and
Schroeder, J.I. (2001). A defined range of guard cell calcium oscillation parameters encodes
stomatal movements. Nature 411, 1053-1057.
Allen, G.J., Kuchitsu, K., Chu, S.P., Murata, Y., and Schroeder, J.I. (1999). Arabidopsis abi1-1 and
abi2-1 phosphatase mutations reduce abscisic acid-induced cytoplasmic calcium rises in guard
cells. Plant Cell 11, 1785-1798.
Almeida, D.P.F., and Huber, D.J. (1999). Apoplastic pH and inorganic ion levels in tomato fruit: A
potential means for regulation of cell wall metabolism during ripening. Physiologia Plantarum
105, 506-512.
Ando, Y., Mizutani, K., and Wakatsuki, N. (2014). Electrical impedance analysis of potato tissues during
drying. Journal of Food Engineering 121, 24-31.
Asselbergh, B., Curvers, K., Franca, S.C., Audenaert, K., Vuylsteke, M., Van Breusegem, F., and Hofte,
M. (2007). Resistance to Botrytis cinerea in sitiens, an abscisic acid-deficient tomato mutant,
involves timely production of hydrogen peroxide and cell wall modifications in the epidermis.
Plant Physiology 144, 1863-1877.
Baby, T., Hocking, B., Tyerman, S.D., Gilliham, M., and Collins, C. (2014). Modified method for
producing grapevine plants in controlled environments. American Journal of Enology and
Viticulture 65, 261-267.
Balic, I., Ejsmentewicz, T., Sanhueza, D., Silva, C., Peredo, T., Olmedo, P., Barros, M., Verdonk, J.C.,
Paredes, R., Meneses, C., Prieto, H., Orellana, A., Defilippi, B.G., and Campos-Vargas, R.
(2014). Biochemical and physiological study of the firmness of table grape berries. Postharvest
Biology and Technology 93, 15-23.
Barnavon, L., Doco, T., Terrier, N., Ageorges, A., Romieu, C., and Pellerin, P. (2001). Involvement of
pectin methyl-esterase during the ripening of grape berries: partial cDNA isolation, transcript
expression and changes in the degree of methyl-esterification of cell wall pectins.
Phytochemistry 58, 693-701.
136
Baxter, I., Hosmani, P.S., Rus, A., Lahner, B., Borevitz, J.O., Muthukumar, B., Mickelbart, M.V.,
Schreiber, L., Franke, R.B., and Salt, D.E. (2009). Root suberin forms an extracellular barrier
that affects water relations and mineral nutrition in Arabidopsis. Plos Genetics 5, 12.
Becker, T., and Knoche, M. (2011). Water movement through the surfaces of the grape berry and its
stem. American Journal of Enology and Viticulture 62, 340-350.
Becker, T., and Knoche, M. (2012). Deposition, strain, and microcracking of the cuticle in developing
'Riesling' grape berries. Vitis 51, 1-6.
Blumer, J.M., Clay, R.P., Bergmann, C.W., Albersheim, P., and Darvill, A. (2000). Characterization of
changes in pectin methylesterase expression and pectin esterification during tomato fruit
ripening. Canadian Journal of Botany-Revue Canadienne De Botanique 78, 607-618.
Boettcher, C., Harvey, K., Forde, C.G., Boss, P.K., and Davies, C. (2011). Auxin treatment of pre-
veraison grape (Vitis vinifera L.) berries both delays ripening and increases the synchronicity of
sugar accumulation. Australian Journal of Grape and Wine Research 17, 1-8.
Bonada, M., Sadras, V., Moran, M., and Fuentes, S. (2013a). Elevated temperature and water stress
accelerate mesocarp cell death and shrivelling, and decouple sensory traits in Shiraz berries.
Irrigation Science 31, 1317-1331.
Bonada, M., Sadras, V.O., and Fuentes, S. (2013b). Effect of elevated temperature on the onset and
rate of mesocarp cell death in berries of Shiraz and Chardonnay and its relationship with berry
shrivel. Australian Journal of Grape and Wine Research 19, 87-94.
Bosch, M., and Hepler, P.K. (2005). Pectin methylesterases and pectin dynamics in pollen tubes. Plant
Cell 17, 3219-3226.
Braccini, I., Rodriguez-Carvajal, M.A., and Perez, S. (2005). Chain-chain interactions for methyl
polygalacturonate: Models for high methyl-esterified pectin junction zones. Biomacromolecules
6, 1322-1328.
Brown, M.M., and Ho, L.C. (1993). Factors affecting calcium-transport and basipetal IAA movement in
tomato fruit in relation to blossom-end rot. Journal of Experimental Botany 44, 1111-1117.
Brummell, D.A. (2006). Cell wall disassembly in ripening fruit. Functional Plant Biology 33, 103-119.

137
Brummell, D.A., and Harpster, M.H. (2001). Cell wall metabolism in fruit softening and quality and its
manipulation in transgenic plants. Plant Molecular Biology 47, 311-340.
Brummell, D.A., Harpster, M.H., Civello, P.M., Palys, J.M., Bennett, A.B., and Dunsmuir, P. (1999).
Modification of expansin protein abundance in tomato fruit alters softening and cell wall
polymer metabolism during ripening. Plant Cell 11, 2203-2216.
Burton, R.A., Gidley, M.J., and Fincher, G.B. (2010). Heterogeneity in the chemistry, structure and
function of plant cell walls. Nature Chemical Biology 6, 724-732.
Bush, M.S., and Mccann, M.C. (1999). Pectic epitopes are differentially distributed in the cell walls of
potato (Solanum tuberosum) tubers. Physiologia Plantarum 107, 201-213.
Cabanne, C., and Doneche, B. (2001). Changes in polygalacturonase activity and calcium content
during ripening of grape berries. American Journal of Enology and Viticulture 52, 331-335.
Cabanne, C., and Doneche, B. (2002). Purification and characterization of two isozymes of
polygalacturonase from Botrytis cinerea. Effect of calcium ions on polygalacturonase activity.
Microbiological Research 157, 183-189.
Cabanne, C., and Doneche, B. (2003). Calcium accumulation and redistribution during the development
of grape berry. Vitis 42, 19-21.
Cadot, Y., Chevalier, M., and Barbeau, G. (2011). Evolution of the localisation and composition of
phenolics in grape skin between veraison and maturity in relation to water availability and some
climatic conditions. Journal of the Science of Food and Agriculture 91, 1963-1976.
Cantu, D., Vicente, A.R., Greve, L.C., Dewey, F.M., Bennett, A.B., Labavitch, J.M., and Powell, A.L.T.
(2008). The intersection between cell wall disassembly, ripening, and fruit susceptibility to
Botrytis cinerea. Proceedings of the National Academy of Sciences of the United States of
America 105, 859-864.
Caravia Bayer, L., Collins, C., and Tyerman, S. (2015). Electrical impedance of berries correlates with
decreasing cell vitality during ripening in Shiraz. Australian Journal of Grape and Wine
Research (submitted).

138
Castellarin, S.D., Gambetta, G.A., Wada, H., Shackel, K.A., and Matthews, M.A. (2011). Fruit ripening
in Vitis vinifera: spatiotemporal relationships among turgor, sugar accumulation, and
anthocyanin biosynthesis. Journal of Experimental Botany 62, 4345-4354.
Chardonnet, C., and Doneche, B. (1995). Relation between calcium content and resistance to
enzymatic digestion of the skin during grape ripening. Vitis 34, 95-98.
Chardonnet, C., Lhyvernay, A., and Doneche, B. (1997). Effect of calcium treatment prior to Botrytis
cinerea infection on the changes in pectic composition of grape berry. Physiological and
Molecular Plant Pathology 50, 213-218.
Chardonnet, C.O., Sams, C.E., Trigiano, R.N., and Conway, W.S. (2000). Variability of three isolates of
Botrytis cinerea affects the inhibitory effects of calcium on this fungus. Phytopathology 90, 769-
774.
Chatelet, D.S., Rost, T.L., Shackel, K.A., and Matthews, M.A. (2008). The peripheral xylem of
grapevine (Vitis vinifera). 1. Structural integrity in post-veraison berries. Journal of Experimental
Botany 59, 1987-1996.
Chen, K., Hu, G.Q., and Lenz, F. (1997). Training and shading effects on vegetative and reproductive
growth and fruit quality of apple. Gartenbauwissenschaft 62, 207-213.
Choat, B., Gambetta, G.A., Shackel, K.A., and Matthews, M.A. (2009). Vascular function in grape
berries across development and its relevance to apparent hydraulic isolation. Plant Physiology
151, 1677-1687.
Cholewa, E., and Peterson, C.A. (2004). Evidence for symplastic involvement in the radial movement of
calcium in onion roots. Plant Physiology 134, 1793-1802.
Ciccarese, A., Stellacci, A.M., Gentilesco, G., and Rubino, P. (2013). Effectiveness of pre- and post-
veraison calcium applications to control decay and maintain table grape fruit quality during
storage. Postharvest Biology and Technology 75, 135-141.
Clarkson, D.T. (1984). Calcium-transport between tissues and its distribution in the plant. Plant Cell and
Environment 7, 449-456.

139
Clearwater, M.J., Luo, Z.W., Ong, S.E.C., Blattmann, P., and Thorp, T.G. (2012). Vascular functioning
and the water balance of ripening kiwifruit (Actinidia chinensis) berries. Journal of Experimental
Botany 63, 1835-1847.
Cochard, H., Herbette, S., Hernandez, E., Holtta, T., and Mencuccini, M. (2010). The effects of sap
ionic composition on xylem vulnerability to cavitation. Journal of Experimental Botany 61, 275-
285.
Conn, S., and Gilliham, M. (2010). Comparative physiology of elemental distributions in plants. Annals
of Botany 105, 1081-1102.
Conn, S.J., Gilliham, M., Athman, A., Schreiber, A.W., Baumann, U., Moller, I., Cheng, N.H.,
Stancombe, M.A., Hirschi, K.D., Webb, A.a.R., Burton, R., Kaiser, B.N., Tyerman, S.D., and
Leigh, R.A. (2011). Cell-specific vacuolar calcium storage mediated by CAX1 regulates
apoplastic calcium concentration, gas exchange, and plant productivity in Arabidopsis. Plant
Cell 23, 240-257.
Conn, S.J., Hocking, B., Dayod, M., Xu, B., Athman, A., Henderson, S., Aukett, L., Conn, V., Shearer,
M.K., Fuentes, S., Tyerman, S.D., and Gilliham, M. (2013). Protocol: optimising hydroponic
growth systems for nutritional and physiological analysis of Arabidopsis thaliana and other
plants. Plant Methods 9.
Conradie, W.J. (1981). Seasonal uptake of nutrients by Chenin Blanc in sand culture: II. Phosphorus,
potassium, calcium and magnesium. South African Journal of Enology and Viticulture 2, 7-13.
Cosgrove, D.J. (2005). Growth of the plant cell wall. Nat Rev Mol Cell Biol 6, 850-861.
Curvers, K., Seifi, H., Mouille, G., De Rycke, R., Asselbergh, B., Van Hecke, A., Vanderschaeghe, D.,
Hofte, H., Callewaert, N., Van Breusegem, F., and Hofte, M. (2010). Abscisic acid deficiency
causes changes in cuticle permeability and pectin composition that influence tomato resistance
to Botrytis cinerea. Plant Physiology 154, 847-860.
Dal Santo, S., Vannozzi, A., Tornielli, G.B., Fasoli, M., Venturini, L., Pezzotti, M., and Zenoni, S. (2013).
Genome-wide analysis of the expansin gene superfamily reveals grapevine-specific structural
and functional characteristics. Plos One 8.

140
Dayod, M., Tyerman, S.D., Leigh, R.A., and Gilliham, M. (2010). Calcium storage in plants and the
implications for calcium biofortification. Protoplasma 247, 215-231.
De Freitas, S.T., Do Amarante, C.V.T., Dandekar, A.M., and Mitcham, E.J. (2013). Shading affects
flesh calcium uptake and concentration, bitter pit incidence and other fruit traits in
"Greensleeves" apple. Scientia Horticulturae 161, 266-272.
De Freitas, S.T., Jiang, C.Z., and Mitcham, E.J. (2012). Mechanisms involved in calcium deficiency
development in tomato fruit in response to gibberellins. Journal of Plant Growth Regulation 31,
221-234.
De Freitas, S.T., Mcelrone, A.J., Shackel, K.A., and Mitcham, E.J. (2014). Calcium partitioning and
allocation and blossom-end rot development in tomato plants in response to whole-plant and
fruit-specific abscisic acid treatments. Journal of Experimental Botany 65, 235-247.
De Freitas, S.T., and Mitcham, E.J. (2012). "Factors involved in fruit calcium deficiency disorders," in
Horticultural Reviews. (New York, USA: John Wiley & Sons, Inc.), 107-146.
De Silva, D.L.R., Hetherington, A.M., and Mansfield, T.A. (1996). Where does all the calcium go?
Evidence of an important regulatory role for trichomes in two calcicoles. Plant Cell and
Environment 19, 880-886.
Decreux, A., and Messiaen, J. (2005). Wall-associated kinase WAK1 interacts with cell wall pectins in a
calcium-induced conformation. Plant and Cell Physiology 46, 268-278.
Deluc, L.G., Quilici, D.R., Decendit, A., Grimplet, J., Wheatley, M.D., Schlauch, K.A., Merillon, J.M.,
Cushman, J.C., and Cramer, G.R. (2009). Water deficit alters differentially metabolic pathways
affecting important flavor and quality traits in grape berries of Cabernet Sauvignon and
Chardonnay. Bmc Genomics 10.
Deytieux-Belleau, C., Geny, L., Roudet, J., Mayet, V., Doneche, B., and Fermaud, M. (2009). Grape
berry skin features related to ontogenic resistance to Botrytis cinerea. European Journal of
Plant Pathology 125, 551-563.
Deytieux-Belleau, C., Vallet, A., Doneche, B., and Geny, L. (2008). Pectin methylesterase and
polygalacturonase in the developing grape skin. Plant Physiology and Biochemistry 46, 638-
646.

141
Deytieux, C., Geny, L., and Doneche, B. (2005). "Relation between hormonal balance and
polygalacturonase activity in grape berry," in Proceedings of the 5th International Postharvest
Symposium, Vols 1-3, eds. F. Mencarelli & P. Tonutti. (Leuven 1: International Society
Horticultural Science), 163-170.
Dodd, A.N., Kudla, J., and Sanders, D. (2010). The language of calcium signalling. Annual Review of
Plant Biology 61.
Dominguez, E., Lopez-Casado, G., Cuartero, J., and Heredia, A. (2008). Development of fruit cuticle in
cherry tomato (Solanum lycopersicum). Functional Plant Biology 35, 403-411.
Downton, W.J.S. (1977). Influence of rootstocks on accumulation of chloride, sodium and potassium in
grapevines. Australian Journal of Agricultural Research 28, 879-889.
Drazeta, L., Lang, A., Hall, A.J., Volz, R.K., and Jameson, P.E. (2004). Causes and effects of changes
in xylem functionality in apple fruit. Annals of Botany 93, 275-282.
Dry, P.R., Longbottom, M.L., Mcloughlin, S., Johnson, T.E., and Collins, C. (2010). Classification of
reproductive performance of ten winegrape varieties. Australian Journal of Grape and Wine
Research 16, 47-55.
Esbensen, K.H. (2004). Multivariate Data Analysis - In Practice. Oslo, Norway: CAMO Process.
Espana, L., Heredia-Guerrero, J.A., Segado, P., Benitez, J.J., Heredia, A., and Dominguez, E. (2014).
Biomechanical properties of the tomato (Solanum lycopersicum) fruit cuticle during
development are modulated by changes in the relative amounts of its components. New
Phytologist 202, 790-802.
Etchebarne, F., Ojeda, H., and Deloire, A. (2009). "Grape berry mineral nutrition composition in relation
to vine water status & leaf area/fruit ratio," in Grapevine Molecular Physiology & Biotechnology,
ed. K.A. Roubelakis-Angelakis. 2 ed: Springer Science & Business Media B.V.).
Evans, D.E., Briars, S.A., and Williams, L.E. (1991). Active calcium-transport by plant-cell membranes.
J Exp Bot 42, 285-303.
Felle, H.H., Hanstein, S., Steinmeyer, R., and Hedrich, R. (2000). Dynamics of ionic activities in the
apoplast of the sub-stomatal cavity of intact Vicia faba leaves during stomatal closure evoked
by ABA and darkness. Plant Journal 24, 297-304.

142
Ferguson, I.B. (1984). Calcium in plant senescence and fruit ripening. Plant Cell and Environment 7,
477-489.
Fozard, J.A., King, J.R., and Bennett, M.J. (2013). Modelling auxin efflux carrier phosphorylation and
localization. Journal of Theoretical Biology 319, 34-49.
Franceschi, V.R., and Nakata, P.A. (2005). "Calcium oxalate in plants: Formation and function," in
Annual Review of Plant Biology. (Palo Alto: Annual Reviews), 41-71.
Fritz, E. (2007). Measurement of cation exchange capacity (CEC) of plant cell walls by X-ray
microanalysis (EDX) in the transmission electron microscope. Microscopy and Microanalysis
13, 233-244.
Fuentes, S., Ljung, K., Sorefan, K., Alvey, E., Harberd, N.P., and Ostergaard, L. (2012). Fruit growth in
Arabidopsis occurs via DELLA-dependent and DELLA-independent gibberellin responses.
Plant Cell 24, 3982-3996.
Fuentes, S., Sullivan, W., Tilbrook, J., and Tyerman, S. (2010). A novel analysis of grapevine berry
tissue demonstrates a variety-dependent correlation between tissue vitality and berry shrivel.
Australian Journal of Grape and Wine Research 16, 327-336.
Gabler, F.M., Smilanick, J.L., Mansour, M., Ramming, D.W., and Mackey, B.E. (2003). Correlations of
morphological, anatomical, and chemical features of grape berries with resistance to Botrytis
cinerea. Phytopathology 93, 1263-1273.
Gambetta, G.A., Matthews, M.A., Shaghasi, T.H., Mcelrone, A.J., and Castellarin, S.D. (2010). Sugar
and abscisic acid signaling orthologs are activated at the onset of ripening in grape. Planta 232,
219-234.
Gendre, D., Mcfarlane, H.E., Johnson, E., Mouille, G., Sjodin, A., Oh, J., Levesque-Tremblay, G.,
Watanabe, Y., Samuels, L., and Bhalerao, R.P. (2013). Trans-Golgi network localized
ECHIDNA/Ypt interacting protein complex is required for the secretion of cell wall
polysaccharides in Arabidopsis. Plant Cell 25, 2633-2646.
Giacosa, S., Torchio, F., Segade, S.R., Caudana, A., Gerbi, V., and Rolle, L. (2012). Varietal
relationship between skin break force and off-vine withering process for winegrapes. Drying
Technology 30, 726-732.

143
Giacosa, S., Torchio, F., Segade, S.R., Gaiotti, F., Tomasi, D., Lovat, L., Vincenzi, S., and Rolle, L.
(2013). Physico-mechanical evaluation of the aptitude of berries of red wine grape varieties to
resist the compression in carbonic maceration vinification. International Journal of Food
Science and Technology 48, 817-825.
Gilliham, M., Dayod, M., Hocking, B.J., Xu, B., Conn, S.J., Kaiser, B.N., Leigh, R.A., and Tyerman, S.D.
(2011). Calcium delivery and storage in plant leaves: exploring the link with water flow. Journal
of Experimental Botany 62, 2233-2250.
Graham, N.S., Hammond, J.P., Lysenko, A., Mayes, S., Lochlainn, S.O., Blasco, B., Bowen, H.C.,
Rawlings, C.J., Rios, J.J., Welham, S., Carion, P.W.C., Dupuy, L.X., King, G.J., White, P.J.,
and Broadley, M.R. (2014). Genetical and comparative genomics of Brassica under altered Ca
supply identifies Arabidopsis Ca-transporter orthologs. Plant Cell 26, 2818-2830.
Grignon, C., and Sentenac, H. (1991). pH and ionic conditions in the apoplast. Ann Rev of Plant Phys
42, 103-128.
Han, S.C., Tang, R.H., Anderson, L.K., Woerner, T.E., and Pei, Z.M. (2003). A cell surface receptor
mediates extracellular Ca2+ sensing in guard cells. Nature 425, 196-200.
Hawker, J.S., and Walker, R.R. (1978). Effect of sodium chloride on growth and fruiting of Cabernet
Sauvignon vines. American Journal of Enology and Viticulture 29, 172-176.
Hayes, M.A., Davies, C., and Dry, I.B. (2007). Isolation, functional characterization, and expression
analysis of grapevine (Vitis vinifera L.) hexose transporters: differential roles in sink and source
tissues. Journal of Experimental Botany 58, 1985-1997.
Hayes, M.A., Feechan, A., and Dry, I.B. (2010). Involvement of abscisic acid in the coordinated
regulation of a stress-inducible hexose transporter (VvHT5) and a cell wall invertase in
grapevine in response to biotrophic fungal infection. Plant Physiology 153, 211-221.
Hayter, M.L., and Peterson, C.A. (2004). Can Ca2+ fluxes to the root xylem be sustained by Ca2+-
ATPases in exodermal and endodermal plasma membranes? Plant Physiology 136, 4318-
4325.

144
Henderson, S.W., Baumann, U., Blackmore, D.H., Walker, A.R., Walker, R.R., and Gilliham, M. (2014).
Shoot chloride exclusion and salt tolerance in grapevine is associated with differential ion
transporter expression in roots. Bmc Plant Biology 14.
Ho, L.C., Belda, R., Brown, M., Andrews, J., and Adams, P. (1993). Uptake and transport of calcium
and the possible causes of blossom-end rot in tomato. Journal of Experimental Botany 44, 509-
518.
Ho, L.C., and White, P.J. (2005). A cellular hypothesis for the induction of blossom-end rot in tomato
fruit. Annals of Botany 95, 571-581.
Hocking, P.J. (1980). The composition of phloem exudate and xylem sap from tree tobacco (Nicotiana
glauca Grah.). Annals of Botany 45, 633-643.
Hosmani, P.S., Kamiya, T., Danku, J., Naseer, S., Geldner, N., Guerinot, M.L., and Salt, D.E. (2013).
Dirigent domain-containing protein is part of the machinery required for formation of the lignin-
based Casparian strip in the root. Proceedings of the National Academy of Sciences of the
United States of America 110, 14498-14503.
Hoson, T. (1998). Apoplast as the site of response to environmental signals. Journal of Plant Research
111, 167-177.
Howie, H., and Lloyd, J. (1989). Response of orchard 'Washington Navel' orange, Citrus sinensis (L) to
saline irrigation water. 2. Flowering, fruit set and fruit growth. Australian Journal of Agricultural
Research 40, 371-380.
Huang, X.M., Huang, H.B., and Wang, H.C. (2005). Cell walls of loosening skin in post-veraison grape
berries lose structural polysaccharides and calcium while accumulate structural proteins.
Scientia Horticulturae 104, 249-263.
Hyodo, H., Terao, A., Furukawa, J., Sakamoto, N., Yurimoto, H., Satoh, S., and Iwai, H. (2013). Tissue
specific localization of pectin-Ca2+ cross-linkages and pectin methyl-esterification during fruit
ripening in tomato (Solanum lycopersicum). Plos One 8.
Jiang, L.X., Yang, S.L., Xie, L.F., Puah, C.S., Zhang, X.Q., Yang, W.C., Sundaresan, V., and Ye, D.
(2005). VANGUARD1 encodes a pectin methylesterase that enhances pollen tube growth in
the Arabidopsis style and transmitting tract. Plant Cell 17, 584-596.

145
Johnson, C.H., Knight, M.R., Kondo, T., Masson, P., Sedbrook, J., Haley, A., and Trewavas, A. (1995).
Circadian oscillations of cytosolic and chloroplastic free calcium in plants. Science 269, 1863-
1865.
Johnson, C.H., Shingles, R., and Ettinger, W. (2006). "Regulation and role of calcium fluxes in the
chloroplast," in The structure and function of plastids, eds. R. Wise & J. Hoober. (Dordrecht:
Springer), 403-416.
Karley, A.J., Leigh, R.A., and Sanders, D. (2000). Differential ion accumulation and ion fluxes in the
mesophyll and epidermis of barley. Plant Physiology 122, 835-844.
Keller, M., and Shrestha, P.M. (2014). Solute accumulation differs in the vacuoles and apoplast of
ripening grape berries. Planta 239, 633-642.
Kim, K.N., Cheong, Y.H., Grant, J.J., Pandey, G.K., and Luan, S. (2003). CIPK3, a calcium sensor-
associated protein kinase that regulates abscisic acid and cold signal transduction in
Arabidopsis. Plant Cell 15, 411-423.
Knoche, M., and Peschel, S. (2007). Gibberellins increase cuticle deposition in developing tomato fruit.
Plant Growth Regulation 51, 1-10.
Kohorn, B.D., and Kohorn, S.L. (2012). The cell wall-associated kinases,WAKs, as pectin receptors.
Frontiers in Plant Science 3.
Konrad, K.R., Wudick, M.M., and Feijo, J.A. (2011). Calcium regulation of tip growth: new genes for old
mechanisms. Current Opinion in Plant Biology 14, 721-730.
Krasnow, M., Matthews, M., and Shackel, K. (2008). Evidence for substantial maintenance of
membrane integrity and cell viability in normally developing grape (Vitis vinifera L.) berries
throughout development. Journal of Experimental Botany 59, 849-859.
Kraus, J.E., De Sousa, H.C., Rezende, M.H., Castro, N.M., Vecchi, C., and Luque, R. (1998). Astra
blue and basic fuchsin double staining of plant materials. Biotechnic & Histochemistry 73, 235-
243.
Kudla, J., Batistic, O., and Hashimoto, K. (2010). Calcium signals: the lead currency of plant information
processing. Plant Cell 22, 541-563.

146
Kumar, R., Khurana, A., and Sharma, A.K. (2014). Role of plant hormones and their interplay in
development and ripening of fleshy fruits. Journal of Experimental Botany 65, 4561-4575.
Lacampagne, S., Lambert, C., Belleau-Deytieux, C., L'hyvernay, A., Doneche, B., and Geny, L. (2010).
"Expression, activity and cellular localization of pectin methylesterase in grape berry skin
during ripening," in Vi International Postharvest Symposium, eds. M. Erkan & U. Aksoy.
(Leuven 1: Int Soc Horticultural Science), 1057-1062.
Lang, A. (1990). Xylem, phloem and transpiration flows in developing apple fruit. Journal of
Experimental Botany 41, 645-651.
Lang, A., and During, H. (1991). Partitioning control by water potential gradient- Evidence for
compartmentation breakdown in grape berries. Journal of Experimental Botany 42, 1117-1122.
Lang, A., and Thorpe, M.R. (1989). Xylem, phloem and transpiration flows in a grape - application of a
technique for measuring the volume of attached fruits to high-resolution using Archimedes
principle. Journal of Experimental Botany 40, 1069-1078.
Lee, J., Park, I., Lee, Z.W., Kim, S.W., Baek, N., Park, H.S., Park, S.U., Kwon, S., and Kim, H. (2013).
Regulation of the major vacuolar Ca2+ transporter genes, by intercellular Ca2+ concentration
and abiotic stresses, in tip-burn resistant Brassica oleracea. Molecular Biology Reports 40,
177-188.
Leng, P., Yuan, B., and Guo, Y. (2014). The role of abscisic acid in fruit ripening and responses to
abiotic stress. Journal of Experimental Botany 65, 4577-4588.
Leung, J., Bouvierdurand, M., Morris, P.C., Guerrier, D., Chefdor, F., and Giraudat, J. (1994).
Arabidopsis ABA response gene ABI1 - features of a calcium-modulated protein phosphatase.
Science 264, 1448-1452.
Lionetti, V., Cervone, F., and Bellincampi, D. (2012). Methyl esterification of pectin plays a role during
plant-pathogen interactions and affects plant resistance to diseases. Journal of Plant
Physiology 169, 1623-1630.
Lionetti, V., Raiola, A., Camardella, L., Giovane, A., Obel, N., Pauly, M., Favaron, F., Cervone, F., and
Bellincampi, D. (2007). Overexpression of pectin methylesterase inhibitors in Arabidopsis
restricts fungal infection by Botrytis cinerea. Plant Physiology 143, 1871-1880.

147
Lopez-Casado, G., Matas, A.J., Dominguez, E., Cuartero, J., and Heredia, A. (2007). Biomechanics of
isolated tomato (Solanum lycopersicum L.) fruit cuticles: the role of the cutin matrix and
polysaccharides. Journal of Experimental Botany 58, 3875-3883.
Lu, Y.Q., Liu, H.P., Wang, Y., Zhang, X.Z., and Han, Z.H. (2013). Synergistic roles of leaf boron and
calcium during the growing season in affecting sugar and starch accumulation in ripening apple
fruit. Acta Physiologiae Plantarum 35, 2483-2492.
Madrid, R., Valverde, M., Alcolea, V., and Romojaro, F. (2004). Influence of calcium nutrition on water
soaking disorder during ripening of Cantaloupe melon. Scientia Horticulturae 101, 69-79.
Martin, L.B.B., and Rose, J.K.C. (2014). There’s more than one way to skin a fruit: formation and
functions of fruit cuticles. Journal of Experimental Botany 65, 4639-4651.
Marzouk, H.A., and Kassem, H.A. (2011). Improving yield, quality, and shelf life of Thompson seedless
grapevine by preharvest foliar applications. Scientia Horticulturae 130, 425-430.
Matthews, M.A., Thomas, T.R., and Shackel, K.A. (2009). Fruit ripening in Vitis vinifera L.: possible
relation of veraison to turgor and berry softening. Australian Journal of Grape and Wine
Research 15, 278-283.
Mazzeo, M., Dichio, B., Clearwater, M.J., Montanaro, G., and Xiloyannis, C. (2013). Hydraulic
resistance of developing Actinidia fruit. Annals of Botany 112, 197-205.
Mcainsh, M.R., and Pittman, J.K. (2009). Shaping the calcium signature. New Phytologist 181, 275-
294.
Mcatee, P., Karim, S., Schaffer, R., and David, K. (2013). A dynamic interplay between phytohormones
is required for fruit development, maturation, and ripening. Frontiers in Plant Science 4.
Mccarthy, M.G., and Coombe, B.G. (1999). Is weight loss in ripening grape berries cv. Shiraz caused
by impeded phloem transport? Australian Journal of Grape and Wine Research 5.
Mohnen, D. (2008). Pectin structure and biosynthesis. Current Opinion in Plant Biology 11, 266-277.
Montanaro, G., Dichio, B., and Xiloyannis, C. (2010). Significance of fruit transpiration on calcium
nutrition in developing apricot fruit. Journal of Plant Nutrition and Soil Science 173, 618-622.

148
Montanaro, G., Dichio, B., Xiloyannis, C., and Celano, G. (2006). Light influences transpiration and
calcium accumulation in fruit of kiwifruit plants (Actinidia deliciosa var. deliciosa). Plant Science
170, 520-527.
Montanaro, G., Dichio, B., Xiloyannis, C., and Lang, A. (2012). Fruit transpiration in kiwifruit:
environmental drivers and predictive model. Aob Plants.
Morvan, O., Quentin, M., Jauneau, A., Mareck, A., and Morvan, C. (1998). Immunogold localization of
pectin methylesterases in the cortical tissues of flax hypocotyl. Protoplasma 202, 175-184.
Mullins, M.G., and Rajasekaran, K. (1981). Fruiting cuttings- revised method for producing test plants of
grapevine cultivars. American Journal of Enology and Viticulture 32, 35-40.
Nardini, A., Gasco, A., Trifilo, P., Lo Gullo, M.A., and Salleo, S. (2007). Ion-mediated enhancement of
xylem hydraulic conductivity is not always suppressed by the presence of Ca2+ in the sap.
Journal of Experimental Botany 58, 2609-2615.
Nardini, A., Salleo, S., and Jansen, S. (2011). More than just a vulnerable pipeline: xylem physiology in
the light of ion-mediated regulation of plant water transport. Journal of Experimental Botany 62,
4701-4718.
Nawrath, C., Schreiber, L., Franke, R.B., Geldner, N., Reina-Pinto, J.J., and Kunst, L. (2013).
Apoplastic diffusion barriers in Arabidopsis. The Arabidopsis book / American Society of Plant
Biologists 11.
Ng, J.K.T., Schroder, R., Sutherland, P.W., Hallett, I.C., Hall, M.I., Prakash, R., Smith, B.G., Melton,
L.D., and Johnston, J.W. (2013). Cell wall structures leading to cultivar differences in softening
rates develop early during apple (Malus x domestica) fruit growth. Bmc Plant Biology 13.
Ngouemazong, D.E., Jolei, R.P., Cardinaels, R., Fraeye, I., Van Loey, A., Moldenaers, P., and
Hendrickx, M. (2012). Stiffness of Ca2+-pectin gels: combined effects of degree and pattern of
methylesterification for various Ca2+ concentrations. Carbohydrate Research 348, 69-76.
Nguema-Ona, E., Moore, J.P., Fagerstrom, A.D., Fangel, J.U., Willats, W.G.T., Hugo, A., and Vivier,
M.A. (2013). Overexpression of the grapevine PGIP1 in tobacco results in compositional
changes in the leaf arabinoxyloglucan network in the absence of fungal infection. Bmc Plant
Biology 13.

149
Nishizawa, T., Kobayashi, T., and Aikawa, T. (2004). Effect of calcium supply on the physiology of fruit
tissue in 'Andesu' netted melon. Journal of Horticultural Science & Biotechnology 79, 500-508.
Northcote, K.H. (1988). "Soils and Australian Viticulture," in Viticulture - Resources in Australia, eds.
B.G. Coombe & P.R. Dry. 1 ed (Underdale, Australia: Australian Industrial Publishers Pty. Ltd.),
61-90.
Nunan, K.J., Davies, C., Robinson, S.P., and Fincher, G.B. (2001). Expression patterns of cell wall-
modifying enzymes during grape berry development. Planta 214, 257-264.
Nunan, K.J., Sims, I.M., Bacic, A., Robinson, S.P., and Fincher, G.B. (1998). Changes in cell wall
composition during ripening of grape berries. Plant Physiology 118, 783-792.
Orfila, C., and Knox, J.P. (2000). Spatial regulation of pectic polysaccharides in relation to pit fields in
cell walls of tomato fruit pericarp. Plant Physiology 122, 775-781.
Ortega-Regules, A., Ros-Garcia, J.M., Bautista-Ortin, A.B., Lopez-Roca, J.M., and Gomez-Plaza, E.
(2008). Changes in skin cell wall composition during the maturation of four premium wine grape
varieties. Journal of the Science of Food and Agriculture 88, 420-428.
Osorio, S., Castillejo, C., Quesada, M.A., Medina-Escobar, N., Brownsey, G.J., Suau, R., Heredia, A.,
Botella, M.A., and Valpuesta, V. (2008). Partial demethylation of oligogalacturonides by pectin
methyl esterase 1 is required for eliciting defence responses in wild strawberry (Fragaria
vesca). Plant Journal 54, 43-55.
Osorio, S., Scossa, F., and Fernie, A.R. (2013). Molecular regulation of fruit ripening. Frontiers in Plant
Science 4.
Pan, Q.H., Li, M.J., Peng, C.C., Zhang, N., Zou, X., Zou, K.Q., Wang, X.L., Yu, X.C., Wang, X.F., and
Zhang, D.P. (2005). Abscisic acid activates acid invertases in developing grape berry.
Physiologia Plantarum 125, 157-170.
Pandey, G.K., Cheong, Y.H., Kim, K.N., Grant, J.J., Li, L.G., Hung, W., D'angelo, C., Weinl, S., Kudla,
J., and Luan, S. (2004). The calcium sensor calcineurin B-Like 9 modulates abscisic acid
sensitivity and biosynthesis in Arabidopsis. Plant Cell 16, 1912-1924.
Pfister, A., Barberon, M., Alassimone, J., Kalmbach, L., Lee, Y., Vermeer, J.E.M., Yamazaki, M., Li,
G.W., Maurel, C., Takano, J., Kamiya, T., Salt, D.E., Roppolo, D., and Geldner, N. (2014). A
150
receptor-like kinase mutant with absent endodermal diffusion barrier displays selective nutrient
homeostasis defects. Elife 3.
Pilati, S., Brazzale, D., Guella, G., Milli, A., Ruberti, C., Biasioli, F., Zottini, M., and Moser, C. (2014).
The onset of grapevine berry ripening is characterized by ROS accumulation and
lipoxygenase-mediated membrane peroxidation in the skin. Bmc Plant Biology 14.
Pitann, B., Schubert, S., and Muehling, K.H. (2009). Decline in leaf growth under salt stress is due to an
inhibition of H+-pumping activity and increase in apoplastic pH of maize leaves. Journal of Plant
Nutrition and Soil Science 172, 535-543.
Plavcova, L., and Hacke, U.G. (2011). Heterogeneous distribution of pectin epitopes and calcium in
different pit types of four angiosperm species. New Phytologist 192, 885-897.
Prior, L.D., Grieve, A.M., and Cullis, B.R. (1992). Sodium chloride and soil texture interactions in
irrigated field grown Sultana grapevines .I. Yield and fruit quality. Australian Journal of
Agricultural Research 43, 1051-1066.
Redgwell, R.J., Macrae, E., Hallett, I., Fischer, M., Perry, J., and Harker, R. (1997). In vivo and in vitro
swelling of cell walls during fruit ripening. Planta 203, 162-173.
Rios, J.J., Lochlainn, S.O., Devonshire, J., Graham, N.S., Hammond, J.P., King, G.J., White, P.J.,
Kurup, S., and Broadley, M.R. (2012). Distribution of calcium (Ca) and magnesium (Mg) in the
leaves of Brassica rapa under varying exogenous Ca and Mg supply. Annals of Botany 109,
1081-1089.
Ristic, R., and Iland, P.G. (2005). Relationships between seed and berry development of Vitis vinifera
L. cv Shiraz: Developmental changes in seed morphology and phenolic composition. Australian
Journal of Grape and Wine Research 11, 43-58.
Rober-Kleber, N., Albrechtova, J.T.P., Fleig, S., Huck, N., Michalke, W., Wagner, E., Speth, V.,
Neuhaus, G., and Fischer-Iglesias, C. (2003). Plasma membrane H+-ATPase is involved in
auxin-mediated cell elongation during wheat embryo development. Plant Physiology 131, 1302-
1312.

151
Robinson, J.B., Treeby, M.T., and Stephenson, R.A. (1997). "Fruits, vines and nuts", in: Plant Analysis:
An Interpretation Manual. (eds.) D. Reuter & J.B. Robinson. 2nd ed. (Melbourne: CSIRO
Publishing).
Rogiers, S.Y., Greer, D.H., Hatfield, J.M., Orchard, B.A., and Keller, M. (2006a). Mineral sinks within
ripening grape berries (Vitis vinifera L.). Vitis 45, 115-123.
Rogiers, S.Y., Greer, D.H., Hatfield, J.M., Orchard, B.A., and Keller, M. (2006b). Solute transport into
Shiraz berries during development and late-ripening shrinkage. American Journal of Enology
and Viticulture 57, 73-80.
Rogiers, S.Y., Keller, M., Holzapfel, B.P., and Virgona, J.M. (2000). Accumulation of potassium and
calcium by ripening berries on field vines of Vitis vinifera (L) cv. Shiraz. Australian Journal of
Grape and Wine Research 6, 240-243.
Rolle, L., Siret, R., Segade, S.R., Maury, C., Gerbi, V., and Jourjon, F. (2012a). Instrumental texture
analysis parameters as markers of table-grape and winegrape quality: a review. American
Journal of Enology and Viticulture 63, 11-28.
Rolle, L., Torchio, F., Ferrandino, A., and Guidoni, S. (2012b). Influence of wine-grape skin hardness
on the kinetics of anthocyanin extraction. International Journal of Food Properties 15, 249-261.
Rounds, C.M., Lubeck, E., Hepler, P.K., and Winship, L.J. (2011). Propidium iodide competes with Ca2+
to label pectin in pollen tubes and Arabidopsis root hairs. Plant Physiology 157, 175-187.
Roy, S., Gillen, G., Conway, W.S., Watada, A.E., and Wergin, W.P. (1995). Use of secondary ion mass
spectrometry to image (44)calcium uptake in the cell walls of apple fruit. Protoplasma 189, 163-
172.
Ruan, Y.L., Patrick, J.W., Bouzayen, M., Osorio, S., and Fernie, A.R. (2012). Molecular regulation of
seed and fruit set. Trends in Plant Science 17, 656-665.
Ruan, Y.L., Patrick, J.W., and Brady, C.J. (1996). The composition of apoplast fluid recovered from
intact developing tomato fruit. Australian Journal of Plant Physiology 23, 9-13.
Saladie, M., Matas, A.J., Isaacson, T., Jenks, M.A., Goodwin, S.M., Niklas, K.J., Ren, X., Labavitch,
J.M., Shackel, K.A., Fernie, A.R., Lytovchenko, A., O'neill, M.A., Watkins, C.B., and Rose,

152
J.K.C. (2007). A reevaluation of the key factors that influence tomato fruit softening and
integrity. Plant Physiology 144, 1012-1028.
Sampedro, J., and Cosgrove, D.J. (2005). The expansin superfamily. Genome Biology 6.
Sams, C.E., and Conway, W.S. (1984). Effect of calcium infiltration on ethylene production, respiration
rate, soluble polyuronide content, and quality of Golden Delicious apple fruit. Journal of the
American Society for Horticultural Science 109, 53-57.
Sattelmacher, B. (2001). Tansley review no. 22 - The apoplast and its significance for plant mineral
nutrition. New Phytol 149, 167-192.
Saure, M.C. (2005). Calcium translocation to fleshy fruit: its mechanism and endogenous control.
Scientia Horticulturae 105, 65-89.
Scharwies, J. (2013). Water transport in grape berry and pre-harvest berry dehydration. M. Ag. Sc.,
University of Adelaide.
Schlosser, J., Olsson, N., Weis, M., Reid, K., Peng, F., Lund, S., and Bowen, P. (2008). Cellular
expansion and gene expression in the developing grape (Vitis vinifera L.). Protoplasma 232,
255-265.
Seifert, G.J., and Blaukopf, C. (2010). Irritable walls: the plant extracellular matrix and signaling. Plant
Physiology 153, 467-478.
Serrani, J.C., Ruiz-Rivero, O., Fos, M., and Garcia-Martinez, J.L. (2008). Auxin-induced fruit-set in
tomato is mediated in part by gibberellins. Plant Journal 56, 922-934.
Shabala, S. (2000). Ionic and osmotic components of salt stress specifically modulate net ion fluxes
from bean leaf mesophyll. Plant Cell and Environment 23, 825-837.
Shishova, M., and Lindberg, S. (2010). A new perspective on auxin perception. Journal of Plant
Physiology 167, 417-422.
Smith, J.P., Schmidtke, L.M., Muller, M.C., and Holzapfel, B.P. (2014). Measurement of the
concentration of nutrients in grapevine petioles by attenuated total reflectance Fourier
transform infrared spectroscopy and chemometrics. Australian Journal of Grape and Wine
Research 20, 299-309.
153
Sun, L., Sun, Y.F., Zhang, M., Wang, L., Ren, J., Cui, M.M., Wang, Y.P., Ji, K., Li, P., Li, Q., Chen, P.,
Dai, S.J., Duan, C.R., Wu, Y., and Leng, P. (2012). Suppression of 9-cis-epoxycarotenoid
dioxygenase, which encodes a key enzyme in abscisic acid biosynthesis, alters fruit texture in
transgenic tomato. Plant Physiology 158, 283-298.
Sun, Q.A., Greve, L.C., and Labavitch, J.M. (2011). Polysaccharide compositions of intervessel pit
membranes contribute to Pierce's disease resistance of grapevines. Plant Physiology 155,
1976-1987.
Sutherland, P., Hallett, L., Redgwell, R., Benhamou, N., and Macrae, E. (1999). Localization of cell wall
polysaccharides during kiwifruit (Actinidia deliciosa) ripening. International Journal of Plant
Sciences 160, 1099-1109.
Tang, R.H., Han, S.C., Zheng, H.L., Cook, C.W., Choi, C.S., Woerner, T.E., Jackson, R.B., and Pei,
Z.M. (2007). Coupling diurnal cytosolic Ca2+ oscillations to the CAS-IP3 pathway in
Arabidopsis. Science 315, 1423-1426.
Teakle, N.L., and Tyerman, S.D. (2010). Mechanisms of Cl- transport contributing to salt tolerance.
Plant Cell and Environment 33, 566-589.
Thomas, T.R., Matthews, M.A., and Shackel, K.A. (2006). Direct in situ measurement of cell turgor in
grape (Vitis vinifera L.) berries during development and in response to plant water deficits.
Plant Cell and Environment 29, 993-1001.
Thomas, T.R., Shackel, K.A., and Matthews, M.A. (2008). Mesocarp cell turgor in Vitis vinifera L.
berries throughout development and its relation to firmness, growth, and the onset of ripening.
Planta 228, 1067-1076.
Tibbits, C.W., Macdougall, A.J., and Ring, S.G. (1998). Calcium binding and swelling behaviour of a
high methoxyl pectin gel. Carbohydrate Research 310, 101-107.
Tilbrook, J., and Tyerman, S.D. (2008). Cell death in grape berries: varietal differences linked to xylem
pressure and berry weight loss. Functional Plant Biology 35, 173-184.
Tilbrook, J., and Tyerman, S.D. (2009). Hydraulic connection of grape berries to the vine: varietal
differences in water conductance into and out of berries, and potential for backflow. Functional
Plant Biology 36, 541-550.

154
Tsubaki, S., Ozaki, Y., Yonemori, K., and Azuma, J.-I. (2012). Mechanical properties of fruit-cuticular
membranes isolated from 27 cultivars of Diospyros kaki Thunb. Food Chemistry 132, 2135-
2139.
Tyerman, S.D., Tilbrook, J., Pardo, C., Kotula, L., Sullivan, W., and Steudle, E. (2004). Direct
measurement of hydraulic properties in developing berries of Vitis vinifera L. cv Shiraz and
Chardonnay. Australian Journal of Grape and Wine Research 10, 170-181.
Vallarino, J.G., and Osorio, S. (2012). Signaling role of oligogalacturonides derived during cell wall
degradation. Plant signaling & behavior 7, 1447-1449.
Van Doorn, W.G., Hiemstra, T., and Fanourakis, D. (2011). Hydrogel regulation of xylem water flow: an
alternative hypothesis. Plant Physiology 157, 1642-1649.
Vandeleur, R.K., Mayo, G., Shelden, M.C., Gilliham, M., Kaiser, B.N., and Tyerman, S.D. (2009). The
role of plasma membrane intrinsic protein aquaporins in water transport through roots: Diurnal
and drought stress responses reveal different strategies between isohdyric and anisohydric
cultivars of grapevine. Plant Physiology 149, 445-460.
Vandeleur, R.K., Sullivan, W., Athman, A., Jordans, C., Gilliham, M., Kaiser, B.N., and Tyerman, S.D.
(2014). Rapid shoot-to-root signalling regulates root hydraulic conductance via aquaporins.
Plant Cell and Environment 37, 520-538.
Vidal, S., Williams, P., O'neill, M.A., and Pellerin, P. (2001). Polysaccharides from grape berry cell
walls. Part I: tissue distribution and structural characterization of the pectic polysaccharides.
Carbohydrate Polymers 45, 315-323.
Vorwerk, S., Somerville, S., and Somerville, C. (2004). The role of plant cell wall polysaccharide
composition in disease resistance. Trends in Plant Science 9, 203-209.
Wada, H., Matthews, M.A., and Shackel, K.A. (2009). Seasonal pattern of apoplastic solute
accumulation and loss of cell turgor during ripening of Vitis vinifera fruit under field conditions.
Journal of Experimental Botany 60, 1773-1781.
Wada, H., Shackel, K., and Matthews, M.A. (2006). Apoplastic solute accumulation accounts for berry
cell turgor loss before veraison in Vitis vinifera. American Journal of Enology and Viticulture 57,
387A-388A.

155
Wada, H., Shackel, K.A., and Matthews, M.A. (2008). Fruit ripening in Vitis vinifera: apoplastic solute
accumulation accounts for pre-veraison turgor loss in berries. Planta 227, 1351-1361.
Walker, R.R., Blackmore, D.H., and Clingeleffer, P.R. (2010). Impact of rootstock on yield and ion
concentrations in petioles, juice and wine of Shiraz and Chardonnay in different viticultural
environments with different irrigation water salinity. Australian Journal of Grape and Wine
Research 16, 243-257.
Walker, R.R., Blackmore, D.H., Clingeleffer, P.R., and Emanuelli, D. (2014). Rootstock type determines
tolerance of Chardonnay and Shiraz to long-term saline irrigation. Australian Journal of Grape
and Wine Research 20, 496-506.
Wang, L., and Ruan, Y.L. (2013). Regulation of cell division and expansion by sugar and auxin
signaling. Frontiers in Plant Science 4.
Wang, W.H., Chen, J., Liu, T.W., Chen, J., Han, A.D., Simon, M., Dong, X.J., He, J.X., and Zheng, H.L.
(2014). Regulation of the calcium-sensing receptor in both stomatal movement and
photosynthetic electron transport is crucial for water use efficiency and drought tolerance in
Arabidopsis. Journal of Experimental Botany 65, 223-234.
Wang, W.H., Yi, X.Q., Han, A.D., Liu, T.W., Chen, J., Wu, F.H., Dong, X.J., He, J.X., Pei, Z.M., and
Zheng, H.L. (2012). Calcium-sensing receptor regulates stomatal closure through hydrogen
peroxide and nitric oxide in response to extracellular calcium in Arabidopsis. Journal of
Experimental Botany 63, 177-190.
Webb, A.a.R., Larman, M.G., Montgomery, L.T., Taylor, J.E., and Hetherington, A.M. (2001). The role
of calcium in ABA-induced gene expression and stomatal movements. Plant Journal 26, 351-
362.
Whalley, H.J., and Knight, M.R. (2013). Calcium signatures are decoded by plants to give specific gene
responses. New Phytologist 197, 690-693.
White, P.J. (2000). Calcium channels in higher plants. BBA-Biomembranes 1465, 171-189.
White, P.J. (2001). The pathways of calcium movement to the xylem. J. Exp. Bot. 52, 891-899.
156
White, P.J. (2012). "Chapter 3 - Long-distance Transport in the Xylem and Phloem," in Marschner's
Mineral Nutrition of Higher Plants (Third Edition), ed. P. Marschner. (San Diego: Academic
Press), 49-70.
White, P.J., and Broadley, M.R. (2003). Calcium in plants. Annals of Botany 92, 487-511.
Willats, W.G.T., Orfila, C., Limberg, G., Buchholt, H.C., Van Alebeek, G., Voragen, A.G.J., Marcus,
S.E., Christensen, T., Mikkelsen, J.D., Murray, B.S., and Knox, J.P. (2001). Modulation of the
degree and pattern of methyl-esterification of pectic homogalacturonan in plant cell walls -
Implications for pectin methyl esterase action, matrix properties, and cell adhesion. Journal of
Biological Chemistry 276, 19404-19413.
Yu, X.C., Li, M.J., Gao, G.F., Feng, H.Z., Geng, X.Q., Peng, C.C., Zhu, S.Y., Wang, X.J., Shen, Y.Y.,
and Zhang, D.P. (2006). Abscisic acid stimulates a calcium-dependent protein kinase in grape
berry. Plant Physiology 140, 558-579.
Zhu, S.Y., Yu, X.C., Wang, X.J., Zhao, R., Li, Y., Fan, R.C., Shang, Y., Du, S.Y., Wang, X.F., Wu, F.Q.,
Xu, Y.H., Zhang, X.Y., and Zhang, D.P. (2007). Two calcium-dependent protein kinases, CPK4
and CPK11, regulate abscisic acid signal transduction in Arabidopsis. Plant Cell 19, 3019-
3036.
Zoccatelli, G., Zenoni, S., Savoi, S., Dal Santo, S., Tononi, P., Zandona, V., Dal Cin, A., Guantieri, V.,
Pezzotti, M., and Tornielli, G.B. (2013). Skin pectin metabolism during the postharvest
dehydration of berries from three distinct grapevine cultivars. Australian Journal of Grape and
Wine Research 19, 171-179.
Zsivanovits, G., Macdougall, A.J., Smith, A.C., and Ring, S.G. (2004). Material properties of
concentrated pectin networks. Carbohydrate Research 339, 1317-1322.
Zwieniecki, M.A., Melcher, P.J., and Holbrook, N.M. (2001). Hydrogel control of xylem hydraulic
resistance in plants. Science 291, 1059-1062.