the risk and return of arbitrage in dual-listed … ben jacobsen, vijay jog, andrew karolyi, ... the...
TRANSCRIPT

Review of Finance (2009) 13: 495–520doi: 10.1093/rof/rfn031Advance Access publication: 8 January 2009
The Risk and Return of Arbitrage in Dual-ListedCompanies∗
ABE DE JONG1, LEONARD ROSENTHAL2 and MATHIJS A. VAN DIJK3
1Rotterdam School of Management, Erasmus University; 2Bentley University; 3Rotterdam School of
Management, Erasmus University
Abstract. This paper evaluates investment strategies that exploit the deviations from theoreticalprice parity in a sample of 12 dual-listed companies (DLCs) in the period 1980–2002. We show thatsimple trading rules produce abnormal returns of up to almost 10% per annum adjusted for systematicrisk, transaction costs, and margin requirements. However, arbitrageurs face uncertainty about thehorizon at which prices will converge and deviations from parity are very volatile. As a result, DLCarbitrage is characterized by substantial idiosyncratic return volatility and a high incidence of largenegative returns, which are likely to impede arbitrage.
JEL Classification: F30, G14, G15
1. Introduction
Arbitrage plays an important role in financial markets – it brings prices to funda-mental value. However, there is a growing body of research that indicates that thereare important impediments to arbitrage in financial markets. Empirical research has
∗ We are indebted to Marco Pagano (the editor), an anonymous referee, Malcolm Baker, DickBrealey, Greg Bylinsky, Susan Christoffersen, Ian Cooper, Bernard Dumas, Ken French, DavidHirshleifer, Ben Jacobsen, Vijay Jog, Andrew Karolyi, Todd Pulvino, Cameron Rider (Allen ArthursRobinson), Jurgen Rieg, Husayn Shahrur, Andrei Shleifer, Martin Siegel, Ronald van Dijk, TheoVermaelen, a number of anonymous investment professionals, and the investor relations departmentsat various companies for helpful suggestions and discussions. We would especially like to thankRichard Royden (UBS) for his insights on DLC arbitrage. We are grateful to seminar participants atHarvard, INSEAD, Ohio State University, RSM Erasmus University, Tilburg University, Universityof Virginia (Darden), the 2003 Northern Finance Association Meetings in Quebec City (Canada),the 2004 European Finance Association Meetings in Maastricht (The Netherlands), and the 2004Financial Management Association Meetings in New Orleans (LA) for insightful comments. Mathijsvan Dijk is grateful for the hospitality of the Department of Finance at the Fisher College of Business(Ohio State University) where some of the work on this paper was performed. The complete collectionof data, background material, graphs, and results can be obtained from http://mathijsavandijk.com/.
C© The Authors 2009. Published by Oxford University Press on behalf of the European Finance Association.All rights reserved. For Permissions, please email: [email protected]
at Erasm
us University R
otterdam on F
ebruary 11, 2011rof.oxfordjournals.org
Dow
nloaded from

496 A. DE JONG ET AL.
identified fundamental risk, transaction and holding costs, short-sale constraints,and idiosyncratic risk as potentially important barriers to arbitrage.1
We assess the performance of arbitrage strategies in dual-listed companies. Adual-listed company (DLC) structure (also referred to as a “Siamese twin”) involvestwo companies incorporated in different countries contractually agreeing to operatetheir businesses as if they were a single enterprise, while retaining their separatelegal identity and existing stock exchange listings. A well-known example is RoyalDutch/Shell. The shares of the DLC parents represent claims on exactly the sameunderlying cash flows. In integrated and efficient financial markets, stock prices ofthe twin pair should move in lockstep.2
Rosenthal and Young (1990) and Froot and Dabora (1999) show that significantmispricing in three DLCs has existed over a long period of time. Both studiesconclude that fundamental factors (such as currency risk, governance structures,legal contracts, liquidity, and taxation) are not sufficient to explain the magnitude ofthe price deviations. Rosenthal and Young (1990) and Froot and Dabora (1999) donot investigate why arbitrage is not effective in bringing prices back to theoreticalparity even though DLC shares are near-perfect substitutes and despite the fact thatthese are very large and liquid securities that can generally be arbitraged easily. Weevaluate the risk and return of arbitrage strategies using a comprehensive sampleof 12 DLCs during the period 1980–2002. Our analysis of investment strategiesin DLCs is an important contribution to previous studies, because it allows us touncover which impediments prevent arbitrage from eliminating the mispricing. Inparticular, our results indicate that there are limits to arbitrage due to idiosyncraticrisk that inhibit arbitrageurs with capital and horizon constraints from closing theprice gaps in DLCs.
For each DLC, we find large deviations from theoretical price parity. Meanabsolute price discrepancies for individual twins range from roughly 4% to almost12%. Deviations from parity reach values of over 15% for every single DLC in thesample and occasionally attain levels of up to 40%. Mispricing shows substantialvariation over time for all DLCs.
1 Empirical studies include Pontiff (1996) and Gemmill and Thomas (2002) on closed-end funds;Mitchell, Pulvino, and Stafford (2002) on “negative stub value” situations; Lamont and Thaler (2003)on technology stock carve-outs; Mitchell and Pulvino (2001) and Baker and Savasoglu (2002) onmergers and acquisitions.2 Many studies refer to DLCs as a textbook example of arbitrage opportunities. Recent referencesinclude Baker et al. (2008), Barberis and Thaler (2003), Brealey et al. (2006, chapter 13), Danielet al. (2002), Ritter (2003), Shleifer (2000, chapter 2), and Thaler (1999).
at Erasm
us University R
otterdam on F
ebruary 11, 2011rof.oxfordjournals.org
Dow
nloaded from

THE RISK AND RETURN OF ARBITRAGE IN DUAL-LISTED COMPANIES 497
We design arbitrage strategies in DLCs based on the premise that convergenceto theoretical parity occurs after large price discrepancies. We control for marketfrictions by taking into account realistic estimates of brokerage commissions, bid-ask spreads, short rebates, and capital requirements. Incorporating transaction costsand margin requirements, arbitrage in all DLCs combined generates abnormalreturns of up to almost 10% per annum.
An important characteristic of DLC arbitrage is that the underlying shares arenot convertible into each other. Hence, risky arbitrage positions must be kept openuntil prices converge. In contrast, arbitrage in cross-listed stocks involves the sameunderlying share, which allows for (almost) instantaneous arbitrage. Gagnon andKarolyi (2004) document the mechanics of arbitrage in cross-listed stocks and showthat deviations between the prices of cross-listed stocks and stock prices in the homemarket are typically below 1%, which suggests that arbitrage succeeds in keepingthe prices of cross-listed stocks at parity.
Since there is no identifiable date at which DLC prices will converge, arbitrageurswith limited horizons who are unable to close the price gap on their own faceconsiderable uncertainty. In some cases, arbitrageurs would have to wait for almostnine years before prices have converged and the position is closed. In the short run,the mispricing might deepen. In these situations, arbitrageurs receive margin calls,after which they would most likely be forced to liquidate part of the position at ahighly unfavorable moment and suffer a loss.
The substantial time-series variability of the deviations from parity results in ahigh volatility of arbitrage returns – almost all of which is idiosyncratic relative towell-known asset pricing models. The annualized idiosyncratic volatility is greaterthan 30% for all strategies and the daily 1% Value-at-Risk is around −4.0%. Thesefindings suggest that idiosyncratic risk (and in particular the fat left tail of the returndistribution) deters arbitrage in DLCs, consistent with the arguments of Shleiferand Vishny (1997) and Pontiff (2006).
Our results are robust to variations in the parameters of the arbitrage strategiesand our transaction costs assumptions. We show that trading in different time zonesand currencies cannot explain our results by running the same tests for severalDLCs whose shares trade in the U.S. The unification of six of the DLCs to a sin-gle structure provides further evidence on the persistence of the mispricing. Sinceprices are almost certain to converge within a limited time period after the uni-fication announcement, arbitrageurs no longer face horizon risk, which suggeststhat the mispricing should be eliminated immediately. Consistent with this conjec-ture, we observe a sharp movement toward parity around the announcement datefor all six twins. Profitable arbitrage opportunities become scarce after unificationannouncement.
at Erasm
us University R
otterdam on F
ebruary 11, 2011rof.oxfordjournals.org
Dow
nloaded from

498 A. DE JONG ET AL.
2. Sample Description
2.1 THE STRUCTURE OF DUAL-LISTED COMPANIES
We investigate the limits of arbitrage in a sample of all 12 dual-listed companiesthat have existed for at least 12 months during the period 1980–2002.3 DLCs arethe result of a merger between two firms incorporated in different countries inwhich the firms agree to combine their activities and cash flows. At the same time,the corporations keep separate shareholder registries and identities and distributethe cash flows to their shareholders using a ratio laid out in the “equalizationagreement.” The equalization agreements are set up in such a way that equaltreatment of both companies’ shareholders in voting and cash flow rights is ensuredunder all circumstances. The contracts cover issues that determine the distribution ofthese legal and economic rights between the twin parents, including issues relatedto dividends, liquidation, and corporate governance. Baker & McKenzie (2001)and the Reserve Bank of Australia (2002) discuss the motivations to adopt a DLCstructure instead of a regular merger.
DLCs can be structured in three ways (U.K. Panel on Takeovers and Mergers,2002). The most common structure is the “combined entities structure.” The keycharacteristic is that the assets of the two companies are held by one or more jointly-owned holding companies. The latter pay dividends to the two companies using apredetermined ratio as outlined in the equalization agreement. The dividends aresubsequently distributed to the shareholders of the two companies. The two compa-nies each have their own shareholder base, domiciles, and listings. Alternatively, inthe “separate entities structure,” the operating activities remain fully owned by eachof the two merged companies. The companies also retain their domiciles, listings,and shareholders. There is a contractual agreement between the twins to providefor equalized payments to shareholders. Finally, in the “stapled stock structure,”shares in each firm are “stapled” to each other. Smithkline Beecham issued “equityunits” (consisting of 5 class B ordinary shares stapled to one preferred share) to theformer shareholders of the U.S. based Smithkline Beckham Group, while formershareholders of Beecham Group PLC (a U.K. company) received class A ordinaryshares in the new company. The dividends to one class A share are equalized to thedividends of one stapled equity unit.
Table I lists the structure used by each of the 12 DLCs in our sample as well astheir date of merger. The two eldest twins are the Anglo-Dutch combinations RoyalDutch/Shell and Unilever NV/PLC. Extensive descriptions of these twins can befound in Rosenthal and Young (1990) and Froot and Dabora (1999). In 1991, more
3 Bedi et al. (2003) also describe a sample of DLCs, but they focus on the transition from a DLC to aunified structure. Scruggs (2007) uses data on two DLCs to construct a measure of noise trader risk.
at Erasm
us University R
otterdam on F
ebruary 11, 2011rof.oxfordjournals.org
Dow
nloaded from

THE RISK AND RETURN OF ARBITRAGE IN DUAL-LISTED COMPANIES 499
Table I. Description of the DLCs
This table presents an overview of all 12 dual-listed companies (DLCs) in the sample. The firstcolumn depicts the name of the DLC as well as the countries in which the parent companies arelisted. The time differential between the two countries in hours is provided in parentheses. All twinsare defined in such a way that the country of the first part of the twin is in an earlier time zone thanthe country of the second part of the twin. The second column presents information on the structureof the DLC, while column 3 shows the date of the DLC creation. For 6 of the 12 DLCs, columns 4and 5 give the date on which the unification of the share structure was announced and the last tradingday before unification.
DLC Unification UnificationCountry 1/Country 2 (time diff.) DLC type Merger Date Announced Date
Royal Dutch/Shell Combined EntitiesNetherlands/United Kingdom (–1) Structure 02.15.1907 10.28.2004 7.20.2005Unilever Separate EntitiesNetherlands/United Kingdom (–1) Structure 1930 − −ABB Combined EntitiesSwitzerland/Sweden (0) Structure 07.08.1991 02.04.1999 06.25.1999Smithkline Beecham Stapled StockUnited Kingdom/United States (–5) Structure 07.26.1989 02.20.1996 04.12.1996Fortis Combined EntitiesNetherlands/Belgium (0) Structure 12.12.1990 08.28.2000 12.14.2001Elsevier/Reed International Combined EntitiesNetherlands/United Kingdom (–1) Structure 01.01.1993 − −Rio Tinto Separate EntitiesAustralia/United Kingdom (–10) Structure 12.21.1995 − −Dexia Combined EntitiesFrance/Belgium (0) Structure 11.19.1996 09.19.1999 11.26.1999Merita/Nordbanken Combined EntitiesFinland/Sweden (–1) Structure 12.15.1997 09.20.1999 03.24.2000Zurich Allied/Allied Zurich Combined EntitiesSwitzerland/United Kingdom (–1) Structure 09.07.1998 04.17.2000 10.13.2000BHP Billiton Separate EntitiesAustralia/United Kingdom (–10) Structure 06.29.2001 − −Brambles Industries Separate EntitiesAustralia/United Kingdom (–10) Structure 08.07.2001 − −
than fifty years after the formation of the previous DLC, ABB, a Swiss-Swedishengineering group was created. This DLC set the stage for subsequent DLCs.Seven of the 12 pairs have a combined entities structure, four have a separateentities structure, and one has a stapled structure.
2.2 DATA
We collect daily stock prices, total returns in local currency, bid and ask prices,trading volume, and the number of shares outstanding from Datastream. Bid andask prices and trading volume are generally not available in the first years of the
at Erasm
us University R
otterdam on F
ebruary 11, 2011rof.oxfordjournals.org
Dow
nloaded from

500 A. DE JONG ET AL.
sample. Datastream does not supply bid-ask prices for Nordbanken AB and bid-ask prices and volume data for ABB AB, the Swedish part of the ABB twin. ForABB AB, daily bid-ask prices and volume data are obtained from Bloomberg. Asdata on the Smithkline Beecham Equity Units (class E shares) are not available onDatastream, we use daily data from Bloomberg for the Smithkline Beecham H andE shares. The sample period for Royal Dutch/Shell and Unilever is January 1, 1980to October 3, 2002. The sample period for all other twins starts at the date of themerger and ends either 20 trading days before the announcement date of the shareunification or at the last date in our full sample period.
We extract information about the theoretical price ratio of the twin prices fromcorporate annual reports, the merger prospectus, and/or the unification prospectus.For 6 out of 12 twins, the theoretical price ratio is equal to 1:1. For the othersix twins, we apply the procedure outlined in Rosenthal and Young (1990) for thecalculation of the theoretical price ratio. This involves taking account of the numberof shares outstanding for both parts of the twin, as the current and future equityflows of these twin pairs are fixed at a specified ratio.
Daily exchange rates are obtained from Datastream. For domestic stock marketindices we use the ASX All Ordinaries index for Australia, the Brussels Allshareindex for Belgium, the SBF 250 index for France, the Helsinki HEX index forFinland, the CBS Allshare index for the Netherlands, the Stockholmborsen Allshareindex for Sweden, the Swiss Performance index for Switzerland, the FTSE Allshareindex for the U.K., and the S&P 500 index for the U.S. All indices are fromDatastream, except for the FTSE and the S&P indices used for the SmithklineBeecham twin, which are taken from Bloomberg. The Datastream World MarketIndex is used as the global market portfolio. Data on the 3-month Treasury Billrate are from the website of the Federal Reserve Bank of St. Louis. We obtain dailyreturns on the Fama-French SMB and HML factors from Kenneth French’s website.
3. Results
3.1 DEVIATIONS FROM THEORETICAL PARITY
Figure 1 depicts graphs of the log deviations of the relative price from theoreticalparity for the eldest DLC (Royal Dutch/Shell) and the youngest DLC (Brambles) inour sample. Table II presents summary statistics of the price differentials for eachtwin. Log deviations from parity are often very large and they fluctuate considerablyover time. The mean absolute price differential ranges from 4.11% (Rio Tinto) to11.93% (Zurich Allied/Allied Zurich). For all of the twins, the deviation fromtheoretical parity exceeds 15% in absolute value at some point in time. For 5 (2)out of 12 twins, absolute price gaps amounting to 20% (35%) or more occur.
at Erasm
us University R
otterdam on F
ebruary 11, 2011rof.oxfordjournals.org
Dow
nloaded from

THE RISK AND RETURN OF ARBITRAGE IN DUAL-LISTED COMPANIES 501
Royal Dutch / Shell
−40%
−30%
−20%
−10%
0%
10%
20%
30%
40%
1/1/1980 1/1/1983 1/1/1986 1/1/1989 1/1/1992 1/1/1995 1/1/1998 1/1/2001
Per
cen
t D
evia
tio
n
Brambles
−40%
−30%
−20%
−10%
0%
10%
20%
30%
40%
8/7/01 10/7/01 12/7/01 2/7/02 4/7/02 6/7/02 8/7/02
Per
cen
t D
evia
tio
n
Figure 1. Log deviations from parity.This figure shows the log deviations from theoretical parity (on a percentage basis) for 2 of the 12dual-listed companies (DLCs) in the sample. The graphs of the log deviations for the other DLCs areavailable from the authors.
The substantial time-series standard deviations depicted in the third column ofTable II indicate that deviations from parity exhibit great variation over time formost twins. For all but two twins, the deviation from theoretical parity assumes bothpositive and negative values over the sample period. The price discrepancy changesfrom negative to positive (or vice versa) frequently for many twins. There is littleindication that the price gap is smaller (or larger) for twins that were established
at Erasm
us University R
otterdam on F
ebruary 11, 2011rof.oxfordjournals.org
Dow
nloaded from
502 A. DE JONG ET AL.
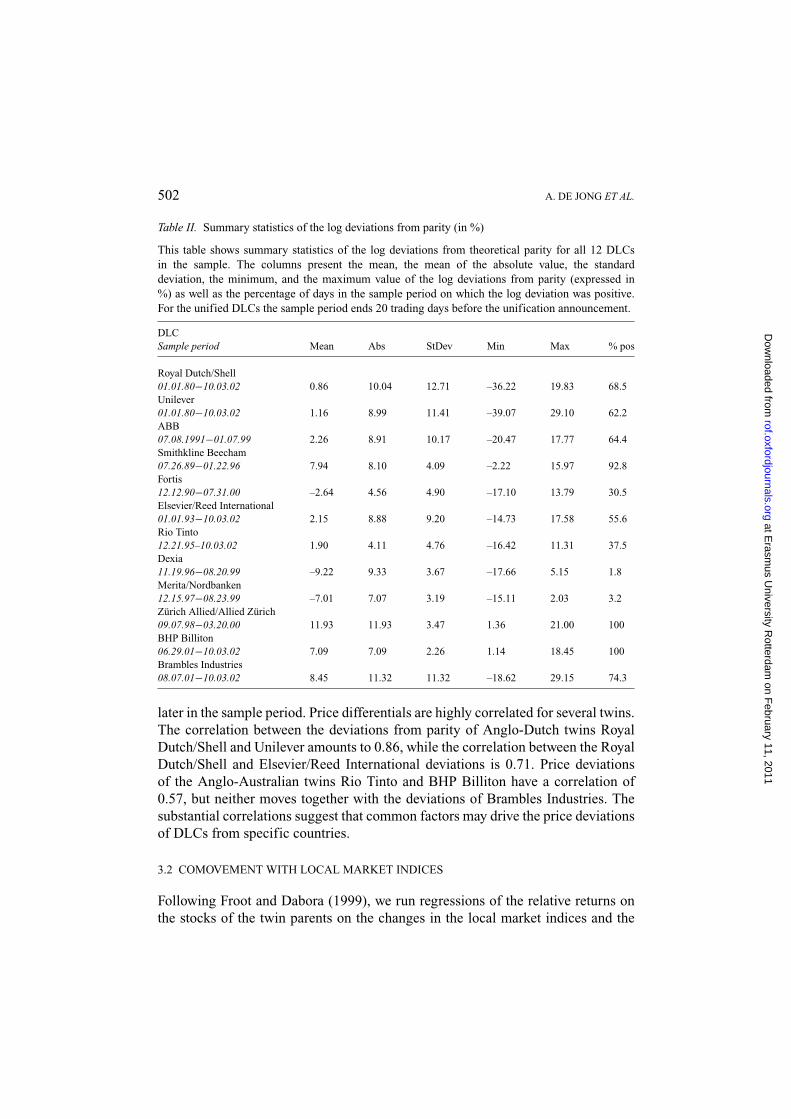
Table II. Summary statistics of the log deviations from parity (in %)
This table shows summary statistics of the log deviations from theoretical parity for all 12 DLCsin the sample. The columns present the mean, the mean of the absolute value, the standarddeviation, the minimum, and the maximum value of the log deviations from parity (expressed in%) as well as the percentage of days in the sample period on which the log deviation was positive.For the unified DLCs the sample period ends 20 trading days before the unification announcement.
DLCSample period Mean Abs StDev Min Max % pos
Royal Dutch/Shell01.01.80−10.03.02 0.86 10.04 12.71 –36.22 19.83 68.5Unilever01.01.80−10.03.02 1.16 8.99 11.41 –39.07 29.10 62.2ABB07.08.1991−01.07.99 2.26 8.91 10.17 –20.47 17.77 64.4Smithkline Beecham07.26.89−01.22.96 7.94 8.10 4.09 –2.22 15.97 92.8Fortis12.12.90−07.31.00 –2.64 4.56 4.90 –17.10 13.79 30.5Elsevier/Reed International01.01.93−10.03.02 2.15 8.88 9.20 –14.73 17.58 55.6Rio Tinto12.21.95–10.03.02 1.90 4.11 4.76 –16.42 11.31 37.5Dexia11.19.96−08.20.99 –9.22 9.33 3.67 –17.66 5.15 1.8Merita/Nordbanken12.15.97−08.23.99 –7.01 7.07 3.19 –15.11 2.03 3.2Zurich Allied/Allied Zurich09.07.98−03.20.00 11.93 11.93 3.47 1.36 21.00 100BHP Billiton06.29.01−10.03.02 7.09 7.09 2.26 1.14 18.45 100Brambles Industries08.07.01−10.03.02 8.45 11.32 11.32 –18.62 29.15 74.3
later in the sample period. Price differentials are highly correlated for several twins.The correlation between the deviations from parity of Anglo-Dutch twins RoyalDutch/Shell and Unilever amounts to 0.86, while the correlation between the RoyalDutch/Shell and Elsevier/Reed International deviations is 0.71. Price deviationsof the Anglo-Australian twins Rio Tinto and BHP Billiton have a correlation of0.57, but neither moves together with the deviations of Brambles Industries. Thesubstantial correlations suggest that common factors may drive the price deviationsof DLCs from specific countries.
3.2 COMOVEMENT WITH LOCAL MARKET INDICES
Following Froot and Dabora (1999), we run regressions of the relative returns onthe stocks of the twin parents on the changes in the local market indices and the
at Erasm
us University R
otterdam on F
ebruary 11, 2011rof.oxfordjournals.org
Dow
nloaded from
THE RISK AND RETURN OF ARBITRAGE IN DUAL-LISTED COMPANIES 503
relevant currency changes. Estimation results, presented in Table III, show that therelative return differentials of all 12 twins exhibit strong comovement with localmarket indices. The signs of all coefficients on the domestic market returns are aspredicted by the comovement effect and 22 out of 24 coefficients are statisticallysignificant. The economic importance of the comovement effect is substantial andthe R2 of the regressions ranges from 10% to 40%. Other empirical studies alsofind evidence of comovement effects, see, e.g., Bodurtha et al. (1995), Chan et al.(2003), and Gagnon and Karolyi (2004).
3.3 ARBITRAGE STRATEGIES
Our main analysis concerns the performance of arbitrage strategies in the 12 DLCsin our sample. We specify investment strategies involving a long position in therelatively underpriced part of the twin and shorting an equal dollar amount in therelatively overpriced part of the twin. In a frictionless market this strategy is a zero-cost investment. However, in practice arbitrageurs must post collateral for this trade.We investigate the investment strategy from the perspective of U.S. arbitrageurs. Weimpose Regulation T initial margin requirements equal to 50% of the long marketvalue and 50% of the short market value. Since some of the DLCs have never tradedin the U.S., we bias our results against finding significant trading profits by havingthe arbitrageurs subject to the stricter U.S. shorting and margin rules. We assumethat cash balances receive 5% per year and margin loans pay 5.5% annually. Dailyreturns are calculated on the basis of daily equity values. Following Mitchell et al.(2002), we assume that the short rebate is equal to 3% per year.4
We initially disregard currency risk in our analysis of DLC arbitrage, since weexpect the impact of currency risk hedging on the arbitrage strategies to be neg-ligible. Froot and Dabora (1999, p. 211) show that under reasonable assumptionsabout dividend payments and exchange rate volatility the impact of currency risk isvery small. Additionally, implementing a currency hedging strategy is inexpensive,so currency risk is unlikely to materially affect our findings. We provide an investi-gation of the importance of risk due to currency differences in DLCs in section 5.1below.
Our trading strategy requires the investors to specify three different parame-ters. First, we assume that investors set up an arbitrage position when the price
4 These assumptions imply a borrowing fee of 200 basis points, which is considerably larger thanthe average lending fee estimates provided by Saffi and Sigurdsson (2007) for the countries in oursample. While these estimates are limited to the period 2004–2006, borrowing fees for the large andheavily traded stocks in our sample are likely to be significantly lower than the average over a largenumber of stocks in each country. Moreover, conversations with industry practitioners indicated thatequity lending in the U.S. is available for many of the twin stocks. Section 5.3 reports that our resultsare insensitive to changes in the borrowing fee.
at Erasm
us University R
otterdam on F
ebruary 11, 2011rof.oxfordjournals.org
Dow
nloaded from

504A
.DE
JON
GE
TA
L.
Table III. Log deviations from parity and comovementThis table reports regression estimates of the equation:
rA,t − rB,t = α + β (rA,t−1 − rB,t−1) +1∑
i=0
γ1i I ndex1t+i +
0∑
j=−1
γ2j I ndex2t+ j +
1∑
k=−1
δke.r.t+k + εt ,
where A and B represent the twin pair, rA,t and rB,t are the log returns on day t of the first and the second part of the DLC in their local currencies,respectively (Table I defines what the first and the second part is), Index1 and Index2 denote the log returns of the domestic market indicescorresponding to twin A (country 1) and twin B (country 2), and e.r. represents the log changes in the exchange rate between the currencies of thefirst and the second part of the twin. In regressions of the return difference of twins for which there is no time difference only contemporaneousreturns of the domestic market indices are incorporated. Columns depict the twin, the sample period, the adjusted R2, the Durbin-Watson statistic,the degrees of freedom, and the cumulative coefficients on all four independent variables in the regression. For the unified DLCs the sample periodends 20 trading days before the unification announcement. a, b, and c, indicate significance at the 1%, 5%, and 10% level for Wald tests that the sumof all coefficients (lead/lag and current value) is equal to zero. Newey-West standard errors are employed in order to correct for heteroskedasticityand autocorrelation.
Durbin- Degrees of Lagged dep. Market index Market index ExchangeDLC Sample period R2 Watson freedom variable country 1 country 2 rate
Royal Dutch/Shell 01.01.80−10.03.02 0.242 2.03 5927 –0.231a 0.346a –0.501a –0.806a
Unilever 01.01.80−10.03.02 0.146 2.06 5927 –0.216a 0.170a –0.560a –0.595a
ABB 07.08.91−01.07.99 0.155 2.03 1952 –0.119a 0.433a –0.399a –0.509a
Smithkline Beecham 07.26.89−01.22.96 0.132 2.14 1527 –0.299a 0.086c –0.248a 0.031Fortis 12.12.90−07.31.00 0.104 1.99 2506 –0.163a 0.476a –0.537a –0.580b
Elsevier/Reed International 01.01.93−10.03.02 0.197 2.14 2534 –0.319a 0.331a –0.417a –0.772a
Rio Tinto 12.21.95−10.03.02 0.272 2.15 1760 –0.296a 0.431a –0.741a –0.524a
Dexia 11.19.96−08.20.99 0.100 2.18 708 –0.216a 0.290a –0.324a –0.319Merita/Nordbanken 12.15.97−08.23.99 0.246 2.09 431 –0.371a 0.463a –0.445a –0.139Zurich Allied/Allied Zurich 09.07.98−03.20.00 0.091 2.03 390 –0.153a 0.155 –0.354b –0.928a
BHP Billiton 06.29.01−10.03.02 0.397 2.21 319 –0.280a 0.459b –0.709a –0.647b
Brambles Industries 08.07.01−10.03.02 0.288 2.00 293 –0.005 0.343 –0.866a –0.567
at Erasmus University Rotterdam on February 11, 2011 rof.oxfordjournals.org Downloaded from

THE RISK AND RETURN OF ARBITRAGE IN DUAL-LISTED COMPANIES 505
discrepancy (measured by the log deviations from parity) crosses a certain “buythreshold.” Secondly, the investors need to determine the “sell threshold” for thelog deviations from parity, at which point the arbitrage position is terminated. Fi-nally, the investors can choose a maximum investment horizon, after which anyinvestment is interrupted. We impose the condition that the arbitrageur holds atmost one position in each twin at each point in time (in order to arrive at a conser-vative estimate of arbitrage profits) and we discard any open positions at the endof the sample period. We also assume that when a strategy terminates within onemonth, the arbitrageur invests the investment proceeds in the 3-month T-bill forthe remainder of the month. This assumption prevents investment strategies withmodest daily returns, but very short durations from having a large influence onthe results. We use daily closing prices to assess the profitability of the strategy.We potentially bias our results against finding significant trading profits, becausearbitrageurs may be able to pick more favorable buy and sell opportunities duringthe day. The establishment of a new arbitrage position is conditional on the pricesobserved on the previous day, which makes our trading rules feasible in practice.
Our analysis incorporates transaction costs and maintenance margin require-ments. Based on conversations with a number of large investment firms, we use the(conservative) assumption that arbitrageurs pay a commission of 25 basis points pertransaction. In addition, setting up an arbitrage position involves a cost of half thebid-ask spread for both of the twin stocks. Arbitrage returns are calculated assum-ing a bid-ask spread of 40 basis points, which is the median bid-ask spread of all24 twin stocks in the sample. The main reason for using the median bid-ask spreadis that the bid-ask spread data from Datastream are not sufficiently reliable. Dataon spreads are only available for a small part of the sample period (for most stocksdata are not available before the late 1990s) and exhibit frequent missing valuesand outliers. A bid-ask spread of 40 basis points is realistic in comparison withtrading cost estimates provided by Chiyachantana et al. (2004), Froot and Perold(1997), Hupperets and Menkveld (2002), and the annual Elkins/McSherry tradingcosts survey. (Unreported results show that using the average bid-ask spread foreach individual DLC as an estimate for the variable transaction costs yields similarfindings.) Our analysis abstracts from the costs of doing the currency translation.These transactions costs are generally only a few basis points and are unlikely tohave a significant impact on our results.
The arbitrageur receives a margin call if twin prices move such that the positionreaches the minimum required maintenance margin of 25% for long positionsand 30% for short positions (following NYSE and Nasdaq regulations). After amargin call, the arbitrageur responds by partially liquidating the position. Thatis, the arbitrageur unwinds the smallest possible fraction of the long and the shortposition that generates enough additional equity in the account to satisfy the margin
at Erasm
us University R
otterdam on F
ebruary 11, 2011rof.oxfordjournals.org
Dow
nloaded from

506 A. DE JONG ET AL.
requirements. The partial liquidation leads to a negative return on that day, as themispricing has deepened. The account is marked to market each day.
Table IV reports the results of an investment strategy with a buy threshold of10%, a sell threshold of 5%, and a maximum horizon of one year (260 tradingdays). Over the sample period 1980–2002, a U.S. arbitrageur would have set up136 positions in the DLCs in the sample, indicating notable arbitrage activity. Forexample, the strategy would have generated positions in Royal Dutch/Shell lastingroughly seven and a half years in total, or one third of the sample period. Thereis a significant amount of variation in the investment horizon across the arbitragepositions. All 12 twins generate at least one arbitrage strategy that lasts shorter thanone month (22 trading days), while in total 18 arbitrage positions (distributed oversix twins) are interrupted after one year.
Following the arbitrage strategy for all twins in the sample would have yielded anaverage return of 1.18% per month (14.2% per annum). Returns exhibit considerabledispersion, both across twins and for each individual DLC. Median returns forindividual twins vary between 0.14% to over 5% per month. Roughly 9% of thepositions (11 out of 127) produce negative investment returns. Negative returnsare associated with positions terminated at the end of the maximum horizon at anunfavorable point in time. In some cases, termination after one year yields a lossof up to 16.5% (i.e., 12 times the reported return of −1.374% on a monthly basis)of the arbitrageur’s total invested capital. More than 10% of the 127 investmentstrategies result in one or more margin calls. Most of these investments receive anumber of subsequent margin calls forcing the arbitrageur to partially liquidate theposition, as the mispricing deepens for several days in a row.
In order to determine the sensitivity of our return calculations to the thresholdsand the horizon, we present returns for buy/sell thresholds of 10%/5% and 5%/1%and horizons of one month, three months, and one year, as well as unlimited horizonresults in Table V. The table presents the results of eight different trading rulesaggregated over all twins. All strategies produce a considerable number of arbitragepositions (ranging from 112 to 309 positions) and weighted-average monthly returnsof up to 1.238% per month. The number of strategies decreases with the investmenthorizon, as long horizons prevent other positions from being set up in the sameperiod. For the unlimited horizon strategies in particular, investment horizons ofindividual arbitrage positions exhibit substantial variation. Although the majorityof investments last only one month, the average horizon is about 4.5 (6) monthsfor the 10%/5% (5%/1%) case and some positions are open for several yearsbefore convergence takes place. Reducing the uncertainty about the length of theinvestment horizon comes at a cost. The termination of positions before convergenceoccurs leads to negative returns. For instance, for the strategies with a maximumhorizon of one month, more than half of the arbitrage positions result in a negativereturn. The losses may be very large for individual arbitrage positions (up to 23% of
at Erasm
us University R
otterdam on F
ebruary 11, 2011rof.oxfordjournals.org
Dow
nloaded from

TH
ER
ISK
AN
DR
ET
UR
NO
FA
RB
ITR
AG
EIN
DU
AL
-LIS
TE
DC
OM
PAN
IES
507Table IV. Arbitrage strategies with a 10% buy threshold and a 5% sell threshold with transaction costs and margin calls
This table reports the returns of arbitrage strategies that involve obtaining a long position in the relatively underpriced part of the twin and shortingan equal dollar amount in the other part of the twin. At most one arbitrage position is maintained at each point in time. Positions are initiated(terminated) when the absolute price deviation crosses the buy (sell) threshold. Positions are also terminated after 1 year (260 trading days), nomatter what the price deviation is at the time. Open positions at the end of the sample period are not taken into account. For positions that last lessthan 1 month (22 trading days), the investment proceeds are invested in the 3-month T-bill for the remainder of the month. Transaction costs arecomposed of a commission of 25 basis points per transaction plus half of the bid-ask spread of 40 basis points. Returns are calculated assumingRegulation T initial and maintenance margin requirements. When margin calls are received, positions are partially liquidated such that maintenancemargin requirements are satisfied. The first (second) column depicts the number of arbitrage positions that are long (short) in twin A, the first partof the DLC, and short (long) in twin B, the second part. In addition, the table presents the mean, median, minimum, and maximum number of daysinvested, the weighted average of the arbitrage returns expressed in % per month (where the weights are determined by the number of days for whicheach position is maintained), the median, minimum, and maximum return expressed in % per month, the number of strategies interrupted becausethe maximum horizon is exceeded, the number of strategies with negative returns, and the number of strategies for which one or more margin callsare received. For the unified DLCs the sample period ends 20 trading days before the unification announcement.
# Long A # Short A Mean Median Min/Max Mean Return Median Return Min Return Max Return # Cut-Off # Return # MarginDLC Short B Long B # Days # Days # Days (w.% p.m.) (% p.m.) (% p.m.) (% p.m.) < 0 Calls
Royal Dutch/Shell 3 12 126.0 70 22/260 0.492 1.460 –0.728 5.393 5 2 3Unilever 10 21 88.6 22 22/260 1.134 4.346 –1.374 13.044 5 4 6ABB 5 5 96.7 77 22/260 0.920 3.607 –0.393 6.960 1 1 1Smithkline Beecham 0 6 167.7 260 22/260 0.147 0.680 –0.464 3.976 3 2 2Fortis 14 4 32.8 22 22/99 3.760 4.677 0.805 9.589 0 0 0Elsevier/Reed International 6 7 116.2 80 22/260 0.694 1.095 –0.573 9.552 3 1 1Rio Tinto 11 2 24.6 22 22/40 5.054 5.140 2.539 8.250 0 0 0Dexia 4 0 124.5 46 22/260 0.917 1.179 –0.318 5.385 1 1 1Merita/Nordbanken 4 0 55.3 22 22/148 2.150 2.885 0.513 8.627 0 0 0Zurich Allied/Allied Zurich 0 3 133.0 123 22/254 1.062 1.249 0.712 4.058 0 0 0BHP Billiton 0 5 23.0 22 22/27 4.238 3.703 2.930 6.705 0 0 0Brambles Industries 1 4 30.6 22 22/65 3.106 3.830 0.764 6.056 0 0 0Total 58 69 82.0 25 22/260 1.180 3.703 –1.374 13.044 18 11 14
at Erasmus University Rotterdam on February 11, 2011 rof.oxfordjournals.org Downloaded from

508A
.DE
JON
GE
TA
L.
Table V. Summary of arbitrage strategies
This table reports the returns of combined arbitrage strategies in all twins after taking account of transaction costs and margin requirements. Theset-up of the arbitrage positions is described in Table IV. The first (second) column depicts the number of arbitrage positions that are long (short)in twin A, the first part of the DLC, and short (long) in twin B, the second part. In addition, the table presents the mean, median, minimum, andmaximum number of days invested, the weighted average of the arbitrage returns expressed in % per month (where the weights are determined bythe number of days for which each position is maintained), the median, minimum, and maximum return expressed in % per month, the number ofstrategies interrupted because the maximum horizon is exceeded, the number of strategies with negative returns, and the number of strategies forwhich one or more margin calls are received. For the unified DLCs the sample period ends 20 trading days before the unification announcement.
Buy Threshold/Sell # Long A # Short A Mean Median Min/Max Mean Return Median Return Min Return Max Return # Cut-Off # Return # MarginThreshold/Horizon Short B Long B # Days # Days # Days (w.% p.m.) (% p.m.) (% p.m.) (% p.m.) < 0 Calls
5%/1%/1 month 135 174 22.0 22 22/22 –0.009 –0.560 –15.154 11.704 218 170 45%/1%/3 months 93 112 44.6 50 22/65 0.558 1.653 –6.726 11.704 89 77 135%/1%/12 months 73 83 83.4 32 22/260 0.892 2.487 –0.992 11.704 21 17 195%/1%/∞ 68 70 126.8 23 22/2321 0.780 2.878 –0.124 11.704 0 1 2010%/5%/1 month 107 181 22.0 22 22/22 0.432 0.074 –23.523 13.044 215 140 310%/5%/3 months 75 109 46.0 62 22/65 1.064 1.815 –7.650 13.044 88 57 910%/5%/12 months 58 69 82.0 25 22/260 1.180 3.703 –1.374 13.044 18 11 1410%/5%/∞ 53 59 100.1 22 22/1322 1.238 4.081 0.098 13.044 0 0 10
at Erasmus University Rotterdam on February 11, 2011 rof.oxfordjournals.org Downloaded from

THE RISK AND RETURN OF ARBITRAGE IN DUAL-LISTED COMPANIES 509
total capital for some strategies). Moreover, transaction costs have a more negativeimpact on returns for short horizon strategies. Imposing a maximum horizon ofonly one month with buy/sell thresholds of 5%/1% leads to negligible arbitragereturns as a result of very high transaction costs. On the other hand, longer horizonsmay lead to lower average returns, because positions that are open for a long timehave positive, but very small monthly returns and a large weight in the weighted-average return. The overall effect is that average arbitrage returns are higher atlonger horizons.
Taken as a whole, the results presented in Tables IV and V suggest that invest-ment strategies in the 12 DLCs in our sample produce significant arbitrage returns.Arbitrage in DLCs is not risk-free, however. Uncertainty over the time to conver-gence is large, and arbitrageurs regularly receive a sequence of margin calls. Inaddition, imposing a maximum horizon leads to a large fraction of positions thatyield (potentially large) negative returns.
4. Arbitrage Risk and the Limits of Arbitrage
This section presents an analysis of the risk of the arbitrage strategies in DLCs.As a starting point of the analysis we measure abnormal arbitrage returns aftercorrecting for systematic risk. Table VI displays estimates of the abnormal return(alpha) relative to the Fama-French three-factor model for all eight investmentstrategies described in Table V. Alphas are obtained from time-series regressionsof daily portfolio returns in excess of the 3-month T-bill rate on the excess return onthe S&P 500 index and the size (SMB) and book-to-market (HML) factors. Dailyportfolio returns are constructed by pooling the daily returns on the individualinvestment positions after incorporating transaction costs and maintenance marginrequirements. Out of the eight strategies analyzed, five produce alphas that arestatistically significant at the 5% level or better. Average alphas on these strategiesrange from 3.7% to 8.9% on an annual basis. Only strategies with a very shortmaximum horizon do not generate positive alphas. Inspired by Jorion and Schwartz(1996) and Foerster and Karolyi (1999), we also compute alphas relative to anInternational Asset Pricing Model (IAPM) that includes the global market portfolioand the local market portfolios corresponding to each of the twin parents. TheIAPM alphas reported in Table VI are very similar to the alphas of the Fama-Frenchthree-factor model with values of up to 9.5%.
Although abnormal returns on simple DLC arbitrage strategies seem economi-cally large, DLC arbitrage is characterized by a high degree of uncertainty aboutconvergence of the mispricing. Some of the DLCs have existed for a very long time.As shown in section 3, price discrepancies in DLCs are very volatile and often as-sume large values for prolonged periods of time. As a result, arbitrage positions can
at Erasm
us University R
otterdam on F
ebruary 11, 2011rof.oxfordjournals.org
Dow
nloaded from

510A
.DE
JON
GE
TA
L.
Table VI. Abnormal returns and risk of arbitrage strategies
This table reports the abnormal returns of the arbitrage strategies presented in Table V, obtained as the intercept (alpha) in two different regressionmodels of the daily excess returns (expressed in % per month) on all the individual positions in the twins for all eight arbitrage strategies:(i) the Fama-French three-factor model (FF 3-F) including the (excess) returns on the S&P 500 index, the SMB and the HML portfolioand (ii) an International Asset Pricing Model (IAPM) including the excess returns on the global market portfolio and two domestic marketportfolios corresponding to each of the twin parents. Arbitrage returns are calculated after transaction costs and Regulation T initial and maintenancemargin requirements are imposed. Columns present the arbitrage strategy analyzed, the number of individual investment positions generated by thisstrategy (total number of days invested in parentheses), the estimates of the Fama-French alpha and the IAPM alpha expressed in % per month (factorloadings are suppressed to conserve space), the annualized abnormal return of the portfolio (based on both estimates of alpha), the volatility (σ) ofexcess arbitrage returns, the volatility (σ) of abnormal returns on the S&P 500 over the same period (for comparison purposes), the idiosyncraticvolatility (σε) relative to the FF 3-F model and the IAPM, and finally the skewness, the kurtosis, and the 1% Value-at-Risk of the arbitrage returndistribution. a, b, and c, indicate significance at the 1%, 5%, and 10% level.
Buy Threshold/Sell # Investments FF 3-F Annualized IAPM AnnualizedThreshold /Horizon (# Days) Alpha Abnormal Alpha Abnormal
Return Return σ σ S&P 500 FF 3-F σε IAPM σε Skewness Kurtosis 1% VAR
5%/1%/1 month 309(6,798) –0.415 –5.0% –0.416 –5.0% 34.6% 23.6% 34.5% 34.4% 0.46 12.4 –4.6%
5%/1%/3 months 205(9,148) 0.159 1.9% 0.126 1.5% 34.5% 23.8% 34.4% 34.3% 0.40 11.6 –4.5%
5%/1%/12 months 156(13,019) 0.457b 5.5% 0.447b 5.4% 33.5% 22.6% 33.4% 33.3% 0.34 11.0 –4.2%
5%/1%/∞ 138(17,505) 0.310b 3.7% 0.333b 4.0% 31.6% 22.1% 31.5% 31.4% 0.29 10.8 –4.0%
10%/5%/1 month 288(6,339) 0.011 0.1% 0.033 0.4% 31.0% 24.0% 30.9% 30.9% 0.23 8.9 –3.8%
10%/5%/3 months 184(8,462) 0.610a 7.3% 0.643a 7.7% 30.7% 23.2% 30.7% 30.7% 0.23 8.3 –3.8%
10%/5%/12 months 127(10,422) 0.718a 8.6% 0.752a 9.0% 30.7% 22.9% 30.6% 30.7% 0.35 9.6 –3.7%
10%/5%/∞ 112(11,210) 0.745a 8.9% 0.790a 9.5% 30.9% 22.2% 30.8% 30.8% 0.41 10.2 –3.8%
at Erasmus University Rotterdam on February 11, 2011 rof.oxfordjournals.org Downloaded from

THE RISK AND RETURN OF ARBITRAGE IN DUAL-LISTED COMPANIES 511
have very long horizons (up to nine years for the strategies depicted in Table V).During this time, mispricing may worsen significantly. This leads to negative ar-bitrage returns in the short run even though expected returns are positive over thefull horizon. As an example, the price deviation of Unilever NV/PLC “converged”from –10.2% to –4.9% between January 7, 1980 and May 9, 1983, but the mispric-ing worsened dramatically between these dates, reaching –39.1% on August 18,1981. Several theoretical studies, e.g., De Long et al. (1990), Shleifer and Summers(1990), and Shleifer and Vishny (1997), suggest that rational arbitrageurs are con-cerned about possible adverse price movements in the short run, even when theyknow that prices will converge eventually.
Table VI presents estimates of the total volatility (σ) and the idiosyncratic volatil-ity (σε) of returns for the DLC investment strategies as well the total volatility ofthe S&P 500 over the same period. Annualized standard deviations of arbitragereturns range from 31.0% to 34.6% for different strategies. The idiosyncratic riskof arbitrage returns relative to both the Fama-French three-factor model and theIAPM discussed above are almost identical to the standard deviation of arbitragereturns. It is remarkable that only a marginal fraction of the time-series variation inarbitrage returns can be attributed to variation in the benchmark factors includedin widely used asset pricing models. Both the total and the idiosyncratic volatil-ity of arbitrage returns are much larger than the annualized volatility of the S&P500, which lies between 22.1% and 24.0%. Hence, the volatility of DLC arbitrageconsistently exceeds the risk of investing in the S&P 500 by almost 50%. This isespecially striking in light of the fact that our arbitrage strategies involve hedgedlong-short positions.5
The final three columns of Table VI indicate that the distribution of arbitragereturns exhibits positive skewness and high kurtosis (i.e., fat tails). Arbitrage inDLCs is associated with substantial downside risk. The daily 1% Value-at-Riskof around –4% for all strategies indicates that the arbitrageur can be expected toregularly suffer a large single-day loss.
Taken together, our findings indicate that although arbitrage strategies in DLCshave negligible fundamental risk and low systematic risk, they are characterizedby high idiosyncratic risk (including a high frequency of extreme returns) anduncertainty about the horizon at which convergence takes place. We interpret theevidence as being consistent with idiosyncratic risk deterring arbitrage activity andimpeding efficient pricing.
5 The volatility of arbitrage positions in DLCs is also much higher than the volatility of hedge fundreturns. Agarwal et al. (2007) report that the volatility of monthly returns amounted to 4.4% onaverage for 3,924 hedge funds over 1994–2002.
at Erasm
us University R
otterdam on F
ebruary 11, 2011rof.oxfordjournals.org
Dow
nloaded from
512 A. DE JONG ET AL.
5. Robustness
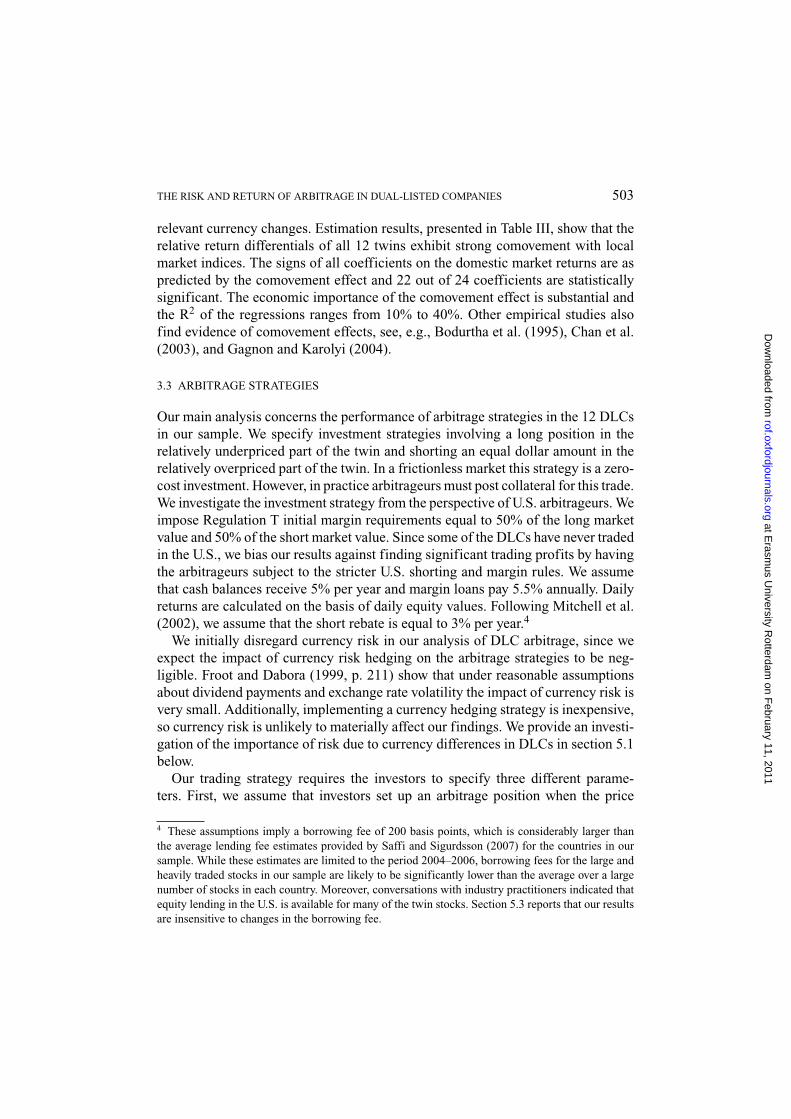
5.1 DO TIME ZONE AND CURRENCY DIFFERENCES MATTER?
The two parent companies of the twins Royal Dutch/Shell, Unilever, ABB, Elsevier/Reed International, Rio Tinto, Zurich Allied/Allied Zurich, and BHP Billiton haveall traded on a U.S. stock market during at least part of the sample period. TheU.S. share prices of these twins can be used to investigate whether their mispricingcan in part be explained by differences in time zones and currencies, as all U.S.listed shares trade within the same time zone and in U.S. dollars. Data on shareprices in the U.S. are obtained from Datastream, except for the ADR prices ofABB AG/AB and BHP Billiton Ltd/PLC, which are taken from Bloomberg. Wecompute log deviations from parity on the basis of the U.S. prices and analyzearbitrage opportunities on the basis of these price differentials. Detailed results ofthe analyses of the ADR data are available from the authors.
ADR prices closely follow the prices of the ordinary shares for all DLC parents.This implies that differences between the log deviations from parity based on theADR prices and those based on the ordinary share prices are minor and mostcorrelations are nearly equal to 1. Some of the DLCs exhibit a slightly lowercorrelation between ADR and ordinary share price discrepancies, which can beexplained by the infrequent trading of some of the ADRs and because the ADR ofABB AB is on the B share, which carries 1/10th of the votes of the A share.
Relative returns on the ADRs of the twin parents also exhibit comovement withthe relative returns in the home markets. Moreover, both the number of arbitragepositions established in the twin ADRs and the returns on these positions are verysimilar to the results reported in Table V. These findings indicate that arbitrage inthe ADRs of DLCs is equally profitable as arbitrage in the ordinary shares. Overall,the evidence demonstrates that time zone and currency differences do not play arole in the mispricing of DLCs.
5.2 ALTERNATIVE HYPOTHESES FOR DLC MISPRICING
This section discusses whether the mispricing observed in the 12 DLCs in our sam-ple can be explained by contractual shortcomings in the equalization agreements,taxation, corporate governance issues, or short-sales constraints.
The relative pricing of the shares of the twin parents depends crucially on the ef-fectiveness of the equalization agreements. It is impossible to rule out that observeddeviations from theoretical price parity in part arise from (perceived) contractualshortcomings. On the other hand, we have elaborately reviewed academic and ap-plied research and find little indication that investors face uncertainty about theparity of the twin stocks’ fundamental value. The legal structures of DLCs have
at Erasm
us University R
otterdam on F
ebruary 11, 2011rof.oxfordjournals.org
Dow
nloaded from

THE RISK AND RETURN OF ARBITRAGE IN DUAL-LISTED COMPANIES 513
been scrutinized from several perspectives. In the academic finance literature,Rosenthal and Young (1990) and Froot and Dabora (1999) do not find defects inthe agreements that can explain the mispricing. An internal document of MerrillLynch (2002) investigates arbitrage opportunities and discusses the legal structurewithout pointing at any type of fundamental risk. Legal scholars (Schmidt, 1999;Wymeersch, 2000; PLC, 1993), global law firms (Allens Arthur Robinson, 2001;Baker & McKenzie, 2001; Lovells, 2001; Cleary Gottlieb Steen & Hamilton, 2003;Herbert Smith, 2003), and regulators (Reserve Bank of Australia, 2002; U.K. Panelon Takeovers and Mergers, 2002) have investigated the contractual features and con-clude that the equalization agreements are an effective instrument in cross-bordermergers.
Dividend taxation could be a potential explanation for the price deviations inDLCs, since the equalization agreements do not aim to adjust dividend paymentsfor tax differences across countries and investors. Analyzing dividend taxation inDLCs is very complex, because taxation differs across different groups of investorsin different countries in a myriad of ways. We provide three pieces of evidencebased on which we expect that taxation is not a main determinant of the mispricing.First, Froot and Dabora (1999) conclude that tax-induced investor heterogeneitycannot explain the mispricing, because for each of the three twins in their sampleat least one group of Dutch, U.K., and U.S. investors is tax-indifferent and becausethe deviations from parity are too large relative to observed taxation differencesfor other groups. Second, if dividend taxation matters for relative twin prices, wewould expect to observe different ex-dividend day effects for the twin shares of aDLC (see, e.g., Elton and Gruber, 1970; Elton et al., 2005). However, in an eventstudy of all 34 dividend payment observations where both parents go ex-dividendon the same date (not reported), we detect only one significant change in the pricedeviation on the ex-dividend day. This finding suggests that dividend taxation doesnot materially affect the deviation from parity. Third, the time-series volatility ofthe deviations from parity we document in section 3 is much larger than can beexplained by occasional taxation changes. We investigate the abolition of the U.K.Advanced Corporation Tax (arguably the most important regulatory tax changeduring our sample period, see Financial Times, 1997). If dividend taxation matters,we should observe that U.K. parents decline in value relative to the parents in othercountries after the abolition. In an (unreported) event study, we find no evidence ofa significant effect on the price deviations.
Corporate governance issues or the threat of contract renegotiation could also berelevant explanations for the mispricing. However, the governance structures andcontracts are rarely changed, while the mispricing is very volatile and 10 out of 12twins show both positive and negative price deviations. Second, we are not awareof any case in which doubts about the governance structure or the equalizationagreements have been raised. Third, we collect announcement dates (if available)
at Erasm
us University R
otterdam on F
ebruary 11, 2011rof.oxfordjournals.org
Dow
nloaded from

514 A. DE JONG ET AL.
of significant changes in blockholdings (identified on the basis of 20-F filings andannual reports) over the period 1991–2002 and find little evidence of a systematicrelation with the magnitude and sign of the price deviations.
A number of studies indicate that there may be important constraints on short-sales. D’Avolio (2002) describes the market for borrowing stock in the U.S. andshows that while this market is generally very active and liquid, for some stockssupply is constrained and fees are significant. Lamont and Thaler (2003) presentevidence that the shorting market exhibits important imperfections for a sampleof U.S. tech stocks. Bris et al. (2007) document short-sale restrictions in interna-tional equity markets. For example, in Belgium there is no organized market forstock lending and borrowing, while in Sweden shorting has only been allowed since1991. In Finland shorting started in 1998, but transfer taxes make it expensive. Al-though these and other legal or institutional obstacles may have hampered arbitragestrategies in several of the twins in the sample (notably Dexia, Fortis, ABB, andMerita Nordbanken), for most firms in the sample it is implausible that short-saleconstraints can explain more than a minor part of the mispricing. The DLCs in oursample generally involve very large and liquid stocks for which equity lending isrelatively easily available.
5.3 TRADING PARAMETERS
Figure 2 displays the alphas of arbitrage strategies in DLCs relative to the Fama-French three-factor model as a function of the buy and the sell thresholds. (We obtainsimilar results when Sharpe ratios instead of alphas are used as the performancemeasure.) The benchmark arbitrage strategy has a buy threshold of 10%, a sellthreshold of 5%, and a maximum horizon of one year. This strategy produces analpha of 0.718% per month (8.6% per annum) and is indicated by a black dot inthe graph. Figure 2 shows that the abnormal return on our benchmark strategyis not exceptional. Both a strategy with a buy/sell threshold of 10%/6% and astrategy with a buy/sell threshold of 9%/5% yield a higher alpha. These strategiesalso generate a higher number of arbitrage positions. Moreover, strategies with abuy threshold between 14% and 18% are considerably more profitable as well.In particular, a strategy with a buy threshold of 18% and a sell threshold of 10%has an abnormal return of almost 15% per annum. This strategy generates only 24arbitrage positions, however. The number of positions varies from up to 300 forthresholds that are relatively low and close together and falls below 100 for buythresholds that are much higher than sell thresholds. The fact that alphas increasewith the buy threshold (for a given difference between buy and sell thresholds)suggests that relative prices have a greater tendency to move toward parity whenthe price gap is larger.
at Erasm
us University R
otterdam on F
ebruary 11, 2011rof.oxfordjournals.org
Dow
nloaded from

THE RISK AND RETURN OF ARBITRAGE IN DUAL-LISTED COMPANIES 515
Figure 2. Sensitivity analysis of arbitrage strategies.This figure shows the sensitivity of the abnormal returns (alphas) – relative to the Fama-Frenchthree-factor model and after taking account of transaction costs and margin requirements – of thearbitrage strategies in all twins with respect to buy and sell thresholds. The benchmark arbitragestrategy has a buy (sell) threshold of 10% (5%) and a maximum horizon of one year. This strategy isindicated by a black dot in the graph. The set-up of the arbitrage positions is described in Tables IVand V.
Our assumptions on trading costs and interest rates do not have a large effect onthe abnormal returns of the arbitrage strategies. When the commission is increasedfrom 25 to 50 basis points, the alpha decreases to 0.453% per month. Similarly,when we assume that the bid-ask spread is 80 instead of 40 basis points, we find analpha of 0.506% per month. Reducing the short rebate to 1% per year leads to a dropin the alpha to 0.562% per month. As a final analysis, we impose an additional delayof one trading day before the arbitrageur acts on signals derived from the crossingof buy/sell thresholds. This quite restrictive assumption moderates the alpha to astill healthy 0.382% per month.
5.4 UNIFICATIONS
An interesting feature of our sample is that six twins have chosen to end theDLC structure and have unified their shares. (We do not analyze the unification ofRoyal Dutch/Shell in 2005 as it falls outside of our sample period.) In the periodbetween the announcement and the actual unification, horizon risk is negligible
at Erasm
us University R
otterdam on F
ebruary 11, 2011rof.oxfordjournals.org
Dow
nloaded from

516 A. DE JONG ET AL.
because prices will certainly converge within a set and limited amount of time(subject to governmental or shareholder objections). Thus, if uncertainty about thehorizon is an important impediment to arbitrage, we expect prices to converge toparity instantaneously. Furthermore, price discrepancies and arbitrage opportunitiesshould be absent after the unification announcement.
The final two columns of Table I display the dates of the announcement of theunification and the actual unification dates. Several reasons for unification werementioned by the twins. Four of the six DLCs explicitly stated that the premiumsor discounts were undesirable. Other motivations include greater liquidity (men-tioned by four twins), enhanced access to capital markets (four), elimination ofinvestor confusion caused by the complicated structure (three), greater presenceand weighting in certain indices (two), and a broader shareholder base (two).
Unifications can be structured in two ways. The first is a stock swap, in which oneof the twins makes an offer for the shares of the other twin and only the former twincontinues to exist. Dexia and Merita/Nordbanken chose this approach. The secondmethod, chosen by the other four pairs, is to create a new entity that exchanges itsshares for the shares of both twins. In addition to choosing either of these structures,some firms provide incentives to specific shareholders. For example, Allied Zurichholders received 40 pence a share as compensation for having to hold a companywith a primary listing in Switzerland and for no longer owning a company that waspart of the FTSE 100 index.
Figure 3 shows the development of the log deviations from parity of Dexia andZurich Allied/Allied Zurich starting 120 trading days before the announcementdate (date 0) up to the last trading day of the twin shares. The graphs show thatthe mispricing is eliminated virtually instantaneously. For Dexia, the deviationchanges from –9.22% to –0.14% in a single day. For Zurich Allied/Allied Zurich,the deviation is reduced from 8.29% to 1.91% in one day and to 0.34% in two days.Similar changes in the price deviations occur for Merita/Nordbanken (from –5.44%to –0.13% in one day) and Fortis (from 0.71% to 0.11% in one day). The pricedifferential remains somewhat larger for ABB (from 12.30% to 5.56% in one day)and Smithkline Beecham (from –3.08% to –2.11% in one day). However, the signof these price discrepancies is consistent with the incentives provided to ABB AGshareholders and U.S. Smithkline Beecham shareholders. (The holders of ABB AGbearer shares received a one-time 30 Swiss franc dividend, while the AG registeredholders got a one-time 6 Swiss franc dividend. Smithkline Beecham paid holders ofthe equity units US$0.225 per share or US $1.125 per unit to redeem the preferredstock that was part of the unit.) These results suggest that the financial markets areaware of the mispricing of the DLCs and that a correction to prices occurs withinone or two days.
During the period between the announcement and the actual unification, thedeviations from parity remain relatively stable for ABB, Smithkline Beecham,
at Erasm
us University R
otterdam on F
ebruary 11, 2011rof.oxfordjournals.org
Dow
nloaded from

THE RISK AND RETURN OF ARBITRAGE IN DUAL-LISTED COMPANIES 517
Dexia
−20%
−15%
−10%
−5%
0%
5%
10%
15%
20%
−120 −100 −80 −60 −40 −20 0 20 40
Zürich Allied / Allied Zürich
−20%
−15%
−10%
−5%
0%
5%
10%
15%
20%
−120 −100 −80 −60 −40 −20 0 20 40 60 80 100 120
Figure 3. Log deviations from parity around the unification announcement.This figure shows the log deviations from theoretical parity (on a percentage basis) for two of thesix unified DLCs over the period starting 120 days before the unification announcement (day 0) tillthe last trading day before unification. The graphs of the log deviations for the other unified DLCsaround the unification announcement date are available from the authors.
Fortis, and Zurich Allied/Allied Zurich. Two twins, Dexia and Merita/Nordbanken,exhibit considerable swings, however. This phenomenon can be explained by thestock swap structure of these unifications. In the case of Dexia, the French sharebecomes undervalued after a stable period and recovers later. On the 22nd tradingday after the announcement of the unification, the French share is removed from theCAC40 index. This is likely to induce investors to sell the French share. Towardsthe unification date, it becomes clear that the bid will succeed and a 2.5% bonus ispaid.
at Erasm
us University R
otterdam on F
ebruary 11, 2011rof.oxfordjournals.org
Dow
nloaded from

518 A. DE JONG ET AL.
We examine whether the trading rules discussed in section 3 yield different resultsin the post-announcement period. Unreported results show that after the announce-ment of the unification, the 10%/5% and 5%/1% buy/sell threshold strategies pro-duce a total of only one and four arbitrage positions, respectively. Some arbitragereturns are high on a monthly basis, but investment horizons are generally veryshort. Moreover, Merita/Nordbanken accounts for the only position in the 10%/5%strategy and for three out of four arbitrage positions in the 5%/1% strategy. Thesepositions require shorting the shares of Merita, the Finnish parent. As mentionedin section 5.2, Finnish transfer taxes make shorting expensive and little used.
The main difference of the post-announcement period compared with the pre-announcement period is that there is far less uncertainty over the arbitrage hori-zon, which reduces concerns about adverse price movements in the short run.Our analysis of the six unifications provides further evidence suggesting that thistype of uncertainty deters arbitrage activity in the period before the unificationannouncement.
6. Conclusions
We examine the risk and return of arbitrage strategies in a sample of 12 dual-listed companies (DLCs). In contrast to previous empirical studies on the riskand return characteristics of arbitrage strategies, our analysis involves situations inwhich fundamental risk, transaction costs, and short-sale constraints do not formimportant barriers to arbitrage.
We find that the relative prices of all twins exhibit statistically significant andeconomically large deviations from theoretical parity. The deviations from parityshow substantial variation over time. Arbitrage in DLCs produces abnormal returnsof up to almost 10% per annum (taking into account transaction costs and marginrequirements). However, DLC arbitrage involves considerable uncertainty, as thereis no identifiable date at which the twin prices will converge. We show that arbitragestrategies exhibit a large amount of idiosyncratic risk and a distribution with a fatleft-tail. The idiosyncratic volatility of arbitrage returns lies in the range of 30–35%for all strategies, which is close to 50% higher than the total volatility of the S&P500.
Overall, we find that there is prolonged mispricing of large, well-traded interna-tional equity securities. Arbitrage is not successful in eliminating this mispricing.We interpret our findings as evidence in support of studies that emphasize theimportance of idiosyncratic risk as an impediment to arbitrage, e.g., Shleifer andVishny (1997) and Pontiff (2006).
at Erasm
us University R
otterdam on F
ebruary 11, 2011rof.oxfordjournals.org
Dow
nloaded from

THE RISK AND RETURN OF ARBITRAGE IN DUAL-LISTED COMPANIES 519
References
Agarwal, V., Daniel, N. D. and Naik, N. Y. (2007) Role of managerial incentives and discretion inhedge fund performance, unpublished working paper, Georgia State University, Drexel University,London Business School.Allens Arthur Robinson. (2001) Innovative structures: Dual listed companies, Focus Mergers &Acquisitions 1, July.Baker & McKenzie. (2001) Dual listed companies, Newsletter, July.Baker, M., Foley, C. F. and Wurgler, J. (2008) Multinationals as arbitrageurs: The effect of stockmarket valuations on foreign direct investment, Review of Financial Studies, forthcoming.Baker, M. and Savasoglu, S. (2002) Limited arbitrage in mergers and acquisitions, Journal of FinancialEconomics 64, 91–115.Barberis, N. and Thaler, R. H. (2003) A survey of behavioral finance, in G. Constantinides, M. Harrisand R. M. Stulz (eds.), Handbook of the Economics of Finance, North-Holland, Amsterdam,pp. 1051–1121.Bedi, J., Richards, A. and Tennant, P. (2003) The characteristics and trading behavior of dual-listedcompanies, unpublished working paper, Reserve Bank of Australia.Bodurtha, J., Kim, D.-S. and Lee, C. (1995) Closed-end country funds and U.S. market sentiment,Review of Financial Studies 8, 879–918.Brealey, R. A., Myers, S. C. and Allen, F. (2006) Principles of Corporate Finance, 8th edition,McGraw-Hill Irwin.Bris, A., Goetzmann, W. N. and Zhu, N. (2007) Efficiency and the bear: Short sales and marketsaround the world, Journal of Finance 62, 1029–1079.Chan, K., Hameed, A. and Lau, S.T. (2003) What if trading location is different from businesslocation? Evidence from the Jardine Group, Journal of Finance 58, 1221–1246.Chiyachantana, C. N., Jain, P. K., Jiang, C., and Wood, R. A. (2004) International evidence oninstitutional trading behavior and price impact, Journal of Finance 59, 869–898.Cleary Gottlieb Steen & Hamilton. (2003) Cross border mergers: The cases for and against dualheaded structures, European M&A Report, October, 3–7.Daniel, K., Hirshleifer, D. and Teoh, S. H. (2002) Investor psychology in capital markets: Evidenceand policy implications, Journal of Monetary Economics 49, 139–209.D’Avolio, G. (2002) The market for borrowing stock, Journal of Financial Economics 66, 271–306.De Long, J. B., Shleifer, A., Summers, L. H., and Waldmann, R. J. (1990) Noise trader risk in financialmarkets, Journal of Political Economy 98, 703–738.Elton, E. J. and Gruber, M. J. (1970) Marginal stockholder tax rates and the clientele effect, Reviewof Economics and Statistics 52, 68–74.Elton, E. J., Gruber, M. J. and Blake, C. R. (2005) Marginal stockholder tax effects and ex-dividend-day price behavior: Evidence from taxable versus nontaxable closed-end funds, Review of Economicsand Statistics 87, 579–586.Financial Times. (1997) Ending tax credit could knock 20% off shares, May 22.Foerster, S. R. and Karolyi, G. A. (1999) The effects of market segmentation and investor recognitionon asset prices: Evidence from foreign stocks listing in the U.S., Journal of Finance 54, 981–1013.Froot, K. A. and Dabora, E. M. (1999) How are stock prices affected by the location of trade?, Journalof Financial Economics 53, 189–216.Froot, K. A. and Perold, A. F. (1997) Global equity markets: The case of Royal Dutch and Shell,Harvard Business School Case, 9-296-077.Gagnon, L. and Karolyi, G. A. (2004) Multi-market trading and arbitrage, unpublished working paper,Queens University, Ohio State University.
at Erasm
us University R
otterdam on F
ebruary 11, 2011rof.oxfordjournals.org
Dow
nloaded from

520 A. DE JONG ET AL.
Gemmill, G. and Thomas, D. C. (2002) Noise trading, costly arbitrage, and asset prices: Evidencefrom closed-end funds, Journal of Finance 57, 2571–2594.Herbert Smith. (2003) Dual listed company (“DLC”) structures: Recent developments, CorporateBriefing, November.Hupperets, E. C. J. and Menkveld, A. J. (2002) Intraday analysis of market integration: Dutch bluechips traded in Amsterdam and New York, Journal of Financial Markets 5, 57–82.Jorion, P. and Schwartz, E. (1996) Integration vs. segmentation in the Canadian stock market, Journalof Finance 41, 603–616.Lamont, O. A. and Thaler, R. H. (2003) Can the market add and subtract? Mispricing in tech stockcarve-outs, Journal of Political Economy 111, 227–268.Lovells. (2001) DLC merger structures, Corporate Finance Newsletter, September, 1–4.Merrill Lynch (2002) The dual listings: Event driven & equity arbitrage sales, Internal Memo, July,available at http://pages.stern.nyu.edu/∼msiegel/merrill.doc.Mitchell, M. and Pulvino, T. (2001) Characteristics of risk and return in risk arbitrage, Journal ofFinance 56, 2135–2175.Mitchell, M., Pulvino, T. and Stafford, E. (2002) Limited arbitrage in equity markets, Journal ofFinance 57, 551–548.PLC. (1993) Rothmans restructuring: The tax advantages of twinned shares, News Brief, September,11–13.Pontiff, J. (1996) Costly arbitrage: Evidence from closed-end funds, Quarterly Journal of Economics111, 1135–1152.Pontiff, J. (2006) Costly arbitrage and the myth of idiosyncratic risk, Journal of Accounting andEconomics 42, 35–52.Reserve Bank of Australia. (2002) Dual-listed companies, Bulletin, October, 7–13.Ritter, J. R. (2003) Behavioral finance. Pacific-Basin Finance Journal 11, 429–437.Rosenthal, L. and Young, C. (1990) The seemingly anomalous price behavior of Royal Dutch/Shelland Unilever N.V./PLC, Journal of Financial Economics 26, 123–141.Saffi, P. A. C. and Sigurdsson, K. (2007) Price efficiency and short selling, unpublished workingpaper, IESE Business School, London Business School.Schmidt, R. (1999) Cross-border mergers and corporate governance: An empirical analysis from1988 to 1999, unpublished working paper, Martin Luther University.Scruggs, J. T. (2007) Noise trader risk: Evidence from the Siamese twins, Journal of FinancialMarkets 10, 76–105.Shleifer, A. (2000) Inefficient Markets, Oxford University Press.Shleifer, A. and Summers, L. H. (1990) The noise trader approach to finance, Journal of EconomicPerspectives 4, 19–33.Shleifer, A. and Vishny, R. W. (1997) The limits of arbitrage, Journal of Finance 52, 35–55.Thaler, R. H. (1999) The end of behavioral finance, Financial Analysts Journal 55, 12–17.U.K. Panel on Takeovers and Mergers (2002) Dual-listed company transactions and frustrating action,Consultation Paper, April 26.Wymeersch, E. (2000) Some aspects of cross border co-operation between business enterprises,unpublished working paper, University of Gent.
at Erasm
us University R
otterdam on F
ebruary 11, 2011rof.oxfordjournals.org
Dow
nloaded from