the resources report
DESCRIPTION
Monmouth County Real Estate Market Report 1st Quarter 2014TRANSCRIPT

the RESOURCESreport
Monmouth CountyReal Estate Market Report1st Quarter 2014
the RESOURCESreport

resourcesrealestate.com
Thomas McCormackManaging Partner - [email protected]
As old man winter finally retreats and we find the Spring market upon us, we at Resources Real Estate eagerly await the annual rush of willing buyers into our marketplace. Like a seasonal migration, they come from around the corner and sometimes from around the globe to our corner of the world — this beautiful place called Monmouth County. The place we call home.
And as our market continues to heat up, we know there’s a level of anxiety among buyers who understand that low inventory makes their task a very real competition.
With unit sales gains of almost 12.5%, dollar volume sales up more than 19%, and available inventory diminished by 8%*, now more than ever, market knowledge and negotiating know-how are key skills to achieving the goal.
We take pride in helping our clients understand the market and what they need to do to be successful. So whether buyer or selling, when you need the services of an exceptional agent we hope you’ll think of Resources Real Estate.
Tom
(* For the 12 month period ending with first quarter 2014.)
As we finally shake off the last vestiges of Winter and see the flashes of color of daffo-dils and crocus pushing their way up toward the light, we too feel the effects of inevita-ble growth and are excited about the real estate market budding along with the Spring.
Despite the recent harsh weather, we are experiencing multiple bids on properties that are priced correctly, making it almost impossible for buyers to take a wait-and-see attitude. Sellers that overprice continue to see their homes take longer to sell and generally for less.
Our market data is uncompromisingly clear and we spend time with each seller advising on their individual market, as well as recent trending.
At Resources Real Estate, 2014 brings us exclusive windowfront interactive technolo-gy which, while still uncommon here, is widely used in Europe. We are confident our clients will again benefit from our continued leadership in technology development in our market. We bring things to our real estate clients, that no other companies offer, we are not afraid of being bold!
Our agents are simply the best educated in the market. We continue to hire only the best available agents and our training is unparalleled. The confidence our clients show in our agents is well evident: we’ve recently listed the most exclusive waterfront home in the area, a landmark home that delivers an exceptional lifestyle for the most sophisticated buyer in the market. We are honored to represent this spectacular property. We believe that every house has a story and we are honored to tell yours.
Carolynn
Carolynn Ozar-DiakonBroker - Senior [email protected]

QuaRTERLy REPORT2013 2014
1st Qtr 2nd Qtr 3rd Qtr 4th Qtr 1st Qtr 2nd Qtr 3rd Qtr 4th Qtr
AtlAntic HigHlAnds
Number of Sales 6 14 14 19 9
Days on Market 223 106 90 116 105
Average Price $805,555 $656,374 $385,187 $475,960 $341,014
Median Price $765,000 $542,350 $396,042 $404,133 $330,250
Highest Price $1,150,000 $1,480,488 $745,000 $1,280,000 $510,000
colts neck
Number of Sales 21 31 47 25 21
Days on Market 105 134 115 134 178
Average Price $786,751 $951,222 $783,952 $852,680 $719,127
Median Price $634,375 $855,500 $673,150 $735,833 $618,116
Highest Price $2,200,000 $3,750,000 $2,450,000 $1,765,000 $1,800,000
FAir HAven
Number of Sales 16 23 39 30 19
Days on Market 93 74 85 71 105
Average Price $647,638 $932,338 $703,259 $919,854 $884,601
Median Price $586,763 $711,500 $692,333 $711,500 $691,166
Highest Price $1,352,000 $3,300,000 $1,479,000 $3,600,000 $2,250,000
Holmdel
Number of Sales 22 38 58 38 21
Days on Market 117 105 70 92 75
Average Price $716,528 $828,609 $718,749 $757,560 $750,407
Median Price $610,816 $698,500 $648,500 $694,167 $687,650
Highest Price $1,750,000 $2,582,200 $1,852,150 $2,750,000 $1,400,000
bit.ly/rumsonwaterfront
resourcesrealestate.com

QuaRTERLy REPORT2013 2014
1st Qtr 2nd Qtr 3rd Qtr 4th Qtr 1st Qtr 2nd Qtr 3rd Qtr 4th Qtr
little silver
Number of Sales 13 32 33 13 10
Days on Market 95 94 45 39 46
Average Price $577,394 $632,942 $726,596 $630,041 $601,875
Median Price $561,667 $586,067 $611,721 $521,750 $616,167
Highest Price $1,100,000 $1,575,000 $1,800,000 $1,670,000 $1,137,500
long BrAncH
Number of Sales 19 36 38 29 26
Days on Market 115 128 119 85 154
Average Price $262,542 $277,010 $365,869 $302,180 $257,368
Median Price $217,083 $240,500 $257,500 $248,300 $251,167
Highest Price $1,187,500 $750,000 $1,220,295 $1,500,000 $484,000
middletown
Number of Sales 103 163 208 148 75
Days on Market 87 99 67 77 93
Average Price $397,076 $441,599 $495,838 $450,906 $413,065
Median Price $355,600 $397,500 $416,333 $425,000 $361,967
Highest Price $1,352,000 $2,725,000 $6,100,000 $1,325,000 $1,835,000
monmoUtH BeAcH
Number of Sales 4 5 15 13 5
Days on Market 73 113 109 131 83
Average Price $865,500 $863,100 $597,694 $900,311 $1,042,708
Median Price $963,000 $863,100 $426,500 $862,207 $1,096,875
Highest Price $1,315,000 $1,275,000 $1,800,000 $1,575,000 $2,125,000
bit.ly/7and11hillside
resourcesrealestate.com

QuaRTERLy REPORT2013 2014
1st Qtr 2nd Qtr 3rd Qtr 4th Qtr 1st Qtr 2nd Qtr 3rd Qtr 4th Qtr
oceAnPort
Number of Sales 12 9 16 14 8
Days on Market 100 61 64 109 143
Average Price $396,075 $377,097 $526,507 $489,233 $579,000
Median Price $372,167 $350,750 $382,417 $443,500 $510,917
Highest Price $699,900 $770,000 $2,400,000 $805,000 $1,250,000
red BAnk
Number of Sales 14 21 18 20 6
Days on Market 201 105 90 57 46
Average Price $251,867 $475,638 $497,644 $527,553 $426,583
Median Price $264,583 $365,667 $388,000 $446,683 $422,166
Highest Price $535,100 $2,550,000 $1,650,000 $2,281,700 $724,000
rUmson
Number of Sales 20 32 38 38 17
Days on Market 93 87 86 79 115
Average Price $1,271,269 $1,063,287 $1,444,824 $1,178,908 $1,056,945
Median Price $1,095,833 $857,417 $1,358,417 $855,166 $1,127,500
Highest Price $3,034,000 $3,175,000 $3,200,000 $5,600,000 $2,125,000
sHrewsBUry
Number of Sales 6 8 12 10 5
Days on Market 86 150 63 89 154
Average Price $348,944 $653,633 $425,450 $664,436 $638,333
Median Price $328,500 $667,250 $444,167 $664,150 $640,000
Highest Price $490,000 $960,000 $515,000 $875,000 $950,000
resourcesrealestate.com
bit.ly/459locustpoint

resourcesrealestate.com
bit.ly/80senecaaNNuaL REPORT
2012 2013%
Change
monmoUtH coUnty
Number of Sales 4601 5192 13
Days on Market 107 91 -15
Average Price $472,637 $480,350 2
Median Price $371,875 $384,188 3
Highest Price $7,300,000 $6,425,000 -12
FAir HAven
Number of Sales 91 108 19
Days on Market 90 79 -12
Average Price $735,940 $805,139 9
Median Price $698,833 $667,000 -5
Highest Price $3,500,000 $3,600,000 3
Holmdel
Number of Sales 150 156 4
Days on Market 118 92 -22
Average Price $678,630 $757,940 12
Median Price $643,212 $658,500 2
Highest Price $1,975,000 $2,750,000 39
2012 2013%
Change 2012 2013%
Change
AtlAntic HigHlAnds
Number of Sales 45 53 18
Days on Market 107 120 12
Average Price $434,129 $522,798 20
Median Price $345,396 $420,000 22
Highest Price $1,650,000 $1,480,488 -10
colts neck
Number of Sales 87 124 43
Days on Market 117 121 3
Average Price $889,336 $831,089 -7
Median Price $672,345 $672,500 0
Highest Price $4,450,000 $3,750,000 -16
Monmouth County Price Comparisons
bit.ly/80wriver
resourcesrealestate.com
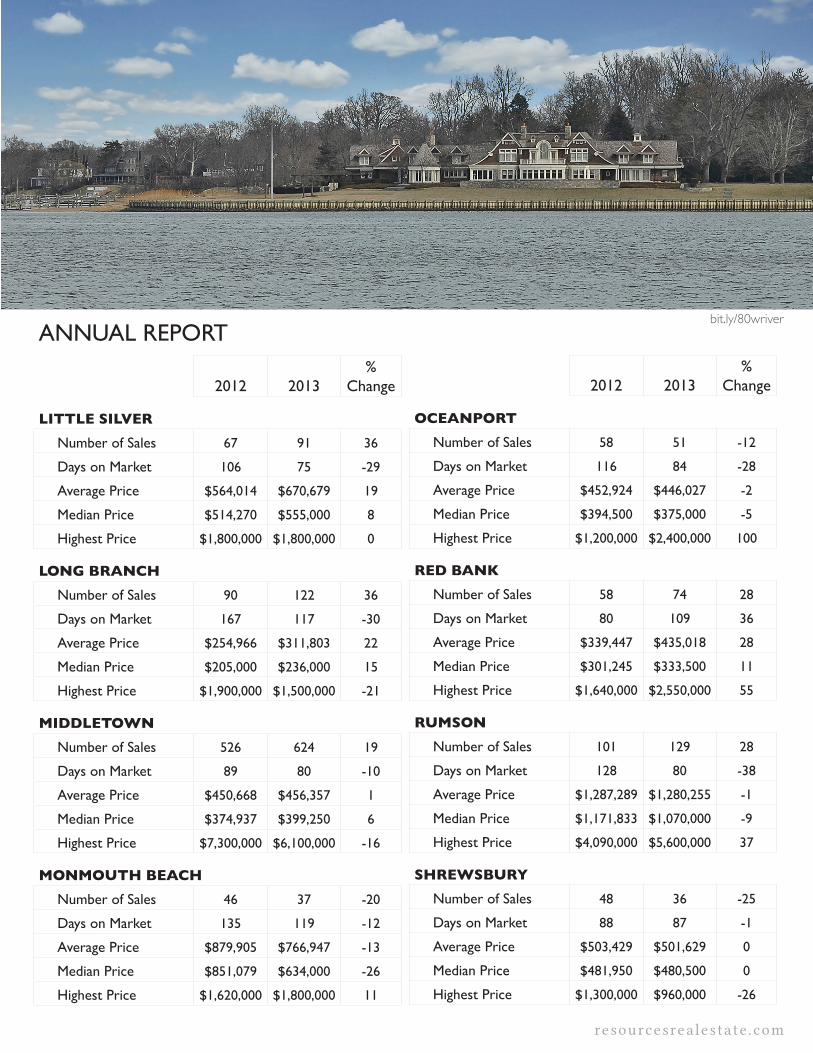
aNNuaL REPORT
2012 2013%
Change
little silver
Number of Sales 67 91 36
Days on Market 106 75 -29
Average Price $564,014 $670,679 19
Median Price $514,270 $555,000 8
Highest Price $1,800,000 $1,800,000 0
long BrAncH
Number of Sales 90 122 36
Days on Market 167 117 -30
Average Price $254,966 $311,803 22
Median Price $205,000 $236,000 15
Highest Price $1,900,000 $1,500,000 -21
middletown
Number of Sales 526 624 19
Days on Market 89 80 -10
Average Price $450,668 $456,357 1
Median Price $374,937 $399,250 6
Highest Price $7,300,000 $6,100,000 -16
monmoUtH BeAcH
Number of Sales 46 37 -20
Days on Market 135 119 -12
Average Price $879,905 $766,947 -13
Median Price $851,079 $634,000 -26
Highest Price $1,620,000 $1,800,000 11
2012 2013%
Change
oceAnPort
Number of Sales 58 51 -12
Days on Market 116 84 -28
Average Price $452,924 $446,027 -2
Median Price $394,500 $375,000 -5
Highest Price $1,200,000 $2,400,000 100
red BAnk
Number of Sales 58 74 28
Days on Market 80 109 36
Average Price $339,447 $435,018 28
Median Price $301,245 $333,500 11
Highest Price $1,640,000 $2,550,000 55
rUmson
Number of Sales 101 129 28
Days on Market 128 80 -38
Average Price $1,287,289 $1,280,255 -1
Median Price $1,171,833 $1,070,000 -9
Highest Price $4,090,000 $5,600,000 37
sHrewsBUry
Number of Sales 48 36 -25
Days on Market 88 87 -1
Average Price $503,429 $501,629 0
Median Price $481,950 $480,500 0
Highest Price $1,300,000 $960,000 -26

bit.ly/53clubway
bit.ly/134ocean
E S O U C E SR E A L E S T A T E B R O K E R
112 East River Road 36 Beach Rd Suite 3 4A West Front St 65 First AveRumson, NJ 07760 Monmouth Beach, NJ 07750 Red Bank, NJ 07701 Atlantic Highlands, NJ 07716
732-212-0440 resourcesrealestate.com
Information deemed reliable but not guaranteed. Data as of 4/3/14.Copyright 2014 by the Monmouth County Association of REALTORS®