the relationship between use of school-based health centers and student-reported school assets
TRANSCRIPT

Journal of Adolescent Health 53 (2013) 526e532
www.jahonline.org
Original article
The Relationship Between Use of School-Based Health Centers andStudent-Reported School Assets
Susan Stone, M.A., Ph.D. a,*, Kelly Whitaker, M.P.A. a,b, Yolanda Anyon, M.S.W., Ph.D. c,and John P. Shields, M.S.W., Ph.D. ba School of Social Welfare, University of California at Berkeley, Berkeley, Californiab ETR Associates, Oakland, Californiac School of Social Work, University of Denver, Denver, Colorado
Article history: Received June 27, 2012; Accepted May 22, 2013Keywords: School health programs; Caring relationships; School assets
A B S T R A C TIMPLICATIONS AND
Purpose: To examine the relationship between student-reported, school-based health centerutilization and two outcomes: (1) caring relationships with program staff; and (2) school assets(presence of caring adults, high behavioral expectations, and opportunities for meaningfulparticipation) using a school districtewide student survey. These relationships were also exploredacross schools.Methods: Using student-reported data from a customized version of the California Healthy KidsSurvey from the San Francisco Unified School District (n ¼ 7,314 students in 15 schools), propensityscoring methods were used to adjust for potential bias in the observed relationship betweenstudent utilization of services and outcomes of interest.Results: Estimates generally pointed to positive relationships between service utilization andoutcome domains, particularly among students using services �10 times. Exploratory analysesindicate that these relationships differ across schools.Conclusions: Use of school-based health centers appears to positively relate to student-reportedcaring relationships with health center staff and school assets. Future research is needed toconfirm the robustness of these observed relationships.
� 2013 Society for Adolescent Health and Medicine. All rights reserved.
* Address correspondence to: Susan Stone, M.A., Ph.D., School of SocialWelfare, University of California at Berkeley, 120 Haviland Hall, Berkeley,CA 94720.
E-mail address: [email protected] (S. Stone).
1054-139X/$ e see front matter � 2013 Society for Adolescent Health and Medicine. All rights reserved.http://dx.doi.org/10.1016/j.jadohealth.2013.05.011
CONTRIBUTION
A small number of empiri-cal studies have examinedthe relationship betweenschool-based healthcenters and academicallyrelated outcome domainsusing robust statisticalcontrols; evidence ofeffects remains limited.Using propensity scoringmethods, we found evi-dence that use of school-based health centers isrelated to some student-reported academicallysalient outcome domains.
In the past 20 years, the number of school-based healthcenters (SBHCs) grew exponentially, from 120 in 1988 toover 1,900 across 45 states as of 2009 [1,2]. School-basedhealth centers also appear to have become more expansive,coordinated, and comprehensive. An increasing number offerbehavioral health, dental, enrichment, and/or health educationservices, which include unique combinations of preventative,tertiary, and/or indicated intervention approaches [1,3,4].
Scholars stress the urgent need to understand and clarify theeffects of the SBHC model, particularly in light of evaluationchallenges [1,3]. First, this model is not a uniform inter-ventiondoften including a mix of services designed to beresponsive to local needs and resources, requiring increasedscrutiny of type and intensity of use [1]. Second, SBHCs maytarget multiple levels, from individual students to schoolorganizational practices, which can make it difficult to detectprogram effects [5]. Third, these models are delivered withindistinct school and district organizational contexts, likelycontributing to variation in SBHC outcomes [1,6e11]. Finally, thismodel is less amenable to evaluation via rigorous experimentaldesigns owing to the nature of SBHC development and

S. Stone et al. / Journal of Adolescent Health 53 (2013) 526e532 527
implementation [1]. Studies of SBHCs often must rely on obser-vational data, which complicates causal inference related tomodel effects. To compensate, a recent, albeit small, body ofempirical work in this area draws on propensity score method-ological approaches to carefully match schools with and withoutSBHCs or students who have or have not used services [12,13].
Given pressure on schools to raise student achievement andgrowing interest in developing sustainable models of integratingSBHCs into the public education system, scholars have sought toclarify the ways in which they may influence student academicoutcomes. Nearly a decade ago, Geierstanger and colleagues [14]developed a framework suggesting that SBHCs potentiallyimpact academic student outcomes indirectly, via two potentialmechanisms: (1) reducing student health risks that impedeeducational achievement; and (2) increasing students’ develop-mental assets.
The first mechanism is through the reduction of studenthealth problems and related risk behaviors that may serve asbarriers to academic performance. Although the full mediationmodel has not been tested directly, recent reviews find that SBHCutilization is associated with reductions in students’ health andmental health symptoms and with improvements in theirattendance and grades, respectively [1,13,15,16].
A second mechanism by which SBHCs may impact academicoutcomes is via the promotion of school-related assets. Althoughthese have been conceptualized in a variety of ways, theytypically reflect the extent to which students personally perceiveaccess to caring and supportive adults, that they are held to highexpectations, and that they have opportunities to participate inactivities or decision making in school. These assets robustly linkto positive socio-emotional and academic outcomes amongyouth [17e21]. School-based health centers may providestudents, particularly those most at risk, access to caring adultsand prosocial activities [1,22e24]. School-based health centerstaff may also support teacher and administrator responses tostudent health needs or sensitize school staff to potentiallearning barriers. Some models directly target the responsive-ness of the overall school environment through particularprogramming (e.g., school-wide awareness campaigns) and/orSBHC staff involvement in school decision making [22]. Onecarefully designed study found that students and parents inschools with SBHCs were more likely than those in schoolswithout them to report more engaging learning environmentsand greater homeeschool communication. Although Geier-stanger and colleagues [14] hypothesized that SBHC utilizationcould have effects on these assets, such relationships have notyet been tested.
The current study draws on data from an SBHC collaborativethat provides a range of health promotion services, preventionprograms, enrichment activities, and nursing and behavioralhealth interventions in high schools within one urban schooldistrict. Using propensity scoring methods, we examine therelationship between use of SBHC services and student reports ofcaring relationships with SBHC staff, and also school assets.Based on the framework and empirical findings described above,we hypothesized that after controlling for potential confoundingstudent and school characteristics, use of SBHC services wouldpositively relate to these indicators. To address limitationsof prior research, we estimated relationships as a function ofstudent reports of the frequency with which they used services[1] and explored the extent to which these relationships weresimilar across schools [6e11].
Methods
Study context
The San FranciscoWellness Initiative is a cityecountyedistrictcollaborative that manages SBHCs (called Wellness Programs) in15 of 19 high schools in the San Francisco Unified School District,which serves a population of over 15,000 students from diversecultural and socioeconomic backgrounds (43% of students receivefree or reduced lunch; 20% are English language learners; and49% are Asian, 21% are Latino, 12% are African-American) [25].
The core of each SBHC is a standardized, site-level staffingstructure that includes, at a minimum, a wellness coordinator,a school nurse, a community health outreach worker, anda behavioral health therapist. In partnership with community-based organizations, staff members deliver services that incor-porate universal, selective, and indicated approaches toaddressing a variety of student health and psychosocial needs[26e28]. District archives indicate that services most oftenaccessed are nursing services (44% of all youth served) andgeneral counseling (38%). Universal services include youth- andadult-led health education and promotion activities deliveredthrough school-wide events and classroom presentations, alongwith drop-in services for students who need first aid or healthinformation. Selective services are provided to students whoexhibit moderate needs, usually through support and empow-erment groups. Finally, indicated interventions in the form ofcounseling and case management are offered to students expe-riencing health or mental health symptoms; the top threepresenting issues are anxiety (27%), family issues (21%), anddepression (20%). Frequent users (students with > 10 contacts)typically participate in indicated interventions [21].
California Healthy Kids Survey
In spring 2009, as part of the Wellness Initiative’s evaluation,a question about SBHC utilization was added to the CaliforniaHealthy Kids Survey (CHKS), the largest statewide student surveyof risk and protective factors [21]. Administration of the surveyincluded a passive parental consent process. Student participa-tion was voluntary and anonymous, which made it impossible tolink survey responses to student academic or SBHC records [21].The 2009 survey is also notable because it was delivered as a nearcensus of all students in the district. The Wellness Initiativegranted permission for the authors to analyze these data and theCommittee for Protection of Human Subjects at University ofCalifornia at Berkeley reviewed the study and deemed it exemptfrom institutional review board review.
Sample
The 2009 CHKS was administered concurrently with theYouth Risk Behavior Survey (YRBS) in the San Francisco UnifiedSchool District. After a random sample of 2,500 students wasdrawn for the YRBS, all remaining high school students in grades9e12 were asked to complete the CHKS. There were 13,901students who were offered the CHKS survey; 12,329 of thosestudents attended schools participating in theWellness Initiative(15 of 19 sites). The survey completion rate was 69%, yieldinga final sample of 8,466 students. Of these, 7,314 responded to thesingle, customized item asking about SBHC utilization.
S. Stone et al. / Journal of Adolescent Health 53 (2013) 526e532528
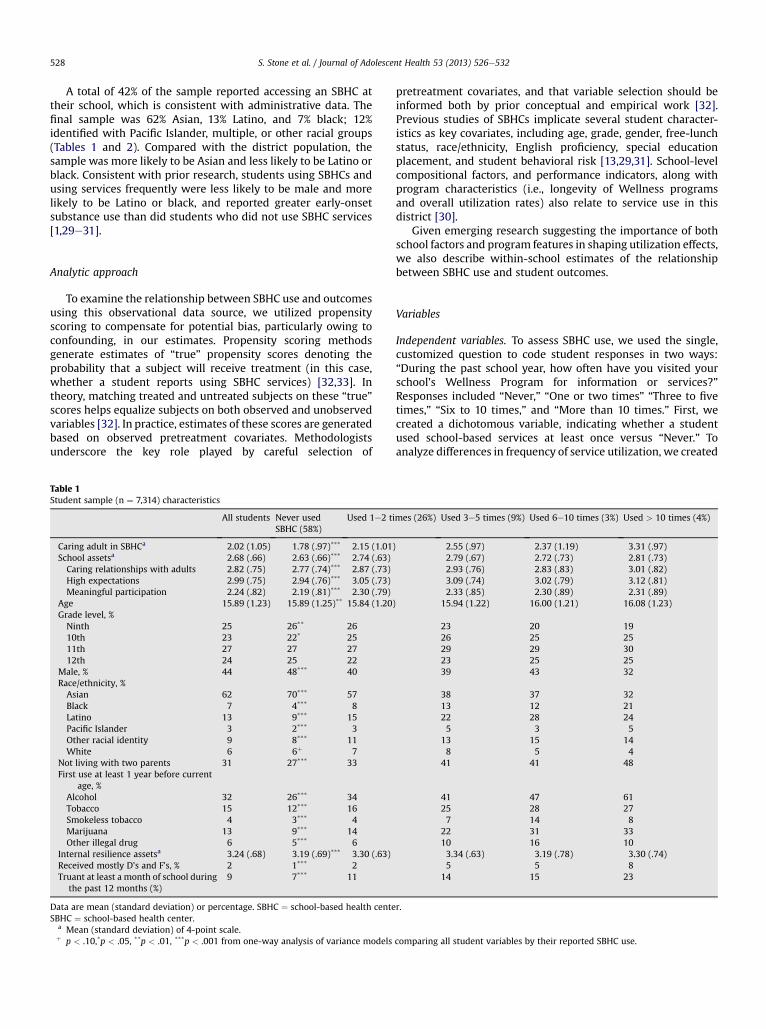
A total of 42% of the sample reported accessing an SBHC attheir school, which is consistent with administrative data. Thefinal sample was 62% Asian, 13% Latino, and 7% black; 12%identified with Pacific Islander, multiple, or other racial groups(Tables 1 and 2). Compared with the district population, thesample was more likely to be Asian and less likely to be Latino orblack. Consistent with prior research, students using SBHCs andusing services frequently were less likely to be male and morelikely to be Latino or black, and reported greater early-onsetsubstance use than did students who did not use SBHC services[1,29e31].
Analytic approach
To examine the relationship between SBHC use and outcomesusing this observational data source, we utilized propensityscoring to compensate for potential bias, particularly owing toconfounding, in our estimates. Propensity scoring methodsgenerate estimates of “true” propensity scores denoting theprobability that a subject will receive treatment (in this case,whether a student reports using SBHC services) [32,33]. Intheory, matching treated and untreated subjects on these “true”scores helps equalize subjects on both observed and unobservedvariables [32]. In practice, estimates of these scores are generatedbased on observed pretreatment covariates. Methodologistsunderscore the key role played by careful selection of
Table 1Student sample (n ¼ 7,314) characteristics
All students Never usedSBHC (58%)
Used 1e2 ti
Caring adult in SBHCa 2.02 (1.05) 1.78 (.97)*** 2.15 (1.01)School assetsa 2.68 (.66) 2.63 (.66)*** 2.74 (.63)Caring relationships with adults 2.82 (.75) 2.77 (.74)*** 2.87 (.73)High expectations 2.99 (.75) 2.94 (.76)*** 3.05 (.73)Meaningful participation 2.24 (.82) 2.19 (.81)*** 2.30 (.79)
Age 15.89 (1.23) 15.89 (1.25)** 15.84 (1.20)Grade level, %Ninth 25 26** 2610th 23 22* 2511th 27 27 2712th 24 25 22
Male, % 44 48*** 40Race/ethnicity, %Asian 62 70*** 57Black 7 4*** 8Latino 13 9*** 15Pacific Islander 3 2*** 3Other racial identity 9 8*** 11White 6 6þ 7
Not living with two parents 31 27*** 33First use at least 1 year before current
age, %Alcohol 32 26*** 34Tobacco 15 12*** 16Smokeless tobacco 4 3*** 4Marijuana 13 9*** 14Other illegal drug 6 5*** 6
Internal resilience assetsa 3.24 (.68) 3.19 (.69)*** 3.30 (.63)Received mostly D’s and F’s, % 2 1*** 2Truant at least a month of school during
the past 12 months (%)9 7*** 11
Data are mean (standard deviation) or percentage. SBHC ¼ school-based health centeSBHC ¼ school-based health center.
a Mean (standard deviation) of 4-point scale.þ p < .10,*p < .05, **p < .01, ***p < .001 from one-way analysis of variance models
pretreatment covariates, and that variable selection should beinformed both by prior conceptual and empirical work [32].Previous studies of SBHCs implicate several student character-istics as key covariates, including age, grade, gender, free-lunchstatus, race/ethnicity, English proficiency, special educationplacement, and student behavioral risk [13,29,31]. School-levelcompositional factors, and performance indicators, along withprogram characteristics (i.e., longevity of Wellness programsand overall utilization rates) also relate to service use in thisdistrict [30].
Given emerging research suggesting the importance of bothschool factors and program features in shaping utilization effects,we also describe within-school estimates of the relationshipbetween SBHC use and student outcomes.
Variables
Independent variables. To assess SBHC use, we used the single,customized question to code student responses in two ways:“During the past school year, how often have you visited yourschool’s Wellness Program for information or services?”Responses included “Never,” “One or two times” “Three to fivetimes,” “Six to 10 times,” and “More than 10 times.” First, wecreated a dichotomous variable, indicating whether a studentused school-based services at least once versus “Never.” Toanalyze differences in frequency of service utilization, we created
mes (26%) Used 3e5 times (9%) Used 6e10 times (3%) Used > 10 times (4%)
2.55 (.97) 2.37 (1.19) 3.31 (.97)2.79 (.67) 2.72 (.73) 2.81 (.73)2.93 (.76) 2.83 (.83) 3.01 (.82)3.09 (.74) 3.02 (.79) 3.12 (.81)2.33 (.85) 2.30 (.89) 2.31 (.89)
15.94 (1.22) 16.00 (1.21) 16.08 (1.23)
23 20 1926 25 2529 29 3023 25 2539 43 32
38 37 3213 12 2122 28 245 3 5
13 15 148 5 4
41 41 48
41 47 6125 28 277 14 8
22 31 3310 16 103.34 (.63) 3.19 (.78) 3.30 (.74)5 5 8
14 15 23
r.
comparing all student variables by their reported SBHC use.

Table 2School sample characteristics
All students Never used SBHC(58%)
Used 1e2 times(26%)
Used 3e5 times(9%)
Used 6e10 times(3%)
Used > 10 times(4%)
Students eligible for free or reduced lunch, % 47 46* 46 49 50 50Student body black or Latino, % 26 23* 27 33 34 38Student body at or above proficiency in reading, % 56 58* 56 48 47 44Student body who used SBHC, % 36 34* 36 41 43 46Years SBHC has been operating, n 6.50 (2.43) 6.74 (1.94)* 6.29 (2.10) 5.99 (2.22) 6.27 (2.22) 5.61 (2.43)
N ¼ 7,314 students; 15 schools. Data represent mean (standard deviation) or percentage.SBHC ¼ school-based health center.*p < .001, from one-way analysis of variance models comparing school characteristics by reported SBHC use.
S. Stone et al. / Journal of Adolescent Health 53 (2013) 526e532 529
four dichotomous indicators reflecting each of the responsecategories (vs. “Never used”). Surveys captured neither the typenor the nature of the service utilized by respondents.
Dependent variables. Our first dependent variable was a singleitem indicator asking students to report their level of agreement,on a 4-point scale, with the following statement: “There is anadult in the Wellness Program who really cares about me.”School assets were measured using a composite variable, fromthe CHKS Resilience Youth Development Module. It includedthree subscales (nine items): (1) caring relationships (threeitems, e.g., “At my school there is a teacher or other adult whoreally cares about me”); (2) high expectations (three items, e.g.,“Atmy school there is a teacher or other adult who believes that Iwill be a success”); and (3) meaningful participation (three items,e.g., “At my school I do interesting activities”). These threesubscales show favorable internal consistencies (Cronbach alphaof .80, .86, and .80, respectively) and construct validity [33e35].
Control variables. Specific pretreatment controls fell into threecategories: student socio-demographic background, earlyalcohol and substance use, and school attended. Demographiccharacteristics included continuous measures of age and threedichotomous variables indicating grade level (10th, 11th, and12th, vs. ninth). Others included a series of dichotomous vari-ables indicating whether a student was male (vs. female), Latino,black, white, Pacific Islander, or of another racial background(vs. Asian), and living with biological parents (vs. not). Prioralcohol and substance abuse was measured using five items.Using their reports of their current age as an index, studentswere classified, via effects coding, as either reporting use at least1 year before their current age (coded 1), current use (coded 0),or never having used (coded �1). Finally, to capture all time-invariant characteristics of school attended, a series of dichoto-mous variables reflecting 14 of the 15 schools were utilized.
Three additional variables (grades, school attendance, andinternal assets) that could not be plausibly classified as occurringbefore SBHC utilization, but were possible confounders of therelationship between use and school assets, were included infinal models. Indicators of student self-reported academicperformance were dichotomized into two variables reflectingwhether the student (1) reported grades ofmostly D’s and F’s and(2) skipped more than 1 month of school. This decision wasbased on prior research suggesting that receiving F’s and missing> 10% of a school year are salient indicators of future academicperformance [36,37]. Internal assets were measured using anadditional Resilience Youth Development Module compositeincorporating student (1) cooperation and communication(three items); (2) self-efficacy (three items); (3) empathy
(three items); (4) problem-solving (three items); (5) self-awareness (three items); and (6) goals and aspirations (threeitems). These also show favorable psychometric properties, withCronbach alpha ranging between .79 and .89 [33e35,38].
For analyses exploring school-level outcome differences, weconsidered: percentages of the student body that were (1) blackor Latino; (2) receiving free or reduced lunch; and (3) reading ator above proficient on standardized tests, as well as the overallutilization rate and longevity (in years) of each SBHC. Tables 1and 2 present sample student and school descriptive characte-ristics, respectively. They include results of one-way analysis ofvariance models comparing all variables by levels of studentSBHC use, confirming initial differences among students onvariables of interest by reported SBHC use.
Data analyses
Propensity scoring techniquesdoverall use. We estimatedstudents’ propensities to report using SBHC services usinglogistic regression, including all pretreatment controls, as well asinteraction terms among pairs of all variables. We comparedSBHC use estimates across multiple matching procedures; ulti-mately using estimates generated from one-to-one nearestneighbor within calipers procedures [31]. The matched sampleincluded 5,962 students, encompassing 97% of SBHC users (2,981of 3,075). As seen in Table 3, there were no significant differencesbetween users and nonusers on any pretreatment covariatesafter matching.
Propensity scoring techniquesdfrequency of use. For SBHCfrequency of use or “dose,” we utilized methods recommendedby Guo and Fraser [32] and Imbens [39]. We first estimateda multinomial logit model predicting the dose categories (i.e.,“never,” vs. “one or two times,” “three to five times,” “six to 10times,” and “> 10 times”) using the model specification dis-cussed above. In this method, the inverse of the propensity scorefor students’ reported use level is used as a propensity weight insubsequent regression analyses.
Multivariate estimates. Final regression models included allpretreatment and other controls and used cluster-correctedstandard errors to account for the nestedness of studentswithin schools.
Missing data. Several survey items had varying but usually smallproportions (e.g., < 5%) of missing responses. We experimentedwith a variety of imputation techniques to recover data, andconfirmed that all estimates were robust to alternative missingdata specifications. We report results based on a data

Table 3Propensity matched sample characteristics
Pretreatment control variables Used SBHC(n ¼ 2,981)
Did not use SBHC(n ¼ 2,981)
Individual levelAge 15.89 (1.21) 15.93 (1.22)Grade level, %Ninth 24 2510th 25 2411th 28 2712th 22 24
Male, % 40 39Race/ethnicity, %Asian 51 52Black 10 9Latino 18 17Other racial identity 12 12Pacific Islander 3 3White 7 7
Not living with two parents 36 36First use at least 1 year before current
age, %Alcohol 38 38Tobacco 19 18Smokeless tobacco 6 5Marijuana 18 16Other illegal drug 8 8
School characteristicsStudents eligible for free and reduced
lunch, %47 47
Student body black or Latino, % 29 28Student body at or above proficiency in
reading, %53 54
Student body who used SBHC, % 38 37Years SBHC has been operating, n 6.20 (2.16) 6.29 (2.12)
Data represent mean (standard deviation) or percentage. N ¼ 5,962. There wereno significant differences (p < .10) between users (and frequency of use) andnonusers after matching.SBHC ¼ school-based health center.
S. Stone et al. / Journal of Adolescent Health 53 (2013) 526e532530
set including all 7,314 students who reported their SBHCutilization, using a combination of conditional mean imputa-tion and dummy variable flags indicating that a variable wasimputed.
Results
Table 4 presents estimates of the relationship betweenstudent-reported SBHC utilization, frequency of utilization, andstudent reports of a caring relationship with an SBHC staffmember, and total school assets (and three componentsubscales). The top rows present results from multivariate ordi-nary least-squared regression estimates using propensity scoringmethods. We also include multivariate ordinary least-squaredregression estimates for comparison.
Any versus no reported SBHC use was positively related tostudent reports of a caring relationship with an adult SBHC staffmember (b ¼ .48, p < .001, d ¼ .50), their total school assets(b ¼ .09, p < .001, d ¼ .14), specific school assets including caringrelationships with adults (b ¼ .08, p < .01, d ¼ .10), high expec-tations (b ¼ .08, p < .001, d ¼ .10), and meaningful participation(b ¼ .11, p < .001, d ¼ .12).
Based on post hoc z-tests, there was evidence of a linear dose-response relationship between students who used an SBHC oneto two times, three to five times, and > 10 times (vs. no reporteduse) and their reports of caring adults in the SBHC. A linear
dose-response relationship was not found for school assets. Posthoc z-tests revealed that for each asset subscaledcaring rela-tionships with adults, high expectations, and meaningfulparticipationdstudents who reported use of the SBHC > 10times reported significantly stronger assets than did studentswho either used it one to two times, three to five times, or six to10 times. These latter three groups did not differ from each other.
Effect sizes were largest for student reports of caring rela-tionships with SBHC staff (for each dose category, d¼ .28, .78, .52,and 2.84, respectively). Effect sizes for total school assets andassets subscales were generally modest (d ¼ 0e20). Amongstudents who used SBHC services> 10 times versus not, mediumeffect sizes were observed for total schools assets, caringrelationships, high expectations, and meaningful participation(d ¼ .57, .52, .53, and .48, respectively).
Table 5 describes propensity-adjustedmultivariate regressionestimates of the relationship between SBHC use and assets foreach school. Given the modest number of schools in the sample,we further grouped schools into two categories (those in whichthere were positive and significant associations between SBHCuse and caring relationships with adults in the SBHC and totalassets vs. not) and compared these schools in terms of theircompositional, performance, and utilization characteristics. Posthoc, Bonferroni-adjusted t-tests revealed that the six schools thatmet these criteria had higher average reading proficiency levels(52% vs. 21%; p < .01) and fewer black and Latino students (25%vs. 60%; p < .001). Their SBHCs were more established (7 vs.4 years; p < .01) and had lower overall utilization rates (37% vs.64%; p < .01).
Discussion
We found support for our hypotheses regarding student-reported SBHC utilization and school assets. We found relation-ships between student reports of SBHC use, a caring relationshipwith an adult in the SBHC, and school assets. Our findings coherewith emerging literature suggesting a positive relationshipbetween students’ SBHC utilization and academic outcomes, byproviding evidence of a key mechanism of that relationship,student-reported school assets. Importantly, school assets arelinked to reduced student risk behaviors, improved well-being,and positive school outcomes [17e21,25]. We found thestrongest relationships for student reports of caring relationshipswith SBHC staff, which is consistent with literature suggestingthat a key contribution of SBHCs is providing youth with accessto caring adults, particularly those at risk [23].
We found more modest relationships between overall utili-zation, utilization frequency levels up to 10 SBHC visits, andschool assets. This could be interpreted in at least twoways. First,school assets represent measures of students’ perceptions of therelationships and opportunities available in the overall schoolcommunity, of which SBHC contacts represent a circumscribedset. Second, it is likely that the nature of the contact with theSBHC has a role. It would be unreasonable to assume that casualcontact with the SBHC would produce large effects. Even witha higher frequency of visits to the SBHC, the particular type ofservice and the extent to which it directly or indirectly targetscaring relationships, high expectations, or opportunities formeaningful participation likely vary. On the one hand, thisfinding echoes prior calls for more research to unpack the nature,type, and frequency of service use, and also points to a need tounderstand subgroups of students who may be more or less

Table 4Multivariate regression estimates of relationship between SBHC use and caring relationships in SBHC, and school assets
Caring relationship with adult in SBHC Total school assets Caring relationshipsc High expectationsc Meaningful participationc
OLS multivariate regression estimates from propensity matched sample (n ¼ 5,962)Used at all .48*** (.39, .56) .09*** (.06, .13) .08** (.03, .13) .08*** (.03, .13) .11*** (.06, .15)
OLS multivariate regression estimates from propensity-weighted dose-response models (n ¼ 7,314)Used 1e2 times .37***a,b (.29, .45) .07***a (.05, .10) .06**a (.03, .09) .07**a (.02, .11) .08***a (.04, .12)Used 3e5 times .74***a,b (.61, .88) .11***a (.06, .17) .11**a(.05, .16) .09þa (.05, .16) .15***a (.08, .22)Used 6e10 times .35***a,b (.19, .51) .04a (�.03, .12) .00a (�.12, .11) .02a (�.09, .13) .09a (�.03, .20)Used > 10 times 1.58*** (1.45, 1.70) .23*** (.17, .28) .23*** (.17, .29) .23*** (.11, .34) .24*** (.16, .32)
OLS multivariate regression estimates from sample (n ¼ 7,314)Used at all .52*** (.43, .61) .09*** (.06, .12) .08*** (.04, .12) .08** (.03, .12) .11*** (.07, .15)
OLS multivariate regression estimates from dose-response models (n ¼ ,7314)Used 1e2 times .36*** (.27, .45) .08*** (.05, .11) .06** (.03, .10) .07** (.02, .11) .09*** (.04, .14)Used 3e5 times .71*** (.52, .83) .11*** (.07, .14) .10*** (.06, .14) .09** (.02, .15) .13*** (.05, .25)Used 6e10 times .52*** (.36, .67) .10þ (.02, .20) .04 (�.10, .19) .07 (�.07, .20) .15** (.05, .25)Used > 10 times 1.46*** (1.32, 1.60) .16*** (.09, .24) .19*** (.12. .25) .14** (.05, .24) .19** (.08, .30)
Data represent estimate (95% confidence interval). Multivariate models are cluster-corrected and also include pretreatment and other covariates, and school fixedeffects. Comparison group ¼ never used SBHC.OLS ¼ ordinary least squares; SBHC ¼ school-based health center.
a Post hoc z difference from used > 10 times, < .001.b Post hoc z difference from used three to five times, < .001.c Caring relationships, high expectations, and meaningful participation are subscales of total school assets.þ p < .10, **p < .01, ***p < .001.
S. Stone et al. / Journal of Adolescent Health 53 (2013) 526e532 531
responsive to SBHC services [1,26,29]. On the other hand, thesefindings raise the question of whether and how SBHC centers canmore actively link their programming to school asset develop-ment, which likely involves intentional collaborationwith schoolstaff to align and integrate their services with core schoolactivities [1,19].
School-based health center effects may be influenced bycharacteristics of the schools in which they are situated, and area reminder that schools can exert important influences on bothprogram delivery and student experience of services [6e11]. Thatschools with overall positive relationships between student-reported SBHC use and school assets had higher reading profi-ciency levels, lower concentrations of black and Latino students,and lower utilization than their peer schools raises questionsabout potential interactions between SBHCs and the risk profileof the student body or variation in SBHC capacity or service
Table 5Multivariate regression estimates of relationship between SBHC use and caringrelationships in SBHC, and school assets, by school
School Caringrelationshipwith adult inSBHC
Totalschoolassets
Caringrelationships
Highexpectations
Meaningfulparticipation
1 (n ¼ 60) .42 �.30 �.17 �.17 �.372 (n ¼ 400) .33*** �.05 �.08 �.07 .033 (n ¼ 49) .45 �.04 .06 .11 �.274 (n ¼ 76) .10 �.35 �.28 �.29 �.455 (n ¼ 59) .52þ �.08 �.25 �.01 .136 (n ¼ 299) .52*** .12 .10 .10 .167 (n ¼ 359) .39*** .18*** .27*** .20** .058 (n ¼ 156) .34þ �11 �.05 �.09 �.069 (n ¼ 245) .43*** .20** .17þ .16 .21þ
10 (n ¼ 521) .69*** .17** .21*** .22*** .0611 (n ¼ 869) .45*** .10* .02 .03 .19***
12 (n ¼ 1,219) .57*** .08* .06 .08* .08þ
13 (n ¼ 292) .58*** .14 .16 .13 .1614 (n ¼ 200) .50*** �.04 �.02 �.08 .1515 (n ¼ 1,158) .36*** .10** .08þ .05 .15**
SBHC ¼ school-based health center.þp < .10, *p < .05, **p < .01, ***p < .001.
delivery strategies. Such effects receive little attention in thisliterature, but are crucial for interpreting potential SBHC benefitsto students [6e11] and extending theory in this area [14].
Finally, we observed differential relationships between thenumber of SBHC visits and assets. The strongest effects, all ofwhich fell in the medium to large range, were observed forstudents reporting > 10 visits. This is encouraging given thaton average, these students showed risky pretreatment charac-teristics, and it may suggest minimum “doses” at which SBHCutilization shows effects on these outcome domains. Alterna-tively, we cannot rule out that students’ school assets havea role in selecting students into SBHC utilization and levels ofuse. This suggests more intensified efforts to understand corre-lates of SBHC utilization, such as staff referral practices, beyondprior socio-demographic and health and behavioral riskfactors [30].
In summary, our findings must be interpreted in light ofthe limitations of this data source in generating accurate esti-mates of these relationships. Use of this cross-sectional dataset also complicates our ability to understand the direction andnature of the relationship between SBHC use and assets. Wecannot be certain that SBHC use precedes student-reportedoutcome domains. As we discussed, we cannot rule out thatother omitted variables may account for the relationships weobserved, such as other types of service use at school or in thecommunity.
Given these limitations, our results support the promise offurther exploration and expansion the framework of Geier-stanger and colleagues [14] for SBHC effects on student academicfunctioning. Our findings also underscore that nuanced under-standing of both users and the nature and type of services used,as well as the implementation of designs that can be informativeof school effects on SBHCs and their users, could add to thedevelopment of this knowledge base [1,6e11].
Acknowledgments
The authors acknowledge the support of the administrativestaff of the San Francisco Wellness Initiative and the School

S. Stone et al. / Journal of Adolescent Health 53 (2013) 526e532532
Health Programs Office of the San Francisco Unified School Dis-trict's Student, Family, and Community Support Department foraccess to data sources and helpful feedback on the manuscript.
References
[1] Keeton V, Soleimanpour S, Brindis CD. School-based health centers in anera of health care reform: Building on history. Curr Probl Pediatr AdolescHealth Care 2012;42:132e56.
[2] Strozer J, Juszczak L, Ammerman A. 2007-2008 National School-BasedHealth Care Census. Washington, DC: National Assembly on School-BasedHealth Care; 2010.
[3] AtkinsMS,HoagwoodKE,KutashK, et al. Toward the integrationof educationand mental health in schools. Adm Policy Ment Health 2000;37:40e7.
[4] Guerra NG, Williams KR. Implementation of school-based wellness centers.Psychology in the Schools 2003;40:473e87.
[5] Cook TD. School based management: A concept of modest sensitivity withmodest results. J Personnel Eval Educ 2007;20:129e45.
[6] Billy JOG, Grady WR, Wenzlow AT, et al. Contextual influences on schoolprovision of health services. J Adolesc Health 2000;27:12e24.
[7] Eisenberg M. Integrating a school-based health intervention in times ofhigh-stakes testing: Lessons learned from full court press. Health PromotPract 2009;10:284e92.
[8] McNall MA, Lichty LF, Mavis B. The impact of school-based health centerson the health outcomes of middle school and high school students. Am JPublic Health 2010;100:1604e10.
[9] Payne AA, Gottfredson DC, Gottfredson GD. School predictors of theintensity of implementation of school-based prevention programs: Resultsfrom a national study. Prevent Sci 2006;7:225e37.
[10] Strolin-Goltzman J, Sisselman A, Auerbach C, et al. The moderating effect ofschool type on the relationship between school-based health centers andthe learning environment. Soc Work Public Health 2012;27:699e709.
[11] Wade TJ, Mansour ME, Guo JJ, et al. Access and utilization patterns ofschool-based health centers at urban and rural elementary and middleschools. Public Health Rep 2008;123:739e50.
[12] Strolin-Goltzman J. The relationship between school-based health centersand the learning environment. J Sch Health 2010;80:153e9.
[13] Walker SC, Kerns SE, Lyon AR, et al. Impact of school-based health centeruse on academic outcomes. J Adolesc Health 2009;46:1e7.
[14] Geierstanger SP, Amaral G, Mansour M, Walters SR. School-based healthcenters and academic performance: Research, challenges, and recom-mendations. J Sch Health 2004;74:347e52.
[15] Hoagwood KE, Olin SS, Kerker BD. Empirically based school interventionstargeted at academic and mental health functioning. J Emot Behav Disord2007;15:66e92.
[16] Mason-Jones AJ, Crisp C, Momberg M, et al. A systematic review of the roleof school-based healthcare in adolescent sexual, reproductive, and mentalhealth. Syst Rev 2012;1:1e49.
[17] Blum RW, Libbey HP. Special issue on school connectedness: Strengtheninghealth and education outcomes for teenagers. J Sch Health 2004;74:231e99.
[18] Catalano RF, Oesterle S, Fleming CB, Hawkins JD. The importance ofbonding to school for healthy development: Findings from the SocialDevelopment Research Group. J Sch Health 2004;74:252e61.
[19] Jenson JM, Alter CF, Nicotera N, et al. Risk, resilience, and positive youthdevelopment: Developing effective community programs for at-risk youth:Lessons from the Denver Bridge Project. New York: Oxford Universiy Press;2013.
[20] Kia-Keating M, Dowdy E, Morgan ML, Noam GG. Protecting and promoting:An integrative conceptual model for healthy development of adolescents.J Adolesc Health 2011;48:220e8.
[21] Kidger J, Araya R, Donovan J, David Gunnell D. The effect of the schoolenvironment on the emotional health of adolescents: A systematic review.Pediatrics 2012;129:1e25.
[22] Brown MB, Bolen LM. The school-based health center as a resource forprevention and health promotion. Psychol Schools 2008;45:28e38.
[23] Richardson JW. From risk to resilience: Promoting school-health partner-ships for children. Int J Educ Reform 2008;17:19e36.
[24] Steen S, Noguera PA. A broader and bolder approach to school reform:Expanded partnership roles for school counselors. Prof Sch Couns 2010;14:42e52.
[25] San Francisco Unified School District. District school profiles 2008-2009(Fall 2008): High schools summary. San Francisco: Research, Planning,Accountability Department, San Francisco Unified School District; 2009.
[26] Soleimanpour S, Geierstanger SP, Kaller S, et al. The role of school healthcenters in health care access and client outcomes. Am J Public Health 2010;100:1597e603.
[27] Weisz J, Sandler I, Durlak J, Anton B. Promoting and protecting youthmental health through evidence-based prevention and treatment. AmPsychol 2005;60:628e48.
[28] Weist MD, Goldstein A, Morris L, Bryant T. Integrating expanded schoolmental health programs and school-based health centers. Psychol Sch2003;40:297e308.
[29] Amaral G, Geierstanger S, Soleimanpour S, Brindis C. Mental health char-acteristics and health-seeking behaviors of adolescent school-based healthcenter users and nonusers. J Sch Health 2011;81:138e45.
[30] Anyon Y, Whitaker K, Shields J, Franks H. Help-seeking in context:Reframing Chinese American adolescents’ underutilization of behavioralhealth services. J Sch Health. In press.
[31] Ilgen MA, Schulenberg J, Kloska DD, et al. Prevalence and characteristics ofsubstance abuse treatment utilization by US adolescents: national datafrom 1987 to 2008. Addict Behav 2011;36:1349e52.
[32] Guo S, Fraser MW. Propensity score analysis: Statistical methods andapplications. Thousand Oaks (CA): Sage; 2010.
[33] Rosenbaum PR, Rubin DB. The central role of the propensity score inobservational studies for causal effects. Biometrika 1983;70:41e55.
[34] Hanson TL, Kim J-O. Measuring resilience and youth development: Thepsychometric properties of the Healthy Kids Survey. (Issues and AnswersReport, REL 2007eNo. 034). Washington (DC): Department of Education,Institute of Education Sciences, National Center for Education Evaluationand Regional Assistance, Regional Educational Laboratory West; 2007.
[35] Constantine NA, Bernard B, Diaz M. Measuring protective factors andresilience traits in youth: The Healthy Kids Resilience Assessment. SeventhAnnual Meeting of the Society for Prevention Research, New Orleans,LA; 1999.
[36] Neild R, Farley E. Whatever happened to the class of 2000? The timing ofdropout in Philadelphia’s schools. In: Orfield G, ed. Dropouts in America:Confronting the Graduation Rate Crisis. Cambridge (MA): Harvard Educa-tion Press; 2004:207e20.
[37] Allensworth E, Easton JQ. What matters for staying on-track and gradu-ating in Chicago public high schools: A close look at course grades, failuresand attendance in the freshman year. Chicago: Consortium on ChicagoSchool Research; 2007. p. 1e61.
[38] Furlong MJ, Ritchey KM, O’Brennan LM. Developing norms for the CaliforniaResilience Youth DevelopmentModule: Internal assets and school resourcessubscales. California School Psychologist 2009;14:35e46.
[39] Imbens GW. The role of propensity scoring in estimating dose-responsefunctions. Biometrika 2000;87:706e10.