the relationship between 24-hour ambulatory blood pressure
TRANSCRIPT
Rev Port Cardiol. 2017;36(2):97---105
www.revportcardiol.org
Revista Portuguesa de
CardiologiaPortuguese Journal of Cardiology
ORIGINAL ARTICLE
The relationship between 24-hour ambulatory blood
pressure load and neutrophil-to-lymphocyte ratio
Tolga Cimen, Hamza Sunman, Tolga Han Efe ∗, Mehmet Erat, Haluk Furkan Sahan,Engin Algül, Ilkin Guliyev, Ahmet Akyel, Mehmet Dogan, Sadık Acıkel, Ekrem Yeter
Department of Cardiology, Dıskapı Yıldırım Beyazıt Training and Research Hospital, Ankara, Turkey
Received 11 May 2016; accepted 15 July 2016
Available online 1 February 2017
KEYWORDSAmbulatory bloodpressure;Neutrophil-to-lymphocyte ratio;Hypertension;Inflammation
Abstract
Introduction and Objective: The neutrophil-to-lymphocyte ratio (NLR) is established as a
reliable marker of systemic inflammation. Low-grade inflammation has a key role in the patho-
genesis and progression of hypertension (HTN). Blood pressure (BP) load, defined as the
percentage of abnormally elevated BP readings, is a good marker of HTN severity. We aimed to
evaluate the relationship between HTN severity and NLR using averaged ambulatory BP readings
and BP load.
Methods: A total of 300 patients with untreated essential HTN were included in this cross-
sectional study. Patients were divided into quartiles according to NLR values (first: <1.55;
second: 1.55-1.92; third: 1.92-2.48; and fourth: >2.48). Averaged ambulatory BP values and
BP load were assessed for each quartile.
Results: In the interquartile evaluation there were no differences between quartiles in terms of
baseline demographic, clinical and echocardiographic characteristics (p>0.05). Daytime systolic
BP (SBP), 24-hour diastolic BP (DBP), daytime DBP, daytime SBP load, 24-hour DBP load and
daytime DBP load were found to be significantly higher in the upper two quartiles (p<0.05
for all). In correlation analysis, log NLR values were found to be positively correlated with
24-hour SBP, DBP, SBP load and DBP load (Pearson coefficients of 0.194, 0.197, 0.157 and 0.181,
respectively; p<0.01 for all). In multivariate analysis, log NLR had an independent association
with 24-hour SBP and DBP and 24-hour SBP and DBP load.
Conclusion: This study showed for the first time that increased NLR is independently associated
with HTN severity in untreated essential HTN patients.
© 2016 Sociedade Portuguesa de Cardiologia. Published by Elsevier Espana, S.L.U. All rights
reserved.
∗ Corresponding author.E-mail address: [email protected] (T.H. Efe).
http://dx.doi.org/10.1016/j.repc.2016.07.0090870-2551/© 2016 Sociedade Portuguesa de Cardiologia. Published by Elsevier Espana, S.L.U. All rights reserved.
98 T. Cimen et al.
PALAVRAS-CHAVEPressão arterialem ambulatório;Proporcãoneutrófilos/linfócitos;Hipertensão;Inflamacão
A relacão entre a carga da pressão arterial em ambulatório durante 24 horas
e a proporcão neutrófilos/linfócitos
Resumo
Introducão e objetivos: A relacão neutrófilos/linfócitos (RNL) foi estabelecida como um mar-
cador inflamatório sistémico fiável. Uma inflamacão de baixo grau tem um papel fundamental
na patogénese e na progressão da hipertensão (HT). A carga da pressão arterial (PA) definida
como a percentagem de leituras da PA anormalmente elevadas é um bom marcador da gravi-
dade da PA. O objetivo deste estudo é avaliar a relacão entre a gravidade da PA e a RNL pela
utilizacão da média de leituras ambulatórias da PA e da carga da PA.
Métodos: Um total de 300 doentes, com HT essencial não tratada, foram incluídos neste estudo
transversal. Os doentes foram divididos em quartis, de acordo com os valores da RNL (primeiro
<1,55; segundo 1,55-1,92; terceiro 1,92-2,48 e o quarto > 2,48). Os valores médios da PA em
ambulatório e a carga da PA foram avaliados para cada quartil.
Resultados: Na avaliacão interquartis, não houve diferenca entre quartis nas características
demográficas, clínicas e ecocardiográficas basais (p > 0,05). A PA sistólica diurna (PAS), a
PA diastólica (PAD) a 24 horas, a PAD diurna, a carga da PAS diurna, a PAD a 24 horas e a PAD
diurna foram significativamente mais elevadas nos dois quartis superiores (p < 0,05 para todos).
Na análise de correlacão, os valores do logaritmo de RNL foram positivamente correlacionados
com a PAS a 24 horas, com a PAD, com a PAS carga e com a PAD carga (coeficientes de Pearson
de 0,194, 0,197, 0,157 e 0,181, respetivamente; p<0,01 para todos). Na análise multivariada,
os valores do logaritmo da RNL mostraram uma associacão independente com a PAS-PAD a 24
horas e com a carga da PAS-PAD a 24 horas.
Conclusão: Este estudo mostrou pela primeira vez que o aumento da RNL está independente-
mente associado à gravidade da PA nos doentes com HT essencial não tratada.
© 2016 Sociedade Portuguesa de Cardiologia. Publicado por Elsevier Espana, S.L.U. Todos os
direitos reservados.
Introduction
Hypertension (HTN) is a common condition that results indamage to important target organs including the heart, kid-ney and brain.1,2 Low-grade inflammation has a key role inits pathogenesis and progression.3 Inflammatory processesare assumed to have particularly significant involvement invascular remodeling of resistance arteries.4 Increasing bloodpressure (BP) may progressively cause a pro-inflammatoryresponse and thus establish a vicious cycle. Furthermore,HTN is a significant risk factor in inflammatory conditionssuch as atherosclerosis.5
The relationship between various cardiovascular condi-tions and inflammation has been investigated in previousstudies.6 Elevated C-reactive protein (CRP), vascular (VCAM-1) and intercellular (ICAM-1) adhesion molecules, monocytechemoattractant protein-1 (MCP) and plasminogen activatorinhibitor-1 (PAI-1) are some of the inflammatory moleculesthat are increased in HTN.7,8 Along with these well-known inflammatory markers, recent studies have shownthe neutrophil-to-lymphocyte ratio (NLR) to be a reliablemarker of systemic inflammation.9 It has been shown tohave prognostic significance in various conditions such ascoronary artery disease,10,11 malignancy,12 heart failure,13
and cerebral and peripheral artery disease.14,15 Since HTNis considered a significant risk factor in most of these con-ditions, the relationship between NLR and HTN has alsobeen thoroughly investigated.16 NLR is a good predictor in
high-risk conditions such as resistant HTN and non-dipperHTN.17,18
Ambulatory blood pressure monitoring (ABPM) is animportant tool that is frequently used by clinicians in dailypractice to guide treatment and help to identify conditionssuch as white-coat and masked HTN.19 It is known that ABPMis a better predictor of target organ damage and cardio-vascular endpoints than office BP.20 However, it may havelimitations in patients with ‘high-normal’ BP.21 In view ofthis limitation, some authors suggest that BP load, definedas the percentage of abnormally elevated BP readings, is abetter predictor.22,23
As far as we know, there are few data on the evaluationof severity of the inflammatory response in HTN using NLR,which is a simple and inexpensive method. Thus, in our studywe aimed to evaluate the relationship between HTN severityand NLR using averaged ambulatory BP readings and BP load.
Methods
Study population
This cross-sectional study included 300 consecutive patientswith newly diagnosed essential hypertension by 24-hourABPM using a validated device between December 2014 andDecember 2015. All patients had untreated essential HTN,defined as office BP of ≥140/90 mmHg (the mean of ≥2 valid
The relationship between 24-hour ambulatory BP load and NLR 99
readings measured on at least two visits). Patients with thefollowing criteria were excluded from the study: current useof antihypertensive drugs, acute or chronic infectious condi-tions, leukocytosis (white blood cell count >12.0×10³/mm3),history of malignancy, chronic renal disease (estimatedglomerular filtration rate <60 ml/min/1.73 m2), elevatedhepatic enzymes (bilirubin >2 upper limit of normal [ULN]or AST/ALT/ALP >3 ULN), diagnosis of secondary hyperten-sion or white coat hypertension, moderate to severe valvulardisease, symptomatic cardiac failure or prosthetic valve,history of coronary artery disease, peripheral artery diseaseor stroke, atrial fibrillation, thromboembolic disorders, his-tory of hematological disease and consumption of drugs thatmay affect NLR.
Demographic, clinical, and laboratory parameters includ-ing age, gender, diabetes, hyperlipidemia, smoking status,body mass index (BMI), fasting blood glucose level, serumcreatinine level, fasting lipid profile, and complete bloodcount parameters were recorded in all patients.
Informed consent was obtained from each patient beforeenrollment. The study was approved by the institutionalethics committee and performed in accordance with theHelsinki Declaration.
Laboratory tests
A complete blood count analysis was performed using an LHseries analyzer (Beckman Coulter Inc., Hialeah, FL). NLR wascalculated as the ratio of neutrophil count to lymphocytecount in admission samples. Biochemistry analysis was per-formed using standard tests on samples obtained in fastingconditions.
All transthoracic echocardiography examinations wereperformed using a Philips iE33 xMATRIX system with a 2.5/3.5MHz transducer (Philips Electronics, The Netherlands) byan experienced echocardiographer who was blinded to thepatients included in the study. Left ventricular ejectionfraction (LVEF) and left ventricular mass index (LVMI) werecalculated as recommended by the current guidelines.24 Anelectrocardiogram was obtained for all patients.
Blood pressure measurement
Twenty-four-hour ABPM readings (Oscar 2 oscillometric mon-itor, SunTech Medical Inc., Morrisville, NC) were assessed forall patients. Appropriate cuff sizes were selected by trainednurses. Measurements were taken at 15-min intervals duringthe day and at 30-min intervals at night. Patients with fewerthan 80% valid measurements were excluded. Patients withmean 24-hour systolic BP (SBP) ≥130 mmHg and/or dias-tolic BP (DBP) ≥80 mmHg or mean daytime SBP ≥135 mmHgand/or DBP ≥85 mmHg were diagnosed as hypertensive.19
A non-dipper pattern was defined as a decrease of <10% inSBP between daytime (7:00 am to 11:00 pm) and nighttime(11:00 pm to 7:00 am). Mean 24-hour, daytime, and night-time SBP and DBP were calculated for each patient using thehourly averages of ambulatory BP recordings. BP load andBP variability were recorded as additional data. BP load wasdefined as the percentage of values reaching or exceeding135 mmHg SBP or 85 mmHg DBP daytime and 120 mmHg SBPor 70 mmHg DBP nighttime on 24-hour BP readings. 24-hour
BP load was also calculated based on these cut-off values.For a more reliable evaluation of BP variability, we also per-formed an additional analysis using the weighted mean ofdaytime and nighttime standard deviation for both SBP andDBP, as previously described.25
Statistical analysis
Statistical analyses were performed using SPSS software(version 21.0; SPSS, Chicago, IL). Continuous data were pre-sented as medians with interquartile range or mean ± SDfor non-normally and normally distributed variables, respec-tively. The Shapiro-Wilk test was used to test the distributionpattern and logarithmic conversion was performed for non-normally distributed variables. The study population wascategorized into quartiles based on NLR levels. Compar-isons between groups were carried out by Kruskal-Wallistests or analysis of variance, as appropriate. Differencesbetween groups were revealed using Dunn’s procedure fordata without normal distribution and Bonferroni’s multiplecomparison post hoc test for data with normal distribution.Categorical variables were summarized as percentages andcompared with the chi-square test. Correlations betweenvariables were investigated by the Pearson correlation coef-ficient. Age, gender, diabetes, hyperlipidemia, smokingstatus, BMI, serum creatinine, hemoglobin, fasting glu-cose, white blood cell count, platelet count, log NLR, totalcholesterol, low-density lipoprotein, high-density lipopro-tein cholesterol, triglycerides, aspirin medication, LVEF andLVMI were tested by univariate linear regression analysis.Multivariate regression analysis including all univariate cor-relates (p<0.1) was used to identify predictors for 24-hoursystolic and diastolic BP and BP load. For all tests, statisticalsignificance was accepted as a p value <0.05.
Results
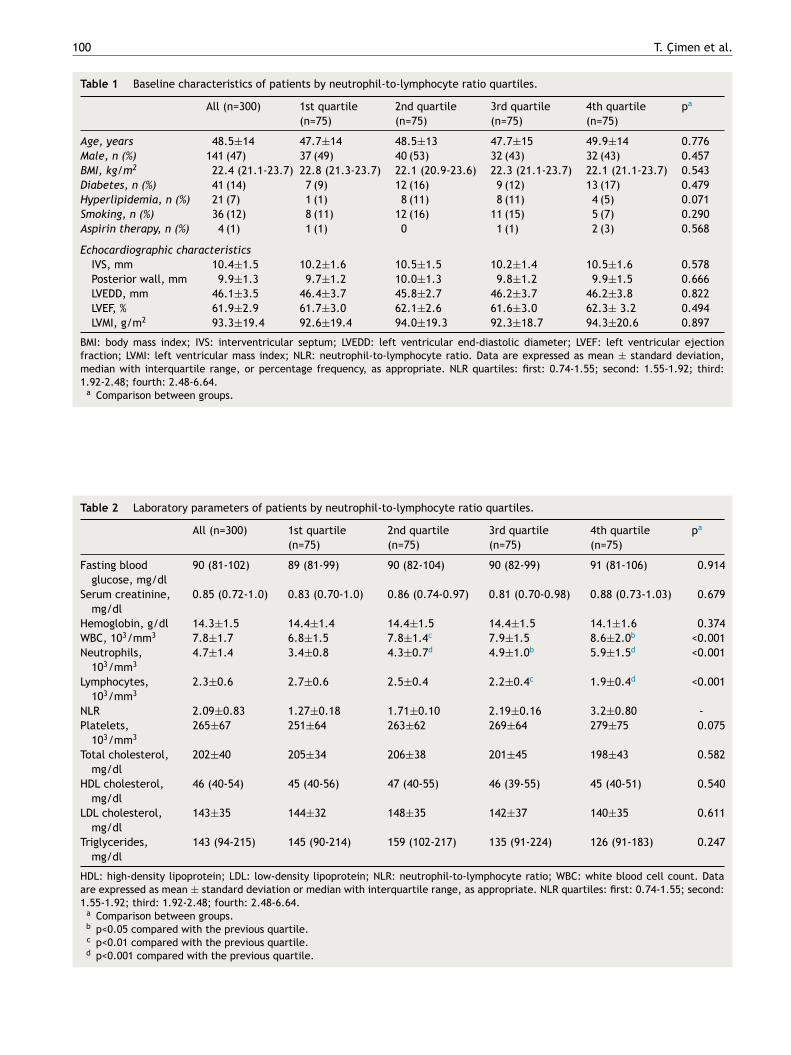
Three hundred hypertensive patients (47% male) were eval-uated. The mean age of the population was 48.5±14 years.Patients were divided into quartiles according to NLR val-ues (first: <1.55; second: 1.55-1.92; third: 1.92-2.48; andfourth: >2.48). There were no differences between quartilesin terms of basal demographics, cardiovascular risk factorsor echocardiographic parameters (Table 1). Baseline labora-tory findings are presented in Table 2. Fasting blood glucose,serum creatinine, hemoglobin, platelet count, and lipid pro-file were not different across NLR quartiles. White bloodcell and neutrophil counts were significantly higher in upperquartiles of NLR. There was also a statistically significanttrend towards lower lymphocyte count in patients in thefourth quartile.
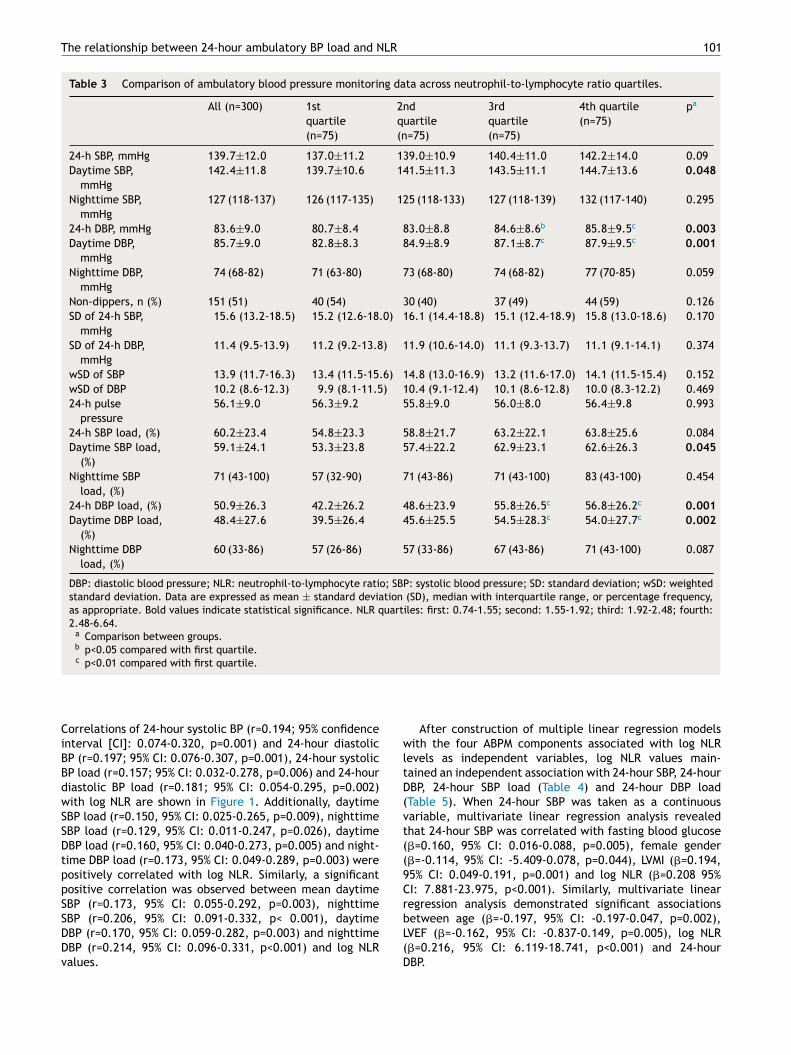
Patients’ ABPM data are shown in Table 3. In theinterquartile evaluation, daytime SBP, 24-hour DBP, daytimeDBP, daytime SBP load, 24-hour DBP load and daytime DBPload were found to be significantly higher in the upper twoquartiles (p<0.05 for all). The difference was more notice-able in DBP data. Dipping status and BP variability data werenot significantly different between quartiles (p>0.05).
Subsequently, the relationship between mean BP and BPload values and NLR was evaluated. A positive correlationbetween log NLR and daytime, nighttime and 24-hourBP and BP load values was identified (p<0.05 for all).
100 T. Cimen et al.
Table 1 Baseline characteristics of patients by neutrophil-to-lymphocyte ratio quartiles.
All (n=300) 1st quartile
(n=75)
2nd quartile
(n=75)
3rd quartile
(n=75)
4th quartile
(n=75)
pa
Age, years 48.5±14 47.7±14 48.5±13 47.7±15 49.9±14 0.776
Male, n (%) 141 (47) 37 (49) 40 (53) 32 (43) 32 (43) 0.457
BMI, kg/m2 22.4 (21.1-23.7) 22.8 (21.3-23.7) 22.1 (20.9-23.6) 22.3 (21.1-23.7) 22.1 (21.1-23.7) 0.543
Diabetes, n (%) 41 (14) 7 (9) 12 (16) 9 (12) 13 (17) 0.479
Hyperlipidemia, n (%) 21 (7) 1 (1) 8 (11) 8 (11) 4 (5) 0.071
Smoking, n (%) 36 (12) 8 (11) 12 (16) 11 (15) 5 (7) 0.290
Aspirin therapy, n (%) 4 (1) 1 (1) 0 1 (1) 2 (3) 0.568
Echocardiographic characteristics
IVS, mm 10.4±1.5 10.2±1.6 10.5±1.5 10.2±1.4 10.5±1.6 0.578
Posterior wall, mm 9.9±1.3 9.7±1.2 10.0±1.3 9.8±1.2 9.9±1.5 0.666
LVEDD, mm 46.1±3.5 46.4±3.7 45.8±2.7 46.2±3.7 46.2±3.8 0.822
LVEF, % 61.9±2.9 61.7±3.0 62.1±2.6 61.6±3.0 62.3± 3.2 0.494
LVMI, g/m2 93.3±19.4 92.6±19.4 94.0±19.3 92.3±18.7 94.3±20.6 0.897
BMI: body mass index; IVS: interventricular septum; LVEDD: left ventricular end-diastolic diameter; LVEF: left ventricular ejectionfraction; LVMI: left ventricular mass index; NLR: neutrophil-to-lymphocyte ratio. Data are expressed as mean ± standard deviation,median with interquartile range, or percentage frequency, as appropriate. NLR quartiles: first: 0.74-1.55; second: 1.55-1.92; third:1.92-2.48; fourth: 2.48-6.64.
a Comparison between groups.
Table 2 Laboratory parameters of patients by neutrophil-to-lymphocyte ratio quartiles.
All (n=300) 1st quartile
(n=75)
2nd quartile
(n=75)
3rd quartile
(n=75)
4th quartile
(n=75)
pa
Fasting blood
glucose, mg/dl
90 (81-102) 89 (81-99) 90 (82-104) 90 (82-99) 91 (81-106) 0.914
Serum creatinine,
mg/dl
0.85 (0.72-1.0) 0.83 (0.70-1.0) 0.86 (0.74-0.97) 0.81 (0.70-0.98) 0.88 (0.73-1.03) 0.679
Hemoglobin, g/dl 14.3±1.5 14.4±1.4 14.4±1.5 14.4±1.5 14.1±1.6 0.374
WBC, 103/mm3 7.8±1.7 6.8±1.5 7.8±1.4c 7.9±1.5 8.6±2.0b <0.001
Neutrophils,
103/mm3
4.7±1.4 3.4±0.8 4.3±0.7d 4.9±1.0b 5.9±1.5d <0.001
Lymphocytes,
103/mm3
2.3±0.6 2.7±0.6 2.5±0.4 2.2±0.4c 1.9±0.4d <0.001
NLR 2.09±0.83 1.27±0.18 1.71±0.10 2.19±0.16 3.2±0.80 -
Platelets,
103/mm3
265±67 251±64 263±62 269±64 279±75 0.075
Total cholesterol,
mg/dl
202±40 205±34 206±38 201±45 198±43 0.582
HDL cholesterol,
mg/dl
46 (40-54) 45 (40-56) 47 (40-55) 46 (39-55) 45 (40-51) 0.540
LDL cholesterol,
mg/dl
143±35 144±32 148±35 142±37 140±35 0.611
Triglycerides,
mg/dl
143 (94-215) 145 (90-214) 159 (102-217) 135 (91-224) 126 (91-183) 0.247
HDL: high-density lipoprotein; LDL: low-density lipoprotein; NLR: neutrophil-to-lymphocyte ratio; WBC: white blood cell count. Dataare expressed as mean ± standard deviation or median with interquartile range, as appropriate. NLR quartiles: first: 0.74-1.55; second:1.55-1.92; third: 1.92-2.48; fourth: 2.48-6.64.
a Comparison between groups.b p<0.05 compared with the previous quartile.c p<0.01 compared with the previous quartile.d p<0.001 compared with the previous quartile.
The relationship between 24-hour ambulatory BP load and NLR 101
Table 3 Comparison of ambulatory blood pressure monitoring data across neutrophil-to-lymphocyte ratio quartiles.
All (n=300) 1st
quartile
(n=75)
2nd
quartile
(n=75)
3rd
quartile
(n=75)
4th quartile
(n=75)
pa
24-h SBP, mmHg 139.7±12.0 137.0±11.2 139.0±10.9 140.4±11.0 142.2±14.0 0.09
Daytime SBP,
mmHg
142.4±11.8 139.7±10.6 141.5±11.3 143.5±11.1 144.7±13.6 0.048
Nighttime SBP,
mmHg
127 (118-137) 126 (117-135) 125 (118-133) 127 (118-139) 132 (117-140) 0.295
24-h DBP, mmHg 83.6±9.0 80.7±8.4 83.0±8.8 84.6±8.6b 85.8±9.5c 0.003
Daytime DBP,
mmHg
85.7±9.0 82.8±8.3 84.9±8.9 87.1±8.7c 87.9±9.5c 0.001
Nighttime DBP,
mmHg
74 (68-82) 71 (63-80) 73 (68-80) 74 (68-82) 77 (70-85) 0.059
Non-dippers, n (%) 151 (51) 40 (54) 30 (40) 37 (49) 44 (59) 0.126
SD of 24-h SBP,
mmHg
15.6 (13.2-18.5) 15.2 (12.6-18.0) 16.1 (14.4-18.8) 15.1 (12.4-18.9) 15.8 (13.0-18.6) 0.170
SD of 24-h DBP,
mmHg
11.4 (9.5-13.9) 11.2 (9.2-13.8) 11.9 (10.6-14.0) 11.1 (9.3-13.7) 11.1 (9.1-14.1) 0.374
wSD of SBP 13.9 (11.7-16.3) 13.4 (11.5-15.6) 14.8 (13.0-16.9) 13.2 (11.6-17.0) 14.1 (11.5-15.4) 0.152
wSD of DBP 10.2 (8.6-12.3) 9.9 (8.1-11.5) 10.4 (9.1-12.4) 10.1 (8.6-12.8) 10.0 (8.3-12.2) 0.469
24-h pulse
pressure
56.1±9.0 56.3±9.2 55.8±9.0 56.0±8.0 56.4±9.8 0.993
24-h SBP load, (%) 60.2±23.4 54.8±23.3 58.8±21.7 63.2±22.1 63.8±25.6 0.084
Daytime SBP load,
(%)
59.1±24.1 53.3±23.8 57.4±22.2 62.9±23.1 62.6±26.3 0.045
Nighttime SBP
load, (%)
71 (43-100) 57 (32-90) 71 (43-86) 71 (43-100) 83 (43-100) 0.454
24-h DBP load, (%) 50.9±26.3 42.2±26.2 48.6±23.9 55.8±26.5c 56.8±26.2c 0.001
Daytime DBP load,
(%)
48.4±27.6 39.5±26.4 45.6±25.5 54.5±28.3c 54.0±27.7c 0.002
Nighttime DBP
load, (%)
60 (33-86) 57 (26-86) 57 (33-86) 67 (43-86) 71 (43-100) 0.087
DBP: diastolic blood pressure; NLR: neutrophil-to-lymphocyte ratio; SBP: systolic blood pressure; SD: standard deviation; wSD: weightedstandard deviation. Data are expressed as mean ± standard deviation (SD), median with interquartile range, or percentage frequency,as appropriate. Bold values indicate statistical significance. NLR quartiles: first: 0.74-1.55; second: 1.55-1.92; third: 1.92-2.48; fourth:2.48-6.64.
a Comparison between groups.b p<0.05 compared with first quartile.c p<0.01 compared with first quartile.
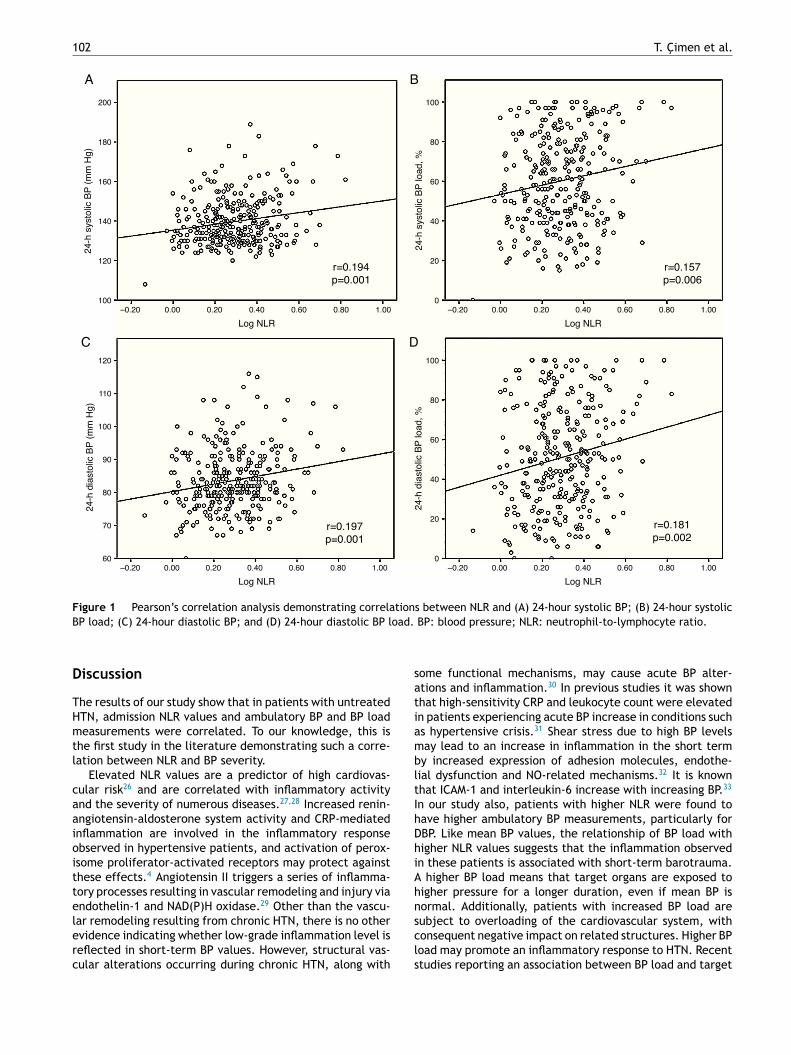
Correlations of 24-hour systolic BP (r=0.194; 95% confidenceinterval [CI]: 0.074-0.320, p=0.001) and 24-hour diastolicBP (r=0.197; 95% CI: 0.076-0.307, p=0.001), 24-hour systolicBP load (r=0.157; 95% CI: 0.032-0.278, p=0.006) and 24-hourdiastolic BP load (r=0.181; 95% CI: 0.054-0.295, p=0.002)with log NLR are shown in Figure 1. Additionally, daytimeSBP load (r=0.150, 95% CI: 0.025-0.265, p=0.009), nighttimeSBP load (r=0.129, 95% CI: 0.011-0.247, p=0.026), daytimeDBP load (r=0.160, 95% CI: 0.040-0.273, p=0.005) and night-time DBP load (r=0.173, 95% CI: 0.049-0.289, p=0.003) werepositively correlated with log NLR. Similarly, a significantpositive correlation was observed between mean daytimeSBP (r=0.173, 95% CI: 0.055-0.292, p=0.003), nighttimeSBP (r=0.206, 95% CI: 0.091-0.332, p< 0.001), daytimeDBP (r=0.170, 95% CI: 0.059-0.282, p=0.003) and nighttimeDBP (r=0.214, 95% CI: 0.096-0.331, p<0.001) and log NLRvalues.
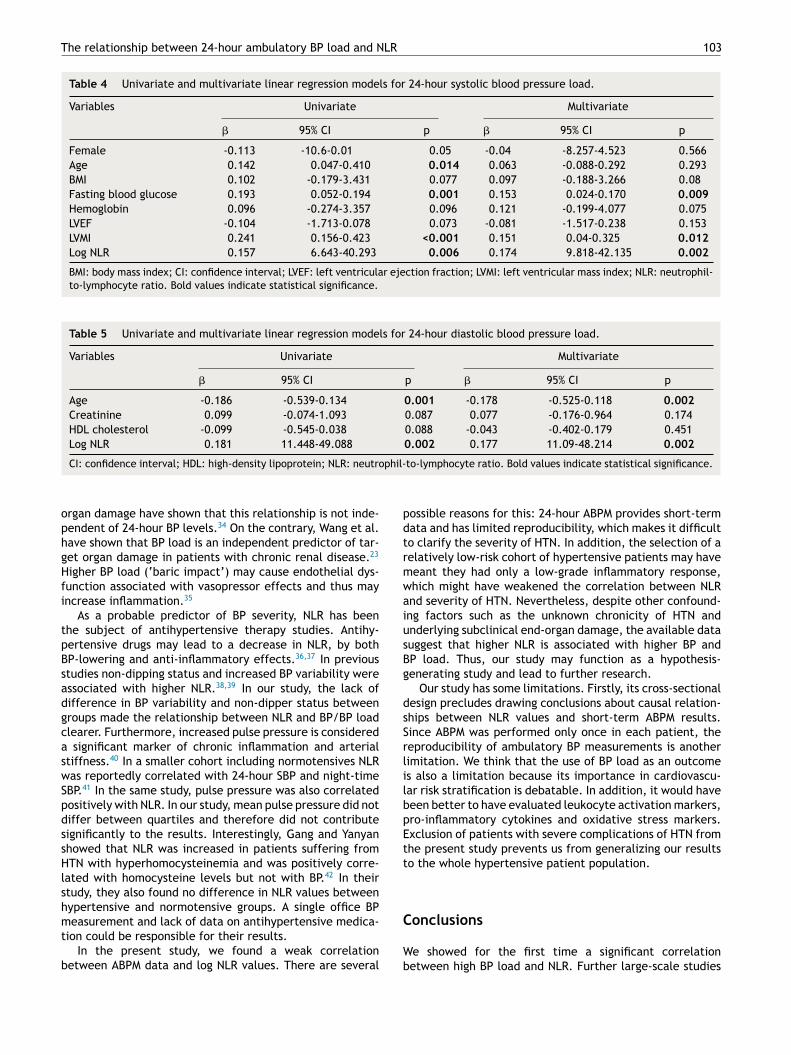
After construction of multiple linear regression modelswith the four ABPM components associated with log NLRlevels as independent variables, log NLR values main-tained an independent association with 24-hour SBP, 24-hourDBP, 24-hour SBP load (Table 4) and 24-hour DBP load(Table 5). When 24-hour SBP was taken as a continuousvariable, multivariate linear regression analysis revealedthat 24-hour SBP was correlated with fasting blood glucose(�=0.160, 95% CI: 0.016-0.088, p=0.005), female gender(�=-0.114, 95% CI: -5.409-0.078, p=0.044), LVMI (�=0.194,95% CI: 0.049-0.191, p=0.001) and log NLR (�=0.208 95%CI: 7.881-23.975, p<0.001). Similarly, multivariate linearregression analysis demonstrated significant associationsbetween age (�=-0.197, 95% CI: -0.197-0.047, p=0.002),LVEF (�=-0.162, 95% CI: -0.837-0.149, p=0.005), log NLR(�=0.216, 95% CI: 6.119-18.741, p<0.001) and 24-hourDBP.
102 T. Cimen et al.
200
A B
DC
180
160
140
120
100–0.20 0.00 0.20 0.40
Log NLR
24
-h s
ysto
lic B
P (
mm
Hg
)
0.60 0.80 1.00
100
80
60
40
20
0–0.20 0.00 0.20 0.40
Log NLR
24
-h s
ysto
lic B
P lo
ad
, %
0.60 0.80 1.00
120
100
110
90
80
70
60–0.20 0.00 0.20 0.40
Log NLR
r=0.197
p=0.001
r=0.181
p=0.002
r=0.157
p=0.006
r=0.194
p=0.001
24-h
dia
sto
lic B
P (
mm
Hg)
0.60 0.80 1.00
100
80
60
40
20
0–0.20 0.00 0.20 0.40
Log NLR
24-h
dia
sto
lic B
P load, %
0.60 0.80 1.00
Figure 1 Pearson’s correlation analysis demonstrating correlations between NLR and (A) 24-hour systolic BP; (B) 24-hour systolic
BP load; (C) 24-hour diastolic BP; and (D) 24-hour diastolic BP load. BP: blood pressure; NLR: neutrophil-to-lymphocyte ratio.
Discussion
The results of our study show that in patients with untreatedHTN, admission NLR values and ambulatory BP and BP loadmeasurements were correlated. To our knowledge, this isthe first study in the literature demonstrating such a corre-lation between NLR and BP severity.
Elevated NLR values are a predictor of high cardiovas-cular risk26 and are correlated with inflammatory activityand the severity of numerous diseases.27,28 Increased renin-angiotensin-aldosterone system activity and CRP-mediatedinflammation are involved in the inflammatory responseobserved in hypertensive patients, and activation of perox-isome proliferator-activated receptors may protect againstthese effects.4 Angiotensin II triggers a series of inflamma-tory processes resulting in vascular remodeling and injury viaendothelin-1 and NAD(P)H oxidase.29 Other than the vascu-lar remodeling resulting from chronic HTN, there is no otherevidence indicating whether low-grade inflammation level isreflected in short-term BP values. However, structural vas-cular alterations occurring during chronic HTN, along with
some functional mechanisms, may cause acute BP alter-ations and inflammation.30 In previous studies it was shownthat high-sensitivity CRP and leukocyte count were elevatedin patients experiencing acute BP increase in conditions suchas hypertensive crisis.31 Shear stress due to high BP levelsmay lead to an increase in inflammation in the short termby increased expression of adhesion molecules, endothe-lial dysfunction and NO-related mechanisms.32 It is knownthat ICAM-1 and interleukin-6 increase with increasing BP.33
In our study also, patients with higher NLR were found tohave higher ambulatory BP measurements, particularly forDBP. Like mean BP values, the relationship of BP load withhigher NLR values suggests that the inflammation observedin these patients is associated with short-term barotrauma.A higher BP load means that target organs are exposed tohigher pressure for a longer duration, even if mean BP isnormal. Additionally, patients with increased BP load aresubject to overloading of the cardiovascular system, withconsequent negative impact on related structures. Higher BPload may promote an inflammatory response to HTN. Recentstudies reporting an association between BP load and target
The relationship between 24-hour ambulatory BP load and NLR 103
Table 4 Univariate and multivariate linear regression models for 24-hour systolic blood pressure load.
Variables Univariate Multivariate
� 95% CI p � 95% CI p
Female -0.113 -10.6-0.01 0.05 -0.04 -8.257-4.523 0.566
Age 0.142 0.047-0.410 0.014 0.063 -0.088-0.292 0.293
BMI 0.102 -0.179-3.431 0.077 0.097 -0.188-3.266 0.08
Fasting blood glucose 0.193 0.052-0.194 0.001 0.153 0.024-0.170 0.009
Hemoglobin 0.096 -0.274-3.357 0.096 0.121 -0.199-4.077 0.075
LVEF -0.104 -1.713-0.078 0.073 -0.081 -1.517-0.238 0.153
LVMI 0.241 0.156-0.423 <0.001 0.151 0.04-0.325 0.012
Log NLR 0.157 6.643-40.293 0.006 0.174 9.818-42.135 0.002
BMI: body mass index; CI: confidence interval; LVEF: left ventricular ejection fraction; LVMI: left ventricular mass index; NLR: neutrophil-to-lymphocyte ratio. Bold values indicate statistical significance.
Table 5 Univariate and multivariate linear regression models for 24-hour diastolic blood pressure load.
Variables Univariate Multivariate
� 95% CI p � 95% CI p
Age -0.186 -0.539-0.134 0.001 -0.178 -0.525-0.118 0.002
Creatinine 0.099 -0.074-1.093 0.087 0.077 -0.176-0.964 0.174
HDL cholesterol -0.099 -0.545-0.038 0.088 -0.043 -0.402-0.179 0.451
Log NLR 0.181 11.448-49.088 0.002 0.177 11.09-48.214 0.002
CI: confidence interval; HDL: high-density lipoprotein; NLR: neutrophil-to-lymphocyte ratio. Bold values indicate statistical significance.
organ damage have shown that this relationship is not inde-pendent of 24-hour BP levels.34 On the contrary, Wang et al.have shown that BP load is an independent predictor of tar-get organ damage in patients with chronic renal disease.23
Higher BP load (‘baric impact’) may cause endothelial dys-function associated with vasopressor effects and thus mayincrease inflammation.35
As a probable predictor of BP severity, NLR has beenthe subject of antihypertensive therapy studies. Antihy-pertensive drugs may lead to a decrease in NLR, by bothBP-lowering and anti-inflammatory effects.36,37 In previousstudies non-dipping status and increased BP variability wereassociated with higher NLR.38,39 In our study, the lack ofdifference in BP variability and non-dipper status betweengroups made the relationship between NLR and BP/BP loadclearer. Furthermore, increased pulse pressure is considereda significant marker of chronic inflammation and arterialstiffness.40 In a smaller cohort including normotensives NLRwas reportedly correlated with 24-hour SBP and night-timeSBP.41 In the same study, pulse pressure was also correlatedpositively with NLR. In our study, mean pulse pressure did notdiffer between quartiles and therefore did not contributesignificantly to the results. Interestingly, Gang and Yanyanshowed that NLR was increased in patients suffering fromHTN with hyperhomocysteinemia and was positively corre-lated with homocysteine levels but not with BP.42 In theirstudy, they also found no difference in NLR values betweenhypertensive and normotensive groups. A single office BPmeasurement and lack of data on antihypertensive medica-tion could be responsible for their results.
In the present study, we found a weak correlationbetween ABPM data and log NLR values. There are several
possible reasons for this: 24-hour ABPM provides short-termdata and has limited reproducibility, which makes it difficultto clarify the severity of HTN. In addition, the selection of arelatively low-risk cohort of hypertensive patients may havemeant they had only a low-grade inflammatory response,which might have weakened the correlation between NLRand severity of HTN. Nevertheless, despite other confound-ing factors such as the unknown chronicity of HTN andunderlying subclinical end-organ damage, the available datasuggest that higher NLR is associated with higher BP andBP load. Thus, our study may function as a hypothesis-generating study and lead to further research.
Our study has some limitations. Firstly, its cross-sectionaldesign precludes drawing conclusions about causal relation-ships between NLR values and short-term ABPM results.Since ABPM was performed only once in each patient, thereproducibility of ambulatory BP measurements is anotherlimitation. We think that the use of BP load as an outcomeis also a limitation because its importance in cardiovascu-lar risk stratification is debatable. In addition, it would havebeen better to have evaluated leukocyte activation markers,pro-inflammatory cytokines and oxidative stress markers.Exclusion of patients with severe complications of HTN fromthe present study prevents us from generalizing our resultsto the whole hypertensive patient population.
Conclusions
We showed for the first time a significant correlationbetween high BP load and NLR. Further large-scale studies
104 T. Cimen et al.
are needed to assess whether NLR can be used to predictHTN severity and to guide therapy in patients with HTN.
Ethical disclosures
Protection of human and animal subjects. The authorsdeclare that no experiments were performed on humans oranimals for this study.
Confidentiality of data. The authors declare that they havefollowed the protocols of their work center on the publica-tion of patient data.
Right to privacy and informed consent. The authorsdeclare that no patient data appear in this article.
Conflicts of interest
The authors have no conflicts of interest to declare.
References
1. Sliwa K, Stewart S, Gersh BJ. Hypertension: a global perspec-tive. Circulation. 2011;123:2892---6.
2. Kannel WB. Blood pressure as a cardiovascular risk factor: pre-vention and treatment. JAMA. 1996;275:1571---6.
3. Brasier AR, Recinos A 3rd, Eledrisi MS. Vascular inflammationand the renin-angiotensin system. Arterioscler Thromb VascBiol. 2002;22:1257---66.
4. Savoia C, Schiffrin EL. Inflammation in hypertension. Curr OpinNephrol Hypertens. 2006;15:152---8.
5. Tousoulis D, Kampoli AM, Papageorgiou N, et al. Pathophysiologyof atherosclerosis: the role of inflammation. Curr Pharm Des.2011;17:4089---110.
6. Golia E, Limongelli G, Natale F, et al. Inflammation and cardio-vascular disease: from pathogenesis to therapeutic target. CurrAtheroscler Rep. 2014;16:435.
7. Cottone S, Mule G, Nardi E, et al. Relation of C-reactive pro-tein to oxidative stress and to endothelial activation in essentialhypertension. Am J Hypertens. 2006;19:313---8.
8. de La Sierra A, Larrousse M, Oliveras A, et al. Abnormalitiesof vascular function in resistant hypertension. Blood Press.2012;21:104---9.
9. Imtiaz F, Shafique K, Mirza SS, et al. Neutrophil lymphocyteratio as a measure of systemic inflammation in prevalent chronicdiseases in Asian population. Int Arch Med. 2012;5:2.
10. Akyel A, Yayla C, Erat M, et al. Neutrophil-to-lymphocyte ratiopredicts hemodynamic significance of coronary artery stenosis.Anatol J Cardiol. 2015;15:1002---7.
11. Verdoia M, Barbieri L, Di Giovine G, et al. Neutrophil to lym-phocyte ratio and the extent of coronary artery disease: resultsfrom a large cohort study. Angiology. 2016;67:75---82.
12. Ying HQ, Deng QW, He BS, et al. The prognostic value of preop-erative NLR, d-NLR, PLR and LMR for predicting clinical outcomein surgical colorectal cancer patients. Med Oncol. 2014;31:305.
13. Benites-Zapata VA, Hernandez AV, Nagarajan V, et al. Use-fulness of neutrophil-to-lymphocyte ratio in risk stratificationof patients with advanced heart failure. Am J Cardiol.2015;115:57---61.
14. Koklu E, Yuksel IO, Arslan S, et al. Is elevated neutrophil-to-lymphocyte ratio a predictor of stroke in patients withintermediate carotid artery stenosis? J Stroke Cerebrovasc Dis.2015.
15. Amrock SM, Weitzman M. Multiple biomarkers for mortality pre-diction in peripheral arterial disease. Vasc Med. 2016.
16. Liu X, Zhang Q, Wu H, et al. Blood neutrophil to lympho-cyte ratio as a predictor of hypertension. Am J Hypertens.2015;28:1339---46.
17. Belen E, Sungur A, Sungur MA, et al. Increased neutrophil tolymphocyte ratio in patients with resistant hypertension. J ClinHypertens (Greenwich). 2015;17:532---7.
18. Demir M. The relationship between neutrophil lymphocyteratio and non-dipper hypertension. Clin Exp Hypertens.2013;35:570---3.
19. ESH/ESC Task Force for the Management of Arterial Hyperten-sion. 2013 Practice guidelines for the management of arterialhypertension of the European Society of Hypertension (ESH)and the European Society of Cardiology (ESC). J Hypertens.2013;31:1925---38.
20. Bliziotis IA, Destounis A, Stergiou GS. Home versus ambulatoryand office blood pressure in predicting target organ damage inhypertension: a systematic review and meta-analysis. J Hyper-tens. 2012;30:1289---99.
21. Zachariah PK, Sheps SG, Bailey KR, et al. Reproducibil-ity of ambulatory blood pressure load. J Hum Hypertens.1990;4:625---31.
22. White WB. Blood pressure load and target organ effectsin patients with essential hypertension. J Hypertens Suppl.1991;9:S39---41.
23. Wang C, Zhang J, Deng W, et al. Nighttime systolicblood-pressure load is correlated with target-organ dam-age independent of ambulatory blood-pressure level inpatients with non-diabetic chronic kidney disease. PLOS ONE.2015;10:e0131546.
24. Lang RM, Badano LP, Mor-Avi V, et al. Recommendations forcardiac chamber quantification by echocardiography in adults:an update from the American Society of Echocardiography andthe European Association of Cardiovascular Imaging. J Am SocEchocardiogr. 2015;28, 1---39.e14.
25. Bilo G, Giglio A, Styczkiewicz K, et al. A new method forassessing 24-h blood pressure variability after excluding thecontribution of nocturnal blood pressure fall. J Hypertens.2007;25:2058---66.
26. Wang X, Zhang G, Jiang X, et al. Neutrophil to lymphocyteratio in relation to risk of all-cause mortality and cardiovascu-lar events among patients undergoing angiography or cardiacrevascularization: a meta-analysis of observational studies.Atherosclerosis. 2014;234:206---13.
27. Acar G, Fidan S, Uslu ZA, et al. Relationship of neutrophil-lymphocyte ratio with the presence, severity, and extentof coronary atherosclerosis detected by coronary com-puted tomography angiography. Angiology. 2015;66:174---9.
28. Sen BB, Rifaioglu EN, Ekiz O, et al. Neutrophil to lymphocyteratio as a measure of systemic inflammation in psoriasis. CutanOcul Toxicol. 2014;33:223---7.
29. Liu J, Yang F, Yang XP, et al. NAD(P)H oxidase medi-ates angiotensin II-induced vascular macrophage infiltrationand medial hypertrophy. Arterioscler Thromb Vasc Biol.2003;23:776---82.
30. Derhaschnig U, Testori C, Riedmueller E, et al. Hypertensiveemergencies are associated with elevated markers of inflam-mation, coagulation, platelet activation and fibrinolysis. J HumHypertens. 2013;27:368---73.
31. Thiele S, Britz S, Landsiedel L, et al. Short-term changes inhsCRP and NT-proBNP levels in hypertensive emergencies. HormMetab Res. 2008;40:561---5.
32. Walpola PL, Gotlieb AI, Cybulsky MI, et al. Expression ofICAM-1 and VCAM-1 and monocyte adherence in arteriesexposed to altered shear stress. Arterioscler Thromb Vasc Biol.1995;15:2---10.
The relationship between 24-hour ambulatory BP load and NLR 105
33. Chae CU, Lee RT, Rifai N, et al. Blood pressure and inflammationin apparently healthy men. Hypertension. 2001;38:399---403.
34. Liu M, Li Y, Wei FF, et al. Is blood pressure load associated, inde-pendently of blood pressure level, with target organ damage?J Hypertens. 2013;31:1812---8.
35. Cugini P, Baldoni F, De Rosa R, et al. Higher blood pressureload (baric impact) in normotensives with endothelial dysfunc-tion: a paraphysiological status of ‘‘pre-hypertension’’. Clin Ter.2002;153:309---15.
36. Karaman M, Balta S, Seyit Ahmet AY, et al. The comparativeeffects of valsartan and amlodipine on vWf levels and N/L ratioin patients with newly diagnosed hypertension. Clin Exp Hyper-tens. 2013;35:516---22.
37. Fici F, Celik T, Balta S, et al. Comparative effects ofnebivolol and metoprolol on red cell distribution widthand neutrophil/lymphocyte ratio in patients with newlydiagnosed essential hypertension. J Cardiovasc Pharmacol.2013;62:388---93.
38. Sunbul M, Gerin F, Durmus E, et al. Neutrophil to lymphocyteand platelet to lymphocyte ratio in patients with dipper versusnon-dipper hypertension. Clin Exp Hypertens. 2014;36:217---21.
39. Kilicaslan B, Dursun H, Kaymak S, et al. The relationshipbetween neutrophil to lymphocyte ratio and blood pressurevariability in hypertensive and normotensive subjects. TurkKardiyol Dern Ars. 2015;43:18---24.
40. Angeli F, Angeli E, Ambrosio G, et al. Neutrophil count andambulatory pulse pressure as predictors of cardiovascularadverse events in postmenopausal women with hypertension.Am J Hypertens. 2011;24:591---8.
41. Pusuroglu H, Akgul O, Erturk M, et al. A comparative analy-sis of leukocyte and leukocyte subtype counts among isolatedsystolic hypertensive, systo-diastolic hypertensive, and non-hypertensive patients. Kardiol Pol. 2014;72:748---54.
42. Gang L, Yanyan Z. Increased neutrophil to lymphocyte ratio inpersons suffering from hypertension with hyperhomocysteine-mia. Hypertens Res. 2016.