the recommendation for expressing uncertainties of
TRANSCRIPT
Page 1 of 13
The recommendation for expressing uncertainties of quantitative measurement results in the medical laboratories
Version 2, date of issue: 10.3.2021
Table of Contents 1. Introduction ........................................................................................................................................ 1 2. Abbreviations ...................................................................................................................................... 2 3. The concept of uncertainty ................................................................................................................. 2 4. Application of measurement result uncertainty in its interpretation ................................................ 4 5. Uncertainty of the calculation result .................................................................................................. 4 6. Frequency of the uncertainty determination ...................................................................................... 5 7. Rounding and number of significant digits ........................................................................................ 5 8. The problem of zero uncertainty ........................................................................................................ 5 9. How many uncertainties to find out for one laboratory examination ............................................... 6 10. What sources of uncertainty (partial uncertainties) to include in the calculation ............................ 6
10.1. Procedure for determining the partial uncertainty uRw, rel ............................................................. 7 10.2. Procedure for determining the partial uncertainty ucal, rel.............................................................. 8
11. Calculation of the combined uncertainty ........................................................................................... 9 12. What uncertainty to choose and how to present it ............................................................................. 9 13. Minimum and maximum permissible measurement uncertainty .................................................... 10
13.1. Minimum permissible uncertainties ......................................................................................... 10 13.2. Maximum permissible uncertainties ......................................................................................... 10
14. Bias .................................................................................................................................................... 11 15. References ......................................................................................................................................... 12
1. Introduction This text aims to provide medical laboratory staff with practical, simple, and clear instructions to the calculation of uncertainty of quantitative measurement results in the most concise form possible. It does not
intend to be, and cannot be, an exhaustive treatise about uncertainty of results (comprehensive explanations
are available, e.g., in [1, 2, 10]), but is focused on the routine laboratory testing and practical needs given in particular by the requirements of ISO 15189 [5].
This text differs from the first version of the 2014 guideline mainly by the application of the document [2]
and the subsequent substantial simplification.
The basic concept of uncertainties is very simple and elegant. Unfortunately, the mathematical apparatus needed to fully master the issue is not trivial (see e.g. [1] for a detailed explanation), and therefore we have
adopted in this recommendation the following simplifications, in accordance with [2]: the measured values
obtained from repeated measurements have a normal (Gaussian) distribution and the partial uncertainties are uncorrelated.
A significant change we come up in this version of the recommendation is that we no longer include
bias in the uncertainty, i.e. we assume that bias is not significant. There are 2 main reasons for this: 1. Not only is bias not accounted for in the GUM [1], but bias is not included in uncertainty in the new
ISO/TS 20914 document [2] - this document does talk about bias in section 6.6, but it assumes that
significant bias will be corrected for, and only includes the uncertainty of the correction made in
uncertainty (which is further complicated by the fact that the correction can be additive or multiplicative). The paper [2] does not allow for the alternative that if the measurement results are
loaded with significant bias, the total uncertainty would be increased by including the bias in some
way, instead of correcting the measured value for this known significant bias. 2. The second reason is purely pragmatic. It is unusual for a laboratory, after having properly calibrated
its analytical measurement system using the calibrator and procedure prescribed by the
manufacturer, to invest additional money, time, and effort in purchasing a commutable CRM or
SRM reference material and using it to determine whether its measurement results are compromised by significant bias (in some cases, bias can be detected by measuring EQA samples, but such cases
are a fraction compared to the total spectrum of routinely performed laboratory tests). And if
significant bias is detected, a subsequent correction is made to the measurement results issued. Since such a procedure is not common in routine clinical laboratories, we consider it unnecessary to
burden this recommendation with rather complicated considerations concerning (un)corrected bias.
Page 2 of 13
The fact that in this recommendation we do not include the 'bias component' in the overall uncertainty has
allowed us to simplify the recommendation considerably. We believe that this simplification is not at the
expense of the explanatory power of the resulting estimates of measurement uncertainty.
Regarding bias, we strongly encourage all readers to get familiar with Chapter 14.
2. Abbreviations The symbols and abbreviations used in the equations are always explained directly next them.
CRM Certified reference material
CV Coefficient of variation
Dmax Acceptable difference (criterion used to assess the results in EQA)
EQA External quality assessment
k Coverage factor
POCT Point of care testing
Laboratory testing performed at the patient's bedside or at first contact with the patient
RCV Reference change value
SD Standard deviation
SRM Standard reference material
IQC Internal quality control
u urel
Standard uncertainty Standard uncertainty expressed as a relative value (i.e. in %)
U
Urel
Expanded uncertainty
Expanded uncertainty expressed as a relative value (i.e. in %)
In this text we consistently denote the relative uncertainties (expressed in %) by the subscript rel (e.g.
ucal,rel), while absolute uncertainties (expressed in the unit of measurement of the relevant laboratory test)
are without this subscript (e.g. ucal).
3. The concept of uncertainty The definition of uncertainty (according to [6, 7]) reads: “Non-negative parameter characterizing the
dispersion of the quantity values being attributed to a measurand, based on the information used.”
Uncertainty is a parameter associated with each measurement result and expresses the limits (theoretical and practical) of the measurement process. There is no absolutely accurate measurement result (i.e. a result
with zero uncertainty) does not exist. Uncertainty can be reduced with increasing investment (time,
money), but it can never be completely eliminated. It would be a big mistake to assume that the measured
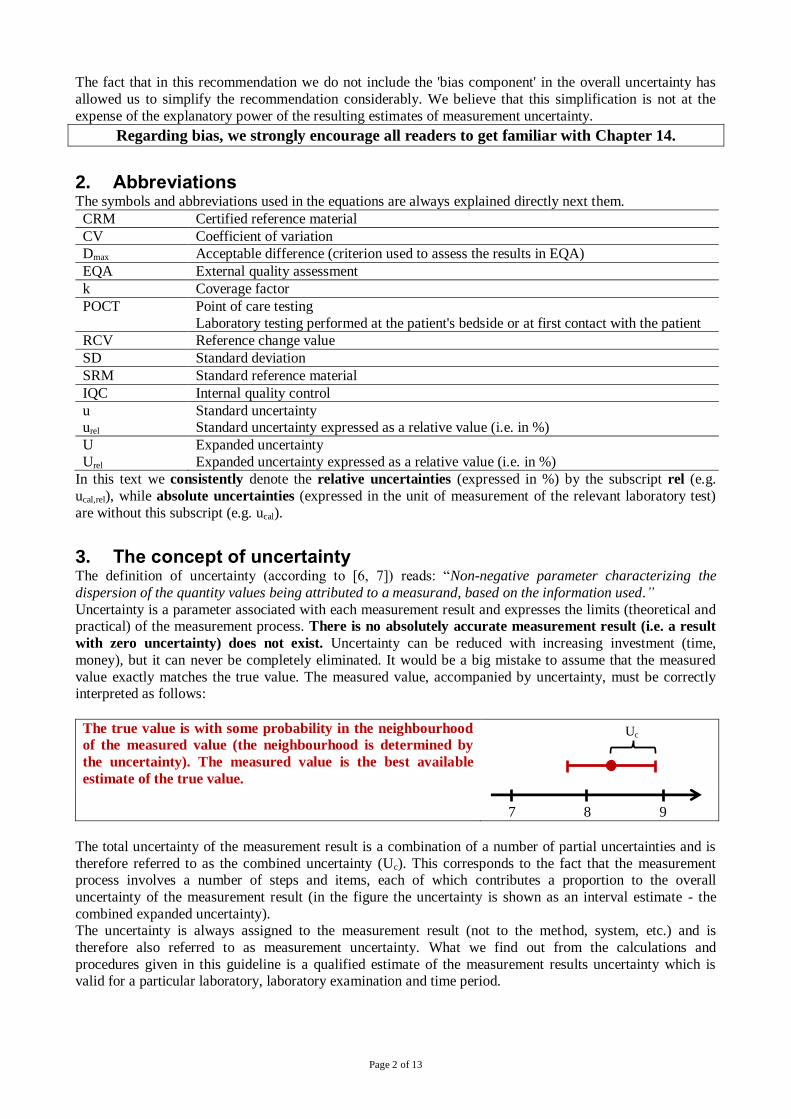
value exactly matches the true value. The measured value, accompanied by uncertainty, must be correctly interpreted as follows:
The true value is with some probability in the neighbourhood
of the measured value (the neighbourhood is determined by
the uncertainty). The measured value is the best available
estimate of the true value.
Uc
7 8 9
The total uncertainty of the measurement result is a combination of a number of partial uncertainties and is
therefore referred to as the combined uncertainty (Uc). This corresponds to the fact that the measurement process involves a number of steps and items, each of which contributes a proportion to the overall
uncertainty of the measurement result (in the figure the uncertainty is shown as an interval estimate - the
combined expanded uncertainty). The uncertainty is always assigned to the measurement result (not to the method, system, etc.) and is
therefore also referred to as measurement uncertainty. What we find out from the calculations and
procedures given in this guideline is a qualified estimate of the measurement results uncertainty which is valid for a particular laboratory, laboratory examination and time period.
Page 3 of 13
The uncertainty can be expressed as absolute (in a unit of measurement) or relative (in %).
The conversion of absolute uncertainty to relative is done according to the following equation:
𝑢𝑟𝑒𝑙 = 100 ⋅𝑢
𝑥 [%] (1)
The conversion of relative uncertainty to absolute uncertainty is carried out according to the equation:
𝑢 = 𝑥 ⋅𝑢𝑟𝑒𝑙
100 (2)
where: urel ... relative uncertainty (expressed in %)
u ... absolute uncertainty (expressed in the unit of measurement) x ... the measured value
According to equations (1) and (2) we can convert any type of uncertainty (standard, combined, expanded -
see example 1 below).
The basic hierarchy of uncertainties, which corresponds to the procedure for their identification, is as
follows: The standard uncertainty (denoted by u) is the component of uncertainty that a certain part of the
measurement process contributes to the combined uncertainty of the measurement result and is expressed
in the form of a standard deviation (i.e. u = SD).
The relative standard uncertainty (referred to as urel) is the standard uncertainty expressed in % according to equation (1) and corresponds to the coefficient of variation (i.e. urel = CV).
The relative combined uncertainty (denoted by uc,rel) is calculated from the partial uncertainties using a
formula that describes the propagation of the uncertainties and, in the simplest case where the resulting (output) measurand is calculated according to a multiplicative mathematical relationship from several
initial (input) measurands, reduces to the equation:
𝑢𝑐,𝑟𝑒𝑙 = √𝑢1,𝑟𝑒𝑙2 + 𝑢2,𝑟𝑒𝑙
2 + … + 𝑢𝑛,𝑟𝑒𝑙2 [%] (3)
where: uc,rel ... relative combined uncertainty u1,rel to un,rel … partial relative standard uncertainties
The relative combined expanded uncertainty (denoted by Uc,rel) is calculated according to the equation:
Uc,rel = k · uc,rel [%] (4)
where: Uc,rel ... relative combined expanded uncertainty
k … coverage factor - we recommend to use k = 2, which corresponds to a coverage interval of 95 %
uc,rel ... relative combined uncertainty
Relative combined expanded uncertainty is the final result that the laboratory should reach (calculate) based
on this guide. This is information that should be available to all recipients of the measurement results (clinicians) on the request. It should always be stated which value of the coverage factor was used to
calculate the expanded uncertainty.
The manufacturer provides the following data for the glucose calibrator: content value: 2.61 mmol/L
expanded uncertainty: 0.05 mmol/L
coverage factor: 2
Based on the terminology introduced in this guide, we have these data: xcal = 2.61 and Ucal = 0.05 (all in mmol/L).
According to equation (1), we can easily obtain the relative expanded uncertainty: Ucal,rel = 1.9 %.
For further calculations according to this recommendation (see Chapter 10.2 for details) we will need the (non-expanded) relative standard uncertainty, which we obtain by dividing the relative expanded
uncertainty U by the coverage factor k (based on equation (4)) and obtaining: ucal,rel = 0.96 %
Ex
am
ple
1
True value The true value can be expressed using the measured value and its uncertainty with the following equation
(a verbal description is given at the beginning of this chapter):
X = x ± Uc (5) where: X ... the true value
x ... the measured value
Uc ... combined expanded uncertainty (k = 2) Equation (5) means that the true value X lies with 95% probability within the interval:
<x - Uc; x + Uc >, which can also be written as: x - Uc < X < x + Uc
Page 4 of 13
The result of C-reactive protein (CRP) measurement in blood serum including its uncertainty can be
recorded in several ways,:
30.0 mg/L (Uc,rel = 10%) or 30.0 mg/L (Uc = 3.0 mg/L)
or 30.0 ± 3.0 mg/L
Regardless of the method of notation, the information (k = 2) should be available and the meaning of
the message is as follows: The laboratory that performed the measurement states that the true CRP concentration in the sample is within the range of 27 to 33 mg/L with a 95% probability and the
measured value (30 mg/L) is the best estimate of the true value that the laboratory can provide.
Ex
am
ple
2
In this context, we would like to emphasise the inappropriateness of using a % as a measurement unit (mainly because % is not an SI unit and also because it is very confusing when SD, CV and both absolute
and relative uncertainties are in %). However, in practice % is still commonly used as a unit (tradition) and unfortunately this leads to the fact that it is not possible to distinguish between absolute and relative
measures by simply looking at the unit. In these cases, the type of uncertainty must be clearly distinguished
(e.g. by writing uabs and urel).
It is not recommended to include the uncertainties of measurement results in routine laboratory
reports, but they should be available on request ([2], Chapter 1 and 5.6).
4. Application of measurement result uncertainty in its interpretation It is common that the measurement results are compared with something, e.g. with the result of the same test from the previous day, with a reference interval, with a cut-off, etc. When interpreting a measurement result
by comparing it to a cut-off value, it must be taken into account that the uncertainty is part of the result.
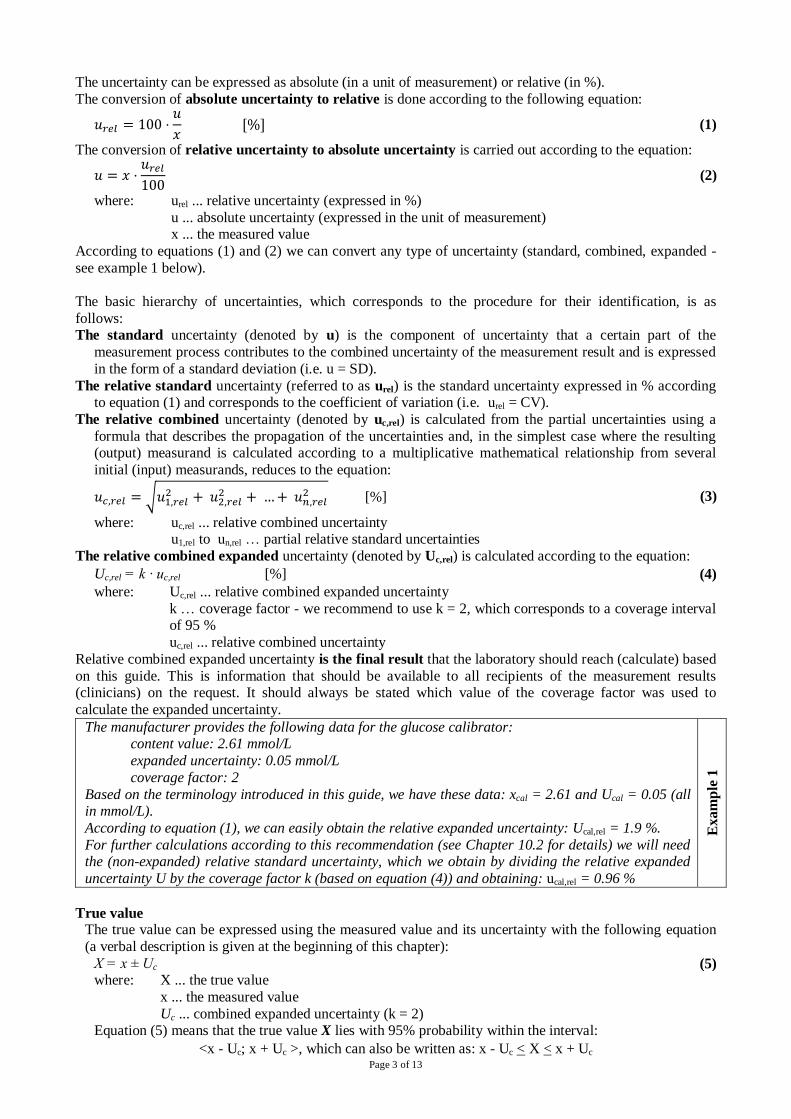
The following figure shows that the interpretation of a result depends not only on the measured value but also on its uncertainty. The limit is indicated by the vertical blue line and from the 6 results shown, ordered
from smallest to biggest, only one is negative (#2) and one is positive (#5). The others (grey) are
inconclusive (in the context of the uncertainty approach, the term borderline result is inappropriate - these
results may not lie "on the borderline" at all).
Result
#
Interpretation of
the result
Limit (e.g. cut-off)
area of negativity area of positivity
1 inconclusive
2 negative 3 inconclusive
4 inconclusive
5 positive 6 inconclusive
0,02 0,04 0,06
It is obvious that if we ignore the existence of uncertainties, results 1 to 3 would be interpreted as negative and 4 to 6 as positive. A more detailed explanation is available in [4, 12].
5. Uncertainty of the calculation result In many cases (laboratory test results determined by recalculation, ratio results, etc.) the measurement results are further processed, e.g. multiplied by a constant, divided by each other, etc. It is therefore appropriate to
ask how the uncertainty of the measurement result is reflected in the result of such an arithmetic calculation.
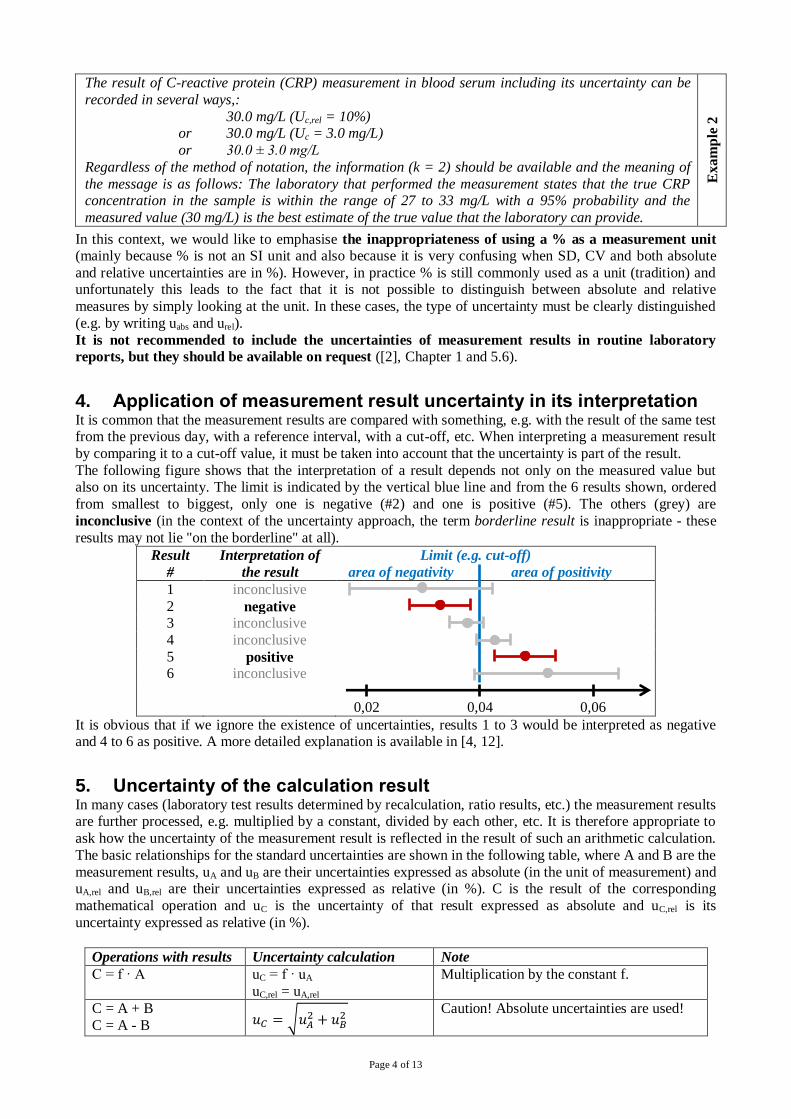
The basic relationships for the standard uncertainties are shown in the following table, where A and B are the
measurement results, uA and uB are their uncertainties expressed as absolute (in the unit of measurement) and uA,rel and uB,rel are their uncertainties expressed as relative (in %). C is the result of the corresponding
mathematical operation and uC is the uncertainty of that result expressed as absolute and uC,rel is its
uncertainty expressed as relative (in %).
Operations with results Uncertainty calculation Note
C = f · A uC = f · uA
uC,rel = uA,rel
Multiplication by the constant f.
C = A + B
C = A - B 𝑢𝐶 = √𝑢𝐴2 + 𝑢𝐵
2 Caution! Absolute uncertainties are used!
Page 5 of 13
Operations with results Uncertainty calculation Note
C = A · B
C = A/B 𝑢𝐶,𝑟𝑒𝑙 = √𝑢𝐴,𝑟𝑒𝑙
2 + 𝑢𝐵,𝑟𝑒𝑙2
Caution! Relative uncertainties are used!
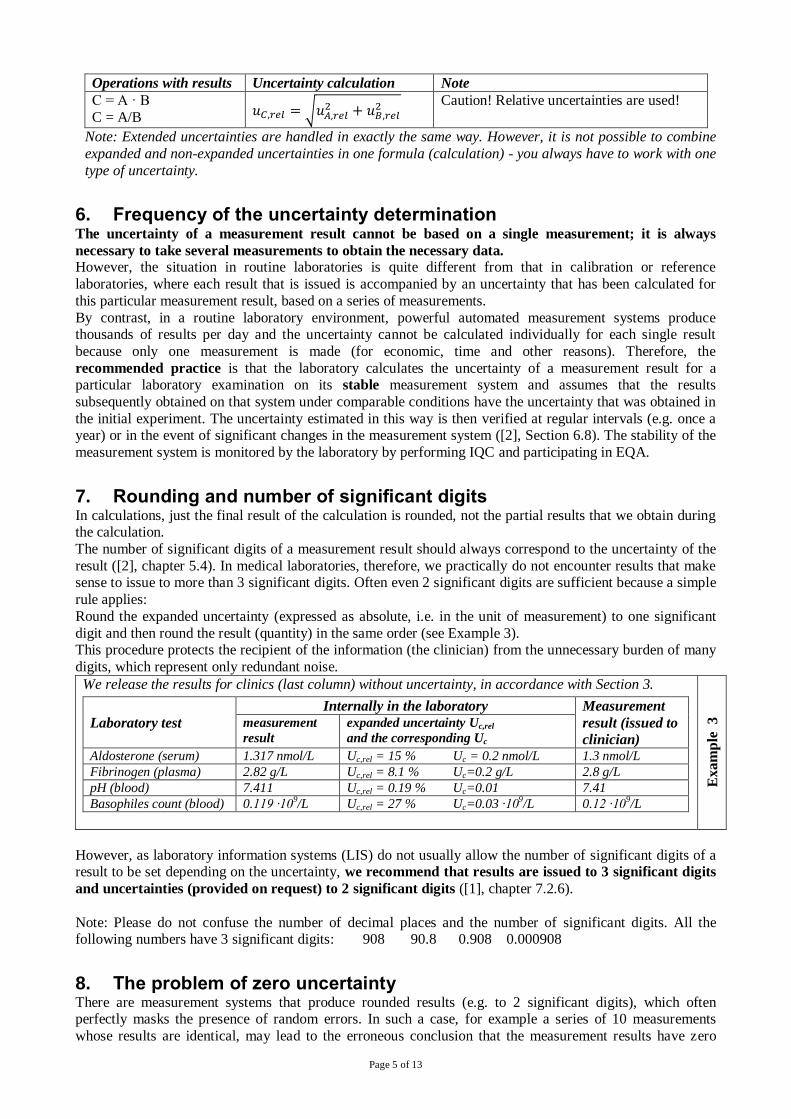
Note: Extended uncertainties are handled in exactly the same way. However, it is not possible to combine
expanded and non-expanded uncertainties in one formula (calculation) - you always have to work with one
type of uncertainty.
6. Frequency of the uncertainty determination The uncertainty of a measurement result cannot be based on a single measurement; it is always
necessary to take several measurements to obtain the necessary data. However, the situation in routine laboratories is quite different from that in calibration or reference
laboratories, where each result that is issued is accompanied by an uncertainty that has been calculated for
this particular measurement result, based on a series of measurements.
By contrast, in a routine laboratory environment, powerful automated measurement systems produce thousands of results per day and the uncertainty cannot be calculated individually for each single result
because only one measurement is made (for economic, time and other reasons). Therefore, the
recommended practice is that the laboratory calculates the uncertainty of a measurement result for a particular laboratory examination on its stable measurement system and assumes that the results
subsequently obtained on that system under comparable conditions have the uncertainty that was obtained in
the initial experiment. The uncertainty estimated in this way is then verified at regular intervals (e.g. once a year) or in the event of significant changes in the measurement system ([2], Section 6.8). The stability of the
measurement system is monitored by the laboratory by performing IQC and participating in EQA.
7. Rounding and number of significant digits In calculations, just the final result of the calculation is rounded, not the partial results that we obtain during the calculation.
The number of significant digits of a measurement result should always correspond to the uncertainty of the
result ([2], chapter 5.4). In medical laboratories, therefore, we practically do not encounter results that make sense to issue to more than 3 significant digits. Often even 2 significant digits are sufficient because a simple
rule applies:
Round the expanded uncertainty (expressed as absolute, i.e. in the unit of measurement) to one significant
digit and then round the result (quantity) in the same order (see Example 3). This procedure protects the recipient of the information (the clinician) from the unnecessary burden of many
digits, which represent only redundant noise.
We release the results for clinics (last column) without uncertainty, in accordance with Section 3.
Laboratory test
Internally in the laboratory Measurement
result (issued to
clinician)
measurement
result
expanded uncertainty Uc,rel
and the corresponding Uc
Aldosterone (serum) 1.317 nmol/L Uc,rel = 15 % Uc = 0.2 nmol/L 1.3 nmol/L
Fibrinogen (plasma) 2.82 g/L Uc,rel = 8.1 % Uc=0.2 g/L 2.8 g/L
pH (blood) 7.411 Uc,rel = 0.19 % Uc=0.01 7.41
Basophiles count (blood) 0.119 ·109/L Uc,rel = 27 % Uc=0.03 ·109/L 0.12 ·109/L
Exam
ple
3
However, as laboratory information systems (LIS) do not usually allow the number of significant digits of a result to be set depending on the uncertainty, we recommend that results are issued to 3 significant digits
and uncertainties (provided on request) to 2 significant digits ([1], chapter 7.2.6).
Note: Please do not confuse the number of decimal places and the number of significant digits. All the following numbers have 3 significant digits: 908 90.8 0.908 0.000908
8. The problem of zero uncertainty There are measurement systems that produce rounded results (e.g. to 2 significant digits), which often perfectly masks the presence of random errors. In such a case, for example a series of 10 measurements
whose results are identical, may lead to the erroneous conclusion that the measurement results have zero
Page 6 of 13
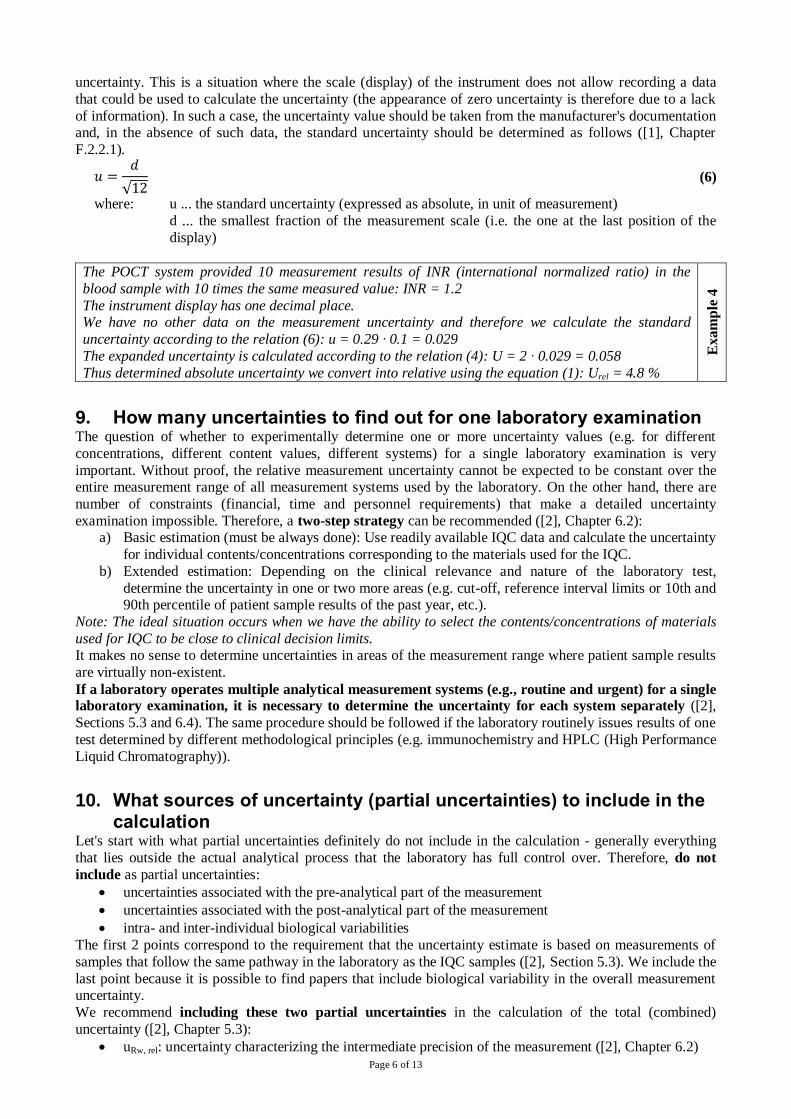
uncertainty. This is a situation where the scale (display) of the instrument does not allow recording a data
that could be used to calculate the uncertainty (the appearance of zero uncertainty is therefore due to a lack
of information). In such a case, the uncertainty value should be taken from the manufacturer's documentation and, in the absence of such data, the standard uncertainty should be determined as follows ([1], Chapter
F.2.2.1).
𝑢 =𝑑
√12 (6)
where: u ... the standard uncertainty (expressed as absolute, in unit of measurement)
d ... the smallest fraction of the measurement scale (i.e. the one at the last position of the
display)
The POCT system provided 10 measurement results of INR (international normalized ratio) in the
blood sample with 10 times the same measured value: INR = 1.2
The instrument display has one decimal place. We have no other data on the measurement uncertainty and therefore we calculate the standard
uncertainty according to the relation (6): u = 0.29 · 0.1 = 0.029
The expanded uncertainty is calculated according to the relation (4): U = 2 · 0.029 = 0.058
Thus determined absolute uncertainty we convert into relative using the equation (1): Urel = 4.8 %
Ex
am
ple
4
9. How many uncertainties to find out for one laboratory examination The question of whether to experimentally determine one or more uncertainty values (e.g. for different
concentrations, different content values, different systems) for a single laboratory examination is very
important. Without proof, the relative measurement uncertainty cannot be expected to be constant over the entire measurement range of all measurement systems used by the laboratory. On the other hand, there are
number of constraints (financial, time and personnel requirements) that make a detailed uncertainty
examination impossible. Therefore, a two-step strategy can be recommended ([2], Chapter 6.2): a) Basic estimation (must be always done): Use readily available IQC data and calculate the uncertainty
for individual contents/concentrations corresponding to the materials used for the IQC.
b) Extended estimation: Depending on the clinical relevance and nature of the laboratory test,
determine the uncertainty in one or two more areas (e.g. cut-off, reference interval limits or 10th and 90th percentile of patient sample results of the past year, etc.).
Note: The ideal situation occurs when we have the ability to select the contents/concentrations of materials
used for IQC to be close to clinical decision limits. It makes no sense to determine uncertainties in areas of the measurement range where patient sample results
are virtually non-existent.
If a laboratory operates multiple analytical measurement systems (e.g., routine and urgent) for a single laboratory examination, it is necessary to determine the uncertainty for each system separately ([2],
Sections 5.3 and 6.4). The same procedure should be followed if the laboratory routinely issues results of one
test determined by different methodological principles (e.g. immunochemistry and HPLC (High Performance
Liquid Chromatography)).
10. What sources of uncertainty (partial uncertainties) to include in the calculation
Let's start with what partial uncertainties definitely do not include in the calculation - generally everything
that lies outside the actual analytical process that the laboratory has full control over. Therefore, do not
include as partial uncertainties:
uncertainties associated with the pre-analytical part of the measurement
uncertainties associated with the post-analytical part of the measurement
intra- and inter-individual biological variabilities
The first 2 points correspond to the requirement that the uncertainty estimate is based on measurements of
samples that follow the same pathway in the laboratory as the IQC samples ([2], Section 5.3). We include the
last point because it is possible to find papers that include biological variability in the overall measurement uncertainty.
We recommend including these two partial uncertainties in the calculation of the total (combined)
uncertainty ([2], Chapter 5.3):
uRw, rel: uncertainty characterizing the intermediate precision of the measurement ([2], Chapter 6.2)
Page 7 of 13
ucal, rel: uncertainty of the calibrator ([2], Chapter 6.5)
We do not include a bias in the uncertainty (see Chapter 1 and Chapter 14).
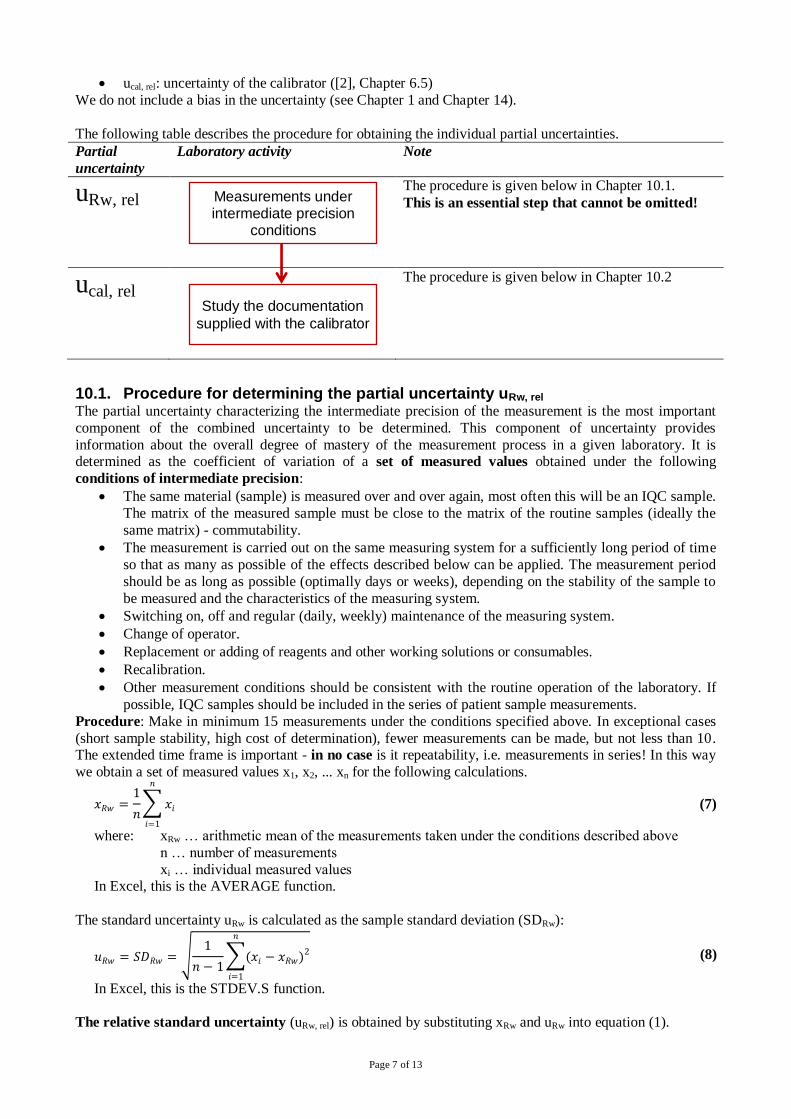
The following table describes the procedure for obtaining the individual partial uncertainties.
Partial
uncertainty
Laboratory activity Note
uRw, rel The procedure is given below in Chapter 10.1.
This is an essential step that cannot be omitted!
ucal, rel The procedure is given below in Chapter 10.2
10.1. Procedure for determining the partial uncertainty uRw, rel The partial uncertainty characterizing the intermediate precision of the measurement is the most important
component of the combined uncertainty to be determined. This component of uncertainty provides
information about the overall degree of mastery of the measurement process in a given laboratory. It is determined as the coefficient of variation of a set of measured values obtained under the following
conditions of intermediate precision:
The same material (sample) is measured over and over again, most often this will be an IQC sample.
The matrix of the measured sample must be close to the matrix of the routine samples (ideally the
same matrix) - commutability.
The measurement is carried out on the same measuring system for a sufficiently long period of time
so that as many as possible of the effects described below can be applied. The measurement period
should be as long as possible (optimally days or weeks), depending on the stability of the sample to
be measured and the characteristics of the measuring system.
Switching on, off and regular (daily, weekly) maintenance of the measuring system.
Change of operator.
Replacement or adding of reagents and other working solutions or consumables.
Recalibration.
Other measurement conditions should be consistent with the routine operation of the laboratory. If
possible, IQC samples should be included in the series of patient sample measurements.
Procedure: Make in minimum 15 measurements under the conditions specified above. In exceptional cases
(short sample stability, high cost of determination), fewer measurements can be made, but not less than 10. The extended time frame is important - in no case is it repeatability, i.e. measurements in series! In this way
we obtain a set of measured values x1, x2, ... xn for the following calculations.
𝑥𝑅𝑤 =1
𝑛∑ 𝑥𝑖
𝑛
𝑖=1
(7)
where: xRw … arithmetic mean of the measurements taken under the conditions described above
n … number of measurements
xi … individual measured values In Excel, this is the AVERAGE function.
The standard uncertainty uRw is calculated as the sample standard deviation (SDRw):
𝑢𝑅𝑤 = 𝑆𝐷𝑅𝑤 = √1
𝑛 − 1∑(𝑥𝑖 − 𝑥𝑅𝑤)2
𝑛
𝑖=1
(8)
In Excel, this is the STDEV.S function.
The relative standard uncertainty (uRw, rel) is obtained by substituting xRw and uRw into equation (1).
Measurements under intermediate precision
conditions
Study the documentation
supplied with the calibrator
Page 8 of 13
Be careful of these items (according to [2], Article A.3.1):
Sets of measurements obtained during the use of different batches of IQC material should be treated
separately, even though the concentration/content values may be similar.
The new batch of reagents should not affect either the results of the patient samples or the IQC
measurements. However, if you have information from the manufacturer that a new batch of reagents will affect the results (or if you find this within the IQC and verify it on patient samples), the
measurement set should be closed and a new series of measurements should be started.
The same rule as for reagents also applies to new batches of calibrators.
If, for the reasons mentioned above, we have multiple sets of measurements (h sets in total), we calculate the uncertainty for each set according to the procedure above to obtaining the uncertainties uRw,rel 1, uRw,rel 2, …
uRw,rel h. Subsequently, a single average uncertainty can be calculated:
𝑢𝑅𝑤,𝑟𝑒𝑙 =√∑ 𝑢𝑅𝑤,𝑟𝑒𝑙 𝑖
2ℎ
𝑖=1
ℎ [%]
(9)
where: uRw,rel i ... relative standard uncertainties of particular set of measured values
h … number of sets of measured values (batches of IQC material)
Next, we work with the value of uRw,rel. It is assumed that the individual measured samples (batches of IQC material) have approximately the same
value of the content of the measured component. The individual sets of measured values should be
approximately equal in frequency (otherwise a weighted average should be used in relation (9)).
Rule: It does not make sense to process measured values over an enormously long period of time, the maximum should be a history of 1 year. The goal is to have a set of measurements that represents a time
period covering the conditions described in the beginning of the chapter and to have a sufficiently large set
(optimally 100 or more) of measurements. Thus, if for a particular laboratory test we collect 100 measurements per month by measuring one batch of IQC sample, this is a sufficient set for the
calculation of uRw,rel and there is no reason to include data from earlier periods/files. If we collect these 100
measurements using 3 batches of IQC materials, we have 3 sets of measurements which we process
according to relation (9).
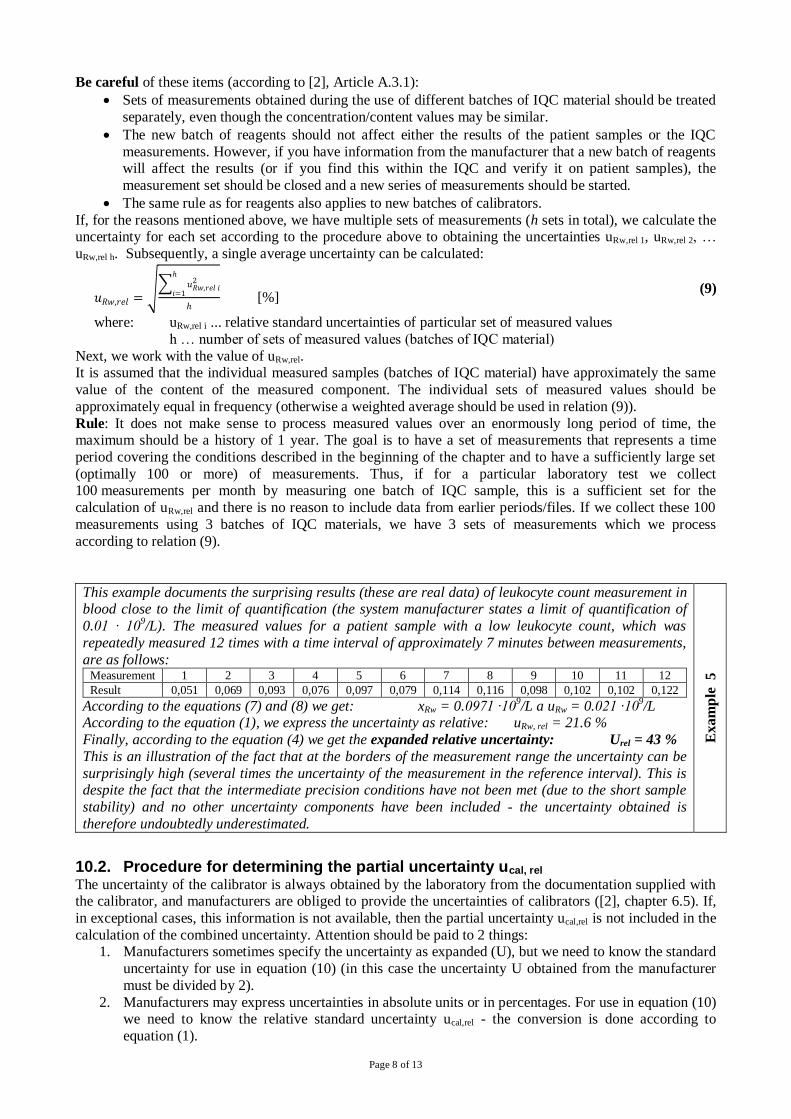
This example documents the surprising results (these are real data) of leukocyte count measurement in blood close to the limit of quantification (the system manufacturer states a limit of quantification of
0.01 · 109/L). The measured values for a patient sample with a low leukocyte count, which was
repeatedly measured 12 times with a time interval of approximately 7 minutes between measurements,
are as follows: Measurement 1 2 3 4 5 6 7 8 9 10 11 12
Result 0,051 0,069 0,093 0,076 0,097 0,079 0,114 0,116 0,098 0,102 0,102 0,122
According to the equations (7) and (8) we get: xRw = 0.0971 ·109/L a uRw = 0.021 ·10
9/L
According to the equation (1), we express the uncertainty as relative: uRw, rel = 21.6 %
Finally, according to the equation (4) we get the expanded relative uncertainty: Urel = 43 %
This is an illustration of the fact that at the borders of the measurement range the uncertainty can be
surprisingly high (several times the uncertainty of the measurement in the reference interval). This is despite the fact that the intermediate precision conditions have not been met (due to the short sample
stability) and no other uncertainty components have been included - the uncertainty obtained is
therefore undoubtedly underestimated.
Exam
ple
5
10.2. Procedure for determining the partial uncertainty ucal, rel The uncertainty of the calibrator is always obtained by the laboratory from the documentation supplied with the calibrator, and manufacturers are obliged to provide the uncertainties of calibrators ([2], chapter 6.5). If,
in exceptional cases, this information is not available, then the partial uncertainty ucal,rel is not included in the
calculation of the combined uncertainty. Attention should be paid to 2 things: 1. Manufacturers sometimes specify the uncertainty as expanded (U), but we need to know the standard
uncertainty for use in equation (10) (in this case the uncertainty U obtained from the manufacturer
must be divided by 2).
2. Manufacturers may express uncertainties in absolute units or in percentages. For use in equation (10) we need to know the relative standard uncertainty ucal,rel - the conversion is done according to
equation (1).
Page 9 of 13
Both of the above steps are shown in Example 1.
The calibrator uncertainty reported by the manufacturer is the combined uncertainty of the calibrator value (it
includes the combined uncertainty of all the measurements in an unbroken chain of traceability, at the end of which is the calibrator value). This uncertainty is no longer reviewed or verified by the laboratory.
If the calibration was performed using several calibrators, we recommend taking a pessimistic approach and
including the worst (i.e. largest) calibrator uncertainty in the uncertainty calculation.
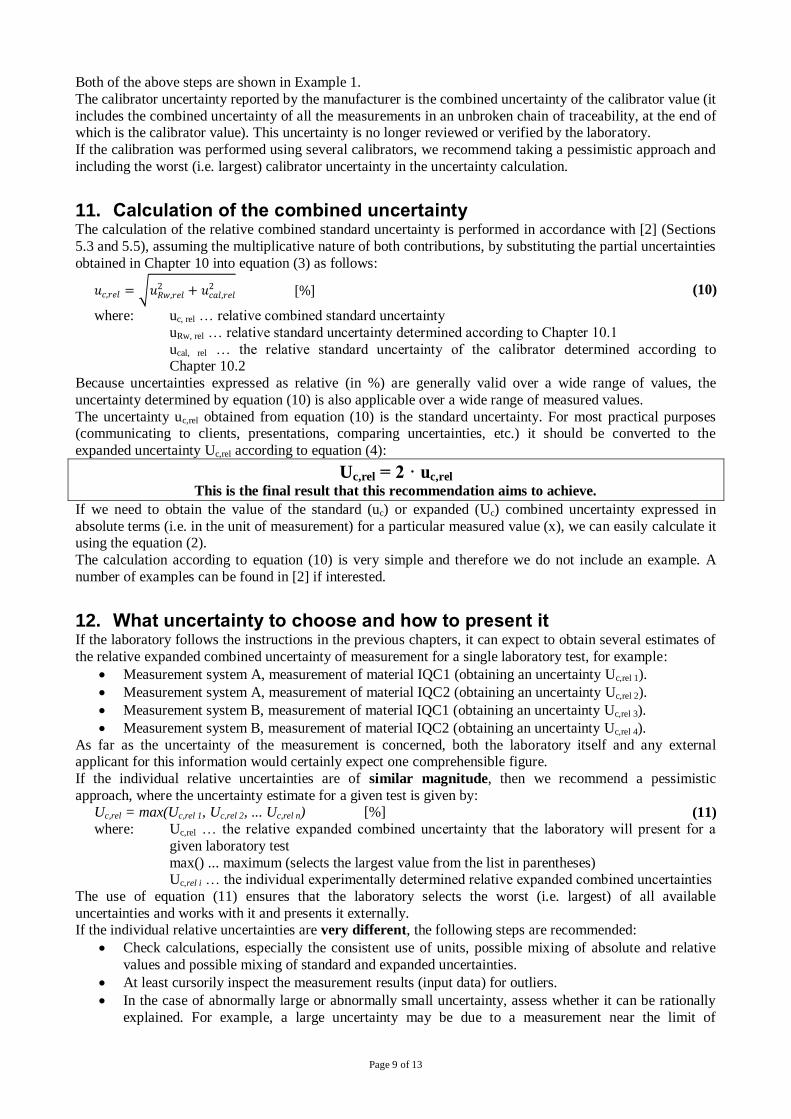
11. Calculation of the combined uncertainty The calculation of the relative combined standard uncertainty is performed in accordance with [2] (Sections
5.3 and 5.5), assuming the multiplicative nature of both contributions, by substituting the partial uncertainties
obtained in Chapter 10 into equation (3) as follows:
𝑢𝑐,𝑟𝑒𝑙 = √𝑢𝑅𝑤,𝑟𝑒𝑙2 + 𝑢𝑐𝑎𝑙,𝑟𝑒𝑙
2 [%] (10)
where: uc, rel … relative combined standard uncertainty
uRw, rel … relative standard uncertainty determined according to Chapter 10.1
ucal, rel … the relative standard uncertainty of the calibrator determined according to Chapter 10.2
Because uncertainties expressed as relative (in %) are generally valid over a wide range of values, the
uncertainty determined by equation (10) is also applicable over a wide range of measured values.
The uncertainty uc,rel obtained from equation (10) is the standard uncertainty. For most practical purposes (communicating to clients, presentations, comparing uncertainties, etc.) it should be converted to the
expanded uncertainty Uc,rel according to equation (4):
Uc,rel = 2 · uc,rel This is the final result that this recommendation aims to achieve.
If we need to obtain the value of the standard (uc) or expanded (Uc) combined uncertainty expressed in
absolute terms (i.e. in the unit of measurement) for a particular measured value (x), we can easily calculate it using the equation (2).
The calculation according to equation (10) is very simple and therefore we do not include an example. A
number of examples can be found in [2] if interested.
12. What uncertainty to choose and how to present it If the laboratory follows the instructions in the previous chapters, it can expect to obtain several estimates of
the relative expanded combined uncertainty of measurement for a single laboratory test, for example:
Measurement system A, measurement of material IQC1 (obtaining an uncertainty Uc,rel 1).
Measurement system A, measurement of material IQC2 (obtaining an uncertainty Uc,rel 2).
Measurement system B, measurement of material IQC1 (obtaining an uncertainty Uc,rel 3).
Measurement system B, measurement of material IQC2 (obtaining an uncertainty Uc,rel 4).
As far as the uncertainty of the measurement is concerned, both the laboratory itself and any external applicant for this information would certainly expect one comprehensible figure.
If the individual relative uncertainties are of similar magnitude, then we recommend a pessimistic
approach, where the uncertainty estimate for a given test is given by: Uc,rel = max(Uc,rel 1, Uc,rel 2, ... Uc,rel n) [%] (11)
where: Uc,rel … the relative expanded combined uncertainty that the laboratory will present for a
given laboratory test
max() ... maximum (selects the largest value from the list in parentheses) Uc,rel i … the individual experimentally determined relative expanded combined uncertainties
The use of equation (11) ensures that the laboratory selects the worst (i.e. largest) of all available
uncertainties and works with it and presents it externally. If the individual relative uncertainties are very different, the following steps are recommended:
Check calculations, especially the consistent use of units, possible mixing of absolute and relative
values and possible mixing of standard and expanded uncertainties.
At least cursorily inspect the measurement results (input data) for outliers.
In the case of abnormally large or abnormally small uncertainty, assess whether it can be rationally
explained. For example, a large uncertainty may be due to a measurement near the limit of
Page 10 of 13
quantification (see Example 5). Unexpectedly small uncertainty (or even zero uncertainty) may be
the result of rounding (see Chapter 8).
If the reason for the 'atypicality' of an uncertainty is found, then the uncertainty should be omitted
from the calculation according to relation (11). However, for atypically large uncertainties, it is always important that clinicians are aware of the fact that results can be very imprecise in certain
areas of the measurement range (see Example 5, where the expanded uncertainty was 43 %, and this
is still an underestimate).
If the survey shows that the measurement uncertainty varies significantly with the
concentration/content of the item being measured, then it is appropriate to split the measurement
range into parts and declare a different measurement uncertainty for each part.
13. Minimum and maximum permissible measurement uncertainty The laboratory should have an idea of what magnitude of the measurement uncertainty of a particular parameter is still acceptable. There is no universal, simple guide for finding such a value - even the
document [2] in chapter 5.2 is limited to general phrases, the common denominator of which is undoubtedly
the true statement that "the maximum allowable uncertainty should be appropriate to clinical needs". The assessment of whether the uncertainty of a measurement result is “acceptably large” always depends on
the intended use of that result (e.g. we need a different uncertainty for diagnostic purposes and a different
uncertainty for monitoring purposes). The maximum allowable measurement uncertainty is also referred to
as the target measurement uncertainty [2, 11]. The laboratory should avoid the two extremes – both trying to achieve the smallest possible uncertainty
(uncertainty can always be reduced, i.e. improved, but from a certain threshold onwards at the cost of huge
and inadequate financial and time investments) and large uncertainty. The basic guidelines are given in the following 2 chapters.
13.1. Minimum permissible uncertainties a) Zero uncertainty is impossible, uncertainty is always greater than zero. Note: The uncertainty a
constant is zero of course - for example, the constant 1000, which we use to convert a concentration
given in mmol/L to µmol/L, has zero uncertainty.
b) The uncertainties of calibrators and, where appropriate, CRMs and SRMs can serve as a basic guide to the smallest measurement uncertainties a laboratory can achieve. CRMs do not need to be bought
immediately if we want to learn about them.
Example: At https://www.bipm.org/jctlm we can find the following data for the LNE HbA1c 401
reference material: CRV = 32.5 mmol/mol and Uc = 1.8 mmol/mol (k = 2). The relative Uc,rel is therefore 5.5 % and the additional steps of transferring this value to the calibrator supplied by the
manufacturer to the laboratory and the contribution of the laboratory itself to the uncertainty (uRw,rel)
always increase the uncertainty of the measurement. Therefore, the uncertainty declared by the laboratory for the measurement of glycated haemoglobin HbA1c in the region of 30 mmol/mol is highly
unreliable and unlikely if it is less than 6 %. Similarly, the uncertainties of reference materials are
available on the NIST USA website. Reference materials and reference methods lie at the top of the pyramid of metrological traceability,
and no trick can be used in the laboratory to achieve lower uncertainties.
13.2. Maximum permissible uncertainties Different strategies can be used to find the maximum permissible measurement uncertainty (Uc,rel max). Each
has its positives and negatives. Ideally, the laboratory should be able to answer the question: What
uncertainty do we need in order to make our results meet the needs of clinicians? Here are a few possible approaches (this is not an exhaustive list; many other strategies can be found in the
literature):
a) Using APS (analytical performance specification) values derived from biological variability values
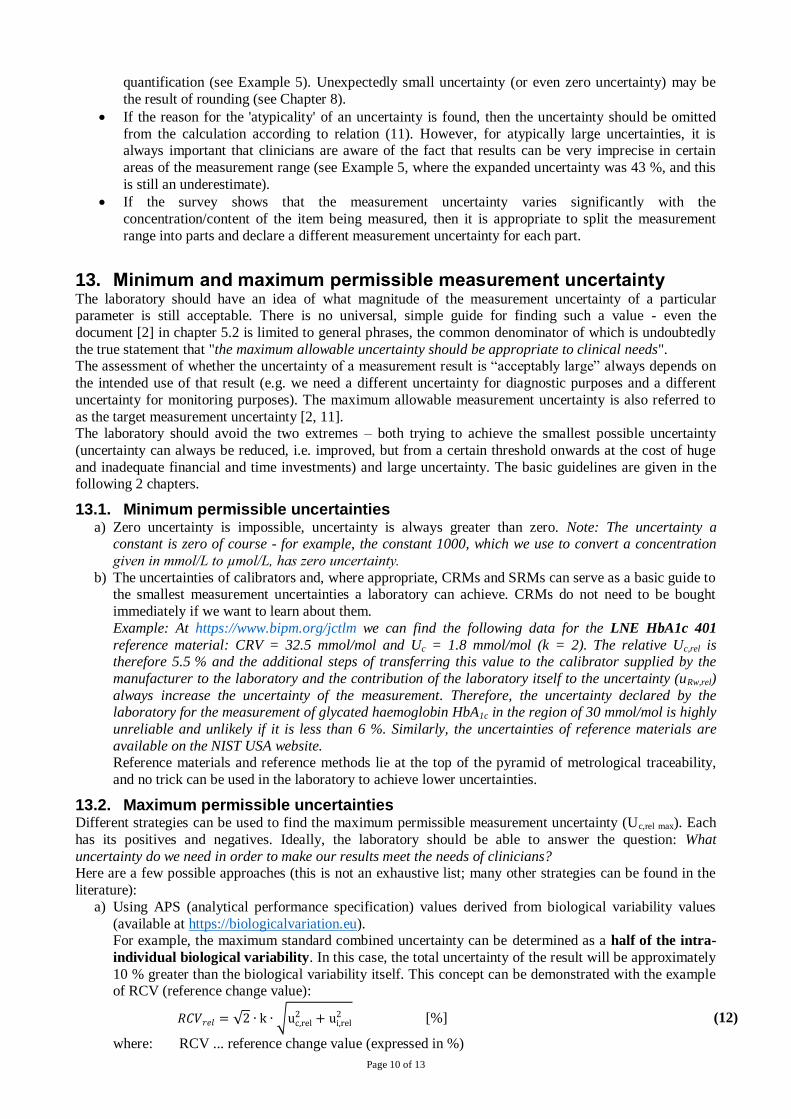
(available at https://biologicalvariation.eu). For example, the maximum standard combined uncertainty can be determined as a half of the intra-
individual biological variability. In this case, the total uncertainty of the result will be approximately
10 % greater than the biological variability itself. This concept can be demonstrated with the example of RCV (reference change value):
𝑅𝐶𝑉𝑟𝑒𝑙 = √2 ∙ k ∙ √uc,rel2 + ui,rel
2 [%] (12)
where: RCV ... reference change value (expressed in %)
Page 11 of 13
k ... coverage factor – the same as in the equation (4), we choose k = 2
uc,rel … the relative standard combined uncertainty of the measurement
ui,rel … relative uncertainty corresponding to intra-individual biological variability Using the serum (plasma) glucose determination as an example and its intra-individual biological
variability ui,rel = 5 %, we obtain a maximum for the measurement uncertainty uc,rel max = 2.5% - with
this uncertainty, RCVrel = 16 % to which the laboratory contributes approximately one tenth. Thus, the criterion set by the laboratory in this case, according to equation (4), is: the maximum
magnitude of the combined expanded uncertainty for the measurement of serum (plasma) glucose is:
Uc,rel max = 5 %. Since the uncertainty of reference materials is usually around 1.5 %, this criterion
should be achievable. Positives/negatives: This is an exact method without "subjective influences". However, the
determination of Uc,rel max from biological variability can be problematic not only because biological
variability is not available for all laboratory tests, but also because it often leads to inadequately hard (analytically unfeasible) conditions (e.g. measurement of mean corpuscular volume (MCV), sodium
cation determination, etc.) or, on the contrary, to very loose and demotivating conditions (e.g.
measurement of C-reactive protein).
b) The search for the maximum permissible uncertainty can be based on (documented) clinicians'
request or on literature data or on data given in international recommendations (guidelines). Let us
take the measurement of CD34+ cells count in blood as an example. The clinical unit will tell you that
if the true count is 5 ·106/L, there is no change in the patient's therapy, whether the measured value is
4 or 5 or 6 ·106/L.. When measuring small numbers, it is usually appropriate to work with
uncertainties expressed in absolute terms. We can then declare the maximum uncertainty for small
counts using equation (12), where we use absolute values instead of relative values, by setting RCV = 2 ·10
6/L and neglecting intra-individual biological variability. We obtain the maximum uc,max =
0,72 ·106/L and from there, according to (4), we obtain the criterion: the maximum magnitude of the
combined expanded uncertainty for the measurement of small counts of CD34+ cells in blood is:
Uc,max = 1.4 ·106/L.
Positives/negatives: The advantage is the indisputable link to the needs of clinicians. But obtaining
credible and quantifiable clinical requirements can be difficult and time consuming; validation from
multiple sources is recommended. c) A good overview of the magnitude of measurement uncertainties in large groups of laboratories can be
obtained from EQA provider reports. If participants report uncertainties and if the provider publishes
the data collected from participants, then information on the average magnitude of measurement uncertainty can be found in the final report. The maximum allowable uncertainty can then be set by
the laboratory as a certain multiple of the average uncertainty, e.g. as 1.5 times the average
uncertainty of the EQA participants.
Positives/negatives: The advantage is the "state of the art" approach, i.e. the laboratory tries to provide similar quality as most other laboratories. But obtaining adequate data is impossible in many
EQA programs and even where data is available, it is always for a limited number of laboratory tests.
d) The EQA data can also be used to determine the maximum allowable uncertainty in another way, by deriving from the Dmax. If Uc,rel max = Dmax, then the participant has a 95 % chance of obtaining the
expected result in a single measurement without the presence of systematic error, and in a round where
2 samples are used, the participant has approximately a 90 % chance of success (i.e. of succeeding in
both samples). Clearly, the criterion Uc,rel max = Dmax is not very ambitious and e.g. 𝑼𝒄,𝒓𝒆𝒍 𝒎𝒂𝒙 =𝟐
𝟑𝑫𝒎𝒂𝒙
may be recommended as more appropriate (giving a 90% chance of success if the systematic error of
the laboratory measurement does not exceed one third of Dmax). Positives/negatives: Because Dmax criteria are typically constructed by EQA providers as a "state of
the art" or from biological variabilities or consensus of the experts, reasonable linkage to clinical needs
and analytical capabilities is assured. Data on Dmax are generally more readily available than data on the measurement uncertainties of EQA participants mentioned above under c).
14. Bias The fact that laboratories are only able to determine bias in a limited number of laboratory tests is one of the
essential arguments leading to the simplification described in Chapter 1. IVD suppliers are responsible for ensuring that the measurement systems they supply have only minimal and medically acceptable bias ([2],
Chapter 6.6). However, this in no way implies that a laboratory should resign on trying to quantify the bias
Page 12 of 13
of its measurement results. This is crucial information that can have a direct impact on the quality of patient
care.
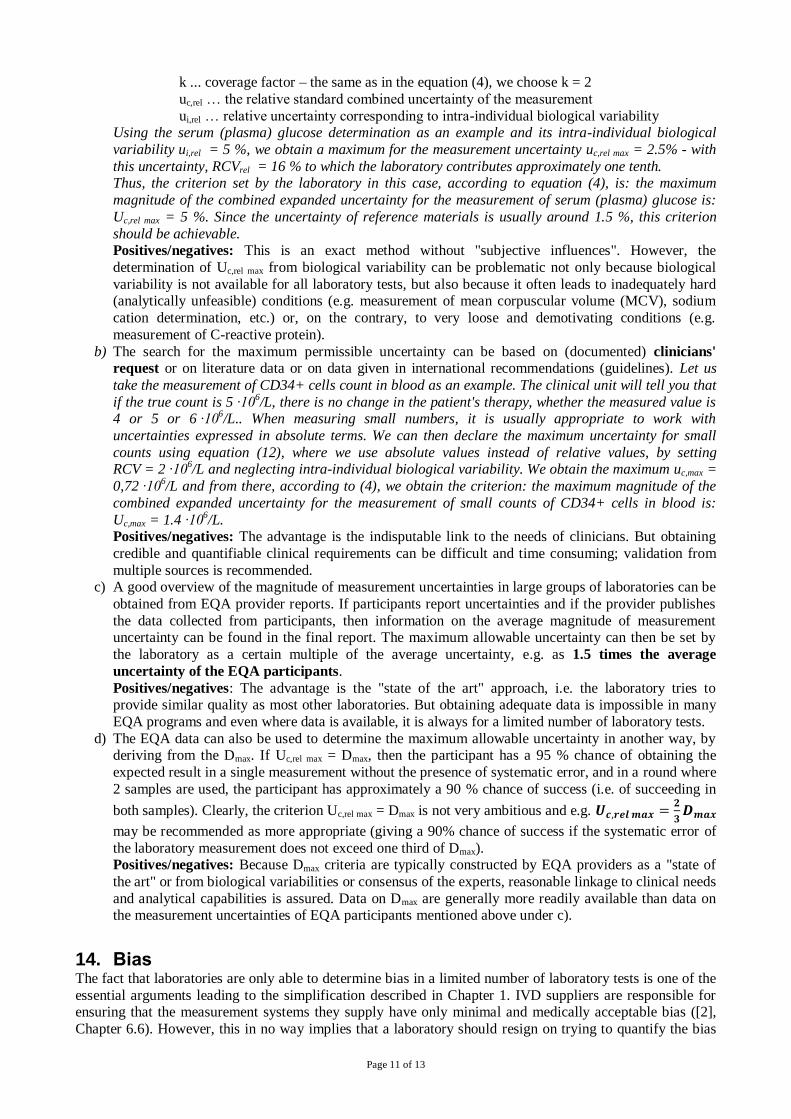
To determine the bias a laboratory has to perform n measurements (for n, n = 5 may be recommended as a minimum, document [2] gives n = 10 in the examples) of a material with a declared content value under
repeatability conditions (measurements in a series). The mean and standard deviation are calculated from
these measurements. The criterion for deciding whether bias is significant is defined in [2] in section C.5.2 as follows:
|𝑥𝑙𝑎𝑏 − 𝑥𝑟𝑒𝑓| > 2 ∙ √𝑢𝑟𝑒𝑓2 +
𝑆𝐷2
𝑛 (13)
where: xlab ... the average of the values measured by the laboratory (calculation according to the
equation (7))
xref … the value (concentration/content) declared in the reference material documentation uref ... standard uncertainty of the reference material value
SD ... standard deviation of the measurements made by the laboratory (calculation according
to the equation (8))
n ...number of measurements made by the laboratories
Note: The expression √𝑢𝑟𝑒𝑓2 +
𝑆𝐷2
𝑛 represens the standard uncertainty of the bias estimate
Both CRM and SRM materials can be used as reference materials, as well as samples validated in the EQA
process if uncertainties in the assigned values are available. Care should always be taken to ensure the matrix adequacy of the reference material used.
When the bias is not significant, it does not need to be addressed either in the context of the release of
results or in the uncertainty calculation. When the bias is significant, the laboratory should make maximal effort to eliminate it and, if necessary,
request the supplier of the measurement system for the cooperation. Even if the significant bias cannot be
eliminated, we recommend that the laboratory perform a basic uncertainty estimate according to this
recommendation (i.e. without including bias). In case the laboratory wants to include a component of (significant and uncorrected) bias in its uncertainty estimate, it is already outside the scope of this
recommendation, in which case it is possible to follow, e.g., documents [3, 8, 9].
15. References 1 Guide for the expression of uncertainty in measurement. ISO Geneva 1993. (Reprinted 1995:
Reissued as ISO Guide 98-3 (2008)).
2 ISO/TS 20914:2019 Medical laboratories — Practical guidance for the estimation of measurement
uncertainty. ISO 2019. 3 Synek V.: Attempts to include uncorrected bias in the measurement uncertainty. Talanta 2005, 65:
829-837.
4 ILAC-G8:03/2009 - Guidelines on the Reporting of Compliance with Specification. ILAC 2009. 5 EN ISO 15189:2012 ed. 2 Medical laboratories — Requirements for quality and competence (ISO
15189:2012, Corrected version 2014).
6 JCGM 200:2012 International vocabulary of metrology – Basic and general concepts and associated terms (VIM) 3rd edition. Available from www.bipm.org
7 Metrologická terminologie 3. Available at: www.sekk.cz/terminologie
8 Plzák Z, Synek V.: Odhad nejistoty chemických měření se započtením vychýlení. Metodický list
Eurachem ČR 2018. Dostupné na: www.eurachem.cz
9 Synek V.: How to encompass an uncorrected bias in to the expanded uncertainty with a fixed
coverage probability: calculation procedures. Accred Qual Assur 2017, 22/4:179-186. 10 Ellison S. L. R. and Williams (Eds). Eurachem/CITAC guide: Quantifying Uncertainty in Analytical
Measurement, Third edition, (2012) ISBN 978-0-948926-30-3. Available from www.eurachem.org
11 Bettencourt da Silva R., Williams A. (Eds), Eurachem/CITAC Guide: Setting and Using Target
Uncertainty in Chemical Measurement, (1st ed. 2015). Available from www.eurachem.org. 12 ISO/IEC Guide 98-4 (2012) Uncertainty of measurement - Part 4: Role of measurement uncertainty
in conformity assessment. ISO Geneva 2012.

Page 13 of 13
Authors (alphabetic list):
Vladimír Bartoš Marek Budina
Bedřich Friedecký
Josef Kratochvíla Drahomíra Springer
Kristian Šafarčík
Reviewers (alphabetic list):
Zbyněk Plzák Václav Synek
Editor:
Marek Budina ([email protected])