the rea data model - yolasiastie.yolasite.com/resources/sia_romney/chapter 17.pdf · 516 part iv ....
TRANSCRIPT
Chapter 17
Chapter 1 8
Chapter 19
The REA Data ModelDatabase Design Using the READata Model
lmplementing an REA Modelin a Relational Database
Special Topics in REA Modeling
511

Usingdel
INTEGRATIVE CASE FRED'5 TRAIN SHOP
Fred Smith is frustrated. Business in his model train shop is booming. But the simple
accounting software that he uses to run the business has only limited reporting
capabilities. Consequently, he often has to manually reYiew transaction data to prepare
custom reports. The process is time-consuming and prone to error. For example, Fred
spent the past weekend poring over sales records for the prior three months to try to
identify which combinations of items were most frequently purchased together' He
plans to use the information to offer a special sales promotion but is concerned about
the quality of his analysis.
At lunch, Fred explains his frustrations to his CPA, Paul Stone. Paul mentions that
he has just completed a training course on database design. He suggests that he could
create a relational database for Fred that would interface with his accounting software
and that would provide Fred with the ability to easily design reports to analyzer.his
business. Fred likes the idea and hires Paul to design a relational database for his
train store.
s12
lntroduction
Chapter 4covered the fundamental principles of rclational databases The thrce chapters in this
secti^on will teach you how to design and document a relational database for an accounting infor-
frationxystem. You will see that there is much more to building a database than simply leaming
the syntax of how to use a particular database management system (DBMS) Building accurate
databases requires a.great deal of carefut planning and desigt before you even sit down at the
computerthis chapter introduces the topic of data modeling, one aspect of database desigo that
accountants should understand. We discuss entity-relationship (E-R) diagrams and the REA
accounting model and demonstrate how to use these tools to build a data model of an AIS' Then
we discus's howpuch REA models can also serve as a source of documentation about an
organizatiol's business activities and policies. Chapter 18 will explain how to implement
an-REA data model in a database and how to query the resulting database to retuieve information
needed to effectiYely manage an organization's business activities Chapter 19 concludes
this three-chapter seition by examining a number of advanced data modeling and database
design issues.
Database Design Process..:..::...:.:::
Fieure l7-l shows the five basic steps in database design. The fiIst stage (systems analysis) con-
,iri, ofir]itiuf pfunning to determine the need for and feasibility of developing a new system This
stage includes preliminary judgments about the proposal's technological and economic feasibil-
ItyIIt utro in otr", identifying user information needs, defining the scope of the proposed new
sistem, and using information about the expected number of users and fransaction volumes to
make preliminarf decisions about hardware and software requirements' The second stage (con-
ceptual design) includes developing the different schemas for the new system at the conceptual'
"*t"mul, uniirt"-nl levels. Thi third stage (physical design) corsists of translating the internal-
level schema into the actual database structures that will be implemented in the new system. This
is also the stage when new applications are developed. The fourth stage (implementation and
conversion) includes all the actiYities associated with transferring data from existing systems to
the new database AIS, testing the new system, and training employees how to use it' The final
stage is using and maintaining the new system. This includes carefully monitoring system per-
foriran"" und user satisfaction to determine the need for making system enhancements and
modihcations. Eventually, changes in business stmtegies and practices or signiltcant new devel-
opments in information iechnoLgy prompt the company to begin investigating the feasibility
513

514 PART lV . THE REA DATA MODEL
FIGURE 17-IData Modeling in the
Database Desion Process
Doto ModelUsed Here
of developilg a new system, and the entire process sta.rts again (note the arro* retuming to thesystems analysis stage).
Accountants can and should pa icipate in every stage of the database desigu process,although the level of their inyolvement is likely to vary across stages. Durilg the systems analy-sis phase, accountants help evaluate project feasibility and identify user infomation needs In theconceptual design stage, accountants participate in deyeloping the logical schemas, designing thedata dictionary, and specifying important controls. Accountants with good database skills maydirectly participate in implementing the data model during the physical design stage. Durillg the,implementation and conversion stage, accountants should be involved in testing the accuracy ofthe new database and the application progmms that will use that data, as well as asses$ing theadequacy of controls. Finally, many accountants arc regular users of the organiz4tign's daiabaseand sometimes even have responsibility for its management.
Accountants may proyide the greatest yalue to their organizations by taking responsibility fordata modeling. Dard modeling is the process of defining a database so that it faithfully representsall aspects of the organization, including its interactions with the extemal enyironment. As shownin Figure 17-1, data modeling occurs during both the systems analysis and conceptual designstages of database design. Next, we discuss two impo ant tools that accountants can use toperform data modeling: entity-relationship diagramming and the REA data model.
At entitt-relationship @-R) iliagram is a graphical technique for portraying a darab&eschema. It is called an E-R diagram because it shows the various enririeJ being modeled and theimportant relationshrps among them. An entit! is anythirrg about which the organization wants
rThe material in this section is based on P Chen, "The Enrity Retationship Modet-Toward a Unified ViJw of Data,,,Transactions on Database S}Jrel,,s (March 1976, l:l): 9-36.
Relationship
' CHAPT€R 17 . oATABAS€ OESGN USNG rsE R€A oATA MoorL 115
to collect and store information. For example, Fred's Train Shop's database would includeentities for employees, customers, suppliers, inventory and for business events such as sales tocustomers and deliveries from suppliers. In a relational database, separate tables would be cre-ated to store informati]on about each distinct entity; in an object-odented database, separate
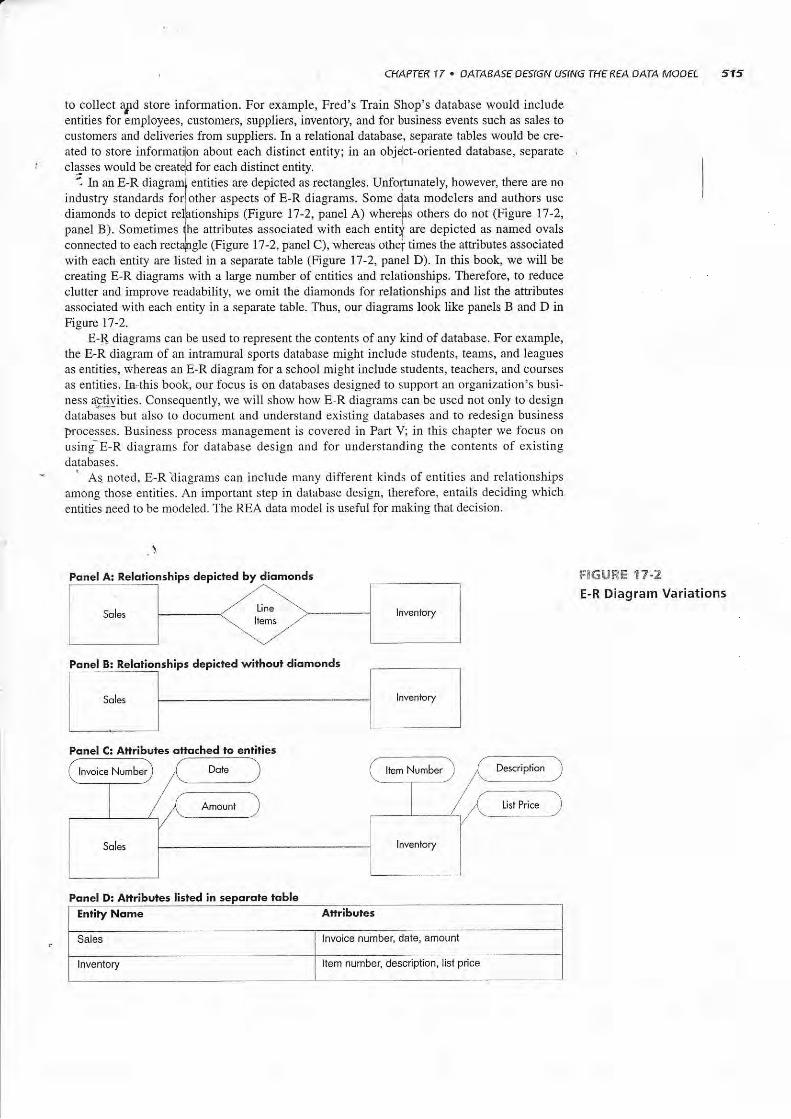
cla-sses would be creatdd for each distinct entity.i In an E-R entities arc depicted as rectangles. Unfortunately, however, there are no
industry standards for]other aspects of E-R diagrams. Some (ata modelers and authors use
diamonds to depictpanel B). Sometimes (he attributes associated with each entiti are depicted as named ovalsconnected to each (Figure 17-2, panel C), whereas othef times the attributes associated
with each entity are listed in a separate table (Figure 17 -2, panel D). In this book, we will becreating E-R diagrams with a large number of entities and relationships, Therefore, to reduceclutter and improve readability, we omit the diamonds for relationships and list the attributesassociated with each entity in a separate table. Thus, our diagrams look like panels B and D inFig:re 11-2-
E-[ diagrams can be used to represent the contents of any kind of database. For example,the E-R diagram of aII intramural sports database might include students, teams, and leaguesas entities, whereas an E-R diagram for a school might include students, teachers, and coursesas entities. Iq"this book, our focus is on databases designed to support an organization's busi-ness aj?tivities. Consequently, we will show how E-R diagrams can be used not only to designdatabases but also to document and understand existing databases and to redesign business
D{ocesses. Business process management is covered in Part V; in this chapter we focus onusintE-R diagrams for database design and for understanding the contents of existingdatabases.
' As noted, E-R'diagrams can include many diff'erent kinds of entities and relationshipsamong those entities. An important step in database design, therefore, entails deciding whichentities need to be modeled. The REA data model is useful for making that decision.
Pqnel D: Attributes listed in
cts of E-R diagrams. Some (ata modelers and authors use(Figure 17-2, panel A) where[s others do not (Yrgure 17-2,
FlGURE 17.2E-R Diagram Variati
Ponel A: Relotionrhips depicted by diomonds
Pqnel B: Relotionships depicted withoul diomonds
Ponel C: Atlibufer otto(hed to entities
Enlity Nome Attribuies
Sales lnvoice number, date, amouni
lnventory Item number, description, list price

516 PART IV . THE REA DATA MODEL
FIGURE 17-3Basic Elements of an
REA Diagram
2lhe material in this section is adapted from William E. Mccarrhy, . An Enriry-Relationship View of AccountingModels:' The Accounting Reyiew (Octobet 19'79): 667-686; William E. Mccarthy, ..The REA Accounting Modil:A Generalized Framework for Accourting Systems in a Shar€d Dara Environ mentj' The Accounting Retiw(July 1982): 554-578; and Guido L. Geerts and W. E. Mccarthy, .An Ontological Analysis of rhe primitives of rheExtended-REA Enterprise Informarion AlchitectIIe:' Internationat toumal ofAcco ntin| Infot nation Slnems3(March 2002): l-16.'Some RIA data modelers have proposed a fourth type of entity, which they call locadons. Stores ard warehouseswould be examPles of this founh typ€ of eDtity. However, such "location" entities are usually also resources controll€alby the organization. Therefore, the anrhors of this text s€e no compelling reason to crcale yei another type of entity indmodel locations as resources. If an organization does not want or need to store informatjon about locatior.
"*""pitoidentify where an evenr occuned,locadon can be an attribute for each evenr.aThe discussion of events in rhis section is based on the work of Julie smirh David, "Three 'Bvents' That Define anREA Methodology for Systems Analysis, Design, and Implemenrarion," Working pap€r, Arizona State Universiry,August 1997, and cuido L. ceerts and W. E. Mcca(hy, .An Ontologicat Analysis of iie primitives of rt*Extended-REA Enterprise Infomation Architedure:' Intemationnl Joumat olAccounting tnfonnation Slstell.s 3(March 2002): I 16.
The REA Data Model2
T\e REA data was developed specifically for use f[ aesigning AIS. The REA data modelfocuses on the semantics underlying an organization's value-chain activities. It providesguidance forand bymodels arechapter and the book, we will refer to E-R diagmms developed according to the REAdata model as diagrams.
Three Basic Types of EntitiesThe REA data model is so named because it classifies entities into three distinct categories: theresources the organization acquires and uses, the ?yents (business activities) in which the organ-ization engages, and the agents panicipating in these events.3 Figure l7-3 provides exdmplei ofthese three types of entities.
Resources are those things that have economic value to the organization. Figure 17-3includes two resource entities: cash and inventory. Events arc the various business activitiesabout which management wants to collect information for planning or contlol porposes.4 Thereare two event entities in Figure l7-3: Sales and Receive Cash. dents are the people and organi_zations that participate in events and about whom information is desired for planning, control,and evaluation purposes. Figure l7-3 includes two types of agent entities: Employees andCustomers.
Lse design by identifuing what entities should be included in the AIS databasehow to structure relationships among fhe entities in that database. REA datadepicted in *re form of E-R diagrams. 'Coosequently, in the remainder of this

CHAPTER 17 . DATABASE DESTGN USING THE REA DATA MODEL 517
Structuring Relationships: The Basic REA TemplateThe REA data model prescribes a basic pattern for how the three types of entities (resources,
events, and agents) should relate to one another. Figure 17-4 presents this basic pattern. The
essential features of th€ patlem are as follows:-lf. Each event is link{d to at least one resource that it affects.2- Each event is linkdd lo at least one other event.
3. Each event is linked to at least tn o participating agents.
RULE 1: EVERY EV;NT ENTITY MUST BE LINKID TO AT LEAST ONE RESOURCE ENTITY EVENTS
mus, be linked to at least one resource that they affect. Some events, such as the one labeled "GetResource A" in Figure 17-4, increase the quantity of a resource' Common examples of such
"Get" events include the receipt of goods ftom a supplier (which increases the quantity on hand
of inventory) and the receipt of payment ftom a customer (which increases the arnount of cash).
Other eyents, such as the one labeled "Give Resource B" in Figure 17-4, directly decrease the
quantity. of a resource. Common examples of such "Give" events include paying suppliers and
selling merchandise, which decrease the amount of cash and quantity on hand of inventory,
respectiYely.Relatioqslips that affect the quantity of a resource are sometimes referred to as stocffiow
relationships because they represelrt either an inflow or oudlow of that resource. Not every event
d ectlratem the quantity of a resource, however. For example, orders from customers represent
eom$tments that will eventually result in a future sale of merchandise, just as orders to
suppliers represent commitments that will eventually result in the subsequent purchase ofinventory. For simplicity, Figure 17-4 does not include any such commitment events.
Olgadzations do, however, need to track the effects of such commitments, both to provide better
service and for planning purposes. For example, customer orders reduce the quantity available ofthe speci{ic inventory items being ordered. Sales staff need to know this information to be able to
properly respond to subsequent customer inquiries and orders, Manufacturing companies may
use inforrnation about customer orders to plan production. Later in the chapter we will see how
to add commitmAnt events to the basic pattern shown in Figure l7-4.
RULE 2I EVERY EVENT ENTITY MUST BE LINKED TO AT I.EAST ONE OIHER EVENT ENTITY
Figure 17-4 also shows that the Get Resource A event is linked to the Give Resource B event in
what is labeled as an economic duality relationship. Such give-to-get duality relationships reflect
lnternolAgent
FIGURE 17-4Standard REA Template
Resource BlnternolAgeni
The nomes on fie lines describe ihe nolure o[ lhe relotionship. Agenis porticipote in events. The
economic duolity relotionship bet,veen the "get" evenl ond lhe "give" event reflech 6e loct hotorgonizolions musl give up one resource (e.9., cosh) in order to get some other resource
[e!., inrentory). The stockflow relotionships between on evenl ond o resource rePresenleitherinflows or ou$ows of o resource.
518 PART lV . THE REA DATA MODEL
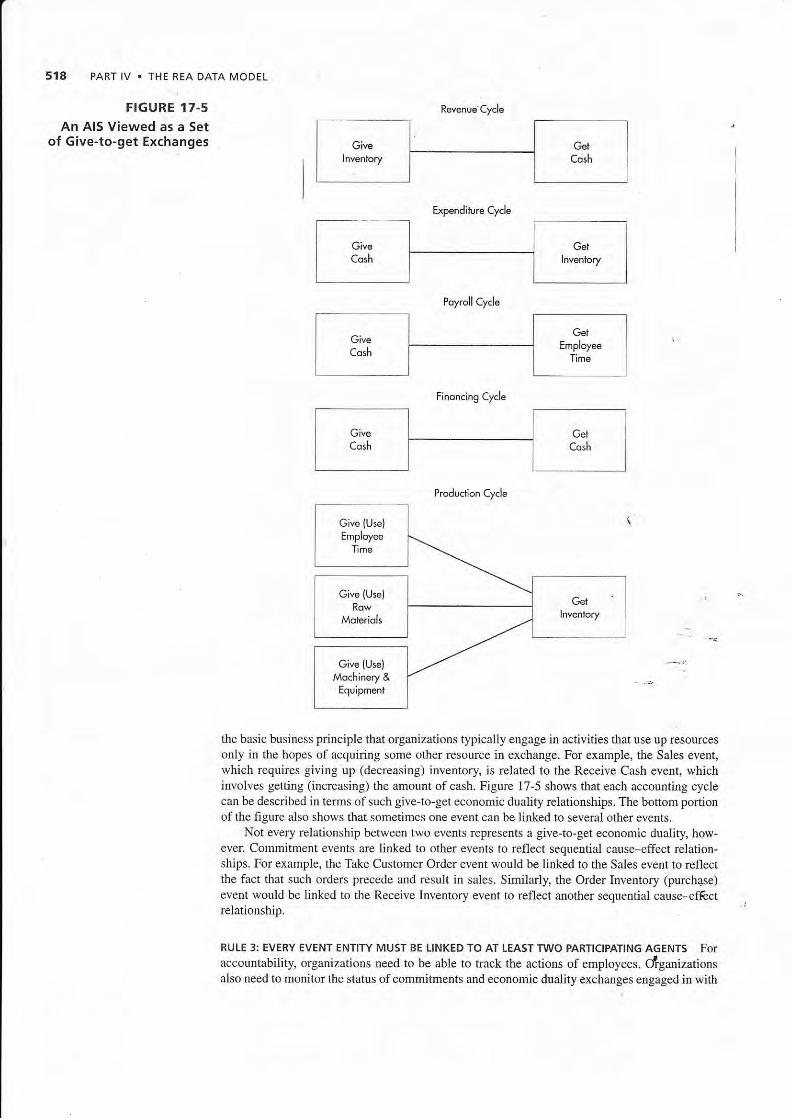
FIGURE 17.5An Al5 Viewed as a set
of Give-to-get Exchanges
Expenditur€ Cycle
Poyroll Cycle
Finoncing Cycle
Production Cycle
the basic business principle that organizations typically engage in actiyities that use up resourcesonly in the hopes of acquiring some other resource in exchange. For example, the Sales event,which requires giying up (decreasing) inventory, is related to the Receive Cash event, whichinvolves getting (increasing) the amount of cash. Figure l7-5 shows that each accounting cyclecan be described in terms of such give-to-get economic duality relationships. The bottom portionof the figure also shows that sometimes one event cart be linked to several other events,
Not every relationship between two events rcpresents a give-to-get economic duality, ho\tr-ever. Commitnent events are linked to other eyents to reflect sequential cause-effect relatioa-ships. For example, the Take Customer Order event would be linked to the Sales event to reflectthe fact that such orders precede and result in sales. Similarly, the Order Inventory (purchgse)event would be linked to dre Receiye Inventory event to reflect another sequential cause-efftctrelationship.
RULE 3: EVERY EVENT ENTIry MUST BE LINKED TO Al LEAST TWO PARTICIPATING AGENTS Foraccountability, organizations need to be able to hack the actions of employees. drganizationsalso need to monitor the status of commitments aIld economic duality exchanges engaged in with
CHAPTER 17 . DATABASE DESIGN USING THE REA DATA MODEL 519
outside pafiits. Thus, Figure 17-4 shows each eYent linked to two participating agent entities. For
events that involye transactions with extemal parties, the intemal agent is the employee who is
responpible for the resource affected by that event. and the external agent is the outside party to
the trairsaction, For intemal events, such as the transfer of raw materials from the storeroom to
produition, the intemal agent is the emPloyee who is giYing up resPonsibility for or custody ofthe-re{ootce, and the extemal agent is the employee who is receiving custody of or assuming
responsibility for lhat resource. ]
Deteloping an REA Diagr'am
This chapter focuses on developing an REA diagram for a single business cycle. In the next
chapter we will learn how to integmte REA diagrams for individual business cycles to create one
enterprise-wide REA diagram.Developing an REA diagram for a specific business cycle consists of the following thee
steps:
1. Identify the events about which management wants to collect information.2. icleqtify ihe'resources affected by each eYent and the agents who participate in those events.
3. Ddtermine the cardinalities of each relationship.
- Let us follow these th.ree steps to see how Paul developed Figure 17-6 to model the revenue
cycle of Fred's Train Shop.
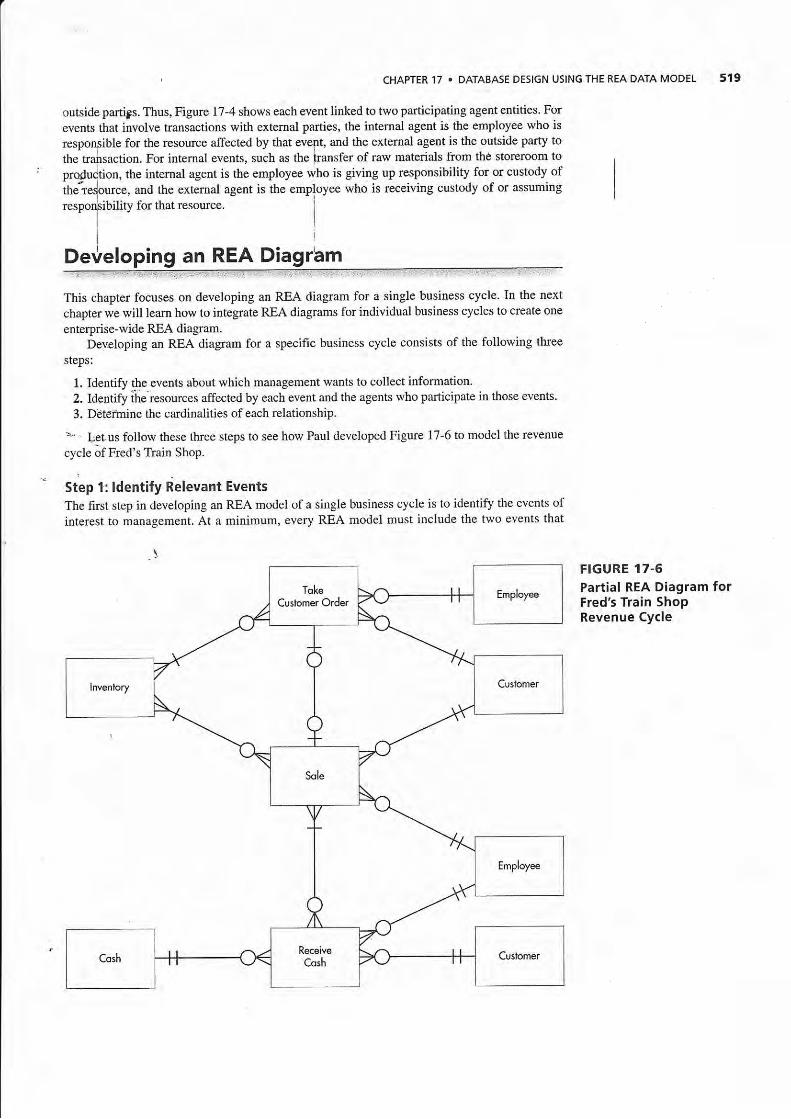
Step 1: ldentify Relevant EventsThe first step in developing an REA model of a single business cycle is to identify the events ofinterest to management. At a minimum, eYery REA model must include the two events that
FIGURE 'I7.6Partial REA Diagram forFred's Train ShopRevenue Cycle

I s2o
I
I
PART IV . THE REA DATA MODEL
represenl the basic give-to-get economic exchange performed in that particular business cycle(see Figure 17-5). Usually there are other events that management is interested in planning,controlling, and monitoring; they also need to be included in the REA model.
A solid understanding of activities pirformed in each business cycle (see Chapters 12-16) isneeded to identify which elents comprise the basic give-to-get economic duality relationships. Forexample, Chapter 12 explained that the revenue cycle typically consists of four sequential activities:
1. Take customer orders2. Fill customer orders3. Bill customers4. Collect payment from customers
Analysis of the fust activity, taking customer orders, indicates that it does not involve either theacquisition of resources from or provision ofresources to an extemal party. It is only a commit[entto perform such actions in the future. The second activity, fill customer orde6, does reduce theorganization's stock of a resource that has economic yalue (inventory) by delivering it to an exter-nal party (the customer). Thus, it represents an example of the protot,?ical Give Resou{ce eventdepicted in Figure 17-4. The tltid actiyity, billing customers, involyes fie exchange of informationwith an external party but does not directly increase or reduce the quantity of any economicresource. Finally, analysis of the fourth actiyity, collect payments from customers, indicates that itresults in an increase in the organization's supply of an economic resource (the entity labeted"Cash" in Figure 17-6) as a rcsult of receiving it from an extemal party (the customer). Thus, it isan example ofthe prototypical Get Resource eyent depicted in Figure 17-4. Consequently, analysisqf the basic business activities performed in the revenue cycle indicates that the basic give-to-geteconomic exchange consists of two events; fill customer orde$ (usually refened to as the Salesevent) and collect payments from customers (often calted the Receive Cash event).
In drawing an REA diagram for an single business cycle, it is useful to divide the paper intothree colunms, one for each type of entity. Use the left column for rcsources, the center columnfor events, and the right column for agents. Readability is further enhanced i*the event entitiesare drawn from top to bottom corresponding to the sequenca in which they occur. Thus, Paulbegins to draw Figure 17-6 by placing the Sales eyent entity above the Receive Cash event entityin the center column ofthe paper.5
After the economic exchange events are identified, it is necessary to detemine which otherbusiness activities should be represented as eyents in the REA model. This; too, requires undbr-standing what each actiyity entails because only those activities that involve the acquisition ofnew information need to be included in the model. Retuming to our example, Paul notes,that tbgeconomic duality of Sales and Receive Cash accurately reflects most in-store sales transactioniin which the customer selects one or more items and pays for them. Sometimes,-howeyer,customers call the store and ask if specific items can be set aside for pickup later that wiek. Toensure that he reorders popular items on a timely basis, Fred needs not only to set those itemsaside but also to record such orders in the system. Therefore, Paul decides to add the commit-ment event Take Customer Order to the REA diagram, placing it above the Sales event becausecustomer orders precede the Sales event.
Paul then considers the other revenue cycle business activity, billing customers. He knowsthat in-store sales are paid for immediately and, therefore, do not inyolve a separate "billing"step. But Fred also sells model trains to shopping centers, hotels, and other institutions that wantto set up seasonal displays for their customers. Such sales are made on credit, and Fred doessubsequently prepare and mail invoices to those customers. However, pdnting and mailinginvoices does not directly increase or decrease any economic resource. Nor does the billing activ-ity represent a commitment to a future economic exchange: The customer's legal obligation topay arises from the delivery of the merchandise, not from the printing of an inyoice.Consequently, as noted in Chapteru 12 and 13, mairy organizations are beginning to realize thatbilling is a non-value-added activity that can be eliminated entirely. Moreover, rhe activitf ofpdnting an inyoice does not add any new information to the database. The p ces and quantities
SPlacement conventions, such as the use ofcolumns and sequential ordering of events, are nor /eq,j/ed (9 use rhe REAmodel to design a database. We suggest these rules only because following them often simplifies the protess of drawingan REA diagram and produces REA diagrams that are easy to read.
CHAPTER 17 ' DATABAsE DESIGN USING THE REA DATA MODEL
of items sold were recorded at the time of the sale, at which time the terms of payment werc also
agreed uporf Thus, the billing activity is simply an information processing event that merely
ritrieves i,'formation from the database,'similar to writing a query or printing an intemal report.
Since such information retrieval events do not alter the contents of the database, they need not be
modeled as events in an REA diagram. For all the foregoing reasons, Paul realizes that he doesmodeled as events in an REA dragmm. tsor all the toregomg reasons' rau
no6?rded to include a billing event itr his revenue cycle REA diagram for Fred's Train
flut whar about accounts receivable? If there is no billing event, how can Fred's
monitor this balance sheet item? The solution lies in understanding that accounts
merely a timing difference between the two components of the basic economic
Shop
rle isn the
revenue cycle: sales and the receipt of payment. In other words, accounts receivable
equals all sales for which customers have not yet paid. Consequently, accounts receivable
calculated and monitored by simply collecting information about Sales and Receive Cash events.
The next chapter will illustrate several different ways for extracting information about accounts
receivable from a database built using the REA data model.
Finally, notice that there are no events that pertain to the entry of data. The reason for this is
that the REA data model is used to design transaction processing databases. The objective is to
model 0re basic value-chain business activities of aa organization: what it does to generate rcv-
enues and how it spends cash ald uses its other resouces. Entering data about those events and
about the resg-ulces and agents associated with them is not usually considered a primary value-
chain activity. Thus, just like writing queries and printing reports, data entry activities are not con-
sideredimportant events about which detailed data needs to be collected. Moreoveq as discussed
i* the. preceding frve chapters, there is a cotrtinuous tend to use technology to eliminate routine
clericallinfomation processing activities, inctuding data entry. Thus, it is possible to conceive of
business events (such as the sale of merchandise) being performed without the need for any sepa-
rat'e data entry activities. Indeed, much data entry already occurs as a by-product of performing
the business events that are included in the REA diagram. For example, whenever a sale, purchase,
receipt of cash, or payment occu$, information about that event is entercd in the database Thus,
what gets modeled in the REA diagram is the business event (e.g., the sale tansaction) and the
facts that management wants to collect about that event, not the entry of that data'
.\Step 2: ldentify Resources and AgentsOnce the relevant events have been specified, the reSources that ale affected by those events need
to be identified. This involves answering three questions:
1. What economic resource is reduced by the "Give" event?
2, What economic resourca is acquired by the "Get" eYent?
3. What economic resource is affected by a commitment evellt?
Again, a solid understanding of business processes makes it easy to answer these questions To
continue our example, Paut has obsened that the Sales event involves giving inventory to cus-
tomers and that the Receive cash event involves obtaining payments (whether in the form ofmoney, c,hecks, credit card, or debit card) ftom customers. Therefore, he adds an Inventory rcsource
entity to the REA diagmm and tints it to the sales event entity. The Inventory entity stoles informa-
tion about each product that Fred sells. Then Paul adds a Cash resource entity to the diagram'
Although organizations typically use multiple accounts to track cash and cash equivalents (e g ,
operating checking account, petty cash, and short-term investments), these are all summarized in
one balance sheet account called cash. Similarly, the cash resource contains information about
every individual cash account. Thus, in a rclational database, the "cash" table would contain a sep-
arate rcw for each specific account (e.g., petty cash, checking account, etc.). Paul then links the
"Cash" resource entity to the Receive Cash event entity. Finally, the Take Customer Order event
involves setting aside merchandise for a specific customer. To maintain accurate inyentory recolds,
and to facilitate timely reordering to avoid stockouts, each Take Customer Order event should result
in reducing the quantity available of that particular inventory item. Therefore, Paul adds a link
between the Inveritory rcsource entity and the Take customer order event entity in the REA dia-
gram he is developing for Fred's Train Shop revenue cycle.
In addition to specifying the resources affected by each event, it is also necessary to identify
the agents who participate in those events. There will always be at least one internal agent
(employee) and, in most cases, an extemal agent (customer or vendor) who participate in each

PART IV . THE REA DATA MODEL
event. In the case of Fred's Train Shop's revenue cycle, a customer and a salesperson participatein each sales event. The customer and a cashier are the two agents participating in each ReceiveCash event. Both the salesperson artd the cashier are employees of Fred's. Thus, both revenuecycle economic exchange eyents iDyolye the same two general types of agents: +mployees (th€intemal party) and customers (the external party). The Take Customer Order everft also involyesboth customers and emliloyees. Therefore, Paul adds both types of agents to rle diagram anddraws relationships to indicate which agents participated in which events. To re{uce cluner, hesometimes links one copy of a particular agent entity to two adjacent eyent entirids.6
Step 3: Determine Gardinalities of Relationships I
The final step in drawing an REA diagram for one transaction cycle is to add information aboutrelationship cardinalities. Carilinalities describe the nature of the relationship between two enti-ties by indicating how many instances of one entity can be Iinked to each specific instance ofanother entity. Consider the relationship between the customer agent entity and the sales evententity. Each entity in an REA diagram represents a set. For example, the Customer entity repre-sents the set of the organization's customers, and the Sales entity represelts the set of individualsales transactions tl)at occur during the current fiscal period. Each individual customer or salestransaction represelts a specific instance of that entity. Thus, in a relational database, each row inthe "Customer" table would store information about a particular customer, and each row in the"Sales" table would store information about a specfic sales transaction. Cardinalities define howmany sales transactions (instances of the Sales entity) can be associated with each customer(instance of the Customer entity) and, conversely, how many customers can be associated witheach sales transaction.
No universal standard exists for representing information about cardinalities in REA dia-grams. In this text, we use the gmphical "crow's feet" notation style for rcpresenting cardinalityinformation because it is becoming increasingly popular and is used by many software designtools. Table 17-1 explains the meaning of the symbols used to represent cardina.lity information,and Focus 17-1 compares the notation used in this book with other cornmonly \rsed conventions.
TABLE 17-1 Graphical Symbols for Representing Cardinality tnformation
Minimum = 0lMaximum = I
-+F- Minimum= 1;
Maximum = I
cardinalities
Minimum = 0;
Maximum = many
Minimum = 1:
Maximum = manyEntity A Entity B
Meaning
Each instance of e[tity A mayor rnay not be liDked to i{r)linstances of entity B, but can "'be linked to at most onc *instance of entity B. 'Each instance of entity A mustbe linked to all instance ofentity B, and can only belinked to at most one instanceof entity B.
Each instance of entity A mayor may not be linked to anyinstances of entity B, butcould be linked to more thatrone instance of entity B.
Each irstarce of entity A mustbe linked to at least oneinstance ofentity B, but call -be linked to many instances dentity B.
--o<-
+
6Deciding how many copies of tbe same entity to inctude in an REA diagram is a matter of personal tasre: lncluding toomany copies clutters the diagam with redundant rcctangles, but too few copies can result in a confusing Gngled web oflines connecting entities to one another.

CHAPTER 17 . DATABASE DESIGN USING THE REA DATA MODEL 523
Some of the more common
(Min, Max) A pair of alphanumeric charaders insideparentheses:
(0,'l) means minimum = o, maximum = 1
(1,1) means minimum = 1; maximum = 1
(0,N) means minimum = 0; maximum = many('l,N) means minimum = l; maximum = many
Each instance of entity A must be linked to at least oneinstance of entity B but may be linked to many instances
of entity B; each instance of entity B may or may not belinked to an instance of entity A but can only be linkedto at most one instance of entity A. Noter Some authorsand .onsultants flip which side of the relationship thecardinality pair appears on!
UML one or two alphanumeric charaders sepa-rated by two periods:
b..1 means minimum = o; maximum = 1
1 means minimum = 1; maximum = 1
* means minimum = 0; maximum = many
t * means minimum = 1; maximum = manyEach instance of entity A must be linked to at leatt oneinstance of entity B but may be linked to many instances
of entity B; each instance of entity B must be linked to an
instance of entity A but can only be linked to at most oneinstance of entity A.
Maximums one alphanumeric character to represent theonly maximum cardinality in that relationship:(Microsoft 1 means 1; the infinity symbol (oo) means
Access) many
Each instance of entity A may be linked to manyinstances of entity B; each instance of entity B can onlybe linked to at most one instance of entity A.
As shown in Table 17-1, cardinalities are represented by the pair of symbols next to an
entity. The four rows in Table 17-l depict the four possible combinations of minimum and ma"r-
imum cardinalities. The minimum cardinality cattbe either zero (0) or one (1), depending upon
whether the relationship between the two entities is optional (the minimum cardinality is zero;
see rows one and three) or mandatory (the minimum cardinality is one, as in rows two and four).
T1le maximum cardinarir) can be either one or many (the crow's feet symbol), depending upon
whether each instance of entity A can be linked to at most one instance (as in the top two rows)
or potentially many instancas of entity B (as in the bottom two rows)
Let us now use the information in Table 17-1 to irterpret some of the cardinalities inFigure 17-6. Look first at the Sale-Customer relationship' The minimum and maximum cardinal-
ities next to the Customer entity are both one. This pattem is the same as that in row two in
Table 17-1. Thus, the minimum cardinality of one next to the Customer entity in Figure 17-6 indi-
cates that each sale transaction (entity A) m ur, be linked to some specific customer (entity B). The
maximum cardinality of one means that each sale transaction can be linked to at most only one
PART lV . THE REA DATA MODEL
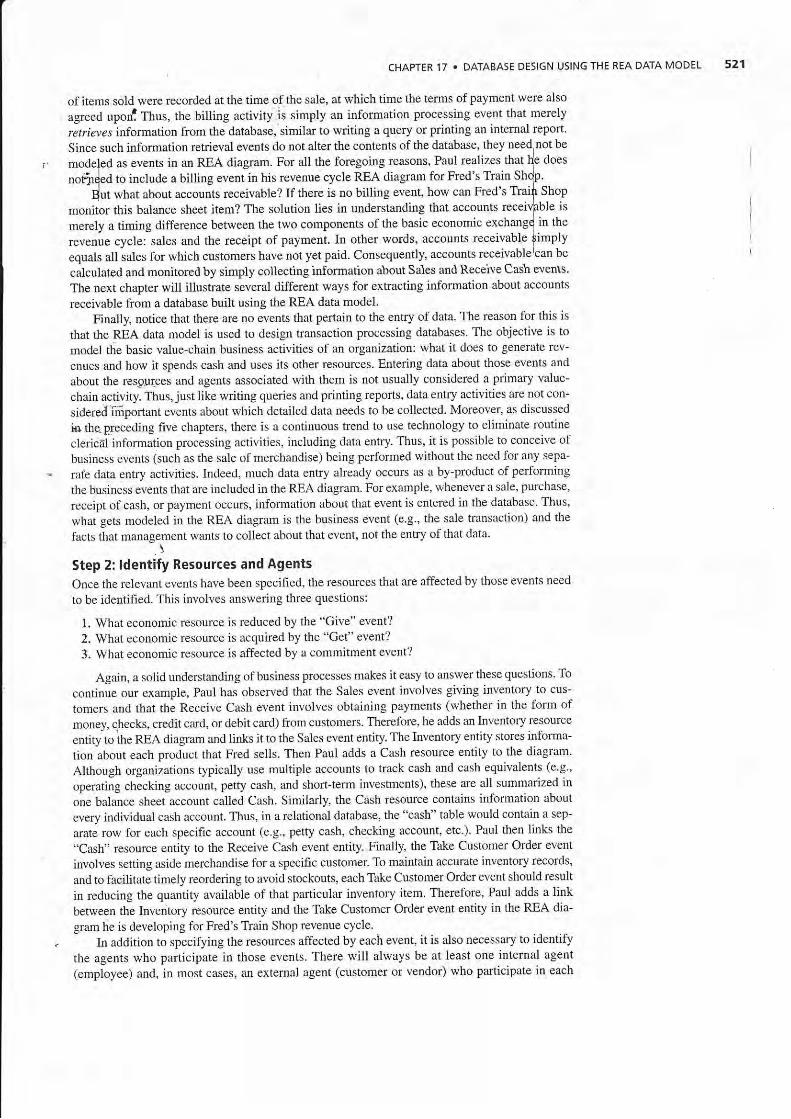
FIGURE 17-7Examples of Different
Types of Relationships
specific customer This reflects normal business practices: only one legally identifiable customer(which could be an individual or a business) is held responsible for a sale and its subsequent pay-ment. Now look at the cardinality pair next to the Sale entity: as in row three in Table l7-1, theminimum cardinality is zero, and the maximum cardinality is many, The zero minimum cardinal-ity means lhat the relaridnship is optional: A customer does not bave to be associald \trith any spe-cific sale transaction. This allows Fred's Train Shop to enter information about pfospective cus-tomers to whom it can send advertisements before they have ever purchasedlanything. Themaximum cardinality i$ many. indicating that a specific customer may, and Fred hopes will, beassociated with mulripJd sale transacrions (i.e., become a loyal customer who makes repated pur-chases from Fred's Traih Shop). Now notice that the cardinality pairs next to the Inyentory entityin Figure 17-6 have a mlnimum of one and a maximum of many for every relationship. This is thesame pattem as in row four in Table 17-1. This means that every customer order or sale transactionm xJl involye at least one inventory item (you cannot sell 'hothing") but may involve multiple dif-ferent items (e.g., a customer could purchase both a locomotive and a rail car in the same transac-tion). Finally, notice that the cardinality pat next ro the Sale entity in its relationship with the TakeCustomer Order entity is like the pattem in row one of Table 17-1. The minimum cardinality ofzero reflects the fact that an order may not )e, have beefl tumed iato an actual sale transaciion. Ihemaximum cardinality of one indicates that Fred's Train Shop fills all customer orders in full ratherthan making a number of panial deliveries.
You should be able to interpret the rest of Figure 17-6 by following the same process justpresented by comparing the cardinality pairs next to each entity to the four patterns inTable 17-1. Let us now examine what the various types of relationships mean and what theyreveal about an organizationis business practices.
THRIE TyPES OF RELATIONSH|pS Three basic types of relationships between entities arepossible, depending ot the ma-lcimum cardinality associated with each entity (the minimumcardinality does lrot matter):
7. A one-to-one (1:1) reldtionship exists when the maximurn cardinality forEach entity inthat relationship is 1 (see Figure 17-7, panel A).
Porcl A: A om-to-one (l:ll relothrriip
P0rel B: A one-to-mory | I :N) relotionship
Ponel (:0pporile one-torniry ( I lill ,el.tioirhip (rometimer refered to 05l{:l}
Ponel ll A mony-to-mlry (lil,lll ielotion,fiip

CHAPTER l7 . DATABASE DESIGN USING THE REA DATA MODEL
Z. e one+o-many (t:N) rehttionship exists when the maximum cardinality of one entity iDthe rehtionship is 1 and the maximum cardimlity for the other entity in that relationship ismany (see Figures 17-7, panels B and C).
3. A many-to-mant (M:N) relationship exists when the maximum cqrdinality for both enti-ties in the relationship is many (Figure l7-7, panel D).
]
525
i ' Figure l7-7 shows that any ofthese possibilities mlgftt describe
nalities mrs, reflect the organization's business policies. Irt us nowpossibilities depicted in Figure 17-7 means. Figure 17-7, panel A,
between the
Sales and Receive Cash events. The data modeler or database designer arbitrarily choose
Instead, the cardi-which of these three possibilities to use when depicting variouswhat each of the
a one-to-one ( 1:1)
relationship between the Sales and Receive Cash events. The maximum cardinality of 1 associ-
ated with the Receive Cash entity means ahat each Sales event (transaction) can be linled to4, mos, one Receive Cash event. This would be appropriate for an organizatiol that had a busi-
ness policy of not allowing customers to make installment payments. At the same time, the
maximum cardinality of 1 associated with each Sale event means that each payment a customer
submits-is linked to a, mo.r, one sales eyent. This would be appropriate for an organization that
had a business policy of requiring customers to pay for each sales hansaction sepamtely. Thus,
the 1:1 relationship depicted in Figure 17-7, panel A, represents the t)?ical revenue cycle rela-
tionship for tusiness-to-consumer retail sales: Customers must pay, in full, for each sales trans-
action.bef,ore they are allowed to leave the store with the merchandise they purchased. Note that
it does not matter har4, customers pay for each sales tansaction (i.e., with cash, check, credittaid,:or debit card). Regardless of the method used, there is one, and only one, payment linked to
each sales transaction and, conversely, every sales transaction is linked to one, and only one, pay-
ment from a customgr (payments made by debit and credit cards also involve the card issuer; forsimplicity, that tansfer agent is not included in Figure 17-6). If management is interested intracking the frequency of how customers choose to pay, payment method might be recorded as
an attribute of the Receive Cash event.
Panels B and C of Figure 17-7 depict two ways that one-to-many (1:N) relationships can
occur. Panel B +ows that each Sales event may be linted to many Receive Cash events. This
indicates that the organization has a business policy that allows customen to make installmentpaymelnls to the selling organization.ll the customer uses a third-party source of credit, the sell-
ing organization teceives one payment in full from that third party for that particular sales
transaction; the customer may be making installnent payments to the crcdit agency, but those
payments would not be modeled in an REA diagram for the selling organization. (Think about it:The selling organization has no way of hacking when one of its customers pays a portion of acredit card bill or makes a monthly payment on a bank loan). The situation dePicted inFigure 17-7, panel B, does not, however, mean that every sales transaction is paid for in install-
ments: The maximum cardinality ofN simply means that some sales transactions may be paid ininstallments. Panel B of Figwe 17-7 also shows that each Receive cash event is linkedto at most
one sale event. This indicates that the orgaaization has a busioess policy that requires customels
to pay ior each sales transaction separately and arc lot allowed to build up an account balance
over a period of time. Thus, Figure 17-?, panel B, represents the revenue cycle of an organization
that probably sells big-ticket items. Should a customer return and make another purchase, a
separate set of installment payments would be created in order to separately track how much has
been paid for each sales transaction.Figure l7-7, panel C, shows another type of 1:N relationship between the Sale and Receive
Cash events. In this case, each Sale event can be linked to at mos, one Receive Cash event. This
indicates that the organization has a business policy that does not permit customers to make
installment payments. Figure 17-7, panel C, also shows that each Receive Cash evett may be
linted to many different Sale events. This indicates the existence of a business policy allowing
customers to make a number of purchases during a period of time (e.g., a month) and then pay
off those purchases with one payment. The situation depicted in Figure 17-7, panel C, is quite
common, especially for business-to-business sales of nondurable goods.
Figure 17-7, panel D, depicts a many-to-many (M:N) relationship between the Sale and
Receive Cash events. It shows that each Sales event may be linkedto one or more Receive Cash

526 PART IV . THE REA DATA MODEI
events and that each Receive cash eyent may in tum be linked to one or more sale events. Thisreflects an organization that has business policies that allow customers to make installmentpayments and also permits customers to accumulate a balance representing a set of salestransactions oyer a period of time. Keep in mind, however, thatlmaximum cardinalities of N donot represent mandatory practices: Thus, for the relationship (epicted in panel D, some saleshansactions may be pai<i in full in one payment and some cuqromers may pay for each salestransaction separately. The situation depicted in Figure l7-7. pa*el D. is quite common.
i
BUSINESS MEANING OF CARD|NATmES As uored, the choice lof cardinalities is not arbitlary,but reflects facts about the organization being modeled an! its business practices. Thisinfomation is obtained during the systems analysis and conceptual design stages of the databasedesign process, Thus, Paul Stone had to clearly understand how Fred,s Train Shop conducts itsbusiness activities to ensure that Figure 17-6 was corect.
Let us now examine Figure 17-6 to see what it reyeals about Fred,s Train Shop,s revenuecycle processes. First, note that all of the agent-rvent relationships are 1:N. This is typical formost organizations: A particular agent often participates in ma[y events. For example, organiza_tions expect that oyer time a given employee will repeatedly perform a particular task.Organizations also desire their customers to make repeat orders and purchases, just as theytypically place orders with the same suppliers. However, for accountabiliry purposes, events a.reusually linked to a specific internal agent and a specific external agent; hence, the maximumcardinality on the agent side of the agent-€vent relationships in Figure 17-6 is always l. Iihowever, a particular event required the cooperation of a team of employees, the maximumcardinality on the agent side of the relationship would be many.
The minimum cardinalities associated with the agent-event relationships in Figure l7_6 alsoreflect typical business processes followed by most organizations. The figure shows that eachevent m6l be linked to an agent (a sale must iqvolye a customer, a payment must come from acustomer, etc.); hence the minimum cardinality of I on the agent side of the.relationship. Incontrast, Figure 17-6 shows that the minimum cardinality on the event side oF the agent-+ventrelationship is 0. There are several reasons why a particula.r agent need not have participated inany events. The organization may wish to store information about potential customers and alter_nate suppliers with whom it has not yet conducted any business. Information about newly hiredemployees will exist in the database p or to rheir first day on the job_ Finally, there is afundamental difference in the naturc of agent entities and event entities. Oiganizations usuailydesire to maintain information about agents indefinitely but typically store information odyabout events that have occurred during the cuflent fiscal yeal. Thus, agent entities are analogouqto master files, whereas eyent eDtities are analogous to transaction hles. At the end of a fiscalyear, the contents of eyent entities are typically archived, and the next fiscal year begins$th noinstances of that eyent. Thus, at the beginning of a new fiscal year, agents are not,Iinked to anycurrent events.
Figure 17-6 depicts M:N relationships between the inventory resource and the variouseyents that affect it. This is the typical situation for organizations, like Fred,s Train Shop, that sellmass-produced items. Most organizations kack such inventory by an identifier such as panumber, item number, or stock-keeping unit (SKU) number and do not attempt to track eachphysical instance of that product. When a sale occurs, the system notes which product number(s)were sold. Thus, the same inventory item may be linked to many different sales events. Forexample, Fred's Train Shop uses product number 15734 to refer to a particular model of a steamlocomotiye. At a given point in time, it may have five ofthose locomotives in stock. If, during thecourse of a weekend, five different customers each purchased one of those locomotives, thesystem would link product number 15734 to five sepamte sales events. Hence, the maximum car_dinality on the eyent side of the relationship is many. Of course, Fred,s Train Shop, like mostorganizations, permits (and desires) that customers purchase many different products at the sametime. For example, a customer who purchases a steam locomotive (product number 15734) riayalso purchase a box of curved kack (product number 3265). Thus, the system would link onesales event to multiple inventory items; hence the maximum cardinality on the inyentory side ofthe relationship is also many.
But what if an organization sells unique, one-of-a-kind inventory such as origirlal artwork?Such items can only be sold one time; consequently, the maximum cardinality on the event side

524 PART IV . THE REA DATA MODEL
Data modeling is not an easy task, as l-iewlett-packardlearned when it began designing a nelv database for itsaccounting and finance function. A mijor probtem wasthe same term meant different thinqs to different peop
invested in these early steps because it
accounting and finance function. A problem was thatthe same term meant different things to different people-For example, accounting used the ternl orders to refer to thetotal dollar amount of orders per time period, whereas thesales department used the term to refer to individualcustomer orders. Moreover, such confusions existed evenwithin the accounting and finance function. For example,the reporting group used the term product to refer to anygood currently sold to customers. Thus, the primary key forthi5 entity was product number. ln contrast, the forec;stinggroup used the term product to refer to any good that wasoften still in the planning stage and had no product numberassigned yet.
To solve these problems, Hewlett-packard asked the dif-ferent user groups to actively participate in the data model-ing process. The first step was to convince all users of theneed for and benefits of creating a data model for theirfundion. Then it was necessary to carefully define the scopeof the modeling effort. Hewlett-Packard found that the time
facilitated the activities of clarifying definitions and develop-ing attribute lists that took place later in the process. Thelatter activity was an iterative affair that in(luded manyrevisions. Documentation wa5 critical to this procesr. Eachmember of the modeling team and user groups had copiesof the proposed lists, which made it easier to spot inconsis-tencies in definitions.
Hewlett-Packard credits the data modeling approach ascontributing 5ignificantly to the prolect's oveiali success.Data modeling allowed the participanti to concentratefirst on understanding the essential business characteristlcsof the new system, instead of getting bogged down inspecifying the contents of relational database tab,e5. Thishelped them to identify and resolve conflicting viewpointsearly in the proces5 and paved the way for eventualacceptance of the resulting system. The key step, however,was in getting the different user groups to actively partici-pate in the data modeling process. Otherwise, the re5ult-ing data model would not have been as accurate or widelyaccepted.
\
entities being modeled. For example, ifFred's Train Shop only made sales to walk-in customersand did not take any orders ftom businesses, then Figure l7-6 would not need to ilclude the TakeCustomer Order commitment event,
Although the development of the REA diagram for Fred's Train Shop's. revenue cycle mayseem to haye been relaiively stnightforward and intuitive, data modeling is usually a complexand repetitive process. Frequently, data modelem develop an idtial REA diagmm that reflectstheir understanding of the organization's business processes, only to learn when showing it to.intended users that they had omitted key dimensions or misundemtood some operating-groce-dures. Thus, it is not unusual to erase and redraw portions of an REA diagram several timesbefore finally producing an acceptable model. One common source of misunderifijirding is theuse of different terminology by various subsets of the intended user groups. Focus 17-2 high-lights the importance of involving the eyentual users of the system in the data modeling processso that terminology is consistent.
Summary and Case Conclusion
The database design process has five stages; systems analysis, conceptual design, physicaldesign, implementation and conversion, and operation and maintenance. Because of their exten-sive knowledge of tansaction processing requirements and general business functions, account-ants should actively participate in eyery stage.
One way to perform the activities of systems analysis and conceptual design is to buildiadata model of the AIS. The REA accounting data model is developed specifically for designing adatabase to support an AIS. The REA model classifies entities into three basic categories:resources, events, and agents. An REA model can be documented io the form of an entity-relationship (E-R) diagram, which depicts the entities about which data are cdllected as

CHAPTER 17 . DATABASE DESTGN USING THE REA DATA MODEL
rcctangles and represenrs the important relationships between entities by connecting lines. Thecardinalitie5 of the relationships depicted in REA diagrams specify the minimum and maximumnumber of times an instance of one entity can be linled to an instance of the other entity partici-pating in that relationship. Cardinalities also provibe information about the basic businesipolicies an organization follows.
i Developing an REA diagram involves three stepsi First. identify the basic eyents of interest(any activity about which management wans to collecl information in order to plan, control, an(evaluate performance). Secondjdentify the resources [ffected by and the agenrs who panicipat{in those events. Third, use knowledge about the organilation's business practices to add relation.lship cadinality information to the diagam. i
Paul Stone followed these steps to develop an REA diagram for Fred's Train Shop's rev-enue cycle. He interviewed Fred to understand the store's business policies and used his generalknowledge of revenue cycle activities to draw Figure 17-6. Paul showed the diagram to Fredand explained what each portion represents. Fred indicated that the diagram correctly reflectshis store's revenue cycle activities. Paul then explained that he will proceed to use the model todesign a relational database that Fred can use to automate the analyses he cuffently doesby hand.
= a-
Key Terms
data modeling 514entity-relationship (E-R)
diagram 514entity 515 \REAdatamodel 516resources 516events 516
agents 516cardinalities 522minimumcardinality 523maximum
cardinality 523one-to-one (1:1)
relationship 524
oDe{o-many (1:N)relationship 525
manyto-many (M:N)relationship 525
Chapiter Q,uiz
1. Accounts Receivable would appear in an REA diagram as an example of which kind ofentity?a. Iesoulceb. event
2. Which of the following is NOT likely to be depicted as an entity in the REA
AIS 'N
ACTION
data model?a. customersb- sales
a. 1:1
b- l-:N
c. mvorces
d. delivery trucks
3. In most cases, the relationship between agent entities and event entities is
c. agentd. none of the above
c, M:Nd. 0:N

530 PART IV . THE REA DATA MODEL
4. If customeE pay for each sales transaction with a separate check and are notpermitted to make installment payments on any sales, then the relationship betweenthe Sales and Receive Cash events would be modeled as being which of thefollowing?
|
a. l:l c, M:Nb. 1:N aL o'N
5. Which of the following most accuately rirodels the sales of low-cost mass-producitems by a retail store?
ddI
I
6. Data modeling occurs during which stages of database design?a. systems analysis and physical designb. systems analysis and coDceptual designc. conceptual design and implementation and conversiond. physical design and implementation and conversion
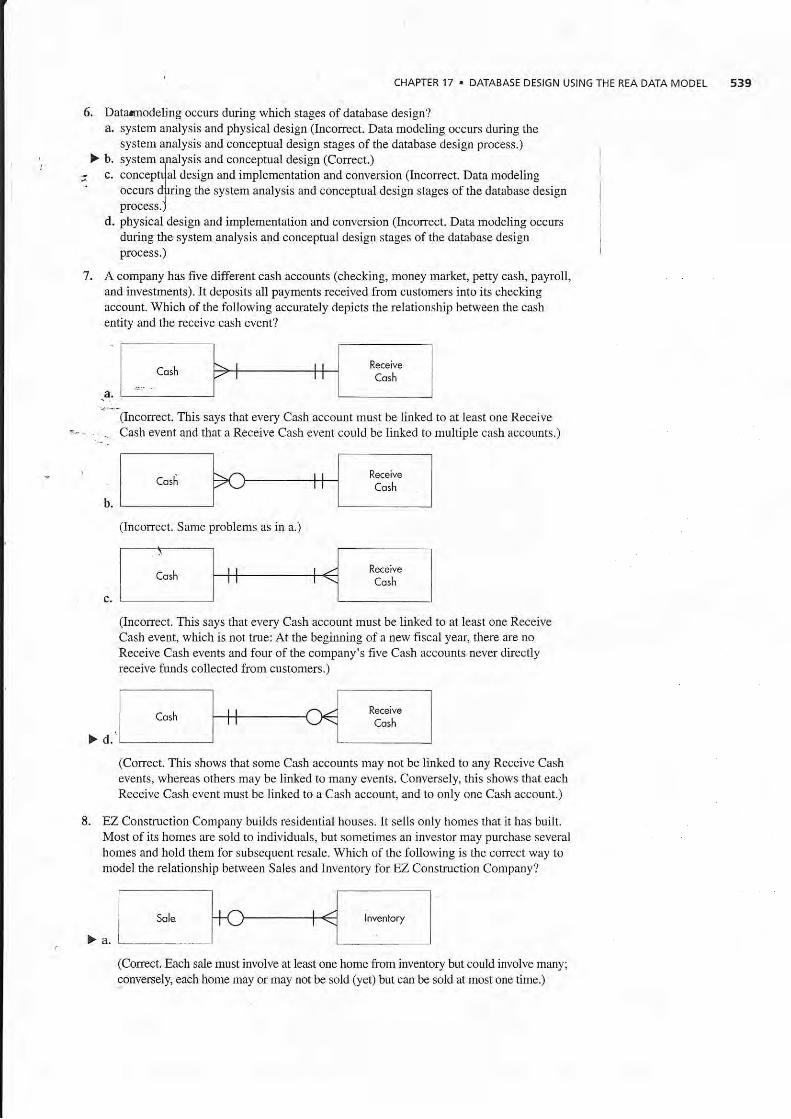
A company has five different cash accounts (checking, money market, petty cash;payroll,and investrnents). It deposits all payments received from customers into its checkingaccount. Which of the following accurately depicts the relationship between the Cashentiry and the Receive Cash event?

CHAPTER t7 . DATABASE DESIGN USING THE REA DATA MODEL
8. EZ Corstruction Company builds residential houses. It sells only homes that it built.Most of its homes are sold to individuals, but sometimes an investor may purchaseseveral homes and hold them for subsequent resale. Which of the following is thecoffect way to model the relationship between Sale and Inventory for EZConstruction Company?
Which of the following statements about the REA data model is tuue?
a. Eyery event must be linked to at least two agents.b. Every resource must be linked to at least one agent.c. Eyery event must be linked to at least two resources.d. Every agent must be linked to at least two events.
A business operates by always collecting payments for the entire amount of the sale
from customers in advance. It then orde$ the items from its suppliers, and whenthey all arrive it ships the entire order to the customer. Which of the followingdescribes the relationship between the Sales and Receive Cash events for thiscompany?
9.
10.

PART IV . THE REA DATA MODEL
Comprehensive Problem...... ,.=.=-.:
Expenditure Cycle for Fredt Irain Shop
In order for Fred to sell trains and train accessories, he frst needs to have inventory to sell. Thus,
as part of his overall engagement, Paul Stone has also prepared an REA model for the expendi-
ture cycle of Fred's Train Shop, The following paragraph describes the expenditure cyclebusiness processes of Fred's Train Shop:
Fred deals with more than one supplier and oJten places orders for muttiple itemsitthe same time- Fred takes inventory and places orders every Monday. Fred's sappliers
strive to provide outstanding service. Therefore, they nevet consolidate multipld:iitdersinto one shipment, but always ship merchandise the day after receiving an.order.
tlsually, Fred's suppliers can fill his entire order in one shipment. Occasionally,however a supplier may be temporarily out of stock of a particular item- In such cases,
the supplier shiry as much of the order as possible Lnd then ships the out-of-stotk itent
separ(ttely as soon as it becomes available, Fred pays for each order in full at one
time: that is, he does not make partiql palments on orders received. Some suppliersoffer discoant terms for early payments; Fred qlwsys takes advantage of such offers,
paying individual invoices, in full, on the appropriate date. Suppliers who do not offersuch discounts send Fred monthly ttutements listing oll orders placed the prior month-
Fred pays the entire balance indicated on the statement in one check by the specifieddue date.
Requiredhepare al REA diagram for Fred's Train Shop's expenditure cycle.

CHAPTER 17 . DATABASE DESIGN USING THE REA DATA MODEL 533
Discugsion Q,uestions
17.1. Wlry is it not necessary to mddel activities such as entering informatiori about customeN
.- or suppliers, mailing invoiceslto customers and recording invoices recelved fromi suppliers as events in an REA diagram?
i
17.2. The basic REA template incl+des lints betweer two events and links bgtween events andresources and between eventsl and agelts. Why do you think the basic dEA template does
not include d ect linlG betw$n (a) two resources, (b) two agents, or (c) betweeoresources and agenls? I
17.3, How can REA diagrams help an auditor understand a client's business processes?
17.4. Which parts of Figure 17-6 would accurately depict almost every organization's revenuecycle? Which parts would change?
17.5. What is the relationship between the things that would be represented as resourcesin an REA diagram and the different categodes of assets found on an organization'sbalan-ce _sheet? (Hinl: Are there any assets that would not be modeled as resources?
- Are there aDy resources in an REA diagram that are not listed as assets on a bal-'iinte sheet?)
'17.6- ilow woukl accounts payable be reflected in an REA diagram? Why?
17.7. What are the frye stages of the database design process? In which stages should' accountants darticipate? Why?
17.8. What is the difference between an Entity-Relationship (E R) diagram and an REA diagram?
\Problems
17.1. Joe's is a small ice-cream shop located near the local university's baseball field. Joe'sserves walk-in customers only. The shop carries 26 flavors of ice cream. Customerscan buy cones, sundaes, or shakes. When a customer pays for an individual purchase,a sales transaction usually includes just one item. When a customer pays for a familyor group purchase, however, a single sales transaction includes many different items.Al1 sales must be paid for at the time the ice cream is served. Joe's maintains severalbanking accounts but deposits all sales receipts into its main checking account.
RequiredDraw an REA diagram, complete with cardinalities, for Joe's revenue cycle.
17.2. Joe, the owner of the ice-cream shop, purchases ice cream from two vendors. Over theyears, he has developed good relationships with both vendors so that they allow Joe topay them biweekly for all purchases made during the preceding two-week period. Joe
calls in ice-cream orders on Mondays and Thursdays. The orders are delivered the nextday. Joe buys ice-cream toppings from one of several local stores and pays for each suchpurchase at the time of sale with a check from the company's main checking account.
RequiredDraw an REA diagram, complete with cardinalities, for Joe's expenditure cycle.

PART IV . THE REA DATA MODEL
17.3. Sue's Gallery sells original paintings by local artists. All sales occur in the store. Sometimescustome$ purchase more than one painting. Individual customers must pay for purchases infuIl at the time of sale. Corporate customers, such as hotels, howeyer, may pay in install-ments if they purchase rnlore than 1 0 paintings. Although Sue's Gallpry has several baokaccounts, all sales moniei are deposited intact into the main checkidg account.
Required :
l,Draw an REA diagram lpr the gallery's revenue cycle. Be sure to include cardinaliries.
I
17.4. Sue's Gallery only purctlases Iinished paintings (it never commissfons anists). It payseach artist 507o of the alheed price at the time ofpurchase, and thqi remainder afier thepainting is sold. All purchases are paid by check from Sue's main checking account.
RequiredDraw an REA diagram, complete with cardinalities, of the gallery's expenditure cycle.
17.5. Develop a data model of Fred's Train Shop's expenditure cycle activities related tothe acquisition of office equipment alld other fixed assets. Fred sometimes ordErsmultiple pieces of equipment. Vendors usually ship the eltire order but sometimes areout of stock of some items. In such cases, they immediately ship to Fred what theyhave in stock and then send a second shipment when they obtain the other items.Conversely, several orders placed within a short time pedod with the same vendormight be filled with one delivery. Assume that Fred makes installment payments formost fixed-asset acquisitions but occasionally pays for some equipment in full at thetime of purchase.
RequiredDraw an REA diagram of your data model. Be sure to include cardinalities.
17.6. Provide an example (in terms of companies with which you are familiar) {or each of thebusiness situations described by the following relationship cardinalities:
CHAPTER 17 . DATABASE DESIGN USING THE REA DATA MODEL 535
'*1.
j.
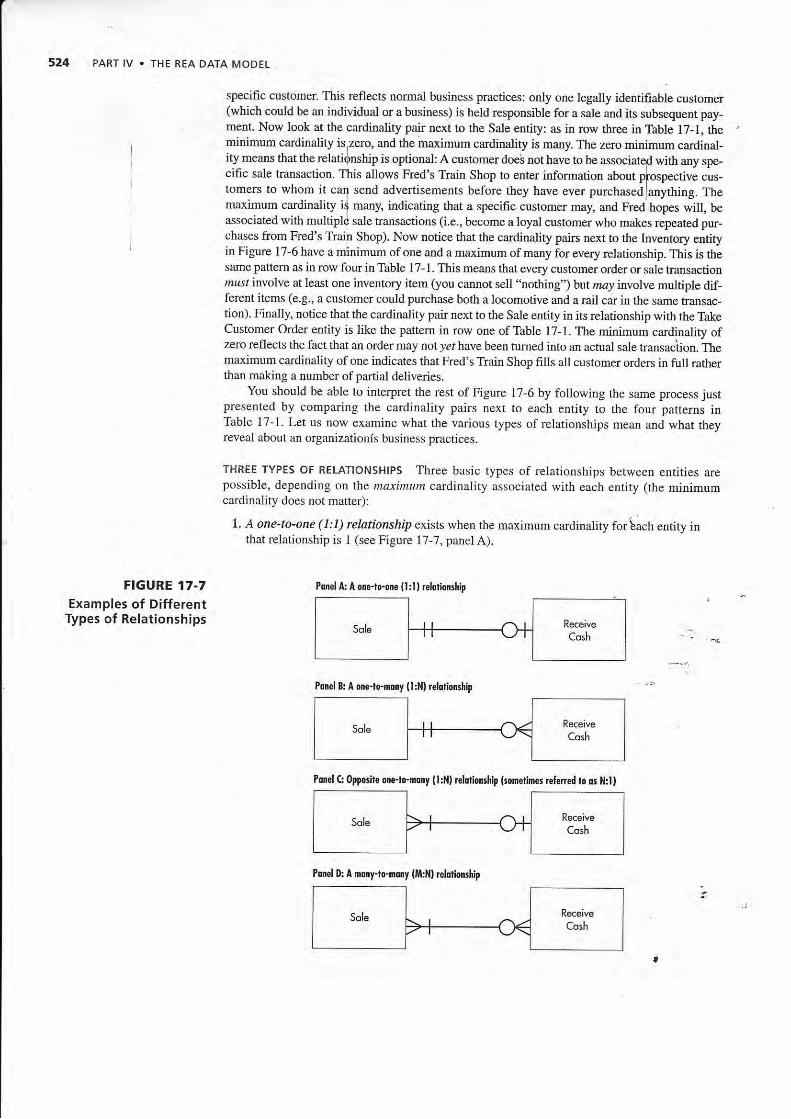
\17.7. Model the cardinalities of the following business policies:
a. The relationship between the Sale alld ReceiYe Cash events for installment sales.
b. .The relationship between the Sale and Receive Cash events at a convenience store.
c. The Take Customer Order-Sale relationship in a situation when occasionally several
shipments are required to fill an order because some items were out of stock.
d- The Sale-Inventory relationship for a custom homebuilder.
e. The relationship between the Sale and Receive Cash events for Dell computers, which
requires customers to pay the entirc amount of their purchase in advance, prior to Dellshipping the merchandise.
f. The relationship between the Sale and ReceiYe Cash events for a rctail store that has
some in-store sales paid in firll by customers at the time of the sale but that also makes
' some in-store sales to customers on crcdit, billing them later and permitting them to
make installment payments.g. The relationship betweer the Receive Inventory and Disburse Cash eYents in the case
where suppliers require payment in advance, in full,h. The relationship between the Call on Customers event (i.e., the visit by a salespe$on
to a potential customer) and the Take Customer Order event for a business that is orlyconducted door-to-door (e.g., kitchen knives, certain books, etc.) so that the only way
PART IV . IHE REA DATA MoDEL
to order the items is when a salesperson visits the customer. (I/,rrrr do you think eyerycall results in an order?)
i, The relationship between the Call on Customers and Take Customer Orders events, for a manufacturer which also accepts orders on its Web site.j. The relationship benf,een the Receivi Inventory and Disburse Cash events for acompany which rec{ives monthly bills from its suppliers for all purchases made theprevrous monrh: sorhe suppliers require payment of the entire bill, in firll, within30 days or they will not accept any subsequent orde$, but other suppliers acceptinstallment payments.
17.8. The Computer Warehouse sells computer hardware, software, and supplies (such aspaper). Individual customers just wa.lk into the store, select merchan&se, and must payfor tieir purchases in full before leaving the store. Corporate customers, however, call inorders in advance, so that the items are waiting to be picked up. Corporate customersmay charge their purchases to their account. The Computer Warehouse mails corporatecustomers monthly statements that summarize all purchases made the prior monih.Corporate customers pay the entire balance, as listed on the monthly sLtement, i,)ithone check or EFT transaction.
RequiredDraw an REA diagram of the Computer Wa.rehouse,s revenue cycle, complete withcardinalities.
17.9. TheComputer Warehouse purchases its inventory from more than a dozen differentvendors. Orders are placed yia telephone, fax, or on the supplier,s Web site. Mostorders are delivered the next day. Most orders are filled completely in one ship-ment, but sometimes a supplier is out of stock of a particulaiitem. In such situa_tions, rhe bulk of the order is shipped immediately and the out_ol._stock item isshipped separately as soon as it arives (such shipments of back ordqs are nevercombined with any new orders placed by the Computer Warehouse). The ComputerWarehouse pays for some of its purchases COD but usually pays by the l0th of themonth for all purchases made the prior month. None of its'ruppti"., allow it tomake installment payments.
RequiredDraw an REA diagram of the Computer Warehouse's expenditure cycle, complete withcardinalirie\.
17.10. Stan's Southem Barbeque Supply Store orders mass_produced barbecue products.&pmvarious suppliers. Stan,s maintains information about a contact person aieach sffieralong with all required address information. Each purchase ordet has ttre ordir number,date, tax, and total. purchase orders also contain the following information for eachproduct ordered: stock number, description, and price. The mLager of Sta[,s plaqesorders by fax seveml times a day, whenever he notices that an item is .unning iow. Somesuppliers fill each individual order separately. Others, howevel consolidate orders andfill all of them in one weekly delivery. Stan,s suppliers never make partial shipments; ifthey are out of stock of a certain irem. they wait untjl rhey obrain rhit item and then shipthe eltire order. Some suppliers require payment at the time of delivery, but othen senjStan's a monthly statement detailing all purchases during the current period. Twosuppliers allow Stan's to make installment payments for any individual purchase ordersthat exceed $20,000.
RequiredDraw an REA diagram with cardinalities for the expenditure cycle of Sran,s Southern :Barbeque Supply Store.

CHAPTER t7 . DATABASE DESIGN USING THE REA DATA MODEL 537
An important 4nalytical and problem-solving skill is th( abil-ity to adapt aqd transfer patterns learned in one settitrg toother situatiorls. This chapter explained how to develop anREA diagram for a business that sel]s tangible inventory. Yetsome busines{es provide only a service, For exampl{, thefollowing nar{ative describes Sparky's Amusement Park'srevenue cycle.,
Sparky's Amusement Park is an entertainment park run byrccent college graduates. It caters to young people and otherswho are young at hea . The owners are very interested inapplying what they have leamed in their information systemsand marketing classes to operate a park better than any other inthe grea.
To accomplish these goals, guests of the park are given apetsonal "membership card" as they enter. This card will beused to identify each guest. Assume that a new card is issuedeach_time a guest comes to the park. As a result, the systemdoes not have to tmck one person over a period of time.- _As at other parks, guests pay a flat fee for the day and then
afe able to ride all of the attractions (such as a doubleloopingroller coaster and the merry-go-round) for no exha charge. Theowners, howevei want to kack the rides each guest takes andthe attmctions the guests use. They plan to have guests swipe
their membership card through a computerized card reader,which automatically enlers information into t[e compurersystem. This should allow rhe owners to garher dlata about riefollowing: I
O Number of people who use each piece of equipment.(How many people rode the Ferris wheel today?)
o Number of times each piece of equipment is operateddaily.
O Times of day rhe attraction is busy or slow. (When was thecarousel the busiest?)
a Number of attractions each guest uses. (How manydifferent pieces of equipment did customet ll22 ide?)
o Number of rides each guest enjoys. (How many differentrides did customer 1122 enjoy? Did each guest go on anyrides more than once?)
RequiredDraw an REA diagram for Sparky's revenue cycle only.Be sure to include cardinalities. State any assumptions you hadto make.
(This problem is adapted from one developed for classroomuse by Dr. Julie Smith David at Arizona State University.)
AIS IN ACTION SOLUTIONSOuiz Key
1. Accounts Receivable would appear in an REA diagram as an example of which kind ofgntity?a. resource (Incorrect. Accounts Receivable is not a resource as defined in the
REA model, but simply equals the difference between the Sales and Receive Cashevents.)
b. event (Incorrecf. Accounts Receivable is not an eyent, but represents the differencebetween two eYents.)
c. agent (I[correct, Agents are peop]e or organizations.)) d. none ofthe above (Correct. Accounts Receivable would not appear as an entity in an
REA diagram because it represents the difference between two events.)
2, Which of the following is NOT likely to be depicted as an entity in the REAdata model?a. customers (lncorrect. Customefi are an agent entity.)b, sales (Incorect. Sales are an event entity.)

PART IV . THE REA DATA MODEL
) c. invoices (Correct. Invoices arc paper outputs of a database--{hey do not meet thedefinition of being either a resource, an event, or an agent and, therefore, are notmodpled as an entity in a REA diagram.)
d. deli{ery trucks (locorrect. Delivery trucks are hn economic resource entity.)
3, In mostlcases, the relationship between agent entities and event entities isa. I : I fr-ncorrect. Over time. agents can pan icipafe in many events. )
) b. l:N kCorrecl Over time, agents usuatly particlpate in many everts. Usually, foraccolntability purposes, an event is linked to {nly one specific internal agent and one
specffic extemal agent. Occasionally, a complgx task may be linked to a team ofintemal agents, but this is not the norm.)
c. M:N (Incorrect. This pattem may occasionally occur, but it is not the norm.)d. 0:N (Incorrect. There is no such thing as a 0:N relationship.)
4, If customers pay for each sales transaction with a separate check and are not permitted tomake installment payments on any sales, then the relationship between the Sale and
Receive Cash events would be modeled as being which of the followiDg?> a. l:1 (Correct. Each sales transaction is linked to only one payment (no installments)
and each payment is linked to only one sales transaction (separate checks).)b. l:N (Incorrect. This indicates that each sale eyent could be linked to multiple cash
receipts, implying installment payments.)
c. M:N (Incorrect. This not only indicates the possibility of installment payments butalso the use of one check to pay for multiple sales.)
d. 0:N (Incorrect. There is no such thing as a 0:N relationship.)
5. Which of the following most accurately models the sales of low-cost, mass-produced
items by a retail store?
(Incorrect. This indicates that every inventory item must be linked to at least one sale,
but that a sales transaction may consist of no inventory.)
(Incorrect. This shows that a sales transaction car consist of no inYentory items.)
(Co[ect. Each sale must involve at least one item of inventory but possibly many;
converseln each inventory item may not be linked to any sales kansaction, but a giYen
item could be linked to many sale events.)
(Incorrect. This says that every inventory item must be linked to at least one sales
transaction-this is rot true at the b€ginning of a fiscal year and also preclujes storing
information about new products prior to their being sold.)
CHAPTER'17 . DATABASE DESIGN USING THE REA DATA MODEL 539
6. Datannodeling occurs during which stages of database design?a. system analysis and physical design (Inco[ect. Data modeling occurs during the
system analysis and conceptual desigl stages of the database design process.)) b. system apalysis and conceptual design (Corect.)
; c, concepnlal design and implementation and conversion (Incorect. Data modeling- occurs dlring the system analysis and conceptual design stages of the database designpaoaess,J
d. physical design and implementation and conversion (Incorrect. Data modeling occursduring the system analysis and conceptual design stages of the database designprocess.)
7. A company has five different cash accounts (checking, money market, petty cash, payroll,and investments). It deposits all payments received from customers into its checkingaccount. Which of the following accurately depicts the relationship between the cashentity and the receive cash event?
(Inco[ect. This says that eyery Cash account must be linked to at least one Receive=- . - - Cash eyent and that a Receive Cash event could be linked to multiple cash accounts.)
(Incofiect. Same problems as in a.)
(Incorrect. This says that every Cash account must be linked to at least one ReceiveCash event, which is not true: At the beginning of a new fiscal year, there are noReceive Cash events and four of the company's five Cash accounts never dirccdyreceive funds collected ftom customeN.)
>d.(Correct. This shows that some Cash accounts may not be linked to any Receive Cash
events, whereas othem may be linked to many events. Conversely, this shows that eachReceiye Cash event must be linked to a Cash account, and to only one Cash account.)
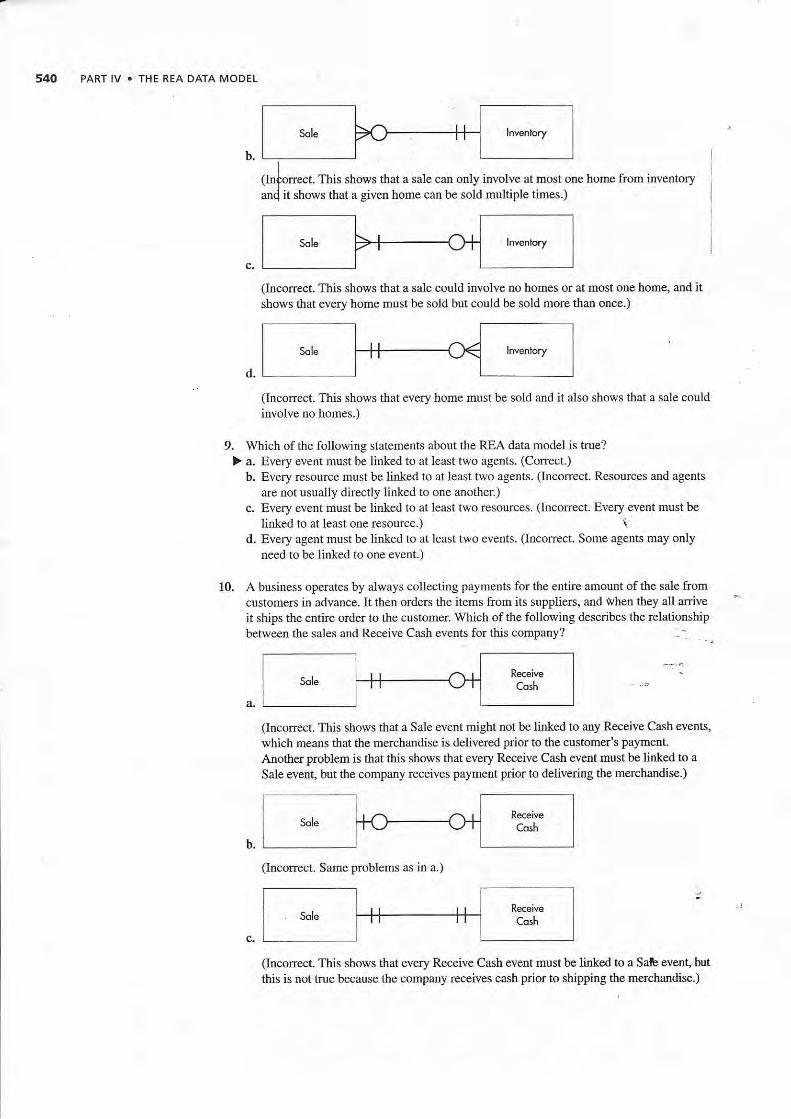
8. EZ Conskuction Company builds residential houses. It sells only homes that it has built.Most of its homes are sold to individuals, but sometimes an investor may purchase severalhomes and hold them for subsequeut resale. Which of the following is the correct way tomodel the relationship between Sales and Inventory for EZ Constuction Company?
(Correct. Each sale must involve at least one home from inventory but could involve many;conversely, each home may or may not be sold (yet) but can be sold at most one time.)
PART IV . THE REA DATA MODEL
(Incorrect. This shows that a sale could involve no homes or at most one home, and itshows that every home must be sold but could be sold more than once.)
(Incorrect. This shows that every home must be sold ard it also shows that a sale couldinvolve no homes.)
9. Which of the following statements about the REA data model is true?
> a. Every event must be linked to at least two agents. (Corlect.)b. Every resource must be lioted to at least two agents. (Incorrect. Resources aDd agents
are not usually directly linked to one another)c. Every event must be linked to at least two resources. (Incorrect. Every event must be
liDked to at least one resource.) \d. Every agent must be linted to at least two events. (Incorect. Some agents may only
need to be linked to one event.)
10. A business operates by always collecting payments for the entire amount of the sale fromcustomels in advance, It then orders the items from its suppliers, and *hen they all arriv€
it ships the entire order to the custom€r. Which of the following describes the relationshipbetween the sales and Receive Cash events for this company?
(Incorrect. This shows that a Sale event might not be linked to any Receive Cash events,
which means that the merchandise is delivered prior to the customer's pa)'rnent.
Arother problem is that this shows that every Receive Cash event must be linlcd to a
SaIe event, but the company receives payment prior to delivering the merchandise.)
(Incofiect. Same problems as in a.)
(Incorect. This shows that every Receive Cash eyent must be linked to a Sab event, but
this is not true because the company receives cash prior to shipping the merchandise.)

CHAPTER 17 . DATABAsE DESIGN USING THE REA DATA MODEL 541
Comprehensive Problem Solution
l
iI
;,>d.
(Conect. This shows that each Sale eyent must be linked to a prior Receive Cash eventbul. that a Receive Cash event may not (ye0 be linked to any Sale event.)
REA Diagram of Expenditure Cycle for Fredt Train ShopTo create an entity-relationship diagram using the REA model, follow the three basic stepsoutlined in the chapter.
1 ldentifyEventsAs e*pllained in the chapter, the first step is to identily all releyant events or tansactions using
.$-e basic "give-to-get" exchange. After talking to Fred about how he buys the inventory he needs,Paul.identifies three basic events that occur
.1. Order Inve[tory.2. Receiye Inyentory.3. Pay for Inventory which Paul decides to call "Disburse Cash."
2 ldentify Resources and AgentsNext, identify the resources involved with these events. Paul determines that there are tworesources involved with these events:
1, Inventory2. Cash
Then identify the agents or people needed to make t}lese eyents happen, remembedng that thereare usually two agerts for each eyent, one intemal to Fred's store (i.e., an employee) and oneextemal to Fred's store (i.e., the supplier). Paul lists the following agents as being involved in theOrder Inventory event:
1. Purchasing Clerk2. Supplier
The follbwing are the agents involved in the Receiye Inventory eyent:
3. Receiving Clerk4. Supplier
The following are the agents involved in the Disburse Cash event:
5. Supplier6. Cashier
3 Determine Cardinalities of RelationshipsAfter all events, resources, and agents are identified, the next step is to determine how all of theseentities inieract by determiring the cardinalities of all of the relationships between and amongrhe entities. The involves tfuee sleps:
1. Speciry cardinalities of eyent-agent relationships.2- Specify cardinalities of event-resource relationships.3. Specify cardinalities of eyent--€vent relationsbips.

l'-
I
I
PART lV . THE REA DATA MODEL
t Event-Agert Relationship Cardinalities
After talking with Fred, Paul understands that any employee can order merchandise from suppli-ers. However, one and only one elnployee is involved in each order event. Similarly, any
employee can check in deliveries frorfr suppliers. Because model train merchardjse is not heavy
or bulky, each delivery is checked in by only one employee. Fred, or his wife, signs all checks tfsuppliers, and only one signature is ever required. fius. the ma-ximum cardinality on the agerit
side of relationships between events gd intemal agents (employees) is always I . Obviously. ait
employee must participate in each e{ent: There must be some employee who places an order,
theie must be some employee who ohecks in a delivery, and either Fred or his wife must sign
each check. Thus, th e minimum cardillality on the agent side of relationships between events and
intemal agents is also l.Orders, receipts of inventory, and payments all involve suppliers. Each event must be
liirked to a particular supplier: A purchase order must identify and be sert to a supplier, a
delivery comes from some supplier, and a payment is made to some identifiable supplier.Moreover, each event can be linked to only one supplier: Each order is placed with a spec,rcsupplier, each delivery comes from a specf?c supplier, and each payment is made to a'specglcsupplier (e.g., each check is made payable to one, ard only one, supplier). Thus, the minimumand maximum cardinalities on the agent side of relationships between events and externalagents is 1.
Paul also knows that information about both intemal and extemal agents is maifltained indef-initely but that information about events is maintained only for the current fiscal year. Therefore,at the beginning of each fiscal period, no intemal agent and no extemal agent is linked to any
order, inventory receipt, or payment events. Thus, the minimum cardinality on the eyent side ofrelationships between events and agents is 0. Dudng the course of the year, however,.the samg
employee may place many differert orders or may check in many different deliveries ofmerchandise. In addition, both Fred and his wife will sign many different checks that are sent tosuppliers. Conversely, dudng the year maay orders may be placed with the sa\e supplier; many
deliveries may be received from tlre same supplier; and many payments may be made to the same
supplier. Thus, the maximum cardinality on the event side of relationships between events and
agents is N.
2 Event-Resource Relationship CardiDalities
Each order must involve at least one inventory item but could be for many different items.
Similarly, each delivery of merchandise from a supplier must involve at least one inventori-itaqbut may include many different items. Consequently, Paul depicts the minimum cardinality as 1
and the maximum cardinality as N on the inventory side of all relationships betw-epn the
inventory resource and various events.
Information about inventory is maintained indefinitely, but only orders and inventoryreceipts that occured during the curent fiscal year are maintained in the database, Thus, at the
beginning of each fiscal year the inventory entity is not linked to any order or receiYe inventory
events. During the course of the year, however, a particular inventory item may be ordered and
received many times. Thus, Paul depicts the minimum cardinality as 0 and the maximum cardi-
nality as N on the event side of all relationships between the Invertory resource and various
events affecting it.Each payment must be made from some general ledger cash account. In addition, each pay-
ment can be made ftom only one specific account. For example, a check can be linked to either
the operating checking account or the payroll checking account, but it cannot be linked to both
accounts. Thereforc, Paul sets the minimum and maximum cardinalities to 1 on the resource side
ofthe relationship between the Cash resource and the Disburse Cash event.
Information about the various cash accounts in the general ledger (operating checkirg, pgy-
roll, investment, etc.) is maintained indefinitely, but the Disburse Cash event entity contalns
information only about payments made during the cu[ent fiscal year. Therefore, at the beginningof each fiscal year, the cash resource is not Iinked to any Disburse Cash events. During the couneof the year, however, a given cash account may be linked to many different Disburse Cash events.
Thus, the minimum cardinality is 0 and the maximum cardinality is N on the evenl side of the
relationship between the Cash resource and the Disburse Cash event.

, CHAPTER '17 . DATABASE DEStcN USTNG THE REA DATA MoDEL
3 Event-Event nelationship Cardinalitiei
Orders occur before deliveries. Some orders, however, may include items that arc out of stock;when that happens, the merchandise in stock is sent immediately, and one or more additionalshipments are made for any items that the supplier had to back order. Thus, one drder can be
$nked to multiple Receive Inventory events. Coosequently, Paul assigns a minimud cardinality
{f{ and a maximum cardinality of N on the Receive Inventory side of the relationstlp betweenfie Order Inventory and Receive Inventory events.
I
Fnid's employees haye been irained to accept only deliveries for which a valfd purchaseorder exists. Thus, each Receive Inventory event must be linked to an order. Fredls suppliersnever consolidate multiple orders into one delivery; thus, each Receive Inventory qlent can belinked to at most one order event. Therefore, Paul depicts the minimum and maximum cardinal-ities on the Order Inveatory side of the relationship between the Receive Inventory and OrderInventory eYents as both being 1.
Often, Fred pays for deliveries in the following month. Thus, there may be ReceiveInventory events that are not yet linked to any Disburse Cash eyeDts. Fred always pays for deliv-eries in,full; he rrever makes installment pa],ments. Therefore, each Receive Inventory event islinked to at most one Disburse Cash event. Consequently, Paul assigns a minimum cardinality of0 and a maximum cardinality of 1 to the Disburse Cash side of the relationship between theReceiye Inventory and Disburse Cash events.
Fledls only pays for deliveries after the merchandise has been received and inspected. Thus,every Disbune Cash event must be linked to a preceding Receive Inyentory event. Oftentimes, Fredbr.his wife will write one check to pay for several deliveries received during the preceding month.Therelore, Paul draws the minimum cadinality as I and the maximum cardinality as N on theReceiye Inventory side of the relationship between the Receive Inventory and Disburse Cash eyents.' After completihg the three steps, Paul produced the following REA diagram of theexpenditure cycle of Fred's Train Shop.
543