the psychology of visualization by andrew csinger
TRANSCRIPT

The Psychology of Visualization
by
Andrew Csinger
Department of Computer ScienceUniversity of British Columbia
November 1992c
�Andrew Csinger, 1992
Abstract
This document is a review of the literature of three related areas: psychophysical visionresearch, automatic display generation, and multi-dimensional data visualization. Commonthreads are explored, and a model of the visualization process is proposed which integratesaspects of these three areas.
In the review of psychophysics, attempts to find a set of primitive perceptual channels areexplored. In the literature on automatic generation and visualization, attempts to employ thesepsychophysical findings are investigated. Finally, the proposed model is a framework whichmight facilitate this kind of cooperation.
Contents
1 Introduction 11.1 Motivation ������������������������������������������������������������������������� 11.2 Structure of this paper ������������������������������������������������������������� 1
2 Attention, Pre-attention, and the Ranking of Perceptual Tasks 22.1 Psychophysics ��������������������������������������������������������������������� 2
2.1.1 Pomerantz: Perceptual Grouping ����������������������������������������� 32.1.2 Treisman: Feature Integration Theory ������������������������������������� 52.1.3 Enns: Ecological Constraints ��������������������������������������������� 62.1.4 Montalvo: Another approach ��������������������������������������������� 6
3 Visualization: The Orchestra Metaphor 83.1 Automatic Graph Generation ������������������������������������������������������� 93.2 Iconographic Data Visualization ��������������������������������������������������� 123.3 Requirements for Effective Geometric Codes ������������������������������������� 133.4 Color Considerations ��������������������������������������������������������������� 13
4 A Model of the Visualization Process 144.1 Components ����������������������������������������������������������������������� 154.2 Channels ��������������������������������������������������������������������������� 164.3 Interactivity Requirements ��������������������������������������������������������� 17
5 Conclusions and Discussion 185.1 Final Remarks ��������������������������������������������������������������������� 20
A Murch’s Guidelines on the use of Color 21
B Weber’s Law 22
C Steven’s Law 22
List of Tables
1 Properties of the Retinal Variables ������������������������������������������������� 102 Ranking of Elementary Perceptual Tasks ������������������������������������������� 12
List of Figures
1 Bongard Problem number 6. ������������������������������������������������������� 7
Figure 1: The Visualization System 15
i
Introduction 1
1 Introduction
You don’t have to be Hungarian to be a genius, but it sure helps.
—attributed to Bela Julesz
1.1 Motivation
Humans have been engaged in visualization since the day they acquired the capability of ab-straction. There is nothing esoteric or arcane about the need for better ways of studying thesometimes subtle relationships among the variables in often large data streams, but surprisinglylittle is known about the relative merits of the different ways of going about the enterprise. Newhope springs from at least two different sources, however: Insights from modern psychophysicalstudies promise a firm theoretical foundation for future visualization techniques, and feedbackfrom practitioners in the graphic arts and the software industry provide both validation for theseearly theories and effectiveness criteria of their own.
Visualization is different things to different people. Broadly interpreted, even source listingsof programs belong to the domain of visualization [Car79]. Fractal imagery, already of interestby virtue of its graphic beauty and paradoxical complexity, is a powerful visualization tool forexploring the stability of feedback systems [Pic88]. Computer-Aided Software Engineering(CASE) tools are also visualization aids [JLSU87, LJSR89].
Many research areas in science and medicine are concerned with data of many dimensions,including those of the three spatial and the temporal axes. Nonetheless, scientists still plot two-dimensional graphs, doctors still diagnose from two-dimensional X-rays, engineers still poreendlessly through numerical data, and designers still draw two-dimensional plans [Gre88]. Thetechnology now exists to take advantage of new and old insights into human perception andimprove the presentation of multi-dimensional data to humans.
In this review, I identify two broad sub-areas of the visualization research endeavor: the use oficonographic displays to explore multi-dimensional data [Fli90, FC90, JLSU87, SBG90, GPW89,PG88, CM84] and the use of graphs to represent multi-dimensional relational data [Mac86a,Mac86b, RM90, BP90].
The concerns of these camps are quite different, but their respective explorations have broughtthem into close contact, since both have recognized the importance of the human perceptualprocessor [Ber77, Ber81, Ber83, Enn90, ER90a, ER90b, ER91, KP81, Pom81, WB85, Mur85,SCS90].
1.2 Structure of this paper
Section 2 is a survey of psychophysical research whose goal is the elaboration of the primitiveperceptual channels in the human. I discuss the perceptual principles which have been proposed tounderlie the human visual mechanism, with particular attention to issues which arise in the designof effective displays for visualization tasks: attention and the ranking of perceptual tasks. I alsorelate some of the psychophysical tests that have been employed.
2
Section 3 is a survey of work to date on visualization. Here, I pay special attention to theapplication of knowledge about perception in the subdomains of automatic display generationfor relational information, and multi-dimensional data exploration. I treat color under a separateheading because the results in this area may apply equally well to iconography and automaticgeneration.
Section 4 is further justification for the way I have structured this document. I propose a modelof the visualization process which explicitly shows the roles that knowledge from different fieldsof study might play. Having refrained this far from serious editorializing, I freely proselytize inthis section.
The final section concludes with some broad generalizations and makes some suggestions forsteps that might lead to more effective visualization techniques.
2 Attention, Pre-attention, and the Ranking of Perceptual Tasks
Much work in the field of (perceptual) psychology [Nei63, Tre90, Tre86, TG88, TCF�
90] has beenconcerned with elaborating a putative dichotomy between processes which are pre-attentive andthose which require attention. Pre-attentive processes are characterized by their speed: they arefast, typically accomplished within 100ms, suggesting that they are performed in parallel by thehuman perceptual system. Such processes are sometimes referred to as automatic, or early-visionprocesses. Although such a dichotomy is conceptually attractive, it has been increasingly unableto account for the data, and new models are appearing which refer to a continuous ranking ofperceptual difficulty. Pre-attentive tasks are at the extreme ‘easy’ end of this continuum, whiletasks requiring attention are at the other, ‘hard’ end of the scale. The possibilities afforded by sucha ranking are explored in later chapters.
Much work in the areas of automatic presentation and multi-dimensional data display andexploration has been concerned with ranking perceptual tasks in order to provide meaningfuleffectiveness and expressiveness criteria for visualization systems. The connections between theseapparently disparate fields have not, to my knowledge, been explicitly related.
2.1 Psychophysics
The early work of many researchers (cf. Pomerantz, Garner, Prinzmetal, Rock, Julesz, etc.) setsthe stage for the modern inventory of psychophysical testing techniques. The task with whichsubjects are faced is usually some variation on a search theme: a target in a display is distinguishedfrom a varying number of distractors by differences on a single dimension. The temporal latenciesof these search tasks is recorded for analysis. Followers in this paradigm seek to determine fromthe pattern of search latencies those features which are coded automatically in early vision[TG88].
In what follows I have singled out a few researchers and their work as representative of workin their field and their era. I will pay particular attention to Pomerantz, as exemplary of early work,to Treisman as a proponent of feature integration theory, and to Enns as an explorer of ecologicaleffects on pre-attention. Montalvo’s work is included here to show that similar work is being doneoutside mainstream psychology.
I superimpose the following terminology on my discussion throughout the remainder of thispaper:
Attention, Pre-attention, and the Ranking of Perceptual Tasks 3
Definition 1 Property: A property1 is a generalization of Treisman’s use of the term dimension(see Section 2.1.2).
Definition 2 Data Space: Data space is the mathematical space in which the domain-dependent data to be visualized are defined.2
Definition 3 Stimulus Space: A Stimulus space consists of some subset of the propertiesreferred to above, called stimulus dimensions. I.e., stimulus space is defined by the choice ofperceptual (visual) dimensions to which a subset of data dimensions are to be mapped.
Definition 4 Stimulus: Stimuli are composed of � variables � 1 � � 2 ��������� ��� which vary alongorthogonal stimulus dimensions.
Definition 5 Value: The values of all the variables of a stimulus instantiate that stimulus.
Definition 6 Series: A series is a (temporal) sequence Σ of stimuli
1 � 2 ��������� � .2.1.1 Pomerantz: Perceptual Grouping
Pomerantz [Pom81] discusses divided attention versus selective attention. Lamenting the looseterminology of the Gestaltists, he proposes a metric for the concept of perceptual grouping arrivedat via tests for both selective and divided attention. I will describe the tests because they are highlysuggestive of the kinds of questions one might want to ask in this paradigm, and even of how onemight go about answering some of these.
Selective Attention is measured by presenting to the subject stimuli that vary in two or moreof their component parts or dimensions. The task is to classify these stimuli according to one partwhile ignoring the other part; “if the two parts in question are dissected into separate perceptualunits, then selective attention to just one part should be possible. But if the two parts are parsedinto the same perceptual unit or group, then the two should not split, and so selective attentionshould be difficult or impossible.”
Filtering search tasks: Tests of this sort are called filtering tasks, and take the followingform. A series Σ � of stimuli 1 � 2 ��������� �� are presented to the subject, who uses only the valueof ��� in each stimulus, for some � between 1 and � to decide the membership of each stimulus inpre-assigned categories. Reaction times are recorded and averaged over the series.
In particular, Pomerantz composes stimuli of two dimensions � and � which vary in each caseover the set ��� ���! , i.e., over the set consisting of the right and left bracket characters. Four stimuli�#"$� are possible: � () � )( � (( � ))
The control series Σ % consisted of 32 stimuli which varied in only a single dimension, forinstance, �!� and � � , where � 1 is the only relevant dimension because � 2 is invariant. The
1Some researchers refer to these properties as channels, but I hesitate to employ this term because of its physiologicalimplications. The reader should feel free to consider my usage equivalent, bearing in mind that I might allow ‘channels’which are not primitive in any physiological sense.
2The distinction between data and stimulus space is explored in detail in Section 4. Psychophysics, at any rate, isconcerned only with what I refer to as stimulus spaces.

4
dependent variable was the total time required for the discrimination of all the stimuli in thecontrol series.
The filtering or selective attention series Σ � Pomerantz used consisted of 32 stimuli drawnonce again from � " � . In this series, however, both the � and � dimensions are varied, while thesubject is still required to make discriminations based upon only one of the � � values ( � � 1 inthe experiment cited by Pomerantz).
In fact, the response times for this series using the dimensions described above showed thatthe irrelevant variation in the second dimension hindered the filtering task. Pomerantz suggeststhat this can be explained by the tendency of the brackets to group, leading to a difficulty inselective attention. The same series drawn from different dimensions � � ��� � �! (as before), and� � � � � � (i.e., as before but rotated through 90 degrees) produce no effect over the controlseries. Variation in the irrelevant dimension had no effect on response times, indicating thatselective attention to these dimensions was possible, and that the components of these stimuli hadless tendency to group perceptually.
Divided Attention tasks require that subjects pay attention to at least two aspects of a stimulusand base their responses on both aspects.
Condensation search tasks: Tests of this sort are called condensation tasks, and take thefollowing form. A series Σ � of stimuli 1 � 2 �������!� �� are presented to the subject, who uses thevalues of two or more � � for some � ’s between 1 and � to decide the membership of each stimulusin pre-assigned categories. Reaction times are recorded and averaged over the series.
As in the filtering tasks described above, Pomerantz composed stimuli from two dimensionswhich varied in each case over the set ��� � �! ,
The condensation or divided attention series Σ � Pomerantz used consisted of 32 stimuli drawnonce again from � " � . Both the � and � dimensions were varied, while the subject was requiredto make discriminations based upon the values of both � 1 and � 2 .
The results revealed that the condensation task for these stimuli was easier than the filteringtask (when the parentheses were closely spaced in the stimuli). When the distance between theparentheses was increased, selective attention improved, and divided attention deteriorated. Thedivided attention test was not conducted with the stimuli composed of rotated parentheses, althoughPomerantz assures the reader that results would favor selective, and offend divided attention, onceagain due to the differing tendencies of these stimuli to group.3
To summarize: Results show that increased grouping (stronger emergent properties) leads toincreased divided attention and decreased selective attention.
Pomerantz addressed the separability of dimensions. Perceptual dimensions are said to beseparable when the time to discriminate variations on any one of the dimensions is the samewhether the dimension is shown by itself or in combination. Dimensions are configural whendiscrimination of variations on any one of the dimensions will be different when viewing thedimensions in combination. When correlated variations on data dimensions result in decreaseddiscrimination time, the stimulus dimensions to which they are mapped are said to be integral.
3To rephrase the question which experiments of this type seek to answer: the experimentor wishes to determinewhether the subject is using the component or the configural (i.e., emergent) properties of the stimulus [Gar81].

Attention, Pre-attention, and the Ranking of Perceptual Tasks 5
(Garner has called this effect a ‘redundancy gain’). Uncorrelated variation on integral dimensionsleads to increased discrimination time.
There is a subtle connection between selective and divided attention and integral stimuli andseparable dimensions. In general, when a task calls for the division of attention between correlateddata dimensions, response times will be faster for a pair of integral than for a pair of separablestimulus dimensions. For a task requiring selective attention to a dimension, integral dimensionsyield slower response times than separable dimensions.
2.1.2 Treisman: Feature Integration Theory
Treisman [TG88] defines a dimension to be a set of mutually exclusive values for a single stimulus.Thus, a line can have the value red on the color dimension, as well as the value vertical on theorientation dimension, but can not be both red and green or vertical and horizontal, since theseare values along the same dimension. Treisman uses the word feature to refer to a value on adimension if that dimension appears to be coded as a distinct and separable entity, and the featurein question is coded independently of any other features on the same dimension that are alsopresent in the field.
Experiments have been performed to gather evidence for the separability of features withina dimension [TG88] as well as the separability of one dimension from another. Treisman hy-pothesizes a model of visual perception called Feature Integration Theory to account for the data.Different feature maps (e.g., for orientation, color, etc � � � ) mark the pre-attentively signalled pres-ence or (amount) of a stimulus on a dimension, while a master map of locations must be accessedattentively to determine where in the display field a particular object lies. Such attention is alsorequired to detect the presence of stimuli which signal activity on more than one map (i.e., wherea stimulus is composed of a conjunction of features, as in a line which is both vertical and green).Weber’s law4 can be brought to bear on the search time latency data to provide support for thetheory. In this paradigm, separability is a context-dependent relation between features.
Any search function that increased substantially in time with display size was interpreted asevidence for a serial scan. Pop-out in visual search tasks occurs when the target has a uniquefeature, which is coded early in visual processing and which is not shared by the distractors. Thefollowing distinct dimensions were provided as candidate primitives in the taxonomy of earlyvision, and comprise a partial list of separable, parallel, pre-attentive features:
� colors and sufficiently distinct, different levels of contrast
� line curvature
� line tilt or misalignment
� quantitative values, e.g., length, number or proximity
� terminators and closure
� direction of movement and stereoscopic disparity (work by Nakayama and Silverman)
In particular, shape and color were found to be separable, as well as were lightness and size.Chroma and value are integral, as well as spatial location.
4See Appendix B.
6
2.1.3 Enns: Ecological Constraints
A visual search paradigm was employed by both Treisman and Enns. In one of Enns’ experiments,subjects searched for targets distinguished from the background of distractors by the luminancerelations among three polygons. Search times were low when these relations were consistentwith the interpretation of the targets as three-dimensional cubes, but search was difficult when nothree-dimensional interpretation was possible.
In another experiment by Enns et alias, subjects searched for target items distinguished from abackground field of distractors by the spatial relations between lines. When changes in these spatialrelations afforded interpretations which differed in three-dimensional orientation, search was easy(i.e., fast); when these relations were varied among items that had no obvious three-dimensionalinterpretations, search became difficult (i.e., slow).
Sensitivity to systems of line relations was demonstrated empirically [ER90b], and argued to besupportive of the hypothesis that preattentive processes can extract three-dimensional orientationfrom line drawings [ER91]. These results hint that it may be time to revise assumptions about therole and operation of the human early vision system.5 Enns suggests that the assumption “thatearly vision is designed primarily to reduce the pattern of light on the retina into a useful set ofvisual primitives” for later processing by the attentional system, might give way to a view of thepre-attentive processor as a “high-speed system that performs a ‘quick and dirty’ description ofobjects in the three-dimensional world.” Enns summarizes recent findings which he says havebeen guided by this hypothesis:
� Early vision is sensitive to the direction of light in the scene. This was shown by Ramachan-dran [Ram88] with a texture segregation task where the textural elements varied only in thedirection of their shading gradient.
� Three values of luminance are sufficient to determine direction of lighting. Enns and Rensinkshowed that smooth, ‘natural’ shading is not necessary to achieve Ramachandran’s effect.In fact, three different levels of grey are sufficient when items have three-dimensionalinterpretations.
� Luminance relations between items and their background are critical in early vision. Ennsand Rensink find that these effects are maximal when the luminance of the background isbetween the extremes of the luminances in the item. They suggest that this background-contrast relativity indicates a sensitivity of the pre-attentive system to the sign of the contrastrelation between item and background.
� Early vision’s sensitivity to three-dimensional orientation is premised on important con-straints: Search is easiest, for example, when the line junctions in the items correspond toorthogonal edges in the scene.
2.1.4 Montalvo: Another approach
Montalvo [Mon90] is looking for independent, or orthogonal stimulus dimensions, as are theother researchers cited in this paper. She is motivated, as are the automatic graph generation and
5This kind of sensitivity to scene-based properties also has repercussions on the choice of effective geometric codesfor multi-dimensional data visualization [Enn90]: see Section 3, this paper.
Visualization 7
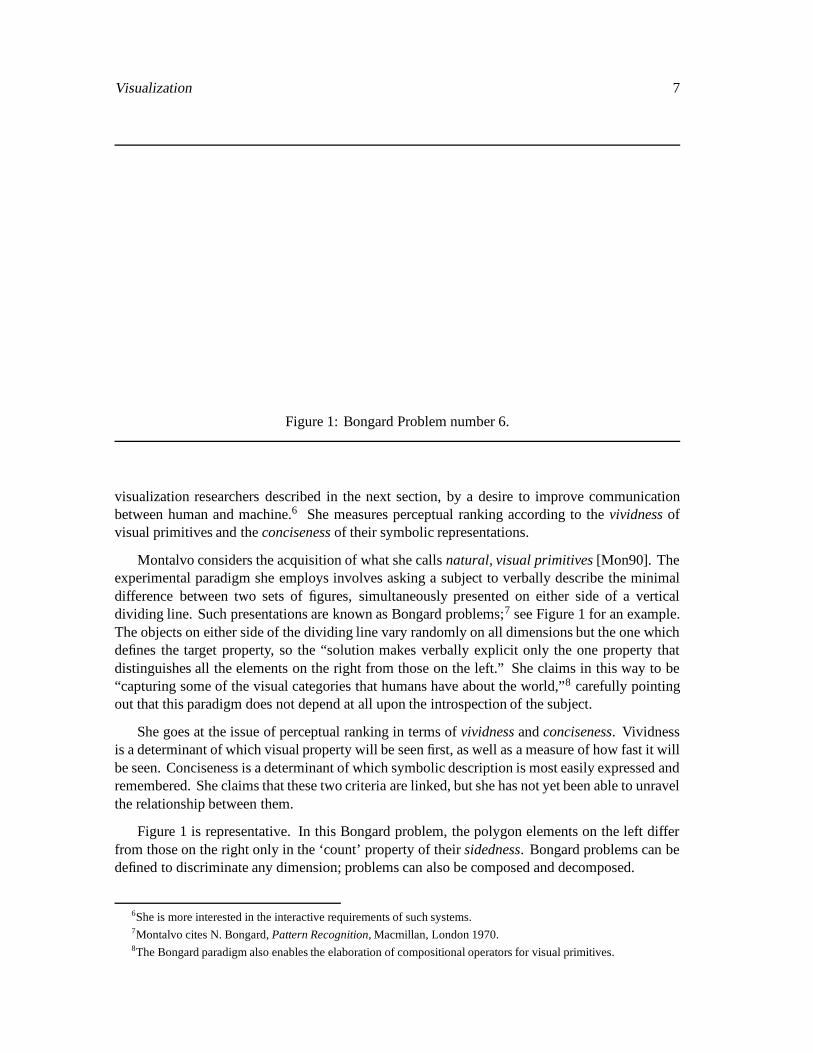
Figure 1: Bongard Problem number 6.
visualization researchers described in the next section, by a desire to improve communicationbetween human and machine.6 She measures perceptual ranking according to the vividness ofvisual primitives and the conciseness of their symbolic representations.
Montalvo considers the acquisition of what she calls natural, visual primitives [Mon90]. Theexperimental paradigm she employs involves asking a subject to verbally describe the minimaldifference between two sets of figures, simultaneously presented on either side of a verticaldividing line. Such presentations are known as Bongard problems;7 see Figure 1 for an example.The objects on either side of the dividing line vary randomly on all dimensions but the one whichdefines the target property, so the “solution makes verbally explicit only the one property thatdistinguishes all the elements on the right from those on the left.” She claims in this way to be“capturing some of the visual categories that humans have about the world,”8 carefully pointingout that this paradigm does not depend at all upon the introspection of the subject.
She goes at the issue of perceptual ranking in terms of vividness and conciseness. Vividnessis a determinant of which visual property will be seen first, as well as a measure of how fast it willbe seen. Conciseness is a determinant of which symbolic description is most easily expressed andremembered. She claims that these two criteria are linked, but she has not yet been able to unravelthe relationship between them.
Figure 1 is representative. In this Bongard problem, the polygon elements on the left differfrom those on the right only in the ‘count’ property of their sidedness. Bongard problems can bedefined to discriminate any dimension; problems can also be composed and decomposed.
6She is more interested in the interactive requirements of such systems.7Montalvo cites N. Bongard, Pattern Recognition, Macmillan, London 1970.8The Bongard paradigm also enables the elaboration of compositional operators for visual primitives.

8
3 Visualization: The Orchestra Metaphor
My eyes were drawn –dare I say: pre-attentively?– to the patterns emerging from thestring section, as the individual cellists, violinists and basists drew their bows over theirinstruments. While my ears responded to the tones of the music, I gradually grew awarethat I was hearing the melody with my eyes as well.
—The author’s reflections on a concert.
But the silliest feature of all was that if you wanted your company accounts representedas a piece of music, it could do that as well. Well, I thought it was silly. The corporateworld went bananas over it.
—Douglas AdamsDirk Gently’s Holistic Detective Agency
When Brahms is the data, one conventionally and justifiably expects to visualize it with one’sauditory system. Although much would be lost by foregoing the sound in music, I wonder howmuch appreciation the experienced concert-goer gets from the visual channel. The marvellousvisualization tool that is the orchestra9 is suggestive of some of the extant approaches to datavisualization.
“The critical requirement of an effective data display is that it stimulate spontaneous per-ceptions of structure in data.” [SBG90] The preceding remark obviously applies to all displayapplications, from word-processing to medical imaging. It certainly motivates some of the workin automatic graph layout and presentation, where salient dimensions of relational data are mappedto appropriate graphical techniques. In that paradigm, effectiveness and expressiveness criteriaderived from vision research and graphic arts knowledge [Arn74] are used to render a meaningfulview of the data. This area is further explored below.
The best known approach to data visualization is the scatterplot [GPW89, WB85]. The successof this technique is due to the ability of the early vision system to group points in space basedupon proximity and similarity in color, size and shape. Ware and Beatty have shown that up tofive dimensions can be effectively mapped to a full color scatterplot display, and suggest ways inwhich the visual effect can be maximized (See Section 3.4). Were it not for the need to detectpatterns in data of arbitrarily high dimension, efforts might have stopped here.
An increasingly popular approach to increasing the dimensionality of displays is what hasbeen variously referred to as iconography, and geometric coding. This approach employs ageneralization of the traditional graphic primitive, the pixel, into a parameterized icon whosefeatures are mapped to distinct dimensions of the data stream. A famous example which provedmore useful as a characterization of the method than representative of its success, is the ChernoffFace icon family [Che73].
9This idea is not as fanciful as it might seem: a colleague of mine has proposed just such a tool.

Visualization 9
3.1 Automatic Graph Generation
Some work which has had to progress without the benefit of a mature perceptual theory hasimplicitly recognized this by trying to establish a ranking of perceptual tasks [CM84, Mac86a,Ber83]. This kind of endeavor has been referred to as a search for a “taxonomy of measurementscales” [Ste46].
Bertin This man’s work [Ber83] is nothing short of fascinating. Though highly idiosyncratic10
and thoroughly at odds with much of the current conceptualization of perception (and notably ofcolor perception),11 there is a wealth of accumulated experience to be gleaned from his ramblingvolumes.12 He provides many examples of thought experiments which, properly conducted,could have been valid psychophysical investigations; Bertin, like many of the researchers cited inthis review, is after a system of rankings of perceptual tasks, which he refers to as the ‘level oforganization’ of the visual variables.13
The visual variables are composed of the ‘planar’ and the ‘retinal’ variables:
� The planar variables: � and �
� The ‘retinal variables’:
– Size
– Value (saturation)
– Texture
– Color
– Orientation
– Shape
The retinal variables are necessary not only in cartography, Bertin points out, but in all graphicsproblems involving more than two dimensions, where the planar spatial dimensions are alreadyin use.14 And most interesting is his analysis of the ways in which the different variables can becombined:
� A variable is associative when it promotes the recognition of emergent properties in spite ofvariation along other dimensions (variables). On the other hand, a variable is dissociative
10Though his books contain no references, he cites the work of Zipf [Zip35], who elaborated a notion of ‘mentalcost’, along the lines of the concept of perceptual rank referred to in this document.
11His usage of the term value, for instance, corresponds to the conventional concept of grey-level saturation, and theterm color to refer to any color variation including color saturation. It is apparent from a footnote on page 73, however,that Bertin is entirely aware of these divergences, and simply chooses to be different.
12Clarity is not served by reading the original French versions; these merely ramble in French!13Bertin’s syncretic terminology supports the thesis that he actually developed these ideas independently, over years
of cartographic production work. These are, as of this version of this paper, only conjectures on my part.14He further refines these notions in terms of his concepts of ‘implantation’ (whether the marks in question take the
form of points, lines, or areas), and ‘imposition’ (the roles of the variables in diagrams, networks, maps, or symbols).Another term he invents is ‘length’, referring here to ‘the number of elements or categories which we are able to identifyin a given ����� variable.”
10
Retinal Variable LevelAssociation Selection Order Quantity
Planar Dimensions� � � �
Size� � �
Value� �
Texture� � �
Color� �
Orientation� �
Shape�
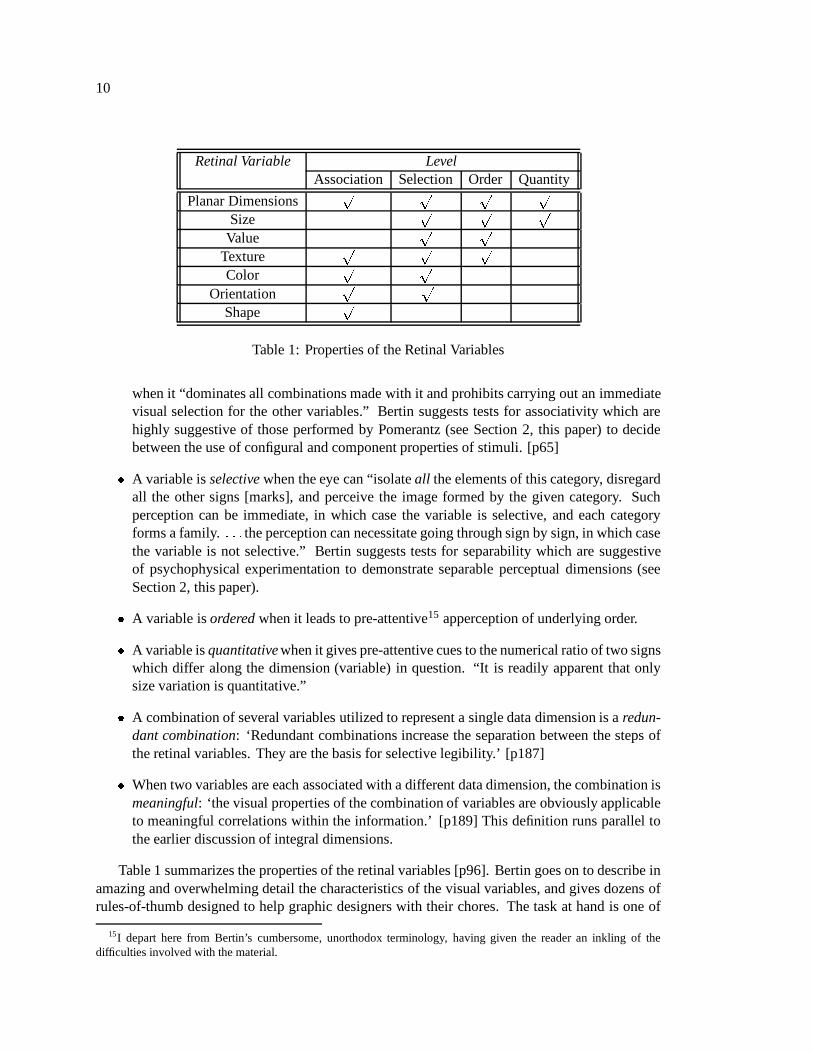
Table 1: Properties of the Retinal Variables
when it “dominates all combinations made with it and prohibits carrying out an immediatevisual selection for the other variables.” Bertin suggests tests for associativity which arehighly suggestive of those performed by Pomerantz (see Section 2, this paper) to decidebetween the use of configural and component properties of stimuli. [p65]
� A variable is selective when the eye can “isolate all the elements of this category, disregardall the other signs [marks], and perceive the image formed by the given category. Suchperception can be immediate, in which case the variable is selective, and each categoryforms a family. � � � the perception can necessitate going through sign by sign, in which casethe variable is not selective.” Bertin suggests tests for separability which are suggestiveof psychophysical experimentation to demonstrate separable perceptual dimensions (seeSection 2, this paper).
� A variable is ordered when it leads to pre-attentive15 apperception of underlying order.
� A variable is quantitative when it gives pre-attentive cues to the numerical ratio of two signswhich differ along the dimension (variable) in question. “It is readily apparent that onlysize variation is quantitative.”
� A combination of several variables utilized to represent a single data dimension is a redun-dant combination: ‘Redundant combinations increase the separation between the steps ofthe retinal variables. They are the basis for selective legibility.’ [p187]
� When two variables are each associated with a different data dimension, the combination ismeaningful: ‘the visual properties of the combination of variables are obviously applicableto meaningful correlations within the information.’ [p189] This definition runs parallel tothe earlier discussion of integral dimensions.
Table 1 summarizes the properties of the retinal variables [p96]. Bertin goes on to describe inamazing and overwhelming detail the characteristics of the visual variables, and gives dozens ofrules-of-thumb designed to help graphic designers with their chores. The task at hand is one of
15I depart here from Bertin’s cumbersome, unorthodox terminology, having given the reader an inkling of thedifficulties involved with the material.

Visualization 11
matching the characteristics of the data to be displayed to the characteristics of the visual variablesvia which they will be presented.16 These considerations lead naturally to the issues faced bythose involved with automatic display generation, which I discuss next.
Mackinlay explores effectiveness and expressiveness criteria for the automatic generation ofgraphical presentations, focussing upon explicitly relational data. The importance of this work forour present purposes is Mackinlay’s emphasis upon the human role as perceiver of the presentation.He conjectures a theory of human perception that ranks the difficulty of perceptual tasks associatedwith the interpretation of presentations; a presentation composed of tasks which are perceptually‘easy’ is more effective than one which is composed of ‘harder’ tasks.
Expressiveness criteria for a graphical language are derived from conventions about the usageof such languages; for example, the conventional interpretation for bar charts can be capturedin a language definition that indicates that bar lengths encode an ordinal relationship betweenitems: ‘The bar chart language cannot express functions that map to nominal domain sets withoutencoding additional, incorrect information.’ He gives convincing examples of success and failurein presentations along the dimensions of both expressiveness and effectiveness.
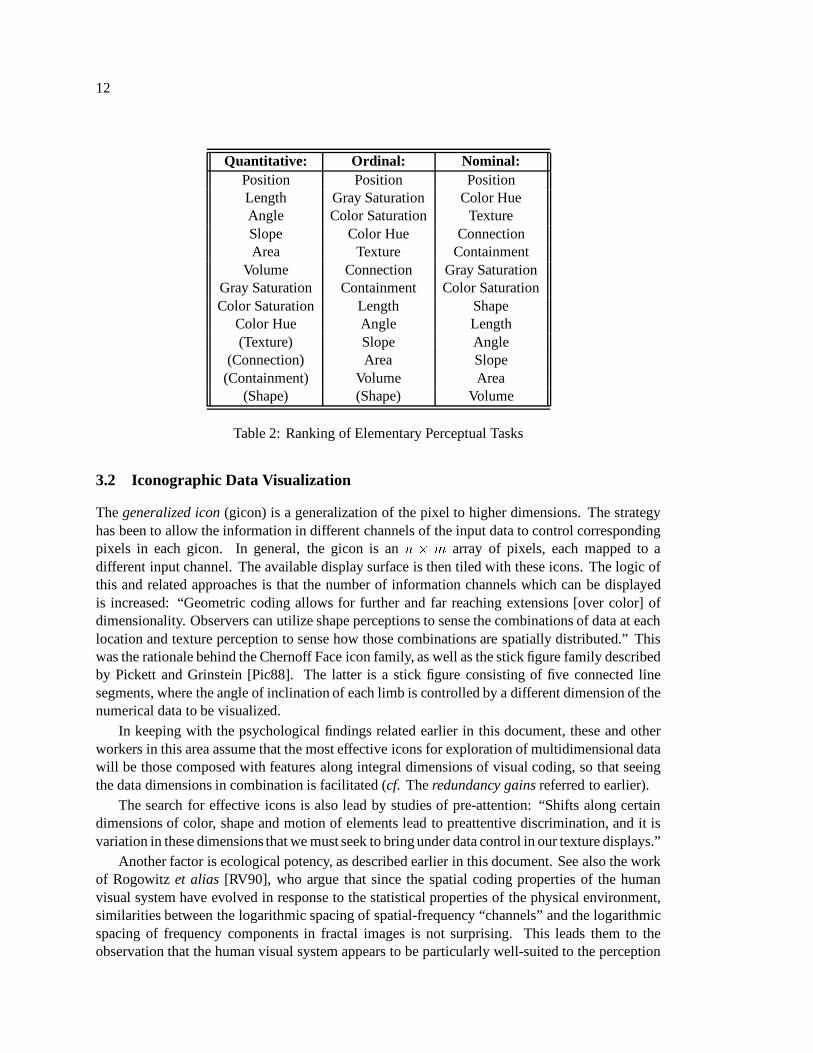
Over a dozen pages of Mackinlay’s dissertation are devoted to elaborating the ranking ofperceptual tasks. Beginning with an analysis of the work of Bertin (see above) and that of Clevelandand McGill [CM84],17 he goes on to suggest ranking criteria of his own. While Cleveland andMcGill performed psychophysical experiments to determine their ranking, Mackinlay uses thework of Julesz on texture [Jul81], Kahneman [KH81] and Ware and Beatty on color,18 as wellas that of Bertin, but does not try very hard to justify his rankings with psychophysical studies.Table 2 is a summary of these rankings, where the bracketed terms are not applicable to thedomain type in which they appear [Mac86a, p69]. This kind of knowledge has been harnessed inautomatic presentation systems to decide how best to graph different relational data.
Part of the contribution of Roth [RM90] has been to refine the taxonomy developed byMackinlay. He has subdivided ordinal types into coordinates and amounts to ensure appropriategraphic techniques in the rendering of graphs which represent information of these types. He alsoadvances further subdivisions according to the domain of membership of the information. Thus,his characterization of data recognizes that sets can belong to domains of time, space, temperatureor mass. These distinctions, says Roth, help to preserve “subtle stylistic conventions, such as usinga horizontal axis for time coordinates and a vertical axis for temperature. This characterizationcan also be helpful for judging how to group and integrate relations within pictures.”19
A fair summary of Roth’s recent work might be to say that he has been concerned withsemantics, where Mackinlay’s approach has been more or less syntactic. Others have exploredthe use of user-specified constraints to improve automatic graph layout [BP90].20 Extensions tonon-standard displays have also been proposed [FM90], and some early implementations havebeen developed.
16Bertin includes much detail about media and printing techniques that need not concern us here.17Cleveland and McGill developed the ranking of quantitative tasks given here as the first column of table 2; the
other two rankings in the table were developed during Mackinlay’s own doctoral research.18See Section 3.4, this paper.19These observations are suggestive of the information which might properly be channelled along the
�����stream
of the diagram in Section 4.20This idea is once again suggestive of the
�����channel in Section 4.
12
Quantitative: Ordinal: Nominal:Position Position PositionLength Gray Saturation Color HueAngle Color Saturation TextureSlope Color Hue ConnectionArea Texture Containment
Volume Connection Gray SaturationGray Saturation Containment Color SaturationColor Saturation Length Shape
Color Hue Angle Length(Texture) Slope Angle
(Connection) Area Slope(Containment) Volume Area
(Shape) (Shape) Volume
Table 2: Ranking of Elementary Perceptual Tasks
3.2 Iconographic Data Visualization
The generalized icon (gicon) is a generalization of the pixel to higher dimensions. The strategyhas been to allow the information in different channels of the input data to control correspondingpixels in each gicon. In general, the gicon is an � " � array of pixels, each mapped to adifferent input channel. The available display surface is then tiled with these icons. The logic ofthis and related approaches is that the number of information channels which can be displayedis increased: “Geometric coding allows for further and far reaching extensions [over color] ofdimensionality. Observers can utilize shape perceptions to sense the combinations of data at eachlocation and texture perception to sense how those combinations are spatially distributed.” Thiswas the rationale behind the Chernoff Face icon family, as well as the stick figure family describedby Pickett and Grinstein [Pic88]. The latter is a stick figure consisting of five connected linesegments, where the angle of inclination of each limb is controlled by a different dimension of thenumerical data to be visualized.
In keeping with the psychological findings related earlier in this document, these and otherworkers in this area assume that the most effective icons for exploration of multidimensional datawill be those composed with features along integral dimensions of visual coding, so that seeingthe data dimensions in combination is facilitated (cf. The redundancy gains referred to earlier).
The search for effective icons is also lead by studies of pre-attention: “Shifts along certaindimensions of color, shape and motion of elements lead to preattentive discrimination, and it isvariation in these dimensions that we must seek to bring under data control in our texture displays.”
Another factor is ecological potency, as described earlier in this document. See also the workof Rogowitz et alias [RV90], who argue that since the spatial coding properties of the humanvisual system have evolved in response to the statistical properties of the physical environment,similarities between the logarithmic spacing of spatial-frequency “channels” and the logarithmicspacing of frequency components in fractal images is not surprising. This leads them to theobservation that the human visual system appears to be particularly well-suited to the perception

Visualization 13
of fractal objects. They hint that their attempt to characterize Rorschach test images in terms offractals is meeting with at least some early success.
Some early implementations have been described in the literature. The Exploratory Visual-ization (Exvis) project [SBG90], for instance:
is a multi-disciplinary effort to develop new paradigms for the exploration of data with veryhigh dimensionality. The fundamental philosophy behind Exvis is that data representationtools should be driven by the perceptual powers of the human. In addition, the interpretationof data of very high dimensionality will be maximized only when we learn how to capitalizesimultaneously on multiple domains of human perceptual capabilities.
This project is in the early stages of exploring the possibilities of iconographic data representationusing sound attributes, along with the integration of auditory and visual displays into a singleunified data exploration facility. (See also Grinstein et alias [GPW89] and Pickett [Pic91]).
3.3 Requirements for Effective Geometric Codes
Enns has summarized some of what is known about perception as it relates to the design ofeffective icons [Enn90]. I have generalized some of his observations:
� More than � variables simultaneously displayed. The value of � might be approached fromtwo, opposite, directions. There is the question of the bandwidth of the human perceptualprocessor, which is currently unknown, and which effectively places an upper limit on � ,the dimensional limit of stimulus space.21 There is also the practical, application-dependentissue of how many variables need to be viewed in combination, which presents itself as alower bound on � .22
� Spontaneous region segregation. Appeal is made here to the correlative abilities of thehuman pre-attentive processor.
� Combination of variables for detection and identification of interactions. The stimulusdimensions chosen should encourage pre-attentive ‘pop-out’ phenomena when combined.
� Perceptual separability by early vision system of parameters. Enns points out that: “ � � � notall logically-independent perceptual properties are perceptually-independent.” Not all com-binations of stimulus dimensions will be equally effective.
3.4 Color Considerations
Color deserves a separate section in this document for several reasons. Our world is, for most ofus, a very colorful place. Color is, not surprisingly, one of the most effective stimulus dimensions.Even in the absence of a complete neurophysiological underpinning, a tremendous amount ofrule-of-thumb information is available on the use of color to accomplish various communicativetasks. It is not that the use of color in visualization is essential, but that the kind of knowledge wehave of color capabilities provokes questions about other human perceptual capacities.
21Grinstein et al. [GPW89] claim there displays can encompass at least 20 dimensions, but say little of theireffectiveness.
22At any rate, if fewer than five dimensions are to be displayed, they can be displayed quite effectively as a colorscatterplot.

14
Ware and Beatty show that it is possible for human observers to perceive five data dimensionssimultaneously [WB85]. The data they used was characterized by a hyperellipsoidal probabilitydensity distribution, but they conclude with respect to the generality of their results that: “colouris likely to be effective in assisting in the perception of correlations in multidimensional space”.Although in most cases they found that adding color was expressively equivalent to addingthree more spatial dimensions, color is not a completely heterogeneous perceptual space, and“resolution is worse in some directions than in others.” In particular, when clusters are separatedalong dimensions which have been mapped to color, perception suffers. Clusters are perceivedas distinct when they are separated by between three and five standard deviations along mostof the possible vectors; “much greater cluster separation is necessary before two clusters canbe resolved” when they are separated on [only] “a few” specific color vectors. One solution,discussed elsewhere in this paper, is to vary the mapping of variables to dimensions; they call thismapping the permutation vector, and I too employ this terminology.
They observe that users require no training to use their color-based five-dimensional visual-ization tool, but point out the importance of control over the background color, which tends toemphasize particular colors in the display, and consequently particular correlations in the data.
Murch also gives an interesting summary of the use of color, from the point of view of a graphicspractitioner [Mur85]. He distinguishes between the qualitative and quantitative uses of color, andprovides a stimulating list of guidelines for the effective use of color derived from physiological,perceptual and cognitive studies. I summarize his observations in Appendix A. Murch alsoprovides a list of the sixteen best and worst color combinations.
These guidelines are suggestive of a beginning for a database of default axioms for reasoningabout presentations of information.
4 A Model of the Visualization Process
To further motivate the unification of the areas in this literature review, I advance the followingmodel of the visualization enterprise. This model is intended as a general, covering model fora broad class of visualization activities, subsuming all the approaches discussed thus far in thispaper.
In particular, I wish to construe the visualization process as composed of the following sub-processes:
1. Determining the permutation vector. Three steps are involved in this process.
� Choose the data dimensions (i.e., the subspace of the data) to project into stimulusspace.
� Choose the perceptual properties to use as the dimensions of stimulus space.� Choose the mapping from data to stimulus space.
What I have thus far been calling the stimulus is therefore the result of applying a function tothe input data: �
� ��� � 1 � � 2 ��������� ����� � � ��� �1 � � � 2 �������!� � �� � , where � �� is the � -th
A Model of the Visualization Process 15
Kmedia
umK
K ϕ
C S
UM
Human
ϕ
R
CE - Computational EngineC - CorrelatorR - Reasonerf() - Mapper
Visualization System
Display
The World
CE
Display Processor
f(data)dataf()
f
Figure 1: The Visualization System
element of the � -place projection function. The permutation vector for a � -dimensionalstimulus space23 is thus � �
1 � �2 ��������� � � � .
2. Iterating, possibly interactively, through step 1 in order to explore the data effectively.
This approach to visualization can be characterized as the process of reducing the domain-dependent data to a suitable domain-independent stimulus, upon which can be brought to bear theresults of psychological studies. More to the point is that there is a body of domain-independentpsychological knowledge which can and should be used to derive the projection function referredto above.
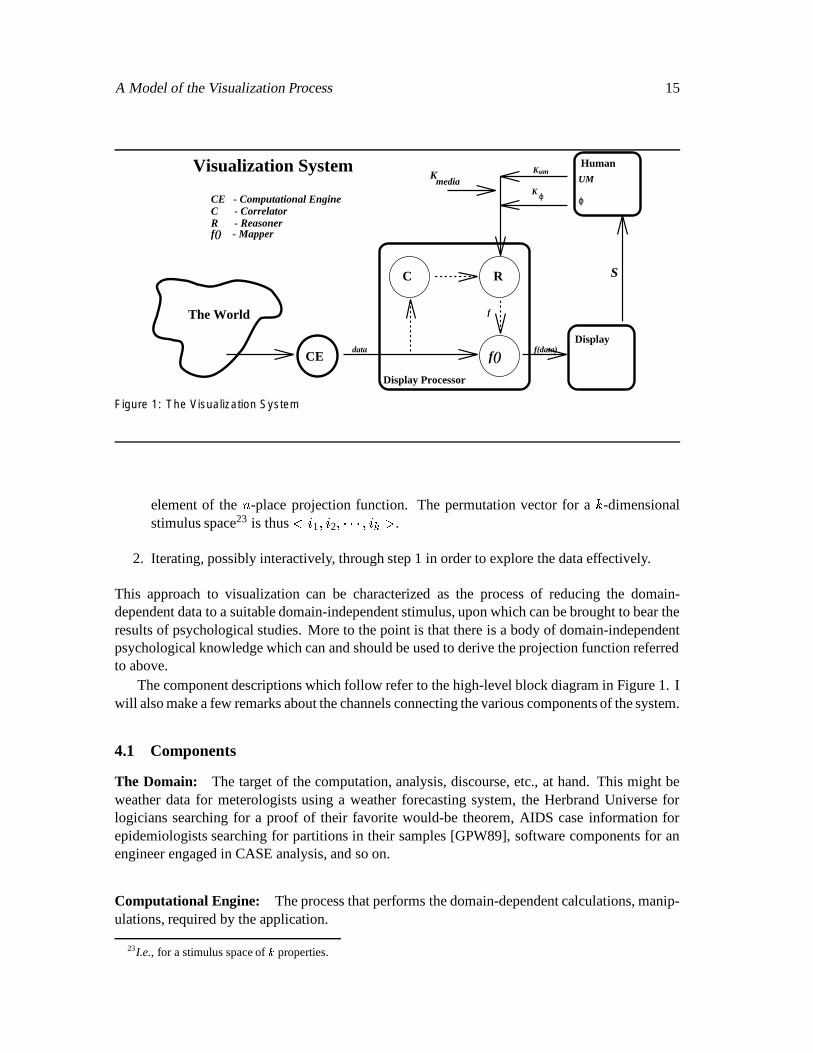
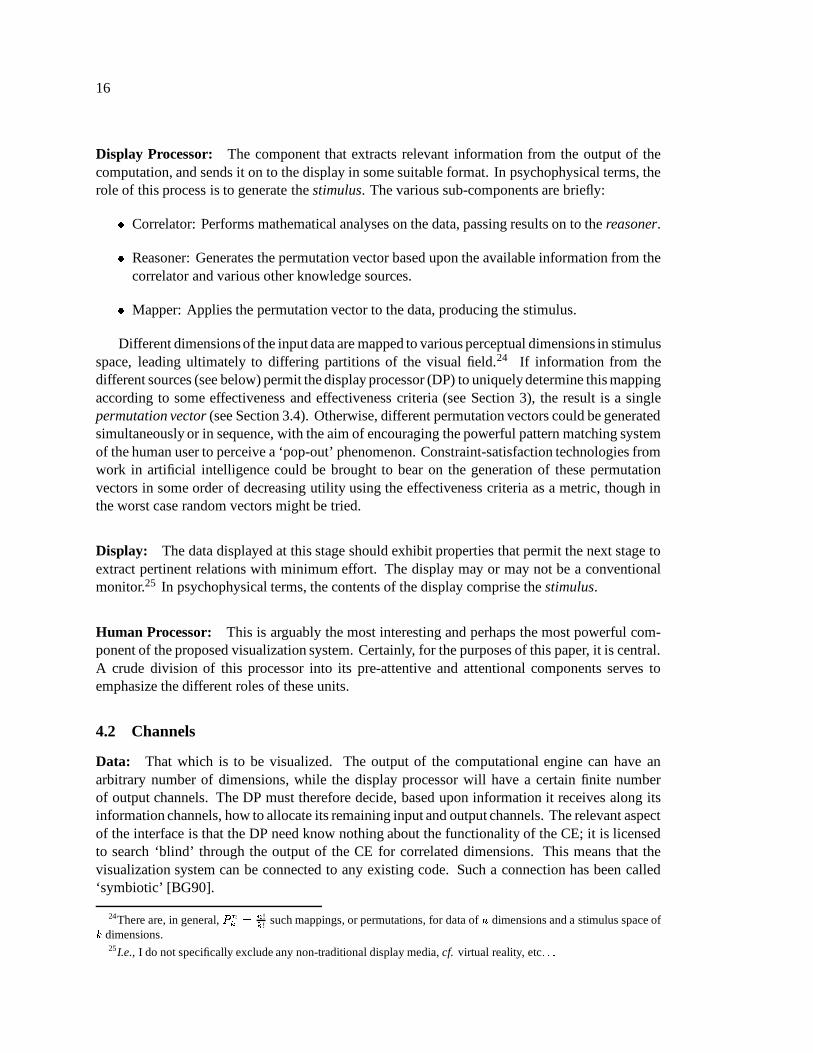
The component descriptions which follow refer to the high-level block diagram in Figure 1. Iwill also make a few remarks about the channels connecting the various components of the system.
4.1 Components
The Domain: The target of the computation, analysis, discourse, etc., at hand. This might beweather data for meterologists using a weather forecasting system, the Herbrand Universe forlogicians searching for a proof of their favorite would-be theorem, AIDS case information forepidemiologists searching for partitions in their samples [GPW89], software components for anengineer engaged in CASE analysis, and so on.
Computational Engine: The process that performs the domain-dependent calculations, manip-ulations, required by the application.
23I.e., for a stimulus space of � properties.
16
Display Processor: The component that extracts relevant information from the output of thecomputation, and sends it on to the display in some suitable format. In psychophysical terms, therole of this process is to generate the stimulus. The various sub-components are briefly:
� Correlator: Performs mathematical analyses on the data, passing results on to the reasoner.
� Reasoner: Generates the permutation vector based upon the available information from thecorrelator and various other knowledge sources.
� Mapper: Applies the permutation vector to the data, producing the stimulus.
Different dimensions of the input data are mapped to various perceptual dimensions in stimulusspace, leading ultimately to differing partitions of the visual field.24 If information from thedifferent sources (see below) permit the display processor (DP) to uniquely determine this mappingaccording to some effectiveness and effectiveness criteria (see Section 3), the result is a singlepermutation vector (see Section 3.4). Otherwise, different permutation vectors could be generatedsimultaneously or in sequence, with the aim of encouraging the powerful pattern matching systemof the human user to perceive a ‘pop-out’ phenomenon. Constraint-satisfaction technologies fromwork in artificial intelligence could be brought to bear on the generation of these permutationvectors in some order of decreasing utility using the effectiveness criteria as a metric, though inthe worst case random vectors might be tried.
Display: The data displayed at this stage should exhibit properties that permit the next stage toextract pertinent relations with minimum effort. The display may or may not be a conventionalmonitor.25 In psychophysical terms, the contents of the display comprise the stimulus.
Human Processor: This is arguably the most interesting and perhaps the most powerful com-ponent of the proposed visualization system. Certainly, for the purposes of this paper, it is central.A crude division of this processor into its pre-attentive and attentional components serves toemphasize the different roles of these units.
4.2 Channels
Data: That which is to be visualized. The output of the computational engine can have anarbitrary number of dimensions, while the display processor will have a certain finite numberof output channels. The DP must therefore decide, based upon information it receives along itsinformation channels, how to allocate its remaining input and output channels. The relevant aspectof the interface is that the DP need know nothing about the functionality of the CE; it is licensedto search ‘blind’ through the output of the CE for correlated dimensions. This means that thevisualization system can be connected to any existing code. Such a connection has been called‘symbiotic’ [BG90].
24There are, in general,����� � !
! such mappings, or permutations, for data of � dimensions and a stimulus space of� dimensions.
25I.e., I do not specifically exclude any non-traditional display media, cf. virtual reality, etc � ���
A Model of the Visualization Process 17
Information flows along several pathways in the diagram.
����
represents knowledge about human psychophysics. Psychophysical research provides awealth of information about perception, which is provided to the DP along this data channel.This channel is concerned with the pre-attentive capabilities of the human processor.
������
represents knowledge about the human user of the visualization system. Such knowl-edge has been referred to as a User Model [Csi90]. The goals and desires of the user arequite relevant to the functioning of the application; a model of the user is made accessible tothe DP along this channel. This channel is concerned with the directed, conscious, attentiveaspects of the human processor.
�� ��� �� represents knowledge about the available display media and technology. Suchknowledge must be brought to bear upon the process of generating the stimulus, since it isthe display surface which mediates the stimulus.
4.3 Interactivity Requirements
In designing a visualization system, it is not enough to consider the perceptual capacities of thehuman processor: one must perform a task-analysis of the visualization effort itself. One mightwish to supply the following modes of interaction:
� Control over the permutation vector.
� Query of a point (or region or volume or hyper-volume) on the display to ask for:
– Values at that point along dimensions in stimulus space.
– Values at that point along dimensions in data space.
The answers to these kinds of queries may involve new displays, and eventually a networkof linked displays.
� Highlighting all points mapped to a (conjunction of) stimulus dimensions.
� Highlight all points in data space which have a (conjunction of) values on arbitrary (stimulusor data) dimensions.
Declarative Graphics: It is conceivable that in at least some visualization scenarios, users mightwant to interact with the data in some non-standard ways. I have in mind here such things asdirect manipulation of the display to alter the values of the underlying data; parameterized iconsare called interactive graphical objects when communication is bi-directional through the icon.Using such icons in a visualization environment may permit direct-manipulation, what-if analysesof the data. Users could in this fashion ask ‘what-if’ questions about the data they are visualizing,and receive perceptual feedback about both their question and its answer.26
When the user of a visualization system detects a pattern which he believes to be in some waymeaningful in terms of the conceptualization of the domain he is exploring, it makes sense to allow
26This would likely involve connections not only to the display processor, as shown in Figure 1, but to the computa-tional engine as well. These issues are peripheral here, however.
18
him to identify this pattern to the system. We want the user and the system to be able to ‘talk’about this new object. This kind of declaration could be made in terms of a conjunction alongranges of either stimulus or data space, in some kind of logical calculus, or by direct graphicalinteraction with the perceptual phenomena of interest. An example of the former (using stimulusdimensions) might be:
����� ��� � red(point) � x(point, X) � � X � 100 � � blue(point)
while an example of the latter might be the mere pointing of a locator graphic device at a clusterof points in a scatter-plot.
5 Conclusions and Discussion
Or you can turn your figures into, for instance, a flock of seagulls, and the formationthey fly in and the way in which the wings of each gull beat will be determined by theperformance of each division of your company. Great for producing animated corporatelogos that actually mean something.
—Douglas AdamsDirk Gently’s Holistic Detective Agency
From the preceding exploration of the psychophysics of perception, and the overview of thevisualization undertaking, one might conclude that matters are well in hand. There is, to be sure, aconcerted effort on the parts of psychologists to elaborate the variables which figure in the humanperceptual system. There is, as well, a will on the parts of visualization practitioners to make useof these and other results. The connections, however, that would make the psychophysical resultsapply in some direct or obvious way to the visualization process remain unclear.
Observations on the Contribution of Psychophysics Classical approaches to the study ofgrouping have serious drawbacks, according to Pomerantz. They are first of all subjective, andare a scientific dead-end. The latter objection is made from the observation that these studies canonly establish the existence of a phenomenon, but fall short of ‘localizing it somewhere in thechain of events that constitutes perception’. I have two things to say about this:
� This criticism is overly harsh, especially in view of the fact that we are far from havingestablished the causal ‘chain of events that constitutes perception’. I admit that the hopeful,naive phenomenology of the classical Gestaltists has not delivered on its early promises,but this surely leaves some maneouvering room for would-be neo-Gestaltists!
� Were the full force of Pomerantz’ criticism entirely well-deserved, I would nonetheless con-sole myself with an exhaustive catalogue of perceptual modes, or ways-of-perceiving, alongwith their relative strengths and weaknesses. With such a compendium, my visualizationsystem would be able to choose the ‘best’ way to render a set of data to a user.
Feature integration theory [Tre90, Tre86, TG88, TCF�
90], in spite of the appealing simplicityof its proposed dichotomy between what is pre-attentive and what is attentive, is unable to account

Conclusions and Discussion 19
for the continuum of search times in psychophysical experiments (see Section 2, this paper). Thesuggestion is that perhaps there is a continuum of perceptual difficulty from the very easy, fast, pre-attentive to the very difficult, attention-requiring. Feature integration theory is a useful conceptualmodel, but it should not be allowed to hinder efforts to arrive at the ranking of perceptual tasksrequired by visualization practitioners.
Lessons from Psychophysics for visualization When looking for correlations between dimen-sions of the data, one may wish to map correlated dimensions to perceptually integral channels inhuman stimulus space, so that the perceptual system benefits from any redundancy gain. Whenlooking for basic differences between dimensions, one might wish to map the data dimensions toperceptually separable channels.27
The design of geometric codes might profitably proceed from an analysis of perceptuallyseparable and perceptually integrated dimensions of visual coding.
Flinn says [FC90, p39] that one way to address the issue of transforming a data stream into asmaller and more comprehensible format is to shift the burden of data reduction from the computerto the user. “The hope is that a data stream can, through a � � � change of representation, be convertedto a form which exploits the capabilities of the human visual system”. By ‘shifting the burden’ inthis fashion, I imagine designers trying to express data using techniques which fall as far to the‘easy’ end as possible along the perceptual cost continuum. The elaboration of this continuum istherefore of great interest to practitioner and theorist alike. Psychophysical data of this sort willfuel further investigations of their neurophysiological foundations, as well as provide guidelinesfor effective representation in data visualization task environments.
Ecological Potency The idea of exploiting real-world statistics (in addition to human perceptualnorms) on the premise that human perception evolved in the same statistical framework is a goodone, and should be exploited wherever possible. Thus, for instance, if animating a feature on avisualization display, it would come as no surprise to me to find that the human visual systemis more sensitive to motion which is gravity-governed28 than to other arbitrary movements offeatures along dimensions.
More Questions...
� Do the spatial dimensions need to be represented in the permutation vector in all cases?Does their a priori inclusion yield undesirable (and so far unexplored) perceptual biases?
� Are all correlations equal? Specifically, is the human perceptual pattern matcher referredto throughout this paper sensitive to correlations between dimensions of data according toone of the traditional mathematical formulations of this relation? Or is it something quitedifferent? Is there some sort of overlap? What kind? How much? It seems that humansare at least as sensitive to correlation as the mathematical definitions. So sensitive, infact, that practices have evolved in human societies that take advantage of it. Consider the
27The preceding from a conversation with Jim Enns, 1991 March 22.28I.e., motion that can be interpreted as ‘falling’.
20
well-known casino game of craps; inveterate gamblers insist against published theory eitherthat they “have a system” or that they have a “feel” for the die.29
� What is the maximum dimensionality of stimulus space? (I.e., how many properties arethere?) The recent work of Enns has demonstrated that the search for perceptual primitivesis not yet over. If there are such late-breaking discoveries in the area of visual perception,which has seen much research activity over more than a century, what then of the non-visualchannels, which are much less explored?
5.1 Final Remarks
Psychophysics is the exploration of stimulus space. Visualization is the exploration of data spacevia a suitable mapping from data to stimulus space.
The goal of psychophysics, from the visualization perspective, is a more expressive visual lan-guage with which the construction of meaningful graphical displays is facilitated. The motivationis to maximize the bandwidth of the communications channel between user and data [CCBD87].This goal is being met from one side by fundamental psychophysical studies of the limits on humanperception, and from another angle by continual improvements in the computational methods andtechnologies used to direct data to humans.
While I think that it is premature to infer neurophysiological structure from the psychophysicalstudies alluded to, I see much to be gained by a practical marriage of visualization practitionersand psychophysicists.
29There is certainly some plausibility in claiming that, due to irregularities in the physical shapes of the die, certainpatterns of throws will be more likely than others, but casino earnings testify to the expertise of die-makers!

Appendices 21
A Murch’s Guidelines on the use of Color
� Physiological Guidelines
– Avoid the simultaneous display of highly saturated, spectrally extreme colors
– Avoid pure blue for text, thin lines and small shapes
– Avoid adjacent colors differencing only in the amount of blue
– Older viewers need higher brightness levels to distinguish colors
– Colors change appearance as ambient light level changes
– The magnitude of a detectable change in color varies across the spectrum
– Difficulty in focusing results from edges created by color alone
– Avoid red and green in the periphery of large-scale displays
– Opponent colors go well together
– For color-deficient observers, avoid single-color distinctions
� Perceptual Guidelines
– Not all colors are equally discernable
– Luminance does not equal brightness
– Different hues have inherently different saturation levels
– Lightness and brightness are distinguishable on a printed hard copy, but not on a colordisplay
– Not all colors are equally readable or legible
– Hues change with intensity and background color
– Avoid the need for color discrimination in small areas
� Cognitive Guidelines
– Do not overuse color (cf. the five plus-or-minus rule)
– Be aware of the non-linear color manipulation in video and hard-copy
– Group related elements by using a common background color (set and pre-attentionin subjects)
– Similar colors connote similar meanings
– Brightness and saturation draw attention
– Link the degree of color change to event magnitude
– Order colors by their spectral position
– Warm and cold colors should indicate action levels

22
B Weber’s Law
Weber’s Law describes the amount by which the magnitude of a physical quantity � must beincreased so that the difference will be discernable with probability � . This formulation is a smallrefinement of Weber’s Law in terms of the concept of just noticeable difference [LN77].
� � ��� � � � � �
C Steven’s Law
Steven’s Law describes the relationship between an actual physical magnitude � , and its per-ceived magnitude � � � � :
� � � � ��� � �� is empirically determined for particular physical quantities. For instance, experiments show thatthe average � for length judgements range from 0.9 to 1.1; for area, from 0.6 to 0.9; for volume,from 0.5 to 0.8. When the stimuli are intended to be interpreted in one-to-one correspondence withphysical values, people are therefore more accurate at length judgements than area or volume, andare worse with volume than with area [CM84].

References 23
References
[Arn74] Rudolf Arnheim. Art and Visual Perception: A Psychology of the Creative Eye.University of California Press, Berkeley, CA, 1974.
[Ber77] Jacques Bertin. La Graphique et le Traitement Graphique de l’Information. Flam-marion, 1977.
[Ber81] Jacques Bertin. Graphics and Information Processing. Walter de Gruyter, 1981.
[Ber83] Jacques Bertin. Semiology of Graphics: diagrams, networks, maps. University ofWisconsin Press, 1983.
[BG90] Kellogg S. Booth and W. Morven Gentleman. A symbiotic approach to visualizationand the user interface. Unpublished, 1990.
[BP90] Karl-Friedrich Bohringer and Frances Newbery Paulisch. Using constraints to achievestability in automatic graph layout algorithms. In CHI’90 Proceedings, pages 43–51,April 1990.
[Car79] T.A. Cargill. A view of source text for diversely configurable software. TechnicalReport CS-79-28, University of Waterloo Computer Science Department, 1979.
[CCBD87] A. Csinger, H.da Costa, B.Forghani, and D.A.Lowther. Increasing cad throughputwith a programmable user interface. In Official Proceedings of the 3rd Int’l IMS ’87,SATECH ’87, Part I, Long Beach, CA., 1987.
[Che73] H. Chernoff. The use of faces to represent points in k-dimensional space graphically.Journal of the American Statistical Association, 68:361–368, 1973.
[CM84] William S. Cleveland and Robert McGill. Graphical perception: theory, experimen-tation and application to the development of graphical methods. American StatisticalAssociation, 79:531–554, September 1984.
[Csi90] Andrew Csinger. Implementing a theory of communications in a default reasoningframework. Master’s thesis, University of British Columbia, 1990.
[Enn90] James T. Enns. The promise of finding effective geometric codes. Conference Pre-sentation, SIGGRAPH’90, 1990.
[ER90a] James T. Enns and Ronald A. Rensink. Influence of scene-based properties on visualsearch. Science, 247:721–723, February 1990.
[ER90b] James T. Enns and Ronald A. Rensink. Sensitivity to three-dimensional orientationin visual search. Psychological Science, 1(5):323–326, September 1990.
[ER91] James T. Enns and Ronald A. Rensink. Preattentive recovery of three-dimensionalorientation from line-drawings. Psychological Review, 1991.

24
[FC90] Scott Flinn and William Cowan. Visualizing the execution of multi-processor real-time programs. In Proceedings Graphics Interface 1990, pages 293–300, Halifax,Nova Scotia, May 1990.
[Fli90] Scott Flinn. Visualizing program execution in real-time: Representing multi-processorreal-time program behavior as a statistical view of state. Master’s thesis, Universityof Waterloo, Dept. of Computer Science, Waterloo, Ontario, 1990.
[FM90] Steven K. Feiner and Kathleen R. McKeown. Coordinating text and graphics inexplanation generation. In Proceedings AAAI, pages 442–449, Boston, MA, July1990.
[Gar81] W. R. Garner. The analysis of unanalyzed perceptions. In Michael Kubovy andJames R. Pomerantz, editors, Perceptual Organization, chapter 5. Lawrence ErlbaumAssociates, 1981.
[GPW89] Georges Grinstein, Ronald Pickett, and Marian G. Williams. Exvis: An exploratoryvisualization environment. In Graphics Interface ’89, London, Canada, 1989.
[Gre88] Donald P. Greenberg. Coons award lecture siggraph87. Communications of theAssociation for Computing Machinery, 31(2), February 1988.
[JLSU87] Jeffrey Joyce, Greg Lomow, Konrad Slind, and Brian Unger. Monitoring distributedsystems. ACM Transactions on Computer Systems, 5(2):121–150, May 1987.
[Jul81] Bela Julesz. Figure and ground perception in briefly presented isodipole textures. InMichael Kubovy and James R. Pomerantz, editors, Perceptual Organization, pages27–54. Lawrence Erlbaum Associates, Hillsdale, NJ, 1981.
[KH81] Daniel Kahneman and Avishai Henik. Perceptual organization and attention. InMichael Kubovy and James R. Pomerantz, editors, Perceptual Organization, pages181–211. Lawrence Erlbaum Associates, Hillsdale, NJ, 1981.
[KP81] Michael Kubovy and James R. Pomerantz, editors. Perceptual Organization.Lawrence Erlbaum Associates, Hillsdale, NJ, 1981.
[LJSR89] David Alex Lamb, Nitin Jain, Wendy Sharp, and Arthur Ryman. Knowledge-basedand formal methods of software design: A preliminary survey for the 4thought project.Technical Report TR 74.042, IBM Canada Laboratory, September 1989.
[LN77] Peter H. Lindsay and Donald A. Norman. Human Information Processing: AnIntroduction to Psychology. Academic Press, Inc., 111 Fifth Avenue, New York, NY10003, 1977.
[Mac86a] Jock D. Mackinlay. Automatic Design of Graphical Presentations. Technical ReportSTAN-CS-86-1138, Stanford University Department of Computer Science, December1986.

References 25
[Mac86b] Jock D. Mackinlay. Automating the Design of Graphical Presentations of Rela-tional Information. Association for Computing Machinery Transactions on Graphics,5(2):110–141, April 1986.
[Mon90] Fanya S. Montalvo. Diagram understanding: The symbolic descriptions behind thescenes. In Tadao Ichikawa, Erland Jungert, and Robert R. Korfhage, editors, VisualLanguages and Applications. Plenum Publishing Corporation, 1990.
[Mur85] Gerald M. Murch. Color graphics – blessing or ballyhoo? In Ronald M. Baeckerand William A. S. Buxton, editors, Readings in Human-computer Interaction: AMultidisciplinary Approach, pages 333–341. Morgan Kaufmann, 1985.
[Nei63] U. Neisser. Decision time without reaction time: Experiments in visual scanning.American Journal of Psychology, 76:376–385, 1963.
[PG88] Ronald Pickett and Georges Grinstein. Iconographic displays for visualizing mul-tidimensional data. In Proceedings of the 1988 IEEE Conference on Systems, Manand Cybernetics, pages 514–519, Beijing and Shenyang, People’s Republic of China,1988.
[Pic88] Clifford A. Pickover. Pattern formation and chaos in networks. Communications ofthe Association for Computing Machinery, 31(2):136–151, February 1988.
[Pic91] Ronald Pickett. Integrated displays of multispectral imagery at air force geophysicslaboratory. Draft, March 1991.
[Pom81] James R. Pomerantz. Perceptual organization in information processing. In MichaelKubovy and James R. Pomerantz, editors, Perceptual Organization, chapter 6.Lawrence Erlbaum Associates, 1981.
[Ram88] Vilayanur S. Ramachandran. Perceiving shape from shading. Scientific American,259:76–83, August 1988.
[RM90] Steven F. Roth and Joe Mattis. Data Characterization for Intelligent Graphics Presen-tation. In CHI’90 Proceedings, pages 193–200, Seattle, WA, April 1990.
[RV90] Bernice E. Rogowitz and Richard F. Voss. Shape perception and low-dimension fractalboundary contours. In Bernice E. Rogowitz and Jan P. Allebach, editors, Human Visionand Electronic Imaging: Models, Methods, and Applications, February 1990.
[SBG90] Stuart Smith, R. Daniel Bergeron, and Georges G. Grinstein. Stereophonic andsurface sound generation for exploratory data analysis. In CHI’90 Proceedings, pages125–132, April 1990.
[SCS90] Frankie K. Sun, William B. Cowan, and Kellogg S.Booth. Understanding visualeffects in a windowed environment. In Proceedings Graphics Interface 1990, pages100–105, Halifax, Nova Scotia, May 1990.
[Ste46] S. S. Stevens. On the theory of scales of measurement. Science, 103:677–680, 1946.

26
[TCF�
90] Anne Treisman, Patrick Cavanaugh, Burkhart Fischer, V.S. Ramachandran, and Rudi-ger von der Heydt. Form perception and attention: Striate cortex and beyond. In LotharSpillmann and John S. Werner, editors, Visual Perception: The NeurophysiologicalFoundations, pages 273–316. Academic Press, 1990.
[TG88] Anne Treisman and Stephen Gormican. Feature analysis in early vision: Evidencefrom search asymmetries. Psychological Review, 95:15–48, 1988.
[Tre86] Anne Treisman. Properties, parts, and objects. In Boff, Kaufmann, and Thomas,editors, Handbook of Perception, volume II, pages 35–1 to 35–70. 1986.
[Tre90] Anne Treisman. Features and objects in visual processing. In Irvin Rock, editor, ThePerceptual World: Readings from Scientific American. W. H. Freeman and Company,New York, 1990. Originally November, 1986 Issue of Scientific American.
[WB85] Colin Ware and John C. Beatty. Using color as a tool in discrete data analysis. CS 21,University of Waterloo Computer Science Department, Waterloo, Canada, August1985.
[Zip35] George Kingsley Zipf. The Psycho-biology of Language. Houghton-Mifflin, Boston,MA, 1935.