the profile technical manual - assessments usaassessments-usa.com/sample/profile-tech-report.pdf ·...
TRANSCRIPT
5205 Lake Shore Drive • Waco, Texas 76710-1732 254.751.1644 • www.profilesinternational.com
The Profile Technical Manual
THE PROFILE T M TECHNICAL MANUAL
COPYRIGHT 1999, PROFILES INTERNATIONAL , IN C ., WA C O, TX 1
CONTENTS INTRODUCTION ____________________________________________________________3
Using Job Match Patterns ____________________________________________________3
An Illustration of The Profile in Use ____________________________________________5
BEHAVIORAL TRAITS_______________________________________________________7
Overview of the Behavioral Traits Section _______________________________________7
Development of the Behavioral Traits Section ____________________________________7 Revision of PS-I _____________________________________________________________________ 8 Development of the Distortion Scale _____________________________________________________ 12
Descriptive Statistics _______________________________________________________13
Reliability Analyses ________________________________________________________15 Coefficient Alpha Reliability Analysis ____________________________________________________ 15 Split-Half Reliability Analysis __________________________________________________________ 16
Validity __________________________________________________________________17 The Construct Validity Approach _______________________________________________________ 17
Intercorrelation of PS-II Scales with other Personality Instruments __________________19 The Guilford-Zimmerman Temperament Survey (GZTS) _______________________________________ 19 Gordon Personal Profile – Inventory (GPP-I) _______________________________________________ 22 Intercorrelation of PS-II Scales with the Vocational Preference Inventory (VPI)______________________ 25 The Criterion-related Validity Approach___________________________________________________ 27 Concurrent Validity __________________________________________________________________ 27 Validation of the Distortion Scale________________________________________________________ 43
Ethnicity and Gender _______________________________________________________44
Summary and Conclusions ___________________________________________________47
OCCUPATIONAL INTERESTS _______________________________________________49
Overview of the Occupational Interest Inventory_________________________________49
Development of the Occupational Interest Inventory______________________________51 Description of the Six General Occupational Themes _________________________________________ 52 Question Selection __________________________________________________________________ 54
Descriptive Statistics _______________________________________________________55
Reliability Analyses ________________________________________________________56
Validity __________________________________________________________________57 Construct Validity ___________________________________________________________________ 57 Concurrent Validity __________________________________________________________________ 60 Predictive Validity ___________________________________________________________________ 66

THE PROFILE T M TECHNICAL MANUAL
COPYRIGHT 1999, PROFILES INTERNATIONAL , IN C ., WA C O, TX 2
Ethnicity and Gender _______________________________________________________67
Summary and Conclusions ___________________________________________________71
THINKING STYLE__________________________________________________________72
Overview of the Thinking Style Test___________________________________________72
Development of the Thinking Style Section______________________________________72
Descriptive Statistics _______________________________________________________73
Reliability Analyses ________________________________________________________73
Validity __________________________________________________________________74 Validity in the Educational Environment___________________________________________________ 74 Validity in the Industrial Environment ____________________________________________________ 74
Ethnicity and Gender _______________________________________________________77
Summary and Conclusions ___________________________________________________90
Bibliography________________________________________________________________92
Appendix A: A Brief Review of The Profile Scales _________________________________94
THE PROFILE T M TECHNICAL MANUAL
COPYRIGHT 1999, PROFILES INTERNATIONAL , IN C ., WA C O, TX 3
INTRODUCTION
These days when it so easy to duplicate products and undercut prices, the key strategic advantage for most companies is the performance of their employees. Employees who are well matched to their position have higher attendance records, less turnover, higher job satisfaction and superior job performance. The benefits of enhanced person-job fit are shared by both the employee and the employer. As part of the Profiles International, Inc. line of products for employers, The Profile is designed to facilitate achieving the best possible job fit. Our clients use The Profile to develop effective work teams, to design optimal training programs based on the trainees’ style of learning, to help supervisors determine which approach will work best when working with a particular employee, to help develop succession plans, etc. The Profile is a psychometric instrument whose roots extend over the last twenty-five years. More than twenty thousand job applicants and incumbents have participated in its development. These sample groups represent a diverse cross section of ages, ethnic groups, income levels, educational levels, job titles, companies and industries. The Profile is the product of a collaboration between several test development psychologists and specialists coordinated by Profiles International, Inc. The Profile investigates several areas (Behavioral Traits, Occupational Interests, and Thinking Style) as a part of evaluating how an individual fits into a particular job. However, all of these areas are not always required to differentiate between those who will do well in a position and those who may be overly challenged by that same position. All three areas may be important for some job patterns; however, generally one or two stand out for a given job match situation. By reviewing broad areas of occupational interests, behavioral traits and thinking style, we expand our ability to discover which areas will be most effective in determining job fit for a given position. By attending to each of the three areas, we enhance the opportunity to identify the factors that will lead to the best job fit. Appendix A contains a brief overview of all of the scales within The Profile. USING JOB MATCH PATTERNS
The job match process for The Profile represents an effective approach that minimizes the time required to efficiently describe jobs, people, and their degree of match. The

THE PROFILE T M TECHNICAL MANUAL
COPYRIGHT 1999, PROFILES INTERNATIONAL , IN C ., WA C O, TX 4
descriptive process usually starts by examining the score pattern of those who are most successful within a position. This pattern of scores across the various dimensions measured by The Profile serves as the initial “success profile” upon which the job matching is based. The Profile allows concurrent study of those incumbents available, job requirement assessments by those who know the job, and a combination of these. Even with a small sample, you will have a good place to start the process and an approach that will allow you to further refine the job pattern with ongoing evaluation. It should be noted that this initial success profile is continuously updated as more empirical information becomes available. It is important for a business to continually maintain the job relevance of the process by which employees are placed. Based on this “success pattern” knowledge of what is necessary for success in a position, we can build a job match pattern for each factor. This pattern consists of a range along each scale where the scores of the most effective performers tend to fall. Because they are not absolute, the typical pattern will be three to five units wide. The farther outside this range (job pattern) a score falls, the less likely there will be a good fit of that individual to the job in regard to that particular factor. In the reports, job match is reported as a percent match to a specific job pattern. This allows for a variation between persons who may still share a good job fit to a position. By using a job pattern, it becomes easy to quickly identify where individuals will tend to fit well into positions, and where they might have adjustments to make. This information is important for both job placement and job training. The Learning Index score in the Thinking Style section is a composite of each of the other four scales. Typically, the more easily an individual processes information, the greater the pace at which they may learn those skills that are used on the job. Often, maximizing that learning means finding the approach that will make the most of their available learning skills. The scores on each scale of The Profile are reported on a STEN scale starting with a one at the low end and going to a ten on the high end. The raw scores have been normed so that the distribution of scores for the typical working population will fall on each scale with a normal distribution. In other words, on each scale about 2/3rds of the scores will fall at 4, 5, 6 or 7, and as you move toward either end of the scale, the frequency of scores will taper off.

THE PROFILE T M TECHNICAL MANUAL
COPYRIGHT 1999, PROFILES INTERNATIONAL , IN C ., WA C O, TX 5
Once a good Job Match Pattern has been established, it may be used to evaluate the match to that job for anyone who has taken The Profile. The Job Pattern is composed of a range of scores for each scale. This range represents the area where those who are expected to fit most easily into the job will score. The farther outside this range (pattern) a score falls, the less likely there will be a good fit of that individual to the job in regard to that particular factor. As mentioned earlier, job match is reported as a percent match to a specific job pattern.
The range of reported job matches will be from 25% to 95%. A match will be provided for each of the three sections (Thinking, Occupational Information, and Behavioral Traits), and for the total match. The higher the match reported, the higher the expectancy that individual will fit well into the job under consideration. Because the interpretations generated by The Profile are provided in reports written in common business language, they require no psychological interpretation by the user. This allows The Profile to be used by those with no special psychological training. While this job pattern approach to matching individuals to a job provides information of great value and should be a major part of the placement decision, remember that the results from any test should never make up more than a third of the final decision. This is especially true when accurate job performance information is available on existing employees.
AN ILLUSTRATION OF THE PROFILE IN USE
The following study is a typical application for The Profile. The results demonstrate how The Profile produces information that significantly improves the employee selection and placement process within an organization. More importantly, this process improvement saves companies a substantial amount of money and time. A large, nationwide sales company provided 43 individuals of mixed gender and ethnicity. All were salespersons and were from several locations within the United States. Some completed The Profile using a test booklet, and some took the assessment on screen. All were allowed the time they needed to complete The Profile. Forty-three completed The Profile and the instrument was scored using the Profiles International, Inc. software. Two had a distortion score of 2 so they were dropped from the process as suggested in the User’s Guide for The Profile Assessment.

THE PROFILE T M TECHNICAL MANUAL
COPYRIGHT 1999, PROFILES INTERNATIONAL , IN C ., WA C O, TX 6
The employer initially provided a list of the 12 top performers so that they could be used to develop the Job Pattern. The criterion was from an in-house process that the company routinely uses to assess the performance of their sales people. The standard software was utilized to build a Job Pattern using the 12 top performers. This was done using the software’s integral Concurrent Study process. The resulting Top Performer Job Pattern was used for all subsequent job matching. All 41 subjects (Ss) were matched against the resulting Top Performer Job Pattern with a 79% or greater matched selected as an acceptable matching point. At this time, the company provided the performance ratings for all subjects. Analysis yielded the following results: n Of those top twelve performers identified by the employer, 11 matched the
pattern at or above the matching point (selection rate, 92%) n Of the 15 bottom performers (as identified by the employer), only 3 matched
the pattern at or above the matching point (selection rate, 20%) n Of the remaining subjects who were identified as performing in the middle
range, approximately one-half matched the pattern at or above the matching point (selection rate, 52%)
To summarize:
n Approximately 9 out of 10 the top performers were selected as a good match
to the Job Pattern while 4 out of 5 of the poor performers were not selected. n While only 54% of the current sales people were selected as a good match
to the Job Pattern, 92% of the most successful sales persons were included in that selected group while only 20% of those who seem to be challenged by the position were included.
n More than half of the group of salespersons selected were proven top performers (52%)

THE PROFILE T M TECHNICAL MANUAL
COPYRIGHT 1999, PROFILES INTERNATIONAL , IN C ., WA C O, TX 7
BEHAVIORAL TRAITS
OVERVIEW OF THE BEHAVIORAL TRAITS SECTION
The PS-I and PS-II were the beginning of the Behavioral Traits section of The Profile. The PS-II represents 20+ years of ongoing factor analytic research, development and use. Taking only 30 minutes to complete, the PS-II has been administered to more than 12,000 job applicants and incumbents. PS-II consists of seven personality scales and a Positive Impression Management scale. Studies have shown that these seven dimensions of normal are significantly related to: n job performance especially sales, management, and customer service, n employee turnover, n promotion potential, n training success, and n conscientious behavior which is related to employee reliability, attendance,
punctuality, and follow through.
Although intended for use in personnel selection, it has also been used successfully for individual assessment, job placement, management development, career counseling and for team building.
DEVELOPMENT OF THE BEHAVIORAL TRAITS SECTION
The Behavioral Traits section began as the Personality Survey (PS-I) which was developed between the mid 1970’s and the mid 1980’s. The questions were derived empirically from previous factor and question analyses. Factor analytic techniques were used to extract 10 personality factors. These 10 personality scales are depicted in TABLE 1.
TABLE 1: PS-I PERSONALITY SCALES
Accommodating Emotional Adjustment Assertiveness Energy Level Attitude Independence Conscientiousness Judgement Details People Orientation
THE PROFILE T M TECHNICAL MANUAL
COPYRIGHT 1999, PROFILES INTERNATIONAL , IN C ., WA C O, TX 8
Revision of PS-I
Between the mid 1980’s and the early 1990’s, more than 15,000 job applicants and incumbents were administered PS-I. During this period, ongoing factor and item analysis, validity and reliability analysis, combined with practical considerations, indicated that PS-I needed revision. Beginning in the early 1990’s, a comprehensive research project was specifically designed to make PS-I not only more valid and reliable, but also more practical and time efficient. The procedures for accomplishing these objectives included: n Reducing scale overlap and redundancies. n Combining questions from overlapping scales into a single scale. n Eliminating scales which had proven to have very limited practical utility. n Rewriting existing questions and writing new questions to update the scales
and to reduce ambiguity.
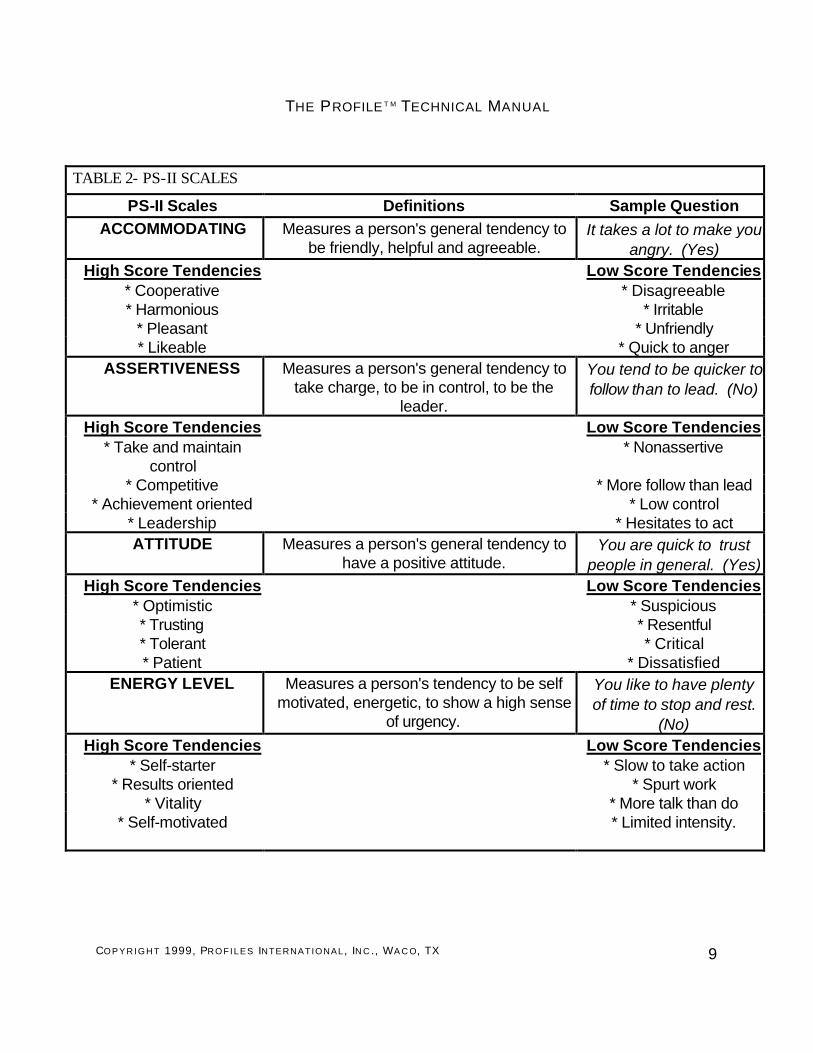
PS-I was reduced from ten scales to seven scales of 30 questions each. The revised edition of PS-I was entitled PS-II. TABLE 2 contains the name and a brief description of the seven personality scales.
THE PROFILE T M TECHNICAL MANUAL
COPYRIGHT 1999, PROFILES INTERNATIONAL , IN C ., WA C O, TX 9
TABLE 2- PS-II SCALES
PS-II Scales Definitions Sample Question ACCOMMODATING Measures a person's general tendency to
be friendly, helpful and agreeable. It takes a lot to make you
angry. (Yes) High Score Tendencies Low Score Tendencies
* Cooperative * Disagreeable * Harmonious * Irritable
* Pleasant * Unfriendly * Likeable * Quick to anger
ASSERTIVENESS Measures a person's general tendency to take charge, to be in control, to be the
leader.
You tend to be quicker to follow than to lead. (No)
High Score Tendencies Low Score Tendencies * Take and maintain
control * Nonassertive
* Competitive * More follow than lead * Achievement oriented * Low control
* Leadership * Hesitates to act ATTITUDE Measures a person's general tendency to
have a positive attitude. You are quick to trust
people in general. (Yes) High Score Tendencies Low Score Tendencies
* Optimistic * Suspicious * Trusting * Resentful * Tolerant * Critical * Patient * Dissatisfied
ENERGY LEVEL Measures a person's tendency to be self motivated, energetic, to show a high sense
of urgency.
You like to have plenty of time to stop and rest.
(No) High Score Tendencies Low Score Tendencies
* Self-starter * Slow to take action * Results oriented * Spurt work
* Vitality * More talk than do * Self-motivated * Limited intensity.

THE PROFILE T M TECHNICAL MANUAL
COPYRIGHT 1999, PROFILES INTERNATIONAL , IN C ., WA C O, TX 10
PS-II Scales Definitions Sample Question
INDEPENDENCE Measures a person's general tendency to make their own decisions, to be self-reliant,
slow to follow the crowd.
You prefer as little supervision as possible.
(Yes) High Score Tendencies Low Score Tendencies
* Adventurous * Seeks support * Slow to follow * Cautious
* Slow to conform * Predictable * People oriented * Reserved
DECISIVENESS1 Measures a person’s general tendency to make decisions quickly from available
information.
You have a forceful-strong-willed personality.
(Yes) High Score Tendencies Low Score Tendencies
*Quick target *Makes conservative decisions
*Confident of decisions *Pursue problems slowly *Will take risks *Carefully analyzes
before deciding
MANAGEABILITY1 Measures a person’s general tendency to follow policies and accept supervisors.
It takes a lot to get you into an argument. (Yes)
High Score Tendencies Low Score Tendencies *Cooperative *Generally cautious with
authority figures *Works within rules *Defends point of view
*Comfortable with authority *Can be defensive toward authority
JUDGEMENT Measures a person's general tendency to be objective, realistic, to show consistent
judgement.
You are touchy about some things. (No)
High Score Tendencies Low Score Tendencies * Sensible * Subjective
* Common sense * Wishful thinking * UNEMOTIONAL * Inconsistent judgement
* Mental toughness * Emotional thinking

THE PROFILE T M TECHNICAL MANUAL
COPYRIGHT 1999, PROFILES INTERNATIONAL , IN C ., WA C O, TX 11
PS-II Scales Definitions Sample Question PEOPLE
ORIENTATION Measures a person's general tendency to be
people oriented, to be socially active and outgoing
You like to participate in many social activities.
(Yes) High Score Tendencies
Low Score Tendencies
* Socially outgoing * Socially quiet * Extroverted * Shy
* People oriented * Reserved * Approachable * Low key
1Manageability and Decisiveness scales added to PS-II (see text) Addition of the Decisiveness and Manageability Scales Two additional scales were developed from a factor analysis of the behavioral trait items. A review of the items suggested that they be named decisiveness and manageability. These factors were regarded as second-order factors. Psychologically, a second-order factor is a broader dimension of personality. Therefore, a more complete description and understanding of a profile may be obtained by knowing all of the scores, including manageability and decisiveness. Yet, even with the inevitable interrelationship between the personality scales, each scale is important and adds individually to the overall robustness of the final result. A study was completed to compare the California Personality Inventory (CPI) with Decisiveness and Manageability. The subjects were 215 sales executives of mixed gender. The results of this study are shown in Table 3, and the significant findings summarized below. The California Personality Inventory (CPI) scales that correlated with Manageability and Decisiveness with a significance of .01 are listed here with a brief description of each. Manageability Responsibility: Reasonable Take duties seriously Socialization: Comfortably accepts ordinary rules Finds it easy to conform

THE PROFILE T M TECHNICAL MANUAL
COPYRIGHT 1999, PROFILES INTERNATIONAL , IN C ., WA C O, TX 12
Self-control: Tries to control emotion and temper Takes pride in being self-disciplined Good Impression: Wants to make a good impression Tries to please others Psychological-mindedness: Good at understanding how people feel & think Decisiveness Dominance: Confident Assertive Task-oriented Capacity for Status: Ambitious and Independent Sociability: Sociable Likes to be with people Self-acceptance: Has a good opinion of self Independence: Self-sufficient Resourceful Detached Self-control: Tries to control emotion and temper Takes pride in being self-disciplined It was felt that these relationships were a good reflection of both manageability and decisiveness, so the scales were added to the behavioral traits section of The Profile.
Development of the Distortion Scale
In addition to the seven personality scales described in TABLE 2, PS-II contains a Positive Impression Scale. This scale is represented in The Profile as the Distortion scale. The Positive Impression Management Scale was designed to measure a person’s tendency to create an exaggerated false positive impression. This scale consists of 8 questions and was developed rationally using questions endorsed consistently “Yes” or “No” by a sample of 2322 job applicants.

THE PROFILE T M TECHNICAL MANUAL
COPYRIGHT 1999, PROFILES INTERNATIONAL , IN C ., WA C O, TX 13
For example, 98% of this sample responded “Yes” to the following question; “Have you ever been angry at anyone?” It can be inferred that an applicant who responds “No, I have never been angry at anyone” is probably attempting to create a false positive impression. Therefore, an incorrect response to any one or more of these eight questions is a highly infrequent occurrence. TABLE 4 indicates the percentage of the total sample that responded “yes” or “no” for each question.
TABLE 4: PERCENTAGE OF ENDORSEMENT FOR EACH POSITIVE IMPRESSION QUESTION
(N = 2322)
Percent PI Question Numbers Yes No
Question 1 98% *2% Question 2 97% *3% Question 3 95% *5% Question 4 95% *5% Question 5 92% *8% Question 6 *92% 8% Question 7 90% *10% Question 8 90% *10%
Average percent 94% 6% *Indicates the direction in which the question is keyed for a Positive Impression
response
According to TABLE 4, the range of PI responses for the eight questions was from a low of 02% to a high of 10% for a sample of 2322 job applicants. The average PI response was 6%.
DESCRIPTIVE STATISTICS
Between 1992 and 1998, more than 12,000 job applicants and incumbents were administered PS-II. This sample represents a cross section of ages, income levels, and educational levels and a diverse range of positions, companies and industries. These scores have been analyzed with respect to certain requirements that must be met in order

THE PROFILE T M TECHNICAL MANUAL
COPYRIGHT 1999, PROFILES INTERNATIONAL , IN C ., WA C O, TX 14
for the test to be useful for practical purposes. The first, and most basic of these is that the test effectively distinguishes one examinee from another. A test that assigns all examinees the same score is useless. An effective test spreads examinees across the score scale in as even a way as possible. Two kinds of statistics are helpful in determining whether this is the case. The first type measures the location or central tendency of the score distribution. The mean, the median and the mode are three such statistics. Each measures location of the center of the score distribution, which would ideally be near the center of the allowed range. The second set of statistics indicates the extent to which scores are spread around the center of the distribution and across the score range. The standard deviation, minimum score, maximum score, and standard error all characterize the “scatter” of the score distribution, or the ability of the test to distinguish examinees. TABLE 5 contains descriptive statistics for the nine personality scales and the Positive Impression Scale. Appendix B contains raw score percentile norms.
TABLE 5- BEHAVIORAL TRAITS, DESCRIPTIVE STATISTICS
(N = 2950) Standard Standard
PS - II Scales Mean Median Mode Deviation Minimum Maximum Error
Accommodating 20.9 21 20 3.4 12 28 .36 Assertiveness 20.6 22 23 4.9 3 28 .52 Attitude 21.1 21 21 3.7 11 28 .39 Energy Level 20.4 20 20 4.3 10 28 .45 Independence 13.3 14 19 5.8 1 25 .61 Judgement 21.5 22 23 4.5 6 28 .47 People Orientation
21.4 23 26 5.9 2 29 .62
Positive Impression
.64 0 0 .94 0 4 .10
Decisiveness 20.1 20 20 4.1 3 28 .43 Manageability 21.8 22 23 4.9 4 28 .57

THE PROFILE T M TECHNICAL MANUAL
COPYRIGHT 1999, PROFILES INTERNATIONAL , IN C ., WA C O, TX 15
RELIABILITY ANALYSES
No measure can be of much value unless it measures in a reliable or consistent manner. Reliability refers to the consistency of test scores obtained by the same person when re-tested with the same test on different occasions. Since all types of reliability are concerned with the degree of consistency between two independently derived sets of test scores, they can all be expressed in terms of a correlation coefficient. A correlation coefficient expresses the degree of relationship between two variables. This relationship is expressed as a decimal number ranging from .00 to 1.00 where 1.00 indicates perfect reliability and .00 indicates the absence of reliability. Although no test is a perfectly reliable instrument, test reliability correlation coefficients should be in the .70’s, .80’s and .90’s. Two methods were used to measure the internal consistency reliability of the PS-II scales: coefficient alpha and split-half reliability analysis.
Coefficient Alpha Reliability Analysis
Coefficient alpha indicates the consistency of responses to individual test questions. The higher a test’s coefficient alpha, the more consistent the questions are for that test. A test with a low coefficient alpha is a test that produces different or inconsistent scores each time the same person takes the test. A high coefficient alpha, however, indicates that the test produces similar or consistent scores each time the same person takes the test. TABLE 6 contains coefficient alpha reliabilities for the seven personality scales for a sample of 2950 job applicants and incumbents.
TABLE 6—COEFFICIENT ALPHA, PS-II
(N = 2950) PS - II SCALES COEFFICIENT ALPHA
Accommodating .79 Assertiveness .76 Attitude .81 Energy Level .75 Independence .77 Judgement .75 People Orientation .84 Decisiveness .78

THE PROFILE T M TECHNICAL MANUAL
COPYRIGHT 1999, PROFILES INTERNATIONAL , IN C ., WA C O, TX 16
Manageability .79
Average .78
According to TABLE 6, average alpha coefficient was .78, ranging from a low of .75 for the Energy Level and Judgement scales, to a high of .84 for the People Orientation scale.
Split-Half Reliability Analysis
The second measure of internal consistency reliability involved the split-half method. Each of the 30-question scales was divided into two equivalent halves of 15 odd and 15 even numbered questions. A split-half reliability correlation coefficient was calculated to provide a measure of consistency with regard to the content of the questionnaire questions. That is, the split-half reliability coefficient would indicate how consistently the PS-II questions measure the dimensions for which it was developed to measure. TABLE 7 contains split-half reliabilities for the seven personality scales for a sample of 2950 job applicants and incumbents.
TABLE 7- SPLIT-HALF RELIABILITIES
(N = 2950)
PS - II SCALES SPLIT-HALF RELIABILITIES
Accommodating .79 Assertiveness .78 Attitude .81 Energy Level .75 Independence .77 Judgement .72 People Orientation .82 Decisiveness .77 Manageability .79
Average .78
According to TABLE 7, split-half reliabilities range from a low of .72 for the Judgement scale to a high of .82 for the People Orientation scale. The average split-half reliability was .78 for the nine personality scales.
THE PROFILE T M TECHNICAL MANUAL
COPYRIGHT 1999, PROFILES INTERNATIONAL , IN C ., WA C O, TX 17
In conclusion, internal consistency of PS-II was determined by calculating coefficient alpha and split-half reliabilities. Both analyses indicate that the nine personality scales are reliable and produce consistent results. Due to the fact that the Positive Impression Scale contains only eight questions, it was not included in the reliability analysis VALIDITY
Validity is the extent to which a measurement measures what it is supposed to measure. The concept of validity refers to the appropriateness or accuracy of inferences or decisions made about individuals based on test results. It is important from both a business and legal perspective that organizations answer the question regarding the validity of the inference underlying selection testing. If the inference is not valid then organizations stand to waste their business investment in selection tests and risk legal challenges to their hiring and placement decisions. Test validation refers to the process of gathering evidence to support the inference being made. Various approaches to gathering validity evidence will be described below.
The Construct Validity Approach
Construct validity refers to the extent to which a psychological measure is an accurate measure of a particular construct. Construct validity addresses the question, “What does this measure really measure, and how well does it measure what it was designed for and purported to measure?” Although there are different methods for evaluating construct validity, two of the most informative methods is to examine the correlation coefficients: 1) among the scales within the new instrument and 2) between the new instrument and other psychological measures that have been shown to measure the same or similar constructs. The pattern of correlations should be consistent with expectations based on what these scales were intended to measure. Scales that measure related personality constructs should converge (i.e., be highly correlated) whereas scales that measure unrelated constructs should diverge (i.e., not be correlated). Intercorrelation of PS-II Scales PS-II was designed to measure seven primary dimensions of normal personality. TABLE 8 contains the intercorrelations among the seven PS-II scales for 2950 job applicants and incumbents.
THE PROFILE T M TECHNICAL MANUAL
COPYRIGHT 1999, PROFILES INTERNATIONAL , IN C ., WA C O, TX 18
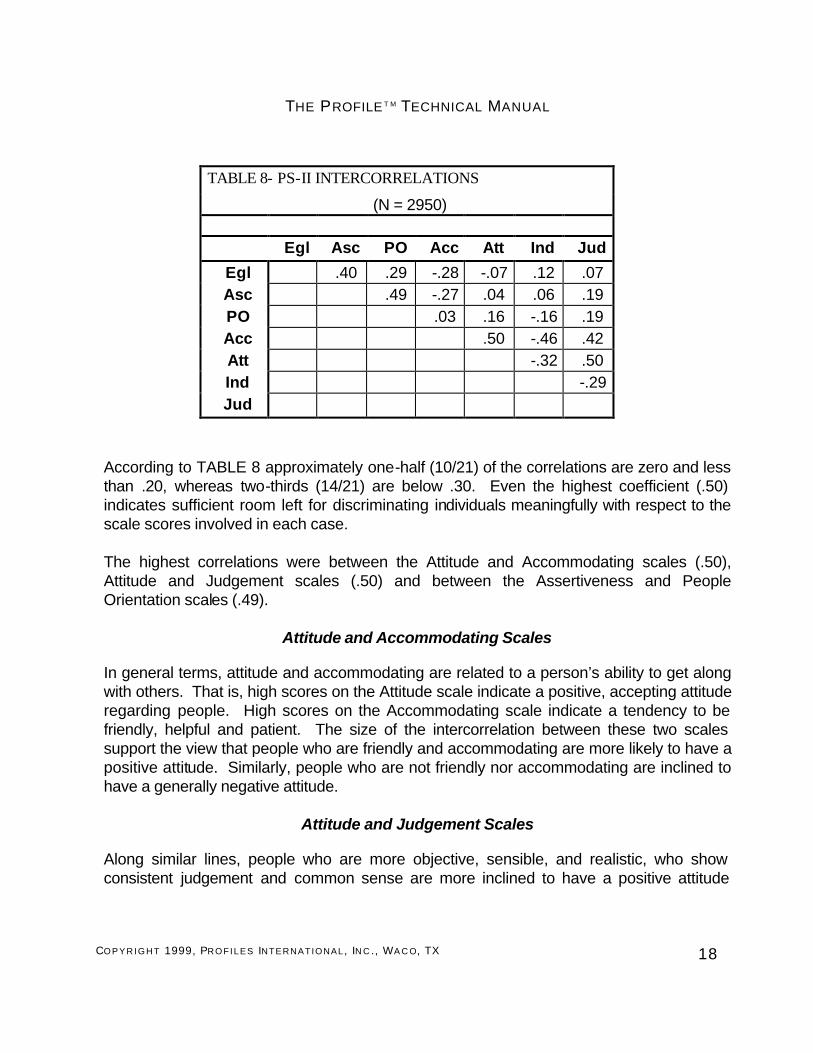
TABLE 8- PS-II INTERCORRELATIONS
(N = 2950)
Egl Asc PO Acc Att Ind Jud
Egl .40 .29 -.28 -.07 .12 .07 Asc .49 -.27 .04 .06 .19 PO .03 .16 -.16 .19 Acc .50 -.46 .42 Att -.32 .50 Ind -.29 Jud
According to TABLE 8 approximately one-half (10/21) of the correlations are zero and less than .20, whereas two-thirds (14/21) are below .30. Even the highest coefficient (.50) indicates sufficient room left for discriminating individuals meaningfully with respect to the scale scores involved in each case. The highest correlations were between the Attitude and Accommodating scales (.50), Attitude and Judgement scales (.50) and between the Assertiveness and People Orientation scales (.49).
Attitude and Accommodating Scales
In general terms, attitude and accommodating are related to a person’s ability to get along with others. That is, high scores on the Attitude scale indicate a positive, accepting attitude regarding people. High scores on the Accommodating scale indicate a tendency to be friendly, helpful and patient. The size of the intercorrelation between these two scales support the view that people who are friendly and accommodating are more likely to have a positive attitude. Similarly, people who are not friendly nor accommodating are inclined to have a generally negative attitude.
Attitude and Judgement Scales
Along similar lines, people who are more objective, sensible, and realistic, who show consistent judgement and common sense are more inclined to have a positive attitude

THE PROFILE T M TECHNICAL MANUAL
COPYRIGHT 1999, PROFILES INTERNATIONAL , IN C ., WA C O, TX 19
regarding people than people who tend to show inconsistent judgement, objectivity and common sense.
Assertiveness and People Orientation Scales
Both of these scales pertain to interpersonal behavior. Being assertive in a social situation typically goes with liking social situations. The common social aspect generates a substantial correlation. Overall, for even the largest coefficients, each scale accounts for less than one-half of the variance of the other, thus indicating that there is a substantial unique contribution made by each of the scales.
INTERCORRELATION OF PS-II SCALES WITH OTHER PERSONALITY INSTRUMENTS
This section of the Technical Report examines the statistical relationships between the PS-II and two other measures of adult personality: the Guilford–Zimmerman Temperament Survey and Gordon Personal Profile – Inventory.
The Guilford-Zimmerman Temperament Survey (GZTS)
The GZTS is a measure of normal, adult personality. It is based on more than 30 years of research and has been documented in over 2,000 books and journal articles. Occupations profile data and norms include more than 15,000 individuals. The GZTS contains ten personality scales. These scales are included in TABLE 9.
TABLE 9- GZTS SCALE DESCRIPTIONS GZTS SCALE DESCRIPTION General Activity Fast vs. Slow Restraint Self control vs. Impulsively Ascendance Dominance vs. Submissive Sociability Outgoing vs. Shy Emotional Stability High vs. Low Objectivity Objective vs. Subjective Friendliness Friendly vs. Aggressive Thoughtfulness Think It Through vs. Act It Out

THE PROFILE T M TECHNICAL MANUAL
COPYRIGHT 1999, PROFILES INTERNATIONAL , IN C ., WA C O, TX 20
Personal Relations Positive vs. Negative Masculinity Interest in Masculine vs. Feminine
Activities Vigor High vs. Low Activity
The PS-II and the GZTS were administered to 540 job applicants and incumbents over a one-year period. TABLE 10 contains the correlations among the seven PS-II scales and the ten GZTS scales. Due to the large sample size, many coefficients were significant beyond the .05 level. Therefore only coefficients of .40 or higher are included in TABLE 10.
TABLE 10- PS-II AND GZTS CORRELATIONS
(N = 540)
GZTS Scales PS-II Scales
Egl Asc PO Acc Att Ind Jud
G .79 R A .68 .42 S .80 E O .49 .69 F .79 .45 -.49 T P .60 .74 M
GZTS KEY G General Activity O Objectivity S Social Interest R Restraint F Friendliness P Personal Relations A Ascendance T Thoughtfulness E Emotional Stability M Masculinity / Femininity
Both the PS-II and the GZTS provide measures of factorially derived personality dimensions and include a number of scales that are similarly named. Therefore, a comparison of these two measure is of particular interest. According to TABLE 10, the patterns of

THE PROFILE T M TECHNICAL MANUAL
COPYRIGHT 1999, PROFILES INTERNATIONAL , IN C ., WA C O, TX 21
intercorrelations between PS-II and the GZTS are largely consistent with what the scales are purported to measure. For example:
n For the PS-II, there is strong evidence for six scales that line up on a one-to-
one basis with six of the GZTS scales. These scales are:

THE PROFILE T M TECHNICAL MANUAL
COPYRIGHT 1999, PROFILES INTERNATIONAL , IN C ., WA C O, TX 22
TABLE 11- PS-II AND GZTS CORRELATIONS
PS-II GZTS CORRELATIONS Energy Level General Activity .79 Assertiveness Ascendance .68 People Orientation Sociability .80 Judgement Objectivity .69 Accommodating Friendliness .70 Attitude Personal Relations .74
n As might be expected, the PS-II People Orientation scale correlated with the GZTS Ascendance Scale, thus indicating that both of these scales share an interpersonal/social orientation.
Similarly, patterns of relationships involving GZTS Personal Relations and Friendliness scales and the PS-II Attitude and Accommodating scales were in the expected direction. The overlapping variance among these four scales supports the view that friendly and accommodating people tend to have a positive attitude when compared with people who are considerably less friendly and accommodating. The significant but negative correlations between the GZTS Friendliness scale and the PS-II Independence scale support the view that highly independent, self-sufficient people tend to be generally less cooperative, accommodating and agreeable, not so much in an “anti” sense, but rather in a “I prefer to make my own decisions” sense. For the most part, GZTS Restraint, Emotional Stability, Thoughtfulness and Masculinity scales show little in common with specific PS-II scales
Gordon Personal Profile – Inventory (GPP-I)
The GPP-I provides a comprehensive description of normal personality functioning through the measurement of eight personality traits. The GPP-I is a self-report questionnaire, with questions presented in a forced-choice format. The GPP-I has 40 years of research, documentation and use with a wide variety of business organizations. The GPP-I measures the eight personality traits shown in TABLE 12.

THE PROFILE T M TECHNICAL MANUAL
COPYRIGHT 1999, PROFILES INTERNATIONAL , IN C ., WA C O, TX 23
TABLE 12- GPP-I SCALE DESCRIPTIONS
GPP-I SCALE DESCRIPTION Ascendancy Active vs. Passive role in Group
Situations Responsibility High vs. Low Emotional Stability High vs. Low Sociability Socially Outgoing vs. Shy Cautiousness Careful vs. Impulsive Original Thinking Innovative vs. Conventional Personal Relations Positive vs. Negative
The PS-II and the GPP-I were administered to 320 job applicants and incumbents over a one-year period. TABLE 13 contains the intercorrelations among the seven PS-II scales and the eight GPP-I scales. Once again, due to the large sample size, only those coefficients of .40 or higher were included in TABLE 13. According to TABLE 13, the patterns of intercorrelations are consistent with expectations. For example:
TABLE 13- GPP-I AND PS-II CORRELATIONS
(N = 320)
GPP-I Scales PS-II Scales
Egl Asc PO Acc Att Ind Jud
A .72 .65 R E .50 S .52 .85 C O P .44 .40 .45 V .67
GPPI KEY A Ascendancy C Cautiousness R Responsibility O Original Thinking
THE PROFILE T M TECHNICAL MANUAL
COPYRIGHT 1999, PROFILES INTERNATIONAL , IN C ., WA C O, TX 24
E Emotional Stability P Personal Relations S Sociability V Vigor
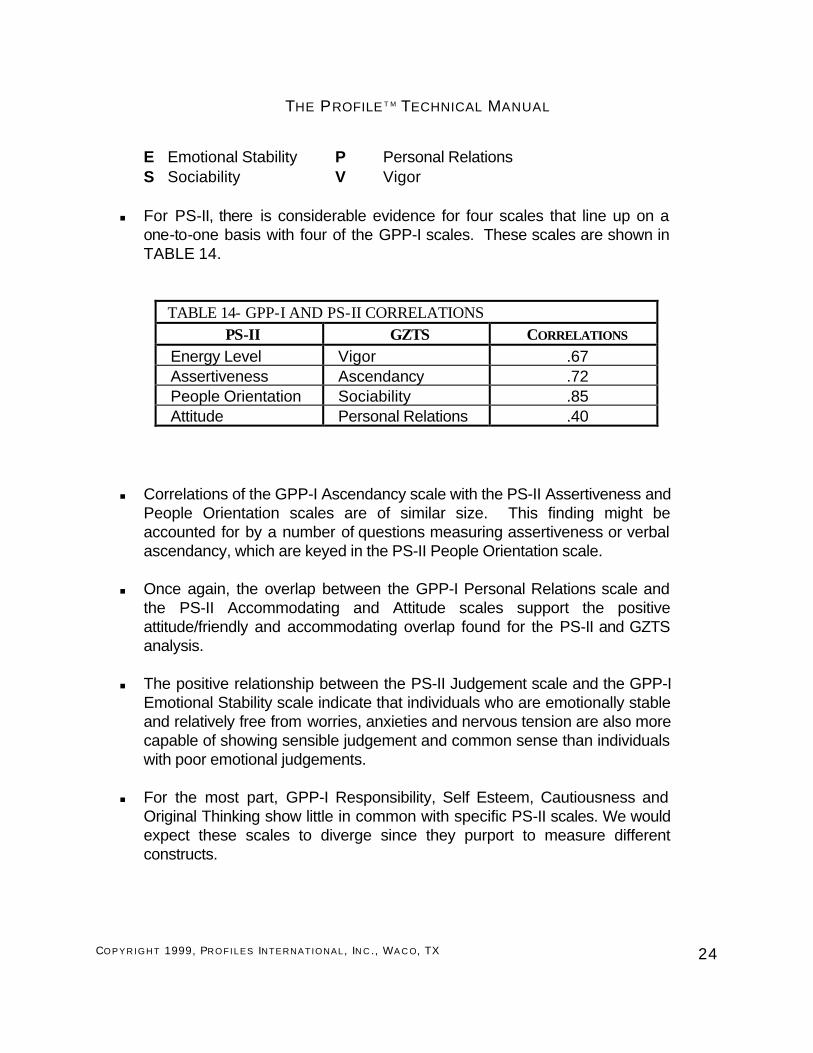
n For PS-II, there is considerable evidence for four scales that line up on a
one-to-one basis with four of the GPP-I scales. These scales are shown in TABLE 14.
TABLE 14- GPP-I AND PS-II CORRELATIONS PS-II GZTS CORRELATIONS
Energy Level Vigor .67 Assertiveness Ascendancy .72 People Orientation Sociability .85 Attitude Personal Relations .40
n Correlations of the GPP-I Ascendancy scale with the PS-II Assertiveness and People Orientation scales are of similar size. This finding might be accounted for by a number of questions measuring assertiveness or verbal ascendancy, which are keyed in the PS-II People Orientation scale.
n Once again, the overlap between the GPP-I Personal Relations scale and
the PS-II Accommodating and Attitude scales support the positive attitude/friendly and accommodating overlap found for the PS-II and GZTS analysis.
n The positive relationship between the PS-II Judgement scale and the GPP-I
Emotional Stability scale indicate that individuals who are emotionally stable and relatively free from worries, anxieties and nervous tension are also more capable of showing sensible judgement and common sense than individuals with poor emotional judgements.
n For the most part, GPP-I Responsibility, Self Esteem, Cautiousness and
Original Thinking show little in common with specific PS-II scales. We would expect these scales to diverge since they purport to measure different constructs.

THE PROFILE T M TECHNICAL MANUAL
COPYRIGHT 1999, PROFILES INTERNATIONAL , IN C ., WA C O, TX 25
In conclusion, there is considerable support for the psychological similarity of constructs and of scale measurement between the PS-II and the GZTS and GPP-I where one would expect it and little convergence in scales measuring dissimilar constructs.
Intercorrelation of PS-II Scales with the Vocational Preference Inventory (VPI)
As is often said among hiring professionals, "you hire on knowledge and skills, but you fire on fit". Because the PS-II will help employers determine the degree of fit between the job candidate and the job, the relationship between the personality scales of the PS-II and vocational preferences were examined. The VPI is widely regarded as the standard of career interest inventories. The VPI has been administered to thousands of people for more than 20 years. The VPI measures six general occupational themes and each occupational theme is defined by a distinctive pattern of interests, abilities and personality types (TABLE 15).
TABLE 15- THE VPI SIX OCCUPATIONAL THEMES
THEME DESCRIPTION Realistic Mechanical, Outdoors Investigative Technical, Science Social Social welfare, helping peopleConventional Office Enterprising Sales, business management Artistic Creative expression
The VPI is also an indirect measure of personality. According to its developers, each of the six occupational themes is related to a specific personality type. People who share an interest in a specific occupational theme will also share a specific personality type. TABLE 16 summarizes the relationships between the six occupational themes and personality types.
TABLE 16: RELATIONSHIPS BETWEEN THE VPI OCCUPATIONAL THEMES AND PERSONALITY TYPES
OCCUPATIONAL THEME PERSONALITY TYPE Realistic Practical, low key, unemotional Investigative Intellectual, unconventional Social People Oriented Conventional Dependable, steady, consistent Enterprising Assertive, competitive

THE PROFILE T M TECHNICAL MANUAL
COPYRIGHT 1999, PROFILES INTERNATIONAL , IN C ., WA C O, TX 26
Artistic Emotional, sensitive The PS-II and the Vocational Preference Inventory were administered to 615 job applicants and incumbents over a one year period. TABLE 17 contains the most statistically significant intercorrelations among the seven PS-II personality scales and the six VPI occupational scales. According to TABLE 17, although the size of the coefficients between the personality and interest scales are generally in the moderate range, these relations are largely consistent with expectations based on what these scales were developed and purported to measure.
TABLE 17- PS-II AND VPI INTERCORRELATIONS
(N = 615)
VPI Scales PS-II Scales
Egl Asc PO Acc Att Ind Jud
R I S .25 .42 C -.24 -.33 E .45 .48 .47 .40 A
VPI KEY R: Realistic; I: Investigative; S: Social; C: Conventional; E: Enterprising; A: Artistic
n According to Holland’s (1985) theory of vocational interests, people with an interest in enterprising and social occupations are socially active and outgoing. TABLE 17 clearly supports this relationship.
n Entrepreneurs tend to be energetic, assertive, independent and socially
outgoing. The significant correlations between the Enterprising scale and the Energy level, Assertiveness, People Orientation and Independence scales support this relationship.
n People who have an interest in conventional occupations tend to enjoy tasks
which are methodical, organized and are primarily data oriented. The
THE PROFILE T M TECHNICAL MANUAL
COPYRIGHT 1999, PROFILES INTERNATIONAL , IN C ., WA C O, TX 27
inverse correlations between the conventional scale and the PS-II Assertiveness and Independence scales lend support to this relationship.
The Criterion-related Validity Approach
Criterion-related validity is one of the most accepted means of demonstrating test validity for all types of tests, including general mental ability tests or tests that measure abstract. In a criterion-related validation study, scores on the target test are correlated with job performance scores for the same group of applicants or employees. The correlation between test scores and job performance scores reflects the criterion-related validity of the test. The stronger the correlation, the more confidence one may have that the test is working as intended to select better applicants.
Research Designs used for Criterion-Related Validation Studies
There are two basic research designs used to conduct a criterion-related validation study. The difference between the two designs is the amount of time allowed to elapse between collecting the predictive data and the criterion data. Using the concurrent validation method for demonstrating criterion-related validity, the predictive data (e.g., test scores) and the criterion data (e.g., job performance ratings) are collected at approximately the same time. Using the predictive validation method the predictive data (e.g., test scores) are collected and a certain amount of time is allowed to elapse and then the criterion data (e.g., job performance ratings) are collected. As opposed to the concurrent validation method, the predictive validation method is longitudinal in nature.
Concurrent Validity
This section of the Technical Report reviews the statistical relationship between PS-II scale scores and various performance criteria. These criteria include: n Sales Performance n Customer Service Performance n Management Performance n Conscientiousness n Employee Turnover n Organizational Status

THE PROFILE T M TECHNICAL MANUAL
COPYRIGHT 1999, PROFILES INTERNATIONAL , IN C ., WA C O, TX 28
Although the sample sizes of some of the following studies are sometimes less than ideal, the number of studies and the overall consistency of results argues against there being spurious relationships due to sampling error. In addition, while this emphasizes some of the practical limitations of applied research, since this instrument will be applied in a "real world" setting, some would argue the findings will generalize better given that the studies were conducted in the same environment.
Predicting Sales Performance
Study 1: Description of the Project: Seventy-six experienced new and used auto sales personnel representing five automobile dealerships completed PS-II. Sales performance data consisted of total cars sold for (a) 1996, (b) 1997, combined 1996, 1997 and (d) combined 1996, 1997 controlling for length of employment.
Results. TABLE 18 contains the statistically significant correlations between the PS-II scale scores and sales performance.

THE PROFILE T M TECHNICAL MANUAL
COPYRIGHT 1999, PROFILES INTERNATIONAL , IN C ., WA C O, TX 29
TABLE 18- CORRELATIONS PS-II AND PERFORMANCE
Sales Performance Tenure Controlled
PS-II Scales 1996 1997 1996 / 1997 1996 / 1997 Energy Level .42** .29* .47** .43** Assertiveness .29* .27* .35** .27* People Orientation
.23* .26* .25* .31**
N = 76
* (p<.05) ** (p<.01)
Discussion: According to TABLE 18, the People Orientation, Assertiveness and particularly the Energy Level scales were significantly related to sales performance. The correlations ranged from .23 to .47.
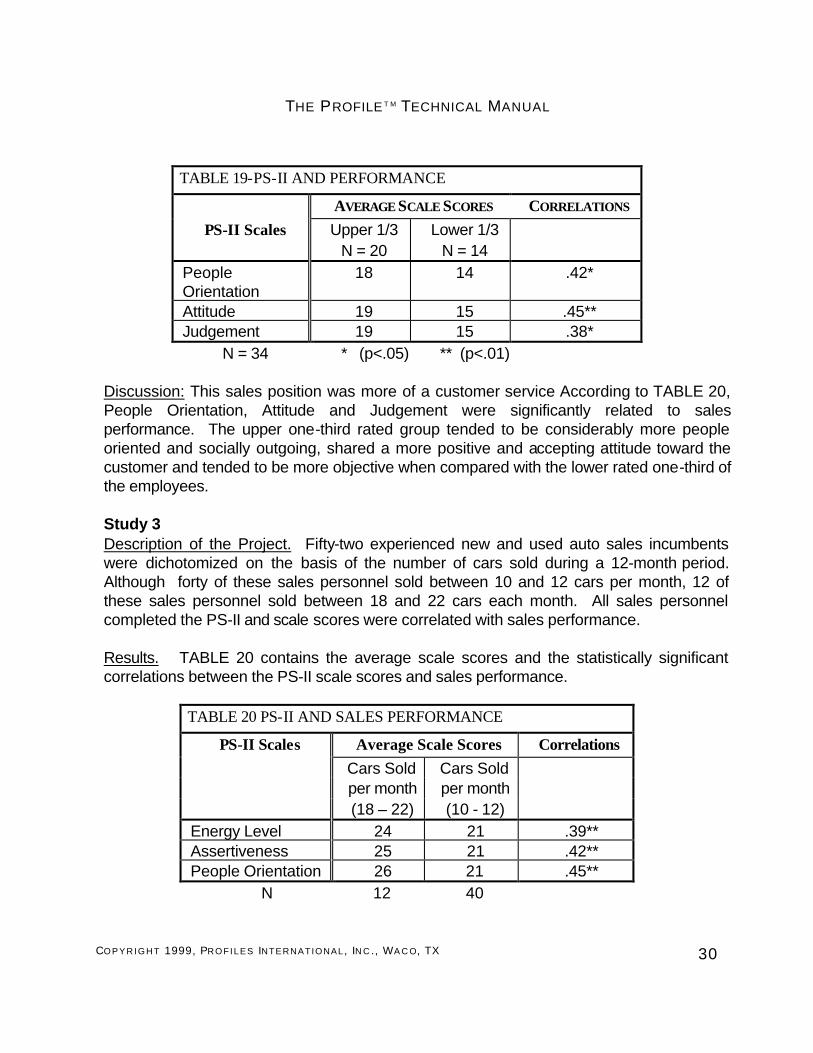
Study 2 Description of the Project. Sixty quick lube technicians from 15 store locations were administered PS-II. Store Managers, three District Managers and two Training Managers rated these employees with respect to their ability to persuade customers to purchase other services in addition to the standard oil change and to purchase other parts in addition to oil and air filters. These 60 employees were divided into upper and lower one-third performance groups. Results. Twenty of the 60 employees were assigned to the upper one-third sales performance group whereas 14 of these employees were assigned to the lower one-third group. TABLE 19 contains the average scale scores and statistically significant correlations between the PS-II scale scores and the upper and lower rated groups.
THE PROFILE T M TECHNICAL MANUAL
COPYRIGHT 1999, PROFILES INTERNATIONAL , IN C ., WA C O, TX 30
TABLE 19-PS-II AND PERFORMANCE
AVERAGE SCALE SCORES CORRELATIONS PS-II Scales Upper 1/3 Lower 1/3
N = 20 N = 14 People Orientation
18 14 .42*
Attitude 19 15 .45** Judgement 19 15 .38*
N = 34 * (p<.05) ** (p<.01) Discussion: This sales position was more of a customer service According to TABLE 20, People Orientation, Attitude and Judgement were significantly related to sales performance. The upper one-third rated group tended to be considerably more people oriented and socially outgoing, shared a more positive and accepting attitude toward the customer and tended to be more objective when compared with the lower rated one-third of the employees.
Study 3 Description of the Project. Fifty-two experienced new and used auto sales incumbents were dichotomized on the basis of the number of cars sold during a 12-month period. Although forty of these sales personnel sold between 10 and 12 cars per month, 12 of these sales personnel sold between 18 and 22 cars each month. All sales personnel completed the PS-II and scale scores were correlated with sales performance.
Results. TABLE 20 contains the average scale scores and the statistically significant correlations between the PS-II scale scores and sales performance.
TABLE 20 PS-II AND SALES PERFORMANCE
PS-II Scales Average Scale Scores Correlations Cars Sold Cars Sold
per month per month (18 – 22) (10 - 12)
Energy Level 24 21 .39** Assertiveness 25 21 .42** People Orientation 26 21 .45**
N 12 40

THE PROFILE T M TECHNICAL MANUAL
COPYRIGHT 1999, PROFILES INTERNATIONAL , IN C ., WA C O, TX 31
* (p<.05) ** (p<.01)
Discussion: According to TABLE 20, Energy Level, Assertiveness and People Orientation were significantly related to sales performance. The correlation ranged from .38 to .45. The three studies summarized above are in line with what is generally accepted regarding successful sales people, particularly for sales positions that require a highly aggressive sales approach. That is, top sales people tend to be highly energetic, results oriented and quick to take action. They tend to become impatient with others who do not share their high sense of urgency. They are assertive, aggressive and have a strong need for control. They are more people than data oriented and are strongly motivated by recognition and acceptance.
Predicting Customer Service Performance
The PS-II was administered to 122 convenience store counter sales personnel from 18 store locations. Annual performance evaluation data was gathered for all employees who were employed for at least one year. Store Managers, four District Managers and three Training Managers completed the evaluation form. The evaluation form contained the following seven scales: n Treatment of customers n Quality of work n Accuracy n Punctuality n Dependability n Interpersonal Relations n Overall Evaluation
Each of the scales have five levels of performance ranging from Poor or Below Standard (1 point) to Excellent or Well Above Standard (5 points). Results. TABLE 21 presents the significant correlations for the PS-II with these seven evaluation scales.

THE PROFILE T M TECHNICAL MANUAL
COPYRIGHT 1999, PROFILES INTERNATIONAL , IN C ., WA C O, TX 32
TABLE 21—PS-II AND EVALUATION SCALES CORRELATIONS
PERFORMANCE EVALUATION SCALES
PS-II Scales Interpersonal Treatment Overall Relations Dependability of Customers Evaluation
Judgement .42** .34** .46** .40** Accommodating .46** .42** .43** Attitude .51** .45** .48**
N = 122 * (p<.05) ** (p<.01) Discussion: According to TABLE 21, although no significant correlations were found between PS-II scale scores and Quality of Work, Accuracy and Punctuality, highly significant correlations were found between three of the PS-II scales and four of the other performance evaluations scales. These correlations range in size from .34 to .51. The results in TABLE 21 are compatible with what one would expect. Employees who tend to be friendly and accommodating, who have a positive attitude and show good judgement received significantly higher evaluation scores for their interpersonal relations and for their treatment of customers when compared with their co-workers who scored significantly lower on these scales. In addition, good judgement was positively related to being a dependable employee.
Predicting Management Performance
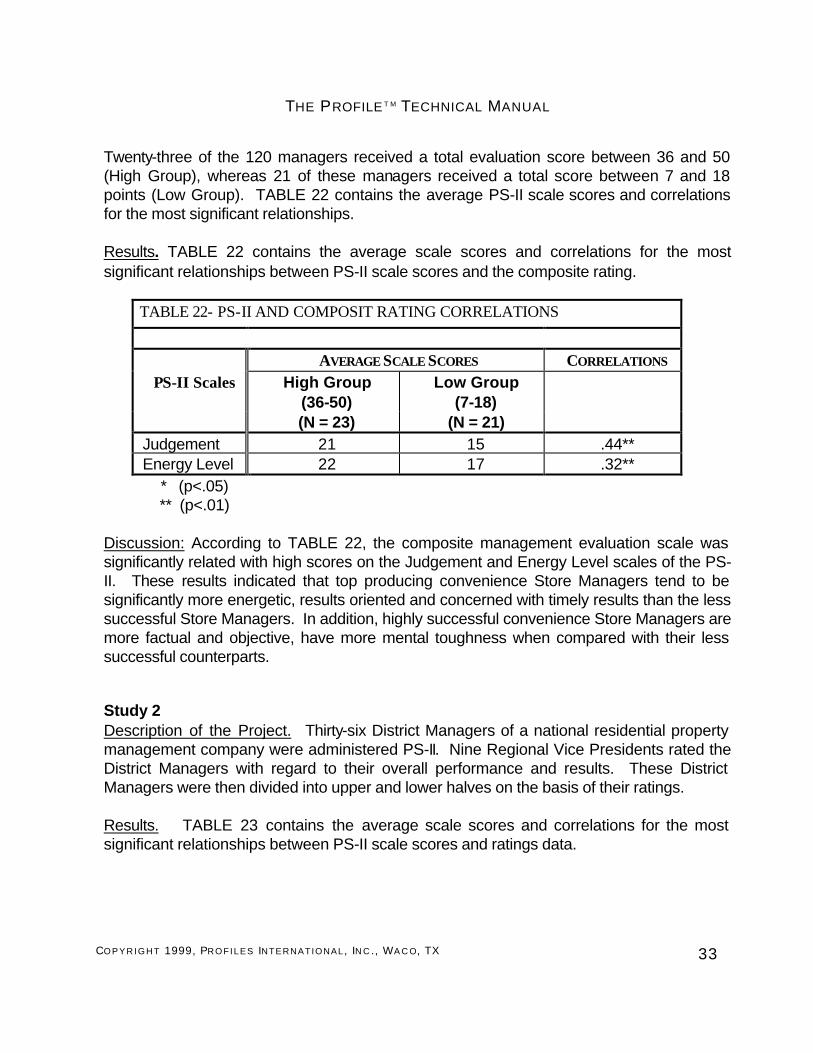
Study 1 Description of the Project. PS-II was administered to 120 convenience store managers. Twelve District Managers, four Regional Managers and five Training/Human Resource Managers completed annual performance evaluation reports on these Store Managers. Although the evaluation report consists of 12 separate management performance scales, a composite scale was created for the purpose of this project. This composite scale consisted of the following separate scales: n Sales to Budget n Turnover Control n Overtime Hours Control n Payroll Dollars Control
THE PROFILE T M TECHNICAL MANUAL
COPYRIGHT 1999, PROFILES INTERNATIONAL , IN C ., WA C O, TX 33
Twenty-three of the 120 managers received a total evaluation score between 36 and 50 (High Group), whereas 21 of these managers received a total score between 7 and 18 points (Low Group). TABLE 22 contains the average PS-II scale scores and correlations for the most significant relationships. Results. TABLE 22 contains the average scale scores and correlations for the most significant relationships between PS-II scale scores and the composite rating.
TABLE 22- PS-II AND COMPOSIT RATING CORRELATIONS
AVERAGE SCALE SCORES CORRELATIONS
PS-II Scales High Group (36-50)
Low Group (7-18)
(N = 23) (N = 21) Judgement 21 15 .44** Energy Level 22 17 .32**
* (p<.05) ** (p<.01)
Discussion: According to TABLE 22, the composite management evaluation scale was significantly related with high scores on the Judgement and Energy Level scales of the PS-II. These results indicated that top producing convenience Store Managers tend to be significantly more energetic, results oriented and concerned with timely results than the less successful Store Managers. In addition, highly successful convenience Store Managers are more factual and objective, have more mental toughness when compared with their less successful counterparts.
Study 2 Description of the Project. Thirty-six District Managers of a national residential property management company were administered PS-II. Nine Regional Vice Presidents rated the District Managers with regard to their overall performance and results. These District Managers were then divided into upper and lower halves on the basis of their ratings. Results. TABLE 23 contains the average scale scores and correlations for the most significant relationships between PS-II scale scores and ratings data.

THE PROFILE T M TECHNICAL MANUAL
COPYRIGHT 1999, PROFILES INTERNATIONAL , IN C ., WA C O, TX 34
TABLE 23 – PS-II AND MANAGER PERFORMANCE
AVERAGE SCALE SCORES CORRELATIONS
High Rated Low Rated PS-II SCALES Managers Managers
(N = 18) (N = 18) Energy Level 25 20 .48** Assertiveness 25 21 .45** Judgement 24 19 .32**
* (p<.05) ** (p<.01) Discussion: According to TABLE 23, the District Managers who represented the upper one-half of the rating distribution scored significantly higher on the Energy Level, Assertiveness and Judgement scales of the PS-II when compared with managers who were in the lower one-half of the rating distribution.
Study 3 Description of the Project. One hundred-thirty apartment Property Managers were administered the PS-II. Twenty District Managers, nine Regional Vice Presidents and five Training/Human Resource Managers rated the overall performance and effectiveness of the 130 managers. TABLE 23 contains the average PS-II scale scores and correlations for the most significant relationship between PS-II scale scores and the 20 top and 20 bottom rated Property Managers. Results. According to TABLE 24, the top 20 rated Property Managers scored significantly higher on the Assertiveness, Judgement, Attitude and Accommodating scales of the PS-II when compared with the bottom 20 rated Property Managers. The correlations ranged from .35 to .46.
TABLE 24 – PS-II AND PROPERTY MANAGER PERFORMANCE
AVERAGE SCALE SCORES CORRELATIONS PS-II SCALES Top 20 Bottom 20
Managers Managers Assertiveness 21 15 .45** Judgement 20 14 .46** Attitude 21 17 .35*

THE PROFILE T M TECHNICAL MANUAL
COPYRIGHT 1999, PROFILES INTERNATIONAL , IN C ., WA C O, TX 35
Accommodating 22 18 .38* * (p<.05) ** (p<.01)
Study 4 Description of the Project. As an extension of the Study 3, the raters were asked to identify from the total group of 130 Property Managers those Property Managers who have the management capabilities and developmental potential to eventually become District Managers. The rating procedure resulted in twelve Property Managers being identified as having future District Manager potential. TABLE 25 contains the most significant average PS-II scale scores differences and correlations between these 12 Property Managers and the remaining 118 Property Managers.
Results. According to TABLE 25, Energy Level, Assertiveness, Judgement and Independence were significantly related to having District Manager developmental potential. The correlations ranged from .39 to .49.
TABLE 25 – PS-II AND DISTRICT MANAGER POTENTIAL
AVERAGE SCALE SCORES CORRELATIONS PS-II SCALES 12 District
Manager 118 Property
Candidates Managers Energy Level 24 20 .48** Assertiveness 23 19 .49** Judgement 23 18 .39** Independence 18 13 .40**
* (p<.05) ** (p<.01)
Study 5 Description of the Project. PS-II was administered to 115 commercial District Managers from a national property management company. Twenty-one Regional Supervisors identified the top and bottom 25 managers with respect to their overall management effectiveness and results. TABLE 26 contains the most significant PS-II average scale score differences and correlations for these two groups of District Managers.
Results. TABLE 26 indicates significant differences between the top and bottom 25 District managers on Energy Level, Assertiveness and Judgement.
THE PROFILE T M TECHNICAL MANUAL
COPYRIGHT 1999, PROFILES INTERNATIONAL , IN C ., WA C O, TX 36

THE PROFILE T M TECHNICAL MANUAL
COPYRIGHT 1999, PROFILES INTERNATIONAL , IN C ., WA C O, TX 37
TABLE 26 – PS-II : TOP AND BOTTOM PERFORMERS
AVERAGE SCALE SCORES CORRELATIONS PS-II SCALES Top 25 Bottom 25
Energy Level 23 18 .52** Assertiveness 23 19 .58** Judgement 22 18 .55**
* (p<.05)
** (p<.01) Discussion: Correlations were all in the .50 range indicating strong relationships between these three personality dimensions and management performance.
Summary: Overall, results of the projects summarized above are highly consistent and clearly in line with other validation findings concerning the relationship between specific personality dimensions and management performance. Successful managers are energetic, self motivated and achievement oriented. They value time and prefer to interact with others in a direct and decisive manner. They are highly assertive and have strong needs to take charge, to be in control, to make their own decisions. They are tough-minded, prefer clearly defined goals, measurable results and tangible incentives. These managers are motivated by challenging assignments and opportunities for advancement. how is this related to the instrument

THE PROFILE T M TECHNICAL MANUAL
COPYRIGHT 1999, PROFILES INTERNATIONAL , IN C ., WA C O, TX 38
Predicting Conscientiousness
Description of the Project. The PS-II was administered to 167 applicants who were applying for full and part time counter sales positions for five convenience stores. These applicants had passed the initial screening which consisted of reviewing their employment application and a very short interview by the Store and District Manager. Criminal background checks were then conducted on these 167 applicants. Thirty-three (20%) of the criminal background checks produced negative results. The most serious negative results included the following: n Theft n Concealed weapon n D W I n No drivers license n Multiple speeding offenses n Reckless driving n Forged checks
Results. TABLE 27 contains the most significant PS-II average scale score differences and correlations between the 33 “negative” applicants and the 134 “positive” applicants.
TABLE 27 – PS-II AND CONSCIENTIOUSNESS
AVERAGE SCALE SCORES CORRELATIONS PS-II SCALES Negative
Applicants Positive Applicants
(N = 33) (N = 134) Judgement 14 18 0.39** Attitude 12 17 0.44**
N = 167
* (p<.05) ** (p<.01)
THE PROFILE T M TECHNICAL MANUAL
COPYRIGHT 1999, PROFILES INTERNATIONAL , IN C ., WA C O, TX 39
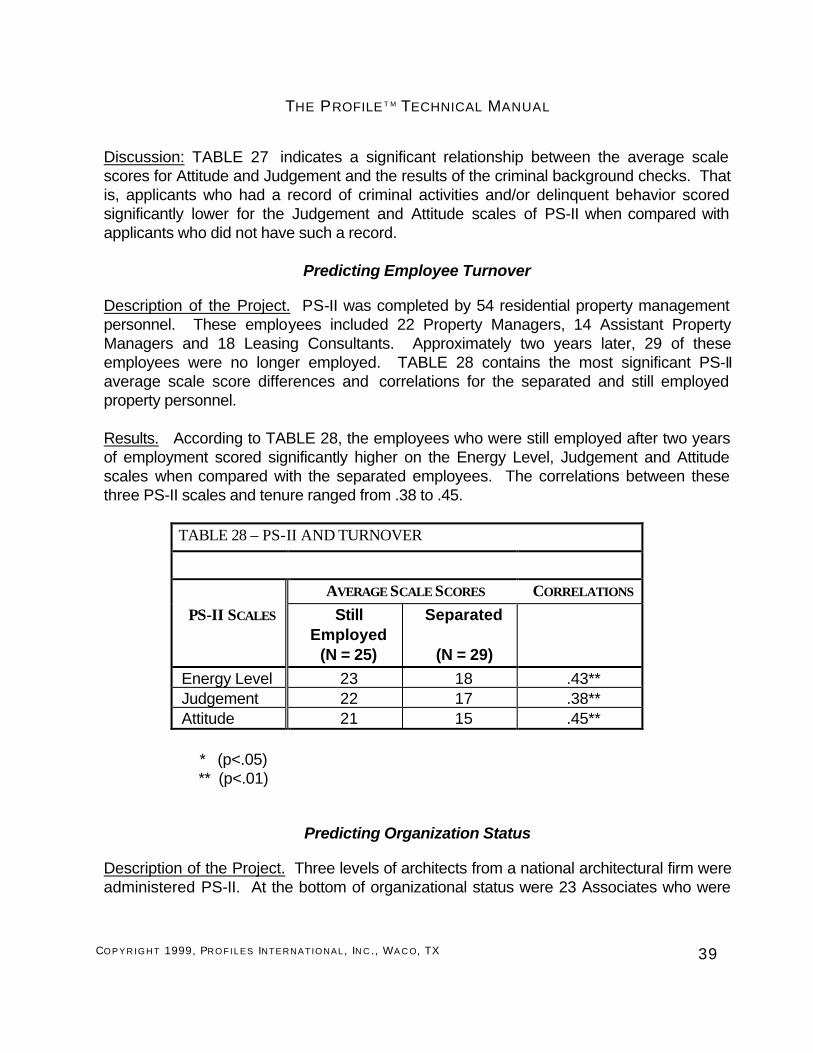
Discussion: TABLE 27 indicates a significant relationship between the average scale scores for Attitude and Judgement and the results of the criminal background checks. That is, applicants who had a record of criminal activities and/or delinquent behavior scored significantly lower for the Judgement and Attitude scales of PS-II when compared with applicants who did not have such a record.
Predicting Employee Turnover
Description of the Project. PS-II was completed by 54 residential property management personnel. These employees included 22 Property Managers, 14 Assistant Property Managers and 18 Leasing Consultants. Approximately two years later, 29 of these employees were no longer employed. TABLE 28 contains the most significant PS-II average scale score differences and correlations for the separated and still employed property personnel. Results. According to TABLE 28, the employees who were still employed after two years of employment scored significantly higher on the Energy Level, Judgement and Attitude scales when compared with the separated employees. The correlations between these three PS-II scales and tenure ranged from .38 to .45.
TABLE 28 – PS-II AND TURNOVER
AVERAGE SCALE SCORES CORRELATIONS PS-II SCALES Still
Employed Separated
(N = 25) (N = 29) Energy Level 23 18 .43** Judgement 22 17 .38** Attitude 21 15 .45**
* (p<.05) ** (p<.01)
Predicting Organization Status
Description of the Project. Three levels of architects from a national architectural firm were administered PS-II. At the bottom of organizational status were 23 Associates who were

THE PROFILE T M TECHNICAL MANUAL
COPYRIGHT 1999, PROFILES INTERNATIONAL , IN C ., WA C O, TX 40
primarily responsible for doing routine technical tasks. In the middle of organizational status were ten Project Managers who supervised the 23 Associates and had project responsibilities. At the top of organizational status were seven Managing Partners who not only supervised the ten Project Managers, but were also primarily responsible for generating new business, managing the business and for making a profit. TABLE 29 contains the most significant PS-II average scale score differences for these three groups of employees.
TABLE 29 – PS-II AND ORGANIZATIONAL STATUS
AVERAGE SCALE SCORES Managing Project
PS-II SCALES Partners Managers Associates (N = 7) (N = 10) (N = 23)
Energy Level 24** 24* 18* Assertiveness 22** 17** 15** People Orientation
26** 17** 14**
* (p<.05) ** (p<.01)
Results. TABLE 29 clearly shows significant PS-II average scale score differences among these three groups of employees. According to TABLE 29:
The Managing Partners were significantly higher on:
n Energy Level when compared with the Associates (t=3.2, df=28, p<.01) n Assertiveness when compared with the Project Managers (t=2.9, df=15,
p<.01) and the Associates (t=3.1, df=28, p<.01) n People Orientation when compared with the Project Managers (t=3.7, df=15,
p<.01) and with the Associates (t=3.9, df=28, p<.01)
The Project Managers scored significantly higher on:
n Energy Level when compared with Associates (t=3.3, df=31, p<.01) n People Orientation when compared with the Associates (t=2.4, df=31,
p<.05).
THE PROFILE T M TECHNICAL MANUAL
COPYRIGHT 1999, PROFILES INTERNATIONAL , IN C ., WA C O, TX 41
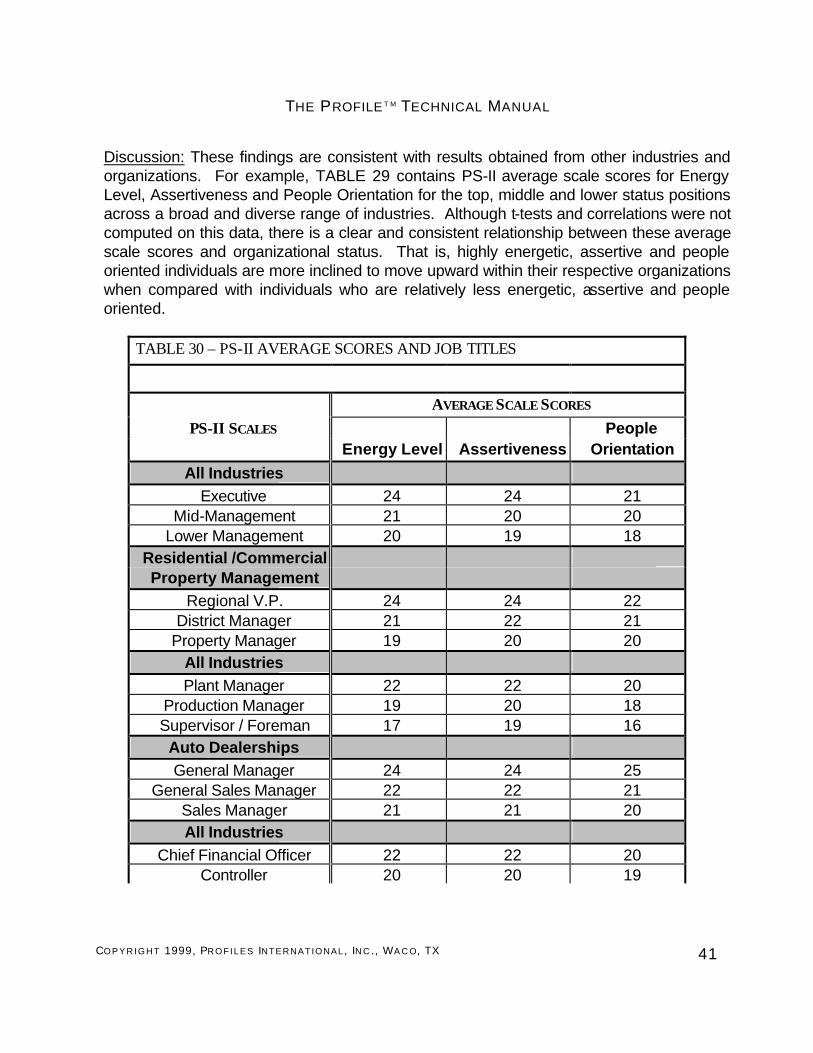
Discussion: These findings are consistent with results obtained from other industries and organizations. For example, TABLE 29 contains PS-II average scale scores for Energy Level, Assertiveness and People Orientation for the top, middle and lower status positions across a broad and diverse range of industries. Although t-tests and correlations were not computed on this data, there is a clear and consistent relationship between these average scale scores and organizational status. That is, highly energetic, assertive and people oriented individuals are more inclined to move upward within their respective organizations when compared with individuals who are relatively less energetic, assertive and people oriented.
TABLE 30 – PS-II AVERAGE SCORES AND JOB TITLES
AVERAGE SCALE SCORES PS-II SCALES People
Energy Level Assertiveness Orientation All Industries
Executive 24 24 21 Mid-Management 21 20 20
Lower Management 20 19 18 Residential /Commercial Property Management
Regional V.P. 24 24 22 District Manager 21 22 21
Property Manager 19 20 20 All Industries Plant Manager 22 22 20
Production Manager 19 20 18 Supervisor / Foreman 17 19 16
Auto Dealerships General Manager 24 24 25
General Sales Manager 22 22 21 Sales Manager 21 21 20 All Industries
Chief Financial Officer 22 22 20 Controller 20 20 19

THE PROFILE T M TECHNICAL MANUAL
COPYRIGHT 1999, PROFILES INTERNATIONAL , IN C ., WA C O, TX 42
Accounting Manager 19 17 17 All Industries
Operations Manager 23 24 21 District Manager 21 22 20 Store Manager 19 20 18

THE PROFILE T M TECHNICAL MANUAL
COPYRIGHT 1999, PROFILES INTERNATIONAL , IN C ., WA C O, TX 43
Validation of the Distortion Scale
TABLE 31 is a frequency distribution of PI responses for the total sample.
TABLE 31- DISTORTION SCALE RESPONSE FREQUENCY
(N = 2322)
PI Question
Frequency Percent Cumulative Percent
0 1020 44% 44% 1 552 24% 68% 2 282 12% 80% 3 188 8% 88% 4 120 5% 93% 5 74 3% 96% 6 48 2% 98% 7 24 1% 99% 8 14 1% 100%
TOTAL 2322 100% According to TABLE 31, 44 percent of the total sample did not respond to any of the eight PI questions in the positive impression direction. Twenty-four percent of the total sample responded to one of the questions. Finally, 93 percent of the total sample responded had only three or less PI responses, thus providing considerable support for the infrequent response rationale for the eight PI questions. When reported in The Profile reports, the PI scale has a negative load on the Distortion Scale. For example, a raw score of 0 (zero) yields a Distortion Scale score of 10 (ten).

THE PROFILE T M TECHNICAL MANUAL
COPYRIGHT 1999, PROFILES INTERNATIONAL , IN C ., WA C O, TX 44
ETHNICITY AND GENDER
A study was done to investigate the effects of gender and ethnicity on the results of the Behavioral Traits section. The subjects in Group F were 96 adults was from a mixed sales and management background. They represented a mixture of males, females, Blacks, Hispanics and Whites. There were no statistically significant interactions reported for Hispanic/White or male/female. The only significance reports was in the means for Independence where Blacks scored a little lower on the Independence scale. This difference was a little less than 2/3rds of a SD and would have a minimal impact in most job situations. The results are reported in TABLES 32, 33, 34 and 35.
TABLE 32- GROUP F, GENDER, BEHAVIORAL TRAITS
(N = 90) mean Std
error 95% Confidence
Interval Scale Gender N T df Sig. diff dif lower upper
Decisiveness Male Female
40 50
-1.27 86 .21 -1.20 .94 -3.06 .67
Energy Male Female
40 50
-.68 86 .50 -.76 1.12 -2.99 1.46
Assertiveness Male Female
40 50
-.38 86 .70 -.47 1.22 -2.90 1.97
Sociability Male Female
40 50
-.94 86 .35 -1.30 1.38 -4.05 1.45
Manageability Male Female
40 50
.58 86 .56 .68 1.18 -1.65 3.02
Attitude Male Female
40 50
-.51 86 .61 -.62 1.22 -3.04 1.80
Accommodation Male Female
40 50
1.36 86 .18 1.35 .99 -.63 3.32
Independence Male Female
40 50
-1.23 86 .22 -1.55 1.26 -4.05 .95
Judgement Male Female
40 50
-1.30 86 .20 -1.42 1.09 -3.59 .75

THE PROFILE T M TECHNICAL MANUAL
COPYRIGHT 1999, PROFILES INTERNATIONAL , IN C ., WA C O, TX 45
TABLE 33- GROUP F, ETHNICITY: BLACK/WHITE, BEHAVIORAL TRAITS
(N = 55) mean Std
error 95% Confidence
Interval Scale Ethnicity N T df Sig. diff dif lower upper
Decisiveness Black White
17 38
-.93 53 .36 -1.21 1.30 -3.82 1.41
Energy Black White
17 38
-1.52 53 .14 -2.06 1.36 -4.78 .66
Assertiveness Black White
17 38
.93 53 .36 1.35 1.46 -1.57 4.27
Sociability Black White
17 38
-1.11 53 .27 -2.03 1.83 -5.69 1.63
Manageability Black White
17 38
.68 53 .50 1.02 1.49 -1.98 4.01
Attitude Black White
17 38
-.08 53 .94 -.13 1.71 -3.57 3.30
Accommodation Black White
17 38
-.57 53 .57 -.70 1.22 -3.15 1.76
Independence Black White
17 38
-2.58 53 .01 -3.82 1.48 -6.79 -.85
Judgement Black White
17 38
1.37 53 .18 1.72 1.26 -.81 4.25

THE PROFILE T M TECHNICAL MANUAL
COPYRIGHT 1999, PROFILES INTERNATIONAL , IN C ., WA C O, TX 46
TABLE 34- GROUP F, HISPANIC/WHITE, BEHAVIORAL TRAITS
(N = 59) mean Std
error 95% Confidence
Interval Scale Ethnicity N t df Sig. diff dif lower upper
Decisiveness Hispanic White
21 38
-.46 57 .65 -.50 1.10 -2.69 1.69
Energy Hispanic White
21 38
-1.65 57 .10 -2.00 1.21 -4.43 .42
Assertiveness Hispanic White
21 38
-.78 57 .44 -1.14 1.45 -4.05 1.77
Sociability Hispanic White
21 38
.16 57 .87 .26 1.65 -3.04 3.57
Manageability Hispanic White
21 38
-.01 57 .99 -.01 1.38 -2.77 2.74
Attitude Hispanic White
21 38
-.48 57 .63 -.75 1.55 -3.86 2.36
Accommodation Hispanic White
21 38
-.30 57 .77 -.34 1.16 -2.66 1.97
Independence Hispanic White
21 38
-1.53 57 .13 -2.10 1.37 -4.85 .65
Judgement Hispanic White
21 38
-.45 57 .66 -.58 1.31 -3.21 2.04
THE PROFILE T M TECHNICAL MANUAL
COPYRIGHT 1999, PROFILES INTERNATIONAL , IN C ., WA C O, TX 47
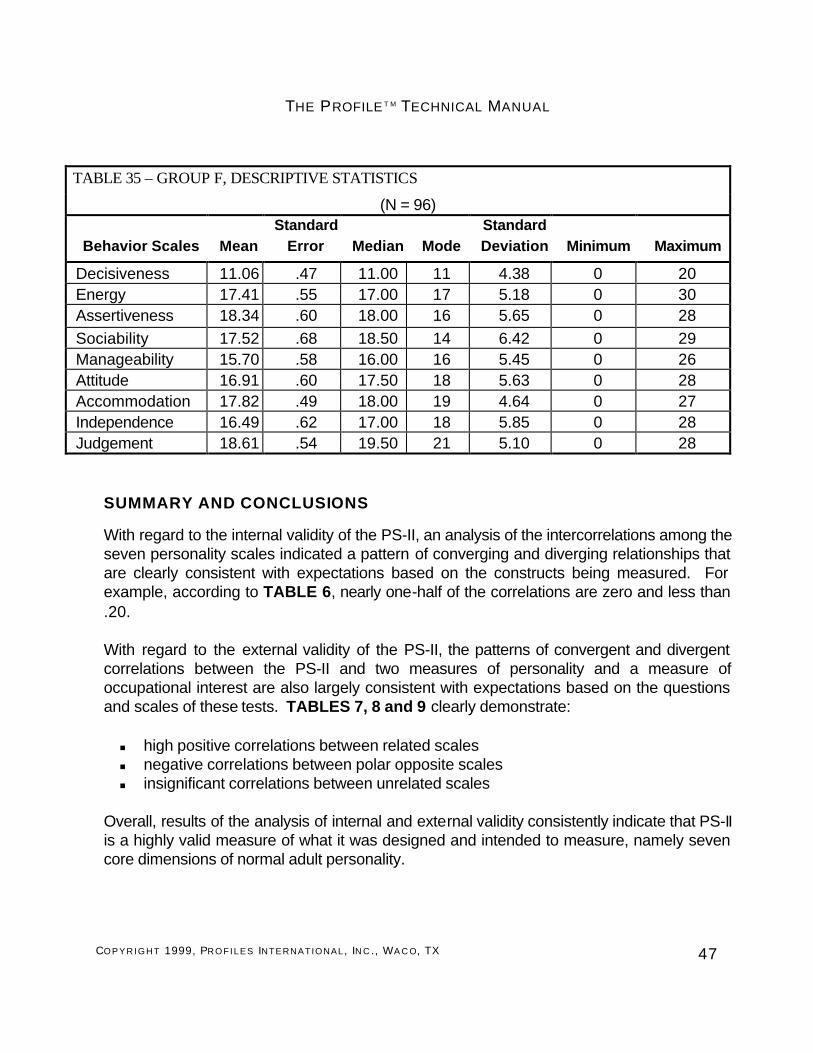
TABLE 35 – GROUP F, DESCRIPTIVE STATISTICS
(N = 96) Standard Standard
Behavior Scales Mean Error Median Mode Deviation Minimum Maximum
Decisiveness 11.06 .47 11.00 11 4.38 0 20 Energy 17.41 .55 17.00 17 5.18 0 30 Assertiveness 18.34 .60 18.00 16 5.65 0 28 Sociability 17.52 .68 18.50 14 6.42 0 29 Manageability 15.70 .58 16.00 16 5.45 0 26 Attitude 16.91 .60 17.50 18 5.63 0 28 Accommodation 17.82 .49 18.00 19 4.64 0 27 Independence 16.49 .62 17.00 18 5.85 0 28 Judgement 18.61 .54 19.50 21 5.10 0 28
SUMMARY AND CONCLUSIONS
With regard to the internal validity of the PS-II, an analysis of the intercorrelations among the seven personality scales indicated a pattern of converging and diverging relationships that are clearly consistent with expectations based on the constructs being measured. For example, according to TABLE 6, nearly one-half of the correlations are zero and less than .20. With regard to the external validity of the PS-II, the patterns of convergent and divergent correlations between the PS-II and two measures of personality and a measure of occupational interest are also largely consistent with expectations based on the questions and scales of these tests. TABLES 7, 8 and 9 clearly demonstrate: n high positive correlations between related scales n negative correlations between polar opposite scales n insignificant correlations between unrelated scales
Overall, results of the analysis of internal and external validity consistently indicate that PS-II is a highly valid measure of what it was designed and intended to measure, namely seven core dimensions of normal adult personality.

THE PROFILE T M TECHNICAL MANUAL
COPYRIGHT 1999, PROFILES INTERNATIONAL , IN C ., WA C O, TX 48
Section 5.8 of this Technical Report summarized the results of 12 (change when delete studies) validation projects which examined the relationship between the PS-II scales and a diverse range of criteria. The results of these projects provided consistent and substantial support for the predictive validity of PS-II. Correlations between PS-II scale scores and measures of sales success, management performance, customer service, conscientiousness, turnover and organizational status were consistently in the mid-40’s. In general terms, the PS-II Energy Level scale and Assertiveness scale tend to be significantly related to sales success, management performance and organizational status. PS-II Attitude scale, Accommodating scale and Judgement scale tend to be significantly related to customer service effectiveness, employee conscientiousness and turnover. In conclusion, statistical analysis of PS-II clearly indicate that PS-II consists of seven scales that provide a highly reliable and accurate measure of seven core dimensions of normal adult personality that are useful for predicting a number of important business-related criteria.
THE PROFILE T M TECHNICAL MANUAL
COPYRIGHT 1999, PROFILES INTERNATIONAL , IN C ., WA C O, TX 49
OCCUPATIONAL INTERESTS
OVERVIEW OF THE OCCUPATIONAL INTEREST INVENTORY
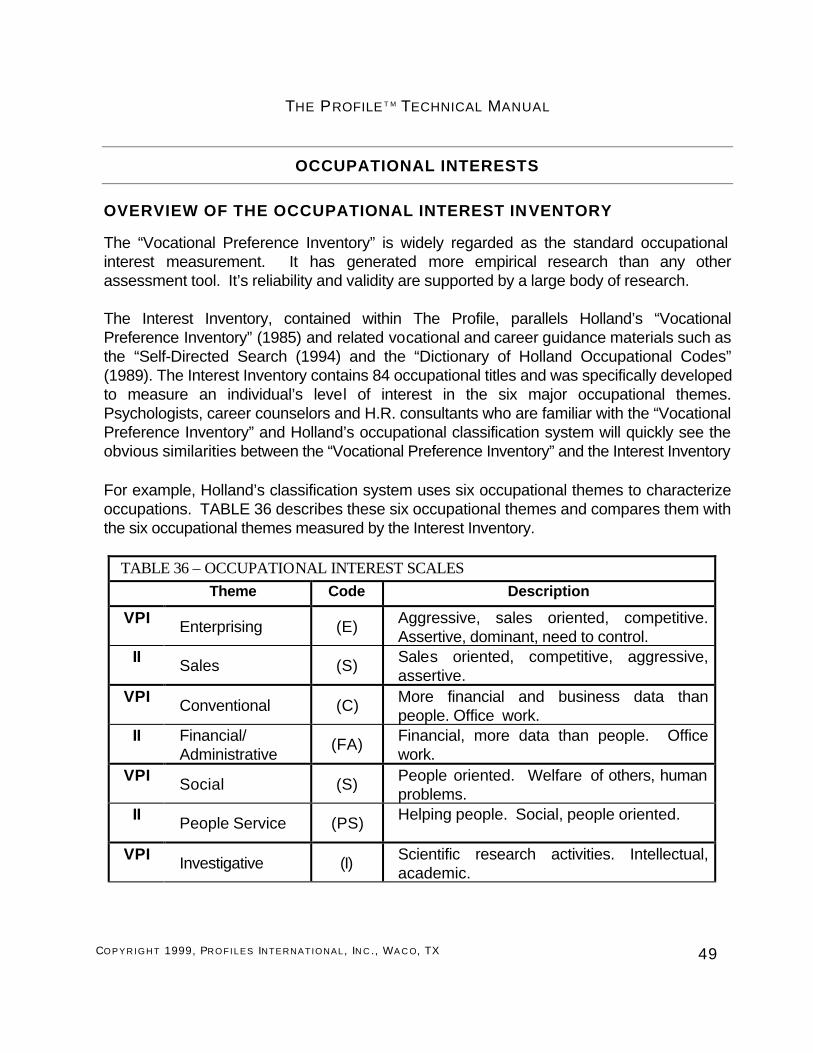
The “Vocational Preference Inventory” is widely regarded as the standard occupational interest measurement. It has generated more empirical research than any other assessment tool. It’s reliability and validity are supported by a large body of research.
The Interest Inventory, contained within The Profile, parallels Holland’s “Vocational Preference Inventory” (1985) and related vocational and career guidance materials such as the “Self-Directed Search (1994) and the “Dictionary of Holland Occupational Codes” (1989). The Interest Inventory contains 84 occupational titles and was specifically developed to measure an individual’s level of interest in the six major occupational themes. Psychologists, career counselors and H.R. consultants who are familiar with the “Vocational Preference Inventory” and Holland’s occupational classification system will quickly see the obvious similarities between the “Vocational Preference Inventory” and the Interest Inventory
For example, Holland’s classification system uses six occupational themes to characterize occupations. TABLE 36 describes these six occupational themes and compares them with the six occupational themes measured by the Interest Inventory.
TABLE 36 – OCCUPATIONAL INTEREST SCALES
Theme Code Description
VPI Enterprising (E) Aggressive, sales oriented, competitive. Assertive, dominant, need to control.
II Sales (S) Sales oriented, competitive, aggressive, assertive.
VPI Conventional (C) More financial and business data than people. Office work.
II Financial/ Administrative
(FA) Financial, more data than people. Office work.
VPI Social (S) People oriented. Welfare of others, human problems.
II People Service (PS) Helping people. Social, people oriented.
VPI Investigative (I) Scientific research activities. Intellectual, academic.
THE PROFILE T M TECHNICAL MANUAL
COPYRIGHT 1999, PROFILES INTERNATIONAL , IN C ., WA C O, TX 50
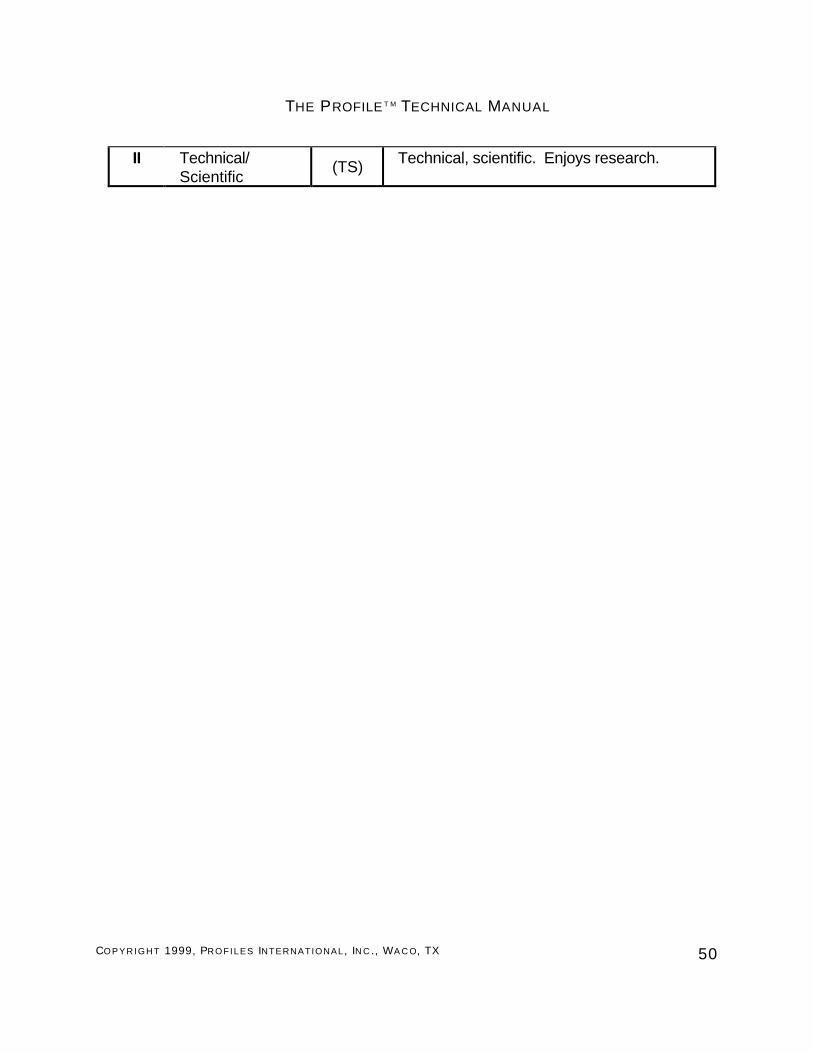
II Technical/ Scientific
(TS) Technical, scientific. Enjoys research.

THE PROFILE T M TECHNICAL MANUAL
COPYRIGHT 1999, PROFILES INTERNATIONAL , IN C ., WA C O, TX 51
Theme Code Description
VPI Realistic (R) More thing than people oriented. Work with tools, machines, outdoors.
II Mechanical (M) Mechanically inclined. More things than people.
VPI Artistic
(A) Artistically oriented, original, self expressive, emotional.
II Creative (C) Creative, artistic, expressive.
Holland’s six occupational themes are used to form a three-letter code, such as ECS, RIE, and CSE that are useful for assessing the degree of compatibility between a person’s interest and thousands of occupational codes contained in the Dictionary of Holland Occupational Codes. The premise is that the closer the match between an individual and occupational group, the more likely it is that the individual will be well suited to that occupational group. The Interest Inventory also produces three-letter codes such as S/FA/PS, M/TS/S and FA/PS/S which are compatible with the codes contained in the Dictionary of Holland Occupational Codes. The Interest Inventory can provide a guide to vocational and career exploration for individuals to have a general idea of their occupational preferences, have established a career and want to examine similar career, or are re-entering the workforce with a general idea of the type of work that would be interesting and enjoyable.
DEVELOPMENT OF THE OCCUPATIONAL INTEREST INVENTORY
The questions and scales for the Interest Inventory were developed in accordance with the following guidelines:
n The questions should be generally well understood. n The questions should be a representative and systematic sampling of
relatively independent and relevant theme - related occupations. n The questions should produce six theme-related scales which are
independent from each other and homogeneous (internally consistent). n The questions should be more applicable with professional, white-collar,
salaried occupations than with entry level, blue collar, hourly positions. n The questions should be generally neutral with regard to gender.
THE PROFILE T M TECHNICAL MANUAL
COPYRIGHT 1999, PROFILES INTERNATIONAL , IN C ., WA C O, TX 52
n The questions and scales should be compatible with the Self Directed Search (1994), Vocational Preference Inventory (1985) and the Dictionary of Holland Occupational Codes (1989).
Description of the Six General Occupational Themes
The Interest Inventory consists of 84 occupational titles that represent six general occupational themes. Descriptive phrases for the six occupational themes include:
Theme One
♦ Mechanically inclined.
♦ Machines, tools, equipment.
♦ Outdoors, physical, hands-on
♦ More things than people.
The word “Mechanical” (M) summarizes this occupational theme. Typical theme-related occupations include: building contractor, mechanical engineer, land surveyor.
Theme Two
♦ Technical
♦ Scientific
♦ Research
The word “Technical/Scientific” (TS) was selected to summarize this occupational theme. Typical theme-related occupations include: physician, meteorologist, geologist, medical research scientist.
Theme Three
♦ Creative
♦ Artistic
♦ Expressive
♦ Imaginative
THE PROFILE T M TECHNICAL MANUAL
COPYRIGHT 1999, PROFILES INTERNATIONAL , IN C ., WA C O, TX 53
This is the “Creative” (C) occupational theme. Typical theme-related occupations are: commercial artist, musical arranger, author, landscape designer.

THE PROFILE T M TECHNICAL MANUAL
COPYRIGHT 1999, PROFILES INTERNATIONAL , IN C ., WA C O, TX 54
Theme Four ♦ People services
♦ Helping people
♦ Social
♦ People oriented
The words “People Service” (PS) summarize this occupational theme. Typical theme-related occupations include: teacher, social case worker, physical therapist, camp director.
Theme Five
♦ Persuasive
♦ Assertive
♦ Aggressive
♦ Competitive
♦ Direct and demanding
The word “Sales” (S) is used to summarize this occupational theme. Typical theme-related occupations are: advertising executive, real estate developer, retail store manager.
Theme Six
♦ Financial
♦ Administrative
♦ Office
♦ Business procedures
♦ More data than people
The words “Financial/Administrative” (FA) were selected to summarize this occupational theme. Typical theme-related occupations are: controller, loan officer, auditor, accountant.
Question Selection

THE PROFILE T M TECHNICAL MANUAL
COPYRIGHT 1999, PROFILES INTERNATIONAL , IN C ., WA C O, TX 55
Questions for the six general occupational theme scales were selected in a series of rational-empirical steps. The first form of the Interest Inventory was developed by reviewing the interest and occupational literature and the 12,860 occupations contained in the DOT and it’s Supplements. With this information as a guide, six scales were developed by selecting occupational titles that most closely reflected a scale theme and rationale. The six theme scales were then tested statistically and revised accordingly (See Section 4.0 Summary of Results).
For example, the People Service scale consists of occupational titles that imply people helping others, welfare skills and activities. Typical titles included are: physical therapist, vocational counselor, psychologist and social case worker.
DESCRIPTIVE STATISTICS
The Interest Inventory was administered individually and in small groups to 573 applicants and job incumbents. The sample consisted of a cross-section of the ages, income levels, educational levels, and gender. These participants represent a diverse range of positions, companies and industries. Test data was gathered over a two-year period (1995-1997).
TABLE 37 contains the average scores and standard deviations for the six Interest Inventory theme-related scales. Appendix D contains Percentile Norms for a sample of 1750 job applicants and incumbents representing a wide and diverse range of industries, companies and occupations.
TABLE 37—DESCRIPTIVE STATISTICS, OCCUPATIONAL INTERESTS (N=573)
Occupational Theme Scale
Average Score Standard Deviation
Mechanical (M) 5.7 3.8 Technical/Scientific (TS) 4.1 3.0 People Service (PS) 6.2 4.0 Financial/Administrative (FA) 6.0 4.2 Sales (S) 8.7 3.7 Creative (C) 5.4 3.9

THE PROFILE T M TECHNICAL MANUAL
COPYRIGHT 1999, PROFILES INTERNATIONAL , IN C ., WA C O, TX 56
RELIABILITY ANALYSES
No measure can be of much value unless it measures in a reliable or consistent manner. Reliability refers to the consistency of test scores obtained by the same person when retested with the same test on different occasions. Since all types of reliability are concerned with the degree of consistency between two independently derived sets of test scores, they can all be expressed in terms of a correlation coefficient.
Coefficient Alpha Reliability Analysis
Coefficient alpha is a statistical measure of reliability. It is a statistic that indicates the consistency of responses of individual test questions. The higher a test’s coefficient alpha, the more consistent the questions are for that test. A test with a low coefficient alpha is a test that produces different or inconsistent scores each time the same person takes the test. A high coefficient alpha, however, indicates the test produces similar or consistent scores each time the same person takes the test.
TABLE 38 contains coefficient alpha correlations for the six Interest Inventory scales.
TABLE 38: OCCUPATIONAL INTEREST, COEFFICIENT ALPHA M TS C PS S FA Coefficient Alpha: .83 .77 .86 .86 .82 .88
According to TABLE 38, coefficient alpha correlations range from .77 (Technical/Scientific) to .88 (Financial/Administrative). The average coefficient alpha for the six occupational scales is .84. Therefore, the coefficient alpha reliability analysis clearly indicates that the Interest Inventory is a very reliable measuring instrument.
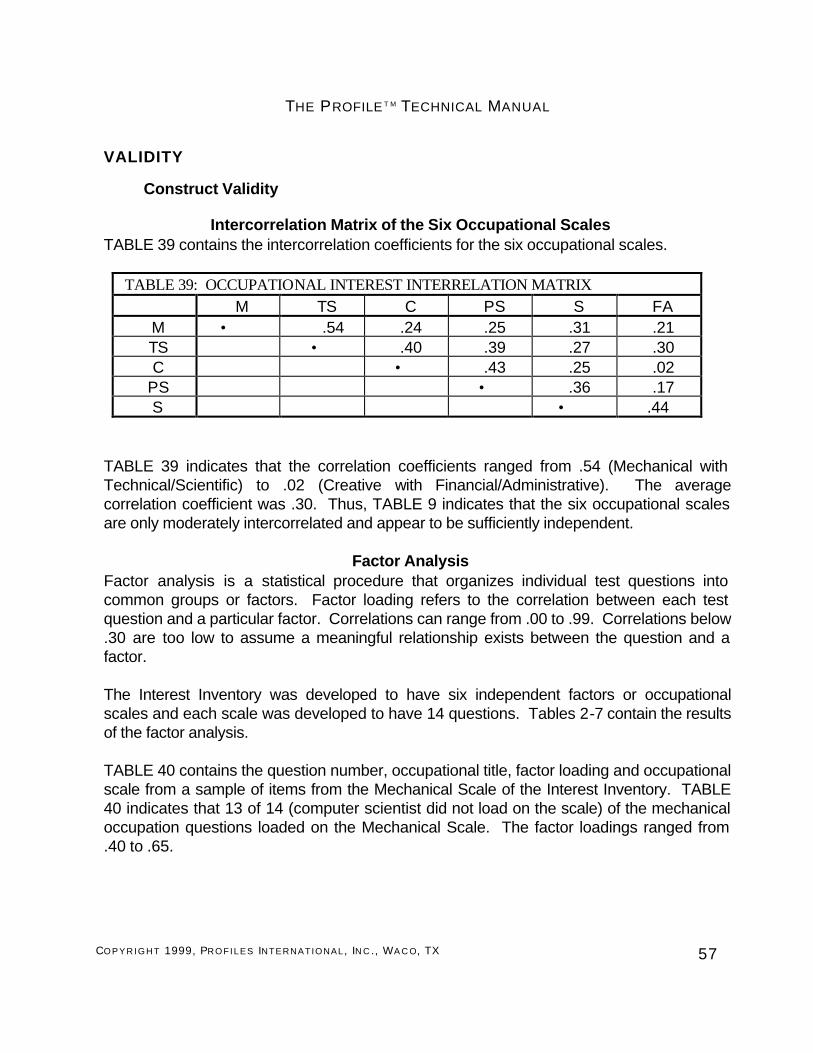
THE PROFILE T M TECHNICAL MANUAL
COPYRIGHT 1999, PROFILES INTERNATIONAL, IN C ., WA C O, TX 57
VALIDITY
Construct Validity
Intercorrelation Matrix of the Six Occupational Scales TABLE 39 contains the intercorrelation coefficients for the six occupational scales.
TABLE 39: OCCUPATIONAL INTEREST INTERRELATION MATRIX
M TS C PS S FA M • .54 .24 .25 .31 .21 TS • .40 .39 .27 .30 C • .43 .25 .02
PS • .36 .17 S • .44
TABLE 39 indicates that the correlation coefficients ranged from .54 (Mechanical with Technical/Scientific) to .02 (Creative with Financial/Administrative). The average correlation coefficient was .30. Thus, TABLE 9 indicates that the six occupational scales are only moderately intercorrelated and appear to be sufficiently independent.
Factor Analysis
Factor analysis is a statistical procedure that organizes individual test questions into common groups or factors. Factor loading refers to the correlation between each test question and a particular factor. Correlations can range from .00 to .99. Correlations below .30 are too low to assume a meaningful relationship exists between the question and a factor.
The Interest Inventory was developed to have six independent factors or occupational scales and each scale was developed to have 14 questions. Tables 2-7 contain the results of the factor analysis.
TABLE 40 contains the question number, occupational title, factor loading and occupational scale from a sample of items from the Mechanical Scale of the Interest Inventory. TABLE 40 indicates that 13 of 14 (computer scientist did not load on the scale) of the mechanical occupation questions loaded on the Mechanical Scale. The factor loadings ranged from .40 to .65.
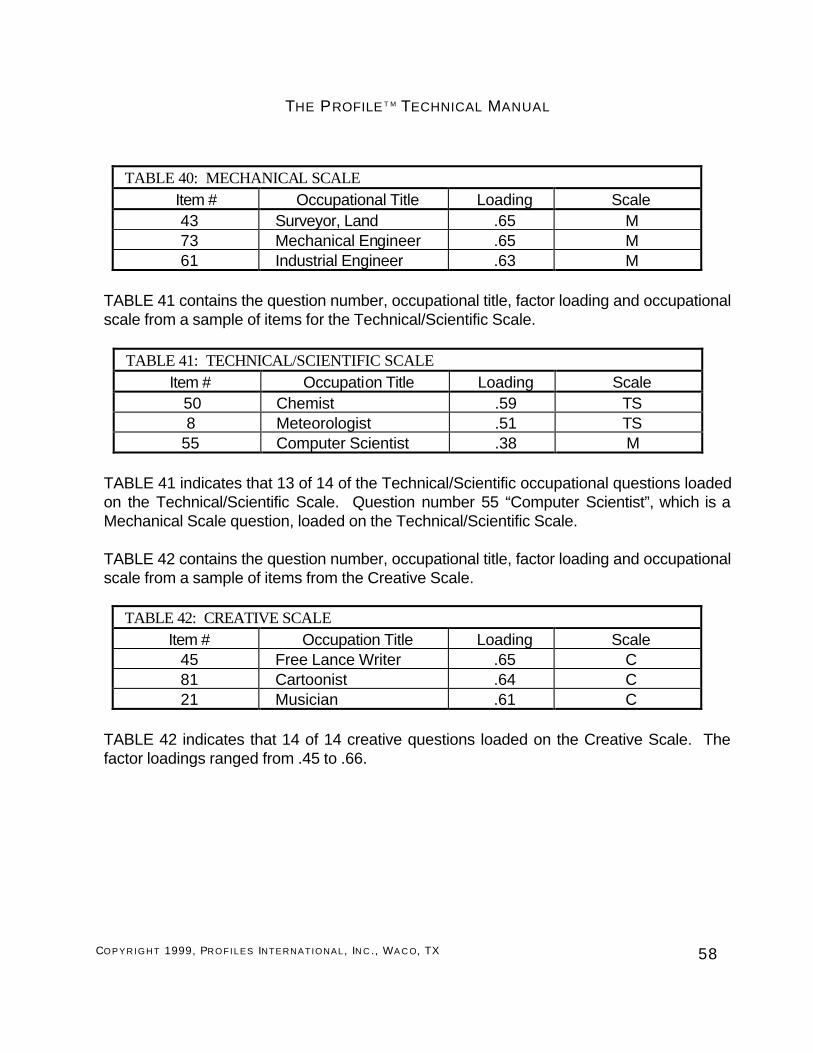
THE PROFILE T M TECHNICAL MANUAL
COPYRIGHT 1999, PROFILES INTERNATIONAL , IN C ., WA C O, TX 58
TABLE 40: MECHANICAL SCALE
Item # Occupational Title Loading Scale 43 Surveyor, Land .65 M 73 Mechanical Engineer .65 M 61 Industrial Engineer .63 M
TABLE 41 contains the question number, occupational title, factor loading and occupational scale from a sample of items for the Technical/Scientific Scale.
TABLE 41: TECHNICAL/SCIENTIFIC SCALE
Item # Occupation Title Loading Scale 50 Chemist .59 TS 8 Meteorologist .51 TS
55 Computer Scientist .38 M
TABLE 41 indicates that 13 of 14 of the Technical/Scientific occupational questions loaded on the Technical/Scientific Scale. Question number 55 “Computer Scientist”, which is a Mechanical Scale question, loaded on the Technical/Scientific Scale.
TABLE 42 contains the question number, occupational title, factor loading and occupational scale from a sample of items from the Creative Scale.
TABLE 42: CREATIVE SCALE Item # Occupation Title Loading Scale
45 Free Lance Writer .65 C 81 Cartoonist .64 C 21 Musician .61 C
TABLE 42 indicates that 14 of 14 creative questions loaded on the Creative Scale. The factor loadings ranged from .45 to .66.

THE PROFILE T M TECHNICAL MANUAL
COPYRIGHT 1999, PROFILES INTERNATIONAL , IN C ., WA C O, TX 59
TABLE 43 contains the question number, occupational title, factor loading and occupational scale from a sample of items from the People Service Scale.
TABLE 43: PEOPLE SERVICE SCALE
Item # Occupation Title Loading Scale 82 Voc./Career Counselor .70 PS 34 Social Case Worker .69 PS 58 Psychologist .63 PS
TABLE 43 indicates that 14 of 14 People Service questions loaded on the People Service Scale. The factor loadings range from .40 to .70.
TABLE 44 contains the question number, occupational title, factor loading and occupational scale from a sample of items from the Sales Scale.
TABLE 44: SALES SCALE
Item # Occupation Title Loading Scale 83 Sales Manager .65 S 23 Advertising Executive .61 S 77 Real Estate Broker .58 S
TABLE 44 indicates that 14 of 14 of the Sales questions loaded on the Sales Scale. The factor loadings ranged from .48 to .65.
TABLE 45 contains the question number, occupational title, factor loading and occupational scale from a sample of items from the Financial/Administrative Scale.
TABLE 45: FINANCIAL/ADMINISTRATIVE SCALE
Item # Occupation Title Loading Scale 78 Financial Analyst .76 FA 84 Bank Examiner .68 FA 54 Auditor .62 FA
TABLE 45 indicates that 14 of 14 of the Financial/Administrative questions loaded on the Financial/Administrative Scale. The factor loadings ranged from .42 to .76.
In conclusion, the results of the factor analysis clearly show that the Interest Inventory consists of six independent scales, each consisting of 14 questions that correlate highly

THE PROFILE T M TECHNICAL MANUAL
COPYRIGHT 1999, PROFILES INTERNATIONAL , IN C ., WA C O, TX 60
among themselves and correlate very little with questions in the other scales. With the exception of Question #55 (Computer Scientist, change from Technical/Scientific to Mechanical Scale) and Question #80 (Market Research Analyst, change from Financial/Administrative to Technical/Scientific Scale), the results of this analysis indicate that the six occupational scales are homogeneous and independent.
Concurrent Validity
Concurrent Validity is primarily concerned with determining whether relevant criterion groups such as sales people, engineers, and accountants have occupational interest patterns that would be predicted by the Interest Inventory. The Interest Inventory has been shown to classify various occupational groups in ways that are consistent with scale meanings.
For example, TABLE 46 contains the average scale scores for a group of Sales (n=99) and Construction (n=74) applicants for a large volume national homebuilder.
TABLE 46 - OCCUPATIONAL INTEREST INVENTORY, SALES AND CONSTRUCTION APPLICANTS
M TS PS FA S C SalesApplicants (n=99)
4** 4 7** 3 11** 7
Construction Applicants (n=74)
9** 5 4** 4 7** 5
*p<.05 ** p<.01
TABLE 46 clearly indicates that the average scale score for the Sales applicants was significantly higher on the Sales (avg.=11; t=4.70) and People Service (avg.=7; t=4.20) Scales than for the group of Construction applicants (Sales avg.=7, People Service avg.=4). In addition, the Construction applicant group scored significantly higher on the Mechanical Scale (avg.=9; t=3.20) when compared with the Sales applicants (avg.=4). TABLE 47 contains the high point profiles for these two groups of applicants.
TABLE 47 – OCCUPATIONAL INTEREST INVENTORY, SALES AND CONSTRUCTION APPLICANTS
M TS PS FA S C

THE PROFILE T M TECHNICAL MANUAL
COPYRIGHT 1999, PROFILES INTERNATIONAL , IN C ., WA C O, TX 61
Sales Applicants (n=99)
04% 12% 72% 12%
Construction Applicants (n=74)
51% 06% 10% 02% 23% 08%
According to TABLE 47, 72 percent of the Sales applicants had a Sales high point profile, whereas 51 percent of the Construction applicants had a Mechanical high point profile. These findings indicate that the Interest Inventory categorized job applicants in ways which are compatible with the scale meanings.
TABLE 48 contains the average scale scores for a group of incumbent Chief Accountants (n=43) and Accounting Managers (n=30) who were employed with an international wholesale food distributor. Within this organization, Chief Accountants are primarily financial specialists, whereas Accounting Managers are required to directly manage a staff of accountants and financial personnel and are more involved in the daily business activities of the organization. Thus, both groups of employees would be expected to share a high Financial/Administrative interest scale score. The Accounting Manager group, however, would be expected to have a higher average score on the Sales Scale when compared with the Chief Accountants. TABLE 48 - OCCUPATIONAL INTEREST INVENTORY, CHIEF ACCOUNTANTS AND ACCOUNTING MANAGERS
M TS PS FA S C Chief Accountants (n=43)
6 5 5 8 6** 5
Accounting Managers (n=30)
6 5 5 8 9** 5
* p<.05 ** p<.01
According to TABLE 48, both groups of incumbents had very similar interest patterns. As predicted, however, the Accounting Managers had a significantly higher average score on the Sales Scale (avg.=9; t=2.7) when compared with the Chief Accountants (avg.=6).
TABLE 49 contains the high point profile for the combined Chief Accountant and Accounting Manager groups (n=73) and a third group of employees consisting of 57 Division Controllers from the same organization.

THE PROFILE T M TECHNICAL MANUAL
COPYRIGHT 1999, PROFILES INTERNATIONAL , IN C ., WA C O, TX 62
TABLE 49 - OCCUPATIONAL INTEREST INVENTORY, CHIEF ACCOUNTANTS & ACCOUNTING MANAGERS AND CONTROLLERS
M TS PS FA S C Chief Accountants & Accounting Managers (n=73)
14% 14% 05% 44% 19% 04%
Controllers (n=57)
04% 17% 04% 52% 23%
TABLE 49 indicates that the Interest Inventory produced results that are consistent with the scale meanings. Both groups of employees had a Financial/Administrative high point profile.
Analysis of Interest Inventory scale scores for a large national multi-family property development and management company has also produced positive results. Interest Inventory scales have been shown to discriminate among Leasing Consultants, Property Maintenance Supervisors and Project Manager/Construction Superintendent applicants.
TABLE 50 contains the average Interest Inventory scale scores for Leasing Consultant (n=65), Maintenance Supervisor (n=34) and Project Manager/Construction Superintendent (n=33) applicants.
TABLE 50 - OCCUPATIONAL INTEREST INVENTORY, LEASING CONSULTANT, MAINTENANCE SUPERVISORS AND PROJECT MGRS./CONST. SUPTS
M TS PS FA S C Leasing Consultant (n=65)
3** 5 9** 5 10** 8
Maintenance Supervisors (n=34)
9** 6 5** 4 6** 4**
Project Mgrs./Const. Supts (n=33)
8** 6 5** 6 6** 5**
* p<.05 ** p<.001 TABLE 50 indicates that although there were no significant differences in average scale scores between the Maintenance Supervisor and Project Manager/Construction Superintendent groups, the Leasing Consultant group had significantly higher average scores for the Sales (avg.=10; t=5.1), People Service (avg.=9; t=4.2)and the Creative
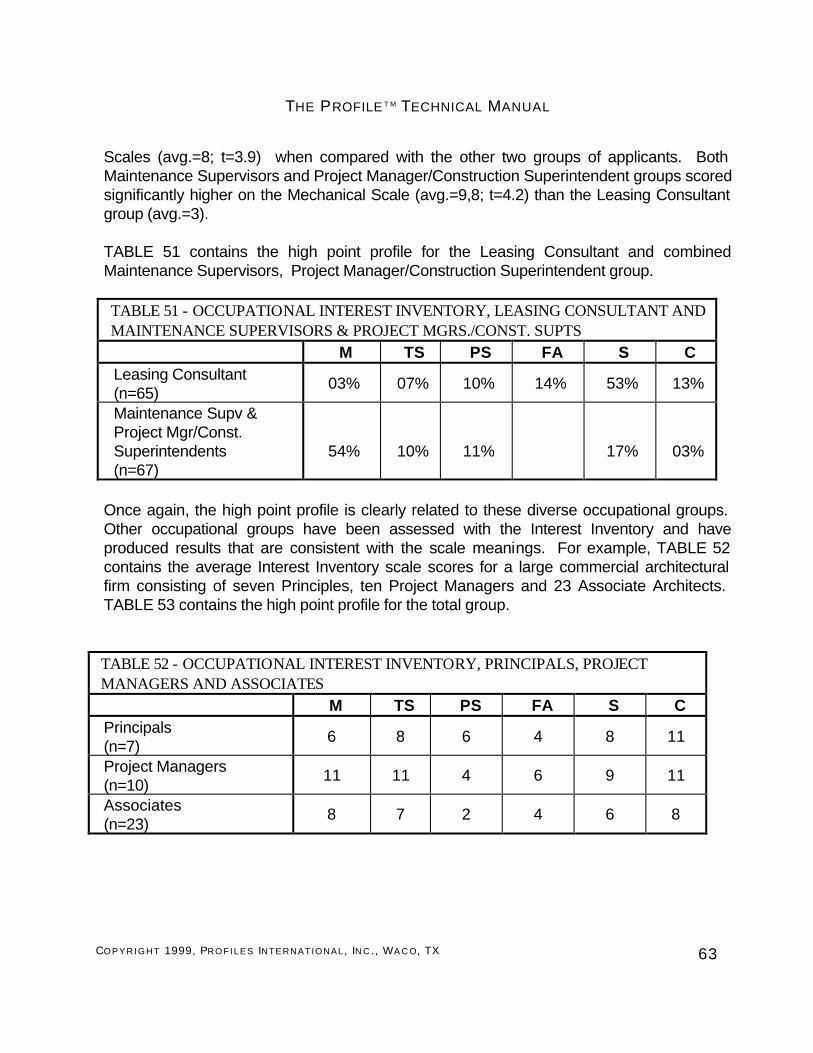
THE PROFILE T M TECHNICAL MANUAL
COPYRIGHT 1999, PROFILES INTERNATIONAL , IN C ., WA C O, TX 63
Scales (avg.=8; t=3.9) when compared with the other two groups of applicants. Both Maintenance Supervisors and Project Manager/Construction Superintendent groups scored significantly higher on the Mechanical Scale (avg.=9,8; t=4.2) than the Leasing Consultant group (avg.=3).
TABLE 51 contains the high point profile for the Leasing Consultant and combined Maintenance Supervisors, Project Manager/Construction Superintendent group.
TABLE 51 - OCCUPATIONAL INTEREST INVENTORY, LEASING CONSULTANT AND MAINTENANCE SUPERVISORS & PROJECT MGRS./CONST. SUPTS
M TS PS FA S C Leasing Consultant (n=65)
03% 07% 10% 14% 53% 13%
Maintenance Supv & Project Mgr/Const. Superintendents (n=67)
54%
10%
11%
17%
03%
Once again, the high point profile is clearly related to these diverse occupational groups. Other occupational groups have been assessed with the Interest Inventory and have produced results that are consistent with the scale meanings. For example, TABLE 52 contains the average Interest Inventory scale scores for a large commercial architectural firm consisting of seven Principles, ten Project Managers and 23 Associate Architects. TABLE 53 contains the high point profile for the total group. TABLE 52 - OCCUPATIONAL INTEREST INVENTORY, PRINCIPALS, PROJECT MANAGERS AND ASSOCIATES
M TS PS FA S C Principals (n=7)
6 8 6 4 8 11
Project Managers (n=10)
11 11 4 6 9 11
Associates (n=23)
8 7 2 4 6 8
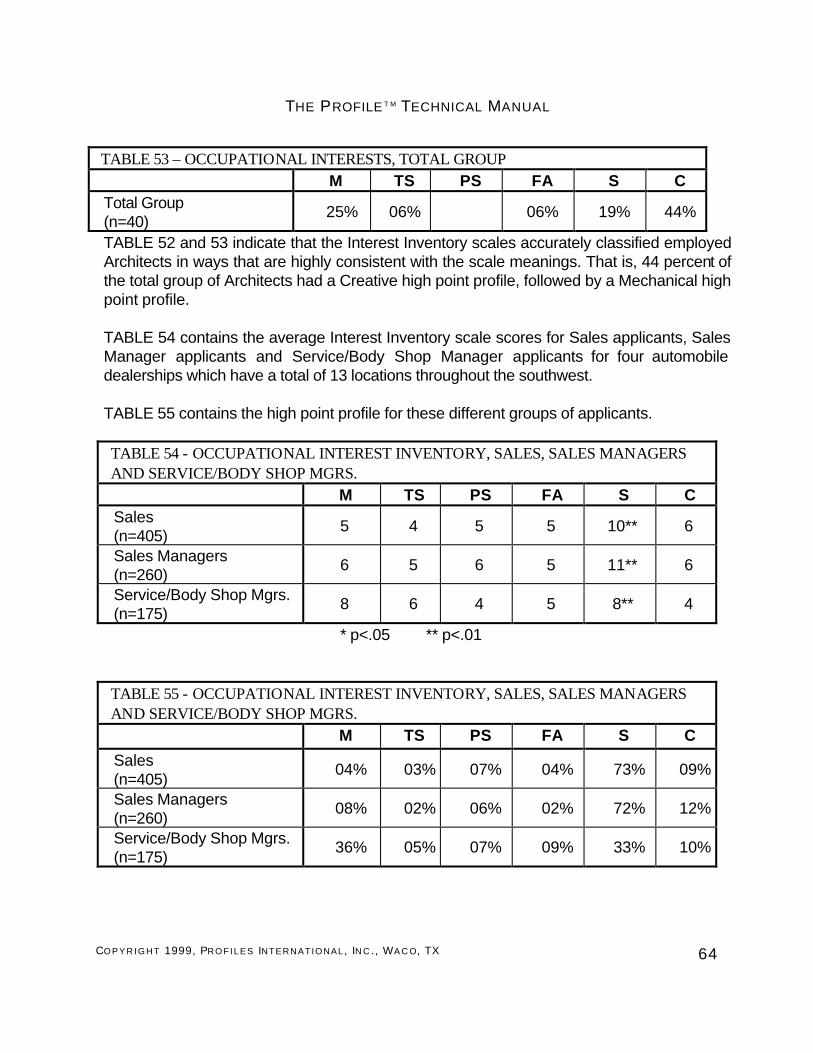
THE PROFILE T M TECHNICAL MANUAL
COPYRIGHT 1999, PROFILES INTERNATIONAL , IN C ., WA C O, TX 64
TABLE 53 – OCCUPATIONAL INTERESTS, TOTAL GROUP M TS PS FA S C
Total Group (n=40)
25% 06% 06% 19% 44%
TABLE 52 and 53 indicate that the Interest Inventory scales accurately classified employed Architects in ways that are highly consistent with the scale meanings. That is, 44 percent of the total group of Architects had a Creative high point profile, followed by a Mechanical high point profile.
TABLE 54 contains the average Interest Inventory scale scores for Sales applicants, Sales Manager applicants and Service/Body Shop Manager applicants for four automobile dealerships which have a total of 13 locations throughout the southwest. TABLE 55 contains the high point profile for these different groups of applicants.
TABLE 54 - OCCUPATIONAL INTEREST INVENTORY, SALES, SALES MANAGERS AND SERVICE/BODY SHOP MGRS.
M TS PS FA S C Sales (n=405)
5 4 5 5 10** 6
Sales Managers (n=260)
6 5 6 5 11** 6
Service/Body Shop Mgrs. (n=175)
8 6 4 5 8** 4
* p<.05 ** p<.01
TABLE 55 - OCCUPATIONAL INTEREST INVENTORY, SALES, SALES MANAGERS AND SERVICE/BODY SHOP MGRS.
M TS PS FA S C
Sales (n=405)
04% 03% 07% 04% 73% 09%
Sales Managers (n=260)
08% 02% 06% 02% 72% 12%
Service/Body Shop Mgrs. (n=175)
36% 05% 07% 09% 33% 10%

THE PROFILE T M TECHNICAL MANUAL
COPYRIGHT 1999, PROFILES INTERNATIONAL , IN C ., WA C O, TX 65
TABLE 54 indicates that the Sales and Sales Manager group were significantly higher on the Sales Scale (avg.=10,11; t=4.7) when compared with the Service and Body Shop Manager applicants (avg.=8). TABLE 55 indicates that more than 70 percent of the Sales and Sales Manager applicants had a Sales high point profile compared with 33 percent of the Service and Body Shop Managers. Thirty-six percent of the Service and Body Shop Managers had a Mechanical high point profile compared with only three percent of the Sales and Sales Manager applicants.
Summary of Concurrent Validity Analysis
TABLE 56 contains the average Interest Inventory scale scores for diverse groups of job applicants, employed individuals and college students.
TABLE 56 – AVERAGE OCCUPATIONAL INTEREST SCORE BY JOB TITLE
Sample Sample Size
M TS PS FA S C
New Home Sales 99 4 4 7 3 11 7 Home Construction 74 9 5 4 4 7 5 Chief Accountants 43 6 5 5 8 6 4 Accounting Managers 30 6 5 5 8 9 5 Leasing Consultants 65 3 5 9 5 10 8 Maintenance Supervisors 34 9 6 5 4 6 4 Project Mgr./Const. Superintendents
33 8 6 5 6 6 5
Architect (Principles) 7 6 8 6 4 8 11 Architect (Project Managers) 10 11 11 4 6 9 11 Architect (Associates) 23 8 7 2 4 6 8 Auto Sales 405 5 4 5 5 10 6 Auto Sales Managers 260 6 5 6 5 11 6 Service/Body Shop Managers 175 8 6 4 5 8 4 Division Controllers 57 5 4 3 7 8 3 Property Mgrs. (Apartments) 130 3 4 9 5 10 5 District Mgrs. (Apartments) 26 5 4 7 7 9 5 College Seniors (Bus./Mktg.) 189 5 4 6 8 12 5 Property Mgrs./Leasing Consultants
54 3 4 9 4 9 7
According to TABLE 56, the Interest Inventory scales clearly discriminate among these diverse groups and consistently categorize or classify these groups in ways that are highly compatible with the scale meanings.

THE PROFILE T M TECHNICAL MANUAL
COPYRIGHT 1999, PROFILES INTERNATIONAL , IN C ., WA C O, TX 66
Predictive Validity
Congruence refers to the degree of fit between a person and a job or organization. It has been argued that the greater the degree of similarity between an employee’s occupational interests and the interests called for in the job, the more likely it is that there will be a successful match and that the employee will perform the job well and stay with it. Tables 57, 58 and 59 support this argument.
For example, 58 incumbent Apartment Property Managers, 14 Assistant Property Managers and 18 Leasing Consultants were administered the Interest Inventory . Approximately two years later, 29 of these employees had separated from the organization for various reasons. TABLE 57 contains the average Interest Inventory scale scores for the 29 separated and 25 employees who were still employed.
TABLE 57 – OCCUPATIONAL INTEREST SCORES OF PROPERTY MANAGEMENT PROFESSIONALS
M TS PS FA S C Employed (n=25)
4 4 9* 5 10* 5
Separated (n=29)
2 4 7* 3 8* 7
* p<.05 ** p<.01 TABLE 57 indicates that the average scale score for the 25 employed individuals was significantly higher for People Service (avg.=9; t=2.6) and Sales (avg.=10; t=2.8) when compared with the separated individuals (People Service avg.=7, Sales avg.=8).
TABLE 58 contains the average scale scores for a group of 130 Property Managers who were employed with a large national apartment property management company.
TABLE 58 also contains the average scale score for 12 of these 130 Property Managers who were identified by their District Managers, Regional Vice Presidents and Training Managers as the top producing Property Managers in this organization.
TABLE 58 – OCCUPATIONAL INTERESTS AND PERFORMANCE OF PROPERTY MANAGERS
M TS PS FA S C

THE PROFILE T M TECHNICAL MANUAL
COPYRIGHT 1999, PROFILES INTERNATIONAL , IN C ., WA C O, TX 67
Property Managers (n=130)
4 4 5* 6 8* 6
Top Producers (n=12)
5 6 8* 6 11* 7
* p<.05 ** p<.01
TABLE 58 indicates that the top producing Property Managers scored significantly higher on the People Service (avg.=8; t=3.6) and Sales (avg.=11; t=3.4) Scales of the Interest Inventory when compared with a large sample of their co-workers.
TABLE 59 contains the average Interest Inventory scale scores for a group of 29 District Property Managers who were rated by their Regional Vice Presidents as “Above Average” performers with a group of 21 District Property Managers who were rated as “Below Average” performers. These two groups of District Managers were employed with a large international residential property management organization consisting of 90 District Managers. TABLE 59 indicates that the “Above Average” District Managers scored significantly higher on the People Service (avg.=9; t=3.6) and Sales (avg.=10; t=3.0) Scales of the Interest Inventory when compared with the “Below Average” District Managers.
TABLE 59 OCCUPATIONAL INTERESTS AND PERFORMANCE OF DISTRICT MANAGERS
M TS PS FA S C Above Average (n=29)
5 5 9** 8 10* 7
Below Average (n=21)
5 4 5** 7 7* 6
* p<.05 ** p<.01
ETHNICITY AND GENDER
The results of the Occupational Interests section were analyzed in regard to the effects of gender and ethnicity on the results. The Group F subjects were 96 adults was from a mixed sales and management background. They represented a mixture of males, females, Blacks, Hispanics and Whites. In the area of Interests a difference between males and females is typically found. In this study the men showed a little higher occupational interest in the Mechanical area. All other areas for men and women were not statistically different.
THE PROFILE T M TECHNICAL MANUAL
COPYRIGHT 1999, PROFILES INTERNATIONAL , IN C ., WA C O, TX 68
In regard to ethnicity, Blacks showed slightly greater interest in the Financial area than Whites, while there was no difference in this area between Hispanics and Whites. There was a difference between Hispanics and Whites, with Whites showing higher interest in Enterprising, People Service, Technical and Creative. The variation in means between these two groups ranged from .25 SD to .71 SD, with an average difference of .41 SD in these four areas. The results of this study are shown in TABLES 60, 61, 62 and 63.

THE PROFILE T M TECHNICAL MANUAL
COPYRIGHT 1999, PROFILES INTERNATIONAL , IN C ., WA C O, TX 69
TABLE 60- GROUP F, GENDER, INTERESTS
(N = 88)
mean Std error
95% Confidence Interval
Scale Gender N t df Sig. diff dif lower upper
Enterprising Male Female
38 50
-.39 86 .70 -.35 .90 -2.13 1.44
Financial Male Female
38 50
-.64 86 .52 -.50 .77 -2.04 1.04
People Service Male Female
38 50
-.66 86 .514 -.59 .91 -2.40 1.21
Technical Male Female
38 50
.40 86 .687 .30 .75 -1.18 1.79
Mechanical Male Female
38 50
-1.80 86 .08 -1.18 .66 -2.49 .12
Creative Male Female
38 50
-.52 86 .60 -.48 .92 -2.32 1.35
TABLE 61- GROUP F, ETHNICITY, INTERESTS
(N = 55)
mean Std error
95% Confidence Interval
Scale Ethnicity N t df Sig. diff dif lower upper
Enterprising Black White
17 38
-1.00 53 .92 -.12 1.16 -2.45 2.22
Financial Black White
17 38
1.40 53 .17 1.59 1.14 -.69 3.87
People Service Black White
17 38
-.28 53 .78 -.31 1.10 -2.51 1.90
Technical Black White
17 38
-.51 53 .61 -.59 1.14 -2.88 1.71
Mechanical Black White
17 38
.49 53 .63 .42 .86 -1.30 2.14
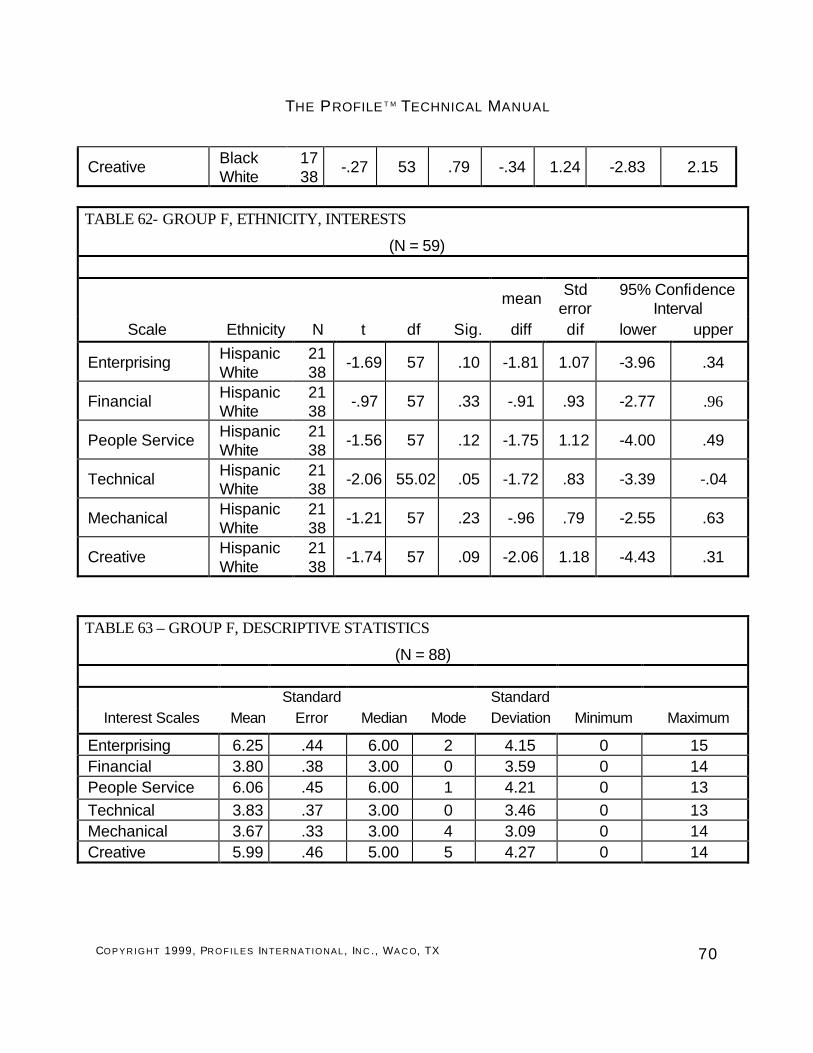
THE PROFILE T M TECHNICAL MANUAL
COPYRIGHT 1999, PROFILES INTERNATIONAL , IN C ., WA C O, TX 70
Creative Black White
17 38
-.27 53 .79 -.34 1.24 -2.83 2.15
TABLE 62- GROUP F, ETHNICITY, INTERESTS
(N = 59)
mean Std error
95% Confidence Interval
Scale Ethnicity N t df Sig. diff dif lower upper
Enterprising Hispanic White
21 38
-1.69 57 .10 -1.81 1.07 -3.96 .34
Financial Hispanic White
21 38
-.97 57 .33 -.91 .93 -2.77 .96
People Service Hispanic White
21 38
-1.56 57 .12 -1.75 1.12 -4.00 .49
Technical Hispanic White
21 38
-2.06 55.02 .05 -1.72 .83 -3.39 -.04
Mechanical Hispanic White
21 38
-1.21 57 .23 -.96 .79 -2.55 .63
Creative Hispanic White
21 38
-1.74 57 .09 -2.06 1.18 -4.43 .31
TABLE 63 – GROUP F, DESCRIPTIVE STATISTICS
(N = 88) Standard Standard
Interest Scales Mean Error Median Mode Deviation Minimum Maximum
Enterprising 6.25 .44 6.00 2 4.15 0 15 Financial 3.80 .38 3.00 0 3.59 0 14 People Service 6.06 .45 6.00 1 4.21 0 13 Technical 3.83 .37 3.00 0 3.46 0 13 Mechanical 3.67 .33 3.00 4 3.09 0 14 Creative 5.99 .46 5.00 5 4.27 0 14

THE PROFILE T M TECHNICAL MANUAL
COPYRIGHT 1999, PROFILES INTERNATIONAL , IN C ., WA C O, TX 71
SUMMARY AND CONCLUSIONS
In conclusion, the concurrent and predictive validity data summarized in this manual consistently support the thesis that employees well matched with their occupations and with the organizations in which they are employed are inclined to be satisfied, to remain with their employer, and to be productive employees. A diverse range of relevant criterion groups such as sales, financial, construction and architects tend to have occupational interest profiles that are predicted and are consistent with the scale meanings. In addition, work outcome measures such as turnover and work performance have been demonstrated to be significantly related to Interest Inventory scale scores. Therefore, the Interest Inventory provides accurate and useful information for pre-employment screening and placement, and for occupational and career guidance.
It can be argued that the greater the degree of similarity between a person’s occupational interest and the interest called for in the job, the more likely it is that there will be a successful match and that the person will be more satisfied, remain in their job and perform the job well. The results of our studies clearly supports this “Best Fit” job screening and placement strategy. Analysis of the Interest Inventory has indicated the following:
n The Interest Inventory contains six scales which are internally consistent and
independent from each other. n The Interest Inventory is a highly reliable measuring instrument.
n The Interest Inventory has been shown to categorize or classify job applicants
and employed individuals in ways which are consistent with the scale meanings.
n High point scale profiles have been shown to be significantly related to
specific occupational groups.
n The Interest Inventory has been shown to predict statistically significant differences in average scale scores for diverse occupational groups and for work outcome measures.

THE PROFILE T M TECHNICAL MANUAL
COPYRIGHT 1999, PROFILES INTERNATIONAL , IN C ., WA C O, TX 72
THINKING STYLE
OVERVIEW OF THE THINKING STYLE TEST
Consisting of 84 multiple-choice questions, the Thinking Style section began as the Test of General Learning (TOGL). The TOGL was developed as an individually administered test of verbal skills, numerical skills, learning skills and quantitative reasoning skills.
♦ This test is a good measure of a person's flexibility and comfort level in different
learning settings.
♦ It has been validated and shown to be job-related in both school and industry.
♦ When used with a selection and training program, the TOGL has been shown to be a valuable tool for assessing employees' potential.
It is intended for use only with individuals who are familiar with the English language. It is not to be used to assess individuals who are illiterate.
DEVELOPMENT OF THE THINKING STYLE SECTION
The initial development work was done in 1988. A large pool of questions was developed consisting of both numeric and verbal learning questions. The questions were submitted to an item analysis where the best questions were selected by type and level of difficulty. The questions were arranged in order of increasing difficulty with numeric and verbal questions in repeating pattern order.
Initially the test consisted of 42 questions comprising the Numerical Leaning Scale and 42 questions comprising the Verbal Learning Scale. The numeric portion of the test asks an individual to respond to a number series, a calculation or a word problem. For verbal questions, the test asks a person to render a synonym or antonym.
To facilitate analysis of the results in The Profile, these two scales were later divided into four scales. The Verbal Learning Scale became the Verbal Skill Scale (18 questions) and Verbal Reasoning Scale (20 questions), and the Numerical Learning Scale became the Numerical Ability Scale (22 questions) and Numeric Reasoning Scale (17 questions). This gave a total of seventy-seven questions for the Thinking Style section.
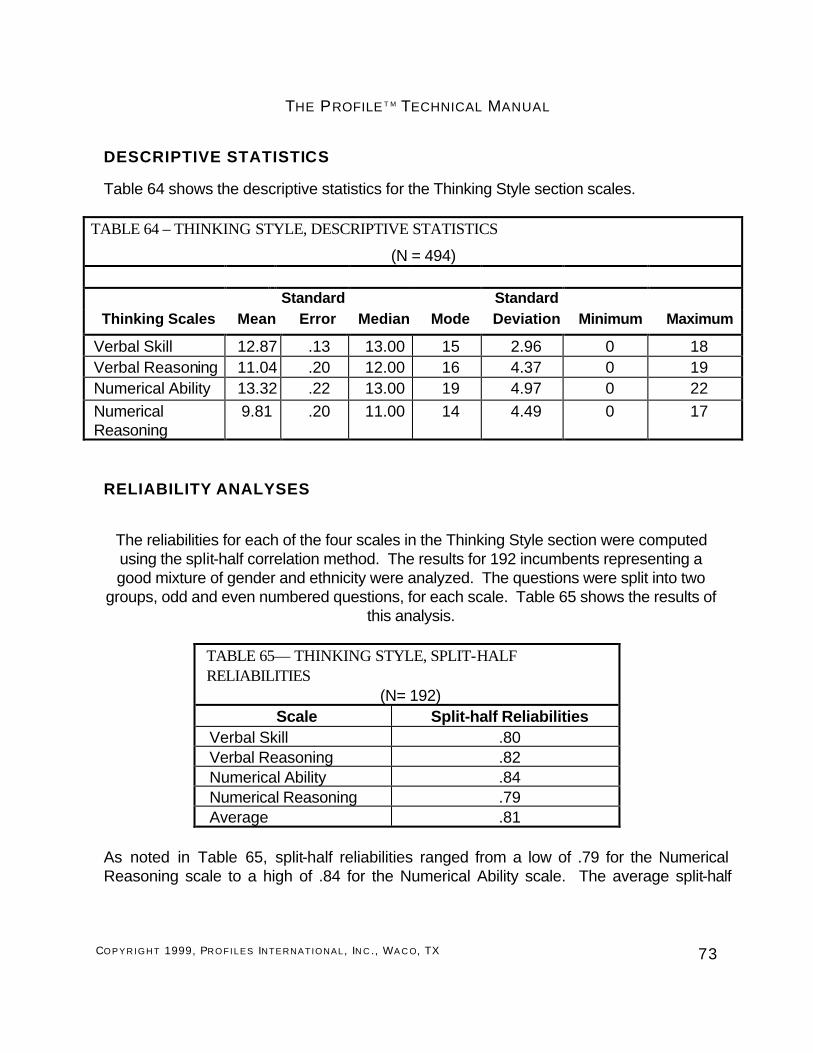
THE PROFILE T M TECHNICAL MANUAL
COPYRIGHT 1999, PROFILES INTERNATIONAL , IN C ., WA C O, TX 73
DESCRIPTIVE STATISTICS
Table 64 shows the descriptive statistics for the Thinking Style section scales.
TABLE 64 – THINKING STYLE, DESCRIPTIVE STATISTICS
(N = 494) Standard Standard
Thinking Scales Mean Error Median Mode Deviation Minimum Maximum
Verbal Skill 12.87 .13 13.00 15 2.96 0 18 Verbal Reasoning 11.04 .20 12.00 16 4.37 0 19 Numerical Ability 13.32 .22 13.00 19 4.97 0 22 Numerical Reasoning
9.81 .20 11.00 14 4.49 0 17
RELIABILITY ANALYSES
The reliabilities for each of the four scales in the Thinking Style section were computed using the split-half correlation method. The results for 192 incumbents representing a good mixture of gender and ethnicity were analyzed. The questions were split into two
groups, odd and even numbered questions, for each scale. Table 65 shows the results of this analysis.
TABLE 65— THINKING STYLE, SPLIT-HALF RELIABILITIES
(N= 192) Scale Split-half Reliabilities
Verbal Skill .80 Verbal Reasoning .82 Numerical Ability .84 Numerical Reasoning .79 Average .81
As noted in Table 65, split-half reliabilities ranged from a low of .79 for the Numerical Reasoning scale to a high of .84 for the Numerical Ability scale. The average split-half

THE PROFILE T M TECHNICAL MANUAL
COPYRIGHT 1999, PROFILES INTERNATIONAL , IN C ., WA C O, TX 74
reliability for these four scales was .81. These reliability scores suggest that the four Thinking Style section scales are reliable and produce consistent results.
VALIDITY
Validity in the Educational Environment
A number of studies have been conducted in the educational environment using ninth grade through graduate level individuals. The correlation between educational achievement and TOGL scores are summarized in the Table 66 below. Only significant findings are reported.
TABLE 66- PREDICTING EDUCATIONAL ACHIEVEMENT
Correlations
Criterion Verbal Numerical Total N
Grade Point Total
.61 .54 .58 325
Science Grades
.44 .52 .46 225
Math Grades .38 .63 .58 139
English Grades
.59 .41 .50 160
Sample consists of an ethnically mixed group of individuals ranging in age from 15 to 28 with the mean age being 19. Ethnic composition of sample is Blacks (13%), Hispanics
(18%), Asian Americans (1.2%), American Indians (.3%) and Whites (67.5%).
Validity in the Industrial Environment
Since 1988 the instrument has been used for pre-employment selection and career counseling. The individual TOGL as well as the overall profile (a composite look at all pertinent test results and scales) have been studied through content, concurrent and predictive validation. 3,260 individuals have been sampled in 52 studies examining 110 job titles in 15 industries. Samples consisted of ethnically mixed individuals whose age ranges were from 17 through 68. The TOGL has been established as a useful instrument for predicting job performance in a number of occupational settings. Below are listed Table 67 which describe the occupational titles and results as well as tables describing samples that consisted of ethnically mixed individuals.
THE PROFILE T M TECHNICAL MANUAL
COPYRIGHT 1999, PROFILES INTERNATIONAL , IN C ., WA C O, TX 75

THE PROFILE T M TECHNICAL MANUAL
COPYRIGHT 1999, PROFILES INTERNATIONAL , IN C ., WA C O, TX 76
Correlations Occupational Title Verbal Numerical Total N
Senior Level Managers .54 .32 .44 275 Mid Level Managers .34 .28 .29 430 Branch Managers .41 .26 .37 112 Retail Store Managers .42 .27 .29 80
Shift Supervisors .29 .28 .28 110 Teller Supervisors .33 .34 .33 55
Sales Representatives .45 .25 .36 655 Customer Service Rep. .37 .22 .30 255 New Accounts Managers .29 .31 .30 90 Executive Secretary .43 .32 .38 37 Auditors .14 .35 .25 29 Engineers .13 .42 .28 37 Programmer Analysts .22 .34 .28 42 Programmers .27 .36 .33 65 Computer Operators .31 .29 .30 35
Sales Coordinator .35 .22 .29 59 Order Desk Clerk .25 .29 .27 52 Administrative Assistants .13 .18 .15 31 Clerk - Level I .25 .21 .23 54 Bank Teller .11 .24 .15 96 AR/AP Clerks .27 .31 .29 41
Total .36 .23 .30 2640
All reported results are significant at the .05 level or better.
Studies performed between 1986 - 1991.
Supervisory ratings were used as criteria in each of these studies, in
addition, sales levels were used for sales positions.
Table 67- Predicting Job Performance

THE PROFILE T M TECHNICAL MANUAL
COPYRIGHT 1999, PROFILES INTERNATIONAL , IN C ., WA C O, TX 77
ETHNICITY AND GENDER
Several small studies were conducted with the Thinking Style section in four sub-sections to help establish norms for the instrument and to investigate the relationship between the results of the instrument, gender and ethnicity. It is interesting to note that the impact of the results of these studies reflect a wide variation of impact from both ethnicity and gender. Because they were conducted with five different organizations, the number of subjects varies from about 40 to 400, as noted in the tables which follow.
All studies are reported in the following tables, even those with low representation in some of the sub-groups. This allows the reader to see all of the data and make an informed interpretation. The ethnic and gender ratios may be gleaned from the data provided in each table and so no additional comments are made as to mixtures. In most cases, there were a few participants who did not provide all of their demographic information, which had an impact on the overall totals. If such data were available they were used.
Group A Summary
Group A consists of 45 adults who were members of a service organization. The primary areas of note in tables 68 - 71 are ethnicity. While Blacks did not score as high as Whites on 3 scales, there were only 9 in the Black group.
TABLE 68- GROUP A, GENDER, THINKING
(N = 44)
mean Std error
95% Confidence Interval
Scale Gender N t df Sig. diff dif lower upper
Verbal Skill Male Female
20 24
-1.97 42 .056 -2.02 1.03 -4.10 .05
Verbal Reasoning
Male Female
20 24
.082 42 .935 .100 1.22 -2.36 2.56
Numerical Ability Male Female
20 24
-.153 42 .879 -.175 1.14 -2.48 2.12
Numerical Reasoning
Male Female
20 24
-.671 42 .506 -1.00 1.49 -4.01 2.01

THE PROFILE T M TECHNICAL MANUAL
COPYRIGHT 1999, PROFILES INTERNATIONAL , IN C ., WA C O, TX 78
TABLE 69- GROUP A, BLACK-WHITE, THINKING
(N = 22)
mean Std error
95% Confidence Interval
Scale Ethnicity N t df Sig. diff dif lower upper
Verbal Skill Black White
9 13
.882 20 .388 1.53 1.74 -2.09 5.15
Verbal Reasoning
Black White
9 13
3.86 20 .001 4.91 1.27 2.26 7.55
Numerical Ability Black White
9 13
5.34 20 .000 6.35 1.19 3.87 8.83
Numerical Reasoning
Black White
9 13
3.51 20 .002 5.79 1.65 2.35 9.22
TABLE 70- GROUP A, HISPANIC-WHITE, THINKING
(N = 26)
mean Std error
95% Confidence Interval
Scale Ethnicity N t df Sig. diff dif lower upper
Verbal Skill Hispanic White
13 13
1.65 26 .111 1.71 1.04 -.422 3.84
Verbal Reasoning
Hispanic White
13 13
2.90 26 .007 3.73 1.28 1.09 6.36
Numerical Ability
Hispanic White
13 13
.298 26 .768 .262 .878 -1.54 2.07
Numerical Reasoning
Hispanic White
13 13
1.76 26 .090 3.03 1.72 -.502 6.56

THE PROFILE T M TECHNICAL MANUAL
COPYRIGHT 1999, PROFILES INTERNATIONAL , IN C ., WA C O, TX 79
TABLE 71—GROUP A, DESCRIPTIVE STATISTICS
(N = 45) Standard Standard
Thinking Scales Mean Error Median Mode Deviation Minimum Maximum
Verbal Skill 13.24 .52 15.00 15 3.48 0 18 Verbal Reasoning 11.62 .59 12.00 8 3.97 0 19 Numerical Ability 18.07 .55 19.00 21 3.68 8 22 Numerical Reasoning
10.84 .72 13.00 14 4.84 0 17
Group B Summary There were eighty-eight in group B (Tables 72, 73, 74 & 75). They represented employees from two different companies. This is the only study where one group differed significantly from another across all scales, the Hispanics scored lower than the Whites. In all cases, the variance between means was less than 2/3rds SD, and suggests a true difference between the persons who made up each group.
TABLE 72- GROUP B, GENDER, THINKING
(N = 83)
mean Std error
95% Confidence Interval
Scale Gender N t df Sig. diff dif lower upper
Verbal Skill Male Female
38 45
-2.135 81 .036 -1.35 .63 -2.60 -.09
Verbal Reasoning
Male Female
38 45
.135 81 .893 .11 .82 -1.52 1.74
Numerical Ability Male Female
38 45
-.178 81 .860 -.26 1.45 -3.15 2.63
Numerical Reasoning
Male Female
38 45
-.60 81 .553 -.54 .91 -2.36 1.27

THE PROFILE T M TECHNICAL MANUAL
COPYRIGHT 1999, PROFILES INTERNATIONAL , IN C ., WA C O, TX 80
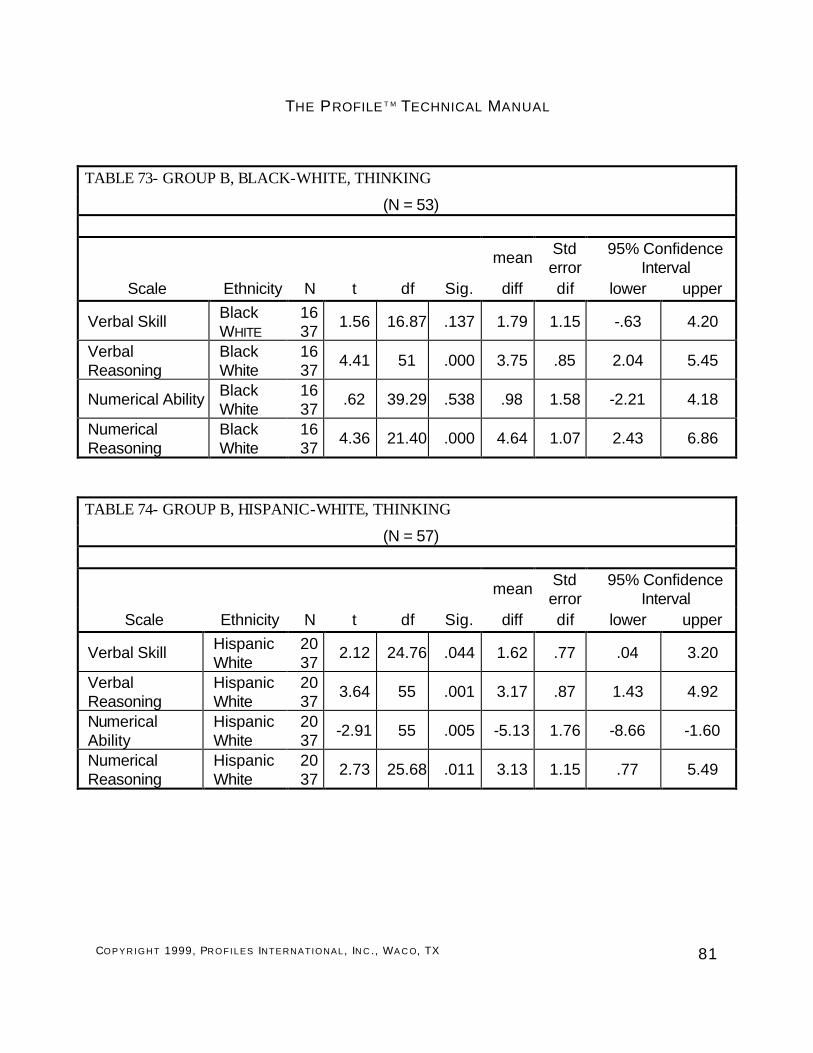
THE PROFILE T M TECHNICAL MANUAL
COPYRIGHT 1999, PROFILES INTERNATIONAL , IN C ., WA C O, TX 81
TABLE 73- GROUP B, BLACK-WHITE, THINKING
(N = 53)
mean Std error
95% Confidence Interval
Scale Ethnicity N t df Sig. diff dif lower upper
Verbal Skill Black WHITE
16 37
1.56 16.87 .137 1.79 1.15 -.63 4.20
Verbal Reasoning
Black White
16 37
4.41 51 .000 3.75 .85 2.04 5.45
Numerical Ability Black White
16 37
.62 39.29 .538 .98 1.58 -2.21 4.18
Numerical Reasoning
Black White
16 37
4.36 21.40 .000 4.64 1.07 2.43 6.86
TABLE 74- GROUP B, HISPANIC-WHITE, THINKING
(N = 57)
mean Std error
95% Confidence Interval
Scale Ethnicity N t df Sig. diff dif lower upper
Verbal Skill Hispanic White
20 37
2.12 24.76 .044 1.62 .77 .04 3.20
Verbal Reasoning
Hispanic White
20 37
3.64 55 .001 3.17 .87 1.43 4.92
Numerical Ability
Hispanic White
20 37
-2.91 55 .005 -5.13 1.76 -8.66 -1.60
Numerical Reasoning
Hispanic White
20 37
2.73 25.68 .011 3.13 1.15 .77 5.49

THE PROFILE T M TECHNICAL MANUAL
COPYRIGHT 1999, PROFILES INTERNATIONAL , IN C ., WA C O, TX 82
TABLE 75 – GROUP B, DESCRIPTIVE STATISTICS
(N = 88) Standard Standard
Thinking Scales Mean Error Median Mode Deviation Minimum Maximum
Verbal Skill 14.02 .32 15.00 15 3.03 0 18 Verbal Reasoning 12.49 .42 13.00 13 3.90 0 19 Numerical Ability 12.23 .70 9.00 6 6.59 3 22 Numerical Reasoning
11.97 .45 13.00 14 4.21 0 17
Group C Summary In a study of 43 salespersons, analysis of the group C results shows a significance between Blacks and Whites on only the numerical reasoning scale and the verbal reasoning scale. No significance is shown on the other ten scales.
TABLE 76- GROUP C, GENDER, THINKING
(N = 39)
mean Std error
95% Confidence Interval
Scale Gender N t df Sig. diff dif lower upper
Verbal Skill Male Female
18 21
-1.18 37 .25 -6.11 .518 -1.66 .439
Verbal Reasoning
Male Female
18 21
.092 37 .93 .09 .9527 -1.84 2.02
Numerical Ability Male Female
18 21
-.624 37 .54 -.175 .280 -.741 .392
Numerical Reasoning
Male Female
18 21
-.093 37 .93 -.007 .768 -1.63 1.49

THE PROFILE T M TECHNICAL MANUAL
COPYRIGHT 1999, PROFILES INTERNATIONAL , IN C ., WA C O, TX 83
TABLE 77- GROUP C, BLACK-WHITE, THINKING
(N = 31)
mean Std error
95% Confidence Interval
Scale Ethnicity N t df Sig. diff dif lower upper
Verbal Skill Black White
7 24
2.52 29 .017 1.62 .642 .306 2.93
Verbal Reasoning
Black White
7 24
1.88 29 .070 2.14 1.14 -.186 4.46
Numerical Ability Black White
7 24
1.12 29 2.73 .434 .389 -.362 1.23
Numerical Reasoning
Black White
7 24
3.22 29 .003 2.54 .789 .927 4.16
TABLE 78- GROUP C, HISPANIC-WHITE, THINKING
(N = 29)
mean Std error
95% Confidence Interval
Scale Ethnicity N t df Sig. diff dif lower upper
Verbal Skill Hispanic White
5 24
-.368 27 .715 -.267 .724 -1.18 1.22
Verbal Reasoning
Hispanic White
5 24
.804 27 .428 1.11 1.38 -1.72 3.94
Numerical Ability
Hispanic White
5 24
-.811 27 .425 -.308 .380 -1.09 .472
Numerical Reasoning
Hispanic White
5 24
1.41 27 .169 1.34 .950 -.607 3.29

THE PROFILE T M TECHNICAL MANUAL
COPYRIGHT 1999, PROFILES INTERNATIONAL , IN C ., WA C O, TX 84
TABLE 79- GROUP C, DESCRIPTIVE STATISTICS
(N = 43) Standard Standard
Thinking Scales Mean Error Median Mode Deviation Minimum Maximum
Verbal Skill 14.84 .34 15.00 16 2.22 5 18 Verbal Reasoning 13.40 .56 14.00 13 3.65 0 19 Numerical Ability 6.12 .15 6.00 6 .98 3 8 Numerical Reasoning
13.14 .47 14.00 14 3.08 0 17
Group D Summary
In a larger study of 406 workers from a computer company (group D), significant differences were found in both verbal scales and the Numerical Reasoning scale. With
this size study it is not surprising that the variance between the means averages less than 1/2 SD for all scales where significance was shown.
TABLE 80- GROUP D, GENDER, ABILITIES
(N = 321)
mean Std error
95% Confidence Interval
Scale Gender N t df Sig. diff dif lower upper
Verbal Skill Male Female
175 146
3.34 275 .001 .982 .294 .403 1.56
Verbal Reasoning
Male Female
175 146
2.29 319 .023 1.06 .465 .151 1.98
Numerical Ability
Male Female
175 146
.643 298 .521 .311 .483 -.640 1.26
Numerical Reasoning
Male Female
175 146
1.92 319 .055 .922 .480 -.02 1.87

THE PROFILE T M TECHNICAL MANUAL
COPYRIGHT 1999, PROFILES INTERNATIONAL , IN C ., WA C O, TX 85
TABLE 81- GROUP D, BLACK-WHITE, THINKING
(N = 182)
mean Std error
95% Confidence Interval
Scale Ethnicity N t df Sig. diff dif lower upper
Verbal Skill Black White
72 110
4.08 180 .000 1.45 .356 .750 2.16
Verbal Reasoning Black White
72 110
4.18 180 .000 2.57 .616 1.36 3.79
Numerical Ability Black White
72 110
.916 180 .361 .602 .657 -.695 1.90
Numerical Reasoning
Black White
72 110
1.94 180 .055 1.28 .662 -.02 2.59
TABLE 82- GROUP D, HISPANIC-WHITE, THINKING
(N = 201)
mean Std error
95% Confidence Interval
Scale Ethnicity N t df Sig. diff dif lower upper
Verbal Skill Hispanic White
91 110
3.64 176 .000 1.32 .363 .605 2.04
Verbal Reasoning
Hispanic White
91 110
3.81 199 .000 2.06 .539 .993 3.12
Numerical Ability
Hispanic White
91 110
.525 199 .600 .321 .611 -.884 1.52
Numerical Reasoning
Hispanic White
91 110
2.89 199 .004 1.74 .603 .553 2.93

THE PROFILE T M TECHNICAL MANUAL
COPYRIGHT 1999, PROFILES INTERNATIONAL , IN C ., WA C O, TX 86
TABLE 83- GROUP D, DESCRIPTIVE STATISTICS
(N = 406) Standard Standard
Thinking Scales Mean Error Median Mode Deviation Minimum Maximum Verbal Skill 12.62 .14 13.00 15 2.89 0 18 Verbal Reasoning 10.72 .22 11.00 16 4.41 0 19 Numerical Ability 13.56 .22 13.50 19 4.51 0 22 Numerical Reasoning
9.34 .22 10.00 14 4.41 0 17
Group E Summary
A group of 51 skilled workers make up group E. As Tables 84 - 87 show, no significance was found between any of the scales for any investigated groups.
TABLE 84- GROUP E, GENDER, ABILITIES
(N = 52)
mean Std error
95% Confidence Interval
Scale Gender N t df Sig. diff dif lower upper
Verbal Skill Male Female
25 27
.434 50 .666 .234 .540 -.850 1.32
Verbal Reasoning
Male Female
25 27
.066 50 .948 -.07 .999 -2.05 1.92
Numerical Ability Male Female
25 27
.016 50 .987 .009 .557 -1.11 1.13
Numerical Reasoning
Male Female
25 27
-.239 50 .812 -.187 .781 -1.76 1.38
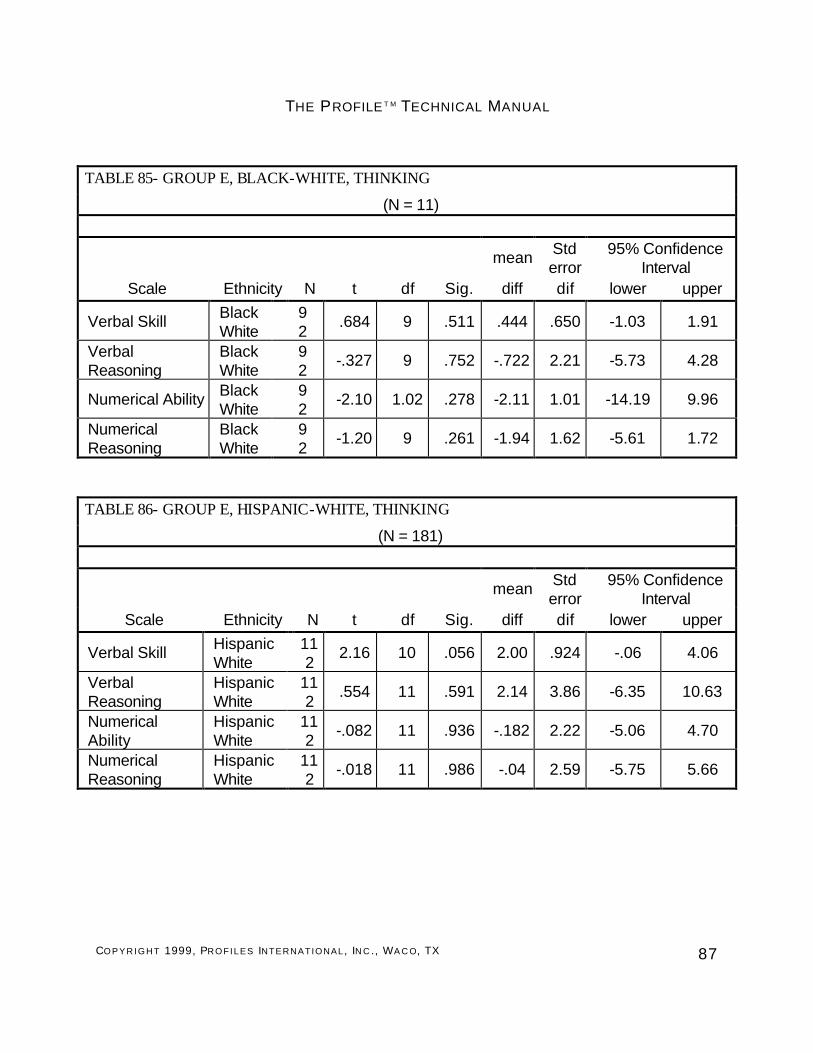
THE PROFILE T M TECHNICAL MANUAL
COPYRIGHT 1999, PROFILES INTERNATIONAL , IN C ., WA C O, TX 87
TABLE 85- GROUP E, BLACK-WHITE, THINKING
(N = 11)
mean Std error
95% Confidence Interval
Scale Ethnicity N t df Sig. diff dif lower upper
Verbal Skill Black White
9 2
.684 9 .511 .444 .650 -1.03 1.91
Verbal Reasoning
Black White
9 2
-.327 9 .752 -.722 2.21 -5.73 4.28
Numerical Ability Black White
9 2
-2.10 1.02 .278 -2.11 1.01 -14.19 9.96
Numerical Reasoning
Black White
9 2
-1.20 9 .261 -1.94 1.62 -5.61 1.72
TABLE 86- GROUP E, HISPANIC-WHITE, THINKING
(N = 181)
mean Std error
95% Confidence Interval
Scale Ethnicity N t df Sig. diff dif lower upper
Verbal Skill Hispanic White
11 2
2.16 10 .056 2.00 .924 -.06 4.06
Verbal Reasoning
Hispanic White
11 2
.554 11 .591 2.14 3.86 -6.35 10.63
Numerical Ability
Hispanic White
11 2
-.082 11 .936 -.182 2.22 -5.06 4.70
Numerical Reasoning
Hispanic White
11 2
-.018 11 .986 -.04 2.59 -5.75 5.66

THE PROFILE T M TECHNICAL MANUAL
COPYRIGHT 1999, PROFILES INTERNATIONAL , IN C ., WA C O, TX 88
TABLE 87- GROUP E --DESCRIPTIVE STATISTICS
(N = 51) Standard Standard
Thinking Scales Mean Error Median Mode Deviation Minimum Maximum
Verbal Skill 12.35 .33 13.00 12 2.38 5 17 Verbal Reasoning 11.16 .45 12.00 12 3.20 3 18 Numerical Ability 16.16 .41 16.00 19 2.96 7 21 Numerical Reasoning
10.84 .47 11.00 10 3.37 3 17
Summary All Groups
Tables 88 - 91 show the statistics for all the five groups combined. This is not an average, but rather a different group consisting of all of the members of the first five groups.
TABLE 88- ALL GROUPS, GENDER, THINKING
(N = 496)
mean Std error
95% Confidence Interval
Scale Gender N t df Sig. diff dif lower upper
Verbal Skill Male Female
250 246
2.39 485 .017 .64 2.6 .113 1.16
Verbal Reasoning
Male Female
250 246
3.24 494 .001 1.26 .389 .497 2.03
Numerical Ability Male Female
250 246
1.81 494 .071 .806 .445 -.07 1.68
Numerical Reasoning
Male Female
250 246
1.97 494 .051 .793 .402 .03 1.58

THE PROFILE T M TECHNICAL MANUAL
COPYRIGHT 1999, PROFILES INTERNATIONAL , IN C ., WA C O, TX 89
TABLE 89- ALL GROUPS, BLACK-WHITE, THINKING
(N = 280)
mean Std error
95% Confidence Interval
Scale Ethnicity N t df Sig. diff dif lower upper
Verbal Skill Black White
109 171
5.60 180 .000 1.75 .334 1.09 2.41
Verbal Reasoning Black White
109 171
6.02 278 .000 2.91 .472 1.98 3.84
Numerical Ability Black White
109 171
1.40 278 .162 .846 .603 -.341 2.03
Numerical Reasoning
Black White
109 171
4.41 278 .000 2.29 .520 1.27 3.32
TABLE 90- ALL GROUPS, HISPANIC-WHITE, THINKING
(N = 317) mean Std
error 95% Confidence
Interval Scale Ethnicity N t df Sig. diff dif lower upper
Verbal Skill Hispanic White
146 171
5.92 248 .000 1.88 .318 1.26 2.51
Verbal Reasoning
Hispanic White
146 171
6.54 315 .000 2092 .447 2.04 3.80
Numerical Ability
Hispanic White
146 171
-.07 315 .946 -.004 .562 -1.14 1.06
Numerical Reasoning
Hispanic White
146 171
5.03 315 .000 2.49 .495 1.52 3.47
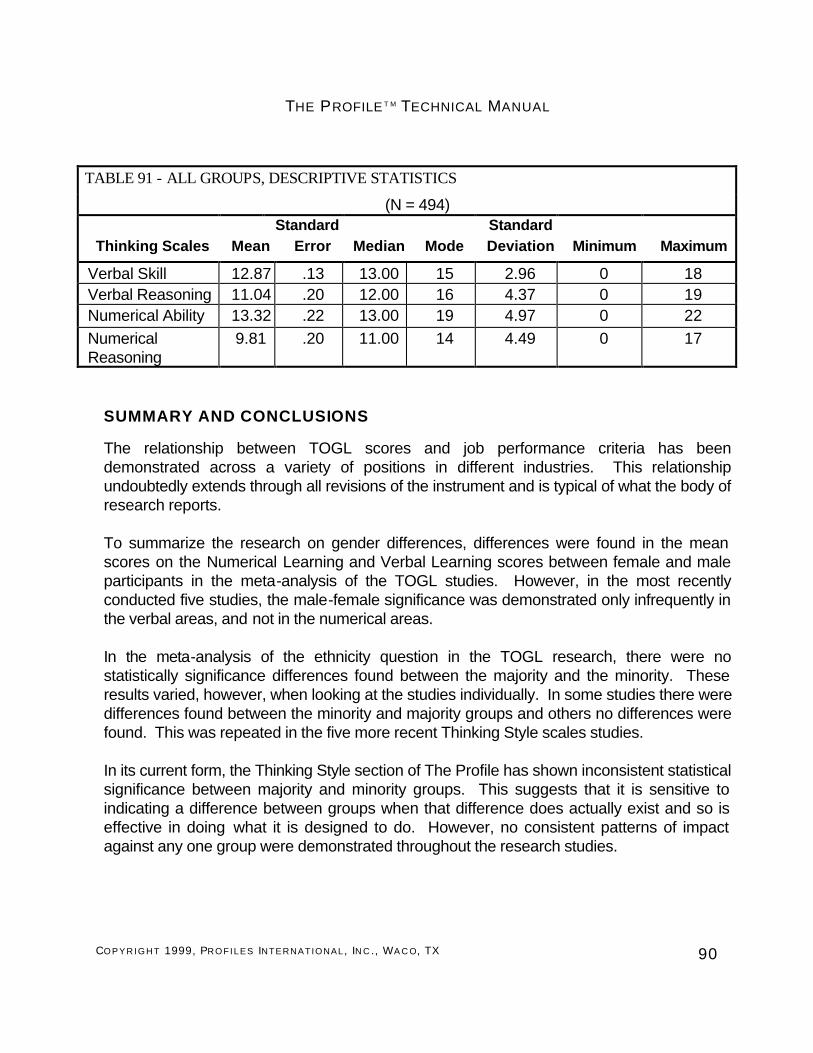
THE PROFILE T M TECHNICAL MANUAL
COPYRIGHT 1999, PROFILES INTERNATIONAL , IN C ., WA C O, TX 90
TABLE 91 - ALL GROUPS, DESCRIPTIVE STATISTICS
(N = 494) Standard Standard
Thinking Scales Mean Error Median Mode Deviation Minimum Maximum
Verbal Skill 12.87 .13 13.00 15 2.96 0 18 Verbal Reasoning 11.04 .20 12.00 16 4.37 0 19 Numerical Ability 13.32 .22 13.00 19 4.97 0 22 Numerical Reasoning
9.81 .20 11.00 14 4.49 0 17
SUMMARY AND CONCLUSIONS
The relationship between TOGL scores and job performance criteria has been demonstrated across a variety of positions in different industries. This relationship undoubtedly extends through all revisions of the instrument and is typical of what the body of research reports. To summarize the research on gender differences, differences were found in the mean scores on the Numerical Learning and Verbal Learning scores between female and male participants in the meta-analysis of the TOGL studies. However, in the most recently conducted five studies, the male-female significance was demonstrated only infrequently in the verbal areas, and not in the numerical areas. In the meta-analysis of the ethnicity question in the TOGL research, there were no statistically significance differences found between the majority and the minority. These results varied, however, when looking at the studies individually. In some studies there were differences found between the minority and majority groups and others no differences were found. This was repeated in the five more recent Thinking Style scales studies. In its current form, the Thinking Style section of The Profile has shown inconsistent statistical significance between majority and minority groups. This suggests that it is sensitive to indicating a difference between groups when that difference does actually exist and so is effective in doing what it is designed to do. However, no consistent patterns of impact against any one group were demonstrated throughout the research studies.

THE PROFILE T M TECHNICAL MANUAL
COPYRIGHT 1999, PROFILES INTERNATIONAL , IN C ., WA C O, TX 91
The relationship between TOGL scores and job performance criteria is well established in the minority, majority, male and female groups. However, the TOGL should not typically be used as a stand-alone test for employee selection. In studies performed where the entire set of individual scores was considered through building an overall composite profile resulting in a profile score and/or general rating, the TOGL scores demonstrated no adverse impact on any protected group. The Profile extends these recommendations into functionality by making the Thinking Style section a part of The Profile battery. Because all together the results from the Thinking Style section contribute only a portion for the Overall match, the practical impact of a variation of ½ SD for any one of the Thinking Style section scales is restricted to approximately 2% of the total match in the most extreme situation expected. None the less, the user is reminded to follow the recommendations from The Profile User’s Guide and established guidelines. The Equal Employment Opportunity Commission (EEOC), Department of Labor and Justice and Civil Service Commission have guidelines for the use of tests in employee selection. The Guidelines have established that an individual or organization considering using this or any test must establish a relationship between test scores and job performance in the setting where it is will be used. The Profile is designed to facilitate this process by building Job Match Patterns and using an Overall Match percentage when reviewing individuals for placement. By building Job Match Patterns with either actual top performers (concurrent study method) or by analysis of a job by those who know the job well (job performance survey method), a valid job pattern may be developed. Because the overall match to that pattern blends information about an individual’s fit in thinking, occupational interests and behavioral traits, the impact of any one scale is only a small portion of the total. This helps protect against introducing any disparate impact into the placement process.

THE PROFILE T M TECHNICAL MANUAL
COPYRIGHT 1999, PROFILES INTERNATIONAL , IN C ., WA C O, TX 92
BIBLIOGRAPHY
Gottfredson, G.D., & Holland, J.L. (1989). Dictionary of Holland occupational codes (2nd ed.) Odessa, FL: Psychological Assessment Resources. Holland, J.L. (1985a). Making vocational choices: A theory of vocational personalities and work environments. Odessa, FL: Psychological Assessment Resources. Holland, J.L. (1985b). The vocational preference inventory. Odessa, FL: Psychological Assessment Resources. Holland, J.L. (1994). The Self-Directed Search. Odessa, FL: Psychological Assessment Resources. U.S. Department of Labor (1977). Dictionary of occupational titles (4th ed.). Washington, DC: U. S. Government Printing Office. U. S. Department of Labor (1982). Dictionary of occupational titles (4th ed. Suppl., 1982). Washington, DC: U. S. Government Printing Office. U. S. Department of Labor (1986). Dictionary of occupational titles (4th ed. Suppl., 1986). Washington, DC: U. S. Government Printing Office. Barrick, M. R., & Mount, M. K. (1991). The Big Five personality dimensions and job performance. Personnel Psychology, 44, 1-26. Crocker, L. & Algina, J. (1986). Introduction to classical & modern test theory. Orlando, FL: Holt, Rinehart, and Winston, Inc. Day, D. V., & Silverman, S. B. (1989). Personality and job performance: Evidence of incremental validity. Personnel Psychology, 42, 25-35. Gordon, L.V. (1978). Gordon Personal Profile - Inventory Manual. New York: Harcourt Brace Jovanovich. Guilford, J.P., and Zimmerman, W.S. (1978). The Guilford-Zimmerman Temperament Survey: Manual of Instructions and Interpretations. Beverly Hills, CA: Sheridan Psychological Services, Inc.

THE PROFILE T M TECHNICAL MANUAL
COPYRIGHT 1999, PROFILES INTERNATIONAL , IN C ., WA C O, TX 93
Guilford, J.S., Zimmerman, W.S. and Guilford, J.P. (1976) The Guilford-Zimmerman Temperament Survey Handbook. San Diego, Ca: EDITS. Hogan, R. (1991). Personality and personality measurement. In M. Dunnette and L. Hough (Eds.), Handbook of industrial and organizational psychology (2ed.). Palo Alto: Consulting Psychologists Press. Holland, J.L (1985). “The Vocational Preference Inventory”. Odessa, FL: Psychological Assessment Resources. Holland, J.L. (1970). Vocational Preference Inventory Manual. Palo Alto, CA: Consulting Psychologist’s Press.

THE PROFILE T M TECHNICAL MANUAL
COPYRIGHT 1999, PROFILES INTERNATIONAL , IN C ., WA C O, TX 94
APPENDIX A: A BRIEF REVIEW OF THE PROFILE SCALES
I. Behavioral Traits 1. Accommodating measures a person’s general tendency to be friendly, helpful and agreeable. To be a team person. A. High Scores hCooperative hWants to make a good impression hSelf-controlled hLikeable B. Low Scores hDisagreeable hOpportunistic hUncooperative hQuick to anger 2. Assertiveness measures a person's general tendency to take charge, to be the leader. A. High Scores hTake and maintain control hExpressive hAchievement oriented hLeadership B. Low Scores hNonassertive hMore to follow than lead hLow dominance hAvoids conflict 3. Attitude measures a person’s general tendency to have a positive attitude. A. High Scores hOptimistic hTrusting hTolerant hPatient

THE PROFILE T M TECHNICAL MANUAL
COPYRIGHT 1999, PROFILES INTERNATIONAL , IN C ., WA C O, TX 95
B. Low Scores hSuspicious hResentful hCritical hDissatisfied 4. Energy Level measures a person’s tendency to be self-motivated, energetic, to show a high sense of urgency and a capacity for a fast pace. A. High Scores hSelf starter hResults oriented hGood vitality hSelf motivated B. Low Scores hSlow to take action hSporadic drive hHesitant hLimited intensity 5. Independence measures a person’s general tendency to make their own decisions, to be self reliant, to take independent action. A. High Scores hIndependent hAdventurous hSlow to follow hSlow to conform B. Low Scores hDependent hSeeks support hCautious hPredictable 6. Objective Judgement measures a person’s general tendency to be objective in decision making. A. High Scores hSensible

THE PROFILE T M TECHNICAL MANUAL
COPYRIGHT 1999, PROFILES INTERNATIONAL , IN C ., WA C O, TX 96
hMentally tough hUnemotional hUses common sense B. Low Scores hSubjective hWishful thinking hInconsistent judgement hEmotional thinking 7. Sociability measures a person’s general tendency to be people oriented, to be socially active and outgoing. A. High Scores hConversational hPeople oriented hApproachable B. Low Scores hSocially distant hSticks to business hAvoids small talk hKeeps to one’s self 8. Manageability measures the tendency to follow policies, accept external controls and supervision, and work within the rules. A. High Scores hCooperative and agreeable hAccepts supervision and external controls hComfortable with authority and rules B. Low Scores hGenerally cautious regarding authority hTends to defend point of view hTends to relate to authority in a defensive manner 9. Decisiveness uses the available information to make decisions quickly. A. High Scores hQuick to act hAccepts the risks associated with their decisions

THE PROFILE T M TECHNICAL MANUAL
COPYRIGHT 1999, PROFILES INTERNATIONAL , IN C ., WA C O, TX 97
hTypically confident of decisions B. Low Scores hMakes conservative decisions hTends to pursue problems slowly, taking little risk hPrefers to carefully analyze the situation before making a decision II. Thinking Style 10. Learning Index – an index of expected learning, reasoning and problem solving potential ; a composite of the scores for Verbal Skill, Verbal Reasoning, Numerical Ability, & Numeric Reasoning. 11. Verbal Skill – a measure of verbal skill through vocabulary. 12. Verbal Reasoning – using words as a basis in reasoning and problem solving. 13. Numerical Ability – a measure of numeric calculation ability. 14. Numeric Reasoning – using numbers as a basis in reasoning and probem solving III. Occupational Interests 15. Enterprising indicates an interest in occupations where they use persuasiveness and enjoy presenting plans. Characterized by being: äBusiness minded äProfit-oriented äCompetitive äDirect Representative occupations that tend to share this interest include: chamber of commerce executives, management consultants, sales engineers, sales representatives, entrepreneurs, business owners, managers in public and private recreation settings, hotel and recreation managers, inventors and architects.

THE PROFILE T M TECHNICAL MANUAL
COPYRIGHT 1999, PROFILES INTERNATIONAL , IN C ., WA C O, TX 98
16. Financial/Administrative indicates interest in occupations that work with financial data, business systems, administrative procedures, etc. Characterized by enjoying: ä Financial Tasks ä Administrative Organization ä Office Work ä Business Procedures Representative occupations that tend to share this interest include: bankers, attorneys, historians, journalists, freelance writers, economists, administrative managers and factory managers. 17. People Service indicates interest in occupations that help people and are concerned with the welfare of others. Characterized by: äFacilitation skills äHelping others äSocial awareness Representative occupations that tend to share this interest include: social workers, psychologists, social welfare directors, physicians, pediatricians, labor relations managers, employment managers, HR professionals and college professors. 18. Technical indicates interest in occupations that center on scientific and technical activities, research and intellectual skills. Characterized by using: äIntellectual approaches äScientific study äResearch methods Representative occupations that tend to share this interest include: physicists, mathematicians, statisticians, engineers, computer programmers, inventors and research analysts. 19. Mechanical indicates interest in occupations that work with tools, equipment and machinery.
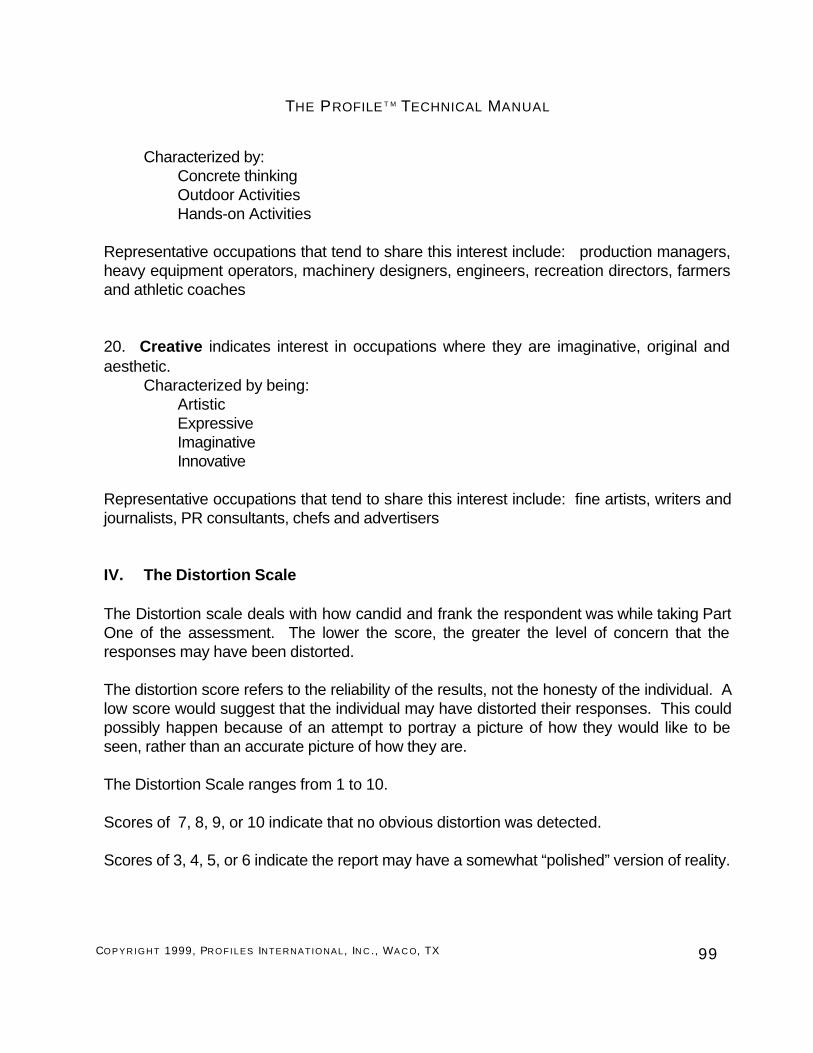
THE PROFILE T M TECHNICAL MANUAL
COPYRIGHT 1999, PROFILES INTERNATIONAL, IN C ., WA C O, TX 99
Characterized by: äConcrete thinking äOutdoor Activities äHands-on Activities Representative occupations that tend to share this interest include: production managers, heavy equipment operators, machinery designers, engineers, recreation directors, farmers and athletic coaches 20. Creative indicates interest in occupations where they are imaginative, original and aesthetic. Characterized by being: äArtistic äExpressive äImaginative äInnovative Representative occupations that tend to share this interest include: fine artists, writers and journalists, PR consultants, chefs and advertisers IV. The Distortion Scale The Distortion scale deals with how candid and frank the respondent was while taking Part One of the assessment. The lower the score, the greater the level of concern that the responses may have been distorted. The distortion score refers to the reliability of the results, not the honesty of the individual. A low score would suggest that the individual may have distorted their responses. This could possibly happen because of an attempt to portray a picture of how they would like to be seen, rather than an accurate picture of how they are. The Distortion Scale ranges from 1 to 10. Scores of 7, 8, 9, or 10 indicate that no obvious distortion was detected. Scores of 3, 4, 5, or 6 indicate the report may have a somewhat “polished” version of reality.

THE PROFILE T M TECHNICAL MANUAL
COPYRIGHT 1999, PROFILES INTERNATIONAL, IN C ., WA C O, TX 100
Scores of 1 or 2, indicate information in the report should probably not be used in the decision-making process for that individual. Rather, other factors and information should be used to make this decision. This means, of course, that the distortion score should never be used as a basis for disqualification of an individual.