the production and implementation of … · in this study, an empirical method ... undertaken in...
TRANSCRIPT

___________________ 1 Dr., Researcher, Karlsruhe Institute of Technology, Karlsruhe, Germany, [email protected]
2 Professor, Karlsruhe Institute of Technology, Karlsruhe, Germany, [email protected]
1
THE PRODUCTION AND IMPLEMENTATION OF SOCIOECONOMIC
FRAGILITY FUNCTIONS FOR USE IN RAPID WORLDWIDE
EARTHQUAKE LOSS ESTIMATION
James Edward DANIELL1, Friedemann WENZEL
2
ABSTRACT
In this study, an empirical method using 7200 damaging earthquakes from the time period 1900-2012
and the socio-economic loss information in the CATDAT Damaging Earthquakes Database (Daniell et
al., 2011) has been established for the translation of earthquake shaking intensity into a reasonable
economic loss or cost estimate, and/or a calculation of fatalities. This has been done using a concept
called socio-economic fragility functions, which use a direct relationship of intensity to fatalities, but
are calibrated by the socioeconomic status of each individual damaging earthquake through time,
meaning that much more socio-economic information through time is used to build the functions than
in existing methodologies. An extensive amount of historical provincial and sub-provincial data as
well as reanalysis of historical events ensure that the functions produced are robust enough to be used
in other methodologies and are consistent with existing engineering fragility functions. A significant
improvement on existing empirical rapid methodologies for earthquake loss studies tested is shown.
INTRODUCTION
The production of a robust rapid loss estimate for socioeconomic impacts from earthquakes such as
fatalities and economic losses has been the goal of many existing software packages and rapid loss
algorithms (Globally – PAGER, QLARM; Europe/Asia – ELER). An extensive state-of-the-art was
undertaken in the reviewing of over 30 earthquake loss estimation packages (Daniell, 2011; Daniell et
al., 2014), as well as over 200 casualty estimation methods, 90+ intensity scales, and 400+ economic
loss functions used worldwide over the past 50 years with respect to rapid use. These were reviewed
with respect to the data needed, regional applicability and data used in their production. In addition,
the speed with which hazard data could be collected was reviewed globally, as well as the ability to
which secondary effects such as fire, landslide, liquefaction and tsunami could be split from the
shaking losses, costs and fatalities.
Many methodologies use building typology damage-derived fatality functions (Erdik et al., 2007;
Wyss, 2004; Jaiswal et al., 2011) and provide a good estimates of socioeconomic losses. Such
methods, however, require a large amount of information in a constantly changing and dynamic world
of infrastructure.
The analysis of macroseismic intensity bounds vs. the exposed population and economic exposure is
not a new concept. The first empirical intensity-population death rate calculations were studied via
2
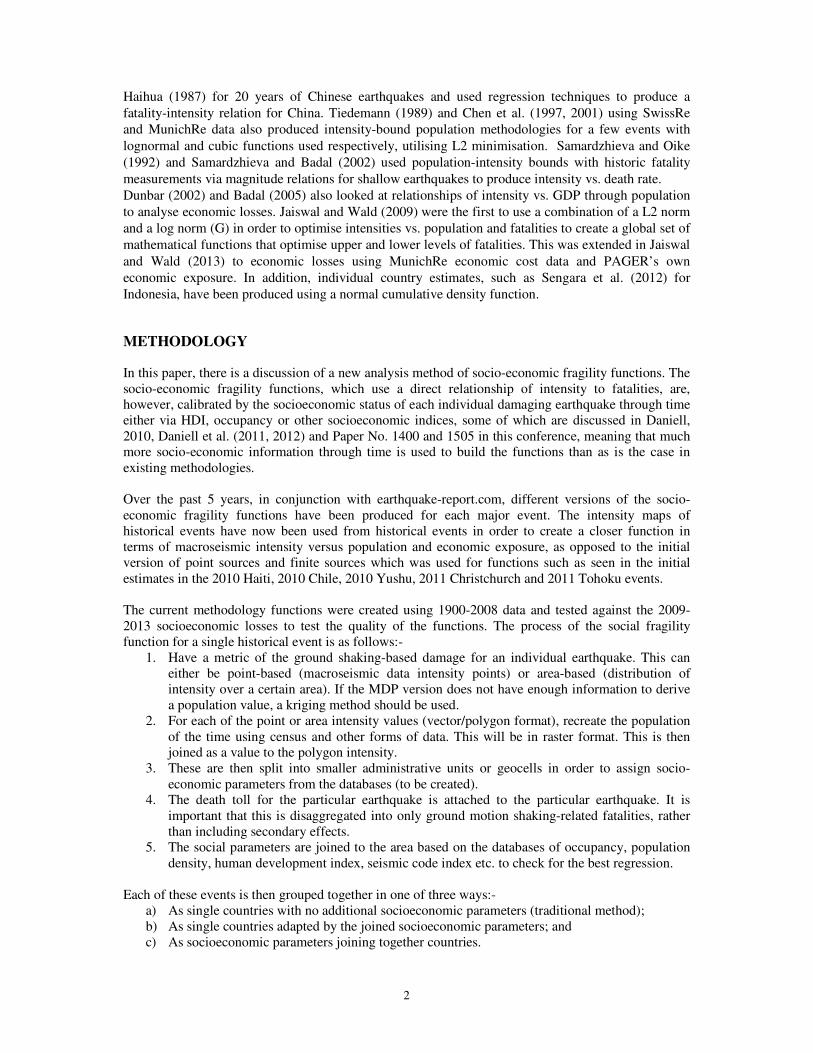
Haihua (1987) for 20 years of Chinese earthquakes and used regression techniques to produce a
fatality-intensity relation for China. Tiedemann (1989) and Chen et al. (1997, 2001) using SwissRe
and MunichRe data also produced intensity-bound population methodologies for a few events with
lognormal and cubic functions used respectively, utilising L2 minimisation. Samardzhieva and Oike
(1992) and Samardzhieva and Badal (2002) used population-intensity bounds with historic fatality
measurements via magnitude relations for shallow earthquakes to produce intensity vs. death rate.
Dunbar (2002) and Badal (2005) also looked at relationships of intensity vs. GDP through population
to analyse economic losses. Jaiswal and Wald (2009) were the first to use a combination of a L2 norm
and a log norm (G) in order to optimise intensities vs. population and fatalities to create a global set of
mathematical functions that optimise upper and lower levels of fatalities. This was extended in Jaiswal
and Wald (2013) to economic losses using MunichRe economic cost data and PAGER’s own
economic exposure. In addition, individual country estimates, such as Sengara et al. (2012) for
Indonesia, have been produced using a normal cumulative density function.
METHODOLOGY
In this paper, there is a discussion of a new analysis method of socio-economic fragility functions. The
socio-economic fragility functions, which use a direct relationship of intensity to fatalities, are,
however, calibrated by the socioeconomic status of each individual damaging earthquake through time
either via HDI, occupancy or other socioeconomic indices, some of which are discussed in Daniell,
2010, Daniell et al. (2011, 2012) and Paper No. 1400 and 1505 in this conference, meaning that much
more socio-economic information through time is used to build the functions than as is the case in
existing methodologies.
Over the past 5 years, in conjunction with earthquake-report.com, different versions of the socio-
economic fragility functions have been produced for each major event. The intensity maps of
historical events have now been used from historical events in order to create a closer function in
terms of macroseismic intensity versus population and economic exposure, as opposed to the initial
version of point sources and finite sources which was used for functions such as seen in the initial
estimates in the 2010 Haiti, 2010 Chile, 2010 Yushu, 2011 Christchurch and 2011 Tohoku events.
The current methodology functions were created using 1900-2008 data and tested against the 2009-
2013 socioeconomic losses to test the quality of the functions. The process of the social fragility
function for a single historical event is as follows:-
1. Have a metric of the ground shaking-based damage for an individual earthquake. This can
either be point-based (macroseismic data intensity points) or area-based (distribution of
intensity over a certain area). If the MDP version does not have enough information to derive
a population value, a kriging method should be used.
2. For each of the point or area intensity values (vector/polygon format), recreate the population
of the time using census and other forms of data. This will be in raster format. This is then
joined as a value to the polygon intensity.
3. These are then split into smaller administrative units or geocells in order to assign socio-
economic parameters from the databases (to be created).
4. The death toll for the particular earthquake is attached to the particular earthquake. It is
important that this is disaggregated into only ground motion shaking-related fatalities, rather
than including secondary effects.
5. The social parameters are joined to the area based on the databases of occupancy, population
density, human development index, seismic code index etc. to check for the best regression.
Each of these events is then grouped together in one of three ways:-
a) As single countries with no additional socioeconomic parameters (traditional method);
b) As single countries adapted by the joined socioeconomic parameters; and
c) As socioeconomic parameters joining together countries.

J.E. Daniell, F. Wenzel 3
In some cases where enough fatal earthquakes were not available from 1900-2008, then a
regionalisation approach for the grouping may need to be undertaken, such as looking at building
typologies, economic situation and practices. This, however, can be hopefully minimised for the final
global method by using similar HDI and vulnerability events to populate locations where not many
damaging earthquakes have occurred.
Figure 1: Left: A step in the fatality function due to similar building collapse, is difficult to pick up with less than
2 coefficients; Right: A step in the fatality function due to similar building collapse is modelled with a double
exponential function, with 5 coefficients.
An assignment of the distribution translates a single value of deaths over the population intensity
bounds, and then this is modified depending on which socio-economic parameters correspond to the
earthquake in question. The expected deaths are then optimised against the fatalities observed in
events. The regression for each of these groupings a-c is then undertaken using the regression
approach of a function distribution optimised for the earthquakes, as has been tested through the Level
2/3 casualty data. The establishment of fatality functions and economic loss functions using the
databases and methodologies created was undertaken using intensity maps and the Level 1 (country)
and Level 2 (town) fatality and economic loss data.
Figure 2: Left: The fatality functions for Iran based on HDI through time; Right: The final fit for Iran based on a
time of day and an HDI based fatality function from 1900-2012, calculated on 1900-2008 data. (Daniell, 2014)
One advantage of the current methodology is that the functions have been validated against real data
and also trends of data at multiple levels, meaning that the numerical optimisation has not always been
the preferred model selected, given that it can often be inaccurate. The shape of the loss function is
thus established using sigmoid curves if possible, which is most often best characterised by a tanhyp
function for economic losses and a normal cumulative density function of a lognormal function for
fatalities when only using 2 parameters as variables as shown in Figure 1. The variability of the
function can be quantified by looking at the residual error. The functions can then be optimised as
more data becomes available. The functions are consequently used for the [intensity, population,

4
socioeconomic parameter] triplets for each new event. The combination of an L2 norm and G norm
into a L2+G norm by Jaiswal et al. (2009) is a good solution to the problem of upper and lower
residuals; however, for the global method, a dual function was also tested with the L2 (least squares)
norm being used for the top, and G (log) norm for the bottom, thus retaining the best possible
regression as per Figure 2.
In order to evaluate the economic losses from any earthquake event worldwide, the historical
earthquake event data must be aggregated. The process of the economic fragility function for a single
historical event is as follows:-
Steps 1-3 are as for the fatality fragility function above.
4. For each of the point or area intensity values (vector/polygon format), recreate the capital
stock and GDP of the time using census and other forms of data. This will be in raster format.
This is then joined as a value to the polygon intensity.
5. These are then split into smaller administrative units or geocells in order to assign additional
socio-economic parameters from the databases (to be created).
6. The direct economic loss for the particular earthquake is attached to the particular earthquake
and the gross capital stock. It is important that this is disaggregated into only ground motion
shaking-related economic losses, rather than including secondary effects.
7. The economic parameters are joined to the area based on the databases, including human
development index, wage, building index etc.
For the next event, the couplets of intensity, population, economic exposure and socio-economic
parameters are used in conjunction with the function from 1900-2008 to create the loss estimate.
REGIONALISATION
The grouping of countries which do not have a significant number of historical events is required,
especially for countries like Australia where not many events have occurred with larger historical
intensities. For economic losses, a different regionalisation is used than for fatalities, as there are
significantly less events with reasonable economic loss estimates and loss functions are very different
due to different building typologies and socioeconomic status between the two. The fatality
regionalisations are shown in the following diagram using the parameters discussed in previous papers
in the AEES, WCEE conferences, as well as Daniell (2014). A combination of the six elements shown
in Figure 3(infrastructure age, building stock, earthquake HDI, climate, fatality vulnerability and
income) is used to choose the country combinations.
Figure 3: Some of the various components which were looked at in the country classification system in addition
to the number of fatal events and fatalities. In the future, as larger fatal events occur in countries which have not
been seen from 1900-2012 globally, this regionalisation should be adapted.
J.E. Daniell, F. Wenzel 5
HISTORICAL ANALYSIS FROM 1900-2008
Historical Earthquake Losses:
The CATDAT Damaging Earthquakes Database of historical earthquake socio-economic losses from
1900-2012 has been extended and improved for 7208 earthquakes, including a rigorous process of
validation, calibration, quantification and data searching. From 2003-2014, over 22,000 sources have
been collected and the database has been used in a wide range of research projects, studies, analyses
and for major events, as per Daniell et al. (2011, 2012).
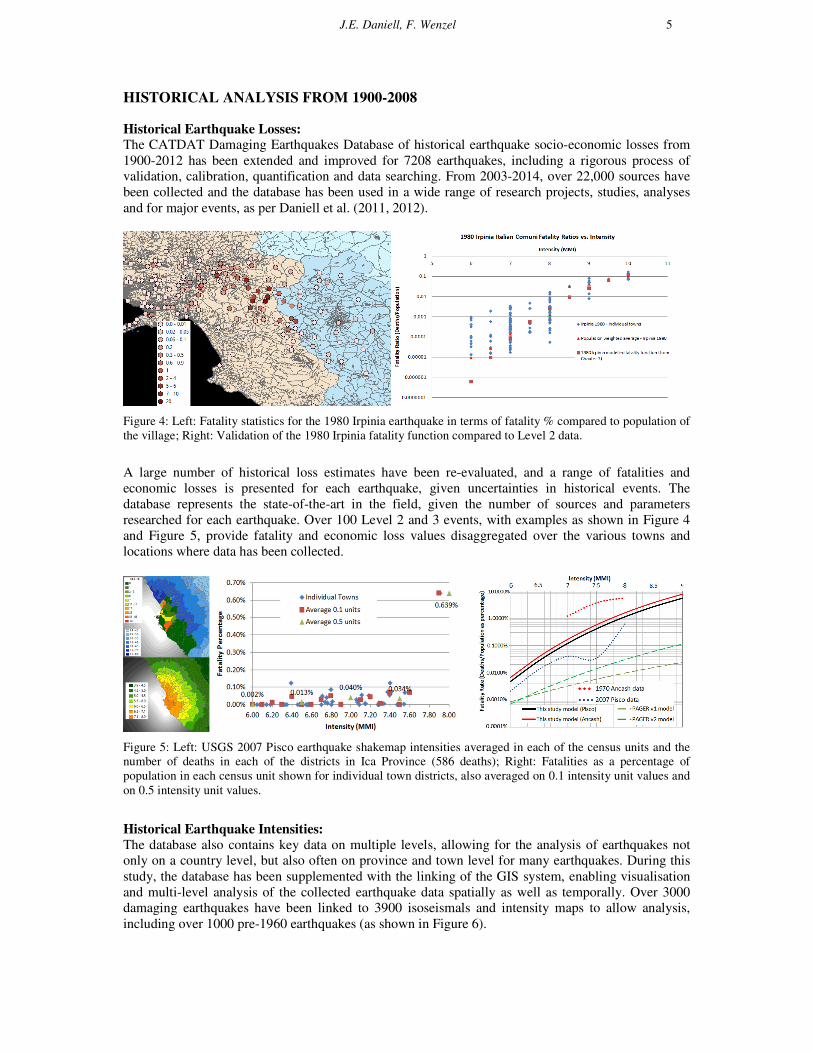
Figure 4: Left: Fatality statistics for the 1980 Irpinia earthquake in terms of fatality % compared to population of
the village; Right: Validation of the 1980 Irpinia fatality function compared to Level 2 data.
A large number of historical loss estimates have been re-evaluated, and a range of fatalities and
economic losses is presented for each earthquake, given uncertainties in historical events. The
database represents the state-of-the-art in the field, given the number of sources and parameters
researched for each earthquake. Over 100 Level 2 and 3 events, with examples as shown in Figure 4
and Figure 5, provide fatality and economic loss values disaggregated over the various towns and
locations where data has been collected.
Figure 5: Left: USGS 2007 Pisco earthquake shakemap intensities averaged in each of the census units and the
number of deaths in each of the districts in Ica Province (586 deaths); Right: Fatalities as a percentage of
population in each census unit shown for individual town districts, also averaged on 0.1 intensity unit values and
on 0.5 intensity unit values.
Historical Earthquake Intensities:
The database also contains key data on multiple levels, allowing for the analysis of earthquakes not
only on a country level, but also often on province and town level for many earthquakes. During this
study, the database has been supplemented with the linking of the GIS system, enabling visualisation
and multi-level analysis of the collected earthquake data spatially as well as temporally. Over 3000
damaging earthquakes have been linked to 3900 isoseismals and intensity maps to allow analysis,
including over 1000 pre-1960 earthquakes (as shown in Figure 6).

6
Figure 6: Left: An example of the splits of administrative units over an intensity map to form intensity,
administrative unit couplets for 1939 Erzincan, Turkey; Right: Isoseismal maps created and collected worldwide
correlated to damaging earthquakes in the database with an intensity greater than 5. In some cases, damaging
earthquakes only had bounds to a minimum of intensity 6, and thus were not extrapolated.
Globally, many papers and studies have been undertaken to quantify the effects of historical events.
These were integrated into a global database, combining the spatial, temporal, socio-economic and
seismological aspects of the particular earthquakes. Each individual earthquake was examined, and the
key earthquakes were searched for in multiple languages in order to attempt to improve the dataset.
Isoseismals from many different atlases, papers and sources were collected over the time period and
these have been integrated into the database to create a larger sample space through time with which to
create functions and trends.
Figure 7: Left: A comparison between two intensity maps of the same earthquake in China from the 16th August
2003 (Gao et al., 2005), which caused 102 million USD damage (around 70 million USD capital stock cost);
Right: Differences of shakemap isoseismals for the 1985 Mexico City event – a: Modified UNAM; b: USGS
Shakemap. The fault block and the same colouring have been included on the UNAM shakemap.
The earthquakes were all disaggregated with respect to shaking and secondary losses; it has also been
an extensive effort during this study creating disaggregation of social and economic losses from
earthquakes through time from 1900-2012. Isoseismals and intensities from local databases and
studies were preferred where multiple versions occurred over global databases as there were many
differences between existing estimates and global databases as shown in Figure 7, especially for
Chinese, Mexican, Italian, Turkish and South American events.
Exposure:
The evaluation and creation of a virtual earth for use in this analysis included an accurate
calculation of economic exposure worldwide. For example, for the 1909 Provence earthquake in
France, the distribution for the Level 3 units from 1900-2012 is shown in Figure 8. It can be seen that
between the highest decrease and increase in population from 1900 to 2012 is around 15 times (Creuse
(loss), Essonne (increase)). A key output of this study was the establishment of the exposure and
vulnerability component globally. The production of a virtual earth of infrastructure typologies,
population estimation on multiple levels (country, province, sub-province and city) using census
information as well as proxies enables the next earthquake to be quantified accurately, allowing for
picking up of regional differences such as the difference between an Istanbul (western Turkey) and
Van (eastern Turkey) earthquake in terms of economic exposure as well as population and
vulnerability.
J.E. Daniell, F. Wenzel 7
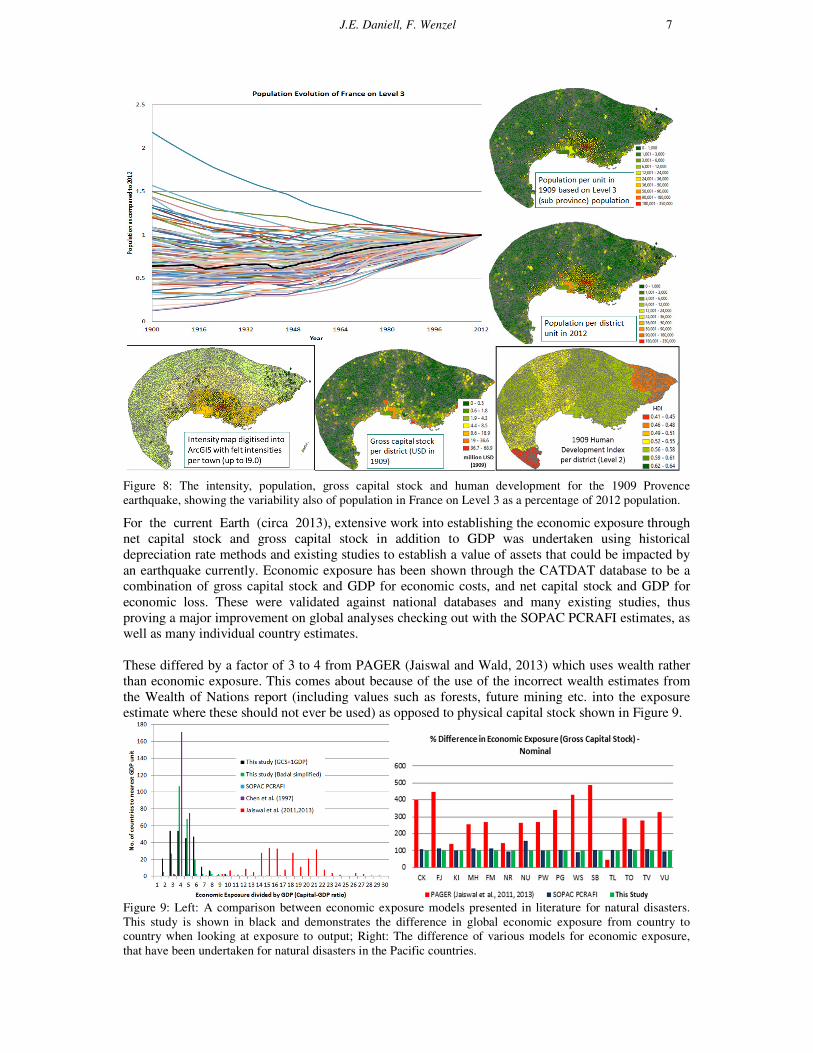
Figure 8: The intensity, population, gross capital stock and human development for the 1909 Provence
earthquake, showing the variability also of population in France on Level 3 as a percentage of 2012 population.
For the current Earth (circa 2013), extensive work into establishing the economic exposure through
net capital stock and gross capital stock in addition to GDP was undertaken using historical
depreciation rate methods and existing studies to establish a value of assets that could be impacted by
an earthquake currently. Economic exposure has been shown through the CATDAT database to be a
combination of gross capital stock and GDP for economic costs, and net capital stock and GDP for
economic loss. These were validated against national databases and many existing studies, thus
proving a major improvement on global analyses checking out with the SOPAC PCRAFI estimates, as
well as many individual country estimates.
These differed by a factor of 3 to 4 from PAGER (Jaiswal and Wald, 2013) which uses wealth rather
than economic exposure. This comes about because of the use of the incorrect wealth estimates from
the Wealth of Nations report (including values such as forests, future mining etc. into the exposure
estimate where these should not ever be used) as opposed to physical capital stock shown in Figure 9.
Figure 9: Left: A comparison between economic exposure models presented in literature for natural disasters.
This study is shown in black and demonstrates the difference in global economic exposure from country to
country when looking at exposure to output; Right: The difference of various models for economic exposure,
that have been undertaken for natural disasters in the Pacific countries.

8
Development of socio-economic indices from 1900 to 2013:
Globally, population estimates, life expectancy, literacy rate, average years of schooling, economic
indices of CPI, GDP (PPP and nominal), net capital stock, gross capital stock and unskilled wage
indices (on multiple levels) and approximate infrastructure vulnerability, infrastructure typologies, age
of infrastructure, the seismic code index, and building practice factor (on a country level) have been
filled in using existing census data, worldwide datasets, and a plethora of studies.
The first worldwide production of the Human Development Index (HDI) through time from 1900-
2013 has been established, which allows for the quick comparison of the socioeconomic status of the
location at the time of an earthquake, giving a key normalization tool. As well as this, an earthquake
HDI integrating components of earthquake vulnerability with this HDI allowed for an additional
normalization tool.
VALIDATION AND TESTING AGAINST EXISTING METHODS
The worldwide models were established using 1900-2008 data, and the events from 2009-2012 have
been tested, with reasonable results showing the use of such a methodology. It is expected that the
functions can be optimised in the future by inclusion of the 2009-2012 data.
The worldwide empirical method has been established for fatalities with an overall standard error of
e1.73 which means that the fatalities can be calculated to within a reasonable level of quality globally,
with some of the error coming from difficulties with historical earthquakes and certain types of
volcanic earthquakes or earthquakes which need additional checking of the intensities observed. The
functions were optimised when corrected by the time of the day (affecting the occupancy) when the
historical earthquakes had occurred, and the HDI and building typologies at the time of the event
versus the whole function HDI. The need for the function to follow historical event typologies on a
town basis meant that the overall standard error was around 0.6 points higher than otherwise (1.1). The
sample space of 2614 earthquakes with fatal and non-fatal events from 1900-2008, with 900+ events
before 1973, gave a good basis for calculation (Figure 10). For fatalities, the methodology predicted
45% of fatal events to within 50% of the death toll reported and 59% for all events. 69% of fatal
events were calculated to within 100% of the fatalities reported. 90% of the fatal events tested and
89% of all events were within one order of magnitude below or above the mean.
Figure 10: The tested 2009-2012 shaking fatality data using the regionalisation 4 country grouping built from
1900-2008. It can be seen that there are 2 fatal quakes underestimated by the model of 5 and 13 deaths
respectively. In addition, 5 misses with overestimates over 2 fatalities result from the model.

J.E. Daniell, F. Wenzel 9
In terms of economic loss functions, a check was made against the functions in every case being
produced, such as for China and that of existing methodologies such as PAGER (Jaiswal and Wald,
2011; 2013; Chen et al. (2001)). It can be seen in Figure 11 that this paper study is in line with the
average losses for China via their standard and also for average houses, which seems reasonable. Also,
it can be seen that the function of the Jaiswal and Wald (2011; 2013) is a large underestimation and
has a strange shape as compared to the existing fragility functions.
Figure 11: Various damage functions for the exposure of China. It can be seen that there is a wide range of
damage functions used, which can result in a wide range of loss estimates depending on exposure.
For economic loss functions as shown in Figure 12, the methodology predicted 42% of events to
within 50% of the economic costs reported and 65% of events to within 100% of the economic costs
reported. 98% of the events tested were within one order of magnitude in either direction. Less events
have accurate economic cost estimates historically from 1900-2012, thus the sample space is smaller
when compared to the fatality model.
Figure 12: The finalised economic cost model (regionalisation 6, HDI) in current dollars, testing the period from
2009-2012 against the 1900-1972 and 1973-2008 data. (log residual error, ξv1=1.28)
10
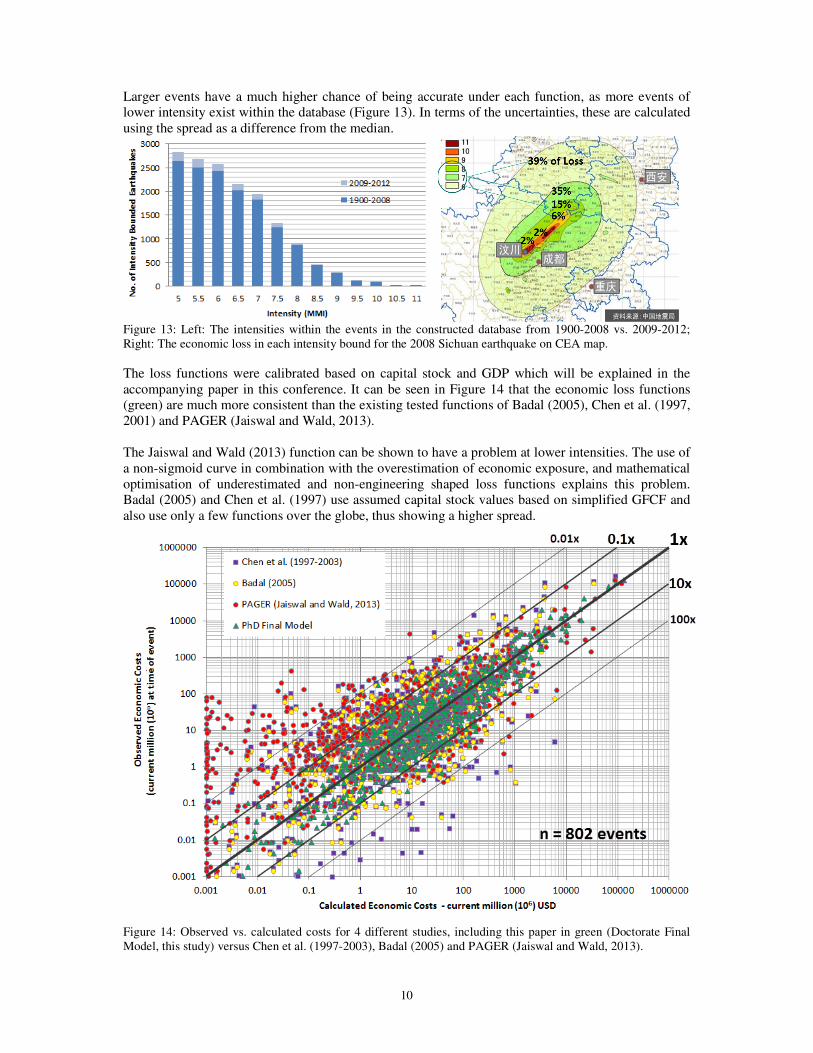
Larger events have a much higher chance of being accurate under each function, as more events of
lower intensity exist within the database (Figure 13). In terms of the uncertainties, these are calculated
using the spread as a difference from the median.
Figure 13: Left: The intensities within the events in the constructed database from 1900-2008 vs. 2009-2012;
Right: The economic loss in each intensity bound for the 2008 Sichuan earthquake on CEA map.
The loss functions were calibrated based on capital stock and GDP which will be explained in the
accompanying paper in this conference. It can be seen in Figure 14 that the economic loss functions
(green) are much more consistent than the existing tested functions of Badal (2005), Chen et al. (1997,
2001) and PAGER (Jaiswal and Wald, 2013).
The Jaiswal and Wald (2013) function can be shown to have a problem at lower intensities. The use of
a non-sigmoid curve in combination with the overestimation of economic exposure, and mathematical
optimisation of underestimated and non-engineering shaped loss functions explains this problem.
Badal (2005) and Chen et al. (1997) use assumed capital stock values based on simplified GFCF and
also use only a few functions over the globe, thus showing a higher spread.
Figure 14: Observed vs. calculated costs for 4 different studies, including this paper in green (Doctorate Final
Model, this study) versus Chen et al. (1997-2003), Badal (2005) and PAGER (Jaiswal and Wald, 2013).
J.E. Daniell, F. Wenzel 11
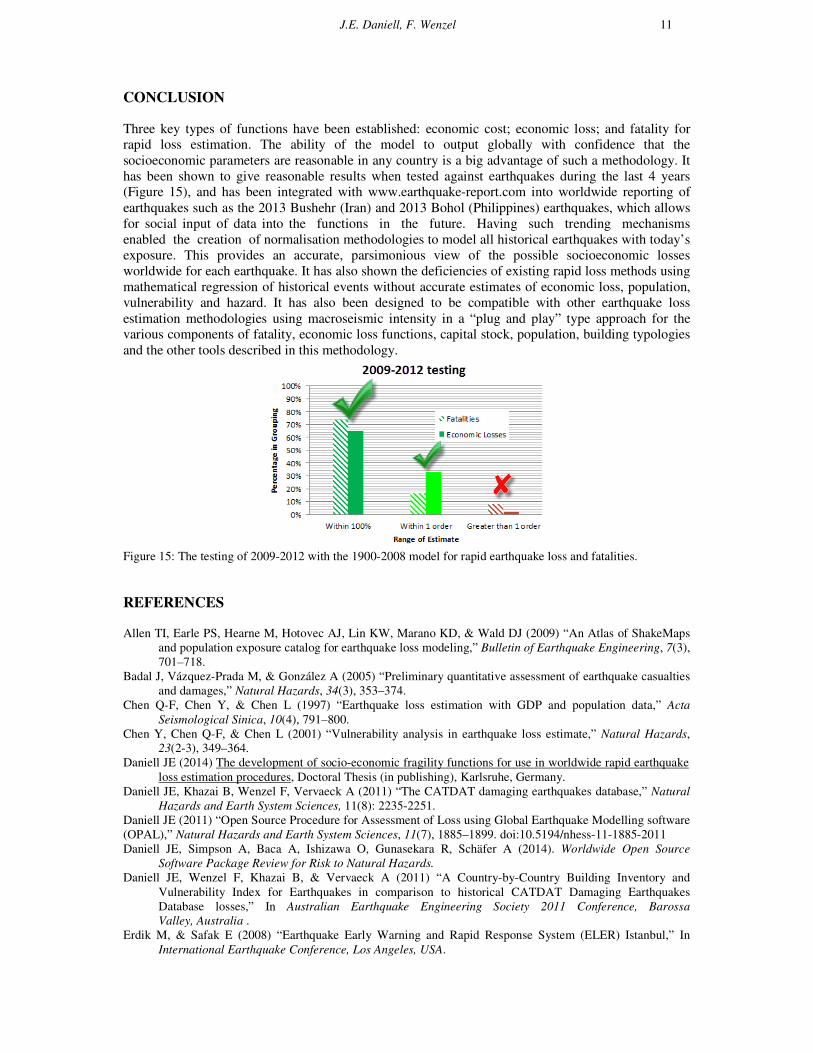
CONCLUSION
Three key types of functions have been established: economic cost; economic loss; and fatality for
rapid loss estimation. The ability of the model to output globally with confidence that the
socioeconomic parameters are reasonable in any country is a big advantage of such a methodology. It
has been shown to give reasonable results when tested against earthquakes during the last 4 years
(Figure 15), and has been integrated with www.earthquake-report.com into worldwide reporting of
earthquakes such as the 2013 Bushehr (Iran) and 2013 Bohol (Philippines) earthquakes, which allows
for social input of data into the functions in the future. Having such trending mechanisms
enabled the creation of normalisation methodologies to model all historical earthquakes with today’s
exposure. This provides an accurate, parsimonious view of the possible socioeconomic losses
worldwide for each earthquake. It has also shown the deficiencies of existing rapid loss methods using
mathematical regression of historical events without accurate estimates of economic loss, population,
vulnerability and hazard. It has also been designed to be compatible with other earthquake loss
estimation methodologies using macroseismic intensity in a “plug and play” type approach for the
various components of fatality, economic loss functions, capital stock, population, building typologies
and the other tools described in this methodology.
Figure 15: The testing of 2009-2012 with the 1900-2008 model for rapid earthquake loss and fatalities.
REFERENCES
Allen TI, Earle PS, Hearne M, Hotovec AJ, Lin KW, Marano KD, & Wald DJ (2009) “An Atlas of ShakeMaps
and population exposure catalog for earthquake loss modeling,” Bulletin of Earthquake Engineering, 7(3),
701–718.
Badal J, Vázquez-Prada M, & González A (2005) “Preliminary quantitative assessment of earthquake casualties
and damages,” Natural Hazards, 34(3), 353–374.
Chen Q-F, Chen Y, & Chen L (1997) “Earthquake loss estimation with GDP and population data,” Acta
Seismological Sinica, 10(4), 791–800.
Chen Y, Chen Q-F, & Chen L (2001) “Vulnerability analysis in earthquake loss estimate,” Natural Hazards,
23(2-3), 349–364.
Daniell JE (2014) The development of socio-economic fragility functions for use in worldwide rapid earthquake
loss estimation procedures, Doctoral Thesis (in publishing), Karlsruhe, Germany. Daniell JE, Khazai B, Wenzel F, Vervaeck A (2011) “The CATDAT damaging earthquakes database,” Natural
Hazards and Earth System Sciences, 11(8): 2235-2251. Daniell JE (2011) “Open Source Procedure for Assessment of Loss using Global Earthquake Modelling software
(OPAL),” Natural Hazards and Earth System Sciences, 11(7), 1885–1899. doi:10.5194/nhess-11-1885-2011 Daniell JE, Simpson A, Baca A, Ishizawa O, Gunasekara R, Schäfer A (2014). Worldwide Open Source
Software Package Review for Risk to Natural Hazards.
Daniell JE, Wenzel F, Khazai B, & Vervaeck A (2011) “A Country-by-Country Building Inventory and
Vulnerability Index for Earthquakes in comparison to historical CATDAT Damaging Earthquakes
Database losses,” In Australian Earthquake Engineering Society 2011 Conference, Barossa
Valley, Australia .
Erdik M, & Safak E (2008) “Earthquake Early Warning and Rapid Response System (ELER) Istanbul,” In
International Earthquake Conference, Los Angeles, USA.

12
Gao M-T, Xu L-S, Guo W-S, Wan B & Yu Y-X (2005) “Spatial damage distribution of August 16, 2003, Inner
Mongolia, China, Ms=5.9 earthquake and analysis,” Acta Seismologica Sinica, 18(2), 218–225.
GB/T18208.4-2005 (2005) “Post-earthquake field works Part 4: Assessment of direct loss.” (in Chinese).
Haihua L (1987) “Preliminary Analysis on the Highest Rate of Casualty in Earthquake Disasters,” Journal of
Catastrophology, 1987-02, Seismological Institute of Lanzhou,SSB, China.
Instituto Nacional de Defensa Civil Peru (INDECI) (2007) Evaluation of the impact of the socioeconomic and
environment from the earthquake of 15 August 2007 (in Spanish).
Jaiswal KS, Wald DJ & D’Ayala D (2011) “Developing Empirical Collapse Fragility Functions for Global
Building Types,” Earthquake Spectra, 27(3), 775-795
Jaiswal KS & Wald DJ (2011) Rapid Estimation of the Economic Consequences of Global Earthquakes (Open-
File Report No. 2011-1116). Retrieved from http://pubs.usgs.gov/of/2011/1116/
Jaiswal KS & Wald DJ (2013) “Estimating Economic Losses from Earthquakes Using an Empirical Approach,”
Earthquake Spectra, 29(1), 309–324.
Jaiswal KS, Wald DJ & Hearne M (2009). Estimating Casualties for Large Earthquakes Worldwide Using an
Empirical Approach, U.S. Geological Survey Open-File Report OF 2009–1136. Retrieved from
http://pubs.usgs.gov/of/2009/1136/pdf/OF09-1136.pdf
Pacific Catastrophe Risk Assessment and Financing Initiative. (2010-2013). The Pacific Disaster Risk
Assessment project.
Samardjieva E & Badal J (2002) “Estimation of the expected number of casualties caused by strong
earthquakes,” Bulletin of the Seismological Society of America, 92(6), 2310–2322.
Samardjieva E & Oike K (1992) “Modelling the number of casualties from earthquakes,” Journal of Natural
disaster science, 14(1), 17–28.
Sengara IW, Suarjana M & Pribadi KS (2012) “Development of Empirical Earthquake Fatality Model for
Indonesia,” In Proceedings of the 15th World Conference of Earthquake Engineering, Lisbon, Portugal.
Tiedemann H (ed.) (1989) Casualties as a function of building quality and earthquake intensity: In: Jones NP et
al., ed. Proceedings of the International Workshop on Earthquake Injury Epidemiology: Implications for
Mitigations and Response, Baltimore, MD, 10-12 July 1989, Johns Hopkins University, pp. 420-434.
Wyss M (2004) “Real-time prediction of earthquake casualties,” paper presented at International Conference on
Disasters and Society – From Hazard Assessment to Risk Reduction. In D Mahlzahn & T Plapp (eds.),
International Conference on Disasters and Society – From Hazard Assessment to Risk Reduction
(pp. 165–173). Karlsruhe, Germany: Logos Publisher.