the process of conducting a shelf life study - mocon.com cuts cookies method: ... • testing will...
TRANSCRIPT

The Process of Conducting
a Shelf Life Study
Presented By: Alan Shema
Product Manager - Consulting & Testing Services
MOCON Inc.
Wednesday October 28, 2015 I 9:00 a.m. CDT Copyright ©2015 MOCON Inc.

Definition of Shelf Life
Objective means to determine the time a product can
be expected to keep without appreciable change in
quality, safety or character.

Why Conduct a Shelf Life Study?
What Are the Benefits?
• Confidence in having an actual calculated
shelf life and not just an estimate
• Prevent recalls
• Maintain quality
• Protect brand/reputation
• Improve profitability
• Avoid expensive litigation
• Consumer safety

Food For Thought - Did You Know?
Last updated: Wednesday, June 18, 2014
A total of 132.9 BILLION Pounds of wasted food!!

When to Conduct a Shelf Life Study
• New product launch
• Package re-design/New packaging
• Challenge the lifespan
• Collect data for validation
• Change in ingredients
• Change in supplier materials
• As part of your QA/QC Program
• Is your current package still performing?

Product Considerations
• Safety
• Functionality
• Quality/Marketability
Something changed but product
is still safe and functions (e.g., color)

End of Shelf Life Parameters
• An acceptable shelf life allows the following desired characteristics of the product to be retained:
• Sensory
• Chemical
• Functional
• Microbiological
• Physical
• These are called “End Of Shelf Life Parameters” (EOSLs)
• Tests deployed to measure shelf life must be product-specific, taking into account EOSLs
• The exact test procedure is unique for each product

Direct Method (Real Time)
• Store under selected conditions for longer than the
expected shelf life
• Check at regular intervals to see when spoilage begins
Benefits:
• No calculations
• See the effects of
precise condition
Application:
• Products with a shorter
shelf life

Indirect Method (Accelerated)
Benefits:
• Avoid running a full length
storage trial
• See the impact of any changes
much sooner
Application:
• Products with a longer shelf life
By increasing the storage temperature,
the trial period is shortened and rate of
deterioration is increased.

Example Comparison of Direct and
Indirect Test Methods
Cold Cuts Cookies
Method: Direct Indirect
Desired Shelf Life: 21 days 12 months
Actual Test Time: 12 days 8 weeks
Temperatures: 5,10,20° C 20,30,40° C
Humidity: 20% 50% or 90%
Microbial: Aerobic Aerobic
Yeast Yeast
Mold Mold
Coliform
Salmonella
Color: Important N/A
Texture: Important Important
Taste: Important Important
Inspection: Daily 1-2 weeks

Before You Begin Testing
The following aspects must be determined

1. Determine Test Method & Duration
• Direct (Real Time) = just past expected shelf life
• Indirect (Accelerated) = Approximately ¼ of expected

Initial steps must determine the following:
• Storage condition(s)
• Testing methods & protocol
• Testing interval
• Number of samples required

2. Determine Storage Conditions
• Direct (Real Time)
- Expected conditions
- Worst case scenario
• Indirect (Accelerated)
- Standard storage conditions
- Elevated storage conditions
= 10° C difference

3. Determine Testing Intervals
• Direct (Real Time)
- 8-10 data points (3-5 days)
• Indirect (Accelerated)
- Weekly/Bi-weekly
The key is to have the failure occur within a time
frame of acceptable margin of error.

4. Determine Product Samples & Protocol
This requires knowledge of:
• Commonly known parameters
• Scientific expertise of product
When combined with the Testing Interval, one can determine the
number of samples needed.

• Q10 is a unitless quantity
• Q10 is the factor by which the rate increases when
the temperature is raised by ten degrees
• Temperatures MUST be in C or K
• Assumption: For typical chemical reactions,
Q10 values are 2.0
The Rule of Ten (Q10)

The Rule of Ten (Q10)

Example Calculations
T1 T2 T3
20° C 30° C 40° C
R1 R2 R3
15 24 38

Example Calculations
Here the actual Q10 value is 1.6 and not 2
Q10 = (24/15) (10/(30-20)) = 1.61 = 1.6
Q10 = (38/24) (10/(40-30)) = 1.581 = 1.58

How Q10 values can be applied
If:We ran a study at 20° C & 40° C and found the
product that tested at 40° C expired after 8 weeks.
Based upon Q10 = 2 we would calculate the shelf life
at room temperature to be:
8 x (2 x 2) = 32 weeks (8 months)
But:With actual Q10 = 1.6 the shelf life would be:
8 x (1.6 x 1.6) = 20.48 weeks (5.2 months)

Summary
• Shelf life studies can be complex and need to be product specific
• Key considerations: Safety, Quality, Character (marketability)
• ALL studies require detailed information about the product to
establish the End Of Shelf Life parameters (EOSLs)
• Direct methods are good for products with a shorter shelf life
• Indirect methods work well for products with a longer shelf life
• Q10 values are a great tool for accelerated studies
• Most studies require expertise in food science

Shelf Life Case Study
• Testing will include an accelerated shelf life study to analyze
packaging material changes and the impact of M.A.P.
Nitrogen gas flush.
• The manufacturer supplied product samples packaged in
various film structures and samples that had been nitrogen
gas flushed.
A leading manufacturer of snack
chips is looking to increase its
product’s current shelf life from
16 weeks to 36 weeks.

• The EOSL parameter for this product is moisture content.
• At a certain moisture level, the chips become tough, chewy,
and have a stale taste.
• The data collected determined the rates of change for each
test parameter at the accelerated conditions.
• This data was used to accurately predict the rates of change
at lower storage conditions and subsequent shelf life codes
were established.
Shelf Life Case Study

Testing Proposal
Samples were stored at 25° C and 45° C
with 90% - 100% RH for 5 – 6 weeks.
Test samples were pulled from storage
weekly
and tested for:
• Leak test upon arrival
• Water activity
• Texture
• Oxidation of fats
• Oxygen head space content
• Moisture content
• Human Sensory for taste, odor,
color and appearance

aw of less
than 0.9
indicates
there is
little to no
danger of
microbial
issues

A noticeable
change in
texture
started to
occur at 2-3
weeks

TBARs is an analysis for measuring oxidation of oils &
fats - commonly perceived as rancid taste & odor.
• No significant change measured

No detrimental
change which
correlates well
with TBARs
data

When the moisture
content reached
2.5%, sensory
detected a loss of
texture – a main EOSL
parameter.

Shelf Life Case Study
To predict the end of shelf life…
• Q10 value was determined to be 2.19 based on rates of
moisture change at 45° C and 25° C
• Texture measurements and sensory evaluation indicate that
end of shelf life is reached at a moisture level of 2.5%. At this
moisture level the chips were tough, chewy, and had a stale
taste
• Based on this end of shelf life parameter, the predicted shelf
life at 25° C (ambient) was calculated and is shown in Table 1

The calculation…
3.4 weeks x 2.19 x 2.19 = 16.31 weeks
3.4 weeks is the time at 45° C that it took to reach EOSL. We
multiplied the weeks by the Q10 twice, once for each 10° change
in temperature.
Shelf Life Case Study
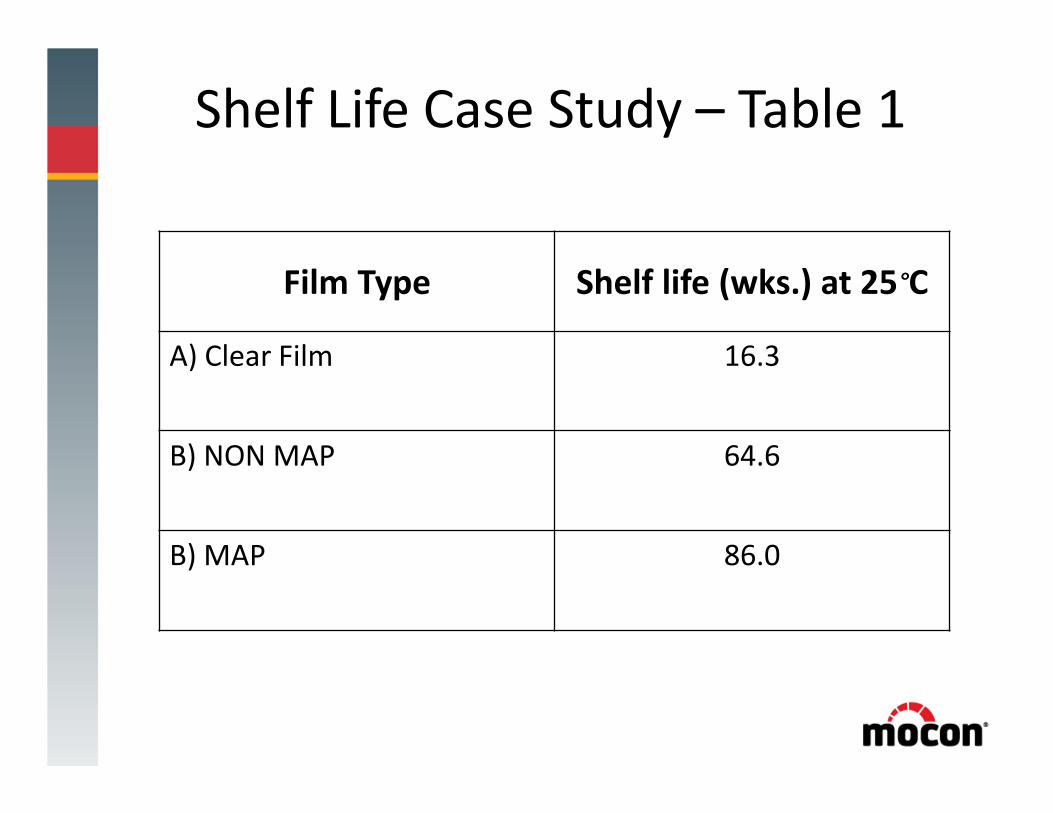
Shelf Life Case Study – Table 1
Film Type Shelf life (wks.) at 25°C
A) Clear Film 16.3
B) NON MAP 64.6
B) MAP 86.0

Case Study Conclusions
• A leading manufacturer of snack chips wants to increase its current
shelf life from 16 weeks to 36 weeks.
We calculated actual current shelf life to be 16.3 weeks.
Through further in-depth testing, film changes and using M.A.P.
gas flushing we were able to greatly increase the shelf life of 16.3
weeks to reach their goal of 36 weeks!
• The EOSL parameter for this product is moisture content. At a certain
moisture level the chips become tough, chewy, and have a stale taste.
We confirmed this to be true. Through various tests they found
ways to keep out moisture and keep the moisture levels consistent
over the length of the products lifetime.

Now that you have spent the time to determine the
correct shelf life of your product, how do you ensure its
consistency?
• Through a strict Quality Control and Assurance
Program of continued testing of key products, package
and process parameters.
Ensuring Consistent Quality

Thank you for attending!
Please visit www.mocon.com for
more educational resources
[email protected] I www.mocon.com