the power of the image 2011 using sound to augment ‘the image’ nick bearman university of east...
TRANSCRIPT

The Power of the Image2011
Using Sound to Augment ‘the Image’
Nick Bearman
University of East Anglia

The Power of the Image2011
Using Sound to Augment ‘the Image’
• Using sound to represent uncertainty in spatial data
• Visual representation• The need for alternatives• Visual & sonic comparison
• UKCP09 Data• Google Maps Interface
• Results• Conclusion
Visual Representation
AlternativeSense Method UKCP09 Google Maps Results

The Power of the Image2011
Spatial Data is usually shown Visually
Visual Representation
AlternativeSense Method UKCP09 Google Maps Results

The Power of the Image2011
But….. Vision has Limits
• Limit on info shown visually
• Can avoid this
• Sometimes need to show all this information
http://kbark.wordpress.com/2006/12/17/where-am-i/ (18/03/2009)
Finnish Town
Visual Representation
AlternativeSense Method UKCP09 Google Maps Results
The Power of the Image2011
+ 2.5°C
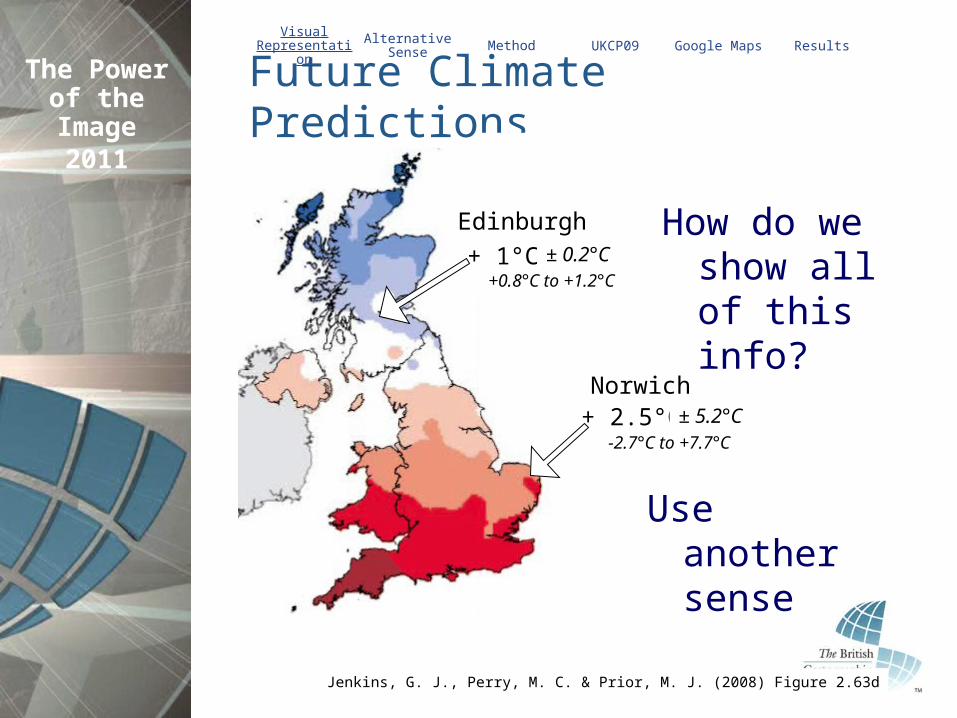
Future Climate Predictions
How do we show all of this info?
Jenkins, G. J., Perry, M. C. & Prior, M. J. (2008) Figure 2.63d
+ 1°C ± 0.2°C
± 5.2°C
Edinburgh
Norwich
+0.8°C to +1.2°C
-2.7°C to +7.7°C
Use another sense
Visual Representation
AlternativeSense Method UKCP09 Google Maps Results
The Power of the Image2011
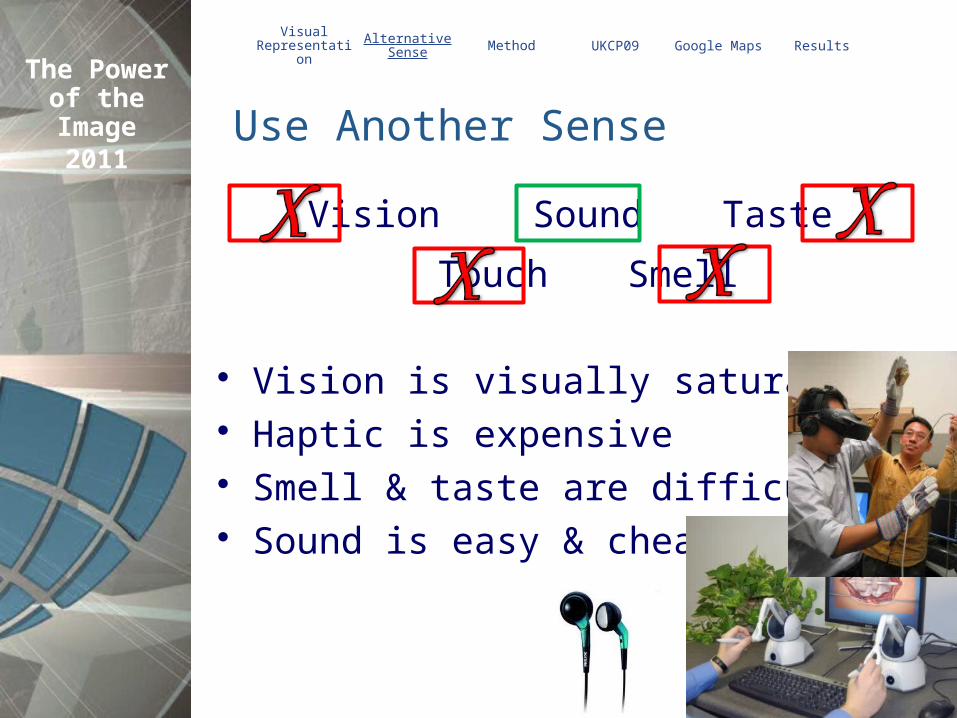
Use Another Sense
Vision Sound Taste
Touch Smell
Vision is visually saturated Haptic is expensive Smell & taste are difficult! Sound is easy & cheap
Visual Representation
AlternativeSense Method UKCP09 Google Maps Results

The Power of the Image2011
Sound Facts• After vision, sound is next most
powerful sense (Minghim, 1995; Fortin et al., 2007)
• Most people are capable of greater sonic differentiation that they utilise (Loomis et al., 1993; Klatzky & Golledge, 1995)
• People can tell the difference between any 2 of 400,000 different sounds
• People can remember up to 49 unique sounds Brewster (1994)
There should be some potential...
However, limited work and very limited testing
Visual Representation
AlternativeSense Method UKCP09 Google Maps Results

The Power of the Image2011
Previous Examples
• Often used for visual impaired• Sound replaces vision
• I’m looking at using sound and vision in combination• Sound augmenting vision
Zhao (2006)
Zhao (2006) Splits Screen into 9, Reads Aloud
MacVeigh & Jacobson (2007)
MacVeigh & Jacobson (2007) Harbour, Sea and Land
Visual Representation
AlternativeSense Method UKCP09 Google Maps Results
The Power of the Image2011
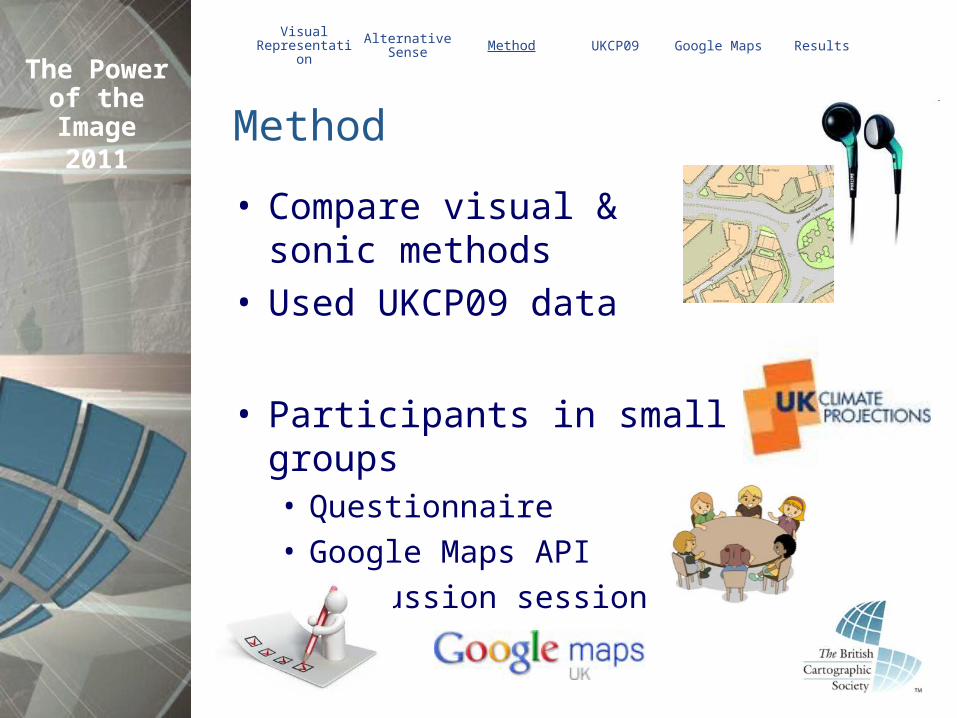
Method
• Compare visual & sonic methods
• Used UKCP09 data
• Participants in small groups• Questionnaire• Google Maps API• Discussion session
Visual Representation
AlternativeSense Method UKCP09 Google Maps Results

The Power of the Image2011
UK Climate Projections 2009• Future climate for UK up to 2080s• Latest in the series• First set to include uncertainty
• Uncertainty is useful• But users have to change their
workflow to make use of UKCP09• How do we represent this?
Visual Representation
AlternativeSense Method UKCP09 Google Maps Results
Temperature Increase
Probability
Temperature Increase

The Power of the Image2011
Uncertainty in UKCP09
Jenkins, G. J., Perry, M. C. & Prior, M. J. (2008) Figure 2.63d
+ 1°C
+ 2.5°C
± 0.2°C
± 5.2°C
Edinburgh
Norwich
+0.8°C to +1.2°C
-2.7°C to +7.7°C
Visual Representation
AlternativeSense Method UKCP09 Google Maps Results
The Power of the Image2011
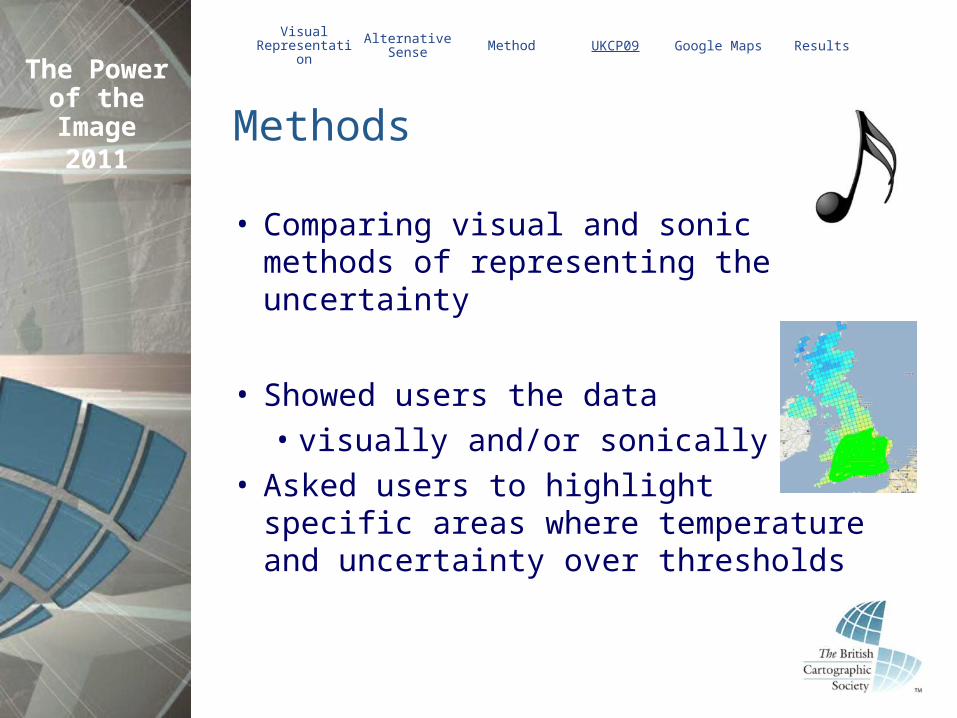
Methods
• Comparing visual and sonic methods of representing the uncertainty
• Showed users the data• visually and/or sonically
• Asked users to highlight specific areas where temperature and uncertainty over thresholds
Visual Representation
AlternativeSense Method UKCP09 Google Maps Results

The Power of the Image2011
How to compare?
• Online evaluation• Web based mapping
• Show UKCP09 data• Collect responses
• Google Maps • Familiar to most users• Good API docs & support
• How?• Lots of tutorials• Took about 6 months
Visual Representation
AlternativeSense Method UKCP09 Google Maps Results

The Power of the Image2011
Visual Representation
AlternativeSense Method UKCP09 Google Maps Results

The Power of the Image2011
Visual Representation
AlternativeSense Method UKCP09 Google Maps Results

The Power of the Image2011

The Power of the Image2011
Visual Representation
AlternativeSense Method UKCP09 Google Maps Results

The Power of the Image2011

The Power of the Image2011
Results
• Calculated Phi value: +1.0 to -1.0• Great variation within results
• Awareness of data set is important (p < 0.001)
• Using sound to reinforce vision increases scores (p = 0.005) for most
• Using sound for different variable helps some but not others
• Subject knowledge & repeated use appear to help
Visual Representation
AlternativeSense Method UKCP09 Google Maps Results

The Power of the Image2011
Results
• Learning Style may have an impact• Visual or aural• Slight trend for visual• Currently unclear based on
these results
• Could be very useful to colour blind users• But not the focus of this research
• Lots of views on the sound• Not all consistent!
Visual Representation
AlternativeSense Method UKCP09 Google Maps Results

The Power of the Image2011
Overall
Using sound to represent uncertainty in spatial data
• Compared different methodologies• Vision, sound and both
• Using Uncertainty in UKCP09• Sound can be useful• Awareness of the data is important• Reinforcing vision with sound helps
Visual Representation
AlternativeSense Method UKCP09 Google Maps Results

The Power of the Image2011
Thanks & Questions