the potential for biosng production in the uk - e4tech · the potential for biosng production in...
TRANSCRIPT
The potential for bioSNG production
in the UK
Final report
NNFCC project 10/008
A project funded by DECC, project managed by NNFCC
and conducted by E4tech
April 2010
CONTENTS
1 Introduction to the project ........................................................................................ 1
1.1 Introduction to bioSNG ....................................................................................................... 1
1.2 Report structure .................................................................................................................. 2
2 Technology review .................................................................................................... 3
2.1 Review of process steps ...................................................................................................... 3
2.2 Development status ............................................................................................................ 8
2.3 Feedstock suitability ......................................................................................................... 11
2.4 Plant configuration and efficiency .................................................................................... 12
2.5 Comparison with BTL ........................................................................................................ 13
2.6 Next steps to commercial deployment ............................................................................. 14
3 Technical feasibility of a UK-based bioSNG plant ...................................................... 15
3.1 Feedstock types and available resources .......................................................................... 15
3.2 Availability of the UK natural gas network ....................................................................... 18
3.3 Possibility of exporting waste process heat and/or excess electricity ............................. 21
3.4 Known capabilities, projects and interested stakeholders ............................................... 22
3.5 Conclusions ....................................................................................................................... 22
4 Policy review ........................................................................................................... 24
4.1 Policy support for the production of bioSNG .................................................................... 24
4.2 Policy support for the use of bioSNG ................................................................................ 25
4.3 Policy support for construction of bioenergy plants ........................................................ 27
4.4 Planning policy .................................................................................................................. 28
4.5 Feedstock support ............................................................................................................. 29
4.6 Access to the natural gas networks .................................................................................. 29
5 Economics ............................................................................................................... 30
5.1 BioSNG production economics ......................................................................................... 30
5.2 Economics of bioSNG use .................................................................................................. 40
6 Air quality impacts of the direct use of bioSNG and biomass .................................... 47
6.1 Introduction ...................................................................................................................... 47
6.2 Comparison of heat production routes ............................................................................ 47
6.3 Potential impacts and conclusions for bioSNG ................................................................. 48
7 Market opportunity ................................................................................................. 50
8 Review of implementation needs: barriers and solutions ......................................... 51
9 Strategic conclusions and recommendations ............................................................ 55
Annex A: Feedstock types and locations ......................................................................... 56
Annex B: End-use modelling data .................................................................................... 59
Annex C: Waste feedstock policies .................................................................................. 61

LIST OF FIGURES
Figure 1: Schematic of the bioSNG production process ......................................................................... 3
Figure 2: Basic principles behind the two main dual fluidised bed gasifier designs, based on the Fast
Internally Circulating Fluidised Bed (FICFB) gasifier (left) and the MILENA gasifier (right). ................... 5
Figure 3: REPOTEC-CTU’s 8MWth FICFB gasifier (left), and 1MWbioSNG methanation unit (right),
installed in Güssing, Austria .................................................................................................................... 9
Figure 4: 800kW MILENA gasifier (left), and 30kW gas cleanup and methanation (right), installed at
ECN ........................................................................................................................................................ 11
Figure 5: Distribution of woodland over 2 hectares ............................................................................. 17
Figure 6: Map of UK forestry residues (oven dried tonnes per annum) ............................................... 17
Figure 7: SRC land suitability in ............................................................................................................ 17
Figure 8: SRC land suitability in England & Wales, and location of current SRC plantations ............... 17
Figure 9: Map of active UK sawmills ..................................................................................................... 17
Figure 10: UK commercial ports importing forestry products, major ports highlighted ...................... 17
Figure 11: UK gas transmission network map (left), and UK population density map (right) .............. 21
Figure 12: Gas flows and tariff payments for biomethane injection .................................................... 26
Figure 13: Investment cost breakdown for a 30 MWbioSNG plant .......................................................... 32
Figure 14: Breakdown of operating costs for a 30MWbioSNG plant ........................................................ 34
Figure 15: BioSNG production cost breakdown for a 30MWbioSNG plant............................................... 35
Figure 16: BioSNG production cost breakdown for a 100MWbioSNG plant............................................. 36
Figure 17: Sensitivity of the bioSNG production cost to various parameters ...................................... 37
Figure 18: BioSNG production cost as a function of plant size, for two feedstock supply strategies .. 38
Figure 19: Delivered cost of heat and annual costs for domestic applications .................................... 42
Figure 20: Delivered cost of heat and annual costs for commercial applications ................................ 43
Figure 21: Delivered cost of heat and annual costs for industrial applications .................................... 44
LIST OF TABLES
Table 1: Typical syngas contaminant concentrations, and quality requirements for methanation ....... 5
Table 2: Gas quality requirements for injection into the UK gas grid ..................................................... 7
Table 3: BioSNG technology types and development status .................................................................. 8
Table 4: Technical potential for clean, woody UK feedstocks in 2020 ................................................. 16
Table 5: UK capabilities, projects and stakeholders ............................................................................. 22
Table 6: Key technical, operational and financial parameters for the economic analysis ................... 30
Table 7: Feedstock supply in 2020 for the 30 and 100 MWbioSNG plants ............................................... 31
Table 8: Central sale prices in 2020 and volumes for electricity and heat co-products ....................... 35
Table 9: The contribution of specific costs and revenues to plant bioSNG production costs .............. 36
Table 10: Central sale prices in 2020 and volumes for bioSNG production ......................................... 37
Table 11: bioSNG plant NPV and IRR .................................................................................................... 37
Table 12: Technology size and utilisation for each application ............................................................ 41
Table 13: Delivered cost of heat (p/kWhth) ........................................................................................... 42
Table 14: Biomass boiler sizes and storage requirements.................................................................... 45
Table 15: Emissions factors for small-scale, direct use of fuels ............................................................ 47
Table 16: Arboricultural arisings by UK region ..................................................................................... 56
GLOSSARY
AD Anaerobic Digestion
Biogas Gas composed mainly of methane and carbon dioxide, produced from the anaerobic
digestion of biomass, e.g. landfill or sewage gas
Biomethane BioSNG or upgraded biogas, almost entirely methane. Suitable for gas network
injection
BioSNG Biomass-derived Synthetic Natural Gas, almost entirely methane, produced from the
methanation of syngas and subsequent purification
BTL Biomass To Liquids – processes which convert biomass into liquid biofuels using a
gasification step
CCC Committee on Climate Change
CHP Combined Heat & Power
CTU Conzepte Technik Umwelt AG
CV Calorific Value
DECC Department for Energy and Climate Change
Defra Department for Environment, Food and Rural Affairs
DNOs Distribution network operators – in charge of lower pressure sections of the UK gas
network
ECA Enhanced Capital Allowance
ECN Energy Research Centre of the Netherlands
EIB European Investment Bank
EIBI European Industrial Bioenergy Initiative
EU European Union
FICFB Fast Internally Circulating Fluidised Bed gasifier technology
FT Fischer-Tropsch synthesis, a chemical catalytic process which converts syngas into
liquid fuels, including diesel, under high temperature and pressure
GBI Grant for Business Investment
GoBiGas Gothenburg Biomass Gasification Plant
GS(M)R Gas Safety (Management) Regulations 1996
IBS Integrated Biomass to Syngas Project
IRR Internal Rate of Return
kW kilo-Watt
kWh kilo-Watt hours
LHV Lower Heating Value
LNG Liquefied Natural Gas
MILENA ECN’s dual gasifier technology
MW Mega-Watt
MWh Mega-Watt hours
NPV Net Present Value
NTS National Transmission System – highest pressure sections of the UK gas network.
Owned and operated by National Grid
odt Oven Dried Tonnes – mass of feedstock at 0% moisture content
Ofgem Regulates the electricity and gas markets in Great Britain
ORED Office of Renewable Energy Deployment
PJ Peta Joules (x 1015
)
PPS22 Planning Policy Statement 22
PSI Paul Scherrer Institut, Switzerland
RDA Regional Development Agency

REA Renewable Energy Association
RED Renewable Energy Directive
REPOTEC REPOTEC - Renewable Power Technologies Umwelttechnik GmbH, Austria
RES Renewable Energy Strategy
RHI Renewable Heat Incentive
RO Renewables Obligation
ROC Renewables Obligation Certificate
ROO Renewables Obligation Order
RSA Regional Selective Assistance
RTFC Renewable Transport Fuel Certificate
RTFO Renewable Transport Fuel Obligation
SET Strategic Energy Technology plan
Syngas Gas composed mainly of hydrogen and carbon monoxide, produced from the
gasification of biomass
TUV Vienna University of Technology, Austria
TWh Tera-Watt hours (x 1012
)

1
1 Introduction to the project
1.1 Introduction to bioSNG
There is considerable interest in the use of renewable resources to provide heat, power, fuels,
materials and chemicals, due to their potential benefits through greenhouse gas emissions
reduction, energy security improvement, and in some cases, cost reduction. In particular, the
Renewable Energy Directive commits the EU to a 20% target for energy from renewable sources by
2020, translating into a 15% target for the UK. The Renewable Energy Strategy, 2008 Energy Bill and
Renewable Heat Incentive consultation consider that in order to meet these objectives, around 12%
of the UK’s heating demand may need to come from renewable sources.
Bioenergy is expected to play a prominent role, meeting around half of this heat sector target.
Biomass is currently used both in the UK and internationally to produce heat at a range of scales, for
example in domestic stoves and boilers, industrial/commercial scale boilers and combined heat and
power. However, deployment in the UK is in many cases limited by the ability to site biomass
conversion and storage equipment, and air quality constraints. In addition to this, the lack of district
heating networks, as used in countries such as Sweden, restricts the ability to produce biomass heat
centrally and distribute it to where it is needed.
An alternative route suggested for decarbonisation of the heat sector is electric heating, using
renewable electricity. However, there are concerns over the level of investment in grid
infrastructure and generation capacity that would be required to supply the resulting variability in
electricity demand, and large increases in electricity demand, particularly if demand also increases as
a result of the electrification of transport.
Conversion of biomass to bio synthetic natural gas, or bioSNG, with injection into the natural gas grid
has been proposed as a way to supply low carbon heat, avoiding these problems. BioSNG production
is a thermochemical route consisting of gasification, followed by methanation of the syngas. The
bioSNG could then be transported via the existing natural gas network, and used in heating or CHP
applications by a wide range of domestic, commercial and industrial users, wherever natural gas is
currently used, without additional investment. It could also be used in gas vehicles and so contribute
to the decarbonisation of road transport. Recognition of these potential benefits has led to
increasing interest in bioSNG in the UK over the past few years, with reports assessing bioSNG’s
potential in the UK being published by National Grid, and policy support being considered by DECC
and the REA.
NNFCC commissioned this study to assess the potential of bioSNG routes in the UK, in terms of the
techno-economic feasibility, air quality benefits, market potential, and drivers for and barriers to
bioSNG production and use. Given the policy targets for 2020, the report focuses on technologies
and feedstocks that could be used within this timeframe, based on existing bioSNG technology
developments, rather than research at an earlier stage. NNFCC have also commissioned a parallel
project on the potential greenhouse gas savings of bioSNG routes.
2
1.2 Report structure
This project reviews the potential for bioSNG production and use in the UK, in terms of suitable
technologies, feedstocks and plant locations, potential for economic competitiveness when used in
heat and CHP applications, and local emissions impacts. It also considers the policy climate for
bioSNG production and use, barriers to production and use, and recommendations to overcome
these barriers. This is achieved through:
Reviewing the technology (Section 2). Here we explain the main process steps involved in
bioSNG production, and review the status of bioSNG technology developers and their projects
Assessing the feasibility of a UK-based bioSNG plant (Section 3). In this section, we review
factors that could affect the type of plant, and location, of a bioSNG project in the UK. The main
considerations discussed are feedstock availability and location, plant scale, and gas grid
availability
Reviewing policies (Section 4) that could affect bioSNG feedstock, plants, and use.
Analysing the potential economics (Section 5) of a bioSNG plant in the UK, and use in three
heating applications, compared with other technology options.
Considering air quality benefits (Section 6) of bioSNG routes compared with direct use of
biomass for heating
Identifying the market opportunity and potential barriers (Sections 7 and 8) to bioSNG
deployment in the UK
Drawing strategic conclusions and recommendations (Section 9) on support that might be
needed to encourage a bioSNG production facility, and encourage use of bioSNG

3
2 Technology review
Synthetic natural gas can be derived from biomass via a thermochemical process involving a
gasification step (bioSNG). If adequately cleaned, the bioSNG can meet natural gas standards. It can
then be injected into the gas network and so substitute natural gas in a range of energy applications.
2.1 Review of process steps
The thermochemical route that converts biomass into synthetic natural gas consists of five main
steps, as illustrated in Figure 1. These conversion steps are discussed further below.
1. The biomass feedstock is pre-treated, usually by drying, and sizing if necessary
2. The dried biomass is gasified to produce syngas, a gas mixture mostly made of hydrogen
(H2), carbon monoxide (CO), carbon dioxide (CO2), and methane (CH4)
3. The syngas is cooled and cleaned of tars and other contaminants
4. This gas is then compressed and catalytically reacted in a methanation reactor to produce a
gas mixture composed primarily of methane and carbon dioxide
5. Finally, the gas is purified and the carbon dioxide removed, in order to produce bioSNG that
matches the requirements for injection into the gas network
Figure 1: Schematic of the bioSNG production process1
2.1.1 Feedstock pre-treatment
Biomass gasifiers being developed for this process are currently using wood, although it may be
possible to use other feedstocks in the future (see section 2.3). Before a biomass feedstock can be
gasified, it may need to be dried, as introducing high moisture biomass into the gasifier decreases
gasifier performance. However, the level of drying required is subject to optimisation, since steam is
1 E4tech (2007) “Gazobois – Wood-to-Methane conversion technology: Feasibility study for a first commercial plant in Eclépens”, report prepared for Gazobois SA
GasificationSyngas
cooling & cleaning
Purification
wood
water
Char combustion
air
(steam)
natural gas network
Methanation
syngasH2
COCO2
CH4
N2
(C2H4)
(H2O)
(SOx)(NH3)
(tars)
H2S
H2
COCO2
CH4
N2
(C2H4)
CO2
CH4
H2ON2
(H2)
(CO)
CH4
(N2)
(CO2)
(H2)(CO)
CO2H2OH2O
heat
syngas
(steam)
electricity grid

4
used as a gasifying agent – hence the biomass does not need to be completely dry. Drying can be
achieved using waste heat recovered from the other plant processes. In terms of feedstock size,
gasifiers suitable for bioSNG production require chipped material or smaller.
2.1.2 Biomass gasification
Gasification is a thermochemical process that occurs in an oxygen-depleted environment, in which a
solid material containing carbon, such as coal or biomass, is converted into a combustible mixture of
gases called syngas. Syngas mainly contains H2 and CO, and can be either burnt directly e.g. in gas
turbines to produce electricity, or upgraded to a fuel e.g. via the Fischer-Tropsch reaction to liquid
biofuels or via a methanation process to bioSNG. This combination of gasification and methanation is
the focus of this study.
Although several gasification technologies exist2, only one type, the indirectly-heated dual fluidised
bed gasifier, has been so far considered for integration with a downstream methanation process.
This specific technology is particularly suited for the production of bioSNG, since its syngas has a high
percentage of methane, a high H2/CO ratio and no nitrogen dilution – favourable characteristics for
subsequent methanation in comparison with other gasifier types. Although there is no inherent
reason why other gasifier types (such as entrained flow or oxygen-blown circulating fluidised bed
gasifiers) could not be used for bioSNG production, these gasifiers have lower theoretical biomass-
to-bioSNG efficiencies compared to an indirectly heated dual fluidised bed gasifier3.
A dual fluidised bed gasifier has two chambers – a gasification chamber and a combustion chamber
(see Figure 2). Biomass is fed into the gasification chamber, where it is converted to syngas using
steam as a gasification agent. The char that is also produced then falls into the combustion chamber,
where it is burnt in air, heating the accompanying bed particles. This hot bed material is then
circulated back into the gasification chamber, providing indirect heating for the gasification reaction.
The gasification chamber is kept at temperatures below 900°C to avoid ash melting and
agglomeration. Ash is separated from the bed material, and may need to be disposed of, or can be
sold as a fertiliser, depending on its heavy metal content.
To date, only two designs of dual gasifier technologies have been developed in combination with
downstream methanation: the Fast Internally Circulating Fluidised Bed (FICFB) gasifier technology
developed by CTU and REPOTEC, and the "MILENA" gasifier developed by the Energy Research
Centre of the Netherlands (ECN) – see Figure 2. The two designs are very similar: both use steam,
have similar temperature ranges and produce a nitrogen (N2) free syngas. For more detailed
information on these technologies, see E4tech’s gasification report (2009)2.
2 E4tech (2009) “Review of Technologies for Gasification of Biomass and Wastes”, report for the NNFCC, funded by DECC, Available at: http://www.nnfcc.co.uk/metadot/index.pl?id=9348;isa=DBRow;op=show;dbview_id=2457 3 Christiaan van der Meijden (2009) “The MILENA Gasification Process for the Production of Bio-CNG”, Available at: http://www.ecn.nl/docs/library/report/2009/l09121.pdf

5
Figure 2: Basic principles behind the two main dual fluidised bed gasifier designs, based on the Fast
Internally Circulating Fluidised Bed (FICFB) gasifier (left)1 and the MILENA gasifier (right)
2.
2.1.3 Syngas cleaning
Although mainly composed of H2, CO, CO2, CH4 and N2, the syngas leaving the gasifier also contains
tars and traces of various compounds (e.g. ethylene (C2H4), water (H2O), ammonia (NH3), hydrogen
sulphide (H2S), alkaline salts and alkaline metals). Gas cleaning is necessary in order to avoid
damaging components such as the compressor, and poisoning of the methanation catalyst. A full
description of the cleaning steps typically used for bioSNG production is given in Kopyscinski (2010)4.
Table 1: Typical syngas contaminant concentrations, and quality requirements for methanation5
Component Unit Raw syngas
concentration
Methanation step
requirements
H2S ppm 100 0.1
COS ppm 10 0.1
HCl ppb 25,000 <25
HF ppb <25
NH3 ppm 2,830 100
HCN ppm 280
Hg mg/Nm3 0.02 0.5
Cd mg/Nm3 0.94 0.05
Na + K mg/Nm3 1,630 1
Dust mg/Nm3 10,000 10
Tars mg/Nm3 10,000-15,000 5
Heavy metals mg/Nm3 <300 <1
4 Jan Kopyscinski, Tilman J. Schildhauer, and Serge M.A. Biollaz (2010) “Production of synthetic natural gas (SNG) from coal and dry biomass – A technology review from 1950 to 2009”, in. Press. Fuel 2010 5 Mozaffarian, M.; Zwart, R.W.R., Feasibility of Biomass/Waste-Related SNG Production Technologies, Final Report, ECN, Petten, 2003

6
Solid particles are separated from the syngas within a cyclone and reintroduced into the combustion
zone. Subsequent gas cooling down to temperatures below 500°C leads to the condensation of some
of the tars and alkaline salts, which can then be filtered. Ammonia can be removed with the use of
sulphuric acid solution. The remaining tars are then removed, e.g. with an active carbon filter.
Sulphur is a poison for the methanation catalyst and although there are only traces of it in the
syngas, mostly in the form of H2S, it needs to be removed. This is done e.g. using a ZnO catalyst at
350°C.
In the methanation reaction, three molecules of H2 are consumed for each CO molecule. Although
methanation catalysts exhibit some water gas-shift activity that will produce H2 in-situ, the gas
exiting a dual gasifier is usually only at a H2/CO ratio of between 1 and 2. As a result, developers
prefer to add an additional water-gas shift step upstream of the methanation reactor, in the gas
cleaning stage. This water-shift reaction also has the added benefit of preventing downstream soot
formation by lowering the gas H/C ratio6.
2.1.4 Methanation
In the methanation process, the pressurised syngas is processed together with steam and a catalyst
within a methanation reactor. This can be done at pressures typically ranging from 5 to 60 bar, and
at a moderate temperature (<400°C). During the process, most of the hydrogen, carbon monoxide,
and ethylene in the syngas is converted into methane and carbon dioxide. Commercial methanation
catalysts are available from companies such as Johnson Matthey, Sud-Chemie and Haldor Topsoe.
The overall process is highly exothermic, and so large amounts of heat are also generated (more
than in, for example, FT synthesis). Thermodynamically, low temperatures and high pressures are
the preferred conditions for methanation. However, achieving low, constant reactor temperatures
by the controlled removal of heat is difficult, due to the heat transfer and catalyst properties.
Furthermore, low temperatures and high pressures increase the risk of carbon formation, leading to
catalyst deactivation by deposition – although the introduction of steam can reduce this risk7.
Some of the extracted heat can be used to dry the biomass feedstock, or to generate steam for the
gasifier or methanation reactor. However, there will normally be excess heat remaining, as well as
heat from the syngas cleaning and purification steps. Because there is an onsite demand for power,
planned projects include combined cycle turbines and other equipment to recover waste heat from
these conversion steps, and generate electricity. How much heat is available, and power is
generated, depends on the overall system integration – see Section 2.4.
2.1.5 Purification
The gas mixture exiting the methanation reactor is cooled down to around 30°C, which allows for
condensed water to be separated from the gases. If the methanation process is operated at high
pressures, this water will still contain dissolved methane; this can be extracted, and then either
burnt in the gasifier combustion zone, or be pressurized and recycled in the methanation process.
The dried gas is now mainly composed of CO2 and CH4 in similar proportions.
6 ECN (2010) “Gas conditioning”, Available at: http://www.biosng.com/experimental-line-up/gas-conditioning/ 7 Deurwaarder, E.P., Boerrigter, H., Mozaffarian, H., Rabou, L.P.L.M. and B. van der Drift (2005) “Methanation of Milena product gas for the production of bio-SNG”, ECN, 14th European Biomass Conference & Exhibition, Paris, Available at: http://www.ecn.nl/docs/library/report/2005/rx05194.pdf
7
In order to be injected in the natural gas network, the methane-rich dry gas mixture must be purified
to obtain bioSNG, i.e. as much CO2 as possible must be extracted with minimal CH4 losses and
minimal energy consumption. Various techniques are commercially available for CO2 separation in a
methanation plant, such as physical absorption in a solvent, pressure swing adsorption, or removal
using dedicated membranes.
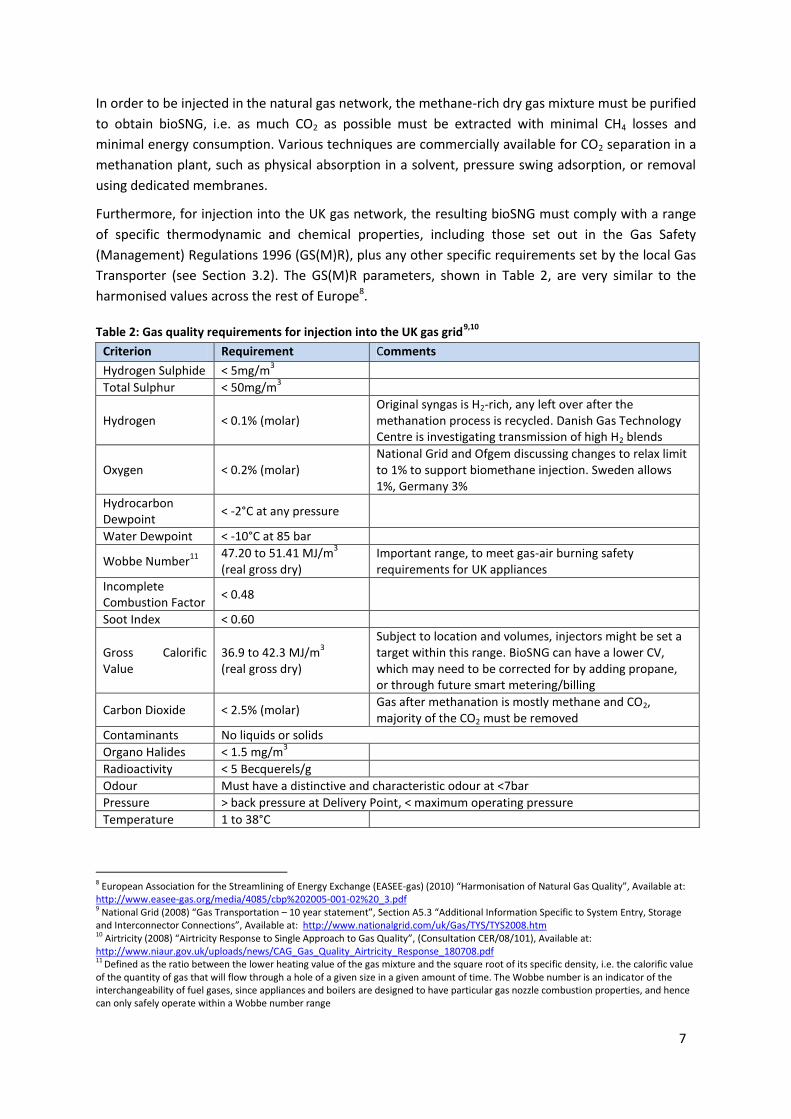
Furthermore, for injection into the UK gas network, the resulting bioSNG must comply with a range
of specific thermodynamic and chemical properties, including those set out in the Gas Safety
(Management) Regulations 1996 (GS(M)R), plus any other specific requirements set by the local Gas
Transporter (see Section 3.2). The GS(M)R parameters, shown in Table 2, are very similar to the
harmonised values across the rest of Europe8.
Table 2: Gas quality requirements for injection into the UK gas grid9,10
Criterion Requirement Comments
Hydrogen Sulphide < 5mg/m3
Total Sulphur < 50mg/m3
Hydrogen < 0.1% (molar) Original syngas is H2-rich, any left over after the methanation process is recycled. Danish Gas Technology Centre is investigating transmission of high H2 blends
Oxygen < 0.2% (molar) National Grid and Ofgem discussing changes to relax limit to 1% to support biomethane injection. Sweden allows 1%, Germany 3%
Hydrocarbon Dewpoint
< -2°C at any pressure
Water Dewpoint < -10°C at 85 bar
Wobbe Number11
47.20 to 51.41 MJ/m
3
(real gross dry) Important range, to meet gas-air burning safety requirements for UK appliances
Incomplete Combustion Factor
< 0.48
Soot Index < 0.60
Gross Calorific Value
36.9 to 42.3 MJ/m3
(real gross dry)
Subject to location and volumes, injectors might be set a target within this range. BioSNG can have a lower CV, which may need to be corrected for by adding propane, or through future smart metering/billing
Carbon Dioxide < 2.5% (molar) Gas after methanation is mostly methane and CO2, majority of the CO2 must be removed
Contaminants No liquids or solids
Organo Halides < 1.5 mg/m3
Radioactivity < 5 Becquerels/g
Odour Must have a distinctive and characteristic odour at <7bar
Pressure > back pressure at Delivery Point, < maximum operating pressure
Temperature 1 to 38°C
8 European Association for the Streamlining of Energy Exchange (EASEE-gas) (2010) “Harmonisation of Natural Gas Quality”, Available at: http://www.easee-gas.org/media/4085/cbp%202005-001-02%20_3.pdf 9 National Grid (2008) “Gas Transportation – 10 year statement”, Section A5.3 “Additional Information Specific to System Entry, Storage and Interconnector Connections”, Available at: http://www.nationalgrid.com/uk/Gas/TYS/TYS2008.htm 10 Airtricity (2008) “Airtricity Response to Single Approach to Gas Quality”, (Consultation CER/08/101), Available at: http://www.niaur.gov.uk/uploads/news/CAG_Gas_Quality_Airtricity_Response_180708.pdf 11 Defined as the ratio between the lower heating value of the gas mixture and the square root of its specific density, i.e. the calorific value of the quantity of gas that will flow through a hole of a given size in a given amount of time. The Wobbe number is an indicator of the interchangeability of fuel gases, since appliances and boilers are designed to have particular gas nozzle combustion properties, and hence can only safely operate within a Wobbe number range

8
2.2 Development status
Both gasification and methanation processes involve mature technologies, already used at large
scale for fossil fuel feedstocks. Methanation has been intensively investigated in the past, in
particular methane production from coal, although this was not followed by commercial
developments (with the exception of Sasol in South Africa) due to the lack of market incentives in
the 1990s.
However, biomass gasification using a dual fluidised bed gasifier is only at the demonstration stage.
Also, there is very limited experience in integrating biomass gasification with downstream processes,
either for the production of liquid fuels via a Fischer-Tropsch process or gaseous fuels via
methanation2. Each system component is generally designed to work within a narrow physical and
chemical range, which makes their integration particularly complex (see Section 2.4).
Today, the combined gasification-methanation technology to produce SNG from biomass is at the
pilot and demonstration stage, with the first commercial scale plants expected between 2012 and
2015. Further work is needed to determine and optimize plant configurations that will be technically
and economically viable. Currently only two groups, ECN and the Austro-Swiss consortium led by
REPOTEC and CTU, are developing integrated gasification-methanation technologies. Table 3 below
summarises their development status, with further details provided in the sections below. These
developers have each been working on bioSNG for about eight years, along with other projects.
Other developers could enter the market, and may have shorter development timescales if they had
existing capabilities in gasification or downstream technologies.
Table 3: BioSNG technology types and development status
Project Technology
type
BioSNG technology
development stage Location Size
Operational
start-up
BioSNG REPOTEC-
CTU
Test rig Güssing
(Austria)
10 kWbioSNG slip stream
of the 8 MWth CHP plant 2003
Pilot plant Güssing
(Austria)
1 MWbioSNG unit, built on
the 8 MWth CHP plant 2008
Gazobois REPOTEC-
CTU Commercial scale plant
Eclépens
(Switzerland) 21.5 MWbioSNG 2012
GoBiGas REPOTEC-
CTU
Commercial scale plant
– Phase 1
Gothenburg
(Sweden) 20 MWbioSNG 2012
Commercial scale plant
– Phase 2
Gothenburg
(Sweden) 80 MWbioSNG 2015/16
E.ON REPOTEC-
CTU
Commercial scale plant Not yet
known 200 MWbioSNG 2015/16
Commercial scale plant Not yet
known 300 MWbioSNG 2018
ECN ECN
Test rig Petten
(Netherlands) 25 kWth biomass input 2004
CHP pilot plant (no
bioSNG)
Petten
(Netherlands) 800 kWth biomass input 2008
CHP demonstration (no
bioSNG)
Alkmaar
(Netherlands) 10 MWth biomass input 2013
Demonstration plant Not known 50 MWth biomass input 2016

9
2.2.1 REPOTEC-CTU technology
As part of the EU Bio-SNG project, a 1 MWbioSNG methanation pilot plant has been operating in
Güssing, Austria12. This methanation unit takes some of the syngas produced from the existing 8
MWth commercial gasifier at Güssing, which has operated for more than 42,000 hours since 2002
(see Figure 3). The total budget for the pilot phase is about €8m. The Güssing project team are13:
Institute for Energy and Environment (DBFZ), Germany – project co-ordination, biomass
provision and demonstration of SNG in vehicles
Vienna University of Technology (TUV), Austria –gasification and gas cleaning
Paul Scherrer Institut (PSI), Switzerland –methanation and gas upgrading
Biomasse Kraftwerk Güssing (BKG), Austria –demonstration and monitoring
Repotec Umwelttechnik, Austria –gasifier construction and commissioning
Conzepte Technik Umwelt (CTU), Switzerland –detailed engineering
Electricite de France (EdF), France; Verbundnetz Gas (VNG), Germany and the Institute of
Chemical Process Fundamentals (ICPF), Czech Republic
Figure 3: REPOTEC-CTU’s 8MWth FICFB gasifier (left) 14, and 1MWbioSNG methanation unit (right), installed
in Güssing, Austria15
The bioSNG pilot has built on the results of the R&D activities and test phase at 10 kWbioSNG, which
showed high bioSNG yields, and low levels of contaminants. The 1 MWbioSNG plant began
commissioning in December 2008, and first produced grid quality gas in June 2009. A test
programme was run in cooperation with GoBiGas between October and December 2009, with
12 The technical developments are carried out by an Austro-Swiss consortium led by commercial partners CTU and REPOTEC. The other scientific project partners are the Institute for Energy and Environment GmbH, the Paul Scherrer Institute (Switzerland), Biomasse Kraftwerk Güssing GmbH & Co KG (Austria), Vienna Univesity of Technology, VNG-Verbundgasnetz AG, Electricité de France, Institute of chemical Process Fundamentals (Czech Republic) 13 Bio-SNG (2010) “Partners”, Available at: http://www.bio-sng.com/ 14 Novatlantis (2010) “Wood gasification plant in Güssing” Available at: http://www.novatlantis.ch/index.php?id=57&L=1 15 Reinhard Rauch (2009) “BioSNG for Transport” presentation at IEA Bioenergy Task 39 Workshop, “From today’s to tomorrow’s Biofuels” June 2-5, 2009 Dresden, Germany. Available at: www.task39.org/Portals/60/presentations/Dresden%20Workshop/Oral%20Presentation/28-Rauch%20BioSNG%20for%20Transport.pdf REPOTEC-CTU’s Güssing plant uses wood chips

10
operators from Göteborg Energi and E.ON present to gain operational plant experience and further
optimise the full process chain16.
The goal of the pilot plant is to demonstrate the technical feasibility of the methanation technology
at industrial scale and to derive optimal operating parameters for the integration of the different
processing steps. The pilot has demonstrated technical feasibility recently17.
Based on this technology, two commercial scale projects are being developed (see Table 3 above).
However, a delay in the construction and commissioning of both Gazobois and GoBiGas projects is
likely since the Güssing pilot, upon which these two commercial projects depend, has itself been
delayed by almost a year. The EU Bio-SNG project was only due to run to April 2009, and although
construction was mechanically complete in July 2008, commissioning and resolving technical issues
(a faulty water supply valve causing partial methanation catalyst deactivation) were not completed
until June 200915.
Gazobois SA is running the Swiss project, although is being taken over by BKW FMB Energie,
Romande Energie and Holdigaz18. The project is currently in the engineering design phase, and
plans to start-up in 2012.
GoBiGas in Sweden is 80% funded by Göteborg Energi and 20% by E.ON. There are two phases –
an initial 20MWbioSNG plant planned for 2012, and an additional 80MWbioSNG plant by 201616. An
investment decision for Phase 1 will be taken in June 2010. Based on the results of Phase 1, E.ON
also have the aspiration to build a 200 MWbioSNG plant by 2015, operational by 2016.
2.2.2 ECN technology
ECN’s route to bioSNG production relies on the integration of different technologies from different
suppliers – ECN are developing their own MILENA gasifier, and then buying in gas cleaning and
catalytic methanation technologies.
The MILENA gasifier (see Figure 4) is a compact, indirectly heated gasifier, first designed in
1999. Biomass is converted into syngas in the steam-blown CFB gasification chamber, sitting
within the BFB air-blown combustor (which provides the heat). The MILENA technology is
more compact than the REPOTEC-CTU design, although less advanced, since the REPOTEC-
CTU gasifier has been demonstrated at 8 MWth, as described above. ECN expect that the
MILENA unit is capable of being scaled up to several 100’s of MWth19
The OLGA tar removal system is commercially supplied by Dahlman. OLGA collects
condensed tars, before absorbing and stripping the remaining tars from the syngas. The tars
can then be recycled back to the gasifier.
There are several commercial suppliers of the remaining cleaning steps and methanation
process. ECN aim to operate the methanation reaction at pressures of around 7 bar, which is
lower than other methanation systems20, allowing for a simplified process (no gas recycles,
16 Åsa Burman (21st Jan 2010) “The GoBiGas Project - from biomass to biogas” Seminar at Chalmers University of Technology, Available at: http://www.monolithica.com/downloads-594514 17 Private communication, results currently unpublished 18 SECA (23rd November 2009) “eNewletter no. 203: sol-E Suisse to acquire stake in Gazobois”, Available at: http://www.seca.ch/default.asp?V_ITEM_ID=14619&TEMPORARY_TEMPLATE=184 19 Bram van der Drift (13th February 2010) pers. comm. 20 Zwart R.W.R. et al, “Production of Synthetic Natural Gas (SNG) from Biomass, Development and operation of an integrated bio-SNG system”, non-confidential version, ECN E-06-018, 2006, Available at: http://www.ecn.nl/docs/library/report/2006/e06018.pdf

11
simple vessels without the need for internal cooling), but at the expense of methane yields
and catalyst activity21.
A 25 kWth lab-scale system was built in 2004. This has successfully undergone duration testing under
fully automated operation with gas cleaning and methanation for over 1,000hours. An 800 kWth
MILENA pilot gasifier started operation in September 2008, and an OLGA tar removal system was
added in 2009. This pilot plant produces tar-free syngas, but not bioSNG. The plant has been tested
using virgin wood, and in 2010 will start to use clean waste wood22.
ECN’s first priority is not currently bioSNG production, but scale-up of the MILENA gasification step.
In partnership with an industrial player, HVC, they plan to build a 10MWth combined heat & power
(CHP) demonstration plant by 2012, whereby syngas is cleaned in an OLGA system, then directly
combusted in a gas engine. This partnership then plans to build a complete 50MWbioSNG bioSNG
demonstration plant by 2015, including the downstream methanation process step, which will
require additional syngas cleaning compared with the CHP systems.
Figure 4: 800kW MILENA gasifier (left), and 30kW gas cleanup and methanation (right), installed at ECN
2.3 Feedstock suitability
Although bioSNG can, in principle, be produced from any solid biomass feedstock, in order to
determine the feedstock types most likely to be used, we conducted a review of the literature
surrounding the existing projects1,15,23,24 and discussed our findings with researchers25,26.
21 ECN (2009) “Methanation” Available at: http://www.biosng.com/experimental-line-up/methanation/ 22 ECN (2010) “Updates on MILENA lab-scale and MILENA pilot” Available at: http://www.milenatechnology.com/ 23 ECN has been using willow and other feedstocks in their lab-scale system, and has tested virgin wood in their pilot plant. In 2010, they
will start using clean waste wood from demolition sites 24 Göteborg Energi (2009) Available at:
http://www.goteborgenergi.se/English_Projects_GoBiGas__Gothenburg_Biomass_Gasification_Project_DXNI-9238273_.aspx . Göteborg
plant will use forestry residues, such as tips, roots and branches 25 Bram Van der Drift (11th November 2009) ECN, email pers. comm. 26 CTU (11th January 2010) pers. comm.

12
All the current technology developments are focusing on clean wood: both the existing bioSNG units
(at Güssing and Petten) currently use clean wood, and the planned commercial plants (in Eclépens
and Göteborg) are planning to use clean wood as well.
The Güssing pilot plant has not used any feedstocks other than clean wood for
insurance/equipment warranty reasons, and they consider that using any alternative feedstocks
would be very difficult currently. This is because they have now ceased their lab-scale gasifier
testing, and are focusing on scale up26. They consider the use of contaminated waste wood as
technically feasible, although expected that this would also result in a shortening of the
methanation catalyst lifetime and the additional need to remove chlorine from the syngas.
ECN have tested a few other, more difficult, feedstocks such as sewage sludge, and might go on
to use small amounts in the future. However, as a result of the early stage of technology
development and work on scale-up to 2020, they expect that new plants would be only be using
clean wood in the near-to-mid term25.
This leads to the conclusion that a new bioSNG plant built by 2020 will be very unlikely to use
anything other than clean, woody feedstocks.
2.4 Plant configuration and efficiency
As mentioned in Section 2.1.4, the amount of heat recovered, the degree of biomass drying, and
amount of steam and electricity generated depends on the design configuration of the bioSNG plant,
as well as the operating conditions. These factors also have a large impact on the efficiency of
conversion of biomass to bioSNG, potential energy exports, and on the plant economics.
The different technology developers and projects are considering different plant configurations,
listed below. It is important to note when considering the efficiency of bioSNG production that these
are generally based on lower heating value (LHV), and so vary depending on the moisture content of
the feedstock used: the LHV efficiency increases when wetter feedstocks are used. In general, a self-
sufficient bioSNG plant can be configured to maximise bioSNG output (to around 70% efficiency with
feedstock at around 25% moisture content), with minimal co-products.
ECN’s commercial scale plants are expected to use an efficient steam cycle, importing no
power, and exporting no heat. This would mean minimal co-product output, and a biomass
to bioSNG efficiency of up to 70% (using 25% moisture content feedstock)23.
REPOTEC-CTU’s Güssing plant is only a pilot plant and is not optimised for bioSNG
production; hence this configuration will not be considered further.
The Gazobois project modelled a 30MWbioSNG output, with 2MWth heat and 0.7MWe power
also available for export1. In this base case, the raw biomass-to-bioSNG efficiency is 74%
(using 50% moisture content feedstock), and overall process efficiency 80%, although
different efficiencies can be achieved in other configurations.
The GoBiGas project plans to operate at a biomass-to-bioSNG efficiency of 65-70%, using
pellets at 10% moisture content; however, this does not include 2.5MW of imported
electrical power alongside the 32MW biomass fuel input. They quote an overall efficiency of

13
above 90% for the conversion of input biomass & power into output bioSNG & heat27, since
most of the waste heat will be recovered for use in a neighbouring co-generation plant and
district heating scheme.
For the purposes of this report, we will consider the self-sufficient option used by Gazobois, with
small electricity and heat outputs (and no inputs), as this matches best with the data on plant
economics used in Section 5.1.
2.5 Comparison with BTL
Given the previous NNFCC study on gasification technologies for liquid fuels production2, it is
interesting to note the key similarities and differences between the biomass to liquids (BTL) and
bioSNG processes
Technology development status. BioSNG production is at an earlier stage of development than
the BTL routes considered, which have demonstration plants using several different technologies
at relatively large scales. BioSNG is based on a gasification technology at an earlier stage than
those used in most BTL routes, although there has been relatively long operating experience at a
demonstration scale plant (Güssing). There is also less experience with process integration with
methanation, which has only been demonstrated at pilot scale.
Syngas quality. In terms of gas contaminants, all chemical catalytic BTL routes have more
stringent quality requirements than methanation. For example, the FT process requires much
lower levels of nitrogen compounds, alkaline metals, tars and particulates. However,
methanation requires a higher H2/CO ratio (of 3) than FT (2), mixed alcohols (1) or syngas
fermentation (unimportant). H2/CO ratios can be increased via a water-gas shift reaction.
Efficiency. Self-sufficient bioSNG plants optimised for bioSNG production have an energy
efficiency from feedstock to bioSNG of around 70%. BTL systems have an efficiency of
conversion of feedstock to BTL liquids of 45-55%28,29. The main reasons for the efficiency
difference are that the raw syngas contains a proportion of methane, and that methanation is
highly efficient (around 85%)30 compared to FT and alcohol synthesis reactions (typically nearer
60%)31.
Scale up potential. BioSNG developers are considering plant scale of up to 100-200MW, as a
result of constraints on the size of the dual gasifiers currently used. BTL plants using entrained
flow gasifiers could be of much larger scale, as could those using other gasifier types in modular
systems. It may be difficult to use modular gasifier systems for bioSNG, as a result of the existing
complexity of process integration.
Feedstock. As discussed above, bioSNG developers are considering only using wood as a
feedstock in the near term. Some other gasifier types used for BTL, such as plasma gasifiers, are
27 Åsa Burman (21st Jan 2010) “The GoBiGas Project - from biomass to biogas” Seminar at Chalmers University of Technology, Available at: http://www.monolithica.com/downloads-594514 28 Mark M. Wright and Robert C. Brown (2007) "Comparative economics of biorefineries based on the biochemical and thermochemical platforms", Center for Sustainable Environmental Technologies, Iowa State University, published Wiley InterScience DOI: 10.1002/bbb.8; Biofuels, Bioprod. Bioref. 1:49–56. This gives 45% biomass to BTL efficiencies for FT diesel and methanol, 50% for hydrogen 29 Opdal, Olav A. (2006) “Production of synthetic biodiesel via Fischer-Tropsch”, Department of Energy & Process engineering, Norwegian University of Science and Technology, Available from: http://www.zero.no/transport/bio/BtL%20Namdalen.pdf 30 E4tech (2007) “Gazobois – Wood-to-Methane conversion technology: Feasibility study for a first commercial plant in Eclépens”, report prepared for Gazobois SA 31 E4tech (2009) “Review of Technologies for Gasification of Biomass and Wastes”, report for the NNFCC, funded by DECC, Available at: http://www.nnfcc.co.uk/metadot/index.pl?id=9348;isa=DBRow;op=show;dbview_id=2457

14
more flexible. In addition, the BTL routes that are based on fluidised bed technologies (as used in
dual fluidised bed gasifiers) are using a wider range of feedstocks, including wastes. This is a
result of the greater level of experience with development and use of these technologies –
which may be the case in the future for bioSNG.
2.6 Next steps to commercial deployment
Although bioSNG production technologies may bring several potential advantages over other
biomass conversion techniques, in particular in terms of overall energy efficiency and flexibility of
the bioSNG use, bioSNG production has not yet attracted a great deal of interest. There are only two
technology developers, both European, and their technologies are both at the pilot stage.
The key aspects of the future development of bioSNG production technologies are:
Technology. The first-of-a-kind commercial plant is highly likely to be based on the technology
developed by an Austro-Swiss consortium led by commercial partners REPOTEC and CTU
Timescale. The first commercial plants are planned for 2012 in Sweden and Switzerland,
although a delay is likely. Given that the developers will be engaged in these projects until at
least 2015, and that a bioSNG plant takes about 3 years to be designed and built, we only
consider it likely that the first UK plant could be operational after 2018
Size. The size of the first commercial plant will be about 20 MWbioSNG, although future plants are
expected to fall in the range 30-100 MWbioSNG
Feedstock. It is very likely that clean wood (forestry residues, short rotation coppice, etc.) will be
the only feedstock used for commercial bioSNG production out to 2020. Alternative feedstocks
(e.g. municipal solid waste, miscanthus) may be used in the longer term if the technology proves
robust enough to these more difficult feedstock types
Players. While the ECN technology is still being developed by a research organisation, the
REPOTEC-CTU technology has attracted a number of commercial partners, such as technology
developers and large power utilities
Barriers to deployment. The technical feasibility of bioSNG production appears to have been
proven for the REPOTEC-CTU technology. According to ECN, the main technical challenges for
bioSNG remaining lie in32:
o the scale-up to commercial size, especially gasification and tar removal
o demonstrating and optimising the critical gas cleaning steps for removing unsaturated
hydrocarbons, tars and organic sulphur found in real gases, i.e. beyond the existing
limited testing at lab and pilot scale
o optimising methanation catalysts to handle specific contaminants (sulphur, unsaturated
and saturated hydrocarbons), and conducting long-term testing for increased bioSNG
efficiency
o the optimisation of plant configurations / the overall system to ensure each plant will be
technically and economically viable
32 Robin Zwart (2009) “JER 2.2 - Prospects for production and use of substitute natural gas (SNG) from biomass”, Bioenergy NoE, Available at: http://www.bioenergynoe.org/Resources/user/Robin%20Zwart,%20ECN%20-%20Prospects%20for%20production%20and%20use%20of%20substitute%20natural%20gas%20(SNG)%20from%20biomass.pdf
15
3 Technical feasibility of a UK-based bioSNG plant
This section assesses the technical feasibility of building a bioSNG plant in the UK, by discussing the
implications of UK-specific constraints, such as the availability of appropriate biomass feedstocks,
integration with the UK gas network, demand for co-products, and existing capabilities. This will help
to determine suitable plant sizes, and possible regions for locating plant location in the UK.
The type of bioSNG technology that might be used in the UK, is not, however, affected by these
considerations. This is because the two main technology types (REPOTEC-CTU and ECN) are very
similar in terms of suitable feedstocks, commercial plant scale and bioSNG quality, meaning that
either could have potential for UK deployment.
3.1 Feedstock types and available resources
In order to determine at a high level which UK regions have the potential for bioSNG plants, this
section considers the types and volumes of feedstock that may be available, and likely regions of
production for these feedstocks. The availability and distribution of feedstocks will affect both the
plant location, and the size, as economies of scale in plant costs may be offset by increased
feedstock transport requirements. This section allows a high level view of the likely scale of UK
plants, and potential regions; a more detailed assessment would be required by any project
developers planning to access biomass resources in a particular location.
3.1.1 Suitable types of feedstock
As discussed above, technologies currently being developed are focusing on clean wood feedstocks,
and it is likely that any plant built in the UK by 2020 will use this type of feedstock. Other UK
feedstocks (e.g. straw, miscanthus, municipal solid waste) might be able to be used in a UK bioSNG
plant, but only in the longer term. Therefore, in this section, feedstocks considered include:
Stemwood
Forestry residues
Arboricultural arisings (municipal trimmings)
Short Rotation Coppice (SRC), such as willow and poplar
Sawmill co-products
Clean waste wood
Imported chips and pellets
A full description of each of these feedstocks is given in Annex A.
3.1.2 Feedstock resource available to bioSNG plants
The size of the resource available varies for each feedstock. From previous E4tech work on biomass
resources33, Table 4 below shows the total technical potential in 2020, and once non-energy
demands (such as those from the wood panel industry) have been met.
33 E4tech (2009) “Biomass supply curve for the UK”, using the Central RES scenario, Available at: http://www.decc.gov.uk/en/content/cms/what_we_do/uk_supply/energy_mix/renewable/res/res.aspx

16
Table 4: Technical potential for clean, woody UK feedstocks in 2020
Total potential resource (PJ/yr)
Available for bioenergy (PJ/yr)
Stemwood 132.3 17.5
Forestry residues 19.3 19.3
Arboricultural arisings 9.3 7.8
Short rotation coppice34
124.1 124.1
Sawmill co-products 45.2 19.5
Clean waste wood35
29.9 9.9
TOTAL 389.3 210.4
Although these are technical potentials, for most feedstocks, it is likely that a large proportion of the
resource could be accessed. However, for energy crops, the technical potential is very large (over
half of the available potential for bioenergy), since a fast ramp-up in UK energy crop planting rates
was assumed, given supportive policy and market conditions. However, over the next 10 years the
planting rates are likely to be much slower, resulting in a much smaller SRC resource. Currently, the
total SRC resource in the UK is only 1.2 PJ/yr.
Furthermore, these amounts would not all be available for bioSNG, as there will be competition
from other bioenergy uses, such as electricity generation, heating, CHP and possibly transport fuels
production. Evaluating this competition is beyond the scope of this study, however, comparing the
scale of the resources in Table 4 with the requirements of a bioSNG plant shows that there could be
enough resource for a number of bioSNG plants:
A 30MWbioSNG plant would require 1.0 PJ/year or 70,000 odt/year of wood
A 100MWbioSNG plant would require 3.4 PJ/year or 233,000 odt/year of wood
Each of the UK feedstock resources listed above in Table 4 are significant enough to merit
consideration in this study, as is the very large potential supply of biomass imports into the UK.
3.1.3 UK bioSNG plant location and size
The volume and type of feedstock available will determine the maximum plant size. There are trade-
offs between maximising plant size, and minimising feedstock transport distances to the plant and
supply risks. Furthermore, the cost of locally sourced feedstock is expected to increase with volume
supplied, due to an increasing cost of extraction for the marginal resources.
A high level view of possible bioSNG plant locations can be given based on considering those areas
with high feedstock densities and a diversity of feedstocks. The maps shown below (Figure 5 to
Figure 10) give an indication of the distribution of different feedstocks across the UK36.
34 The SRC potential is calculated from a split of the 2020 UK energy crop resource, from E4tech (2009) “Biomass supply curve for the UK” study for DECC – see footnote above. SRC is calculated to comprise 78%, and miscanthus 22%, of the total UK energy crop resource available in 2020. This is based on a spatial analysis of energy crop potential land suitability for the TSEC-Biosys project (www.tsec-biosys.ac.uk/index.php?p=1 ), conducted by Pepinster (2008) "Optimization of the bioenergy development in the UK and identification of policies to improve its penetration in the supply portfolio: England Case Study" MSc thesis for Imperial College, London 35 It is worth noting that the clean waste wood resource has been changed since E4tech’s original analysis, in light of more recent data published by WRAP (2009) “Wood waste market in the UK”, Available at: www.wrap.org.uk/recycling_industry/publications/wood_waste_market.html and the WRA (2008) “Wood To Markets” Statistics available at: www.woodrecyclers.org/recycling.php 36 There is no map available for arboricultural arisings, although Table 16 in Annex A shows that the resource is largest in the East and South of England. Waste wood arisings are presumed to be correlated with population density, as shown in Figure 11.

17
Figure 5: Distribution of
woodland over 2 hectares37
Figure 6: Map of UK forestry
residues (oven dried tonnes
per annum)38
37 Forestry Commission (2009) “National Inventory of Woodland and Trees: Great Britain” Available at: www.forestry.gov.uk/pdf/nigreatbritain.pdf/$FILE/nigreatbritain.pdf 38 Restats (2009) “Statistics database for the United Kingdom” Website, Available at: www.restats.org.uk/policy.htm
Figure 7: SRC land suitability
in Scotland39
Figure 8: SRC land suitability
in England & Wales40
, and
location of current SRC
plantations
39 Andersen RS, Towers W, Smith P (2005) “Assessing the potential for biomass energy to contribute to Scotland’s renewable energy needs”, Biomass & Bioenergy 29, 2, pp. 73-82 40 Defra (2006) “Opportunities & optimum sitings for energy crops” Available at: www.defra.gov.uk/foodfarm/growing/crops/industrial/energy/opportunities/index.htm
Figure 9: Map of active UK
sawmills41
Figure 10: UK commercial
ports importing forestry
products, major ports
highlighted42
41 Forestry Commission & Forest Service (2009) pers. comm. Sawmill postcodes plotted at: www.batchgeocode.com/map/?i=ca2f1e7dc0d4caf02cad7e524d10f354 42 FERA Points of Entry data was used to plot port postcodes at: www.batchgeocode.com/map/?i=f9c45c548c6e9ac05f9e110d3fe6ee3b

18
The regions with the highest potential resource availability based on local feedstocks are:
the South of England, particularly west and south of London - almost all the feedstocks are
present including arboricultural arisings, forestry residues, stemwood. This area already has
some SRC activity, plus some highly suitable land
Yorkshire and the Humber, and the East Midlands - arboricultural arisings, current SRC
activity, and some forestry. This area already has considerable SRC activity, plus highly
suitable land for future growth. However, bioenergy competition in this region is expected
to be high, with several large co-firing power plants, and dedicated biomass plants planned
in the region43
Southern Scotland – stemwood, forestry residues and sawmill co-products
South Wales – stemwood and forestry residues and some sawmill co-products. Competition
in this region is again expected to be high, with several dedicated biomass power plants
planned43
There are also other areas in the UK that have a high density of some feedstocks, such as East Anglia,
the North of Scotland, and North Wales, where bioSNG plants could also be built.
There is also potential for plants using imports, which are most likely to be sited at a major UK port,
in order to minimise further transport costs. Given that imports are generally more expensive than
UK feedstocks, these plants are also likely to access cheap local resources where available, for
example close to the ports of Aberdeen, Tyne, Teesport, Hull, Goole, Immingham, Tilbury or
Southampton. The ports in North East England (Tyne, Teesport, Hull, Goole and Immingham) already
handle large volumes of forestry material from Scandinavia and North America, and there is also
some SRC activity in these regions.
3.2 Availability of the UK natural gas network
As important as the availability of suitable biomass feedstocks is the availability of the natural gas
network. There has to be a pipeline of sufficient capacity, sufficiently close to the plant, in order that
all the bioSNG produced can be sold and injected. This section will discuss how the design and
operation of the UK gas grid constrains potential bioSNG plant locations.
3.2.1 Transmission network
The National Transmission System (NTS) is the high pressure part of Great Britain’s gas grid,
consisting of 6,600km of steel pipeline. As shown in Figure 11, the NTS connects the beach terminals
from the North Sea and mainland Europe to the major demand locations. The pipelines are buried
below ground, outside towns and cities. The NTS can operate at pressures of up to 95bar, although
50-65bar is the usual operating range.
The NTS is owned and operated by National Grid, who also control the compressor stations, storage
and several of the liquefied natural gas facilities on the system44. Instantaneous balancing of supply
43 Hawkins Wright (2009) “Forest Energy Monitor” Volume 1, Issue1 – 8 May 2009. Available at: http://www.forestenergymonitor.com/pdf_files/FEM_Issue_1_web.pdf 44 National Grid (2009) “About the Gas Industry: How is Gas delivered?” Available at: http://www.nationalgrid.com/uk/Gas/About/How+Gas+is+Delivered

19
and demand is not required, since NTS pipeline pressures vary by location and time of day, and there
are also several large storage facilities in the UK. Large gas users such as power stations and large
industrial users connect directly to the transmission network at off-take points.
For a bioSNG project to be connected directly to the NTS, then45:
The quality standards for injection of gas into the NTS, as set out in Section 2.1.5, must be met9.
For gas to be injected into a network, it must be at a higher pressure than the network.
Depending on the methanation pressure, further compression might be necessary to reach NTS
pressures.
The connection must be agreed with the National Grid. This means completing the physical
connection with measurement equipment installed, signing the Network Entry Agreement
detailing the conditions for gas to flow (potentially including gas quality requirements above
GS(M)R), and obtaining the rights to sufficient transmission entry capacity. National Grid would
enter into contractual discussions for the design and build of the connection facilities. This
process typically takes 24 – 36 months from initiation to completion. However, as this is a
shorter timescale than for delivering incremental entry capacity on the system, it is important
that capacity needs are considered from the outset.
3.2.2 Distribution networks
The UK gas network also consists of several distribution networks, with 270,000km of lower pressure
pipes taking gas from the NTS to smaller customers. Distribution network operators (DNOs) use a
series of pressure drops, cascading down from the NTS off-take point to46:
the High Pressure Distribution Network47 operating above 7bar (often around 30bar), then
the Intermediate Pressure tier at 2-7bar, then
the Medium Pressure tier at 75mbar–2bar, then finally
the Low Pressure tier at <75mbar, for delivering gas to domestic households.
These pressure drops reduce the gas temperature – in particular the drop from the NTS down to
7bar can be large enough to cause pipes and valves to freeze. To prevent this happening, National
Grid use gas boilers to pre-heat the gas at the NTS off-take points48.
There are 8 gas Distribution Network regions in Great Britain, with 4 different owner-operators
(DNOs); National Grid, Scotia Gas Networks; Wales & West Utilities and Northern Gas Networks. All
four DNOs currently have the same technical standards for biomethane injection49 and none apply
charges for injecting gas into the gas distribution network. However, the biomethane supplier would
have to pay the costs of the connecting pipeline into the grid and associated works (metering, gas
45 National Grid (2009) “Entry Connection Process” Available at: http://www.nationalgrid.com/uk/Gas/Connections/ntsentry/entry_conn_processes/entry_con_process 46 National Grid (2005) “Appendix 15 – Glossary”, Available at: http://www.nationalgrid.com/NR/rdonlyres/9302C433-026E-44E5-8A6A-648B67F6A00E/866/app15.pdf 47 Historically, the High Pressure Distribution Network was called the “LTS” – Local Transmission System 48 Climatico (2009) “Blue-NG: No Geopressure at Beckton, instead it’s the World’s Most Efficient Generator”, Available at: http://www.climaticoanalysis.org/post/blue-ng-no-geopressure-at-beckton-instead-it%E2%80%99s-the-world%E2%80%99s-most-efficient-generator/ 49 National Grid (2008) “National Grid Gas Distribution – Long Term Development Plan 2008”, Section A5.3 “Additional Information Specific to System Entry and Storage”, Available at: http://www.nationalgrid.com/uk/Gas/TYS/LTDP/index.htm

20
quality monitoring, valves etc). This plant would most likely be built by the DNO but paid for by the
plant50.
However, unlike the electricity network in which power can flow from the distribution network back
up to the transmission network, due to the pressure drops, the gas network is currently one-way
only51. This is important, as any gas injected into a regional network must have somewhere within
that region for the gas to be consumed (or temporally stored). If entering any tier of the Distribution
Networks (i.e. at or below 30bar), additional compression costs should not be necessary.
Given that the UK grid specifies a minimum Calorific Value (for both the NTS and distribution
networks), some plants might have to supplement the bioSNG they produce with propane (an
additional cost, and source of greenhouse gas emissions). It might not be necessary to add propane
if the DNO can create a blending point by mixing the bio-methane with existing gas, or if smart
metering and billing options become available in the future (as may well be the case by 2020). The
choices of gas quality processing, compression and grid connection arrangements all interact, and
need to be discussed and agreed with the DNO. As described in Section 2.1.5, inputs into the
Distribution Network have to meet similar standards for injection as for the NTS.
3.2.3 Implications for bioSNG plant location
The mean average composition of the natural gas present in the UK transmission and distribution
networks is 89.1% CH4, 5.2% C2H6, 2.2% N2, 1.4% C3H8 and 1.4% CO2, with traces of larger
hydrocarbons52. The exact composition at a particular location and time can vary considerably.
However, a bioSNG plant injecting into the gas grid only has to meet the quality standards described
in Section 2.1.5 – there are no constraints imposed by an average natural gas composition.
A bioSNG plant will be operating as base-load, with high availability. The commercial plant scales
that are being considered by the technology developers are 20 – 100MWbioSNG. Therefore, the
bioSNG plant must be attached to a large enough network to ensure it can sell all of its gas, as the
lowest pressure tiers will not have the capacity to take the gas in the summer when demand is
lowest. Often the closest gas grid to a potential site (usually within 1 mile) will be at too low a
pressure53. This gives two main options for a bioSNG plant54:
Connect to the high pressure transmission network, which can take very large volumes of gas
Connect to the distribution network in an urban region, where the demand is high. Large
volumes of gas will typically need to go into the High Pressure Distribution Network (at greater
than 7bar), or the Intermediate Pressure tier (at 2 – 7bar)50
50 Although this is the current position, National Grid is open to exploring with DECC/Ofgem whether this is appropriate in the longer term. For example in Germany the gas network is obliged to pay half of the costs. National Grid (2010) pers. comm. and REA (2008) “Biomethane: Injection into the Natural Gas Networks” Available at: http://www.r-e-a.net/document-library/policy/policy-briefings/Biomethane%20Injection%20full%20REA%20briefing%20F.pdf 51 This is the case today, although compression could be added at specific network locations to enable flow from lower to higher pressure tiers, as is the case in Germany. National Grid (2010) pers. comm. 52 StarEnergy (2007) “Albury Gas Storage Project: Preliminary submission of proposals by Star Energy Gas Storage Services Limited for a Storage Authorisation Order under the Gas Act 1965”, Available at: http://www.alburygasstorage.info/documents/AlburyGasStorageProject-SAOPreliminarysubmissionofproposals25July2007.pdf 53 HM Government (2009) “The UK Renewable Energy Strategy” Available at: http://www.decc.gov.uk/en/content/cms/what_we_do/uk_supply/energy_mix/renewable/res/res.aspx 54 National Grid (2009) pers. comm.
21
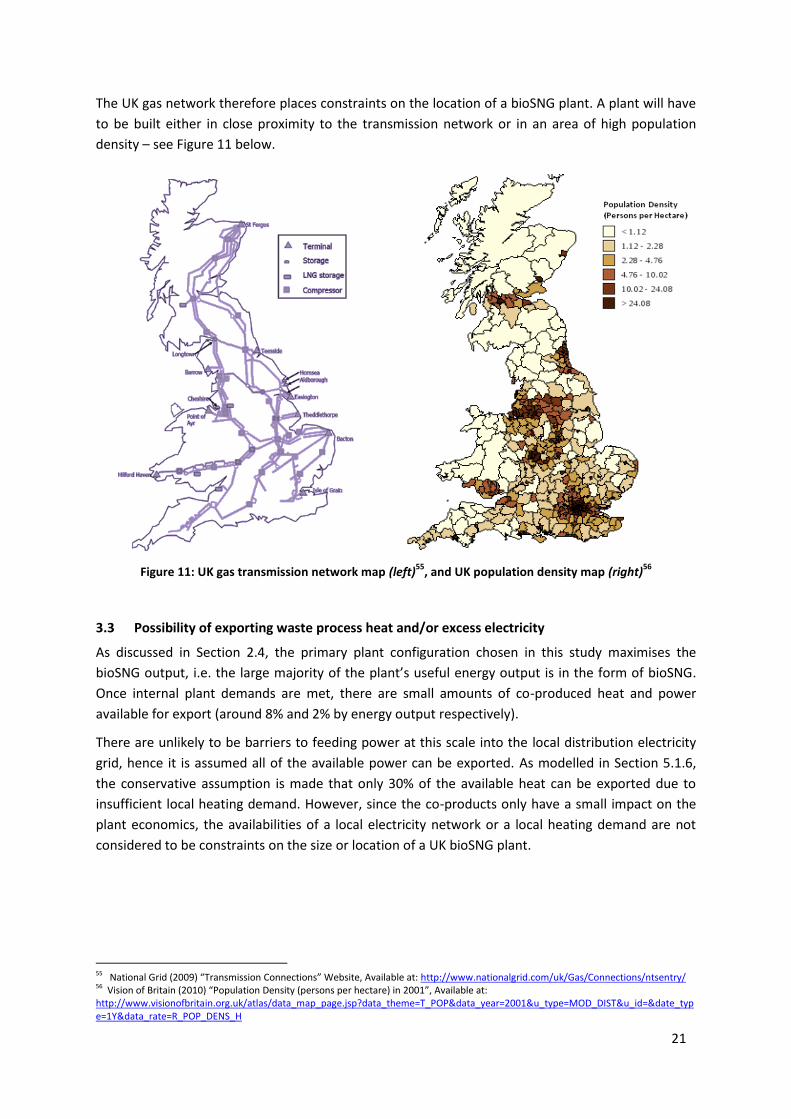
The UK gas network therefore places constraints on the location of a bioSNG plant. A plant will have
to be built either in close proximity to the transmission network or in an area of high population
density – see Figure 11 below.
Figure 11: UK gas transmission network map (left)55
, and UK population density map (right)56
3.3 Possibility of exporting waste process heat and/or excess electricity
As discussed in Section 2.4, the primary plant configuration chosen in this study maximises the
bioSNG output, i.e. the large majority of the plant’s useful energy output is in the form of bioSNG.
Once internal plant demands are met, there are small amounts of co-produced heat and power
available for export (around 8% and 2% by energy output respectively).
There are unlikely to be barriers to feeding power at this scale into the local distribution electricity
grid, hence it is assumed all of the available power can be exported. As modelled in Section 5.1.6,
the conservative assumption is made that only 30% of the available heat can be exported due to
insufficient local heating demand. However, since the co-products only have a small impact on the
plant economics, the availabilities of a local electricity network or a local heating demand are not
considered to be constraints on the size or location of a UK bioSNG plant.
55 National Grid (2009) “Transmission Connections” Website, Available at: http://www.nationalgrid.com/uk/Gas/Connections/ntsentry/ 56 Vision of Britain (2010) “Population Density (persons per hectare) in 2001”, Available at: http://www.visionofbritain.org.uk/atlas/data_map_page.jsp?data_theme=T_POP&data_year=2001&u_type=MOD_DIST&u_id=&date_type=1Y&data_rate=R_POP_DENS_H
22
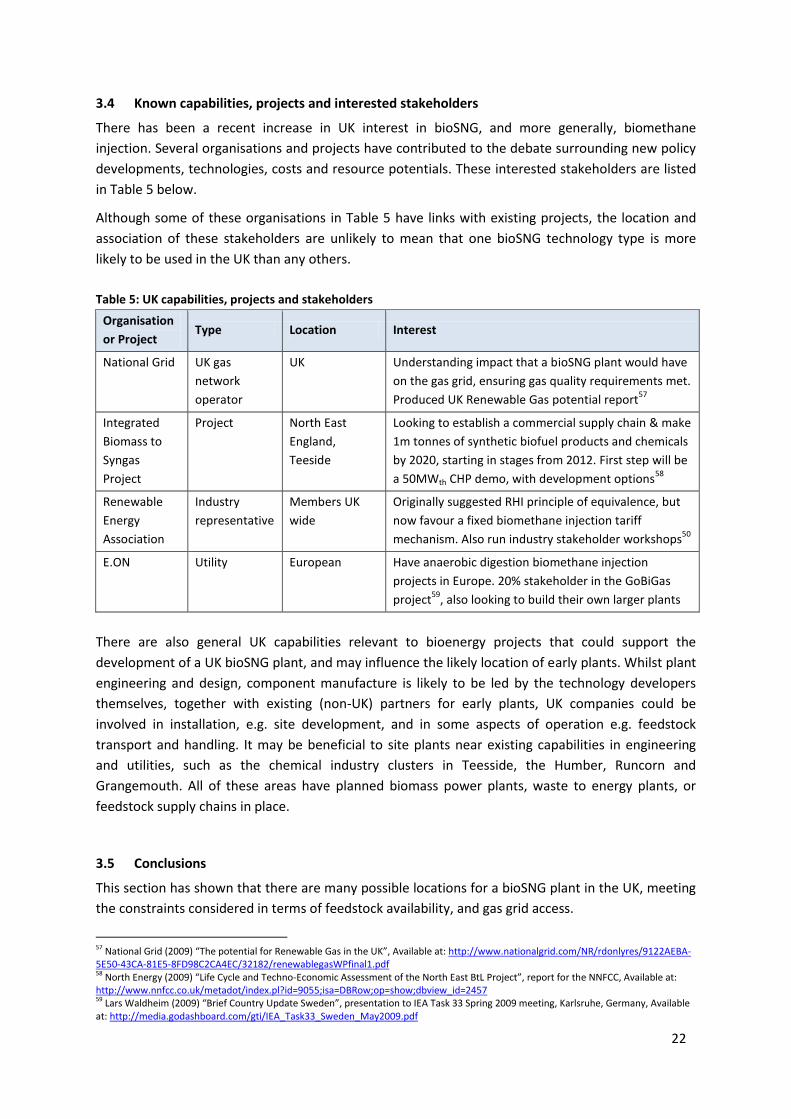
3.4 Known capabilities, projects and interested stakeholders
There has been a recent increase in UK interest in bioSNG, and more generally, biomethane
injection. Several organisations and projects have contributed to the debate surrounding new policy
developments, technologies, costs and resource potentials. These interested stakeholders are listed
in Table 5 below.
Although some of these organisations in Table 5 have links with existing projects, the location and
association of these stakeholders are unlikely to mean that one bioSNG technology type is more
likely to be used in the UK than any others.
Table 5: UK capabilities, projects and stakeholders
Organisation
or Project Type Location Interest
National Grid UK gas
network
operator
UK Understanding impact that a bioSNG plant would have
on the gas grid, ensuring gas quality requirements met.
Produced UK Renewable Gas potential report57
Integrated
Biomass to
Syngas
Project
Project North East
England,
Teeside
Looking to establish a commercial supply chain & make
1m tonnes of synthetic biofuel products and chemicals
by 2020, starting in stages from 2012. First step will be
a 50MWth CHP demo, with development options58
Renewable
Energy
Association
Industry
representative
Members UK
wide
Originally suggested RHI principle of equivalence, but
now favour a fixed biomethane injection tariff
mechanism. Also run industry stakeholder workshops50
E.ON Utility European Have anaerobic digestion biomethane injection
projects in Europe. 20% stakeholder in the GoBiGas
project59
, also looking to build their own larger plants
There are also general UK capabilities relevant to bioenergy projects that could support the
development of a UK bioSNG plant, and may influence the likely location of early plants. Whilst plant
engineering and design, component manufacture is likely to be led by the technology developers
themselves, together with existing (non-UK) partners for early plants, UK companies could be
involved in installation, e.g. site development, and in some aspects of operation e.g. feedstock
transport and handling. It may be beneficial to site plants near existing capabilities in engineering
and utilities, such as the chemical industry clusters in Teesside, the Humber, Runcorn and
Grangemouth. All of these areas have planned biomass power plants, waste to energy plants, or
feedstock supply chains in place.
3.5 Conclusions
This section has shown that there are many possible locations for a bioSNG plant in the UK, meeting
the constraints considered in terms of feedstock availability, and gas grid access.
57 National Grid (2009) “The potential for Renewable Gas in the UK”, Available at: http://www.nationalgrid.com/NR/rdonlyres/9122AEBA-5E50-43CA-81E5-8FD98C2CA4EC/32182/renewablegasWPfinal1.pdf 58 North Energy (2009) “Life Cycle and Techno-Economic Assessment of the North East BtL Project”, report for the NNFCC, Available at: http://www.nnfcc.co.uk/metadot/index.pl?id=9055;isa=DBRow;op=show;dbview_id=2457 59 Lars Waldheim (2009) “Brief Country Update Sweden”, presentation to IEA Task 33 Spring 2009 meeting, Karlsruhe, Germany, Available at: http://media.godashboard.com/gti/IEA_Task33_Sweden_May2009.pdf

23
A bioSNG plant built in the UK by 2020 is highly likely to only be using clean woody feedstocks. There
are several regions with good availability, discussed in Section 3.1. However, there will also be
competition for resources from non-energy and bioenergy users, hence a UK bioSNG plant that only
uses local feedstocks is more likely to be at the low end of the commercial scale plants planned by
developers (in the range 20-30 MWbioSNG). A bioSNG plant that uses imported feedstocks as well as
available local resources is likely to be sited at a major UK port. Due to the availability of imports,
these plants could be at the high end of the commercial-scale plants currently being considered by
developers (~100 MWbioSNG).
Since both the technology developers are planning their commercial-scale bioSNG plants to be at
least 20 MWbioSNG, then the UK gas network also places constraints on the location of a plant of this
scale. Due to the large gas volumes, this plant would have to either connect to the Intermediate
Pressure distribution network (2-7 bar), High Pressure Distribution Network (>7bar) or very high
pressure Transmission Network. A UK bioSNG plant will therefore have to be located in an area of
high population density, or very close to a NTS pipeline.
Due to the plant optimisation for maximum bioSNG output, the output of heat and electricity co-
products are small, and hence the availability of a local heat demand or power export potential are
not crucial factors. Similarly, the capabilities and interests of different UK stakeholders do not favour
one technology design, or place constraints on plant location or size. However, there are locations
with existing UK engineering capabilities and utilities, such as chemical industry clusters.
A good location for a bioSNG plant would be in a region where there is a high density of several
different feedstocks or a major UK port, in an area of high population density or next to the NTS, and
with local industrial capabilities. Examining each of the regions discussed above in turn:
The South of England. There is a diversity of feedstocks, and adequate gas grid coverage in
low and high pressure networks
Yorkshire and the Humber, and the East Midlands – has reasonable NTS coverage and areas
of high population density, plus relevant industrial infrastructure in the Humber region
the area South of Scotland’s central belt. The population density is low, hence a plant would
have to be located on the NTS pipelines running through the middle of the region
South Wales. The gas grid is strong, with high population density, and NTS pipelines present,
hence connecting to the gas network should be straightforward.
The ports of Aberdeen, Teesport, Hull & Immingham, Goole and Tilbury are on the NTS,
hence connecting to the gas network should be straightforward. The ports of Tyne and
Southampton are in areas of high population density, so the gas network should not be a
particular constraint

24
4 Policy review
This section briefly reviews the policies that would affect the production and use of bioSNG in the
UK, in terms of support and requirements for production plants, market mechanisms to support use
of bioSNG and co-products, access to the natural gas network, and policies affecting feedstocks.
The Renewable Energy Directive (RED) commits the EU to a 20% target for energy from renewable
sources by 2020. Within the RED, the UK has a target of 15% of its total energy to come from
renewable sources. Under the Climate Change Act, the UK also has a legal requirement to reduce
carbon emissions by at least 26% by 2020. The Renewable Energy Strategy (RES) and 2008 Energy Bill
consider that in order to meet these objectives, around 12% of the UK’s heating demand (currently
907 TWh/yr) may need to come from renewable sources. Bioenergy is expected to play a prominent
role, meeting around half of this heat sector target60.
As there is no current bioSNG production in the UK, policies directly relating to it are at an early
stage of development. As a result, we have also considered how policies for similar technologies
might apply to bioSNG.
4.1 Policy support for the production of bioSNG
4.1.1 Renewable Heat Incentive (RHI)
This proposed policy will provide financial assistance to generators of renewable forms of heat, such
as biomass fuelled boilers, air- and ground-source heat pumps, solar-thermal water heaters and
combined heat & power plants that use renewable fuels. The RHI will operate in a similar manner to
a feed-in-tariff, subsidising each unit of heat generated, to be funded by a levy on suppliers of fossil
fuel for heat (e.g. gas, coal, heating oil and LNG suppliers)61. All scales of renewable heat generation
across Great Britain will be eligible, with payments banded according to size and/or technology62.
The RHI will also contain specific legislation for the injection of renewable biomethane into the gas
grid, thereby incentivising both bioSNG and upgraded biogas injection61. The level of support given
to biomethane injection will be calculated on the basis of parity with the RO or Feed-in Tariffs
(depending on scale), rather than on the basis of a rate-of-return approach used for other
technologies63. This is in response to various stakeholder concerns that RO incentives lead to
electricity generation from biogas, with no use of the heat generated, rather than grid injection or
use in transport64,65. Note that the parity calculation covers production costs and revenues only, and
does not factor in different risks or carbon savings.
The details of the RHI have not yet been finalised. DECC published its proposals on the RHI on 1st
February 2010, with a consultation now open until 26th April 2010. Details of the RHI should be
finalised in mid-2010, before being passed into legislation so that the RHI can come into effect by 1st
60 Envirolink North West (25th January 2010) “BECGS Workshop”, presentation 61 DECC (2009) “Renewable Heat Incentive”, Available at: www.decc.gov.uk/en/content/cms/what_we_do/uk_supply/energy_mix/renewable/policy/renewable_heat/incentive/incentive.aspx 62 Renewable Heat Incentive Limited (2009), Available online: http://www.rhincentive.co.uk/Technologies.html 63 DECC (2009) “Consultation on the Renewable Heat Incentive”, Available at: http://www.decc.gov.uk/en/content/cms/consultations/rhi/rhi.aspx 64 Ofgem (2009) Renewable Energy Strategy response, Available at: http://www.ofgem.gov.uk/SUSTAINABILITY/ENVIRONMENT/POLICY/Documents1/Renewable%20Energy%20Strategy%20response.pdf 65 Freeman (2009) “Developing UK biogas” Available at: http://www.worldenergy.org/documents/bea_powerpoints__both_speakers.pdf

25
April 2011. Importantly, DECC have committed that the RHI will remain open to new projects until at
least 2020.
Proposed mechanism for incentivising biomethane injection
DECC are proposing that the RHI tariffs be paid as fixed tariffs, linked to inflation, but do not propose
to regulate the price that generators receive for sales of heat or biomethane. Therefore, an injector
will sell the biomethane to a gas supplier66 at the market export price (the current wholesale gas
price is 2p/kWh), and then, in addition, claim the proposed 4p/kWh tariff, to be paid quarterly by
Ofgem direct to the plant owner. The gas injection will be metered, with the total annual support
calculated from the actual energy injected into the network, multiplied by the tariff level. Ofgem will
also be responsible for auditing and enforcement.
Biomethane definition
Biomethane is defined in the Energy Act 2008, Section 100 (3) as “biogas which is suitable for
conveyance through pipes to premises in accordance with a licence under section 7 of the Gas Act
1986”. However, biogas is then defined as “gas produced by the anaerobic conversion of organic
matter” – excluding bioSNG from being supported under UK policy67.
DECC are aware of this issue, and intend to amend the definitions in the Energy Act to enable RHI
support for gasification63. DECC have stated that they propose to define the technologies eligible for
each RHI tariff widely, to avoid unintentionally excluding options. This will allow “emerging
technologies that meet the eligibility criteria to benefit from the relevant mainstream tariff, even
where they may not get a dedicated tariff. For example, syngas would be eligible for the biogas
tariff”.
Separate tariffs for upgraded biogas and bioSNG
The REA recommended that there should be two RHI bands for biomethane injection, one for
upgraded biogas, and one for bioSNG68. It was recommended that within these two bands, the tariff
should be set at a level that stimulates the building of new plants for biomethane injection.
However, DECC have only currently proposed one tariff for biomethane injection, based on biogas
economics – bioSNG has not been explicitly considered within the current RHI consultation. This may
change during 2010, with a separate bioSNG injection tariff proposed. Alternatively, given that it will
be several years before a bioSNG plant is built in the UK, DECC may choose to let bioSNG fall within
the biomethane injection tariff. At this time, which option will be chosen is not yet clear.
4.2 Policy support for the use of bioSNG
Biomethane producers can only currently gain financial support by using the biomethane for
generating electricity onsite, or as an unblended vehicle fuel. If the gas network is used to convey
the equivalent amount of gas to a remote generator, it would not qualify for ROCs. Similarly, under
the Renewable Transport Fuel Obligation, vehicles have to be filled with unblended biogas to qualify
66 The biomethane has to be sold to and owned by a gas supply company. This is because, as with electricity, and due to the licensing structure in the UK, the operator of the gas distribution network cannot purchase or sell gas, only transport it. 67 OPSI (2010) “Energy Act 2008”, Available at: http://www.opsi.gov.uk/acts/acts2008/ukpga_20080032_en_11 68 REA (2009) “Renewable electricity tariffs (‘Feed-in tariffs for small scale generation of electricity’), Renewable heat tariffs (‘Renewable
heat incentive’): Preliminary recommendations on their implementation from the renewable energy industry” Available at: http://www.r-
e-a.net/policy/REA-policy/RET/common/Blueprint
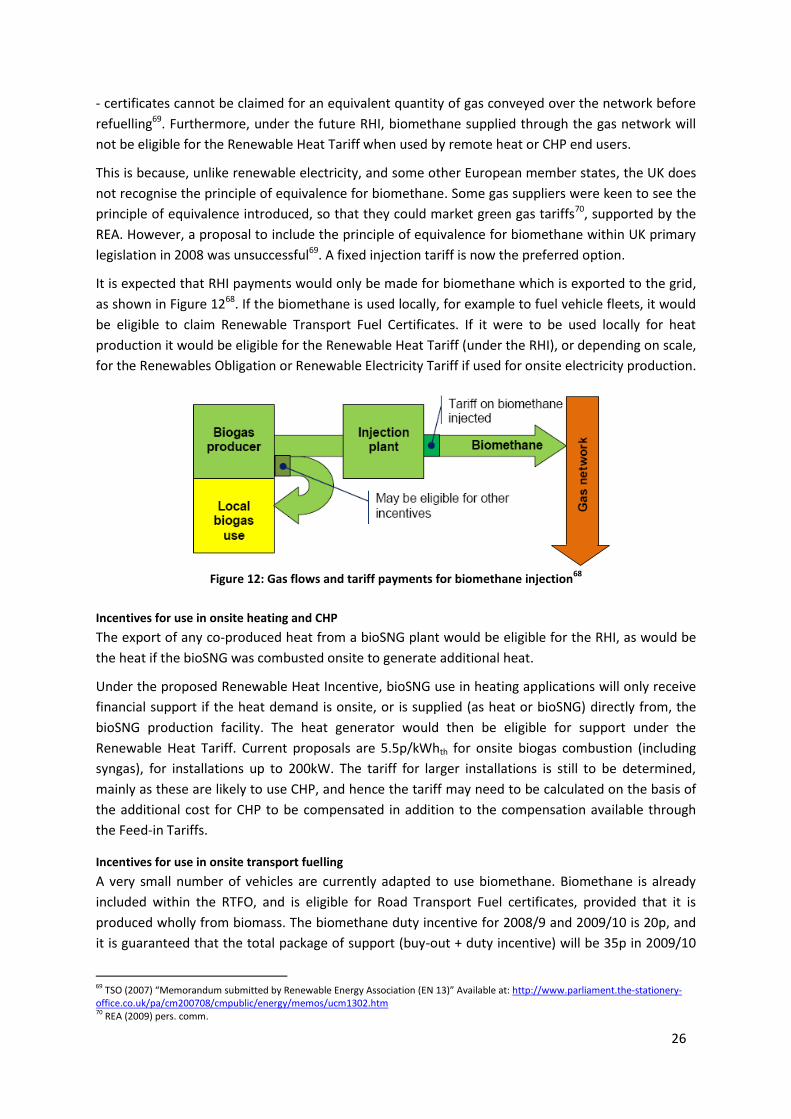
26
- certificates cannot be claimed for an equivalent quantity of gas conveyed over the network before
refuelling69. Furthermore, under the future RHI, biomethane supplied through the gas network will
not be eligible for the Renewable Heat Tariff when used by remote heat or CHP end users.
This is because, unlike renewable electricity, and some other European member states, the UK does
not recognise the principle of equivalence for biomethane. Some gas suppliers were keen to see the
principle of equivalence introduced, so that they could market green gas tariffs70, supported by the
REA. However, a proposal to include the principle of equivalence for biomethane within UK primary
legislation in 2008 was unsuccessful69. A fixed injection tariff is now the preferred option.
It is expected that RHI payments would only be made for biomethane which is exported to the grid,
as shown in Figure 1268. If the biomethane is used locally, for example to fuel vehicle fleets, it would
be eligible to claim Renewable Transport Fuel Certificates. If it were to be used locally for heat
production it would be eligible for the Renewable Heat Tariff (under the RHI), or depending on scale,
for the Renewables Obligation or Renewable Electricity Tariff if used for onsite electricity production.
Figure 12: Gas flows and tariff payments for biomethane injection
68
Incentives for use in onsite heating and CHP
The export of any co-produced heat from a bioSNG plant would be eligible for the RHI, as would be
the heat if the bioSNG was combusted onsite to generate additional heat.
Under the proposed Renewable Heat Incentive, bioSNG use in heating applications will only receive
financial support if the heat demand is onsite, or is supplied (as heat or bioSNG) directly from, the
bioSNG production facility. The heat generator would then be eligible for support under the
Renewable Heat Tariff. Current proposals are 5.5p/kWhth for onsite biogas combustion (including
syngas), for installations up to 200kW. The tariff for larger installations is still to be determined,
mainly as these are likely to use CHP, and hence the tariff may need to be calculated on the basis of
the additional cost for CHP to be compensated in addition to the compensation available through
the Feed-in Tariffs.
Incentives for use in onsite transport fuelling
A very small number of vehicles are currently adapted to use biomethane. Biomethane is already
included within the RTFO, and is eligible for Road Transport Fuel certificates, provided that it is
produced wholly from biomass. The biomethane duty incentive for 2008/9 and 2009/10 is 20p, and
it is guaranteed that the total package of support (buy-out + duty incentive) will be 35p in 2009/10
69 TSO (2007) “Memorandum submitted by Renewable Energy Association (EN 13)” Available at: http://www.parliament.the-stationery-office.co.uk/pa/cm200708/cmpublic/energy/memos/ucm1302.htm 70 REA (2009) pers. comm.

27
and 30p in 2010/1171. Although biomethane derived wholly from biomass is already included in the
RTFO, and hence bioSNG would be able to receive RTF certificates72, currently the RTFO is not a
strong driver for UK biomethane due to reduced targets and the current oversupply of certificates.
Under the EU Renewable Energy Directive, any future changes are likely to favour those biofuels
with lower carbon intensities, and higher sustainability. Due to its environmental benefits,
biomethane is therefore likely to be well placed compared to many other biofuels.
Incentives for use in onsite power generation
The export of any co-produced electricity from a bioSNG plant would be eligible for ROCs, as would
be the electricity if the bioSNG was combusted onsite to generate power.
The banding changes to the RO have introduced definitions for “standard gasification” and
“advanced gasification”, depending on the syngas calorific value73. The dual gasifiers used by bioSNG
developers would qualify as advanced gasification, as the syngas energy content is well above the
legislative threshold74. Advanced gasification power technologies will receive 2 ROCs/MWh, whereas
standard gasification would only receive 1 ROC/MWh75.
This only applies to the renewable proportion of the feedstock – similarly if syngas is co-fired with
natural gas to generate power, only the biomass fraction will be eligible. Different biomass
feedstocks have no direct impact on the gasification band.
4.3 Policy support for construction of bioenergy plants
We considered several schemes and organisations that may be able to provide support for the
construction of a UK bioSNG plant: the Bio-energy Capital Grants Scheme, the Energy Technologies
Institute, Enhanced Capital Allowances, the European Biofuels Technology Platform, European
Investment Bank, UK grants and regional funding. Of these, few specifically mention bioSNG, and
even fewer might provide an opportunity for bioSNG support. These are:
Enhanced Capital Allowances (ECAs) - Gasification or bioSNG production technologies are not
included within the ECA’s listed or non-listed products, hence do not quality for an ECA.
However, products that do not qualify for an ECA may have one or more components that do,
e.g. pumps, controls, motors, compressors76.
The European Commission’s ‘Investing in the development of low-carbon energy technologies’
Strategic Energy Technology (SET)-plan mentions bioSNG as a technology where pilot and first
commercial plants should be supported77. In addition to this bioSNG is specifically mentioned as
one of 7 innovative bioenergy value chains to be supported under the European Industrial
71 Anaerobic digestion (2009) Available at: http://www.biogas-info.co.uk/index.php/incentives-qa VAT is also applicable at 5% 72 RFA (2009) “Launch of consultation on the RTFO C&S Technical Guidance” Available at: http://www.renewablefuelsagency.org.uk/search.cfm?cit_id=282&widCall1=customWidgets.content_view_1&search_string=biomethane&usecache=false 73 OPSI (2009) “Renewables Obligation Order”, Available at: http://www.opsi.gov.uk/si/si2009/draft/ukdsi_9780111473955_en_1 74 From the ROO: “Advanced gasification” means electricity generated from a gaseous fuel which is produced from waste or biomass by means of gasification, and has a gross calorific value when measured at 25°C and 0.1 MPa at the inlet to the generating station of at least 4 MJ/m3. ECN’s pilot plant produces syngas at 13.1 MJ/Nm3 on a wet basis. C.M. van der Meijden, H.J. Veringa, A. van der Drift & B.J. Vreugdenhil (2008) “The 800 kWth Allothermal Biomass Gasifier MILENA” ECN, Available at: http://www.milenatechnology.com/fileadmin/milenatechnology/user/documents/reports/Milena_Valencia_2008_Paper.pdf 75 New Energy Focus (2009) Renewables Obligation, Available at: http://www.newenergyfocus.com/go/legislation/renewables_obligation.html 76 ECA Claim values (2009), Available at: http://www.eca.gov.uk/etl/claim/claimvalues.htm 77 EC (2009) “A Technology Roadmap: on Investing in the Development of Low Carbon Technologies (SET-Plan)“, Available at: http://ec.europa.eu/energy/technology/set_plan/doc/2009_comm_investing_development_low_carbon_technologies_roadmap.pdf

28
Bioenergy Initiative (EIBI)78. This intends to accelerate the commercial deployment of advanced
technologies which are not yet commercially available79, to boost the contribution of sustainable
bioenergy to the EU 2020 targets. It has a €6-8bn budget over 10 years, in order to select and
fund 15 to 20 demonstration and/or reference commercial plants.
European Investment Bank (EIB) - loans are given on a project-by-project basis. Previous
assistance has been given to combined heat & power, biomass and biogas projects.
UK capital expenditure grants - Discretionary grants, typically covering 10-20% of a project’s
total capital expenditure, are available to both manufacturing and service sector industries
situated in those areas of the UK now designated as Tier 1, Tier 2 and Tier 3 by the European
Commission on 27th July 200080. These are Regional Selective Assistance (RSA) in Wales or
Scotland, and Grant for Business Investment (GBI) in England. There has been support in recent
years for bioenergy projects via RSA and GBI. The Scottish Executive has provided £8.1m and
£10m for biomass CHP plants in Markinch and Irvine, and £9m towards the construction of a
500,000 tonne biodiesel plant at Grangemouth81.
Other regional and local funding - The RDAs can also offer a variety of financial support
packages, including equity, loans, grants, tax relief and loan guarantee schemes, as well as
targeting inward investment82. For example, One North East have recently contributed £2.2m
towards a plant feasibility study by Ineos Bio, for converting local wastes in the Tees Valley into
liquid biofuels and electricity83. At a sub-regional level, local authorities can provide grants, site
preparation, business planning assistance and preferential business rates to investors.
4.4 Planning policy
Planning Policy Statement 22 (PPS22): Renewable Energy sets out the Government's policies for
renewable energy, which planning authorities should have regard to when preparing local
development documents and when taking planning decisions84. London, the South East and East
Midlands are specifically considering gasification of wastes for power generation in their RSS targets,
but with no mention of bioSNG production or injection as of yet85.
The work of Office of Renewable Energy Deployment (ORED) includes overcoming the non-financial
barriers to the deployment of wind and other technologies in the UK, including supporting reforms
to ensure an effective planning system is in place at a local and regional level. Although gasification
does not generally suffer from the same image as waste incineration, local opposition in some
locations could be strong, leading to planning delays or even project cancellations.
78 EBTP (2009), EIBI Executive Summary, Available at: http://www.biofuelstp.eu/eibi.html 79 EIBI proposal states that its scope would be “Innovative bioenergy value chains which are not yet commercially available (thus excluding current biofuels, heat & power, biogas …) and could be deployed at large scale (large single units or a larger number of smaller units)” 80 GRA (2009) The assisted area of the UK, Available at: http://www.gra-ukgrants.com/Areasmapceilings_red2.html 81 Scottish Executive (2007) “Regional Selective Assistance Scotland Annual Summary 2006/07” Available at: http://www.scottishbusinessgrants.gov.uk/rsa/files/Annual%20Summary%20200607.pdf 82 Communities and Local Government (2009) “Regional Development Agencies”, Available at: http://www.communities.gov.uk/citiesandregions/regional/regionaldevelopmentagencies/ 83 One North East (2009) “Feasibility study announced for advanced bio-ethanol plant in the Tees Valley”, Available at: http://www.onenortheast.co.uk/page/news/article.cfm?articleId=4104 84 Communities and Local Government (2009) PPS22, Available at: www.communities.gov.uk/planningandbuilding/planning/planningpolicyguidance/planningpolicystatements/planningpolicystatements/pps22 85 Communities and Local Government (2009), Renewable Energy Capacity in Regional Spatial Strategies, Available at: http://www.communities.gov.uk/documents/planningandbuilding/pdf/renewableenergyreport.pdf

29
4.5 Feedstock support
There are several policies that support woody biomass supply in the UK. These include establishment
grants for energy crop production86, and biomass infrastructure schemes87. The landfill tax also acts
as a strong mechanism for diverting waste clean wood from landfill88. For a summary of policies
relating to waste feedstocks, please refer to Annex C.
4.6 Access to the natural gas networks
There are likely to be few policy barriers to access to the natural gas network for bioSNG producers
in the future. In order to explain the current UK gas regulatory regime to new producers, the
Government, in partnership with Ofgem, the gas grid companies and trade associations, has
published a biomethane guidance document89.
Gas Transporter licensing
Companies injecting gas into the pipeline of a licensed Gas Transporter (GT), require a GT licence or
an exemption from the requirement to hold one. Therefore, since a bioSNG plant will be injecting
into the network of an existing licensed GT, under the present licensing regime, the connecting
pipework also has to be owned and operated by a licensed GT. Therefore, and unless the
biomethane injector becomes a licensed Independent GT for this purpose, until any exemption is
made the injector would need to agree with an existing licensed GT for it to adopt the connection
pipework. This is not necessarily a barrier to injection, although it is an added cost in terms of
project planning administration and time, or negotiations with the downstream GT.
By April 2011, the Government intends to provide an exemption from the requirement for a GT
licence for biomethane plant and associated pipe-line, subject to consultation. Also, the EU “3rd
Package” (Directive 2009/73/EC) will require the legal separation of gas production from gas
transportation; when implemented, this may prevent a biomethane producer from holding a GT
licence, thus automatically providing an exemption.
Therefore, by the time a bioSNG plant is built in the UK, it is likely that biomethane producers will
not need to hold a GT license. However, a Network Entry Agreement will still need to be signed with
the downstream Gas Transporter (National Grid or a DNO), detailing the gas quality requirements
and other conditions for biomethane to flow into their network.
Gas quality
In parallel, the Health and Safety Executive, in partnership with DECC, will consider whether
statutory requirements for the quality of gas in the grid might be adjusted, in order to help
biomethane injection without compromising safety90. The main issue to be investigated is the
potential to relax the limits on oxygen concentrations; small anaerobic digestion plants face high
costs in order to meet the stringent levels of O2 removal currently required before injection, but
some industrial gas users need low O2 levels in order to protect valuable equipment, e.g. catalysts.
86 Natural England (2010) “Energy Crops Scheme”, Available at: www.naturalengland.org.uk/ourwork/farming/funding/ecs/default.aspx 87 Biomass Energy Centre (2010) “Bio-Energy Infrastructure Scheme”, Available at: http://www.biomassenergycentre.org.uk/portal/page?_pageid=77,20198&_dad=portal&_schema=PORTAL 88 HM Revenue & Customs (2010) “Landfill Tax”, Available at: http://customs.hmrc.gov.uk/channelsPortalWebApp/channelsPortalWebApp .portal?_nfpb=true&_pageLabel=pageExcise_ShowContent&id=HMCE_CL_001206&propertyType=document 89DECC (2009) “Biomethane into the Gas Network: A Guide for Producers” Available at: http://www.decc.gov.uk/en/content/cms/what_we_do/uk_supply/markets/gas_markets/nonconvention/nonconvention.aspx 90 HM Government (2009) “The UK Renewable Energy Strategy” Available at: http://www.decc.gov.uk/en/content/cms/what_we_do/uk_supply/energy_mix/renewable/res/res.aspx

30
5 Economics
5.1 BioSNG production economics
5.1.1 General assumptions
There are no commercial bioSNG plant designs currently in existence that can serve as a replicable
model for the economic analysis in this study. To date, the most advanced process design is that of
the 1 MWbioSNG demonstration plant in Güssing (Austria). This is the design that was used as the basis
for the Gazobois feasibility study91, on which we based the economic analysis in this study.
The plant has a 74% feedstock-to-bioSNG conversion efficiency, defined as the lower heating value
(LHV) ratio of the bioSNG output to the raw (wet) feedstock input92. The recovered process heat is
used for steam and electricity generation, feedstock drying, and potential export for local heating
needs. Power is generated from the recovered heat using a steam cycle turbine. The methanation
reaction takes place at 400°C and 30bar.
The key technical and operating parameters of this plant design are summarised in Table 6, along
with the key financial parameters used for the economic analysis. For ease of interpretation of the
results and consistency throughout the economic analysis, it is assumed that plant financing is based
solely on equity, with the plant’s full capital cost falling in Year 0. However, with the parameters
used here, the financing structure (share of debt vs. equity) has little impact on production costs.
Table 6: Key technical, operational and financial parameters for the economic analysis
Parameter Value
Raw feedstock to bioSNG LHV efficiency 74%
Annual operation (equivalent peak load hours) 7000 hours
Plant lifetime 20 years
Discount rate 10%
Inflation rate 2%
5.1.2 Plant capacity
Plant capacities of 30 and 100 MWbioSNG are considered in this economic analysis. These capacities
have been chosen as they are likely to be representative of typical UK situations, and because the
first plant built in the UK is not likely to be bigger than existing projects at the time (after 2015).
Furthermore, these plant sizes are consistent with the location discussions in Section 3.5.
A 30 MWbioSNG plant represents a good compromise between the availability of local
feedstock resources and the economic benefit from plant economies of scale. Calculations
have shown that the cost reductions due to economies of scale are significant at small plant
scales, particularly up to ~30MWbioSNG. A 30 MWbioSNG plant is also at a similar scale to the
first bioSNG plants that are planned in Switzerland (25 MWbioSNG Gazobois project) and
Sweden (20 MWbioSNG plant, GoBiGas Phase 1).
A 100 MWbioSNG plant was chosen, since the overall GoBiGas project (Phases I & II) will have a
total capacity of 100MWbioSNG, and ECN have mentioned 100MWth as the scale of their
91 E4tech (2007) “Gazobois – Wood-to-Methane conversion technology: Feasibility study for a first commercial plant in Eclépens”, report prepared for Gazobois SA 92 This 74% efficiency is higher than the product of the gasification efficiency (77%) and methanation efficiency (85%), because the gasification efficiency is defined based on the LHV of dried feedstock (at 10% moisture), not the LHV of the raw feedstock.

31
commercial plants. E.ON have plans for a bigger 200MWbioSNG plant in the future, but this is
dependent on the success of GoBiGas, and may not achieved before a plant is built in the
UK.
5.1.3 Feedstock supply
As mentioned in Section 3.1.3, larger bioSNG plants near at UK port could use import feedstocks to
supply the plant, although given the higher cost of these imports, they are likely to access local UK
feedstocks as well. Since a 30MWbioSNG plant is a suitable size for compromising between local
resource availability and economies of scale, it is assumed that accessing further local resources is
difficult. Therefore, throughout this analysis, larger plants have to meet their additional feedstock
requirements using imports, i.e. 30MWbioSNG is set as the limit for UK sourced feedstocks.
For a 30MWbioSNG plant using only local feedstocks, we chose a mix dominated by mid-range cost
residual resources (forestry residues and arboricultural arisings), complemented by a small share of
the SRC. Feedstock costs are based on current industry data93 as the best estimate of prices in 2020.
For the 100MWbioSNG plant, it is assumed that the same volume of UK feedstocks is available (enough
to produce 30MWbioSNG), but that the rest of the feedstock is supplied using imported, comparatively
expensive, woodchips. Table 7 shows the shares, volumes and costs of these feedstock choices.
Table 7: Feedstock supply in 2020 for the 30 and 100 MWbioSNG plants
Feedstock type Input share
Volume (wet tonnes/year) Moisture
content (%) Cost
(£/wet tonne) 30 MW 100 MW 30 MW 100 MW
Forestry residues (UK) 50% 15% 63,609 63,609 50% 25
Arboricultural arisings (UK) 30% 9% 49,899 49,899 50% 25
Short rotation coppice (UK) 20% 6% 17,597 17,597 25% 68
Wood chips (imported) 0% 70% 0 197,895 25% 90
Total 100% 100% 131,105 329,000
For the 30 MWbioSNG plant, the average feedstock cost is £58/odt (oven dried tonne), and for the 100
MWbioSNG plant, £100/odt.
5.1.4 Plant capital costs
Plant capital costs were taken from an industry source (2005), converted to UK (2010) prices, and
cross checked with other references. The capital costs were also increased to reflect steel and
project engineering cost increases since 2005, an increase of 30%94. These were then modified for
the UK, by using UK land costs and final grid connection charges. Note that the injection equipment
costs were not changed for the UK situation: there are UK-specific requirements for calorific value
metering95, but these are not significantly different from those in the source data.
93 Feedstock prices taken from data used to derive the Central prices (converted into wet tonnes) in Table 18 of E4tech (2010) “Biomass prices in the heat and electricity sectors in the UK”, input into the Renewable Heat Incentive consultation, available at: http://www.decc.gov.uk/en/content/cms/consultations/rhi/rhi.aspx 94 Whitman, Requardt & Associates (2008) “The Handy-Wittman Index of Public Utility Construction Costs”, Available at: http://www.scribd.com/doc/9501599/Handy-Whitman-Index-Electrical 95 REA (2009) “Biomethane injection – briefing sheet”

32
The capital costs for a 30 and a 100 MWbioSNG plant built in the UK in 2018 are estimated to be
£53.9m and £117.9m (in 2010 £), respectively, for a first-of-a-kind plant. This corresponds to specific
cost of £1.8 and £1.2 million per MWbioSNG of capacity, which shows that economies of scale have a
significant impact on the capital intensity. It is worth noting that the source used for our capital costs
considers the gasifier costs to be based on 2nd or 3rd of a kind, whereas the methanation costs are an
engineering estimate.
However, there will be a considerable percentage increase in installed capacity as a result of the first
few plants in Sweden and Switzerland, which should lead to a degree of learning. This capacity
increase, together with a learning rate of 10% for each doubling of capacity, results in a cost
reduction of 17.5% in the main components (gasifier, methanation reactor etc) by 2015.
These cost reductions were therefore considered to apply for a first plant in the UK, since this plant
would only be designed after 2015, to be operational by 2018. This learning would have the effect of
reducing plant capital costs to £46.0m and £100.4m, or specific costs of £1.5 and £1.0 million per
MWbioSNG, respectively.
The investment cost breakdown for a 30 MWbioSNG plant after this learning is detailed in Figure 13 –
the percentage split of the different components are similar for a 100 MWbioSNG plant. The plant
capex is primarily dominated by the gasifier and methanation reactor that, together, account for
about three quarters of the investment costs.
7%
4%
48%
26%
3%12%
Land
Drying and storage
Gasifier
Methanation reactor
Site engineering
Design and costs during construction
Figure 13: Investment cost breakdown for a 30 MWbioSNG plant
Capital cost comparison
As there are no commercial bioSNG projects, very little data exists in the public domain. The one
commercial data point available is the quoted €170m total investment cost for the GoBiGas
project96, equivalent to £148m. Running our economic analysis for a first-of-a-kind plant at the same
scale gives very similar costs, of £144m. Although these costs are both based on very similar
96 Nordic Energy Solutions (2009) “GoBiGas – Gothenburg Biomass Gasification Plant“, Available at: http://www.nordicenergysolutions.org/innovation/demonstration-pilot/bio-energy/gobigas-2013-gothenburg-biomass-gasification-plant

33
technologies, they may not be comparable, given the GoBiGas figure might include different project
costs (including district heating), and costs specific to Sweden (e.g. taxes, labour, land costs).
There are also academic sources available for comparison. ECN estimated in 2006 that a 100 MWth
plant, producing 68 MWbioSNG, would cost €85m97. Converting this to UK (2010) prices, with the
corresponding index increases in engineering project costs, gives a plant cost of £94m, again, similar
to our costs for a first-of-a-kind plant at this scale.
The EU RENEW project assessed the cost of various theoretical BTL systems, including some using a
REPOTEC dual gasifier. However, our model splits out the plant components in a different manner to
RENEW; hence a direct comparison of individual components was not possible. The combined
gasification and cleanup costs from our plant model and RENEW were roughly equivalent, although
RENEW uses belt drying resulting in more expensive biomass pre-treatment98. Further comparisons
with the announced capital costs for commercial BTL plants, for example CHOREN, are not possible,
as the gasifier technologies, pre-treatment and downstream processes required are significantly
different, and current bioSNG cost estimates are for much smaller scale plants.
5.1.5 Plant operating costs
Plant operating costs were taken from an industry source (2005), converted to UK (2010) prices, and
cross checked with other references. Labour costs were also increased using an industry index94.
The annual operating cost, excluding feedstock, for a 30 or 100 MWbioSNG plant is estimated to be
£2.5m and £4.7m respectively, which represents 5.5% and 4.7% of the capital cost. The staff costs
are considered to be independent of plant size, while plant consumables increase linearly, and other
cost elements such as insurance have scale factors included. We have modelled ash disposal as a
cost, although in some situations it may be possible to earn revenue if selling the ash as fertiliser.
The feedstock costs are much larger than the annual plant operating cost, and the average feedstock
cost increases with plant size. This is due to the fact that the availability of inexpensive local
feedstock is usually limited and hence it is assumed that biomass procurement for larger plants has
to rely on more expensive imported biomass99.
The breakdown of annual operating and feedstock costs for a 30MWbioSNG plant is given in Figure 14.
Feedstock costs comprise 61% of the total annual cost for a 30WMbioSNG plant, however, for a
100MWbioSNG plant which mainly uses imports, then feedstock costs are 82% of the total annual cost.
97 Zwart R.W.R. et al, “Production of Synthetic Natural Gas (SNG) from Biomass, Development and operation of an integrated bio-SNG system”, non-confidential version, ECN E-06-018, 2006, Available at: http://www.ecn.nl/docs/library/report/2006/e06018.pdf 98 Institute for Energy and Environment (2007) “WP5.4 Technical Assessment” for RENEW – Renewable Fuels for Advanced Powertrains, Deliverable D 5.3.7, Available at: http://www.renew-fuel.com/fs_documents.php 99 This increasing average feedstock cost is also a realistic assumption for plants only using local feedstocks, since the cost of extraction and transportation generally increases with volume, due to increasing distances.

34
9%
8%
17%
61%
3% 2%
Insurance
Maintenance
Staff
Feedstock
Consumables
Ash disposal
Figure 14: Breakdown of feedstock and operating costs for a 30MWbioSNG plant
5.1.6 Revenues
The plant produces bioSNG as its main product, as well as electricity and heat as marketable co-
products (see Section 2.4). These co-products will also generate additional revenue from the
Renewable Heat Incentive (as described in more detail in Section 4), or the Renewables Obligation.
The revenue assumptions are all based on forecast prices in 2020 (under a Central price scenario),
and linked to inflation further in the future:
Electricity is estimated to be sold to the grid at 2020 wholesale prices of 7.9p/kWhe100. Given
that the plant would be considered to be ‘advanced gasification’ under the Renewables
Obligation, then power exported would also qualify for 2 ROCs (1 ROC currently =
£46.25/MWhe101). The total power sale revenue is therefore 16.8p/kWhe.
Heat is estimated to be sold to a local demand at 4.5p/kWhth – the heat production cost of a
large natural gas boiler (using 2020 industrial retail gas prices). The RHI currently proposes a
subsidy of 4.5p/kWhth on top of this heat price for gasification and pyrolysis plants102. The total
heat sale revenue is therefore 9.0p/kWhth. However, due to the large amounts of heat
generated, it is only assumed that 30% of the potential heat can be exported for sale. Although
larger plants could struggle to find sufficient local demand for large amounts of heat, a plant
using imports is more likely to be sited in an industrial area at a port, and hence there could be
additional industrial process heat demands. Therefore, for simplicity, this 30% assumption is
maintained for all plant scales.
100 DECC (2008) “Real Energy Prices 2000-2022 data”, Available at: http://www.decc.gov.uk/en/content/cms/statistics/projections/projections.aspx 101 Current ROC auction price is £46.25/MWh, reference e-roc (19 Jan 2010), Available at: http://www.e-roc.co.uk/trackrecord.htm 102 DECC (2009) “Renewable Heat Incentive (RHI)”, Available at: www.decc.gov.uk/en/content/cms/what_we_do/uk_supply/energy_mix/renewable/policy/renewable_heat/incentive/incentive.aspx

35
Table 8: Central sale prices in 2020 and volumes for electricity and heat co-products
Revenue
source Support mechanism
Sale
price
(p/kWh)
UK
subsidy
(p/kWh)
Share of
product
sold (%)
Quantity exported
(GWh/yr)
Sales revenues
(£m/yr)
30MW 100MW 30MW 100MW
Electricity Renewable Obligation
Certificate (ROC) 7.88 2 x 4.625 100% 4.7 17.3 0.80 2.90
Heat Renewable Heat Incentive (RHI)
4.48 4.5* 30% 5.2 43.3 0.47 3.89
* the Renewable Heat Incentive currently only proposes this values – not yet set
5.1.7 BioSNG production cost
Under the above assumptions, the bioSNG production cost works out at 5.2p/kWhbioSNG for a
30MWbioSNG plant103. The breakdown of production costs is shown in Figure 15, and shows that the
plant capex and feedstock cost dominate compared to the other costs. The co-product sales of
power and heat do have an impact on the bioSNG production cost, reducing it by 12%.
For a 30MWbioSNG plant, the cost of the biomass feedstock only contributes 42% of the bioSNG
production cost. This is below the typical range of 50-90% seen for other bioenergy conversion
plants104. This indicates that bioSNG technology is complex, with high capex for small plants, and
that it is also fairly costly to operate small plants (in terms of staff and maintenance).
0.0
1.0
2.0
3.0
4.0
5.0
6.0
7.0
Capex Feedstock cost
Staff Insurance Maintenance Other costs Electricity sales
Heat sales Total
Cu
mu
lati
ve b
ioSN
G p
rod
uct
ion
co
st (p
/kW
h)
Figure 15: BioSNG production cost breakdown for a 30MWbioSNG plant
However, for a 100MWbioSNG plant, the bioSNG production cost works out at 4.8p/kWhbioSNG. The
breakdown of production costs is shown in Figure 16, and shows that the feedstock costs dominate
at 75% of the bioSNG production costs.
103 It should be emphasised that bioSNG sales revenues are not considered when calculating the bioSNG production cost in Section 0 – only the revenues on the export of the heat and electricity are considered. BioSNG sale prices are only used for the plant NPV and IRR calculations in Section 0 104 IEA Bioenergy (2009) “'Bioenergy - a sustainable and reliable energy source: A review of status and prospects”, Available at: http://www.ieabioenergy.com/LibItem.aspx?id=6479

36
0.0
1.0
2.0
3.0
4.0
5.0
6.0
7.0
Capex Feedstock cost
Staff Insurance Maintenance Other costs Electricity sales
Heat sales Total
Cu
mu
lati
ve b
ioSN
G p
rod
uct
ion
co
st (p
/kW
h)
Figure 16: BioSNG production cost breakdown for a 100MWbioSNG plant
The co-product sales of power and heat have a large impact on the bioSNG production cost,
reducing it by 19% in the 100MWbioSNG case, provided 30% of the heat can still be sold. In particular
for larger plants, this highlights the importance of electricity grid connection, and siting a plant
where there is a local demand for the waste heat, as well as accessing available subsidies.
However, although the plant capacity increases significantly from 30 to 100MWbioSNG, the bioSNG
production cost only decreases slightly, by 0.4p/kWhbioSNG. This is because the economies of scale
benefits gained in the specific capital and operating costs (excluding feedstock) are largely offset by
the increase in the average cost of feedstock by using more imports – as shown in Table 9.
Table 9: The contribution of specific costs and revenues to plant bioSNG production costs
Plant
capacity
(MWbioSNG)
Specific costs (p/kWhbioSNG) BioSNG
production cost
(p/kWhbioSNG) Capital Feedstock Operating excl. feedstock Revenues
30 2.34 2.19 1.38 - 0.69 5.23
100 1.53 3.57 0.77 - 1.11 4.76
The bioSNG production pressure in this model is 30bar. This means that the bioSNG can be injected
into every tier of the Distribution Network without the need for further compression. Further
compression would be necessary to reach NTS pressures of around 65bar. The additional
compression energy and costs to reach 65bar are small, having less than a 1% difference on the
overall bioSNG production cost105. We therefore have not included this in the economic modelling.
105 From the RENEW (2007) study component costs, this additional compressor would have to be rated at 66kWe, have a capex of approximately £220k, and use 461MWh/yr of electricity. This has little effect on the plant capex, and only slightly reduces the plant revenues, thereby adding 0.05p/kWh to the bioSNG production cost – i.e. a 1% difference.

37
5.1.8 NPV and IRR
BioSNG is estimated to be sold into the gas grid at 2020 wholesale prices of 2.29p/kWh. The RHI is
also currently proposing a biomethane injection tariff of 4p/kWh, which would give a total bioSNG
sale revenue of 6.29p/kWh. This is summarised in Table 10.
Table 10: Central sale prices in 2020 and volumes for bioSNG production
Revenue source
Support mechanism Sale price
(p/kWh)
UK subsidy (p/kWh)
Share of product sold (%)
Volume exported (GWh/yr)
Sales revenues (£m/yr)
30MW 100MW 30MW 100MW
BioSNG RHI (proposed) 2.29 4* 100% 210 700 13.2 44.0
* the Renewable Heat Incentive currently only proposes this values – not yet set
The corresponding plant Net Present Value (NPV) and Internal Rate of Return (IRR) are shown in
Table 11. This table shows that with the proposed RHI biomethane injection tariff, the smaller
30MWbioSNG plant using only UK feedstocks would offer a low rate of return, limiting the chances of
development of such a project from a purely economic point of view. However, the 100MWbioSNG
plant offers a higher return on investment, and could well be attractive to investors.
Table 11: bioSNG plant NPV and IRR
Plant capacity (MWbioSNG) NPV (£m) IRR (%)
30 38.8 9.3%
100 159.8 16.7%
5.1.9 Sensitivity analysis
The sensitivity of the bioSNG production cost to parameters, such as feedstock cost, capex, opex,
learning rates and co-product revenues was examined. The results are shown in Figure 17, centred
on the base-case bioSNG production cost of 5.2p/kWhbioSNG for a 30MWbioSNG plant.
1.08
1.40
0.83
0.41
0.30
4.25 4.50 4.75 5.00 5.25 5.50 5.75 6.00
Feedstock cost (low / high)
Capex (±30%)
Opex (±30%)
Co-product price (±30%)
Learning rate (7%, 13%)
bioSNG production cost (p/kWh) Figure 17: Sensitivity of the bioSNG production cost to various parameters

38
This shows that the bioSNG production cost depends strongly on the feedstock cost and capital
costs106, and varies least with the ranges of co-product prices and technology learning rates.
Compared with the base-case of £58/odt for the average feedstock cost, a range of £37/odt to
£66/odt was analysed, i.e. -35% and +17% respectively. This feedstock range is based on current
industry data107. Most plant operators expect biomass prices to continue to rise in future years.
Therefore, as a final sensitivity, we modelled the 30MWbioSNG plant using feedstock at £120/odt,
which gives a bioSNG production cost of 6.6p/kWhbioSNG, and an IRR of only 3.1%.
For the capital cost, a sensitivity of +30% was chosen to match the range of cost estimates discussed
above. The high capex scenario has a bioSNG production cost of 5.9p/kWhbioSNG, which is 13% higher
than the base-case, and the highest production cost of all the sensitivity scenarios.
We assumed in this study that large plants would need to use imported feedstocks above
30MWbioSNG. Figure 18 shows the impact of this on production costs, and the results that would be
obtained if local feedstocks were used for the whole plant supply. This shows that if import costs are
higher than local ones, as modelled here, the additional feedstock costs offset most of the
economies of scale from increased plant size. If sufficient volumes of local UK feedstocks were
available to supply plant of any size, then the bioSNG production cost for a 100 MWbioSNG plant would
be reduced by 20% to 3.8p/kWhbioSNG, and the IRR increased to 22.6%.
2.5
3.5
4.5
5.5
6.5
7.5
8.5
0 50 100 150 200 250
Bio
SNG
pro
du
ctio
n c
ost
(p/k
Wh
)
Plant capacity (MWbioSNG)
Local UK feedstocks only (economies of scale)
Limited local UK resource, remainder imports
Figure 18: BioSNG production cost as a function of plant size, for two feedstock supply strategies
106 In the Central feedstock scenario used throughout this economic analysis, the average feedstock cost for a 30MWbioSNG plant is £30.7/ wet tonne. In the high feedstock scenario, the average feedstock cost is £35/ wet tonne, and in the low scenario, £19.9/ wet tonne. 107 E4tech (2010) “Biomass prices in the Heat and Electricity sectors in the UK”, Available at: http://www.decc.gov.uk/en/content/cms/consultations/rhi/rhi.aspx

39
5.1.10 Conclusions
In summary, bioSNG production costs are estimated at 5.2 p/kWh for a 30MWbioSNG plant, and at 4.8
p/kWh for a 100MWbioSNG plant. This is significantly higher than DECC’s wholesale natural gas price
projections for 2020 of 1.2 – 3.3 p/kWh. A further comparison can be made with the current
production costs for upgraded biogas from AD, estimated at 3.8 – 5p/kWh108,109. As for most biomass
systems, bioSNG production costs are highly dependent on the feedstock price.
Large plants taking imports only have slightly lower production costs than small plants only taking
local UK feedstocks, as economies of scale are offset by an increased average feedstock cost.
However, the 100MWbioSNG plant modelled here offers a much more attractive IRR than the 30
MWbioSNG plant.
108 NERA / AEA (2009) “The UK Supply Curve for Renewable Heat” study for DECC, Available at: http://www.decc.gov.uk/en/content/cms/what_we_do/uk_supply/energy_mix/renewable/policy/renewable_heat/incentive/supply_curve/supply_curve.aspx 109 DECC (2010) “Impact Assessment of the Renewable Heat Incentive scheme for consultation in January 2010”, Annex 4 biogas assumptions, Available at: http://www.decc.gov.uk/en/content/cms/consultations/rhi/rhi.aspx

40
5.2 Economics of bioSNG use
5.2.1 Methodology
In order to be able to assess the economics of using bioSNG in the heating sector, three different
applications were chosen for analysis – domestic, commercial, and industrial. For each application, a
range of heating technologies was modelled:
Domestic: Natural gas boiler, wood pellet boiler, and a gas boiler using 100% bioSNG
Commercial: Natural gas boiler, wood pellet boiler, wood chip boiler and a gas boiler using 100%
bioSNG
Industrial: Natural gas boiler, wood chip boiler and a gas boiler using 100% bioSNG, as well as
natural gas CHP, wood chip CHP and a gas CHP using 100% bioSNG
Under current proposed policy, with bioSNG being diluted in the gas grid, customers will not see a
different price for bioSNG compared with natural gas. However, in order to assess the full costs of
using bioSNG from a UK or policy viewpoint, we have assumed that the full bioSNG price is seen by
each customer. Throughout, we have not included any revenues from UK policy incentives, such as
Renewable Heat Tariffs or ROCs.
5.2.2 Capital and operating costs
A wide range of reports and sources were used to derive the best available data for the specific
capital and operating costs of each technology. This data is given in Annex B. It was assumed
throughout this end-use economic analysis that bioSNG can be used interchangeably with natural
gas; hence the same gas boiler or CHP costs apply.
5.2.3 System sizing
The sizing of a biomass combustion system relative to that of the heating system’s peak load is a
crucial design decision. Seasonal variations and the speed of system response are also important
factors to be considered – the overriding objective is to minimize the total life-cycle cost of the heat
supply. There are two common approaches – base load and peak load sizing115:
Peak load sizing: Due to the low capital costs of natural gas boilers, they are often sized or over-
sized to the peak heat demand. These systems require no further heat sources or storage, and
provide a rapid response to changes in load. This approach can also be used for biomass boilers,
although higher capital costs lead to expensive heating if utilisation factors are low
Alternatively, the biomass boiler can be sized below the peak demand, and a secondary heating
system (e.g. electric) or a buffer vessel / thermal store used to supply the rest of the peak. The
smaller biomass system is cheaper, and with a higher utilisation factor - but these heat cost
savings need to be offset against the additional costs of the secondary system
For example, for a large domestic household, a natural gas boiler might be sized at 20kWth, with a
10% load factor over the year (as modelled above). A biomass pellet boiler could be sized at the
same kWth rating and utilisation factor, or could be sized at, say, 10kWth with a higher load factor.
For each application within this economic analysis, each technology was sized to meet the same
kWh/yr heating demand. For simplicity and comparability, they were also assumed to have the same

41
peak size and utilisation factor, as given in Table 12. Each technology has a lifetime of 15 years, and
an overall efficiency of between 80-85%.
Table 12: Technology size and utilisation for each application
Domestic Commercial Industrial
Peak output (kWth) 20 250 10,000
Load factor (%) 10% 30% 80%
Discount rate (%) 16% 12% 10%
Note that for industrial applications using CHP, the peak thermal capacity and utilisation are
assumed to be the same as for the heat-only systems, but the amount of electricity co-generated
varies according to the electrical efficiency of the CHP unit. This generated power is modelled as the
avoided costs of buying electricity from the grid.
5.2.4 Fuel prices
In order to assess the full costs of using bioSNG from a UK or policy viewpoint, we have assumed
that the full bioSNG price is seen by each customer. However, the bioSNG cost calculated above is
the cost at the point of injection, without delivery costs or margins. Since bioSNG will face the same
additional costs and charges as natural gas to reach a customer, the difference between wholesale
and delivered prices for natural gas for each sector has been added to the bioSNG production costs,
to convert them to delivered bioSNG prices. For example, the uplift from wholesale to industrial
prices is approximately 1.4p/kWh.
We used central prices for natural gas110, electricity110 and biomass111 as used by DECC. A summary
of all of these 2020 fuel prices is given in Annex B. The delivered fuel prices vary depending on the
scale of the application. In general, the industrial sector is able to access lower priced biomass, with
bulk deliveries of chips at £32-100/odt. Commercial customers pay more for chips, at £111-138/odt,
and can also use bulk pellets (at £182-276/odt). Domestic customers are assumed to use bagged
pellets (£213-317/odt).
5.2.5 Delivered cost of heat
Combining the annual operating and fuel costs (and any avoided power costs) with a levelised capital
cost (dependent on the discount rate), and dividing by the annual heat output, gives a technology’s
delivered cost of heat. These values are shown below in Table 13, and we proceed to discuss each
application in more detail in the following sections.
110 DECC (2008) “Real Energy Prices 2000-2022 data”, Available at: www.decc.gov.uk/en/content/cms/statistics/projections/projections.aspx 111 Industrial chip prices from data used to derive Table 18. Commercial chip prices from Table 16. Commercial and domestic pellet prices from Table 17. E4tech (2010) “Biomass prices in the Heat and Electricity sectors in the UK”, Available at: www.decc.gov.uk/en/content/cms/consultations/rhi/rhi.aspx

42
Table 13: Delivered cost of heat (p/kWhth)
Technology Domestic Commercial Industrial
Natural gas boiler 9.3 6.1 4.5
bioSNG boiler 12.8 9.6 7.9
Pellet boiler 18.7 7.3
Wood chip boiler 5.9 2.3
Natural gas CHP - 0.3
bioSNG CHP 6.7
Wood chip CHP 0.8
5.2.6 Domestic
The breakdown of the delivered cost of heat for domestic applications is shown in Figure 19,
alongside the equivalent breakdown of annual costs.
0.0
3.0
6.0
9.0
12.0
15.0
18.0
0.0
0.5
1.0
1.5
2.0
2.5
3.0
3.5
Wood pellets bioSNG Natural gas
De
live
red
co
st o
f he
at (p
/kW
h)
An
nu
al c
ost
s (£
k/yr
)
Annual fuel costs
Annual opex
Levelised capital costs
Figure 19: Delivered cost of heat and annual costs for domestic applications
For a domestic customer, using a natural gas boiler is the cheapest method of providing their annual
heating requirements. Using a wood pellet boiler is approximately twice as expensive, mainly due to
the high capital costs.
Electric heating gives a delivered cost of heat of 21.2p/kWhth, which is even higher than a pellet
boiler112. Three quarters of this cost is due to the 2020 domestic electricity price, and purely
renewable electricity would only be more expensive still, hence electric heating appears to be a less
economically attractive method of providing renewable heating to domestic customers.
112 Pöyry & Faber Maunsell (2009) “The potential and costs of district heating networks”, report to DECC, Available at: http://man270109a.decc.gov.uk/en/content/cms/what_we_do/uk_supply/energy_mix/distributed_en_heat/district_heat/district_heat.aspx

43
5.2.7 Commercial
The breakdown of the delivered cost of heat for commercial applications is shown in Figure 20,
alongside the equivalent breakdown of annual costs. BioSNG is the highest cost option in this sector,
as a result of high fuel costs. Biomass prices and boiler capex are lower relative to the natural gas
option than for domestic systems, making direct biomass use a much more viable option.
0.0
2.0
4.0
6.0
8.0
10.0
0
10
20
30
40
50
60
70
Wood pellets Wood chips bioSNG Natural gas
De
live
red
co
st o
f he
at (p
/kW
h)
An
nu
al c
ost
s (£
k/yr
)
Annual fuel costs
Annual opex
Levelised capital costs
Figure 20: Delivered cost of heat and annual costs for commercial applications
5.2.8 Industrial
The breakdown of the delivered cost of heat for industrial applications is shown in Figure 21,
alongside the equivalent breakdown of annual costs. At this large scale and high utilisation, fuel
costs and avoided electricity costs dominate. BioSNG is again the highest cost option in this sector,
as a result of high fuel costs. Biomass costs are significantly cheaper at this large scale, and woodchip
boilers provide the lowest heating cost of the industrial heat-only systems modelled.
Despite their high capital costs, CHP systems offer lower cost heat than heat-only systems for
industrial customers, due to the avoided costs of electricity purchase. Whilst all three CHP systems
have the same heat output, the gas CHP systems have a much higher electrical efficiency than a
woodchip CHP, and hence produce more power. In the case of the natural gas CHP, this leads to the
lowest delivered cost of heat.

44
-11.0
-5.5
0.0
5.5
11.0
16.5
22.0
-8.0
-4.0
0.0
4.0
8.0
12.0
16.0
Woodchip CHP BioSNG CHP Gas CHP Chip boiler BioSNG boiler Gas boiler De
live
red
co
st o
f he
at (p
/kW
h)
An
nu
al c
ost
s (£
m/y
r)Avoided annual power costs
Annual fuel costs
Annual opex
Levelised capital costs
Total costs
Figure 21: Delivered cost of heat and annual costs for industrial applications
5.2.9 Siting considerations
System components
Natural gas heating systems are typically of a simple design, consisting of an entry pipeline for
continuous gas delivery, gas boiler, exhaust system and other auxiliary equipment. Since bioSNG is
very similar to natural gas, it can be used in existing natural gas infrastructure and heating systems
with no changes required. However, direct use of biomass heating systems are designed differently –
the key elements of a biomass system are fuel delivery and reception, storage, reclaim and transfer,
a specialised boiler, exhaust system and flue stack and other ancillary equipment113.
Space issues
Almost all domestic biomass boilers use pellets and feed a traditional wet heating system to provide
space heating and hot water. Biomass heating compatibility in buildings with existing gas heating will
therefore be good, and unlike some other renewable heat technologies (e.g. ground source heat
pump), will not require an additional low-temperature heating system.
Automated systems are much more complex, and take up a larger area, and hence are often
uneconomic in individual houses due to high capital costs114. The use of these automated systems is
113 Carbon Trust (2009) “Biomass heating: a practical guide for potential users”, Available at: http://www.carbontrust.co.uk/Publications/pages/PublicationDetail.aspx?id=CTG012 114 NERA, Entec & Element Energy (2009) “Renewable Heat Technologies for Carbon Abatement: Characteristics and Potential”, report for Committee on Climate Change, Available at: http://hmccc.s3.amazonaws.com/docs/NERA%20Renewable%20Heat%20MACC%20report%20final%20revision.pdf
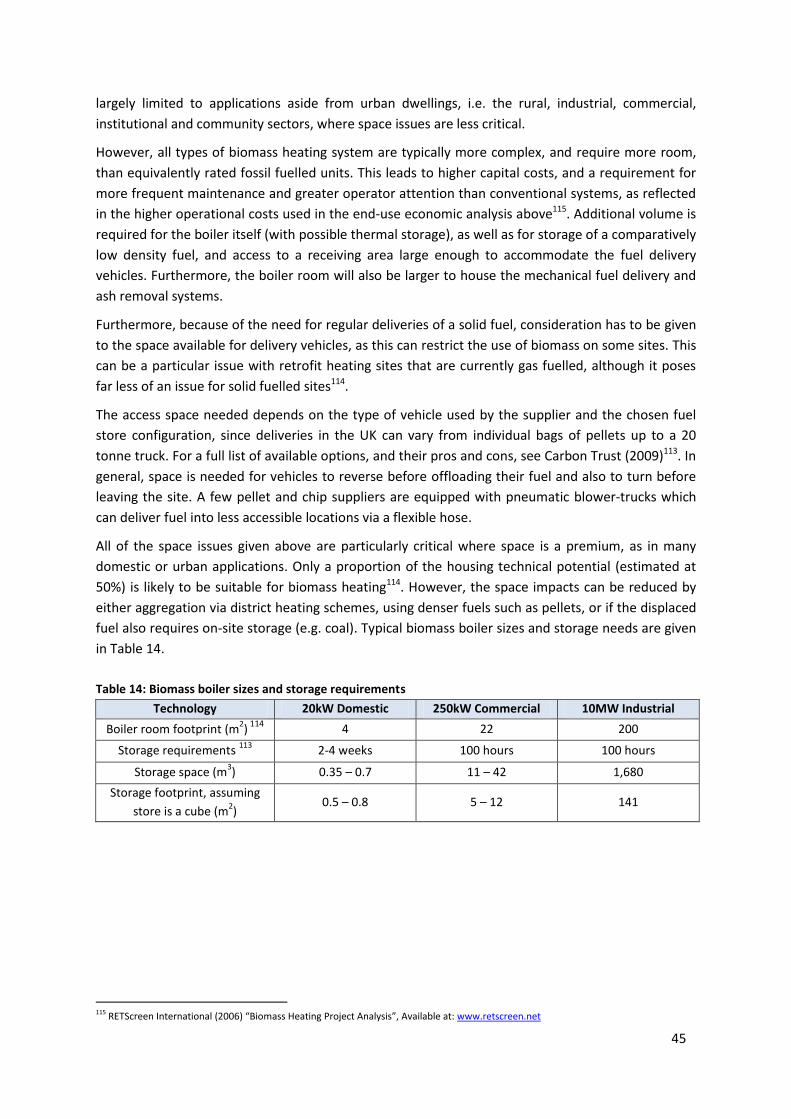
45
largely limited to applications aside from urban dwellings, i.e. the rural, industrial, commercial,
institutional and community sectors, where space issues are less critical.
However, all types of biomass heating system are typically more complex, and require more room,
than equivalently rated fossil fuelled units. This leads to higher capital costs, and a requirement for
more frequent maintenance and greater operator attention than conventional systems, as reflected
in the higher operational costs used in the end-use economic analysis above115. Additional volume is
required for the boiler itself (with possible thermal storage), as well as for storage of a comparatively
low density fuel, and access to a receiving area large enough to accommodate the fuel delivery
vehicles. Furthermore, the boiler room will also be larger to house the mechanical fuel delivery and
ash removal systems.
Furthermore, because of the need for regular deliveries of a solid fuel, consideration has to be given
to the space available for delivery vehicles, as this can restrict the use of biomass on some sites. This
can be a particular issue with retrofit heating sites that are currently gas fuelled, although it poses
far less of an issue for solid fuelled sites114.
The access space needed depends on the type of vehicle used by the supplier and the chosen fuel
store configuration, since deliveries in the UK can vary from individual bags of pellets up to a 20
tonne truck. For a full list of available options, and their pros and cons, see Carbon Trust (2009)113. In
general, space is needed for vehicles to reverse before offloading their fuel and also to turn before
leaving the site. A few pellet and chip suppliers are equipped with pneumatic blower-trucks which
can deliver fuel into less accessible locations via a flexible hose.
All of the space issues given above are particularly critical where space is a premium, as in many
domestic or urban applications. Only a proportion of the housing technical potential (estimated at
50%) is likely to be suitable for biomass heating114. However, the space impacts can be reduced by
either aggregation via district heating schemes, using denser fuels such as pellets, or if the displaced
fuel also requires on-site storage (e.g. coal). Typical biomass boiler sizes and storage needs are given
in Table 14.
Table 14: Biomass boiler sizes and storage requirements
Technology 20kW Domestic 250kW Commercial 10MW Industrial
Boiler room footprint (m2) 114
4 22 200
Storage requirements 113
2-4 weeks 100 hours 100 hours
Storage space (m3) 0.35 – 0.7 11 – 42 1,680
Storage footprint, assuming
store is a cube (m2)
0.5 – 0.8 5 – 12 141
115 RETScreen International (2006) “Biomass Heating Project Analysis”, Available at: www.retscreen.net

46
5.2.10 Conclusions
Under current proposed policy, customers will not see a different price for bioSNG compared with
natural gas. However, this analysis considers that the costs of supplying 100% bioSNG are passed
through to the consumer, with no subsidy, in order to assess its relative economic competitiveness
compared with alternative heating and CHP options.
From the government’s perspective, supporting bioSNG could be a cheaper option than supporting
direct biomass use in the domestic sector, given lower costs of delivered heat. Furthermore, bioSNG
heating has lower disruption for the user, and can be used directly within the existing infrastructure,
without any additional space, access or siting requirements – hence bioSNG appears to be a
favourable pathway to the decarbonisation of domestic UK heating, particularly since about 70% of
UK heating is provided by natural gas.
BioSNG heating and CHP in commercial and industrial applications is more expensive than the direct
use of biomass or natural gas, due to high bioSNG costs. Furthermore, there is generally more space
available for these commercial and industrial users to install direct biomass use systems, and access
is less of an issue, and hence woodchip heating and CHP appears a more cost effective
decarbonisation strategy than bioSNG. Note that supporting bioSNG injection as a result of its
benefits in the domestic sector would result in the bioSNG being used in a range of downstream
applications, including commercial and industrial heating.

47
6 Air quality impacts of the direct use of bioSNG and biomass
6.1 Introduction
Air quality impacts of heat production are an important consideration, given that the UK is currently
failing to meet legally binding EU air quality standards in many parts of the country, with public
health impacts. Although direct use of biomass in the heating sector currently has little effect, it is
expected to play a major role in meeting the UK’s Renewable Energy Strategy targets. Concerns have
been raised that expansion could both make the air quality targets harder to meet and have adverse
effects on human health116.
The UK National Air Monitoring network117 measures several air pollutants, such as NOx (primarily
NO2), SO2, CO, O3, particles (PM10 and PM2.5), benzene, 1,3-butadiene, lead and other heavy metals.
These pollutants have different sources and behave very differently once emitted into the
atmosphere. Under the UK’s Air Quality Strategy118, each pollutant has a mean concentration target
over a certain timeframe, and these targets can only be exceeded a limited number of times each
year. Many of these targets are falling over time, forcing tighter UK compliance and improving air
quality standards119.
6.2 Comparison of heat production routes
In common with other combustion plants, the combustion of biomass for energy can affect air
quality in a variety of ways. Table 15 compares the direct emissions from using biomass compared to
natural gas, heating oil and coal in small-scale heating systems (i.e. domestic and commercial
boilers). Since bioSNG is chemically very similar to natural gas (the same gas pipeline requirements
have to be met), the natural gas emission factors and air quality impacts presented here also apply
to bioSNG.
Table 15: Emissions factors for small-scale, direct use of fuels120,121,122,123,124
Pollutant Automatic-feed wood boiler
g/GJ
Best available biomass boiler
g/GJ
Natural gas / bioSNG
g/GJ
Heating oil g/GJ
Coal g/GJ
PM10 70 20 0.5 3 170
PM2.5 70 16 0.5 3 170
NOx 150 50 70 100 200
SO2 30 20 0.5 140 900
PAH 0.08 0.04 0 0.026 0.32
116 REA (2009) “REA response to the Mayor’s draft Air Quality Strategy for Consultation with the London Assembly and Functional Bodies” Available at: www.r-e-a.net/document-library/policy/consultation-responses/0911%20GLA%20air%20quality%20strategy%20response.pdf 117 Defra and Devolved Administrations (2008) “Air Pollution in the UK: 2008” A report by AEA, available at: http://www.airquality.co.uk/annualreport/air_pollution_uk_2008.pdf 118 Defra (2007) “Air Quality Strategy”, Available at: http://www.defra.gov.uk/environment/quality/air/airquality/strategy/index.htm 119 UK Air Quality Archive (2009) “What are the National Air Quality Objectives?” Available at: www.airquality.co.uk/laqm/information.php?info=objectives 120 AEA (2008) “Technical Guidance: Screening assessment for biomass boilers”, report for Defra and the Devolved Administrations, Available at: http://www.airquality.co.uk/reports/cat18/0806261519_methods.pdf 121 Chris Miles (2009) “Biomass heating & air quality: Development of Policy & Technology”, REA Bioenergy 2009, Available at: http://www.r-e-a.net/document-library/events/rea-events-2009/bioenergy/Chris%20Miles%20-%2009.10.pdf 122 Netcen (2003) “Emission factors programme Task 7 – Review of Residential & Small-Scale Commercial Combustion Sources”, report for Defra and the Devolved Administrations, Available at: www.airquality.co.uk/reports/cat08/0407081208_Task7_cumbustion_report_issue1.pdf 123 EPA (2004) “Natural Gas Combustion”, AP-42 Vol 1, Ch1.4, Available at: www.epa.gov/ttnchie1/ap42/ch01/final/c01s04.pdf 124 EMEP CORINAIR (2006) “Emission Inventory Guidebook“, Available at: www.eea.europa.eu/publications/EMEPCORINAIR4/B216v2.pdf

48
Of particular concern are emissions of particulate matter (PM10 and PM2.5) and nitrogen oxides (NOx)
in small capacity units, since these are likely to constitute the majority of units installed due to
support under the incoming RHI125. Many areas of London are already failing to meet the annual
mean limit value for PM10, and even larger areas of the UK as a whole are likely to fail to meet NO2
limit values coming into force during 2010126.
These emission levels depend on the technology used. Emission levels for particulates (PM),
polyaromatic hydrocarbons (PAHs) and carbon monoxide depend on the completeness of the
combustion process, and hence can be reduced through the use of high efficiency equipment.
Nitrogen oxides (NOx) are almost exclusively formed from nitrogen in the fuel, since biomass
combustion temperatures are too low to form NOx from atmospheric nitrogen. Nuisance issues can
also arise from the use of biomass, with the most common issues arising from smoke and odour127.
Emission of smoke in smoke control areas is generally prohibited, as is the emission of dark smoke
outside these areas. Odour is most likely to be associated with a combination of inadequate
combustion and poor plume dispersion, or from fuel storage.
6.3 Potential impacts and conclusions for bioSNG
Defra modelled the air quality impacts of four scenarios: either installing 38 or 50 TWh of medium or
high quality biomass heating in the UK by 2020. The predicted impact on ambient NOx
concentrations is expected to be small128. However, of greater concern to human health are the
changes in PM10 – heat sector PM10 emissions are predicted to increase by 9-72% depending on the
scenario, with PM10 concentrations increasing by 0.08-0.43μg/m3. This would result in 0.2-1.7million
life years lost in the UK; an annual social cost of about £140-730million. The medium quality 50 TWh
scenario was forecast to have the greatest impact on public health, with both the high quality
scenarios having the least impact128.
Emissions from biomass boilers can be managed to ensure potential air quality impacts are
controlled, by using product and fuel standards, emissions abatement equipment, regulatory
controls and/or planning controls to restrict where certain appliances can be installed127. Defra
stated that the widespread deployment of small-scale biomass heat installations should have a small
and manageable impact on air quality, provided that129:
all new plants are of high quality – corresponding to the best performing, lowest emission units
currently available on the market
the majority of biomass heat uptake replaces existing coal and oil-fired heating, and is located
off the gas grid or away from densely populated urban areas
125 DECC (2009) “Impact Assessment of proposals for a UK Renewable Energy Strategy - Renewable Heat”, URN 09D/685, Available at: http://www.decc.gov.uk/en/content/cms/what_we_do/uk_supply/energy_mix/renewable/res/res.aspx 126 Environmental Protection UK (2009) “The Mayor’s Draft Air Quality Strategy” response to Major Johnson, Available at: http://www.environmental-protection.org.uk/assets/library/documents/Mayors_Draft_AQS_EPUK_Response.pdf 127 Environmental Protection UK (2009) “Biomass and Air Quality Guidance for Local Authorities: England and Wales”, Available at: http://www.environmental-protection.org.uk/assets/library/documents/Biomass_and_Air_Quality_Guidance.pdf 128 Defra Atmospheric Quality and Industrial Pollution Programme (2009) “Renewable Energy Strategy: Potential Impact of Biomass Heat on Air Quality: Summary of Evidence Assembled”, Available at: www.endsreport.com/docs//20090629.doc 129 HM Government (2009) “The UK Renewable Energy Strategy”, Available at: http://www.decc.gov.uk/en/content/cms/what_we_do/uk_supply/energy_mix/renewable/res/res.aspx

49
in densely populated (high risk) urban areas, or where an Air Quality Management Area130 has
been declared, Defra would expect the deployment of biomass heat to be substantially lower,
with biomass units being larger and hence cleaner127.
The Government recognises the need to introduce emission performance standards as biomass
heating becomes more commonplace, bringing in standards for sub-20 MWth boilers currently not
covered by other legislation. The RHI consultation is considering only supporting those boilers that
meet proposed emissions limits, of 30g/GJ for PM and 150g/GJ for NOx, from its introduction in April
2011.
In terms of the implications for the use of bioSNG; if the direct use of biomass is constrained in
urban or Air Quality Management areas, then bioSNG could offer a low-emission and low-carbon131
fuel for heating, that fits with existing infrastructure. Supplying bioSNG to locations off the gas grid
would be much more difficult, plus there would be much fewer constraints on the direct use of
biomass in these areas. Therefore, from an air quality perspective, bioSNG is most likely to be piped
for use in urban areas, which would also have carbon benefits from decarbonising the gas grid.
130 If a local authority finds any places where the UK Air Quality Strategy objectives are not likely to be achieved, it must declare an Air Quality Management Area there, and create a Local Air Quality Action Plan. See http://www.airquality.co.uk/laqm/laqm.php for a map and further details 131 The lifecycle greenhouse gas emissions associated with the use of biomass versus bioSNG and natural gas are considered elsewhere - please see the ongoing project for NNFCC by North Energy (2010) “An Analysis Of The Greenhouse Gas Emissions For Thermo-chemical BioSNG Production And Utilisation In The UK”

50
7 Market opportunity
There could be an opportunity for bioSNG use in the UK in several markets, including use for heating,
as a road transport fuel, or in any other application in which natural gas is currently used.
Under the current policy proposals, bioSNG will not be accounted for once injected in to the grid,
with bioSNG instead being supported at the point of injection. This means that the market for
bioSNG injection in to the gas grid will not be driven by end user demand. Also, there is no policy
target for the level of bioSNG injection, or cap on the amount that could receive the Renewable Heat
Incentive (RHI). As a result, the level of production of bioSNG in the UK is likely to be driven solely by
the economic feasibility of individual projects. For these, the critical factors will be the level of the
RHI support, and the availability and security of feedstock supply. These factors and other barriers
are discussed in more detail in the following section.
Production of bioSNG without gas grid injection may not have a significant market in the UK under
current conditions:
For heat and power generation, direct use of biomass without methane production is likely to be
considerably cheaper than building bioSNG plants.
The use of compressed natural gas for vehicles is a relatively small market in the UK, of which a
small proportion is currently upgraded biogas. This biomethane is eligible under the Renewable
Transport Fuel Obligation, although this has not supported biogas production to date, as there
has not been a market for the tradable certificates generated (RTFCs)132. The future market for
bio-derived CNG in transport will depend on the economics of CNG vehicle conversion and
refuelling infrastructure, the future value of RTFCs, and production costs of the fuel. Since
bioSNG has higher production costs than upgraded biogas, a significant market for bioSNG in
transport in the UK is unlikely.
132 Renewable Fuels Agency (2010) “Year One of the RTFO”, Available at: http://www.renewablefuelsagency.gov.uk/reportsandpublications/yearoneofthertfo.cfm

51
8 Review of implementation needs: barriers and solutions
This report shows that bioSNG could be a viable technology for provision of renewable heat in the
UK towards the end of this decade. The economic viability of bioSNG production and injection is
marginal, however, even if low cost feedstock can be sourced, and Renewable Heat Incentive (RHI)
support is provided at the levels currently proposed. BioSNG injection would reduce the greenhouse
gas intensity of the natural gas grid, giving emissions reductions wherever natural gas was used. This
is important for areas where other technologies are not viable (for example, in areas where direct
use of biomass is not possible because of lack of infrastructure or air quality issues), and while other
technologies are taken up (e.g. energy efficiency measures, heat pumps, solar thermal).
Below, we review the next steps to commercialisation of BioSNG technology in the UK, potential
barriers to this deployment, and recommend possible ways to overcome these barriers.
Access to viable technology
As explained in Section 2.6, the technical feasibility of bioSNG production appears to have been
proven for the one technology. The main challenges lie in the scale-up to commercial size and the
optimisation of plant configuration to ensure it will be technically and economically viable.
Finalised policy support
The details of the Renewable Heat Incentive are not yet finalised, with a consultation on the
proposed scheme ongoing. By the time a bioSNG plant might be planned in the UK, this policy is
likely to be finalised, and could consider bioSNG specifically.
The consultation document mentions the bioSNG route, but does not consider it explicitly in
determining the level of policy support: the proposed tariff for biomethane injection is based on the
level of support needed for biogas injection to be viable, compared with use of biogas for electricity
generation. The tariff lifetime of 15 years is also set based on an anaerobic digestion plant producing
biogas, which is probably too short for bioSNG plants that would have economic horizons of 20-25
years.
The level at which the RHI is set will be very important in determining the viability of bioSNG
production. If the biogas tariff above were applied to a bioSNG project, with central feedstock
prices, over the full 20 year plant lifetime, the plant IRR would be 9.3% for a 30MWbioSNG plant, which
is too low for a project to be attractive. If a viable IRR of 15% were set, this tariff level would mean
that the feedstock price that the plant could pay would be reduced to £24/odt. This is lower than the
cost of any of the suitable UK feedstocks considered, even at the low end of their ranges. However,
for a 100MWbioSNG plant, the IRR is above 15%, even with the feedstock prices considered in this
study.
This analysis shows that the RHI tariff for biogas would only encourage bioSNG production at large
scales, based on the economic analysis here. For smaller plants, a tariff specific to bioSNG plants
would be needed, based on support for the whole project lifetime. If the same approach were used
as for biogas injection, this would involve assessing the comparability with gasification to electricity
routes, which receive 2 ROCs. However, it may be necessary to consider whether this approach is
less appropriate for a route using a dry feedstock than for biogas:
Wet feedstocks are generally best used in anaerobic digestion to produce biogas, and therefore
comparing potential uses of the biogas, and equalising revenues from them is reasonable.

52
However, the drier feedstocks used for bioSNG production, such as wood, could be used in many
other bioenergy routes, including direct heating, combustion to produce heat and power, or
potentially transport fuels production.
These routes may be willing to pay more for feedstocks than gasification to electricity or bioSNG,
depending on the level of support for them. As a result, setting the RHI level for bioSNG to be
competitive with gasification to electricity may not necessarily guarantee that bioSNG is
produced, i.e. that bioSNG can attract feedstocks at the right price.
As a comparison, in the Swiss market, an agreement between producers of biogas and the gas utility
specified that the gas utility would buy any upgraded biogas at a fixed price. This has proved to be
enough to support upgraded biogas, but not bioSNG, forming a barrier to bioSNG development. It is
nevertheless likely that bioSNG producers may overcome this through an agreement with the gas
utility, given that there is not enough biogas available to meet targets.
The certainty of the policy support will also be an important factor in determining project viability:
whether the tariff level will be reviewed in the future, and whether tariff levels will be fixed for
existing plants after this change, similar to the current debate over ROC grandfathering for biomass
to electricity plants.
Adequate feedstock supply
Securing a reliable supply of low cost feedstock over the economic lifetime of the project is crucial
for any plant using biomass. The fact that bioSNG projects and technologies in development are only
currently considering clean woody feedstocks will reduce supply chain options compared with more
flexible technologies, and so this will be particularly important. Feedstock sourcing should be
considered from the outset, in considering plant locations.
Securing feedstock can prove very difficult where no centralised trading system is in place. For
example, the Gazobois project in Switzerland is securing feedstock contracts with individual forest
owners. This could result in many supply contracts, even for a small plant, each having different legal
and economic conditions.
By the time a bioSNG plant is built in the UK, we would expect greater biomass feedstock use in
direct heat and in the power sector, with improved infrastructure and trading compared with the
current situation. Whilst this may improve feedstock supply security, it could also reduce local
availability and increase prices. As a result of spot price increases, many biomass to power
developers are considering vertical integration to secure a proportion of their feedstock supplies e.g.
getting involved in forestry projects or energy crop plantations in the UK or overseas.
Availability to pay and out compete other woody biomass uses will depend on how incentives are set
in other bioenergy routes, such as heat, power and transport fuels, as discussed above.
Ensuring access to woody biomass feedstocks for UK bioenergy uses will involve maximising the UK’s
sustainable biomass resource. Actions to achieve this include the Forestry Commission’s activity on
exploiting undermanaged woodland, government support for energy crop production, waste policies
such as the increasing landfill tax acting to divert waste wood and arboricultural arisings from landfill
Access to project finance
This has proven to be a barrier to many types of advanced bioenergy plant. This has generally been
as a result of the lack of investors with both the willingness to accept technology risk and the ability

53
to invest in capital intensive projects. Investors assessing a bioSNG project will take all of the factors
discussed here in account, but in particular:
Technology risk – whilst we have assumed that a plant would not be built in the UK until a plant
of the same scale, using the same feedstocks, had been demonstrated elsewhere, there would
still be a degree of risk associated with this early stage of technology development. Also,
depending on the success of UK biogas grid injection in the short term, there may be risk
associated with being the first UK bioSNG project to connect to the grid.
Supply chain risk – demonstration of the plant’s ability to source suitable low cost feedstock over
the project lifetime will be essential. This is particularly important for bioSNG plants, and more
so for larger plants, given the lack of flexibility in terms of feedstock quality and types that the
current technology can accept.
Market risk – this relates to the longevity of the RHI, and the potential for the policy mechanism
or support level to be changed. As above, this is not yet known.
Opportunity cost - profitability compared with other potential investments.
Plant siting
Whilst there are no inherent barriers to planning associated with bioSNG plants compared with any
other biomass technologies, it is important to note that renewable energy projects in the UK can
often take longer to be granted planning permission, or face constraints, compared to other EU
countries. Planned projects would need to follow the requirements of Planning Policy Statement 22
(PPS22), which gives national guidance on siting including visual effects, air quality impacts, odour,
dust, abstraction of and emissions to water133. BioSNG projects of the scale considered in this study
will also require an Environmental Impact Assessment (EIA)134, in addition to local consultation. For
example, environmental evaluation and local public opinion caused considerable delays to the
planning of the Prenergy biomass to power plant in Wales135.
Access to heat market for co-generated heat
The economic analysis presented in this study includes sale of a proportion of the heat. Finding
potential heat customers when siting bioenergy plants has proved difficult for CHP developers to
date, and this may also be the case for bioSNG plants. Although the heat revenues are not a large
proportion of the costs (the sale of 30% of the available heat reduces bioSNG production costs by
only 4%), this will have an impact on plant profitability.
Success of gas grid access arrangements
Arrangements for biomethane injection to the grid are currently in development. Experience with
injection from biogas installations in the short to medium term should ensure that any barriers to
bioSNG injection are overcome, such as billing to reflect lower calorific values of injected
biomethane, new oxygen content specifications, and gas transporter license exemptions. One point
133 PPS22 gives guidance on locational issues such as International Designated Sites, National Designations, Green Belts, Buffer Zones and Local Designations, as well as other considerations. Communities and Local Government (2009) “PPS22 Accompanying Guidance”, Available at: http://www.communities.gov.uk/documents/planningandbuilding/pdf/147447.pdf 134 An EIA is required if the development type is included within Schedule 2 to The Town and County Planning (Environmental Impact Assessment) (England and Wales) Regulations 1999. A 30MWbioSNG plant occupies 4 hectares, hence will be included, as it is “an industrial installation carrying gas, steam or hot water, where the area of works exceeds 1 hectare, or a development that will process waste” 135 ‘Prenergy Receives Environment Agency Approval For 350 MW Biomass Plant In South Wales, UK’ Energy Business review 2009 http://biofuel.energy-business-review.com/news/prenergy_receives _environment_agency _approval_for_350_mw_biomass_plant_in_south_wales_uk_090929/

54
to note is that due their smaller scale, biogas installations are most likely to connect only to the
distribution network, and not the transmission network, which could be possible for bioSNG plants.
Feedstock sustainability
There are currently fewer sustainability requirements for biomass feedstocks for heat and power
production than there are for transport fuel feedstocks.
Under the RO, biomass to power plants can only receive ROCs if information on the
sustainability of the fuel is provided. Although only a reporting requirement at present, the
Government has indicated that it may introduce mandatory sustainability standards when
international standards become more developed136.
Last year, the Environment Agency included both in the environmental permit and the planning
consent a condition that all wood used at the Prenergy 350MW biomass power plant at Port
Talbot should come from sustainable sources. Wood used must be certified to a standard
approved by the government’s Central Point of Expertise on Timber Procurement. This is the
first time that the agency has included such a clause as part of an environmental permit.137
However, it is likely that feedstocks for bioSNG plants will need to meet sustainability standards by
the time a plant is built in the UK. For example, in the RHI consultation the Government anticipates
that sustainability standards will eventually be introduced by the European Commission, but
proposes that if the UK believes the sustainability standards are insufficient, it will consider setting
its own standards within EU and International law. The Commission has recently announced that it
will not currently set these standards, but has provided recommendations on the criteria that should
be used if Member States do set them – including requirements for traceability of feedstocks, GHG
intensity requirements for all feedstocks, and biodiversity and carbon stock requirements for non-
waste raw materials138.
Conclusions
In conclusion, there are several barriers to bioSNG plant deployment in the UK that are not present
for biomass to power or most fuels routes, because bioSNG technology is further from commercial
development. These are the lack of finalised policy support, and the need to test proposed grid
access arrangements. Given that these barriers are currently being addressed, they may not exist by
the time a bioSNG plant might be built in the UK. The other potential barriers are common to other
large bioenergy plants: access to reliable, low cost supplies of sustainable feedstocks, project
finance, plant siting, and markets for co-produced heat. Several of these may decrease in
importance as other bioenergy technologies are deployed in the UK over the next few years, as
feedstock supply markets build up, confidence is gained in assessing project finance risks,
sustainability criteria and policy are developed and implemented, and familiarity with siting issues
increases. However, they are likely to remain to a certain extent, as a bioSNG will be a new type of
plant with its own particular risk profile, feedstock needs, and siting requirements.
136 Burges Salmon, Renewable Obligation Briefing March 2009 http://www.burges-salmon.com /Practices/environment_and_health_and_safety/environment/Publications/InHouse_Lawyer_article_The_Renewables_obligation.pdf 137 Ecoseed, October 2009 http://www.ecoseed.org/en/general-green-news/renewable-energy/biofuel/ biomass/4641-welsh-wood-chips-biomass-plant-gets-through-tough-permitting and Burges Salmon , Jan 2010 http://www.energy-business-review.com/suppliers/burges_salmon/news/sustainability_standards2/ 138
REPORT FROM THE COMMISSION TO THE COUNCIL AND THE EUROPEAN PARLIAMENT on sustainability requirements for the use of
solid and gaseous biomass sources in electricity, heating and cooling, February 2010 http://ec.europa.eu/energy/renewables/transparency_platform/doc/2010_report/com_2010_0011_3_report.pdf

55
9 Strategic conclusions and recommendations
Given the UK target of 80% GHG emissions reduction by 2050, there will be the need for a dramatic
reduction in the use of natural gas compared with today, through demand reduction (efficiency), use
of alternative end use technologies, and gas grid decarbonisation through biomethane injection.
These options could also decrease dependence on imported natural gas over time, increasing energy
security. This study has shown that in the long term, bioSNG could be an economically attractive
option for providing low carbon heat in the domestic sector, compared with direct use of biomass,
or electric heating, making use of existing infrastructure and end-use equipment. Whilst it is not the
lowest cost option when compared with direct use of biomass in the commercial and industrial
sectors, it would also result in their decarbonisation where direct use of biomass is not possible, for
example as a result of space or air quality constraints.
These potential long term benefits lead to several potential short term activities. On the policy side,
the Renewable Heat Incentive is under development, which could encourage bioSNG production and
use if set at the right level, with sufficient longevity. At the levels currently proposed, the RHI would
make bioSNG production at large scale a commercially attractive proposition in the UK, provided
that capital and feedstock costs were similar to those modelled here. However, smaller plants are
less likely to be commercially attractive with this level of support. Encouraging the first bioSNG
projects in the UK will rely on setting the RHI support at the right level, but may also require further
assessment of the attractiveness of the UK as a market for early deployment. BioSNG is currently
being developed outside the UK, with projects at the pilot stage, and plans for scale up to the first
few commercial scale plants. Once these are built, the location of the next few plants will depend on
factors including the technology developers’ business model (e.g. licensing), incentives available for
plant construction and bioSNG production, and the ease of project planning and permitting. Bringing
together existing technology and project developers with potential UK stakeholders could help to
establish the likelihood of the UK being a potential site for a future plant, and any additional barriers
that might need to be overcome. Promoting establishment of a project in the UK in the 2020
timeframe would help to demonstrate the technology in the UK context, and show that bioSNG
could make an effective contribution to renewable energy targets, potentially influencing the UK’s
pathway to long term low carbon heating, in terms of changes to gas and electricity infrastructure.

56
Annex A: Feedstock types and locations
Stemwood
Stemwood is the main trunk of a tree – the most valuable part. The available softwood and
hardwood resources are both forecast to increase over the next 10 years, as new woodland is
brought into management, and a significant proportion of the UK’s forests reach maturity.
Therefore, although currently most stemwood is used in sawmills and wood product industries, by
2020 there could be a sizeable resource available for bioenergy. As shown in Figure 5, the main
forest or woodland regions in the UK are located in the South, West and North East of Scotland,
Wales and the South of England.
Forestry residues
Forestry residues include poor quality stemwood, branches and tips that arise from harvesting or
thinning operations. Currently, very little of this resource is used– the resource available will mainly
depend on extractability. With the UK standing forest reaching maturity, the potential forestry
residue resource is also set to increase to 2020. Figure 6 shows the distribution of potential forestry
residues in the UK. The areas in yellow and red have the highest yielding/most concentrated
resource – these include Southern and North East Scotland, Southern England, and Wales, which as
expected, closely matches the stemwood resource.
Arboricultural arisings
Arboricultural arisings include stemwood, branches and wood chips from harvesting, pruning and
safety operations that are carried out in urban and semi-rural areas, and at rail and road sides. They
typically contain 50% moisture content, have a low volumetric density and are thinly spatially
distributed, hence can be difficult to collect and aggregate.
91% of the UK resource is located in England, with the split between the regions given in Table 16.
Some arboricultural arisings are already used for small scale non-energy and woodfuel uses, but
most are left onsite or landfilled (i.e. no current market).
Table 16: Arboricultural arisings by UK region139
Arboricultural arisings (k odt/year)
ENGLAND 456
South East 112
Yorkshire & The Humber 74
East Midlands 65
London 49
East of England 48
North West 10
South West 36
West Midlands 15
North East 15
SCOTLAND 22
WALES 14
NORTHERN IRELAND 7
139 Forestry Research (2002) “Woodfuel Resource: Study into the potentially available woodfuel resource of Great Britain“ Online data resource, Available at: http://www.eforestry.gov.uk/woodfuel/pages/home.jsp

57
Short rotation coppice (SRC)
Short rotation coppice (SRC) feedstocks, such as poplar or willow, are perennial crops harvested
every 3-4 years. These energy crops are grown specifically for bioenergy, and although not
competing against non-energy uses, there is likely to be competition from uses such as in power or
heat generation. The available resource in 2020 is also highly dependent on annual planting rates,
which are currently limited by a number of factors.
Those areas of the UK most suitable for SRC production (i.e. highest predicted yields) are shown in
Figure 7. However, much of the land labelled as suitable will already be under arable or improved
grassland management, and unavailable for growing SRC. It is therefore important to also examine
where the current SRC plantations are located, in order to gauge which regions could provide a
significant SRC feedstock resource by 2020. Two thirds of the current SRC plantations can be found
in counties to the North and East of England (between Newcastle and The Wash), with other clusters
west of London, near Carlisle and Norwich40. Interestingly, looking at Figure 8, these are not
necessary the highest yielding / most suitable areas – very few SRC plantations are found further
north, or in the Midlands.
Sawmill co-products
Sawmill co-products are mainly in the form of woodchips, sawdust or bark, formed during the sizing
process of transforming timber into planks or other products. The forecast increase in stemwood
production to 2020 will therefore directly translate into an increased output of sawmill co-products.
The majority of sawmill co-products are currently used for non-energy uses, and any remaining
sawmill co-products are already being used for bioenergy, mainly in the form of pellets. As shown in
Figure 9, there is a fairly even distribution of sawmills across the whole of the UK, although there are
some clusters in Southern Scotland and the West of England / Wales.
Imported chips and pellets
Woody biomass chips and pellets are currently imported for heat and power production, with
volumes of imports expected to increase in the future. For plant health legislation reasons, imports
of forestry material by ship have to arrive at a certified UK port140. Shipments of wood chip and
pellets are usually large, requiring a deep-water UK port with sufficient facilities. BioSNG plants are
more likely to use wood chips instead of pellets, since dual gasifiers are designed to take chips, and
pellets are more expensive.
A map of the UK commercial ports licensed to handle forestry imports is shown in Figure 10. The
major ports are Aberdeen, Leith, Tyne, Teesport, Hull, Goole & Immingham, Felixstowe, Tilbury,
Southampton, Bristol, Liverpool, Belfast and Clydeport141, each of which is large enough to
comfortably handle enough feedstock to supply a large bioSNG plant.
Clean waste wood
Waste wood arises as part of Commercial & Industrial, Construction & Demolition and Municipal
Solid Wastes. It is therefore most likely to be located at waste aggregator / wood reprocessing sites,
found near areas of high industrial activity and population density. Waste wood is an
inhomogeneous feedstock, and large percentages can be contaminated. Although its
segregation/extraction can be difficult, the remaining proportion is generally clean enough for re-use
140 FERA (2009) “Designated Points Of Entry For Plant Health Controlled Plants/ Plant Products And Forestry Material” Available at: http://www.fera.defra.gov.uk/plants/plantHealth/documents/importsPOE.pdf 141 Bob Jones (2009) pers. comm. www.ports.org.uk

58
by the wood products industry, or used for bioenergy. Clean waste wood is also usually dry (around
20% moisture content), hence requires less drying before gasification than other feedstocks.
Due to avoided landfill charges, clean waste wood should be relatively cheap compared to the other
woody feedstocks, although competition for clean waste wood will be increasing in the future years
due to increased large scale biomass power generation, and wood products industry recycling.

59
Annex B: End-use modelling data
Cost references
DTI (2007) “UK Biomass Strategy 2007: Working Paper 1 – Economic analysis of biomass energy”, Available at: http://www.berr.gov.uk/files/file39040.pdf
Carbon Trust (2009) “Biomass heating: a practical guide for potential users”, Available at: http://www.carbontrust.co.uk/Publications/pages/PublicationDetail.aspx?id=CTG012
Carbon Trust (2005) “Biomass sector review for the Carbon Trust”, Available at: http://www.carbontrust.co.uk/Publications/pages/PublicationDetail.aspx?id=CTC512
NERA, Entec & Element Energy (2009) “Renewable Heat Technologies for Carbon Abatement: Characteristics and Potential”, report for Committee on Climate Change, Available at: http://hmccc.s3.amazonaws.com/docs/NERA%20Renewable%20Heat%20MACC%20report%20final%20revision.pdf
Industry response to the Renewable Heat Curve consultation (2009) private comm.
NERA / AEA (2009) “The UK supply curve for Renewable Heat”, study for DECC, available at: http://www.decc.gov.uk/en/content/cms/what_we_do/uk_supply/energy_mix/renewable/policy/renewable_heat/incentive/supply_curve/supply_curve.aspx
Element Energy (2009) “The growth potential for microgeneration in England, Wales and Scotland: Final Appendix”, report for Microgeneration Steering Board, Available at: http://www.decc.gov.uk/en/content/cms/what_we_do/uk_supply/energy_mix/renewable/explained/microgen/strategy/strategy.aspx
Pöyry & Faber Maunsell (2009) “The potential and costs of district heating networks”, report to DECC, Available at: http://man270109a.decc.gov.uk/en/content/cms/what_we_do/uk_supply/energy_mix/distributed_en_heat/district_heat/district_heat.aspx
Projected fuel prices in 2020
Pellet moisure content 10%
Chip moisture content 25%
Gas grid bioSNG content 100%
Natural gas price Low Central High
Domestic p/kWh 4.14 5.33 6.39
Commercial p/kWh 3.14 4.68 6.04
Industrial p/kWh 2.54 3.72 4.75
Wholesale p/kWh 1.15 2.29 3.29
Wholesale to industrial uplift p/kWh 1.39 1.43 1.46
Avoided power price Low Central High
Domestic p/kWh 11.98 15.53 18.01
Commercial p/kWh 10.49 14.88 17.96
Industrial p/kWh 8.63 12.01 14.37
BioSNG price Low Central High
Domestic p/kWh 7.44 8.27 9.02
Commercial p/kWh 6.45 7.62 8.67
Industrial p/kWh 5.85 6.65 7.38
BioSNG production cost p/kWh 4.45 5.23 5.93
Pellet price Low Central High
Domestic £/odt 213 249 317
Commercial £/odt 182 215 276
Chip price Low Central High
Commercial £/odt 111 123 138
Industrial £/odt 32 70 100

60
Domestic technology assumptions
Technology Pellet boiler Gas boiler Gas boiler
Fuel / Feedstock Wood pellets bioSNG Natural gas
Specific capital costs £/kW 550 125 125
Specific operating costs £/kW/yr 14 4.2 4.2
Fuel price £/MWh 49.8 82.7 53.3
Delivered cost of heat p/kWh 18.72 12.77 9.31
Commercial technology assumptions
Technology Pellet boiler Chip boiler Gas boiler Gas boiler
Fuel / Feedstock Wood pellets Wood chips bioSNG Natural gas
Specific capital costs £/kW 350 430 100 100
Specific operating costs £/kW/yr 7 10 2 2
Fuel price £/MWh 43.0 24.6 76.2 46.8
Delivered cost of heat p/kWh 7.28 5.86 9.59 6.14
Industrial technology assumptions
Technology Woodchip CHP BioSNG CHP Gas CHP Chip boiler BioSNG boiler Gas boiler
Fuel / Feedstock Wood chips bioSNG Natural gas Wood chips bioSNG Natural gas
Peak output (heat) kWth 10,000 10,000 10,000 10,000 10,000 10,000
Peak output (power) kWe 2,500 9,048 9,048
Thermal output/input % 64% 42% 42% 80% 85% 85%
Power output/input % 16% 38% 38%
Specific capital costs £/kWth 250 50 50
Specific capital costs £/kWe 2800 657 657
Specific operating costs £/kWth/yr 1 1
Specific operating costs £/kWe/yr 80 48 48 4
Fuel price £/MWh 14.0 66.5 37.2 14.0 66.5 37.2
Avoided electricity price £/MWh -120 -120 -120
Delivered cost of heat p/kWh 0.78 6.71 -0.28 2.28 7.94 4.48
61
Annex C: Waste feedstock policies
Waste hierarchy
The EU Waste Directive (2008/98/EC) gives the following waste hierarchy to be applied as a priority
order in waste prevention and management legislation and policy142:
1. prevention
2. preparing for re-use
3. recycling
4. other recovery, e.g. energy recovery
5. disposal
However, when applying the waste hierarchy, Member States are required to take measures to
encourage the options that deliver the best overall environmental outcome. This may require
specific waste streams departing from the hierarchy where this is justified by life-cycle thinking on
the overall impacts of the generation and management of such waste142. Given the environmental
benefits of biomethane production and use, this would suggest that (in theory) the EU waste
hierarchy should not be a barrier to bioSNG production from wastes in the UK. BioSNG should be
able to be categorised as energy recovery, hence contribute to local council landfill avoidance
targets. However, as bioSNG would not count towards local council recycling targets, future waste
resources may go to other treatment options, rather than be available as a bioSNG feedstock143.
Furthermore, many of the local councils’ long-term 25 year waste contracts are soon due for
renewal, and there is a concern that large volumes of waste could be used in less efficient
alternative energy applications, such as incineration plants144. However, as discussed in Section
2.1.1, municipal solid waste is not currently a suitable feedstock for bioSNG production, so this is not
a near- or mid-term concern (and the contracts will be up for renewal in 2035 when wastes might be
suitable).
Mixed fuels
The RHI proposes that “where an installation can generate heat from both renewable and non-
renewable fuels, the RHI tariff should only reward the renewable component of the mixed fuel load.
These situations will usually involve CHP or district heating installations, using energy from waste”.
The RHI requires that separate dedicated boilers have to be used, except in the case of municipal
waste, where a similar definition and approach will follow the principles of the Renewables
Obligation. This would also apply for bioSNG plants if they were to take mixed fuels in the future
(other than just clean woody feedstocks).
The Renewables Obligation Order (ROO) gives definitions of “waste”, “solid recovered fuel”, and
“biomass”. Where biomass, wastes and/or fossil fuels are mixed together before being used for
power generation, the ROO applies to each fuel as if they were generating separately, with ROCs
only issued to the renewable proportion. Unlike combustion, the biomass fraction of mixed waste
142 EC (2008) “Directive 2008/98/EC Of The European Parliament And Of The Council”, Available at: http://eur-lex.europa.eu/LexUriServ/LexUriServ.do?uri=OJ:L:2008:312:0003:0030:EN:PDF 143 Ineos Bio and Progressive Energy (2009) pers. comm. 144 CNG Services (2009) pers. comm.

62
that has been processed by an advanced technology (e.g. gasification or pyrolysis) qualifies under
the ROO145.
The definition of biomass has been relaxed (from 98%) to 90% of the total energy content of a fuel
that must be derived from relevant material (e.g. plant, animal), although the proportion composed
of fossil fuel must be reported. For waste to be eligible under the ROO, it must not be derived from
more than 90% fossil fuel. If this proportion is likely to exceed 50%, then the generator may have to
supply fuel and product samples for analysis146.
145 Communities and Local Government (2009), Renewable Energy Capacity in Regional Spatial Strategies, Available at: http://www.communities.gov.uk/documents/planningandbuilding/pdf/renewableenergyreport.pdf 146 OPSI (2009) Renewables Obligation Order, Available at: http://www.opsi.gov.uk/si/si2009/draft/ukdsi_9780111473955_en_1