the portland region in 2010 - portland state university portland region in 2010: ... oregon office...
TRANSCRIPT

3/5/10
1
The Portland Region in 2010:
Taking Stock and Looking to the Future
Sheila A. Martin, Director Institute of Portland Metropolitan Studies / Population Research Center Presentation for Multnomah County Commission, 2/23/10 [email protected]
Key Messages
Demography = Economy

3/5/10
2
Regional Demographic Trends
0%
5%
10%
15%
20%
25%
30%
35%
40%
45%
Perc
en
t ch
an
ge
PDX Growth
OR Growth
USA Growth
Source: Portland State University Population Research Center, US Census Bureau, Washington State Office of Financial Management
Population Growth Population percent change by decade - USA, OR, seven county region

3/5/10
3
Population distribution
500,011 553,215
766,068 881,961
1,081,978
1,341,550
1,523,741
1,927,836
2,191,785
0
500,000
1,000,000
1,500,000
2,000,000
2,500,000
1930 1940 1950 1960 1970 1980 1990 2000 2008
County Population in Seven County Region, 1930-2008
Source: Portland State University Population Research Center, US Census Bureau, Washington State Office of Financial Management
Population distribution
0%
10%
20%
30%
40%
50%
60%
70%
80%
90%
100%
1930 1940 1950 1960 1970 1980 1990 2000 2008
Multnomah
Washington
Clark
Clackamas
Yamhill
Columbia
Skamania
Population Distribution by County, 1930-2008
Source: Portland State University Population Research Center, US Census Bureau, Washington State Office of Financial Management

3/5/10
4
0
100,000
200,000
300,000
400,000
500,000
600,000
700,000
800,000
900,000
Fo
reca
sted
Po
pu
lati
on
Multnomah
Washington
Clark
Clackamas
Yamhill
Columbia
Skamania
Forecast Forecasted Population by County, 2000-2040
Source: Oregon Office of Economic Analysis, Washington State Office of Financial Management
Migration
Population growth = Births -
Deaths + Migration

3/5/10
5
Components 2000-2008
27.9% 22.1%
58.7% 53.8% 43.2%
30.2% 30.2%
72.1% 77.9%
41.3% 46.2% 56.8%
69.8% 69.8%
0%
10%
20%
30%
40%
50%
60%
70%
80%
90%
100%
Net Migration, 2000-2008
Natural Increase, 2000-2008
Population Growth by Net Migration and Natural Increase, 2000-2008
Source: Portland State University Population Research Center, US Census Bureau, Washington State Office of Financial Management
Migration
6,737
86
29,396
22,456
2,288
10,449
31
26,261
4,758
-5,246
23,147
7,270
46,547
708
-10,000
0
10,000
20,000
30,000
40,000
50,000
Net International Migration
Net Domestic Migration
International and Domestic Migration by County, 2000-2008
Source: Portland State University Population Research Center, US Census Bureau, Washington State Office of Financial Management
3/5/10
6
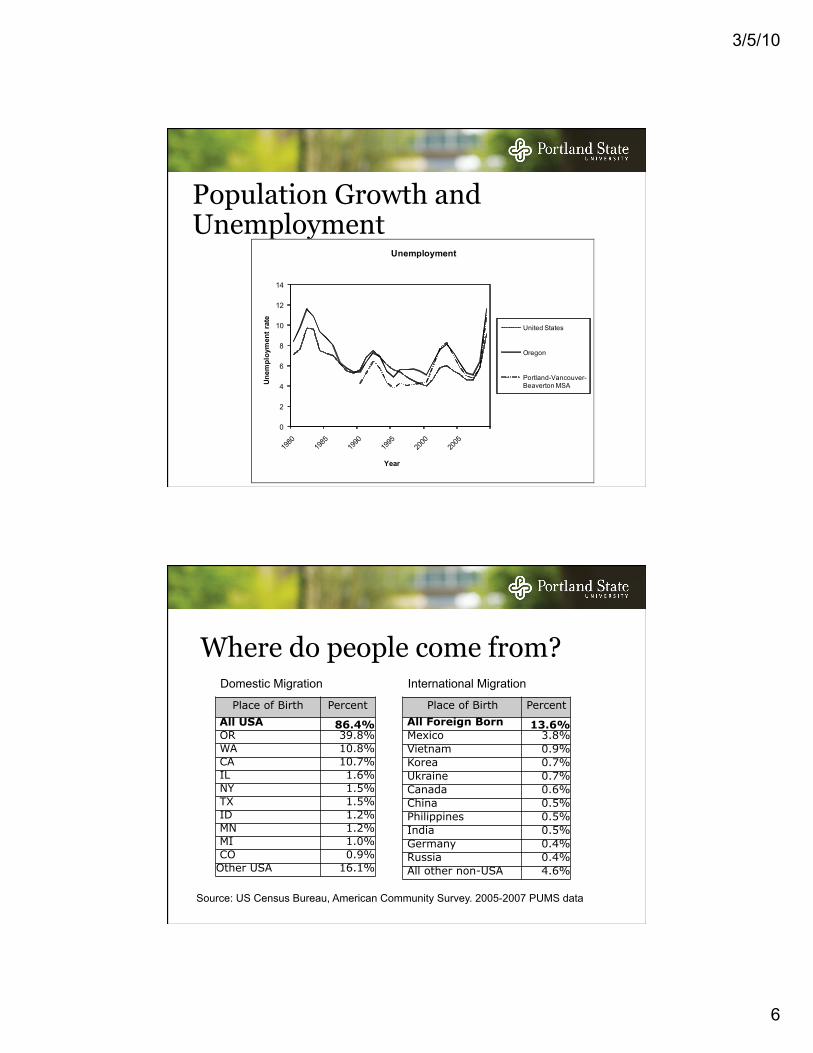
Population Growth and Unemployment
0
2
4
6
8
10
12
14
Unem
ploy
men
t rat
e
Year
Unemployment
United States
Oregon
Portland-Vancouver-Beaverton MSA
Where do people come from?
Place of Birth Percent
All USA 86.4% OR 39.8% WA 10.8% CA 10.7% IL 1.6% NY 1.5% TX 1.5% ID 1.2% MN 1.2% MI 1.0% CO 0.9% Other USA 16.1%
Place of Birth Percent
All Foreign Born 13.6% Mexico 3.8% Vietnam 0.9% Korea 0.7% Ukraine 0.7% Canada 0.6% China 0.5% Philippines 0.5% India 0.5% Germany 0.4% Russia 0.4% All other non-USA 4.6%
Domestic Migration International Migration
Source: US Census Bureau, American Community Survey. 2005-2007 PUMS data
3/5/10
7
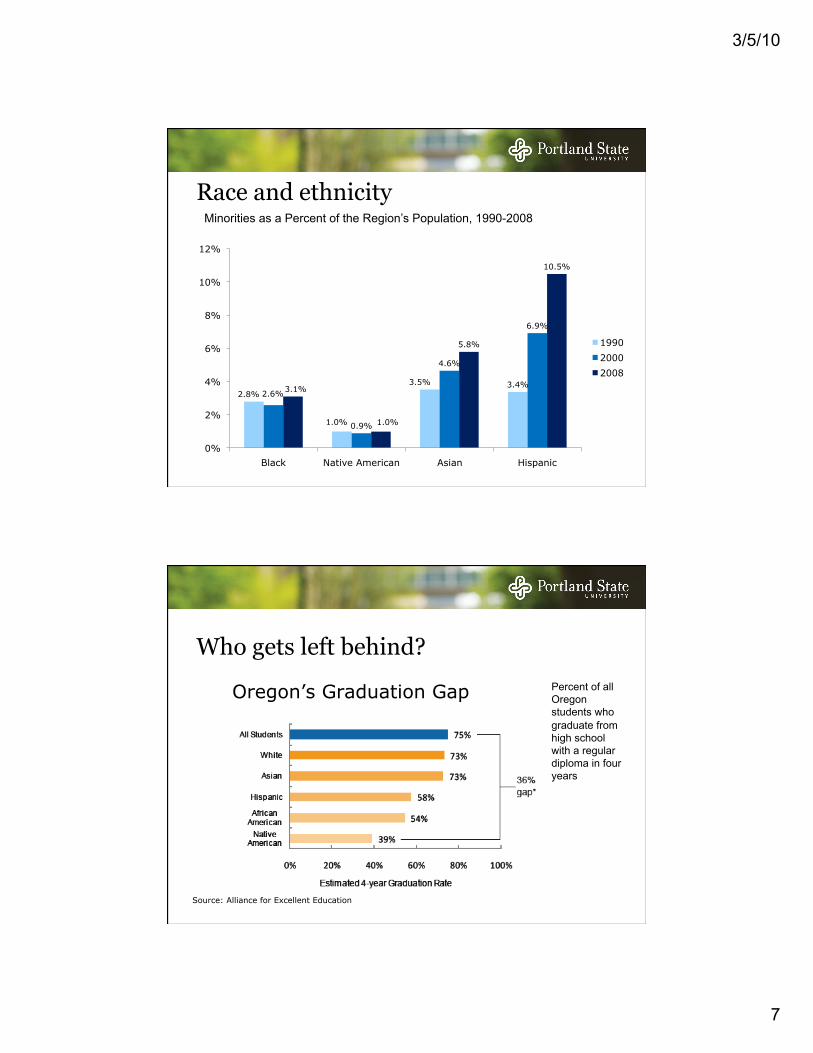
Race and ethnicity
2.8%
1.0%
3.5% 3.4% 2.6%
0.9%
4.6%
6.9%
3.1%
1.0%
5.8%
10.5%
0%
2%
4%
6%
8%
10%
12%
Black Native American Asian Hispanic
1990
2000
2008
Minorities as a Percent of the Region’s Population, 1990-2008
Who gets left behind?
Oregon’s Graduation Gap
Source: Alliance for Excellent Education
Percent of all Oregon students who graduate from high school with a regular diploma in four years

3/5/10
8
Education= economic success
Source: US Census Bureau, 2007 American Community Survey
Washington and Multnomah counties lead educational attainment
Source: US Census Bureau, 2007 American Community Survey
3/5/10
9
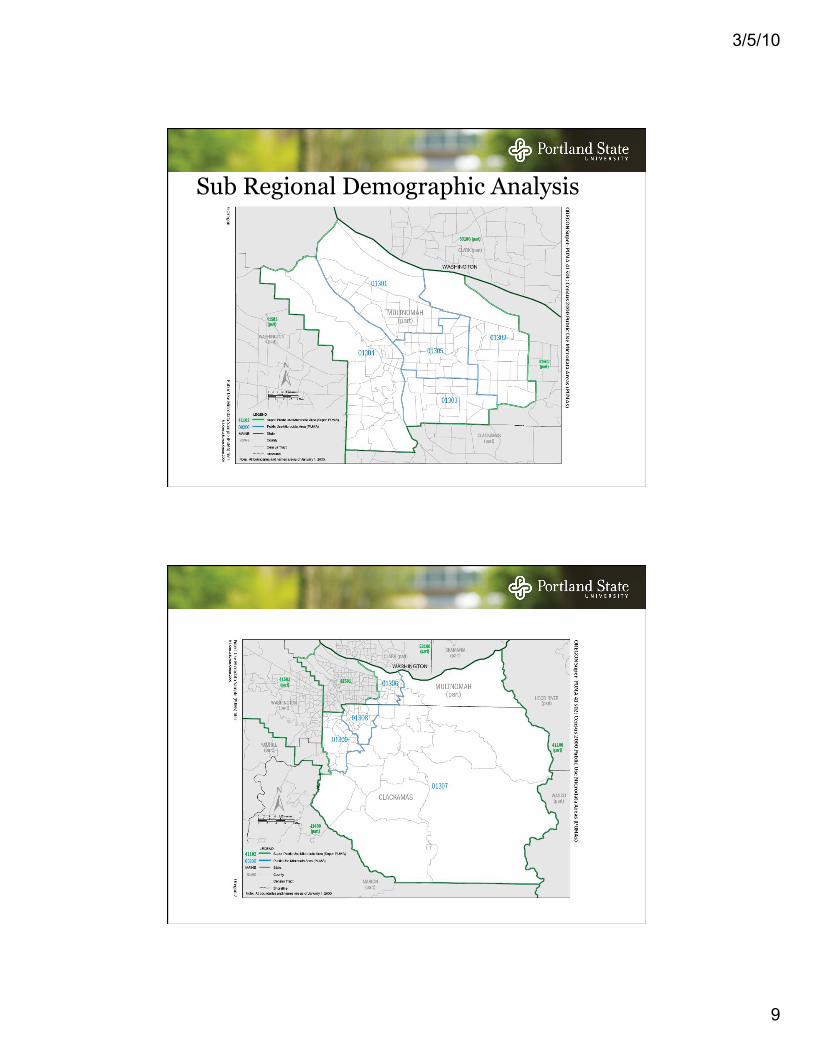
Sub Regional Demographic Analysis

3/5/10
10
North Portland (1301) HH Size 2.3
% Hisp 14.6%
% Black 14.8%
% with BA 32.1%
% English 80.1%
Med HH Income $46,825
Source: US Census Bureau, American Community Survey. 2005-2007 PUMS data
1301
Outer SE (1302) HH Size 2.5
% Hisp 11.6%
% Black 8.4%
% with BA 16.3%
% English 76.8%
Med HH Income $43,500
Source: US Census Bureau, American Community Survey. 2005-2007 PUMS data
1302
3/5/10
11
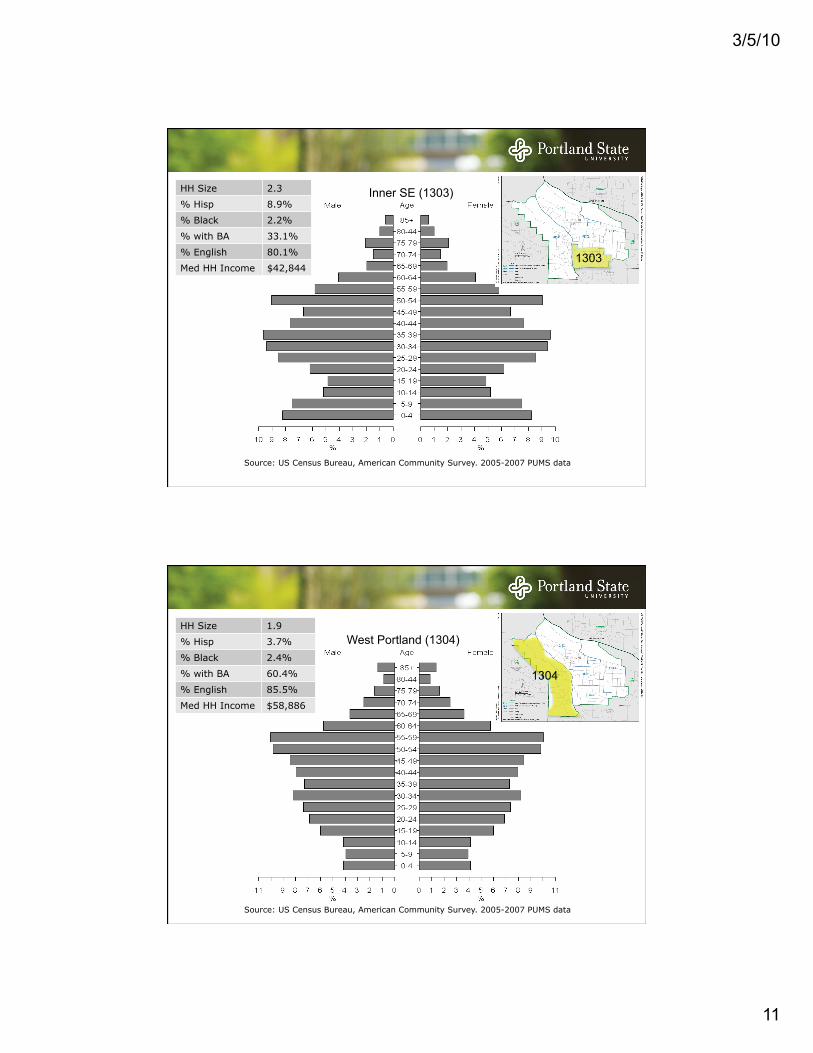
Inner SE (1303) HH Size 2.3
% Hisp 8.9%
% Black 2.2%
% with BA 33.1%
% English 80.1%
Med HH Income $42,844
Source: US Census Bureau, American Community Survey. 2005-2007 PUMS data
1303
West Portland (1304) HH Size 1.9
% Hisp 3.7%
% Black 2.4%
% with BA 60.4%
% English 85.5%
Med HH Income $58,886
Source: US Census Bureau, American Community Survey. 2005-2007 PUMS data
1304
3/5/10
12
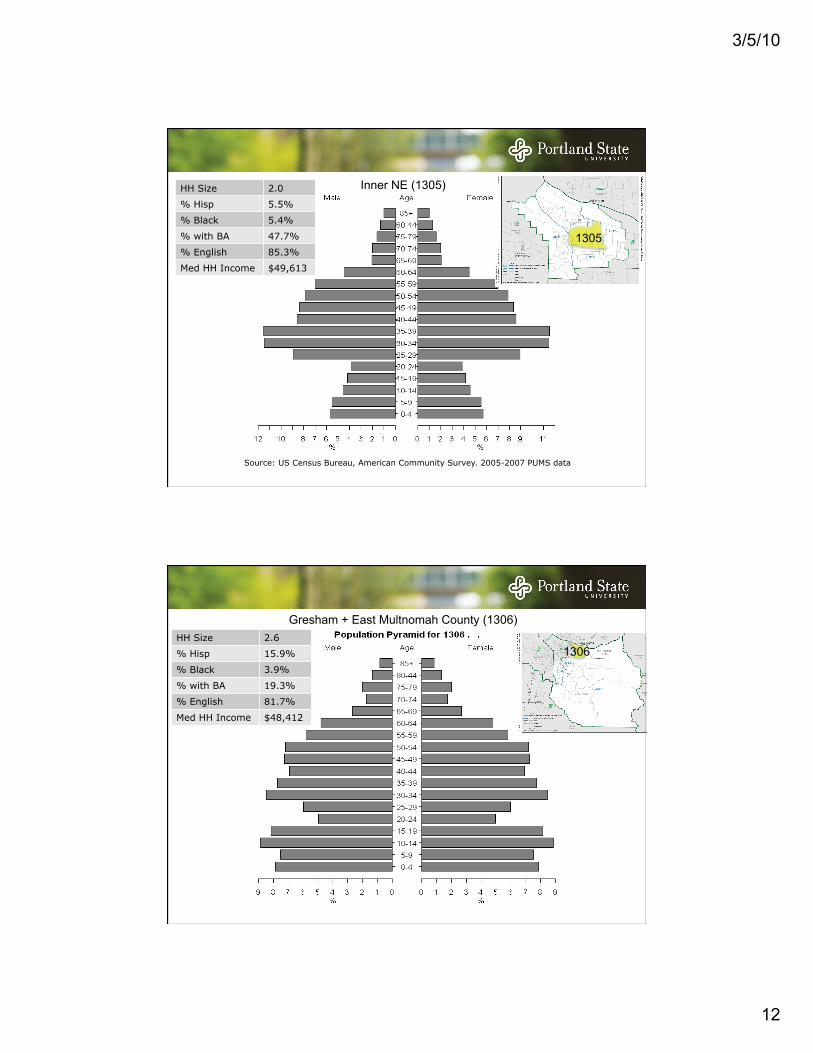
Inner NE (1305) HH Size 2.0
% Hisp 5.5%
% Black 5.4%
% with BA 47.7%
% English 85.3%
Med HH Income $49,613
Source: US Census Bureau, American Community Survey. 2005-2007 PUMS data
1305
Gresham + East Multnomah County (1306) HH Size 2.6
% Hisp 15.9%
% Black 3.9%
% with BA 19.3%
% English 81.7%
Med HH Income $48,412
1302
1306

3/5/10
13
Far East Multnomah and Clackamas Counties (1307) HH Size 2.6
% Hisp 5.0%
% Black 0.6%
% with BA 20.6%
% English 90.7%
Med HH Income $62,669
Source: US Census Bureau, American Community Survey. 2005-2007 PUMS data
1307
Regional Economy

3/5/10
14
1,052,500
978,900
850,000
900,000
950,000
1,000,000
1,050,000
1,100,000
2004
2005
2006
2007
2008
2009
Total Nonfarm Employment – Portland MSA
Nov. 2007
Dec 2009
Almost 74K jobs lost from Nov. 2007 to Dec. 2009 - about 7 percent
Source: Oregon Employment Department, January 2004-December 2009. Not Seasonally adjusted.
464,400
431,000
390,000
400,000
410,000
420,000
430,000
440,000
450,000
460,000
470,000
2004
2005
2006
2007
2008
2009
Multnomah County Jobs
About 33K jobs lost – about 7 percent
Nov 2007
Dec 2009
Source: Oregon Employment Department, January 2004-December 2009. Not seasonally adjusted.

3/5/10
15
Source: Oregon Employment Department, January 2006-November 2009. Seasonally adjusted.
Multnomah County Portland MSA
Persistent Unemployment Multnomah County Portland MSA
Source: Oregon Employment Department, January 2006-November 2009. Seasonally adjusted.

3/5/10
16
Not all industries are equally affected
Health care continues to add jobs
-15.8%
-8.5%
-4.6%
-4.3%
-3.0%
0.0%
0.4%
-18% -16% -14% -12% -10% -8% -6% -4% -2% 0% 2%
Construction
Manufacturing
Finance
High Tech Mfg
Retail
Education
Health care
Industry Employment Growth % increase in one year, November 2009
Source: Oregon Employment Department Portland MSA Nonfarm Employment, November 2008-November 2009.
There are still jobs available
Source: Oregon Employment Department
3/5/10
17
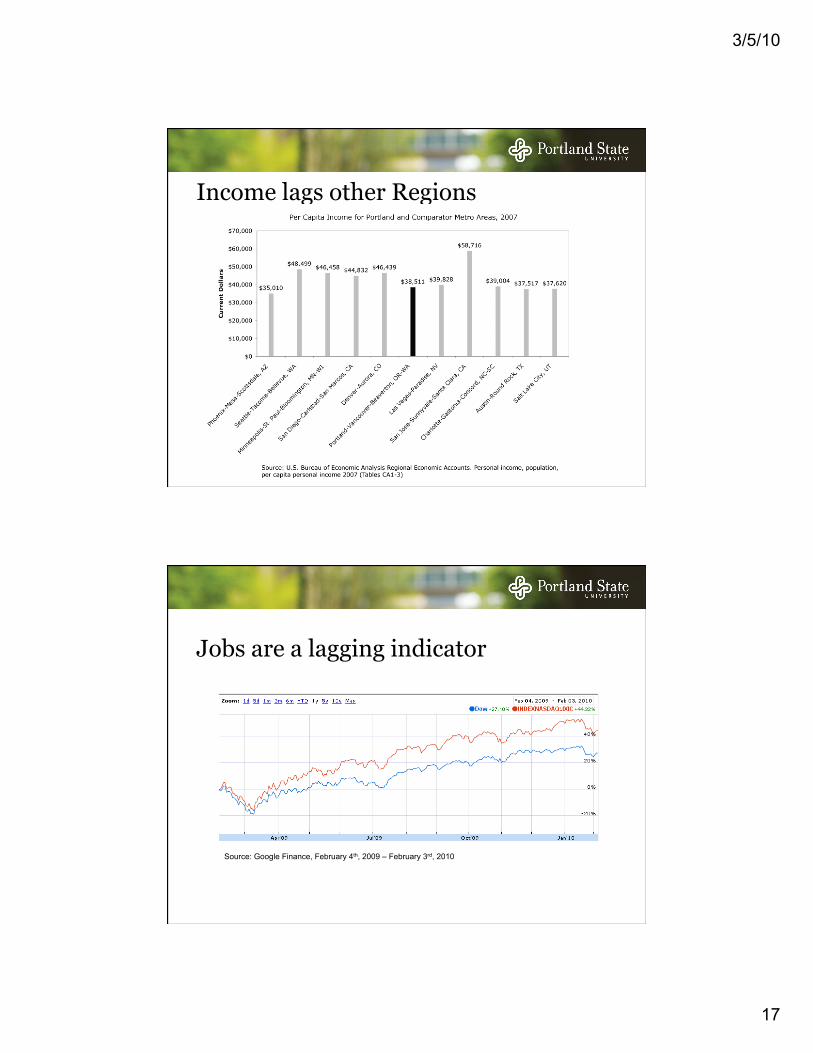
Income lags other Regions
Jobs are a lagging indicator
Source: Google Finance, February 4th, 2009 – February 3rd, 2010

3/5/10
18
Foreclosures came later than other regions
Source: Realtytrac data on Preforeclosures and Bank Reversions in the Portland MSA, May 2007-October 2009
Foreclosure Activity in Multnomah County, May 2007 – October 2009
The Self-Sufficiency Standard Multnomah County, Oregon
Source: Diana M. Pearce, The Self-Sufficiency Standard for Oregon, 2008
FPL: $11,201
FPL: $14,840
FPL: $17,346
FPL: $21,834
$17,491 ($8.28/hr)
$28,254 ($13.38)
$32,360 ($15.32)
$38,714 ($9.17/hr per adult)
$0
$10,000
$20,000
$30,000
$40,000
$50,000
$60,000
$70,000
Adult Adult + Preschooler
Adult + Preschooler +
Schoolage
Two Adult + Preschooler +
Schoolage

3/5/10
19
Self-Sufficiency in the Portland Metro
$48,421
$33,602
$51,937 $32,360
$31,600
Source: Diana M. Pearce, The Self-Sufficiency Standard for Oregon, 2008
For a household with one adult, one preschooler, and one school-aged child
6% 9%
7% 10%
8%
Percent of Population Below the Federal Poverty Level, 2008
Source: American Community Survey 2005-2007, PUMS data
3/5/10
20
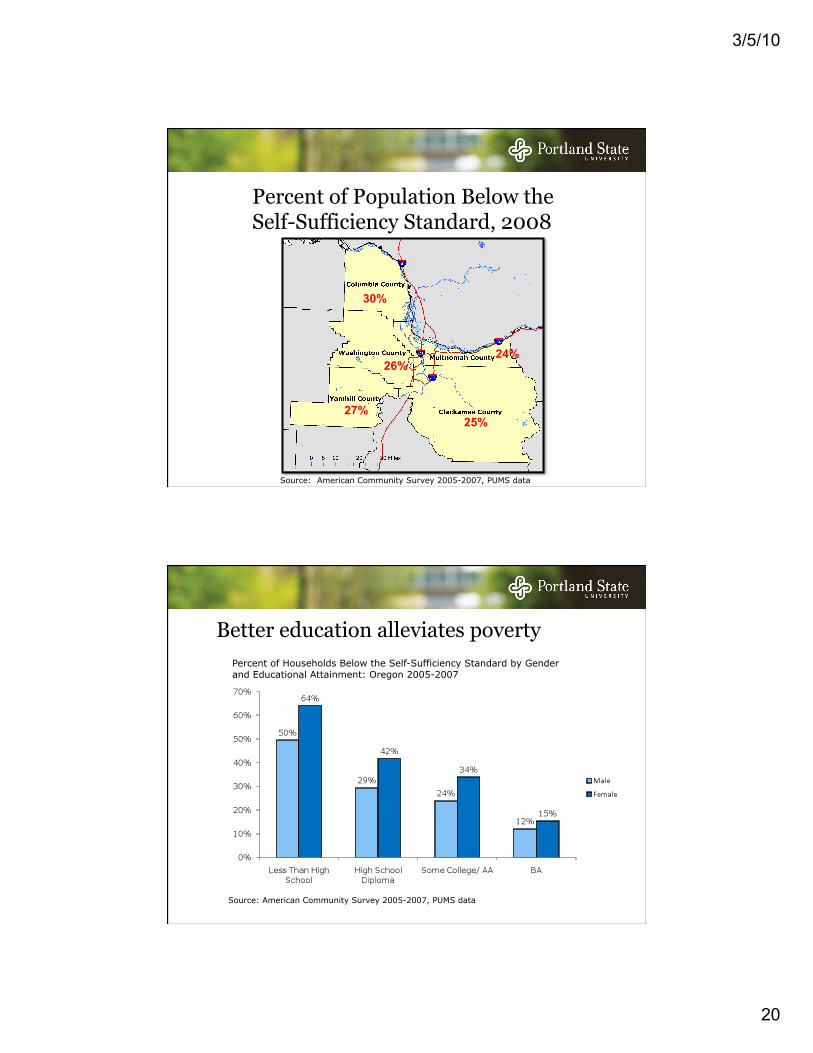
25% 27%
26% 24%
30%
Percent of Population Below the Self-Sufficiency Standard, 2008
Source: American Community Survey 2005-2007, PUMS data
Better education alleviates poverty Percent of Households Below the Self-Sufficiency Standard by Gender and Educational Attainment: Oregon 2005-2007
Source: American Community Survey 2005-2007, PUMS data

3/5/10
21
Source: American Community Survey 2005-2007, PUMS data
The impact of education varies
36%
64%
55%
76%
26%
49%
38%
59%
22%
36%
32%
46%
11%
20% 14%
28%
0%
10%
20%
30%
40%
50%
60%
70%
80%
90%
100%
White (non-Latino) Male Minority Male White (non-Latino) Female Minority Female
Less than high school
High school diploma
Some college or associate's degree
Bachelor's degree or higher
What will bring us out?

3/5/10
22
Patent creation
New ideas form the basis for new businesses
Not all ideas are patentable
Source: Prof. Michael E. Porter, Cluster mapping Project, Institute for Strategy and Competitiveness, Harvard Business School, 2006.
Patents per 10,000 employees, Portland and Comparator MSAs, 2006
Funding good ideas
Source: The MoneyTree Report by PwC and NVCA based on data from Thomson Reuters.
Venture Capital Investment for Portland and Comparator MSAs, 2008
3/5/10
23
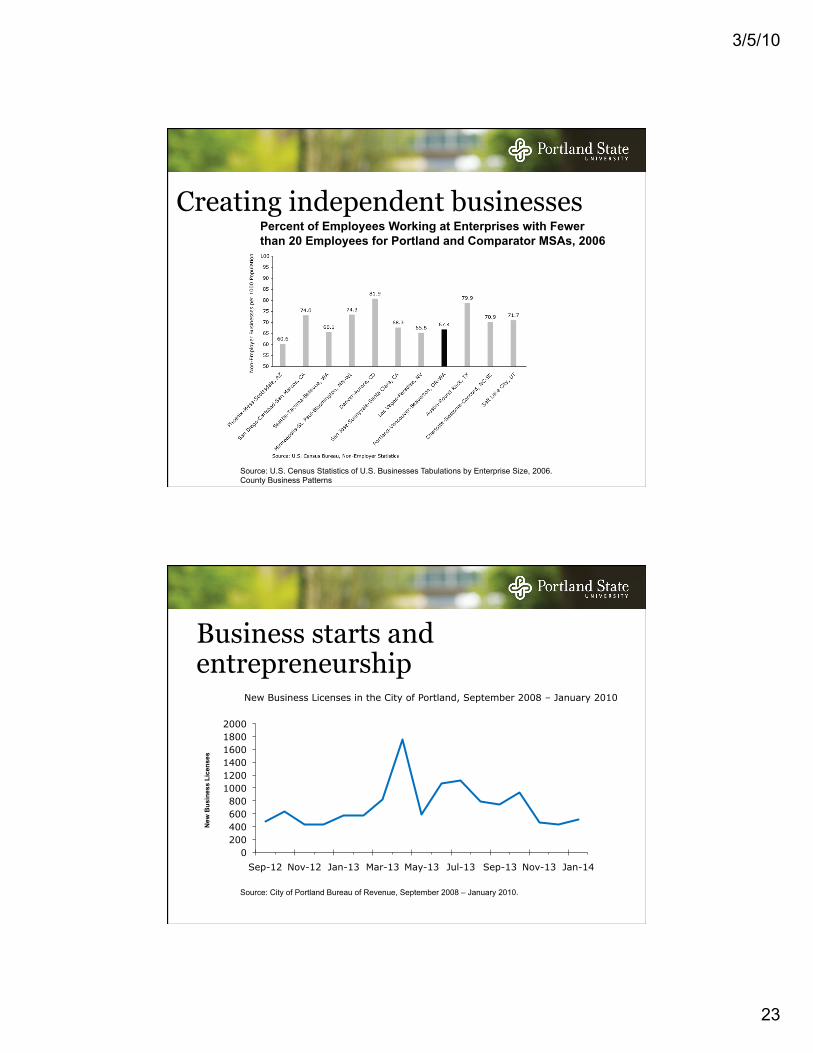
Creating independent businesses Percent of Employees Working at Enterprises with Fewer than 20 Employees for Portland and Comparator MSAs, 2006
Source: U.S. Census Statistics of U.S. Businesses Tabulations by Enterprise Size, 2006. County Business Patterns
Business starts and entrepreneurship
0 200 400 600 800
1000 1200 1400 1600 1800 2000
Sep-12 Nov-12 Jan-13 Mar-13 May-13 Jul-13 Sep-13 Nov-13 Jan-14
New
Bus
ines
s Li
cens
es
New Business Licenses in the City of Portland, September 2008 – January 2010
Source: City of Portland Bureau of Revenue, September 2008 – January 2010.

3/5/10
24
What will improve our chances?
• Oregon families use a higher percentage of family income to pay for college.
• This percentage has risen from 25% in 1992 to 36% in 2006.
Source: “Tuition in the Oregon University System.” Oregon University Service Issue Brief, 2009. http://www.ous.edu/about/legnote09/ib.php
Trends that could make or break us
1 million new people? Or more? Who will they be? What will their
education level be? Can we preserve what’s important about
our place?