the patricia zn-pb-ag epithermal ore deposit: an...
TRANSCRIPT

ACC
EPTE
D M
ANU
SCR
IPT
ACCEPTED MANUSCRIPT
1
The Patricia Zn-Pb-Ag epithermal ore deposit: an uncommon type of
mineralization in northeastern Chile
Darío Chinchilla a, b*
, Lorena Ortega a, Rubén Piña
a, Raúl Merinero
a, Daniel Moncada
c, Robert J.
Bodnar d, Cecilio Quesada
a, Antonio Valverde
e, Rosario Lunar
a, b.
a Departamento de Cristalografía y Mineralogía. Facultad de Ciencias Geológicas. Universidad
Complutense de Madrid. C/ José Antonio Novais, s/n. 28040, Madrid (Spain).
b Instituto de Geociencias IGEO (UCM-CISC), C/ José Antonio Novais, s/n. 28040, Madrid (Spain).
c Departamento de Geología and Andean Geothermal Center of Excellence (CEGA), Universidad de
Chile, Plaza Ercilla 803, Santiago, Chile.
d Department of Geosciences, Virginia Tech, Blacksburg, VA 24061, United States.
e Herencia Resources Plc. Compañía minera Paguanta, Santiago de Chile, Chile.
Abstract
The Patricia ore deposit represents an unusual example of economic Zn-Pb-Ag mineralization at the
northernmost end of the Late Eocene-Oligocene metallogenic belt in Chile. It is hosted by volcano-
sedimentary units, which are typically tuffaceous and andesitic breccias. The ore body consists of a set of
subvertical E-W vein systems developed under a sinistral strike-slip regime that included transtensive
domains with generalized extensional structures where the ores were deposited. The deposit is divided
into two blocks by a set of NNW-ESE-trending reverse faults, which uplifted the eastern block and
exhumed thicker and deeper parts of the deposit. At least 200 m of volcano-sedimentary pile hosting the
mineralization has been eroded in this block. By contrast, the western block exposes a shallower part of
the system where cherts, amorphous silica and jasperoids occur. Three main stages of mineralization have
been defined: (1) pre-ore stage is characterized by early quartz, pyrite and arsenopyrite, (2) base-metal
and silver stage; characterized by sphalerite (6 to 15 mol.% FeS), galena, chalcopyrite, pyrrhotite and Ag-
bearing minerals (freibergite, polybasite, stephanite, pyrargyrite, freieslebenite and acanthite) and (3)
post-ore stage; characterized by late quartz, kutnohorite and minor sulfides (arsenopyrite, sphalerite,
ACC
EPTE
D M
ANU
SCR
IPT
ACCEPTED MANUSCRIPT
2
pyrite, galena, Ag-bearing minerals and Pb-sulfosalts). Whole-ore geochemistry shows two groups of
elements that are positively correlated; 1) Ag-Cd-Cu-Pb-Zn related to the base metal sulfides and 2) Au-
As-Ge-Sb-W related to arsenopyrite and pyrite. Hydrothermal alteration is pervasive in the outcropping
mineralized areas, including silicification and locally, vuggy silica textures. At depth, chloritic and
sericitic alteration is developed along vein selvages and is superimposed to the regional propylitic
alteration. Fluid inclusions indicate that the base-metal ores were deposited from 250-150º C moderate
salinity fluids (1-9 wt % NaCl). The pre-ore stage is characterized by a saline fluid (6-22 wt % NaCl) and
between 210 and 250ºC whereas the post-ore stage has salinity of 4-8 wt % and temperature from 175 to
215ºC. Cooling was the mechanism of ore mineral precipitation in the Patricia deposit, although mixing
of fluids could have occurred in the pre-ore stage. Mineralogical, geochemical and fluid inclusion
evidence is consistent with an intermediate sulfidation (IS) epithermal deposit type. This study highlights
the high potential for hidden economic mineralization at depth in the western block and for extension of
the ore body both to the south and to deeper levels in the eastern block of the Patricia ore deposit. To a
larger extent, the implications of finding such polymetallic epithermal style of mineralization in the
northern Chile Precordillera is relevant both to the regional metallogenic perspective and to the
exploration potential of the region, where the late Eocene-early Oligocene metallogenic belt apparently
disappears.
Keywords: intermediate-sulfidation, Ag-sulfosalts, open-space filling, polymetallic epithermal, strike-
slip duplex, Domeyko fault system, metallogenic belt
1. Introduction
Several long and linear, orogen-parallel metallogenic belts have been defined along the Chilean
Andes, each one developed during a distinct metallogenic epoch, ranging from Cretaceous to Early
Eocene times (Fig. 1a) (Camus and Dilles, 2001). The metallogenic belts young continentwards away
from the subduction zone located at the Pacific western margin of South America, following a migration
similar to the active magmatic arc systems with time (Coira et al., 1982). The Late Eocene to Oligocene
ACC
EPTE
D M
ANU
SCR
IPT
ACCEPTED MANUSCRIPT
3
belt is the most important because it hosts the largest concentration of Cu resources in the world, mostly
in the form of world-class porphyry copper deposits such as Chuquicamata, La Escondida and El
Salvador (Behn et al., 2001; Sillitoe and Perelló, 2005; Maksaev et al., 2007). These porphyry Cu
deposits are genetically related to epizonal plutons emplaced along the N-S oriented Domeyko fault
system (Maksaev, 1990; Behn et al., 2001), whose episodic transpressional/transtensional kinematics
eventually developed extensional areas favorable to the emplacement of shallow plutons. Queen Elizabeth
deposit is the northernmost porphyry copper occurrence in the late Eocene - Oligocene belt within Chile
(Sillitoe & Perelló, 2005). The apparent termination of the belt in this region is a result of concealment
beneath Miocene volcanic rocks (Sillitoe, 2010), and it further reappears in southern Peru (Los Chancas,
Cotabambas, Antapaccay, and Ataspaca porphyry-type deposits, among others; Sillitoe and Perelló,
2005).
The Patricia Zn-Pb-Ag ore deposit displays a vein-like geometry and intermediate sulfidation
epithermal characteristics and it is located close to the northernmost end of the Late Eocene to Oligocene
porphyry Cu belt in Chile, some kilometers apart from the Queen Elizabeth porphyry copper deposit (Fig.
1b). Geographically, it occurs in the Tarapacá Province, I Región, Chile, at latitude 19˚81'S and longitude
69°06'W, 150 km northeast of Iquique and 30 km west of the international border with Bolivia (Figs. 1a
and 1b). Other porphyry copper mines and prospects in the nearby region occur either related to the
Paleocene-early Eocene belt (Cerro Colorado, Bouzari and Clark, 2002; Cotton, 2003; and Mocha,
Sillitoe and Perelló, 2005) or to the late Eocene-early Oligocene belt (Yabricoya, Sillitoe, 1981; Sillitoe
and Perelló, 2005) (Fig. 1b). The Patricia mineralization was identified in 2006 during the early stages of
exploration carried out by Herencia Resources Plc over historical mine workings that date back to the
nineteenth century. These historic workings focused on silver mining and consist of more than 1800 m of
underground galleries; a 400 m long gallery intersected several major Zn-Pb-Ag mineralized veins. The
Patricia ore deposit forms part of the Paguanta Mining Exploration Project and represents the only
example known to date of economic Zn-Pb-Ag epithermal in the northernmost part of the Chilean late
Eocene – Oligocene metallogenic belt, although other polymetallic epithermal deposits within the belt
occur further south in the Antofagasta region (e.g. Faride, Camus and Skewes, 1991). The scarcity of this
ACC
EPTE
D M
ANU
SCR
IPT
ACCEPTED MANUSCRIPT
4
type of ore deposits in the Tarapacá region contrasts with the large number of examples known in the
Peruvian and Bolivian Andes such as Caylloma and Pallancata in Peru (Echavarría et al., 2006; Gamarra-
Urrunaga et al., 2013) and San Cristóbal in Bolivia (Phillipson and Romberger, 2004).
From a metallogenic point of view, the interest of the Patricia deposit is double. The polymetallic
features of the Patricia mineralization, closer to those of the Peruvian and some Bolivian epithermal
deposits than to the Chilean ones, may be indicating a change in the style of outcropping deposits and/or
the level of erosion of the porphyry-epithermal systems in this area. On the other hand, the well-known
genetic and spatial relationships between porphyry and epithermal deposits as parts of larger magmatic-
hydrothermal ore systems (i.e. White and Hedenquist, 1995; Seedorff et al., 2005; Simmons et al., 2005;
Sillitoe, 2010) highlight the potential of the region for finding hidden deposits in a sector of the Andean
late Eocene-early Oligocene metallogenic belt apparently devoid of them.
In this contribution we describe a detailed study of the geology, mineralogy, geochemistry, and fluid
inclusions at the Zn-Pb-Ag Patricia ore deposit. A major emphasis of the work has been to define the
tectonic and structural framework of the deposit, and to identify and characterize the different stages of
mineralization regarding both the mineralogy of the economic phases and the nature of the fluids
responsible for ore deposition. The results allow us to address some key questions related to the evolution
of the hydrothermal system, the mechanisms of ore deposition, and the potential of the area for discovery
of new reserves in the future.
2. Regional context of the Paguanta Mining Exploration Project
The Paguanta Mining Exploration Project, led by Herencia Resources Plc, is located at an elevation
of approximately 3600 m above sea level on the Quebrada of Tarapacá, a deep valley that runs through
the Precordillera and the piedmont of the Andean Western Cordillera (Fig. 1b). In structural terms, the
Precordillera is characterized in this area by the development of a west vergent fault system and
associated folds (Pinto et al., 2004; Victor et al., 2004; Farías et al., 2005) corresponding to the southward
continuation of the west vergent thrust system observed at the latitude of Arica. This major tectonic
feature was likely associated with shortening and uplift of this part of the Andes during the Cenozoic,
Incaic and Quechua phases of the Andean cycle (see discussion by García and Hérail, 2001 and Wörner
ACC
EPTE
D M
ANU
SCR
IPT
ACCEPTED MANUSCRIPT
5
and Seyfried, 2001). A thick sequence of clastic deposits and ignimbrites was also sourced in this part of
the uplifting Precordillera during Oligocene and Miocene times (Schlunegger et al., 2010). These
sediments unconformably overlie an early Palaeozoic to Palaeocene substratum.
At the regional scale, Mesozoic rocks are dominated by Cretaceous green-grey to black andesitic
terrestrial sediments and subaerial lavas (Cerro Empexa and Cauquima Formation; Galli and Dingman,
1962; Sayes, 1978) which unconformably overlie Jurassic marine to subaerial sediments and volcanic
sedimentary strata (Galli, 1957; Pacci et al., 1980; Tomlinson et al., 2001). These formations were
intruded by Late Cretaceous to Paleogene granitoid stocks (Thomas, 1967; Galli, 1968) (Fig. 1b) and
were deformed during the Incaic phase of the Andean orogenic cycle (Noble et al., 1979). Following this
deformation event, an Oligo-Miocene succession consists of thick sequences of ignimbrites and gravels
(Altos de Pica, Luja and Guaviña formations; Galli, 1957; Galli and Dingman, 1962; Pacci et al., 1980;
Tomlinson et al., 2001). North-trending faults are the dominant structures (Fig. 1b), delimiting the horsts
of the Sierra Juan de Morales and Sierra de Tarapacá (Galli, 1968) to the north of Yabricoya area. The
Palaeozoic and Mesozoic basement has experienced continuous uplift between these faults since the
initial Incaic Phase and subsequent Miocene uplift of the Altiplano. The area is incised by numerous
west-southwest trending valleys (Fig. 1b), among which the Quebrada de Tarapacá (Bouzari and Clark,
2002) exposes the volcanic rocks hosting the Patricia ore deposit.
The Paguanta Mining Exploration Project includes a proven economic deposit (Patricia) and two
prospects (La Rosa and Doris) in an area of around 40 km2 (Fig. 2a). Patricia is an economic Zn-Pb-Ag
vein-type mineralization containing mainly pyrite, sphalerite, galena and Ag-sulfosalts and hosted by
hydrothermally altered andesitic rocks of uncertain age. Estimated mineral resources are 4.53 Mt, grading
3.7 % Zn, 1.3 % Pb, 83 g/t Ag and 0.2 g/t Au using a 2 % Zn cut-off grade (June 2012,
www.herenciaresources.com). The La Rosa prospect, located to the north of Patricia, consists of an
intensely leached area with argillic alteration that extends to the Patricia area and is likely part of the same
mineralizing system. The extension of the La Rosa prospect is well defined by a strong geophysical
anomaly obtained through airborne gravimeters and covering more than 3 km2. In spite of intense
weathering, rocks have anomalously high contents of lead (0.41 %), zinc (1.06 %), copper (0.04 %), gold
ACC
EPTE
D M
ANU
SCR
IPT
ACCEPTED MANUSCRIPT
6
(0.22 g/t) and silver (15.6 g/t). The Doris prospect is located north-northeast of Patricia and consists of a
strongly altered zone with fractures filled with secondary copper minerals, mostly chrysocolla and
malachite (Roel et al., 2013). Several sections of drill holes returned up to 2.5% Cu and 50 g/t Ag.
The country rocks in the Paguanta area are mostly volcanic and volcano-clastic in nature, probably
correlative of the Cretaceous Cerro Empexa and Cauquima Formation (Galli and Dingman, 1962; Sayes,
1978). They exhibit a relatively complex structure of NW-SE- oriented asymmetrical folds. Detachment
and fault-propagation types are present, the latter associated with steeply dipping sinistral thrust faults,
which generally suppress a large part of the anticlinal short limbs. Folds and thrusts show vergence to
both the SW and NE, suggesting the existence of flower structures at various scales. At the kilometer
scale, the overall NW-SE orientation of folds and faults in the Paguanta area swings to more northerly
orientations towards the north (Fig. 2a), suggesting it may represent the western part of a sinistral strike-
slip duplex structure. This would be compatible with its location within the regionally important
Domeyko fault system, a largely sinistral transpressional belt that has been active since ca. 35 Ma ago
(Fig. 1b), a period during which 37km of accumulated sinistral displacement has been estimated (Dilles et
al., 1997; Tomlinson and Blanco, 1997b; Maksaev and Zentilly, 1999; Campbell et al., 2006).
3. Analytical methods
In order to carry out mineralogical, geochemical and fluid inclusion studies, representative samples
were selected from 206 exploration cores drilled by Herencia Resources Plc and from surface exposures.
Detailed logging of more than 200 meters of 12 drill cores (8 in the eastern block and 4 in western block,
see below) was performed to determine vein mineral relationships, textures and hydrothermal alteration
patterns. A total of 221 polished thin sections were prepared and studied by transmitted and reflected light
optical microscopy. Most of them correspond to the eastern block where the mineralization is better
developed.
A semi-quantitative determination of the mineralogy of host rocks and mineralized veins was
performed by X-ray diffraction (XRD) using a Siemens D500 XRD diffractometer with Cu Kα radiation
and a graphite monochromator. The bulk mineralogy was studied in non-oriented powders and clay
minerals in oriented aggregates prepared with the < 2 μm fraction. The < 2 μm clay fraction was
ACC
EPTE
D M
ANU
SCR
IPT
ACCEPTED MANUSCRIPT
7
sedimented from an aqueous suspension according to Stokes law (Moore and Reynolds, 1989). These
oriented aggregates were air dried, treated with ethylene glycol and heated to 550 °C/2 h and then
analyzed. Random powders were scanned from 2 to 65° and oriented aggregates were scanned from 2 to
30° 2θ with a scan speed of 0.02° 2θ/s.
The chemical compositions of ore minerals including base metal sulfides and Ag-bearing phases
were determined by electron microprobe in 73 samples using a JEOL Superprobe JXA-8900 at the Centro
Nacional de Microscopía Electrónica of the Universidad Complutense of Madrid, and a CAMECA
Electron Microprobe Analyzer SX-50 at the Serveis Cientifico-tècnics of the Universitat of Barcelona. Kα
X-ray lines were measured for: S, As, Fe, Co, Ni, Cu, Zn, Ag, Au, Cd, Sb, Te, Pb and Bi. The
accelerating voltage was 20kV; 50 nA beam current and 1-5 µm beam diameter. Counting times ranged
from 20 to 60s. The following standards were used: Galena, GaAs, Fe, NiCrCo, Cu, Zn, Ag, Au, Cd,
GaSb, Te and Bi from the Smithsonian Institution and Harvard University (Jarosewich et al., 1980;
McGuire et al., 1992).
Ten representative vein samples containing base metal sulfides and Ag-bearing phases were analyzed
for whole-ore composition in Genalysis Laboratory Services Pty. Ltd., Maddington (Australia). Ag, As,
Bi, Cd, Co, Mo, Se and Te contents were measured by inductively coupled plasma mass spectrometry
(ICP-MS, multi-acid digest); Cu, Pb and Zn contents by inductively coupled plasma atomic emission
spectrometry (ICP-OES, multi-acid digest); Au content by inductively coupled plasma mass spectrometry
(ICP-MS, lead collection fire assay) and S content by infrared spectrometry. Linear regression and
correlation between pairs of elements were computed using robust methods. These mathematical methods
are appropriate for estimating correlation coefficients when samples are heterogeneous and the
assumptions of normality and homoscedasticity required by classical statistical procedures cannot be
guaranteed. Moreover, these methods are less influenced by anomalous data (outliers) than other classical
methods. We computed correlation coefficients and p-value of the linear regression model with the lmrob
function of the R package robustbase. The lmrob function uses fast MM-type estimators for linear
regression models (Maronna et al., 2006).
ACC
EPTE
D M
ANU
SCR
IPT
ACCEPTED MANUSCRIPT
8
Fluid inclusion chips were prepared from 13 core samples located between 94 m (lower limit of the
superficial oxidized zone) and 230 m (lower depth reached by drilling) below present surface. The study
of 108 fluid inclusions contained in 26 FIAs in these samples consisted of petrographic observations and
microthermometric, laser ablation inductively coupled plasma mass-spectrometry (LA-ICP-MS) analyses
and Raman spectroscopic analysis. Samples were selected in the Catedral vein drill cores as it is the
largest and the best drilled vein in the deposit. This allowed a thorough sampling both at different depths
(in order to check the occurrence of boiling) and along the vein strike. Besides the sample position in the
deposit, the main criterion was selecting samples where quartz and/or sphalerite were well represented.
This study was carried out in the Fluid Inclusions Laboratories of the Department of Crystallography and
Mineralogy at the Complutense University of Madrid (Spain) and Virginia Tech in Blacksburg (USA).
Fluid inclusion assemblages (FIAs) representing groups of inclusions that were trapped simultaneously
(Bodnar, 2003; Goldstein and Reynolds, 1994) were identified based on detailed petrographic
observations. Heating-freezing measurements were made on previously defined FIAs. Fluid inclusion
homogenization and final ice melting temperatures were obtained using a Linkam heating-freezing stage
(THMS600) mounted on an Olympus microscope. Salinity was calculated from final ice melting
temperatures using the equation of Bodnar (1993) for the NaCl-H2O system. The stage was calibrated
using synthetic fluid inclusion standards (Sterner and Bodnar, 1984). The precision and accuracy of
measured homogenization temperatures are estimated to be ±1.0 C and the precision and accuracy of ice-
melting temperatures are estimated to be ± 0.1C.
The elemental concentrations of 46 individual fluid inclusions were measured using laser ablation-
inductively coupled plasma-mass spectrometry (LA-ICP-MS). The LA-ICP-MS equipment consists of a
193 nm GeoLasPro Excimer Laser Ablation system coupled to an Agilent 7500ce inductively coupled
plasma mass spectrometer. Fluid inclusions were ablated with a laser beam diameter selected such that
the inclusion was wholly encompassed within the ablation pit. A NIST610 glass standard was analyzed
before and after each sample for calibration and to correct for drift. For all inclusions, we analyzed for Au
(dwell time: 50 milliseconds), Ag (dwell time: 30 milliseconds), Al, As, B, Ca, Cd, Cu, Fe, Ge, K, Mg,
Na, Pb, Sb, Se, Si, Re, Te and Zn (dwell time: 10 milliseconds). Data processing was carried out using the
ACC
EPTE
D M
ANU
SCR
IPT
ACCEPTED MANUSCRIPT
9
AMS software (Mutchler et al., 2008). Ag, As, Au, Cd, Cu, Re and Te concentrations were less than their
detection limits in all analyzed samples with detection limits at 1 ppm. Qualitative element compositions
of the host mineral were also indirectly obtained during ablation to intercept fluid inclusions.
Raman analyses were performed using a laser Raman micro-probe based on the Horiba LabRam-
HR800 design with a high-resolution 800-mm spectrograph and equipped with an air-cooled 514-nm
(green) argon laser set at 50 mW for excitation. The goal of the Raman analysis was to test for the
presence of CO2 and to identify clay minerals in fluid inclusions. Data management and analysis were
performed using the statistical software R 3.1.2 (R Core Team 2014).
4. The Patricia Zn-Pb-Ag ore deposit
The Patricia ore deposit crops out in a small area of ~2 km2 in which the following lithological units
can be distinguished (Figs. 2b – 3a):
1) Pre-mineralization units consist of: (1.1) a lower sedimentary succession which is represented by
tightly folded and subvertical shales, sandstones and quartz-arenites, located NE of the Patricia
mineralization and probably correlative to the Jurassic Noasa Formation elsewhere (Harambour, 1990);
and (1.2) an upper volcano-sedimentary unit which hosts the Patricia mineralization and consists of a
succession of subaerial, andesitic volcanic rocks, including breccias, pyroclasts, agglomerates, tuffs,
lapilli and lavas, commonly affected by regional pervasive propylitic alteration. The volcano-sedimentary
unit is folded and fractured along northwest-trending faults. The age of these rocks is uncertain, although
a correlation with the Cretaceous Cerro Empexa and Cauquima Formations has been suggested (Galli and
Dingman, 1962; Sayes, 1978).
2) Apart from slope debris, post-mineralization units are mainly represented by: (2.1) an ignimbrite
sequence which unconformably overlies the folded volcano-sedimentary unit and the Patricia ore deposit
at its southern end; and (2.2) a non-consolidated polygenic breccia that hosts variably-sized
heterogeneous blocks of ignimbrite, andesite, quartzite, porphyritic rocks, hematite ore and granitoids.
Four main E-W- to ENE-WSW-oriented mineralized vein systems are recognized in the area, named
from north to south, Campamento, Central, Catedral (Fig. 2b - 3a) and Carlos. These vein systems are
ACC
EPTE
D M
ANU
SCR
IPT
ACCEPTED MANUSCRIPT
10
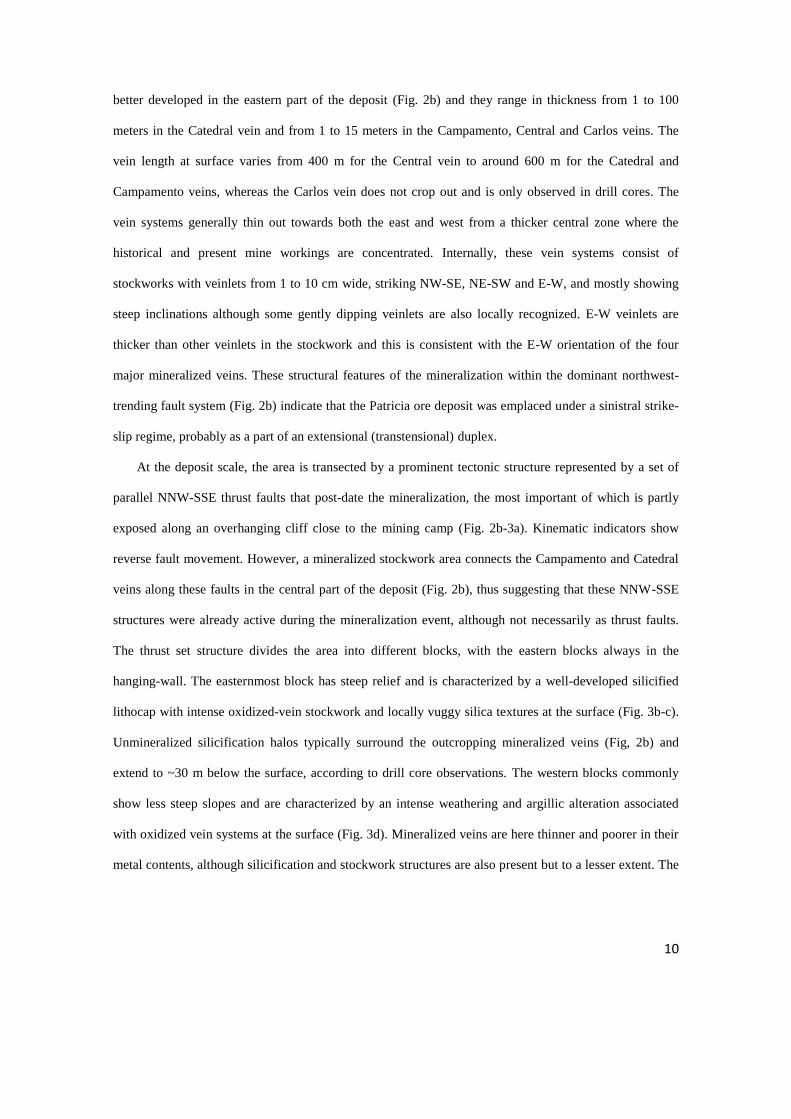
better developed in the eastern part of the deposit (Fig. 2b) and they range in thickness from 1 to 100
meters in the Catedral vein and from 1 to 15 meters in the Campamento, Central and Carlos veins. The
vein length at surface varies from 400 m for the Central vein to around 600 m for the Catedral and
Campamento veins, whereas the Carlos vein does not crop out and is only observed in drill cores. The
vein systems generally thin out towards both the east and west from a thicker central zone where the
historical and present mine workings are concentrated. Internally, these vein systems consist of
stockworks with veinlets from 1 to 10 cm wide, striking NW-SE, NE-SW and E-W, and mostly showing
steep inclinations although some gently dipping veinlets are also locally recognized. E-W veinlets are
thicker than other veinlets in the stockwork and this is consistent with the E-W orientation of the four
major mineralized veins. These structural features of the mineralization within the dominant northwest-
trending fault system (Fig. 2b) indicate that the Patricia ore deposit was emplaced under a sinistral strike-
slip regime, probably as a part of an extensional (transtensional) duplex.
At the deposit scale, the area is transected by a prominent tectonic structure represented by a set of
parallel NNW-SSE thrust faults that post-date the mineralization, the most important of which is partly
exposed along an overhanging cliff close to the mining camp (Fig. 2b-3a). Kinematic indicators show
reverse fault movement. However, a mineralized stockwork area connects the Campamento and Catedral
veins along these faults in the central part of the deposit (Fig. 2b), thus suggesting that these NNW-SSE
structures were already active during the mineralization event, although not necessarily as thrust faults.
The thrust set structure divides the area into different blocks, with the eastern blocks always in the
hanging-wall. The easternmost block has steep relief and is characterized by a well-developed silicified
lithocap with intense oxidized-vein stockwork and locally vuggy silica textures at the surface (Fig. 3b-c).
Unmineralized silicification halos typically surround the outcropping mineralized veins (Fig, 2b) and
extend to ~30 m below the surface, according to drill core observations. The western blocks commonly
show less steep slopes and are characterized by an intense weathering and argillic alteration associated
with oxidized vein systems at the surface (Fig. 3d). Mineralized veins are here thinner and poorer in their
metal contents, although silicification and stockwork structures are also present but to a lesser extent. The
ACC
EPTE
D M
ANU
SCR
IPT
ACCEPTED MANUSCRIPT
11
occurrence of chert, amorphous silica, jasperoids and calcite in or close to the surface is also common in
the westernmost part of the deposit (Fig. 3e-f).
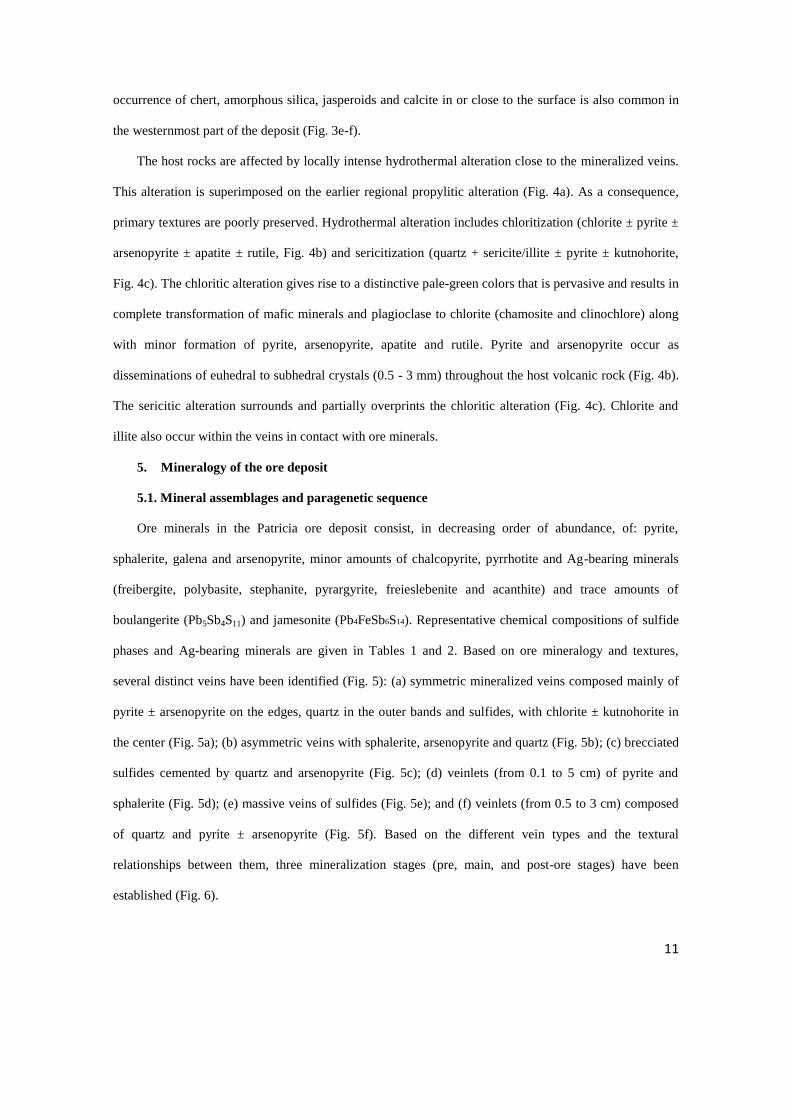
The host rocks are affected by locally intense hydrothermal alteration close to the mineralized veins.
This alteration is superimposed on the earlier regional propylitic alteration (Fig. 4a). As a consequence,
primary textures are poorly preserved. Hydrothermal alteration includes chloritization (chlorite ± pyrite ±
arsenopyrite ± apatite ± rutile, Fig. 4b) and sericitization (quartz + sericite/illite ± pyrite ± kutnohorite,
Fig. 4c). The chloritic alteration gives rise to a distinctive pale-green colors that is pervasive and results in
complete transformation of mafic minerals and plagioclase to chlorite (chamosite and clinochlore) along
with minor formation of pyrite, arsenopyrite, apatite and rutile. Pyrite and arsenopyrite occur as
disseminations of euhedral to subhedral crystals (0.5 - 3 mm) throughout the host volcanic rock (Fig. 4b).
The sericitic alteration surrounds and partially overprints the chloritic alteration (Fig. 4c). Chlorite and
illite also occur within the veins in contact with ore minerals.
5. Mineralogy of the ore deposit
5.1. Mineral assemblages and paragenetic sequence
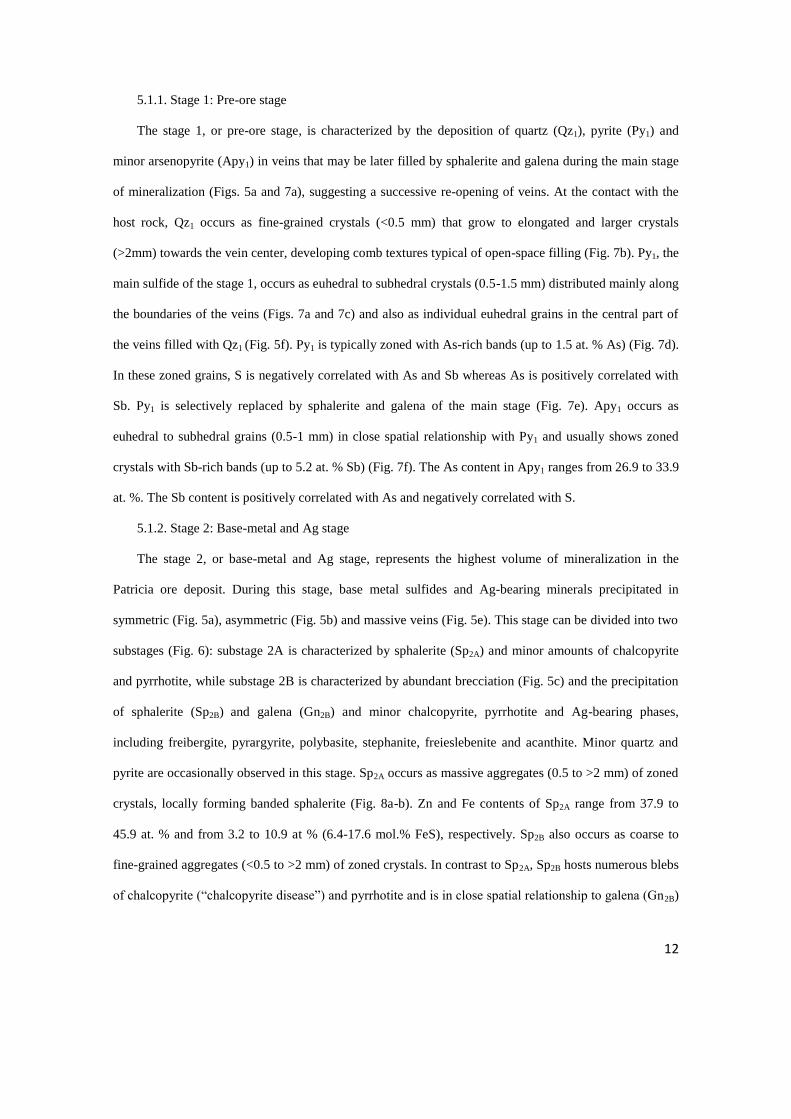
Ore minerals in the Patricia ore deposit consist, in decreasing order of abundance, of: pyrite,
sphalerite, galena and arsenopyrite, minor amounts of chalcopyrite, pyrrhotite and Ag-bearing minerals
(freibergite, polybasite, stephanite, pyrargyrite, freieslebenite and acanthite) and trace amounts of
boulangerite (Pb5Sb4S11) and jamesonite (Pb4FeSb6S14). Representative chemical compositions of sulfide
phases and Ag-bearing minerals are given in Tables 1 and 2. Based on ore mineralogy and textures,
several distinct veins have been identified (Fig. 5): (a) symmetric mineralized veins composed mainly of
pyrite ± arsenopyrite on the edges, quartz in the outer bands and sulfides, with chlorite ± kutnohorite in
the center (Fig. 5a); (b) asymmetric veins with sphalerite, arsenopyrite and quartz (Fig. 5b); (c) brecciated
sulfides cemented by quartz and arsenopyrite (Fig. 5c); (d) veinlets (from 0.1 to 5 cm) of pyrite and
sphalerite (Fig. 5d); (e) massive veins of sulfides (Fig. 5e); and (f) veinlets (from 0.5 to 3 cm) composed
of quartz and pyrite ± arsenopyrite (Fig. 5f). Based on the different vein types and the textural
relationships between them, three mineralization stages (pre, main, and post-ore stages) have been
established (Fig. 6).
ACC
EPTE
D M
ANU
SCR
IPT
ACCEPTED MANUSCRIPT
12
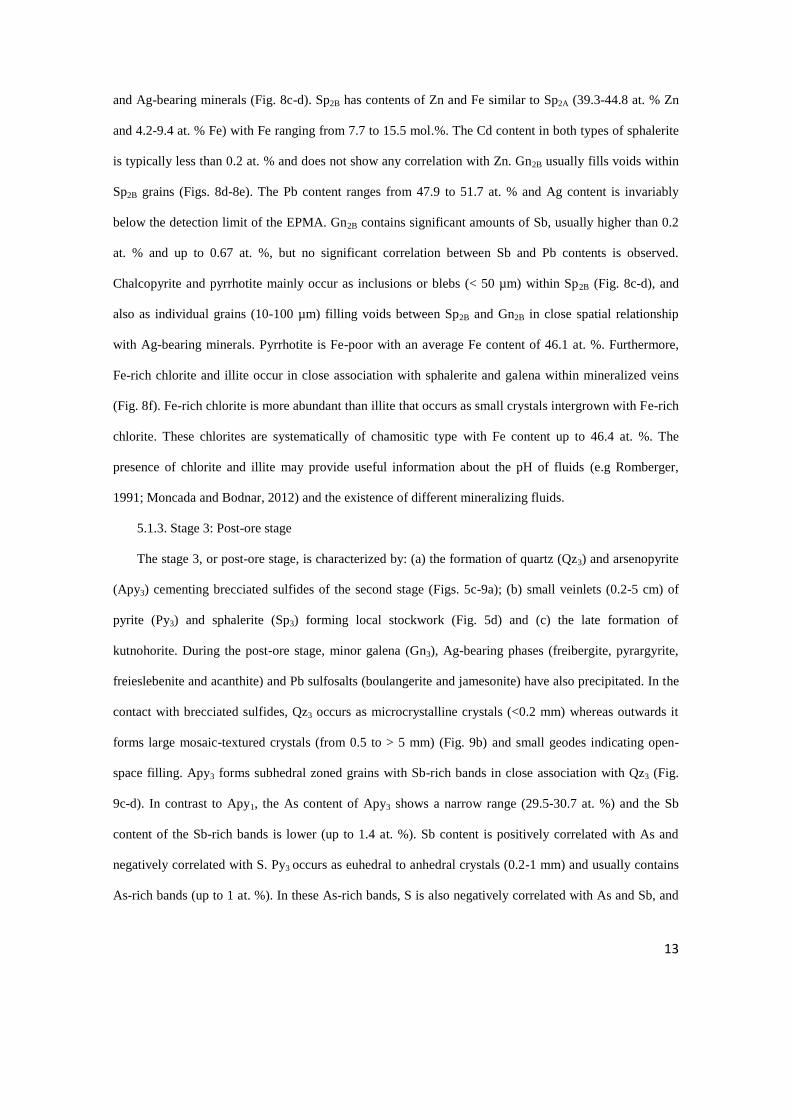
5.1.1. Stage 1: Pre-ore stage
The stage 1, or pre-ore stage, is characterized by the deposition of quartz (Qz1), pyrite (Py1) and
minor arsenopyrite (Apy1) in veins that may be later filled by sphalerite and galena during the main stage
of mineralization (Figs. 5a and 7a), suggesting a successive re-opening of veins. At the contact with the
host rock, Qz1 occurs as fine-grained crystals (<0.5 mm) that grow to elongated and larger crystals
(>2mm) towards the vein center, developing comb textures typical of open-space filling (Fig. 7b). Py1, the
main sulfide of the stage 1, occurs as euhedral to subhedral crystals (0.5-1.5 mm) distributed mainly along
the boundaries of the veins (Figs. 7a and 7c) and also as individual euhedral grains in the central part of
the veins filled with Qz1 (Fig. 5f). Py1 is typically zoned with As-rich bands (up to 1.5 at. % As) (Fig. 7d).
In these zoned grains, S is negatively correlated with As and Sb whereas As is positively correlated with
Sb. Py1 is selectively replaced by sphalerite and galena of the main stage (Fig. 7e). Apy1 occurs as
euhedral to subhedral grains (0.5-1 mm) in close spatial relationship with Py1 and usually shows zoned
crystals with Sb-rich bands (up to 5.2 at. % Sb) (Fig. 7f). The As content in Apy1 ranges from 26.9 to 33.9
at. %. The Sb content is positively correlated with As and negatively correlated with S.
5.1.2. Stage 2: Base-metal and Ag stage
The stage 2, or base-metal and Ag stage, represents the highest volume of mineralization in the
Patricia ore deposit. During this stage, base metal sulfides and Ag-bearing minerals precipitated in
symmetric (Fig. 5a), asymmetric (Fig. 5b) and massive veins (Fig. 5e). This stage can be divided into two
substages (Fig. 6): substage 2A is characterized by sphalerite (Sp2A) and minor amounts of chalcopyrite
and pyrrhotite, while substage 2B is characterized by abundant brecciation (Fig. 5c) and the precipitation
of sphalerite (Sp2B) and galena (Gn2B) and minor chalcopyrite, pyrrhotite and Ag-bearing phases,
including freibergite, pyrargyrite, polybasite, stephanite, freieslebenite and acanthite. Minor quartz and
pyrite are occasionally observed in this stage. Sp2A occurs as massive aggregates (0.5 to >2 mm) of zoned
crystals, locally forming banded sphalerite (Fig. 8a-b). Zn and Fe contents of Sp2A range from 37.9 to
45.9 at. % and from 3.2 to 10.9 at % (6.4-17.6 mol.% FeS), respectively. Sp2B also occurs as coarse to
fine-grained aggregates (<0.5 to >2 mm) of zoned crystals. In contrast to Sp2A, Sp2B hosts numerous blebs
of chalcopyrite (“chalcopyrite disease”) and pyrrhotite and is in close spatial relationship to galena (Gn2B)
ACC
EPTE
D M
ANU
SCR
IPT
ACCEPTED MANUSCRIPT
13
and Ag-bearing minerals (Fig. 8c-d). Sp2B has contents of Zn and Fe similar to Sp2A (39.3-44.8 at. % Zn
and 4.2-9.4 at. % Fe) with Fe ranging from 7.7 to 15.5 mol.%. The Cd content in both types of sphalerite
is typically less than 0.2 at. % and does not show any correlation with Zn. Gn2B usually fills voids within
Sp2B grains (Figs. 8d-8e). The Pb content ranges from 47.9 to 51.7 at. % and Ag content is invariably
below the detection limit of the EPMA. Gn2B contains significant amounts of Sb, usually higher than 0.2
at. % and up to 0.67 at. %, but no significant correlation between Sb and Pb contents is observed.
Chalcopyrite and pyrrhotite mainly occur as inclusions or blebs (< 50 µm) within Sp2B (Fig. 8c-d), and
also as individual grains (10-100 µm) filling voids between Sp2B and Gn2B in close spatial relationship
with Ag-bearing minerals. Pyrrhotite is Fe-poor with an average Fe content of 46.1 at. %. Furthermore,
Fe-rich chlorite and illite occur in close association with sphalerite and galena within mineralized veins
(Fig. 8f). Fe-rich chlorite is more abundant than illite that occurs as small crystals intergrown with Fe-rich
chlorite. These chlorites are systematically of chamositic type with Fe content up to 46.4 at. %. The
presence of chlorite and illite may provide useful information about the pH of fluids (e.g Romberger,
1991; Moncada and Bodnar, 2012) and the existence of different mineralizing fluids.
5.1.3. Stage 3: Post-ore stage
The stage 3, or post-ore stage, is characterized by: (a) the formation of quartz (Qz3) and arsenopyrite
(Apy3) cementing brecciated sulfides of the second stage (Figs. 5c-9a); (b) small veinlets (0.2-5 cm) of
pyrite (Py3) and sphalerite (Sp3) forming local stockwork (Fig. 5d) and (c) the late formation of
kutnohorite. During the post-ore stage, minor galena (Gn3), Ag-bearing phases (freibergite, pyrargyrite,
freieslebenite and acanthite) and Pb sulfosalts (boulangerite and jamesonite) have also precipitated. In the
contact with brecciated sulfides, Qz3 occurs as microcrystalline crystals (<0.2 mm) whereas outwards it
forms large mosaic-textured crystals (from 0.5 to > 5 mm) (Fig. 9b) and small geodes indicating open-
space filling. Apy3 forms subhedral zoned grains with Sb-rich bands in close association with Qz3 (Fig.
9c-d). In contrast to Apy1, the As content of Apy3 shows a narrow range (29.5-30.7 at. %) and the Sb
content of the Sb-rich bands is lower (up to 1.4 at. %). Sb content is positively correlated with As and
negatively correlated with S. Py3 occurs as euhedral to anhedral crystals (0.2-1 mm) and usually contains
As-rich bands (up to 1 at. %). In these As-rich bands, S is also negatively correlated with As and Sb, and
ACC
EPTE
D M
ANU
SCR
IPT
ACCEPTED MANUSCRIPT
14
As is positively correlated with Sb as in Py1. Sp3 is similar to Sp1 and Sp2 and also occurs as massive
aggregates of zoned crystals (Fig. 9e-f). Zn and Fe contents of Sp3 are also similar to those of Sp1 and
Sp2, ranging from 40.8 to 44.9 at. % and from 3.9 to 7.8 at. %, respectively (7.5-13.2 mol.% FeS). The Cd
content of Sp3 is less than 0.13 at. % and does not correlate with Zn. Gn3 occurs as minor aggregates and
shows a narrow range in Pb content (46.3-48.6 at. %) and contains significant amounts of Sb (average 0.4
at. % and up to 1.9 at. %). The Ag content, in most analyzed Gn3 grains, is below the detection limit of the
EPMA. Freieslebenite, boulangerite and jamesonite, with grain sizes ranging from 5 to 25 µm, occur in
close relationship with Ag-bearing minerals and filling voids within Gn3 (Fig. 9h). Kutnohorite,
interpreted as the last mineral that precipitated in the paragenetic sequence, occurs as euhedral and
subeuhedral grains forming narrow veins that cross-cut the brecciated sulfides of the second stage (Fig.
9g).
5.2. Mineralogy and chemistry of Ag-bearing minerals
A total of 230 grains of Ag-bearing phases were identified and analyzed in 30 polished thin sections.
Ag-bearing minerals are present in substage 2B in close textural relationship to galena (more than 80 % of
the Ag-bearing minerals are located within galena), sphalerite and chalcopyrite and also in the post-ore
stage in close relationship to kutnohorite and minor sulfides. The Ag-bearing minerals identified are, in
decreasing order of abundance, freibergite, polybasite, stephanite, pyrargyrite, freieslebenite and
acanthite. They regularly occur as anhedral grains ranging in size from less than 10 µm up to 200 µm, but
average around 40 µm and usually are located at the boundaries of galena and sphalerite or close to the
contact with sphalerite, chalcopyrite and pyrite (Fig. 10). Representative analyses of different Ag-bearing
phases are reported in Table 2.
Freibergite (Ag, Cu)10(Fe, Zn)2Sb4S13 represents 90% of the total Ag phases identified. It occurs as
anhedral grains (15-500 µm but commonly < 60 µm) located at the boundaries of Gn2B and Sp2B grains
and close to the contact with pyrite, chalcopyrite, silicates and kutnohorite (Fig. 10a-b). The Fe and Zn
content in individual grains of freibergite is homogeneous and has an Fe content systematically higher
than Zn. Ag ranges from 11 to 21.7 at. % with an average of 15.1 at. %, and Cu ranges from 13.3 to 23.9
at. % with an average of 19.4 at. %. Arsenic content is invariably below 0.2 at. %.
ACC
EPTE
D M
ANU
SCR
IPT
ACCEPTED MANUSCRIPT
15
Polybasite (Ag, Cu)16(Sb, As)2S11 typically forms fine-grained crystals (10-60 µm) intergrowth with
freibergite (Fig. 10a) or elongated grains along cleavage planes within Gn2B crystals (Fig. 10c). Unlike
freibergite, polybasite is invariably contained within galena and has not been observed within sphalerite.
Electron microprobe analyses reveal that Ag content ranges from 46.9 to 49.8 at. % with minor
substitution by Cu (up to 1.5 apfu). Sb content ranges from 5.6 to 8.7 at. % and As content is below 0.3 at.
%.
Pyrargyrite (Ag3SbS3) occurs as anhedral grains (5-40 μm) disseminated within Gn2B, Gn3 and
commonly in close relationship with kutnohorite (Fig. 10d). It is particularly common in samples with
high modal abundance of Ag-bearing minerals. Its composition is almost stoichiometric with Ag content
around 43.7 at. %.
Stephanite (Ag5SbS4) is a very minor Ag-rich sulfosalt in the Patricia ore deposit and commonly
coexists with polybasite and freibergite with grain sizes of up to 30 µm. It contains 53.7 - 55.7 at. % Ag
and up to 3 at.% Cu.
Freieslebenite (AgPbSbS3) forms small-elongated 30 to 200 µm grains within galena (Fig. 10e), and
it is also in close relationship to other Pb sulfosalts such as boulangerite and jamesonite. Ag and Pb
contents range from 16.9 to 19 at. % and from 12.4 to 12.7 at. %, respectively.
Acanthite (Ag2S) represents the most Ag-rich mineral (from 60 to 71.1 at. %) found in the Patricia
ore deposit. However, it is a very minor phase and usually occurs as anhedral 5 to 10 μm grains, closely
related to freibergite and pyrargyrite (Fig. 10f). It is also observed at the boundaries between sphalerite
and galena or in close relationship to kutnohorite.
6. Whole-ore composition of the mineralized veins
Results of multi-element analyses for selected ore samples are given in Table 3. Matrices of
statistically significant correlations and scatterplots for pairs of elements in whole-ore samples are given
in Fig. 11. According to the p-value of the robust linear regression, analyzed metals can be classified into
two groups. The first group is comprised of the metals positively correlated with Ag, namely Zn, Pb, Cu
and Cd, and the second group by the metals positively correlated with Au, namely As, Sb, Ge and W. No
additional correlations have been observed between the remaining analyzed elements and the metals of
ACC
EPTE
D M
ANU
SCR
IPT
ACCEPTED MANUSCRIPT
16
both groups. The relative abundances of Zn and Pb can be expressed as simple ratios (e.g. Pb/Zn) or as
the zinc ratio 100*Zn/(Zn+Pb), defined by Huston and Large (1987) for massive sulfide systems. Huston
et al. (2006) extended the use of this ratio to Zn-Pb-Ag ore deposits. According to these authors the zinc
ratio is controlled mostly by metal solubilities in the ore fluid and the metal content of the source rocks,
establishing relationships between temperature and salinity of the fluids and the zinc ratio of whole-ore
composition. In the Patricia ore deposit, the zinc ratio of mineralized veins range from 37.3 in galena-rich
samples to 92.8 in sphalerite-rich samples, although the average is 64.4 (standard deviation, 13.81). The
Ag:Zn ratio ranges from 0.001 to 0.016 with an average of 0.005 (1:206). The Au content is below 1 ppm
in all samples and the Ag:Au ratio ranges from 200 to 6000 (average, 1300).
7. Fluid inclusions microthermometry and LA-ICP-MS
Fluid inclusion assemblages (FIAs) have been studied in quartz from the pre-ore stage (Qz1) and
post-ore stage (Qz3), and sphalerite (Sp2A and Sp2B) from the base-metal and Ag stage. According to
Bodnar (2003) and Goldstein and Reynolds (1994) an FIA refers to a group of fluid inclusions that were
all trapped at the same time. Assuming that all of the fluid inclusions within an FIA show the same room
temperature phase ratios and microthermometric behaviour, one can assume that the inclusions record the
original trapping conditions. Fluid inclusions at the Patricia deposit are systematically liquid-rich at room
temperature and do not contain recognisable CO2. Both primary and secondary fluid inclusions have been
identified in the system. Primary fluid inclusions are distributed along growth zones (Fig. 12a-c) and
represent the fluid from which the host mineral precipitated. Secondary fluid inclusions (Fig. 12d) occur
along fracture planes and represent fluids trapped after host-mineral precipitation. Fluid inclusions whose
origin is not clearly primary or secondary have only been incorporated in the paragenesis when they show
specific features that constrain the time of trapping (i.e. such as when a fluid inclusion forms around a
chalcopyrite bleb within sphalerite, indicating that the inclusion and chalcopyrite are coeval; Fig. 12e).
7.1 Pre – ore stage. A total of 39 fluid inclusions (9 FIAs) were studied in Qz1 (Fig. 7b) located at
the outer bands of symmetric mineralized veins. Fine-grained Qz1 crystals occurring at and close to the
vein walls do not contain fluid inclusion suitable for being studied. Therefore, fluid inclusion data were
obtained in Qz1 larger crystals occurring vein inwards as comb-type quartz grains and in close proximity
ACC
EPTE
D M
ANU
SCR
IPT
ACCEPTED MANUSCRIPT
17
to the stage 2 base-metal sulfides. Primary FIAs are scarce (Fig. 12a-b) whereas secondary trails of FIAs
are common but the inclusions in the FIA are smaller than those in FIAs containing primary fluid
inclusions (Fig. 12d). Salinities estimated from primary FIAs range from 22 to 6 wt % NaCl and from
secondary FIAs vary from 15 to 3 wt % NaCl. Homogenization temperatures (Th) from primary FIAs
range from 236 to 205 °C and from 270 to 165°C for secondary FIAs (Table 4). Both primary and
secondary FIAs frequently contain a fibrous mineral with distinct Raman peaks at 204, 262, 355, 395,
466, 698, 798 and 1167 cm-1
, suggesting that the fibrous mineral is a hydrous phyllosilicate, interpreted as
illite (Fig. 12b).
7.2 Base - metal and silver stage. A total of 62 fluid inclusions (13 FIAs) were studied in sphalerite,
Sp2A and Sp2B, of the substages 2A and 2B, respectively. FIAs in Sp2A are common, usually showing
elongated fluid inclusions along growth bands in zoned sphalerite (Fig. 12c). Primary fluid inclusions are
usually larger than secondary inclusions, which commonly form trails cross-cutting growth bands within
the Sp2A. Salinities estimated from primary FIAs of substage 2A range from 9 to 1 wt % NaCl and for
secondary FIAs from 4 to 3 wt % NaCl. Homogenization temperatures (Th) from primary FIAs range
from 248 to 172°C and from 197 to 195°C for secondary FIAs (Table 4). FIAs in Sp2B were more
difficult to study than those in Sp2A, because Sp2B is more Fe-rich and darker, hindering the identification
of fluid inclusions (Fig. 12e). Fluid inclusions observed in Sp2B are commonly associated with solid
inclusion of minor sulfides such as chalcopyrite, pyrrhotite and Ag-bearing minerals (Fig. 12e). Salinity
values from primary FIAs range from 10 to 2 wt % NaCl and Th from 182 to 138°C.
7.3 Post - ore stage. A total of 19 fluid inclusions (4 FIAs) were studied in large mosaic-textured
Qz3 quartz crystals. Fluid inclusions were not observed in earlier microcrystalline Qz3 crystals. Primary
fluid inclusions are observed in the growth bands of quartz but their dark colour makes them impossible
to study (Fig. 12f). FIAs consisting of clear primary inclusions rarely occur (Fig. 12g). These fluid
inclusion are commonly small (∼ 10 µm), reporting salinity from 8 to 4 wt % NaCl and Th ranging from
215 to 175 °C (Table 4). Many secondary inclusions along fractures could be observed in Qz3 (Fig. 12h)
but only some could be studied because of their small sizes. FIAs of secondary inclusions have lower
ACC
EPTE
D M
ANU
SCR
IPT
ACCEPTED MANUSCRIPT
18
salinity, ranging from 4 to 2 wt % NaCl and Th ranging from 242 to 150 °C (Table 4). As observed in
Qz1, these FIAs have also trapped illite crystals.
LA-ICP-MS analyses were carried out on 46 individual inclusions. Fluid inclusions in quartz (stages
1 and 3) contain measurable concentrations of Na and commonly contain measureable concentrations of
K, Ca, Al and Sb. However, Al and Sb concentrations may reflect contributions from the host quartz.
Measurable concentrations of Fe are detected in 6 individual inclusions, and measurable concentrations of
Mg, Zn and Pb in 4 individual inclusions. Ag, As, Au, B, Cd, Cu, Ge, Re, Se and Te are below the
detection limit in all fluid inclusion in quartz. The Na content ranges from 5 to 340 ppm for inclusions in
quartz. In these inclusions, concentrations of Ca range from 2.2 to 183 ppm, K from 1.3 to 125 ppm and
Fe from 1 to 10 ppm. Strong correlation was observed between the Na content with Ca, K and Fe contents
and salinity calculated by microthermometry.
Fluid inclusions in sphalerite (stages 2A and 2B) also contain measurable concentrations of Na and
commonly contain measureable concentrations of K, Ca, Cd, Cu, Fe and Zn. However, Cd, Cu, Fe and Zn
concentrations may reflect contributions from the host sphalerite. Measurable concentrations of B (up to
14 ppm) are detected in 10 individual inclusions. Ag, Al, As, Au, Ge, Mg, Pb, Re, Se, Si and Te are
below the detection limit in all fluid inclusions in sphalerite. The Na content ranges from 3 to 73 ppm for
inclusions in sphalerite. In these inclusions, concentrations of Ca and K range from 1.3 to 43 ppm and
from 1.2 to 23 ppm, respectively. Strong correlation was observed between the Na content with Ca and K
contents and salinity calculated by microthermometry.
8. Discussion
8.1. Tectonic framework
The Patricia epithermal ore deposit was developed in an active tectonic system, as shown by its
structural features and internal vein textures. The main faults in the area strike N10-30W, whereas the
synthetic Riedel faults lie N50-70W. The extensional vector was located ~N-S, as indicated by the
mineralized structures occurring as parallel vein systems, E-W- to ENE-WSW-oriented, with stockwork
veinlets occurring along NW-SE, NE-SW and E-W orientations. These features indicate that the
mineralization formed under a sinistral strike-slip regime, which controlled the development of the
ACC
EPTE
D M
ANU
SCR
IPT
ACCEPTED MANUSCRIPT
19
mineralized structures and created open spaces where the mineralization was deposited. In fact,
transtensive domains with pull-apart and generalized extensional structures are suggested, as shown by
the infilling of veinlets of different orientations forming the stockwork. Furthermore, these veinlets were
continuously formed and/or repeatedly opened during the mineralization process as indicated by different
types of veinlets recognized in the deposit (Fig. 5), often showing open space filling textures, i.e.
symmetrical banding, crustification, quartz comb structures, etc. A strike-slip structural framework has
been also described in other epithermal deposits, such as the Pallancata deposit (Gamarra-Urrunaga et al.,
2013) and the Shila-Paula district in Peru (Chauvet et al., 2006), the Faride deposit in the Antofagasta
region, Chile (Camús and Skewes, 1991) and the Gandy and Abolhassani prospects in Iran (Shamanian et
al., 2004). In these deposits, the kinematics of the strike-slip structures also controlled mineral deposition
in parallel vein systems.
At a regional scale, the Patricia ore deposit is located in the Precordillera domain, which occupied the
Andean back-arc region during the Cretaceous (Mpodozis and Ramos, 1990). The main contractional
deformation event recorded in the Precordillera took place in the Eocene (Incaic Phase; Noble et al.,
1979). This event was coeval with the initial formation of the still active Bolivian orocline (Isacks, 1988;
Allmendinger, 2005; Arriagada et al., 2008; Capitanio et al., 2011), whose southern limb has since being
subjected to clockwise rotation accommodated by sinistral strike-slip along trench-parallel fault systems,
e.g. the Domeyko fault system. The Patricia deposit is located at the northern end of this fault system.
These regional constraints are in agreement with the features observed at the Patricia deposit and in
nearby rock units. The overall deformation of the host-rocks is compatible with the sinistral
transpressional regime during the Incaic Phase in this part of the Andes. The sinistral regime that is also
inferred from the structural characteristics of the deposit itself suggests that it may have formed during
later, post-folding stages within the same Incaic Phase or, alternatively, during a post-Incaic event with
similar kinematics. Whichever the case, the deposit was exhumed by the time of eruption of the
ignimbrite sequence that unconformably overlies its southern part (Fig. 2b). In the absence of absolute
ages for both the mineralization and the unconformable ignimbrites no further constraints on the timing
are possible. However, the above discussion reinforces the inclusion of the Patricia deposit within the late
ACC
EPTE
D M
ANU
SCR
IPT
ACCEPTED MANUSCRIPT
20
Eocene-early Oligocene metallogenetic belt. This interpretation is supported by the Patricia geographical
position (Fig. 1b), its proximity to the early Oligocene Queen Elizabeth porphyry copper deposit
(Davidson y Mpodozis, 1991) and its genetic, geometrical and kinematic relationships to the Domeyko
fault system, which is spatially and temporally coincident with the development of the metallogenic belt
(Sillitoe and Perelló, 2005; Sillitoe, 2010; and references therein).
The Patricia ore deposit is divided along its central part into two blocks (eastern and western)
separate from each other by a set of NNW-ESE-trending reverse faults. The kinematic movement on these
faults resulted in uplift of the eastern block (Fig. 3a), exhuming thicker and deeper parts of the deposit, as
confirmed by fluid inclusion data (see below). In contrast, a shallower part of the system is exposed in the
western block as suggested by the occurrence of cherts, cryptocrystalline silica and jasperoids (Fig. 3e-f),
which are absent in the eastern block. These siliceous formations are typical of thermal spring settings
(Camprubí et al., 2006).
8.2. Temperature and mechanisms of ore deposition
Based on the internal textures of veinlets and cross-cutting relationships among them, three main
mineralizing stages have been recognized in the Patricia deposit, with the second stage being the most
economically significant. The paragenesis of each stage and the evolution of the mineralizing fluids (Fig.
13) both indicate changes in mineralizing conditions over time.
8.2.1. Pre-ore stage
The pre-ore stage is defined by an early quartz Qz1 coexisting with pyrite Py1 and arsenopyrite Apy1.
Quartz grain size increases from vein walls inwards, where quartz crystals are often prismatic, thus
indicating a progressive decrease in silica super saturation as precipitation of quartz proceeded. Primary
fluid inclusions studied in coarse-grained Qz1 indicate a wide range of salinities, from high salinity close
to the NaCl saturation at room temperature to 6 wt % NaCl, and homogenization temperatures from 236
to 205 ºC. However, the lack of microthermometric data from fine-grained Qz1 does not allow knowing
the fluid features during the early pre-ore stage. The salinity and temperature range obtained for the late
pre-ore stage is in general agreement with fluid inclusion data from other intermediate sulfidation
epithermal deposits (Bodnar et al., 2014). The observed salinity variation within this stage strongly
ACC
EPTE
D M
ANU
SCR
IPT
ACCEPTED MANUSCRIPT
21
suggests a process of mixing between brine and a more diluted fluid (Fig. 13).. This stage is similar to the
initial stages in other epithermal deposits where quartz, pyrite ± arsenopyrite are typically deposited
during the earliest stages at the highest temperatures (e.g. El Bronce deposit, Camus et al., 1991; San
Cristóbal deposit, Phillipson and Romberger, 2004; La Guitarra deposit, Camprubí et al., 2006; Caylloma
district, Echavarría et al., 2006). The frequent presence of illite trapped within fluid inclusions in Qz1
(Fig. 13) indicates that pre-ore stage mineralization took place under slightly acidic conditions, because
illite is formed at pH from 5.8 to 6.3 (Romberger, 1991) and temperatures from 220 to 300 °C (Henley
and Ellis, 1983; Reyes, 1990), which are compatible with the obtained homogenization temperatures of
the pre-ore stage fluid inclusions. Py1 and Apy1 are commonly zoned showing alternating As-rich and Sb-
rich bands, respectively. This may reflect slight compositional variations of the mineralizing solutions as
an expression of disequilibrium and metastable conditions, as is commonly observed in epithermal
deposits (e.g. Carrillo-Rosúa et al., 2008).
8.2.2. Base-metal and Ag-bearing minerals stage
The main mineralizing event observed in the Patricia deposit is deposition of two generations of
sphalerite (Sp2A and Sp2B), galena (Gn2B) and minor amounts of pyrite, chalcopyrite, Ag-sulfosalts and
trace of pyrrhotite within Sp2B. Primary fluid inclusions studied in Sp2A and Sp2B indicate lower salinity
(2-10 wt % NaCl) and lower homogenization temperatures than in the pre-ore stage. Stage 2 is
characterized by a gradual cooling from 250 to 140ºC at constant low to moderate salinity. Ag-bearing
phases mainly occur at the end of this stage at temperatures ranging from 180 to 140ºC. The temperatures
indicated by fluid inclusions for the substage 2B are in agreement with those estimated using freibergite
as geothermometer. This geothermometer is based on the isotherms calculated by Sack (2005) using the
molar Ag/ (Ag + Cu) and Zn/ (Zn + Fe) ratio of freibergite (Fig. 14).The geothermometric analyses of
freibergite, which is the most abundant Ag-bearing phase in the Patricia deposit, suggest that most of the
silver mineralization took place in the interval from around 230 to less than 170 ºC, with most of the data
plotting below the 170ºC isotherm. Moreover, the occurrence of minor stephanite in the substage 2A also
marks another upper limit for Ag deposition at 197 ± 5ºC (e. g Keighin and Honea, 1969; Pallancata
deposit, Gamarra-Urrunaga et al., 2013). Freibergite compositions giving temperatures above 200ºC
ACC
EPTE
D M
ANU
SCR
IPT
ACCEPTED MANUSCRIPT
22
could represent re-equilibrated phases due to late higher temperature fluids that characterize the post-ore
stage (Fig. 13) (see below). In addition, the data in Fig.14 support the existence of a miscibility gap in
fahlores first predicted by O´Leary and Sack (1987) and confirmed by Sack et al. (2003) and Chutas and
Sack (2004).
Precipitation of ore minerals due to decreasing temperature in hydrothermal systems is generally the
result of either conductive loss of heat from the system or from mixing with a lower temperature fluid
(Leach and Corbett, 2008). Cooling has also been described in some deposit as the main deposition
process (e.g. San Cristobal deposit, Phillipson and Romberger, 2004) or as one of several mechanisms as
boiling or fluid mixing (e.g. Faride deposit, Camus and Skewes, 1991; El Barqueño and La Guitarra
deposits, Camprubí et al., 2006). Evidence in the Patricia deposit suggests that a combination of both
mixing and cooling likely occurred. As stated earlier, a decrease in fluid salinity between stage 1 and
stage 2 suggests possible dilution of an early brine due to mixing with a lower salinity fluid (e.g. Einaudi
et al., 2003; Sillitoe and Hedenquist, 2003; Simmons et al., 2005). However, cooling seems to be the most
important process responsible for the main stage of ore precipitation, as shown by fluid evolution during
stage 2. The LA-ICP-MS data from fluid inclusions also show evidence of dilution because the Na, Ca
and K contents decrease from stage 1 to stage 2. In addition, the model proposed by Sack (2005) for Ag-
Pb-Zn deposits, implying a primary high-temperature, high-Ag-galena phase that breaks down during
cooling and gives rise to the silver mineralization, provides a reasonable reference for the Patricia deposit,
which agrees with the cooling process recorded by fluid inclusions.
Sulfur and oxygen activities of the fluids during stage 2 have been estimated from the composition of
sphalerite in equilibrium with pyrite according to Barton et al. (1977). The composition of Sp2A and Sp2B
in equilibrium with pyrite ranges from 6 to 15 mol.% FeS and plots within the sulfide dominant field in
the sulfur vs. oxygen activity diagram (Fig. 15). Accordingly, sphalerite precipitated from a fluid with
sulfur activity between -12.2 and -12.5 and oxygen activity around -38. Additionally, the stability limits
for Ag-bearing and Pb-bearing minerals have been obtained of the sulfur activity vs temperature diagram
from Jasinski (1983).
8.2.3. Post-ore stage:
ACC
EPTE
D M
ANU
SCR
IPT
ACCEPTED MANUSCRIPT
23
The post-ore stage is defined by the deposition of quartz (Qz3), pyrite (Py3) and arsenopyrite (Apy3),
minor sphalerite and galena and the final precipitation of minor kutnohorite and trace amounts of Ag-
bearing and Pb-bearing minerals. Primary fluid inclusions studied within Qz3 indicate higher temperatures
(215-175 ºC) and similar salinity (8-2 wt % NaCl) compared to the previous substage 2B (Fig. 13).
The rise in the temperature of the circulating fluids from stage 2B to stage 3 could have been as much
as 75 degrees Centigrade. This fact poses two important questions: 1) did fluid inclusions in sphalerite
Sp2A and/or Sph2B re-equilibrate during the post-ore stage? and, therefore 2) are the obtained
microthermometric data reliable? As pointed out by Bodnar and Bethke (1984), overheating of sphalerite
may cause the fluid inclusions to stretch, leak or decrepitate, thus yielding incorrect microthermometric
data. According to these authors, the amount of overheating necessary to initiate stretching in sphalerite-
hosted inclusions depends, among other factors, on the inclusion size and shape, and the confining
pressure, ranging from <8ºC for inclusions several hundred m in diameter to >75ºC for 10 m-sized
inclusions at 1 bar confining pressure. Fluid inclusion sizes in the Patricia sphalerites are usually below
10 m, and only exceptionally reach 20 m (i.e. Fig. 12e). Regarding the confining pressure, fluid
inclusion data presented in this paper belong to sphalerite from cores samples located at depths below
present surface of 95 to 150 m (stage 2A) and 195 to 228 m (stage 2B) which, assuming hydrostatic
pressure conditions as indicated by the veins open-space filling textures, correspond to minimum
confining pressure around 10-15 bars and 20-23 bars, respectively. These cores were drilled in the
uplifted eastern block of the deposit, which exposes a deeper part of the mineralization than the western
blocks. This means that an unknown thickness of volcanic mineralized rocks has been already eroded and
then, real confining pressures should be higher than the values estimated above (see below for further
discussion on depth of ore deposition). According to Bodnar and Bethke (1984), the higher the confining
pressure, the greater the amount of overheating required to initiate stretching for a given inclusion
volume. Therefore, reequilibration of inclusions in sphalerite might have occurred due to the increase of
temperature from stage 2A to stage 2B, however the confining pressure was, most probably, high enough
to prevent stretching, even in the shallower sphalerite samples (94 m below present surface, see below).
ACC
EPTE
D M
ANU
SCR
IPT
ACCEPTED MANUSCRIPT
24
Therefore, microthermometric data from sphalerite-hosted inclusions presented in this work are
considered fully reliable.
In the post-ore stage, Qz3, Py3 and Apy3 commonly cement the brecciated sulfides of the main-ore
stage, so the increase of temperature and similar salinity of the fluids in the post-ore stage were
accompanied by brecciation and opening of spaces where the mineralization was ultimately deposited.
These breccias indicate either a sharp pressure drop, maybe leading to limited boiling, or just a tectonic
process. Boiling is not supported by fluid inclusion observations, and although the lack of fluid inclusion
evidence for boiling does not preclude its occurrence, tectonic processes are likely to have occurred given
the deposit active tectonic setting. However, according to Fig. 13, cooling is likely to be the main
mechanism of mineral deposition in this stage.
The formation of zoned Py3 and Apy3 with As-rich and Sb-rich bands, respectively, in equilibrium
with Qz3 suggests compositional variations in fluids similar to those observed in the pre-ore stage. During
the final events of the post-ore stage and after precipitation of most sulfides, minor kutnahorite and Ag-
bearing minerals such as freieslebenite and acanthite were precipitated. The presence in the late
depositional stages of carbonates is a typical characteristic of the latest stages in epithermal deposits
(Baumgartner et al., 2008; Canet et al., 2009; Catchpole et al., 2012; Sillitoe and Hedenquist, 2003) as a
result of a last fluid pulse after the main mineralizing event. In other epithermal deposits, Ag-bearing
minerals commonly precipitate during the last stages (e.g. Baumgartner et al., 2008; Bendezu and
Fonboté, 2009; Camprubí et al., 2006; Gropper et al., 1991; Phillipson and Romberger, 2004; Vassileva et
al., 2014) usually due to a combination of different factors involving mixing between magmatic and
meteoric fluids, increasing oxygen fugacity and decreasing fluid temperature (Vassileva et al., 2014).
Illite is also present as trapped crystals within fluid inclusions in Qz3. According to several authors (i.e
Romberger, 1991; Moncada and Bodnar, 2012) the pH stability field for illite is around 6, whereas
carbonates typically occur within neutral to alkaline conditions. The formation of kutnohorite is
comparable to similar phases of Ca/Mn-bearing carbonates described in other epithermal ore deposits,
whose deposition is favored by an increase of oxygen fugacity (fO2) and CO2 concentration (e.g. Canet et
al., 2009; Catchpole et al., 2012; Damian, 2003). Therefore, the formation of kutnohorite in the final
ACC
EPTE
D M
ANU
SCR
IPT
ACCEPTED MANUSCRIPT
25
post-ore stage suggests that slightly acidic-neutral fluids dominant during previous mineralization stages
(from the pre-ore to post-ore stage), evolved at the end of the post-ore stage from neutral to alkaline
fluids.
8.3. Whole-ore composition
Statistically significant and positive correlations between Ag-Cd-Cu-Pb-Zn and Au-As-Ge-Sb-W
reflect the mineralogical control in the element distribution. The Ag-Cd-Cu-Pb-Zn group is related to
base-metal sulfides (sphalerite, galena and chalcopyrite) and Ag-bearing minerals whereas the Au-As-Ge-
Sb-W group is related to arsenopyrite and pyrite. The observed positive correlations between the Ag-Cd-
Cu-Pb-Zn group support the interpretation that these metals were preferentially deposited during the base-
metal stage characterized by precipitation of sphalerite, galena, chalcopyrite and Ag-bearing minerals.
The positive correlation between Zn and Cd (r2 = 0.99 and p-value < 0.001) is consistent with the fact that
Cd substitutes for Zn in sphalerite, as reflected by the presence of trace amounts of Cd in sphalerite (up to
0.3 wt %). In contrast, the positive correlation between Pb and Ag (r2 = 0.97 and p-value < 0.001) is not
related to the presence of Ag in galena because EPMA analyses of galena rarely show significant Ag
content (~0.1 wt %). Alternatively, the Pb-Ag correlation in whole-ore composition can be explained by
the fact of Ag-bearing minerals and galena are in close textural association with most of the Ag-bearing
minerals occurring within galena. This occurrence is in agreement with the possible break down of high-
Ag-galena into Ag-free galena and Ag-bearing phases during cooling (as proposed by Sack, 2005) that
would further explain the observed Pb-Ag correlation. The mean and standard deviation of the zinc/lead
ratio (64.4 - 13.81, respectively) is in agreement with the predominance of sphalerite in the Patricia
deposit.
The strong and positive Sb-As correlation (r2 = 0.80 and p-value < 0.01), the wide distribution of
these elements in the scatterplot (Fig.11) and their positive correlations in Py and Apy, all indicate that Sb
and As substitute for each other in these minerals. Although Ag-sulfosalts also contain some Sb, the
lower relative proportion of these minerals in the whole-ore volume in comparison to arsenopyrite and
pyrite probably led to the correlation of Sb with Au and As instead of Ag. The positive Au-As correlation
(r2 = 0.94 and p-value < 0,001), the low Au concentrations in all analyzed samples (<1 ppm) and the
ACC
EPTE
D M
ANU
SCR
IPT
ACCEPTED MANUSCRIPT
26
absence of discrete Au-bearing minerals suggest that Au may be scarce (ppb or few ppm levels) within
arsenopyrite and As-rich pyrite, but this cannot be proven until analysis are carried out on these minerals.
The mineralogical control of Au by arsenopyrite or As-rich pyrite has been extensively documented
previously (e.g. Huston and Large, 1989; Camus et al., 1991; Genkin et al., 1998; Hedenquist et al., 2000;
Einaudi et al., 2003; John et al., 2003; Reich et al., 2005; Sung et al., 2009).
The presence of Fe in both arsenopyrite-pyrite and sphalerite-chalcopyrite explains the absence of
statistically significant correlation of Fe with any other metal in the whole-ore composition. The absence
of a statistically significant correlation of Se, Bi, Te, Co and Mo with other metals also indicates the lack
of mineralogical control for these metals within the paragenetic sequence established in the Patricia
deposit.
8.4. Depth of ore deposition and erosion of the eastern block
Minimum depth of ore deposition below the paleowater table in the Patricia deposit can be estimated
from hydrostatic boiling point curves (Haas, 1971) given that 1) hydrostatic pressure is indicated by open-
space filling textures in the mineralized veins, and 2) there is no evidence for fluid boiling, at least in the
pre-ore and main ore stages.
Microthermometric data, sampling depth and theoretical boiling depth (Haas, 1971) for some
selected inclusions in Qz1, Sp2A y Sp2B are shown in Table 5. As indicated previously, fluid inclusions
were studied in samples located between 95 m (lower limit of the oxidized zone) and 230 m deep (lower
depth reached by drilling) in the deposit eastern block. Minimum depth of ore deposition estimated from
boiling curves in this mineralized interval (Table 5) is only significant if it is equal or larger than the
sampling depth below present surface (i.e. data from Qz1 and Sp2A). Thus, ore deposition in the studied
vertical section of the Patricia eastern block would have taken place, at least, from 210 m in the
shallowest level below the oxidation blanket (Sp2A at 94 m deep) to 320 m close to the deepest areas
drilled to date (Qz1 at 205 m deep). However, these values represent minimum depths as Ag-rich
polymetallic epithermal mineralization usually occurs in relatively deep sections ( 500 m) of the
epithermal environment (Hedenquist et al., 2000; Albinson et al., 2001; Camprubí and Albinson, 2006).
ACC
EPTE
D M
ANU
SCR
IPT
ACCEPTED MANUSCRIPT
27
The difference between theoretical boiling depths and sampling depth for each inclusion also
provides an approximation to the minimum amount of erosion suffered by the uplifted eastern block of
the Patricia deposit. The maximum difference obtained by this method (Table 5) indicates more than 200
m of volcano-sedimentary pile has been eroded. However, further geological evidence is needed to better
constrain this value.
8.5. Sulfidation state of the Patricia ore deposit
The hydrothermal alteration, ore mineralogy and structural features of the Patricia vein system
correspond to a Zn-Pb-Ag epithermal deposit mainly developed under intermediate-sulfidation (IS)
conditions. The hydrothermal alteration characterized by illite ± sericite ± chlorite ± quartz is typical of IS
deposits (Einaudi et al., 2003). However. According to Einaudi et al. (2003), the absence of pyrrhotite in
equilibrium with pyrite or arsenopyrite suggests that the first and last stages of the Patricia deposit took
place under IS conditions, although maybe close to the limit with the LS field.
The paragenetic sequence of the main ore stage consists of sphalerite, galena, chalcopyrite, pyrrhotite
and Ag-bearing minerals. The sphalerite, galena and chalcopyrite deposition is usually related to IS
conditions and it has been commonly described in some epithermal deposits. (e.g. Hedenquist et al., 2000;
Einaudi et al., 2003; Sillitoe and Hedenquist, 2003; Camprubí and Albinson, 2006; Carillo-Rosúa et al.,
2008; Bendezu and Fonboté, 2009). Moreover, the composition of the sphalerite ranges from 6 to 15
mol.% FeS, which is consistent with sphalerite compositions from IS systems that range from <1 to 10
mol.% FeS and locally up to 20 mol.% FeS (Hedenquist et al., 2000; Einaudi et al., 2003; Simmons et al.,
2005). The Ag:Au ratio of the whole-ore composition in the Patricia deposit ranges from 200 to 6000,
values in accordance with IS systems where the Ag:Au ratio is always higher than 100 (Einaudi et al.,
2003).
On the basis of stability fields of common sulfide species in T- fS2 space, Einaudi et al. (2003)
characterized the mineralogy of very low, low, middle, high and very high sulfidation systems.
Accordingly, the whole paragenetic sequence observed in the Patricia ore deposit belongs to the
intermediate sulfidation type within the stability field of chalcopyrite and pyrite (Fig. 16). Fluids of the
pre-ore stage plot in an area on the T- fS2 space characterized by moderate sulfur fugacity during pyrite

ACC
EPTE
D M
ANU
SCR
IPT
ACCEPTED MANUSCRIPT
28
and arsenopyrite deposition. During the main-ore stage, fluids progressed to lower sulfur fugacities and
cooler conditions favoring the precipitation of sphalerite, galena and chalcopyrite, as well as Ag-bearing
minerals. Finally, during the post-ore stage, fluids plot are higher sulfur fugacity and temperature, similar
to those of the pre-ore stage, supporting the deposition of additional arsenopyrite and pyrite. The
formation of kutnohorite and Ag-bearing minerals during the final post-ore stage indicates progressive
cooling with an increase of pH and oxygen fugacity. Therefore, the suggested evolution for the Patricia
deposit implies the existence of different pulses of fluids and fracturing supported by open-space filling
and brecciation textures observed in the mineralized veins.
9. Concluding remarks
The Patricia Zn-Pb-Ag ore deposit is an intermediate sulfidation hydrothermal system associated
with Cordilleran volcanism (i.e. Camprubí and Albinson, 2006). The localization of the ore bodies is
controlled by extensional structures developed during the regional dominant sinistral strike-slip
movement along the Domeyko fault system, at the northern extent of which the Patricia deposit is located.
This overall sinistral transpressive regime created local transtensive domains with development of open
spaces for hydrothermal ore deposition.
The mineralizing system was characterized by reduced fluids with pH close to neutral conditions that
evolved from an initial stage characterized by saline fluids (6-22 wt %NaCl) with a minimum circulation
temperature of 205°C, likely reflecting the mixing between brine a more dilute fluid. This was followed
by the main mineralization event that precipitated base metals- and Ag-bearing minerals, from a low to
moderate salinity (1-9 wt % NaCl) fluid that progressively cooled from ~250ºC to ~140ºC. The late stage
is characterized by a fluid temperature increase to ~215ºC and subsequent cooling to 175ºC with no
salinity variation.
The Patricia deposit is presently divided into two blocks by a set of NNW-ESE-trending reverse
faults, which uplifted the eastern block and exhumed thicker and deeper parts of the deposit that exhibit
IS features. At least 200 m of the host volcano-sedimentary pile have been eroded from this block. In
ACC
EPTE
D M
ANU
SCR
IPT
ACCEPTED MANUSCRIPT
29
contrast, the western block exposes a shallower part of the system where cherts, amorphous silica and
jasperoids, typical of thermal spring settings, occur. So far, exploration activity has focused in the eastern
part of the deposit, and little attention has been paid to the western areas as early drilling intersected
veinlets with little interesting mineralization. However, the structural framework defined in this paper
strongly suggests that surficial thermal spring showings in the western block could likely progress to low-
sulfidation conditions at shallow depths followed by a gradual variation towards a polymetallic
intermediate-sulfidation ore system at depth, equivalent to the one observed in the eastern block.
Furthermore, the eastern part of the deposit most probably has an extension of the mineralized veins both
at depth, as drilling has not reached the lower limit of mineralization, and towards the south beyond the
ignimbrite unit, as stockwork and silicification were observed in that area during the mapping campaign
included in the present work. Therefore, we propose that the Patricia ore deposit can be significantly
larger than the reserves estimated at present and hidden resources are still to be discovered.
Acknowledgement
This work was made possible by Herencia Resources Plc., which provided access to drill core
and geologic information. Appreciation is expressed to the technical staff of Herencia Resources Plc. at
the Patricia deposit, for their assistance during our studies of the deposit. A warm memory is especially
devoted to Antonio Valverde, chief geologist at Paguanta project and co-author of this paper, who
recently passed away. We would like to thank A. Larios and X. Llovet from the Centro Nacional de
Microscopía Electrónica in the Complutense University of Madrid and from the Serveis Cientifico-tècnics
of the Universitat of Barcelona, respectively, for their assistance with the electron microprobe in the
chemical analyses of the minerals. We also thank B. Soutullo for their assistance with XRD from the
Cristalografía y Mineralogía department in the Complutense University of Madrid. We would like to
thank Dr. L. Fedele for their technical support with LA-ICP-MS analysis. This research was financially
supported by the project CGL2010 – 17668 (Ministerio de Economía y Competitividad of Spain) and the
company Herencia Resources Plc. Finally, we thank Franco Pirajno, editor of OGR, and two anonymous
reviewers whose comments and suggestions have largely contributed to improve the paper.
ACC
EPTE
D M
ANU
SCR
IPT
ACCEPTED MANUSCRIPT
30
References
Albinson, T., Norman, D.I., Cole, D., Chomiak, B., 2001. Controls on formation of low-sulfidation
epithermal deposits in Mexico: Constraints from fluid inclusion and stable isotope data. Society of
Economic Geologists, Special Publication, 8, pp, 1-32.
Allmendinger, R.W., Smalley, R.Jr., Bevis, M., Caprio, H., Brooks, B., 2005. Bending the Bolivian
orocline in real time. Geology 33, 905-908. http://dx.doi.org/ 10.1130/G21779.1
Arriagada, C., Roperch, P., Mpodozis, C., Cobbold, P., 2008. Paleogene building of the Bolivian
Orocline: tectonic restoration of the central Andes in 2-D map view. Tectonics 27, TC6014.
http://dx.doi.org/10.1029/2008TC002269.
Barton, Jr., Bethke, P.M., Roedder, E., 1977. Environment of ore deposition in the Creede Mining
District, San Juan Mountains Colorado: Part III. Progress toward interpretation of the chemistry of
the ore-forming fluid for the OH Vein. Econ. Geol. 72, 1-24.
http://dx.doi.org/10.2113/gsecongeo.72.1.1
Baumgartner, R., Fonboté, L., Vennemann, T., 2008. Mineral zoning and geochemistry of epithermal
polymetallic Zn-Pb-Ag-Cu-Bi mineralization at Cerro de Pasco, Peru. Econ. Geol. 103, 493–537.
http://dx.doi.org/10.2113/gsecongeo.103.3.493
Behn, G., Camus, F., Carrasco, P., 2001. Aeromagnetic signature of porphyry copper systems in northern
Chile and its geologic implications. Econ. Geol. 96, 239-248.
http://dx.doi.org/10.2113/gsecongeo.96.2.239
Bendezu, R., Fonboté, L., 2009. Cordilleran epithermal Cu-Zn-Pb (Au-Ag) mineralization in the
Colquijirca District, Central Peru: deposit-scale mineralogical patterns. Econ. Geol. 104, 905-944.
http://dx.doi.org/10.2113/econgeo.104.7.905
Bodnar, R.J., Bethke, P.M., 1984. Systematics of stretching of fluid inclusions; I, Fluorite and sphalerite
at 1 atmosphere confining pressure. Econ. Geol. 79, 141-161.
http://dx.doi.org/10.2113/gsecongeo.79.1.141
ACC
EPTE
D M
ANU
SCR
IPT
ACCEPTED MANUSCRIPT
31
Bodnar, R.J., 1993. Revised equation and table for determining the freezing point depression of H2O–
NaCl solutions. Geochim. Cosmochim. Acta. 57, 683-684. http://dx.doi.org/10.1016/0016-
7037(93)90378-A
Bodnar, R.J., 2003. Introduction to aqueous-electrolyte fluid inclusions. In: Fluid inclusions: Analysis and
Interpretation, 32 (Eds.) I. Samson, A. Anderson and D. Marshall). Mineral. Assoc. Canada, pp, 81–
89, Short Course.
Bouzari, F., Clark, A.H., 2002. Anatomy, evolution and metallogenic significance of the supergene ore
body of the Cerro Colorado porphyry copper deposit, I Region, northern Chile. Econ. Geol. 97,
1701-1740. http://dx.doi.org/10.2113/gsecongeo.97.8.1701
Campbell, I.H., Ballard, J., Palin, J.M., Allen, C., Faunes, A., 2006. U-Pb zircon geochronology of
granitic rocks from the Chuquicamata-El Abra porphyry copper belt of northern Chile: excimer laser
ablation ICP-MS analysis: Econ. Geol. 101(7), 1327-1344.
http://dx.doi.org/10.2113/gsecongeo.101.7.1327
Camprubí, A., Chomiak, B.A., Villanueva-Estrada, R.E., Canals, À., Norman, D.I., Cardellach, E., Stute,
M., 2006. Fluid sources for the La Guitarra epithermal deposit (Temascaltepec district, Mexico):
Volatile and helium isotope analyses in fluid inclusions. Chem. Geol. 231(3), 252-284.
http://dx.doi.org/10.1016/j.chemgeo.2006.02.002
Camprubí, A., González-Partida, E., Iriondo, A., Levresse, G., 2006. Mineralogy, fluid characteristics,
and depositional environment of the Paleocene epithermal Au-Ag deposits of the El Barqueño
District, Jalisco, Mexico. Econ. Geol. 101, 235-247. http://dx.doi.org/ 10.2113/gsecongeo.101.1.235
Camprubí, A., Albinson, T., 2006. Depósitos epitermales en México: actualización de su conocimiento y
reclasificación empírica. B. Soc. Geol. Mex. 1, 27-81.
Camus, F., Boric, R., Skewes, M.A., Castelli, J.C., Reichhard, E., Mestre, A., 1991. Geologic, structural,
and fluid inclusion studies of El Bronce epithermal vein system, Petorca, central Chile. Econ. Geol.
86, 1317-1345. http://dx.doi.org/10.2113/gsecongeo.86.6.1317
Camus, F., Dilles, J.H., 2001. A special issue devoted to porphyry copper deposits of northern Chile.
Econ. Geol. 96(2), 233-238. http://dx.doi.org/10.2113/gsecongeo.96.2.233
ACC
EPTE
D M
ANU
SCR
IPT
ACCEPTED MANUSCRIPT
32
Camus, F., Skewes, M.A., 1991. The Faride epithermal silver-gold deposit, Antofagasta region, Chile.
Econ. Geol. 86, 1222-1237. http://dx.doi.org/ 10.2113/gsecongeo.86.6.1222
Canet, C., Camprubí, A., González-Partida, E., Linares, C., Alfonso, P., Piñeiro-Fernández, F., Prol-
Ledesma, R.M., 2009. Mineral assemblages of the Francisco I. Madero Zn–Cu–Pb–(Ag) deposit,
Zacatecas, Mexico: Implications for ore deposit genesis. Ore Geol. Rev. 35, 423-435.
http://dx.doi.org/10.1016/j.oregeorev.2009.02.004
Capitanio, F., Faccenna, C., Zlotnik, S., Stegman, D., 2011. Subduction dynamics and the origin of
Andean orogeny and the Bolivian orocline, Nature 480, 83-86.
http://dx.doi.org/10.1038/nature10596
Catchpole, H., Kouzmanov, K., Fonboté, L., 2012. Copper-Excess stannoidite and tennantite-tetrahedrite
as proxies for hydrothermal fluid evolution in a zoned cordilleran base metal district, Morococha,
Central Peru. Can. Mineral. 50, 719-743. http://dx.doi.org/10.3749/canmin.50.3.719
Carrillo-Rosúa, J., Morales-Ruano, S., Morata, D., Boyce, A.J., Belmar, M., Fallick, A.E., Fenoll Hach-
Ali, P., 2008. Mineralogy and geochemistry of El Dorado epithermal gold deposit, El Sauce district,
central-northern Chile. Mineral. Petrol. 92, 341-360. http://dx.doi.org/10.1007/s00710-007-0203-7
Chauvet, A., Bailly, L., André, A.S., Monié, P., Cassard, D., Tajada, F.L., Tuduri, J., 2006. Internal vein
texture and vein evolution of the epithermal Shila-Paula district, southern Peru. Miner. Deposita 41,
387-410. http://dx.doi.org/10.1007/s00126-006-0068-4
Chutas, N.I., Sack, R.O., 2004. Ore genesis at La Colorada Ag-Zn-Pb deposit in Zacatecas, Mexico.
Mineral Mag, 68, pp, 923-937. http://dx.doi.org/10.1180/0026461046860231
Coira, B., Davidson, J., Mpodozis, C., Ramos, V., 1982. Tectonic and magmatic evolution of the Andes
of northern Argentina and Chile. Earth Sci. Rev. 18, 303-332. http://dx.doi.org/10.1016/0012-
8252(82)90042-3
Cotton, W.B., 2003. Near infrared and XRD quantification of porphyry copper alteration at Cerro
Colorado and Spence, Chile. (Doctoral dissertation, PhD thesis, University of Colorado, Boulder,
USA.
ACC
EPTE
D M
ANU
SCR
IPT
ACCEPTED MANUSCRIPT
33
Echavarria, L., Nelson, E., Humphrey, J., Chávez, J., Escobedo, L., Iriondo, A., 2006. Geologic evolution
of the Caylloma epithermal vein district, southern Perú. Econ. Geol. 101, 843-863.
http://dx.doi.org/10.2113/gsecongeo.101.4.843
Einaudi, M.T., Hedenquist, J.W., Inan, E.E., 2003. Sulfidation state of hydrothermal fluids: the porphyry-
epithermal transition and beyond. In: Simmons, S.F., Graham, I.J. (Eds.), Volcanic, Geothermal and
Ore-forming Fluids: Rulers and Witnesses of Processes Within the Earth. Society of Economic
Geologists and Geochemical Society Special Publication, 10, pp. 285–313.
Damian, G., 2003. The genesis of the base metal ore deposit from Herja. Studia UBB, Geologia, 48(1),
85-100.
Davidson, J., Mpodozis, C., 1991. Regional Geologic Setting of Epithermal Gold Deposits, Chile. Econ.
Geol. 86, 1174-1186. http://dx.doi.org/10.2113/gsecongeo.86.6.1174
Dilles, J.H., Tomlinson, A.J., Martín, M.W., Blanco, N., 1997. El Abra and Fortuna Complexes: a
porphyry copper batholith sinistrally displaced by the Falla Oeste. In Congreso Geológico Chileno,
8th Actas, 3, pp. 1883-1887.
Farías, M., Charrier, R., Comte, D., Martinod, J., Hérail, G., 2005. Late Cenozoic deformation and uplift
of the western flank of the Altiplano: Evidence from the depositional, tectonic, and geomorphologic
evolution and shallow seismic activity (northern Chile at 19°30′S), Tectonics 24, TC4001.
http://dx.doi.org/10.1029/2004TC001667.
Galli, C., 1957. Las formaciones geológicas en el borde occidental de la puna de Atacama, sector de Pica,
Tarapacá. Minerales 56, 14-26.
Galli, C., 1968. Carta Geológica de Chile: Cuadrángulo Juan de Morales, Provincia de Tarapacá, Escala
1:50,000: Instituto de Investigaciones Geológicas de Chile, Carta 18, 53 p.
Galli, C., Dingman, I., 1962. Cuadrángulos Pica, Alca, Matilla y Chacarilla, con un estudio sobre los
recursos de agua subterránea. Provincia de Tarapacá. Instituto de Investigaciones Geológicas, Carta
Geológica de Chile, 3(2), 3.
ACC
EPTE
D M
ANU
SCR
IPT
ACCEPTED MANUSCRIPT
34
Gamarra-Urrunaga, J.E., Castroviejo, R., Bernhardt, H.J., 2013. Preliminary mineralogy and ore
petrology of the intermediate-sulfidation Pallancata deposit, Ayacucho, Peru. Can. Mineral. 51, 67-
91. http://dx.doi.org/10.3749/canmin.51.1.67
García, M., Hérail, G., 2001. Comment on Geochronology (Ar-Ar, K-Ar and He-exposure ages) of
Cenozoic magmatic rocks from northern Chile (18-22°S): implications for magmatism and tectonic
evolution of the central Andes of Wörner et al. 2000. Revista Geológica de Chile 28, 127-130.
http://dx.doi.org/10.4067/S0716-02082001000100008
Genkin, A.D., Bortnikov, N., Cabri, L.J., Wagner, F.E., Stanley, C.J., Safonov, Y.G., McMahon, G.,
Friedl, J., Kerzin, A.L., Gamyanin, G.N., 1998. A multidisciplinary study of invisible gold in
arsenopyrite from four mesothermal gold deposits in Siberia, Russian Federation. Econ. Geol. 93,
463-487. http://dx.doi.org/10.2113/gsecongeo.93.4.463
Goldstein, R.H., Reynolds, T.J., 1994. Systematics of fluid inclusions in diagenetic minerals: Society of
Economic Geologists and Paleontologists. Short Course 31, 199.
Gröpper, H., Calvo, M., Crespo, H., Bisso, C.R., Cuadra, W.A., Dunkerley, P.M., Aguirre, E. 1991. The
epithermal gold-silver deposit of Choquelimpie, Northern Chile. Econ. Geol. 86, 1206-1221.
http://dx.doi.org/10.2113/gsecongeo.86.6.1206
Haas, J.L., 1971. The effect of salinity on the maximum thermal gradient of a hydrothermal system at
hydrostatic pressure. Econ. Geol. 66, 940-946. http://dx.doi.org/10.2113/gsecongeo.66.6.940
Harambour, S., 1990. Geología pre-Cenozoica de la Cordillera de los Andes entre las quebradas Aroma y
Juan de Morales. PhD Thesis, Departamento de Geología, Universidad de Chile, Santiago.
Hedenquist, J.W., Arribas, A.Jr., Urien-González, E., 2000. Exploration for epithermal gold deposits.
Rev. Econ. Geol 13, 245-277.
Henley, R.W., Ellis, A.J., 1983. Geothermal systems ancient and modern: a geochemical review. Earth-
Sci Rev. 19, 1-50. http://dx.doi.org/10.1016/0012-8252(83)90075-2
Huston, D.L., Large, R.R., 1987. Genetic and exploration significance of the zinc ratio (100 Zn/ (Zn+
Pb)) in massive sulfide systems. Econ. Geol. 82, 1521-1539.
http://dx.doi.org/10.2113/gsecongeo.82.6.1521
ACC
EPTE
D M
ANU
SCR
IPT
ACCEPTED MANUSCRIPT
35
Huston, D.L., Large, R.R., 1989. A chemical model for the concentration of gold in volcanogenic massive
sulphide deposits. Ore Geol. Rev. 4, 171-200. http://dx.doi.org/10.1016/0169-1368(89)90017-6
Huston, D.L., Stevens, B., Southgate, P.N., Muhling, P., Wyborn, L., 2006. Australian Zn-Pb-Ag ore-
forming systems: a review and analysis. Econ. Geol. 101, 1117-1157.
http://dx.doi.org/10.2113/gsecongeo.101.6.1117
Isacks, B.L., 1988. Uplift of the central Andean plateau and bending of the Bolivian orocline. J. Geophys.
Res. 93, 3211-3231. http://dx.doi.org/10.1029/JB093iB04p03211
Jarosewich, E., Nelen, J.A., Norberg, J.A., 1980. Reference samples for electron microprobe analysis.
Geostandars Newsletter 4, 43-47. http://dx.doi.org/10.1111/j.1751-908X.1980.tb00273.x
Jasinski, A.W., 1983. Some aspects of the silver mineralization in the Hfillefors region (Bergslagen,
Sweden). Mineral. Mag. 47, 507-14.
John, D.A., Hofstra, A.H., Fleck, R.J., Brummer, J.E., Saderholm, E.C., 2003. Geologic setting and
genesis of the Mule Canyon low-sulfidation epithermal gold-silver deposit, north-central Nevada.
Econ. Geol. 98, 425-463. http://dx.doi.org/10.2113/gsecongeo.98.2.425
Keighin, C.W., Honea, R.M., 1969. The system Ag-Sb-S from 600 ºC to 200 ºC. Miner. Deposita 4, 153-
171. http://dx.doi.org/10.1007/BF00208050
Leach, T., Corbett, G., 2008. Fluid mixing as a mechanism for bonanza grade epithermal gold formation.
In Paper presented at the Terry Leach Symposium, 17. http://dx.doi.org/10.13140/2.1.2429.1847
Maksaev, V., 1990. Metallogenic, geological evolution and thermochronology of the Chilean Andes
between latitudes 21°and 26°S, and the origin of major porphyry copper deposits. PhD Thesis,
Dalhousie University, Canada.
Maksaev, V., Townley, B., Palacios, C., Camus, F., 2007. Metallic ore deposits. In: Moreno T, Gibbons
W. (ed) The Geology of Chile. The Geological Society of London, pp, 179-199.
Maksaev, V., Zentilli, M., 1999. Fission track thermochronology of the Domeyko Cordillera, northern
Chile; implications for Andean tectonics and porphyry copper metallogenesis: Exploration and
Mining Geology, 8, 65-89.
ACC
EPTE
D M
ANU
SCR
IPT
ACCEPTED MANUSCRIPT
36
Maronna, R.A., Martin, D.R., Yohai, V.J., 2006. Robust Statistics; Theory and Methods. Ed. Wiley. 87-
171.
McGuire, A.V., Francis, C.A., Dyar, M.D. 1992. Mineral standards for electron microprobe analysis of
oxygen. Am. Mineral 77, 1087-1091.
Moncada, D., Bodnar, R.J., 2012. Gangue mineral textures and fluid inclusion characteristics of the Santa
Margarita Vein in the Guanajuato Mining District, Mexico. Cent. Eur. J. Geosci, 4, 300-309.
http://dx.doi.org/10.2478/s13533-011-0057-8
Moore, D.M., Reynolds, R.C., 1989. X-ray diffraction and the identification and analysis of clay
minerals. Vol. 378. Oxford: Oxford university press.
Mpodozis, C., Ramos, V., 1990. The Andes of Chile and Argentina. In: G. Eriksen et al. (Eds.), Geology
of the Central Andes and its relation to Hydrocarbon and Mineral Resources. Circum-Pacific
Council for Energy and Mineral Resources, Houston, TX. Earth. Sci. Ser. 11, 59-90.
Noble, D.C., McKee, E.H., Mégard, F., 1979. Early Tertiary “Incaic” tectonism, uplift, and volcanic
activity, Andes of central Peru: Geol. Soc. Am. Bull, 90, 903-907. http://dx.doi.org/10.1130/0016-
7606(1979)90<903:ETITUA>2.0.CO;2
O'Leary, M.J., Sack, R.O., 1987. Fe-Zn exchange reaction between tetrahedrite and sphalerite in natural
environments. Contrib Mineral Petr, 96, pp, 415-425. http://dx.doi.org/10.1007/BF01166687
Pacci, D., Cáceres, R., Sayes, J., Monti, S. 1980. Inventario de yacimientos metálicos y no-metálicos. I
Región de Tarapacá. Tomo I-V, Antecedentes geológicos y mineros básicos. Instituto de
Investigaciones Geológicas.
Phillipson, S.E., Romberger, S.B., 2004. Volcanic stratigraphy, structural controls, and mineralization in
the San cristobal Ag–Zn–Pb deposit, southern Bolivia. J. S. Am. Earth. Sci. 16, 667-683.
http://dx.doi.org/10.1016/j.jsames.2003.11.002
Pinto, L., Hérail, G., Charrier, R., 2004. Sedimentación sintectónica asociada a las estructuras neógenas
en la Precordillera de la zona de Moquella, Tarapacá (19°15'S, norte de Chile). Revista Geológica de
Chile 31, 19-44. http://dx.doi.org/10.4067/S0716-02082004000100002
ACC
EPTE
D M
ANU
SCR
IPT
ACCEPTED MANUSCRIPT
37
Reich, M., Kesler, S.E., Utsunomiya, S., Palenik, C.S., Chryssoulis, S.L., Ewing, R.C., 2005. Solubility of
gold in arsenian pyrite. Geochim. Cosmochim. Acta. 69, 2781-2796.
http://dx.doi.org/10.1016/j.gca.2005.01.011
Reyes, A.G., 1990. Petrology of Philippine geothermal systems and the application of alteration
mineralogy to their assessment. J. Volcanol. Geoth. Res. 43, 279-309.
http://dx.doi.org/10.1016/0377-0273(90)90057-M
Roel, J., Ortega, L., Piña, R., Lunar, R., 2013. Estudio preliminar de la mineralización de Cu-Ag de Doris,
Proyecto minero Paguanta, NE Chile. MSc Thesis. Complutense University of Madrid.
Romberger, S.B., 1991. Transport and deposition of precious metals in epithermal deposits. In: Raines,
G.L., Lisle, R.E., Schafer, R.W., Wilkinson, W.H. (Eds.), Geology and Ore Deposits of the Great
Basin Symposium Proceedings, Geological Society of Nevada, Reno, pp, 219-232.
Sack, R.O., 2005. Internally consistent database for sulfides and sulfosalts in the system Ag2S-Cu2S-
ZnS-FeS-Sb2S3-As2S3. Geochim. Cosmochim. Acta. 69, 1157-1164.
http://dx.doi.org/10.1016/S0016-7037(00)00468-3
Sack, R. O., Lichtner, P.C., 2009. Constraining compositions of hydrothermal fluids in equilibrium with
polymetallic ore-forming sulfide assemblages. Econ Geol, 104, 1249-1264.
http://dx.doi.org/10.2113/gsecongeo.104.8.1249
Sayes, J., 1978. Cuadrángulos Collacagua y Laguna del Huasco, Provincia de Iquique, I Región: escala
1:100.000. Instituto de Investigaciones Geológicas de Chile, pp, 43.
Seedorff, E., Dilles, J.H., Proffett, J.M., Einaudi, M.T., Zurcher, L., Stavast, W.J.A., Barton, M.D., 2005.
Porphyry deposits: characteristics and origin of hypogene features. Econ Geol. 100th Anniversary
Volume, 29, pp, 251-298.
Scheuber, E., Reutter, K., 1992. Magmatic arc tectonics in the Central Andes between 21º and 25º S,
Tectonophysics 25, 127-140. http://dx.doi.org/10.1016/0040-1951(92)90422-3
Schlunegger, F., Kober, F., Zeilinger, G., von Rotz, R., 2010. Sedimentology-based reconstructions of
paleoclimate changes in the Central Andes in response to the uplift of the Andes, Arica region
ACC
EPTE
D M
ANU
SCR
IPT
ACCEPTED MANUSCRIPT
38
between 19 and 21°S latitude, northern Chile. Int. J. Earth Sci. 99, 123-137.
http://dx.doi.org/10.1007/s00531-010-0572-8
Shamanian, G.H., Hedenquist, J.W., Hattori, K.H., Hassanzadeh, J., 2004. The Gandy and Abolhassani
epithermal prospects in the Alborz magmatic arc, Semnan province, Northern Iran. Econ. Geol. 99,
691-712. http://dx.doi.org/10.2113/gsecongeo.99.4.691
Sillitoe, R.H., 1981. Regional aspects of the Andean porphyry copper belt in Chile and Argentina:
Transactions of the Institute of Mining and Metallurgy, 90, B15-B36.
Sillitoe, R.H., Hedenquist, J.W., 2003. Linkages between volcanotectonic settings, ore-fluid
compositions, and epithermal precious metal deposits. In: Simmons, S.F., Graham, I. (Eds.),
Volcanic, Geothermal, and Ore-forming Fluids: Rulers and Witnesses of Processes Within the Earth.
Society of Economic Geologists, Special Publication, Society of Economic Geologists. Special
Publication, 10, pp. 315–343.
Sillitoe, R.H., Perelló, J., 2005. Andean copper province: tectonomagmatic settings, deposit types,
metallogeny, exploration, and discovery: Econ. Geol. 100th Anniversary volume, pp, 845-890.
Sillitoe, R.H., 2010. Porphyry copper systems. Econ Geol, 105, pp, 3-41.
http://dx.doi.org/10.2113/gsecongeo.105.1.3
Simmons, S., White, N., John, D.A., 2005. Geological characteristics of epithermal precious and base
metal deposits. In: Hedenquist, J.W., Thompson, J.F.H., Goldfarb, R.J., Richards, J,P., (Eds.), 100th
anniversary volume, 1905-2005. Econ Geol. pp, 485-522
Sinclair, W.D., Kooiman, G.J.A., Martin, D.A., Kjarsgaard, I.M., 2006. Geology, geochemistry and
mineralogy of indium resources at Mount Pleasant, New Brunswick, Canada. Ore Geol. Rev. 28,
123-145. http://dx.doi.org/10.1016/j.oregeorev.2003.03.001
Sterner, S.M., Bodnar, R.J., 1984. Synthetic fluid inclusions in natural quartz I. Compositional types
synthesized and applications to experimental geochemistry. Geochim. Cosmochim. Acta, 48, 2659-
2668. http://dx.doi.org/10.1016/0016-7037(84)90314-4
Sung, Y.H., Brugger, J., Ciobanu, C.L., Pring, A., Skinner, W., Nugus, M., 2009. Invisible gold in
arsenian pyrite and arsenopyrite from a multistage Archaean gold deposit: Sunrise Dam, Eastern
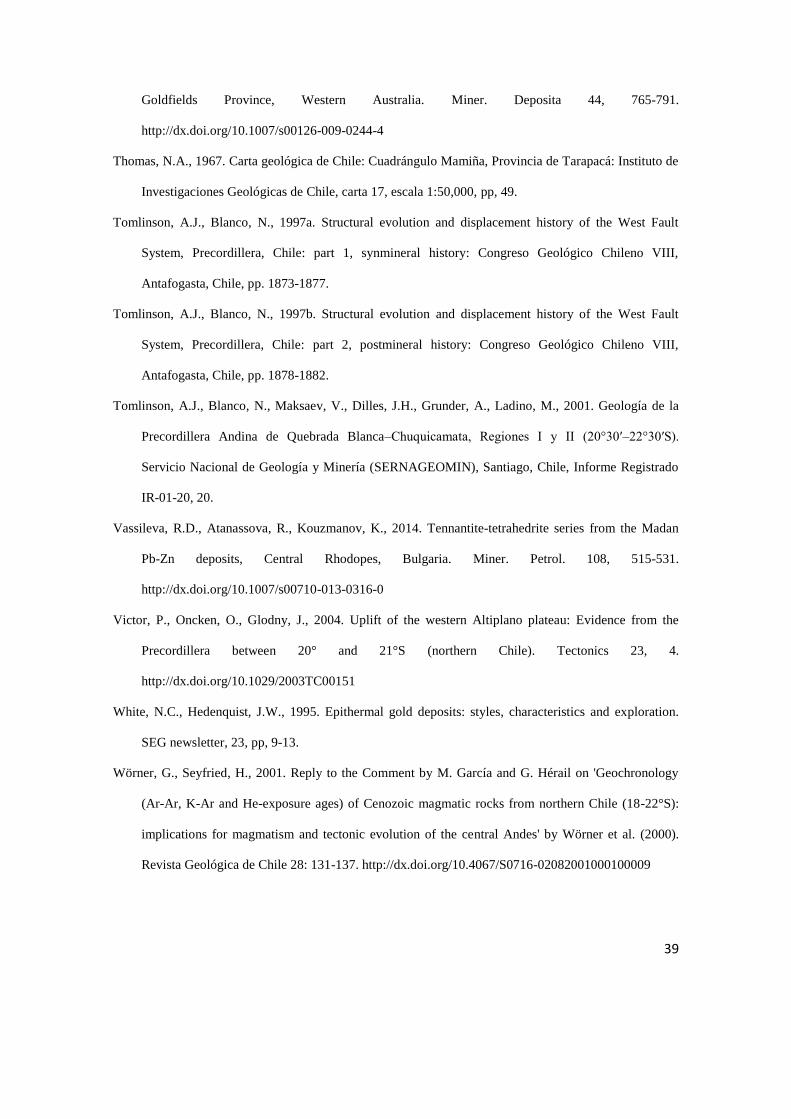
ACC
EPTE
D M
ANU
SCR
IPT
ACCEPTED MANUSCRIPT
39
Goldfields Province, Western Australia. Miner. Deposita 44, 765-791.
http://dx.doi.org/10.1007/s00126-009-0244-4
Thomas, N.A., 1967. Carta geológica de Chile: Cuadrángulo Mamiña, Provincia de Tarapacá: Instituto de
Investigaciones Geológicas de Chile, carta 17, escala 1:50,000, pp, 49.
Tomlinson, A.J., Blanco, N., 1997a. Structural evolution and displacement history of the West Fault
System, Precordillera, Chile: part 1, synmineral history: Congreso Geológico Chileno VIII,
Antafogasta, Chile, pp. 1873-1877.
Tomlinson, A.J., Blanco, N., 1997b. Structural evolution and displacement history of the West Fault
System, Precordillera, Chile: part 2, postmineral history: Congreso Geológico Chileno VIII,
Antafogasta, Chile, pp. 1878-1882.
Tomlinson, A.J., Blanco, N., Maksaev, V., Dilles, J.H., Grunder, A., Ladino, M., 2001. Geología de la
Precordillera Andina de Quebrada Blanca–Chuquicamata, Regiones I y II (20°30′–22°30′S).
Servicio Nacional de Geología y Minería (SERNAGEOMIN), Santiago, Chile, Informe Registrado
IR-01-20, 20.
Vassileva, R.D., Atanassova, R., Kouzmanov, K., 2014. Tennantite-tetrahedrite series from the Madan
Pb-Zn deposits, Central Rhodopes, Bulgaria. Miner. Petrol. 108, 515-531.
http://dx.doi.org/10.1007/s00710-013-0316-0
Victor, P., Oncken, O., Glodny, J., 2004. Uplift of the western Altiplano plateau: Evidence from the
Precordillera between 20° and 21°S (northern Chile). Tectonics 23, 4.
http://dx.doi.org/10.1029/2003TC00151
White, N.C., Hedenquist, J.W., 1995. Epithermal gold deposits: styles, characteristics and exploration.
SEG newsletter, 23, pp, 9-13.
Wörner, G., Seyfried, H., 2001. Reply to the Comment by M. García and G. Hérail on 'Geochronology
(Ar-Ar, K-Ar and He-exposure ages) of Cenozoic magmatic rocks from northern Chile (18-22°S):
implications for magmatism and tectonic evolution of the central Andes' by Wörner et al. (2000).
Revista Geológica de Chile 28: 131-137. http://dx.doi.org/10.4067/S0716-02082001000100009
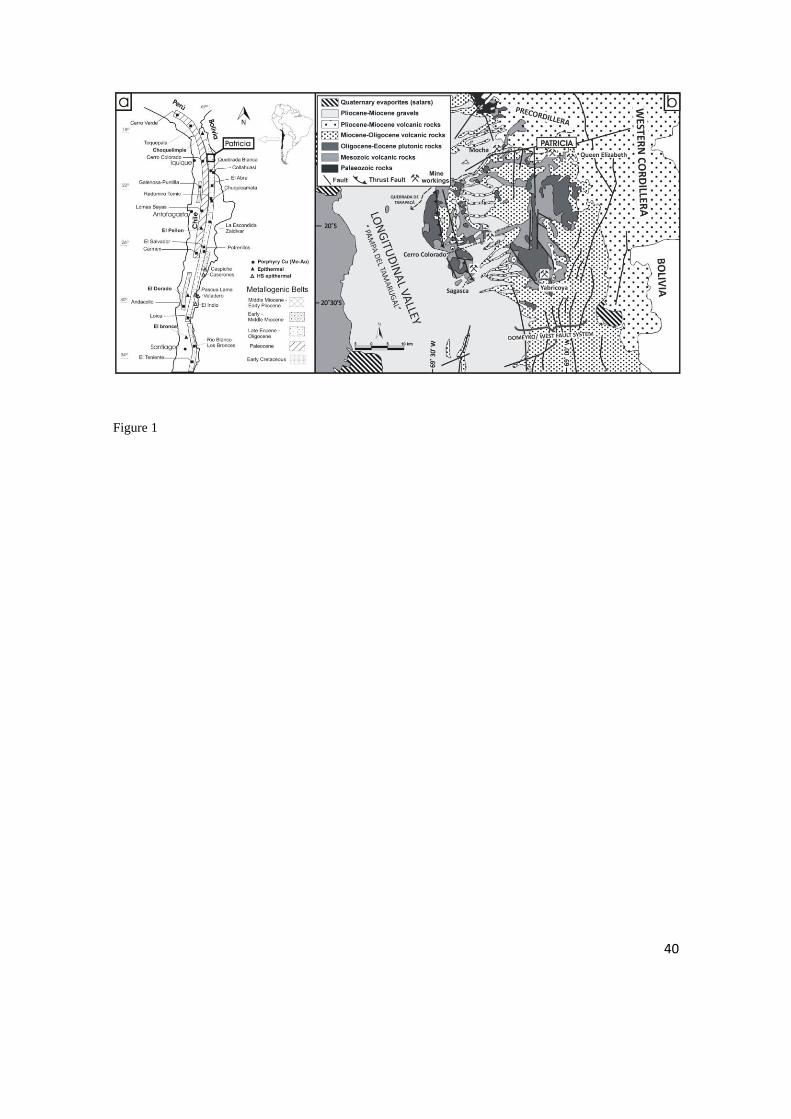
ACC
EPTE
D M
ANU
SCR
IPT
ACCEPTED MANUSCRIPT
40
Figure 1
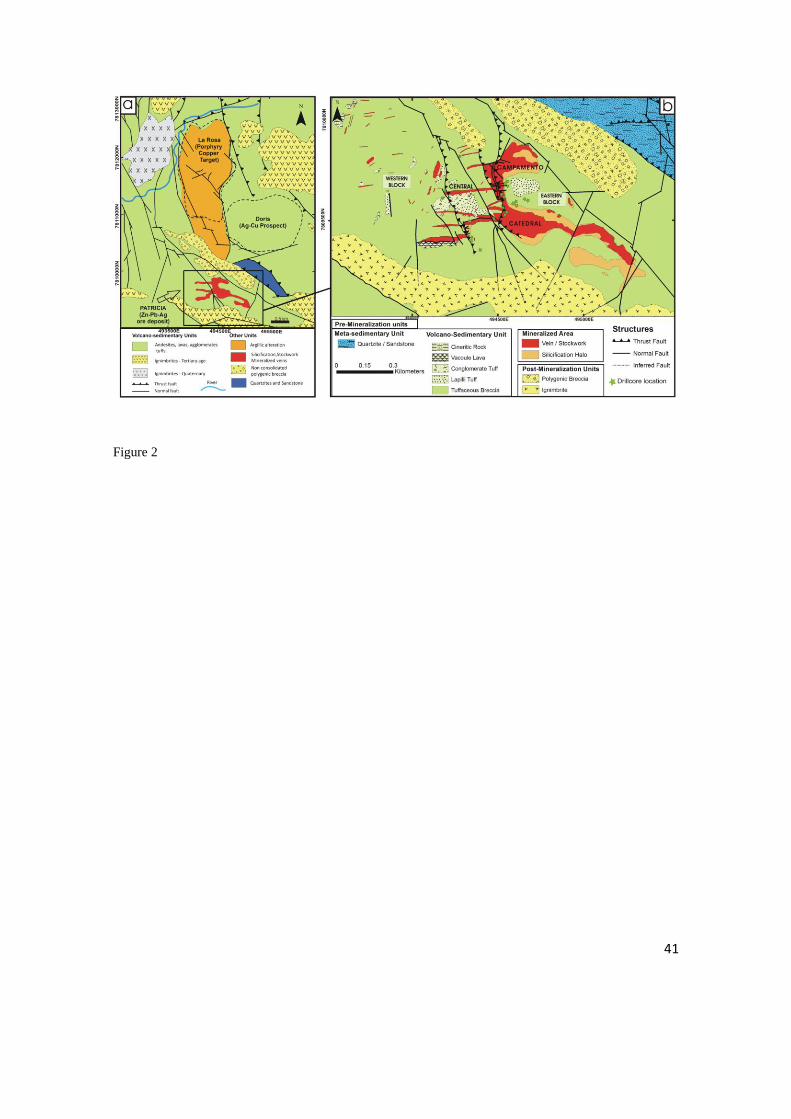
ACC
EPTE
D M
ANU
SCR
IPT
ACCEPTED MANUSCRIPT
41
Figure 2
ACC
EPTE
D M
ANU
SCR
IPT
ACCEPTED MANUSCRIPT
42
Figure 3
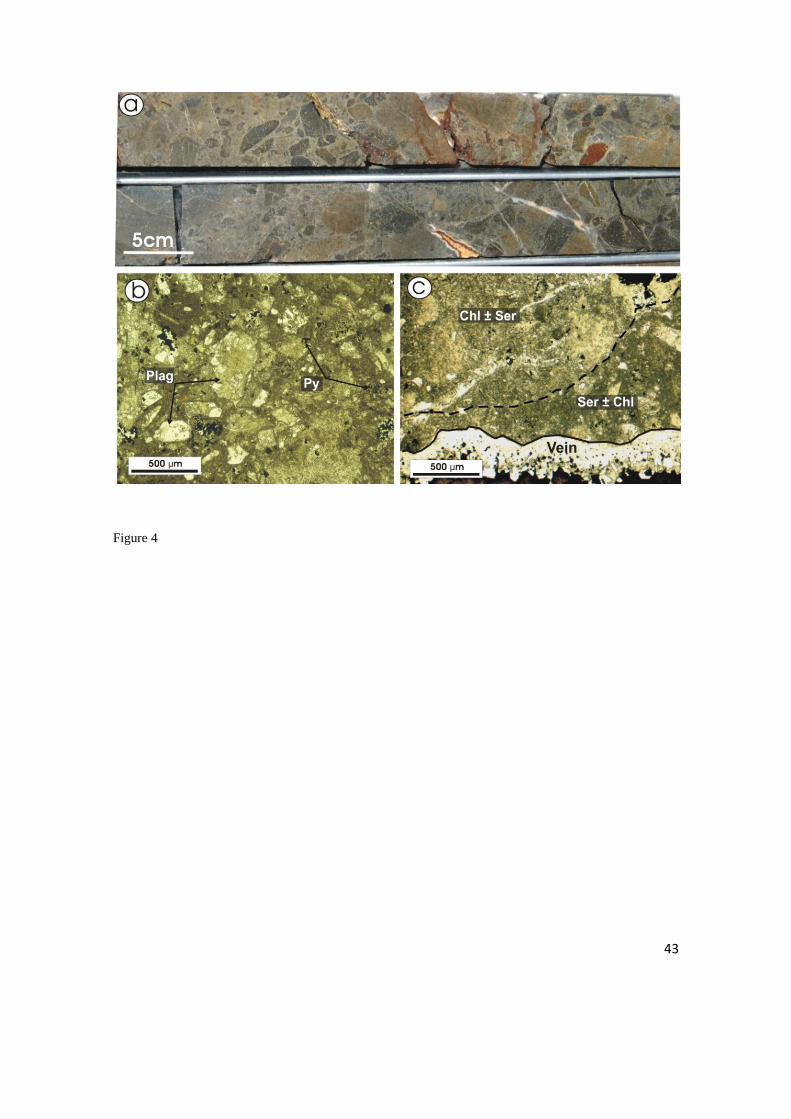
ACC
EPTE
D M
ANU
SCR
IPT
ACCEPTED MANUSCRIPT
43
Figure 4
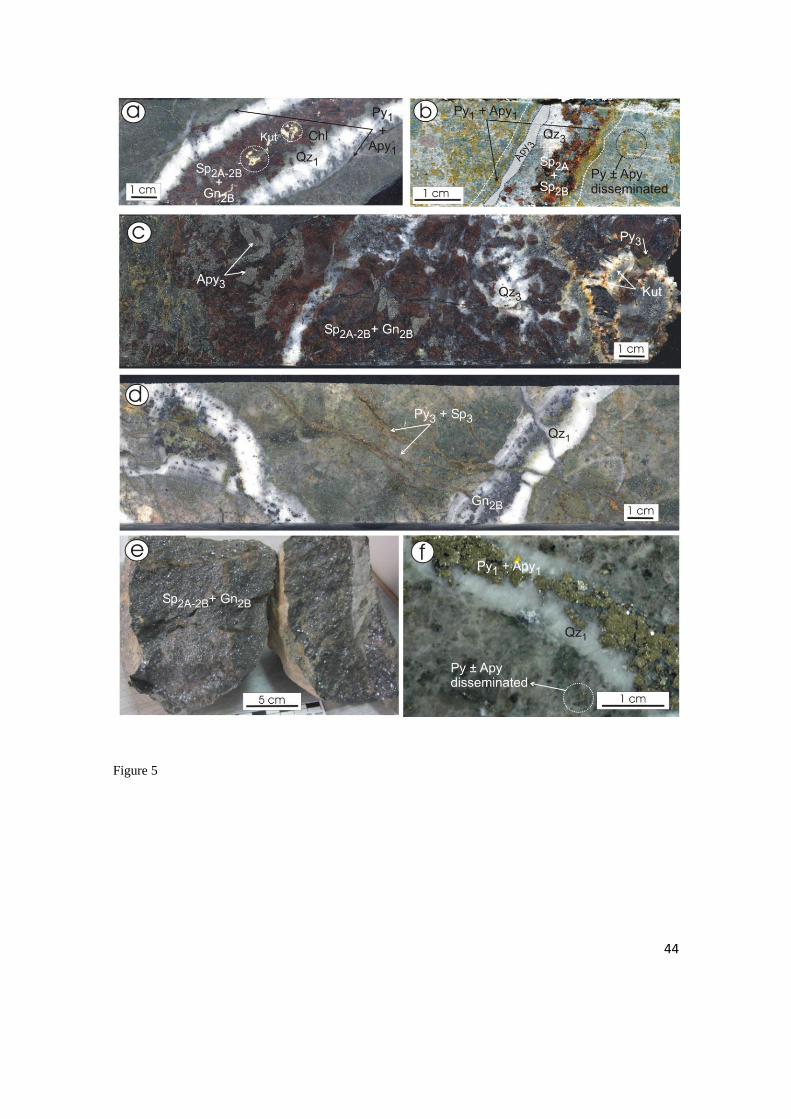
ACC
EPTE
D M
ANU
SCR
IPT
ACCEPTED MANUSCRIPT
44
Figure 5
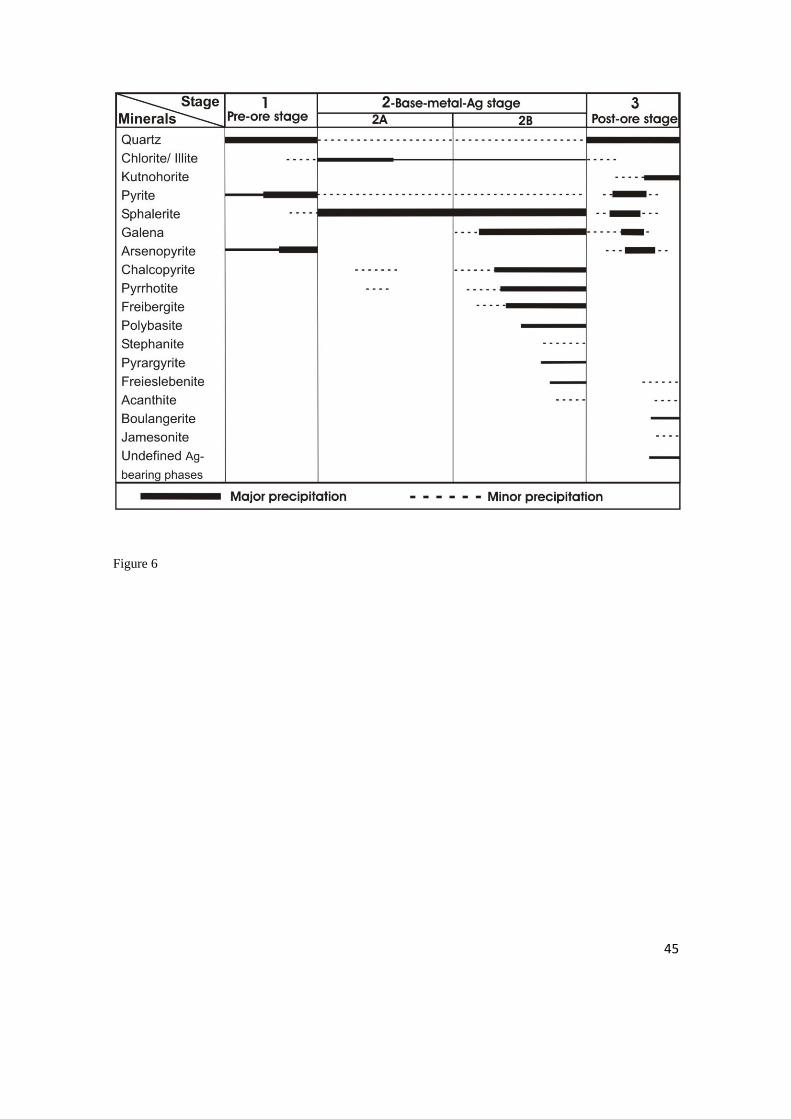
ACC
EPTE
D M
ANU
SCR
IPT
ACCEPTED MANUSCRIPT
45
Figure 6
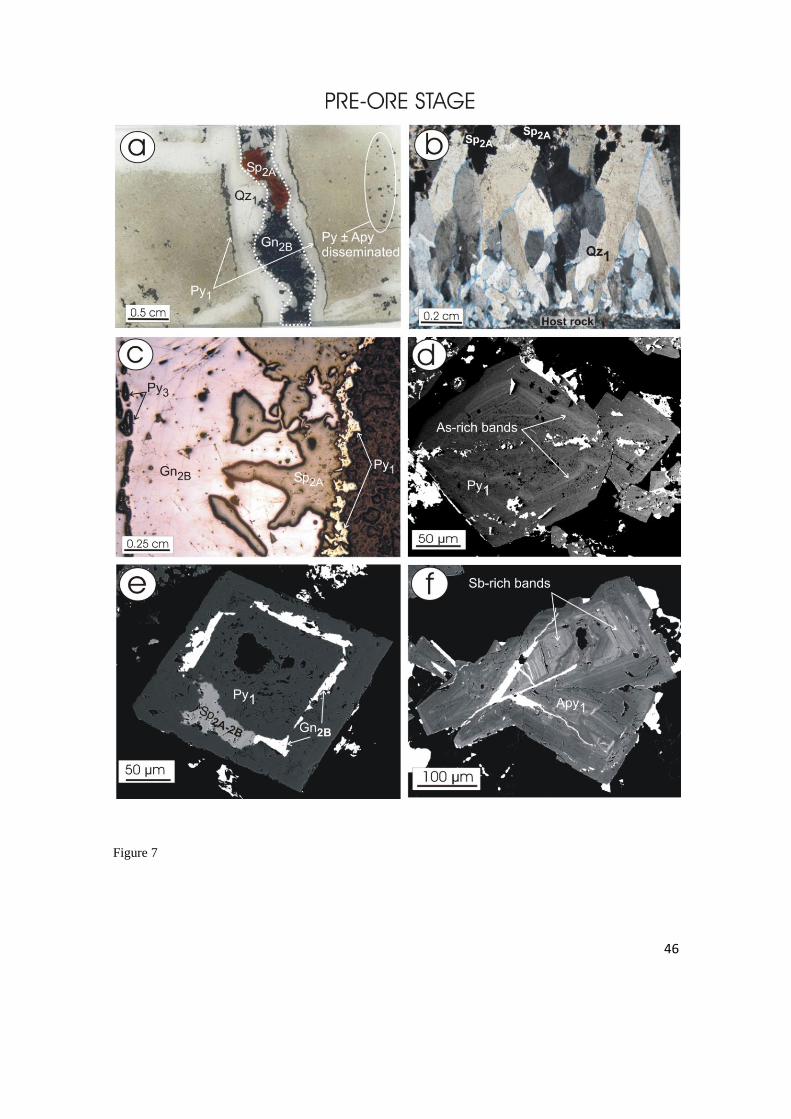
ACC
EPTE
D M
ANU
SCR
IPT
ACCEPTED MANUSCRIPT
46
Figure 7
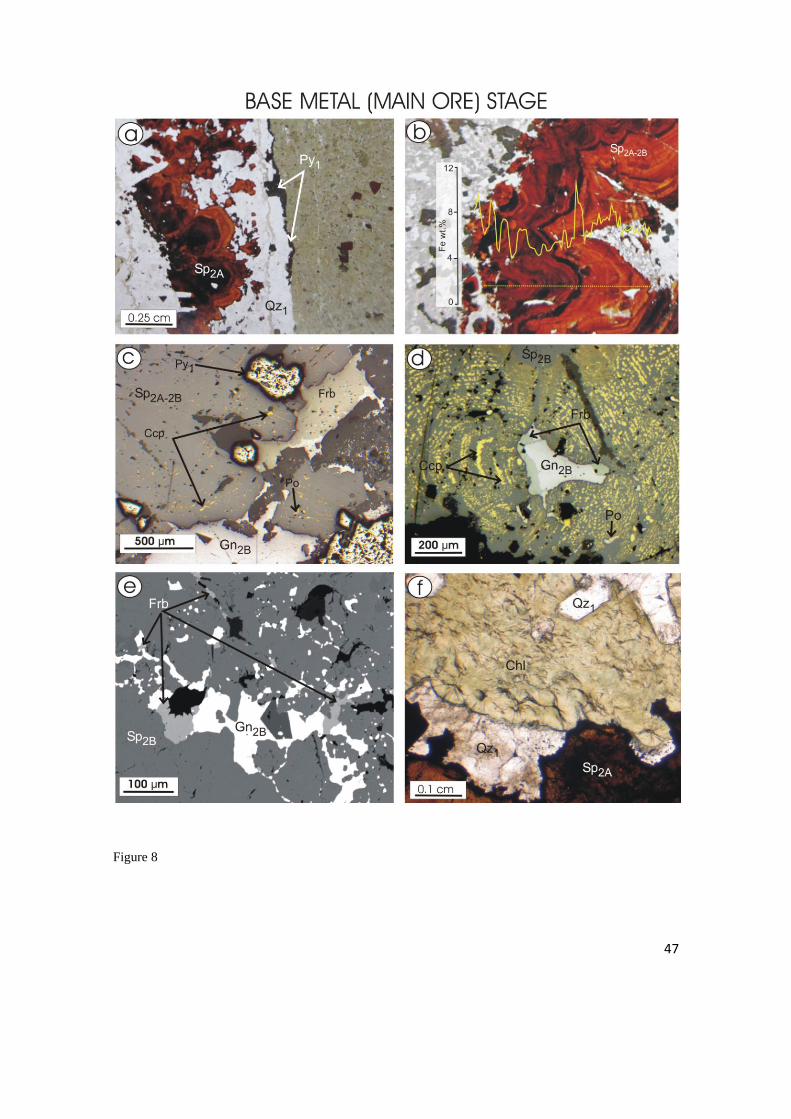
ACC
EPTE
D M
ANU
SCR
IPT
ACCEPTED MANUSCRIPT
47
Figure 8
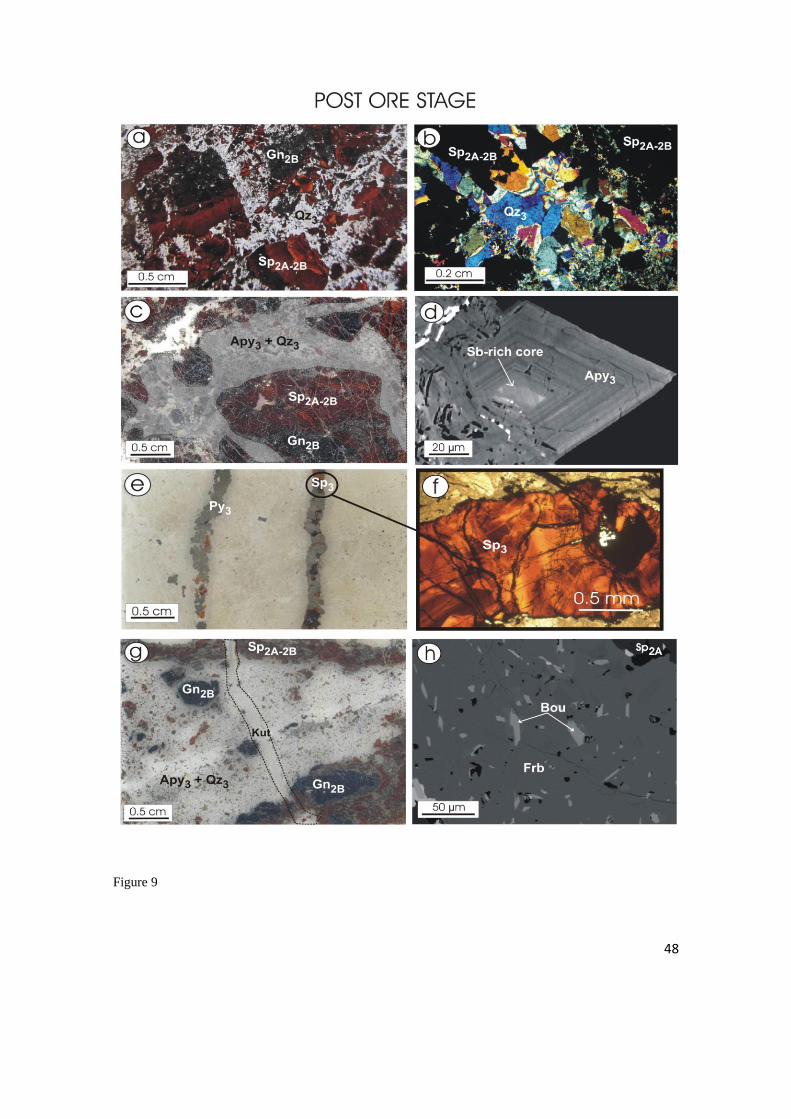
ACC
EPTE
D M
ANU
SCR
IPT
ACCEPTED MANUSCRIPT
48
Figure 9
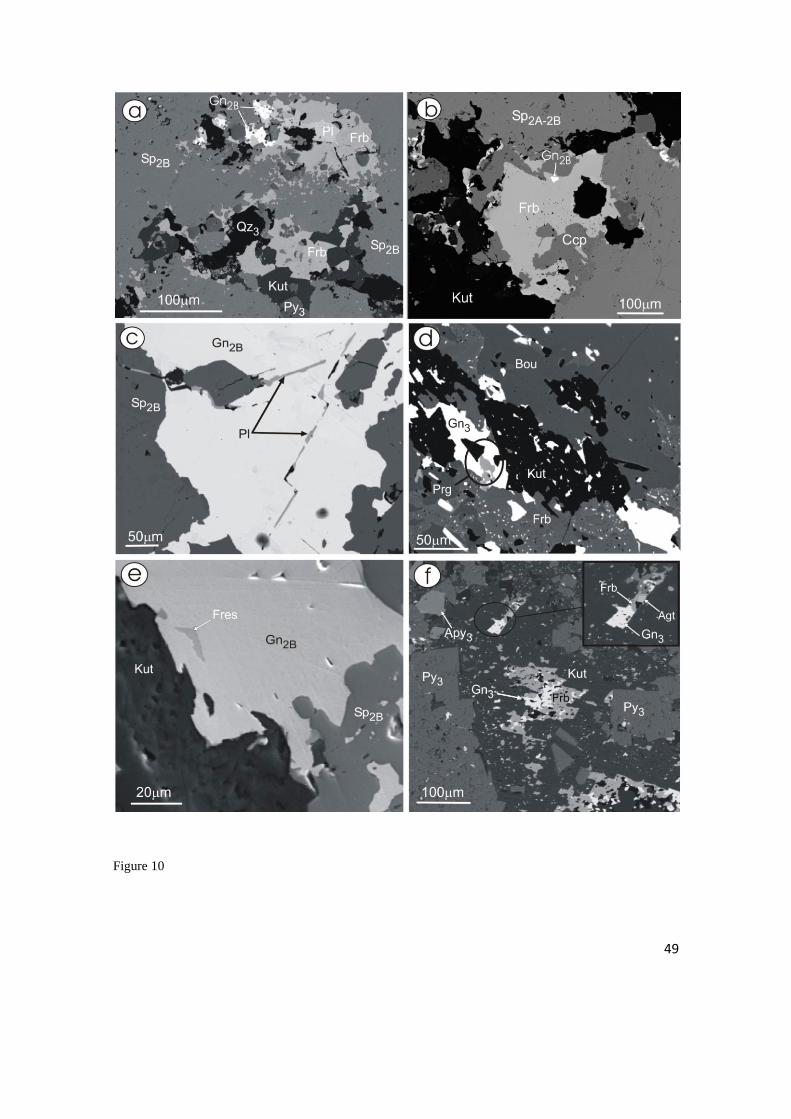
ACC
EPTE
D M
ANU
SCR
IPT
ACCEPTED MANUSCRIPT
49
Figure 10
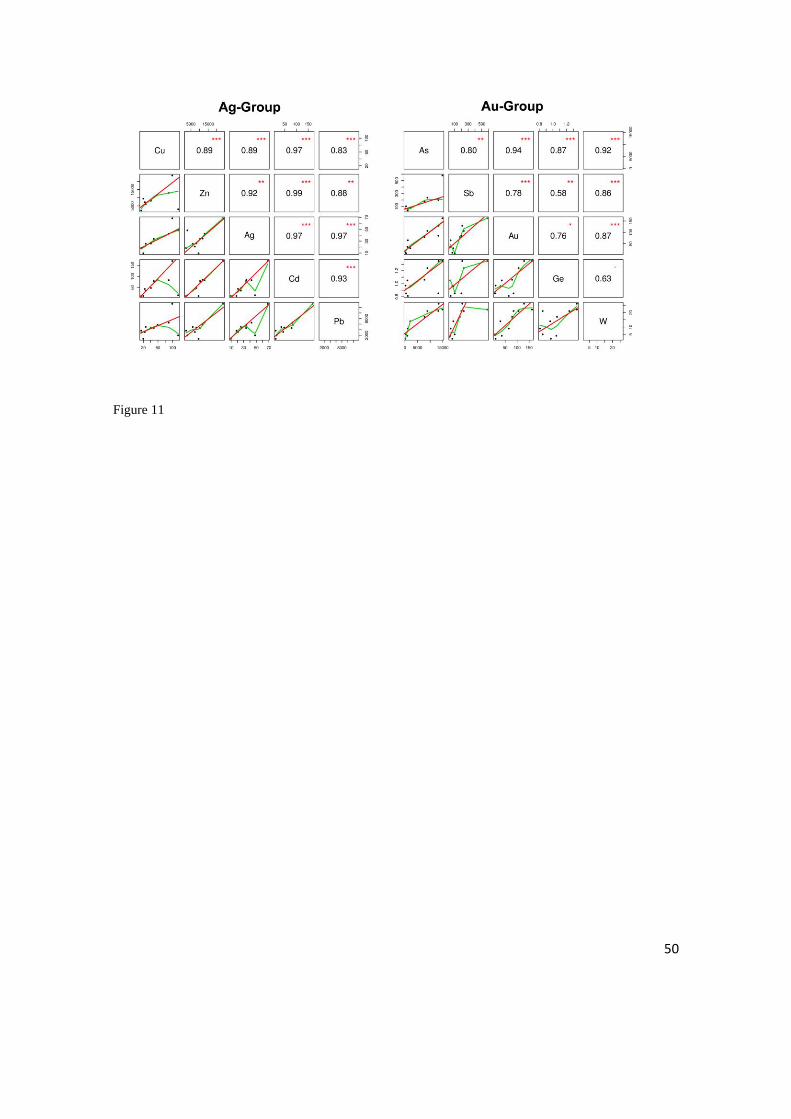
ACC
EPTE
D M
ANU
SCR
IPT
ACCEPTED MANUSCRIPT
50
Figure 11
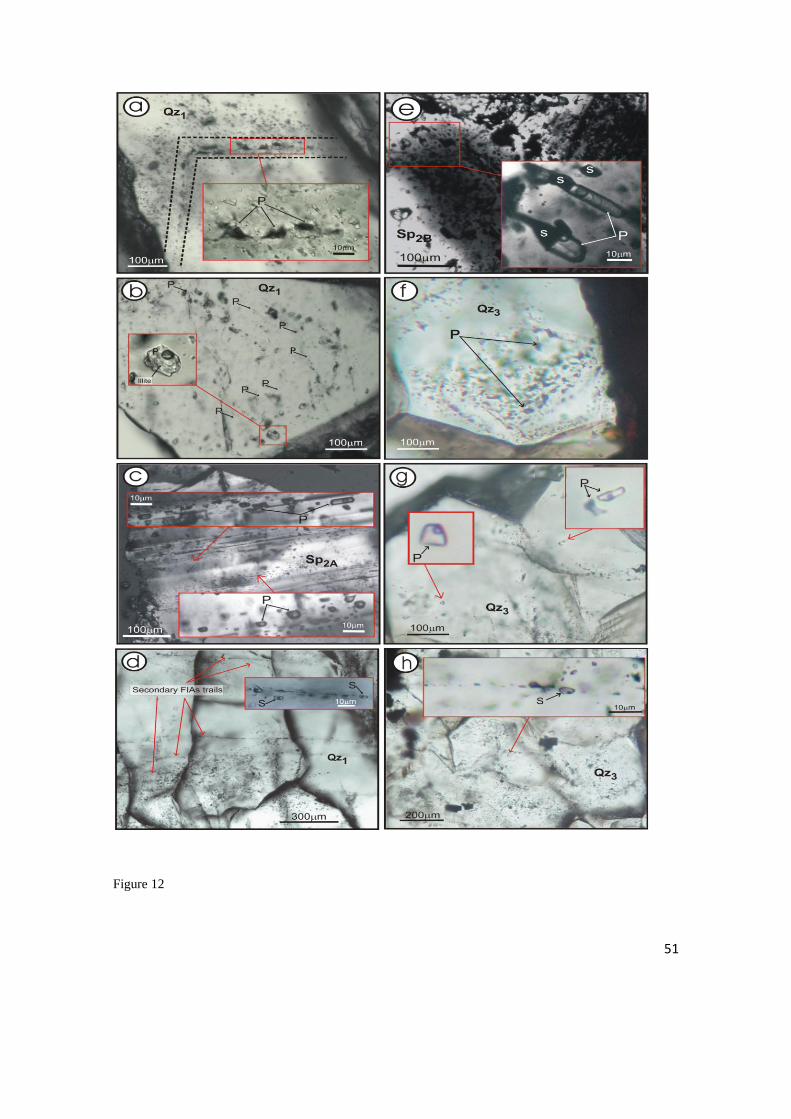
ACC
EPTE
D M
ANU
SCR
IPT
ACCEPTED MANUSCRIPT
51
Figure 12
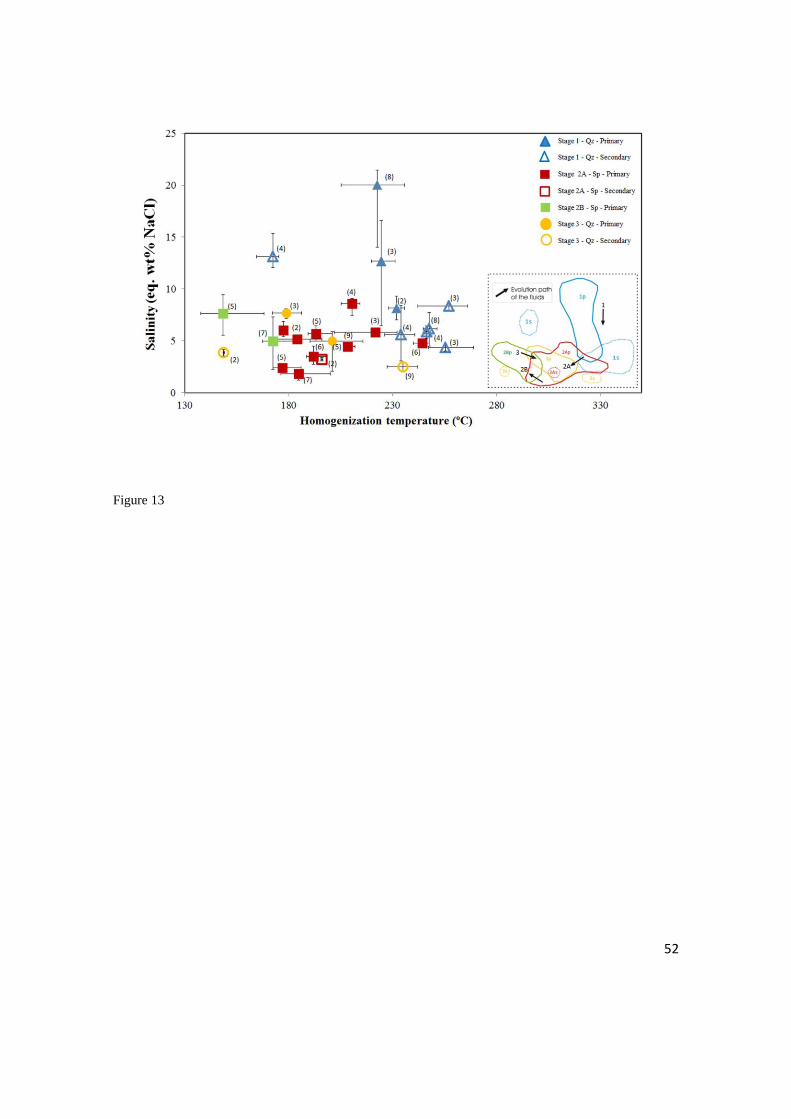
ACC
EPTE
D M
ANU
SCR
IPT
ACCEPTED MANUSCRIPT
52
Figure 13
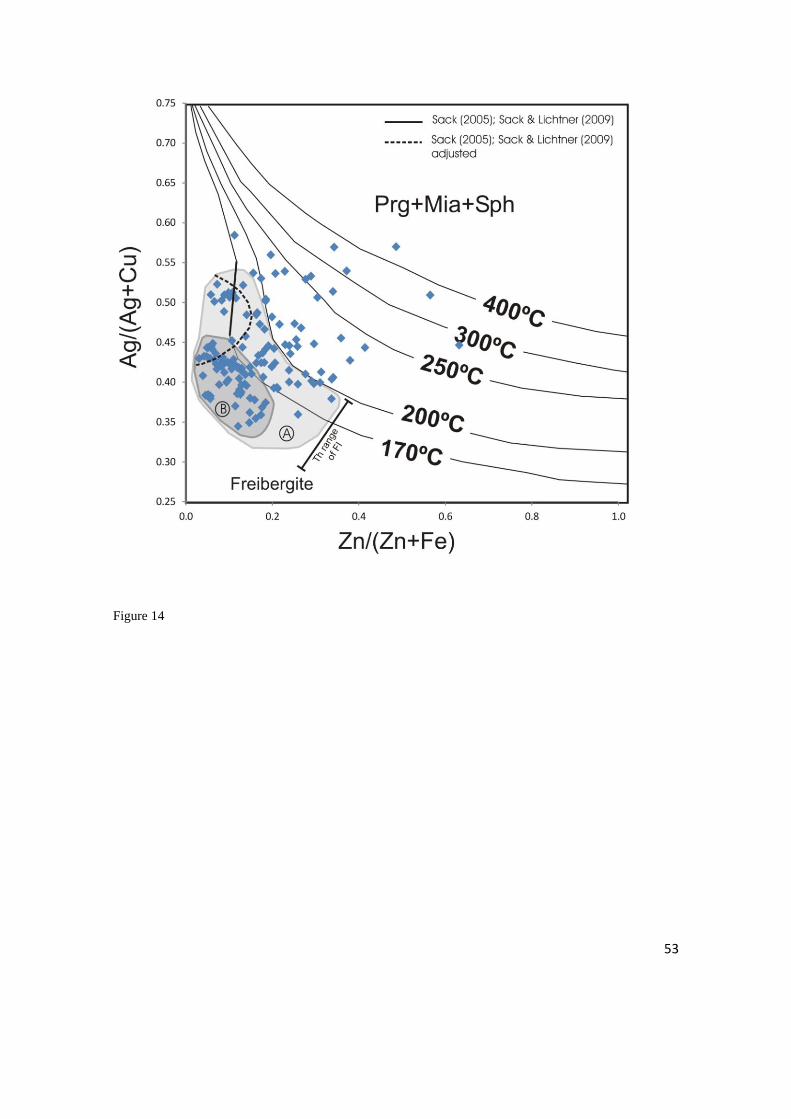
ACC
EPTE
D M
ANU
SCR
IPT
ACCEPTED MANUSCRIPT
53
Figure 14
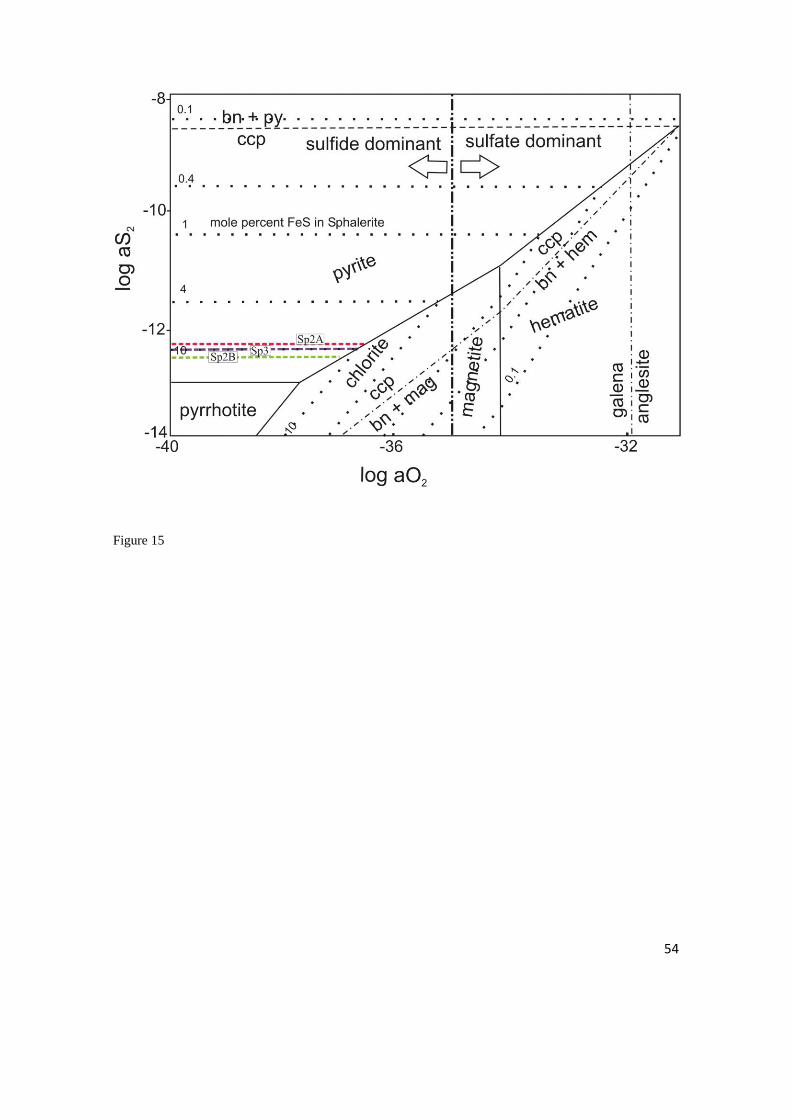
ACC
EPTE
D M
ANU
SCR
IPT
ACCEPTED MANUSCRIPT
54
Figure 15
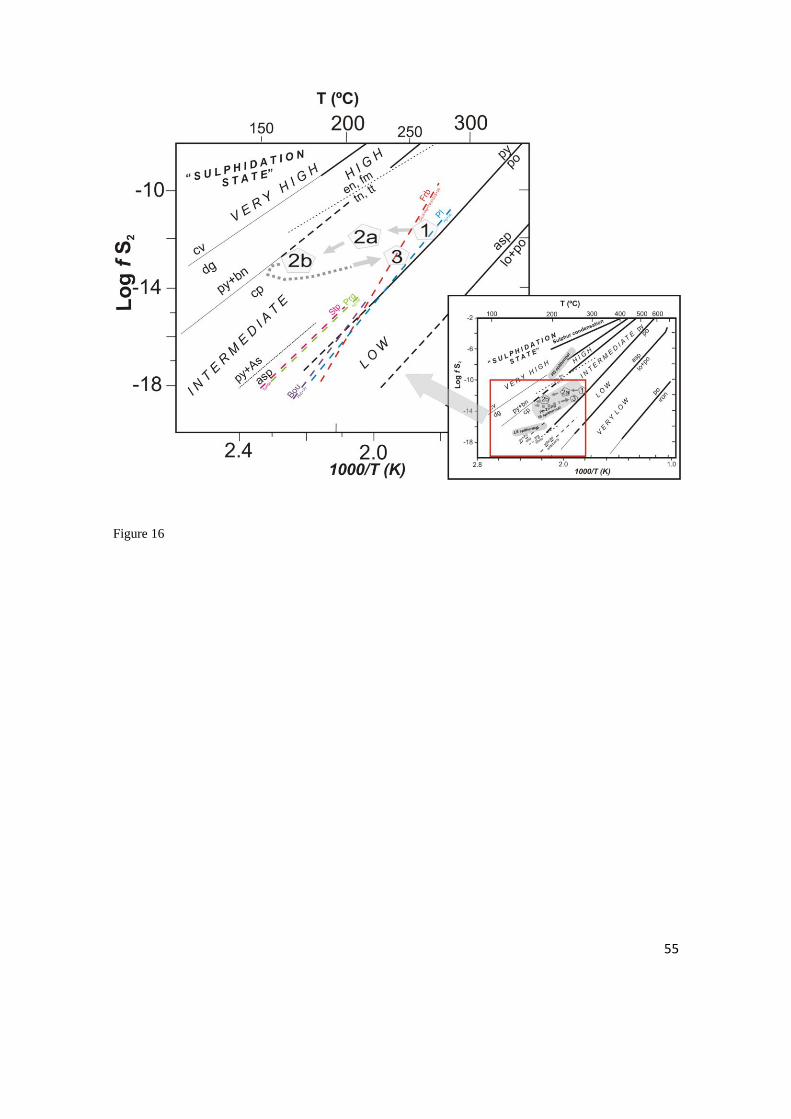
ACC
EPTE
D M
ANU
SCR
IPT
ACCEPTED MANUSCRIPT
55
Figure 16
ACC
EPTE
D M
ANU
SCR
IPT
ACCEPTED MANUSCRIPT
56
Figure captions
Fig. 1. (a) Location of the Patricia deposit and other Cenozoic deposits and prospects within major
metallogenic belts of northern Chile and southern Peru (modified from Camus and Dilles 2001) (b)
Simplified regional geologic map of the Tarapacá region. The location of the Patricia deposit and nearby
deposits and prospects in the area (Cerro Colorado, Sagasca, Yabricoya, Mocha and Queen Elizabeth) are
shown.
Fig. 2. (a) Simplified geological map showing the location of the three prospects (Patricia, Doris, La
Rosa) within the Paguanta Mining Exploration Project (b) Geological map of the Patricia deposit showing
the main units and the location of the three main mineralized veins (Campamento, Central and Catedral).
Location of the drillcore sampling is also shown in the map. Drill cores are commonly N-S oriented and
dip 40-60ºS.
Fig. 3. (a) General view of the western block in the Patricia ore deposit with the mineralized units within
the volcano-sedimentary unit represented in solid lines and the post-mineralization unit represented by
dashed lines. The main thrust fault system and the position of the western and eastern blocks are also
shown, (b) overview of the Patricia silicification and stockwork area in the eastern block, (c) detailed
photograph of the vuggy silica texture observed at Patricia ore deposit, (d) general geometry of the
hydrothermal vein system in the western block, (e-f) sample of amorphous silica and jasperoids,
respectively, located in the Patricia western block.
Fig. 4. (a) Drill core section showing the volcanic and volcano-clastic andesitic breccias hosting the
mineralization and regionally affected by chloritic alteration. Photomicrographs in transmitted light with
one polarizer of: (b) the typical altered host rock in the Patricia deposit affected by chloritic alteration
(greenish to brownish colors). Relicts of plagioclase and disseminate of pyrite are also visible and (c) vein
ACC
EPTE
D M
ANU
SCR
IPT
ACCEPTED MANUSCRIPT
57
showing sericitic (illite) alteration selvage overprinting the chloritic alteration of the host rock.
Abbreviations: Py = Pyrite , Plag = Plagioclase, Chl = Chlorite, Ser = Sericite.
Fig. 5. Drill-core sections showing the different types of mineralized veins observed in the Patricia ore
deposit; (a) symmetric, (b) asymmetric, (c) brecciated sulfides cemented by Qz3 and Apy3 , (d) veinlets of
pyrite and sphalerite, (e) massive sulfide and (f) veinlets mainly composed of quartz and pyrite ±
arsenopyrite. Abbreviations: Py1 = Pyrite stage 1, Apy1 = Arsenopyrite stage 1, Sp2A = Sphalerite stage
2A, Sp2B = Sphalerite stage 2B, Gn2B = Galena stage 2B, Py3 = Pyrite stage 3, Sp3 = Sphalerite stage 3,
Gn3 = Galena stage 3, Apy3 = Arsenopyrite stage 3, Qz1 = Quartz stage 1, Qz3 = Quartz stage 2 and Kut =
Kutnohorite.
Fig. 6. Mineral assemblages and paragenetic sequence present in the Patricia ore deposit. Thick bars
indicate higher abundances, thin and dashed lines refer to lower abundances.
Fig. 7. Photomicrographs of pre-ore stage samples; (a) detailed photograph of a thin section showing the
typical occurrence of Py1 near the vein-wallrock contact. (b) photomicrograph in transmitted light,
crossed-polar, showing the typical “comb” texture of quartz (Qz1), (c) reflected light photomicrograph,
one polar, showing Py1 at the contact between the host rock and the mineralized vein. EPMA
photomicrographs; (d) zoned idiomorphic grain of Py1 with As-rich bands, (e) Py1 grain being replaced by
galena and sphalerite, (f) zoned idiomorphic grain of Apy1 with Sb-rich bands. Abbreviations: Qz =
quartz, Py = pyrite, Apy = arsenopyrite, Gn = galena, Sp = sphalerite.
Fig. 8. Photographs of samples from de base-metal and silver stage: (a) detailed photograph of a thin
section showing zoned sphalerite grains, Sp2A, within a symmetrical vein, (b) Fe concentration map
superimposed onto a grain of Fe-zoned sphalerite, Sp2A. (c - d) photomicrographs in reflected light, one
polar, showing the typical texture of the sphalerite, Sp2B, in relationship to chalcopyrite, galena, pyrrhotite
and freibergite, (e) EPMA photomicrographs showing the typical distribution of Ag-bearing mineral
ACC
EPTE
D M
ANU
SCR
IPT
ACCEPTED MANUSCRIPT
58
within galena and filling voids between sphalerite, (f) Photomicrographs in transmitted light, one polar,
showing chlorite at the contact with sphalerite. Abbreviations: Sp = sphalerite, Py = pyrite, Frb =
freibergite, Gn = galena, Ccp = chalcopyrite, Po = pyrrhotite, Chl = chlorite and Qz = quartz.
Fig. 9. Photographs of post-ore stage samples: (a) detailed photograph of a thin section (DPTS) showing
the typical brecciated texture of sulfides cemented by quartz. (b) Photomicrograph with transmitted light,
crossed-polar, showing mosaic (jigsaw)-textured quartz as a cement of the brecciated sulfides. (c) DPTS
showing the distribution of Qtz3 and Apy3 cementing brecciated sulfides. (d) EPMA photomicrograph of
an oscillatory zoned grain of arsenopyrite, Apy3, with a Sb-rich core. (e) DPTS showing thin vein of
pyrite, Py2, and sphalerite, Sp3, with the presence of (f) zoned sphalerite crystals. (g) DPTS showing a
late-vein of Kut crosscutting Qz3 and the brecciated sulfides. (h) EPMA photomicrograph of a lead
sulfosalt (boulangerite) within a silver sulfosalt (freibergite). Abbreviations: Frb = freibergite, Apy =
arsenopyrite, Bou = boulangerite, Gn = galena, Kut = kutnohorite, Qz = quartz, Py = pyrite, Sp =
sphalerite.
Fig. 10. Scanning Electron Microscope photomicrographs: (a) Ag-bearing minerals filling spaces among
aggregates of sphalerite grains; EPMA photomicrographs: (b) freibergite filling spaces between sphalerite
grains in close association with chalcopyrite, galena and kutnohorite (c) elongated polybasite grains
within galena (d) boulangerite, freibergite and pyrargyrite within galena and kutnohorite filling voids in
sphalerite (e) freieslebenite within galena (f) tiny acanthite grain and freibergite within galena in a
kutnohorite matrix. Abbreviations: Agt = acanthite, Bou = boulangerite, Ccp = chalcopyrite, Fres =
freieslebenite, Frb = freibergite, Gn = galena, Kut = kutnohorite, Pl = polybasite, Py = pyrite, Prg =
pyrargyrite, Sp = sphalerite.
Fig. 11. Matrix of scatterplots of the two groups of elements (Ag and Au groups) with positive
correlations calculated from whole-ore composition of the mineralized veins. Lower panels contain the
scatterplot of each pair of elements, the model of the robust linear regression (red) and the Tukey

ACC
EPTE
D M
ANU
SCR
IPT
ACCEPTED MANUSCRIPT
59
smoothing line (green). Upper panels contain the r squared coefficient and the level of significance of the
robust linear regression (*** = 0.999; ** = 0.99; * = 0.95; · = 0.90). Units are in ppm except for Au
which is in ppb.
Fig. 12. Photomicrographs of fluid inclusion assemblages (FIAs) of the three main stages of
mineralization: (a-b) Primary FIAs in growth bands of quartz (Qz1). (b) Detail of fibrous hydrous
phyllosilicate, likely illite, trapped within a primary fluid inclusion. (c) Primary FIAs in Sp1 distributed in
parallel growth bands of Sp. (d) Secondary FIAs occurring as parallel trails in Qz1. Note that these
inclusions are smaller than primary ones. (e) Primary FIAs in Sp2B characterized by the presence of
chalcopyrite and Ag-sulfosalt inclusions. (f) Dark primary FIAs distributed in parallel growth bands of
Qz3. (g) Individual groups of primary FIAs in Qz3. (h) several trails of secondary FIAs in Qz3.
Fig. 13. Range in measured homogenization temperature and salinity of individual fluid inclusion
assemblages (FIAs) observed in the Patricia ore deposit. Each data point corresponds to the average
homogenization temperature and salinity for the fluid inclusion assemblage and the error bars represent
the minimum and the maximum values for each FIA. A possible evolution path of the mineralizing fluids
in the deposit is shown in the lower right corner (n) Number of fluid inclusions in each FIA.
Fig. 14. Molar Ag/ (Ag + Cu) and Zn/ (Zn + Fe) concentration of freibergite from the Patricia ore deposit
compared with the maximum solubility of Ag in freibergite in the system Ag2S-Cu2S-ZnS-FeS-Sb2S3 at
170, 200, 250, 300, and 400 °C [freibergite in equilibrium with pyrargyrite (Prg), sphalerite (Sph), and
miargyrite (Mia)] modified from Sack (2005). It is also shown, with a solid line, the approximate
miscibility gap for fahlores for the 170°C isotherm calculated by Sack (2005) and, with a dashed black
curve, the approximation for the polythermal miscibility gap intersection with the isotherms and
translated it downwards in Ag/(Ag+Cu) ratios while maintaining the width of the gap calculated at 170°C
(adjusted from Sack 2005; Sack and Lichtner 2009).
ACC
EPTE
D M
ANU
SCR
IPT
ACCEPTED MANUSCRIPT
60
curve).
Two shaded areas (A-B) delimit the areas with the most common freibergite analysis which indicates
temperatures <200 ºC. The darker shaded area (B) below the 170 ºC isotherm shows higher concentration
of freibergite. The solid bar show the range of homogenization temperature (Th) of FI observed in
sphalerite containing Ag-bearing minerals from sub-stage 2B.
Fig. 15. Activity of sulfur versus activity of oxygen diagram showing the stability fields for the main
minerals in the Patricia deposit at 250ºC. Dashed colored lines show the 3 sphalerite assemblages
observed in the Patricia ore deposit. Also, show by the heavy vertical dashed-dot line is the boundary
between fields of dominant aqueous sulfur species, H2S and NaSO4 at a pH = 5.4. Modified from Barton
et al., 1977.
Fig. 16. Log fS2 vs. Temperature diagram showing the inferred evolution path of the hydrothermal fluids
in the Patricia ore deposit. (1) Pre-ore stage; (2a-2b) Base-metal and Ag stage and (3) Post-ore stage,
based on observed mineral assemblages, fluid inclusion microthermometry and sulfide geothermometer.
The diagram shows the relative sulfidation states of hydrothermal fluids in porphyry deposits and
epithermal ore mineral stability fields (modified from Einaudi et al. 2003).
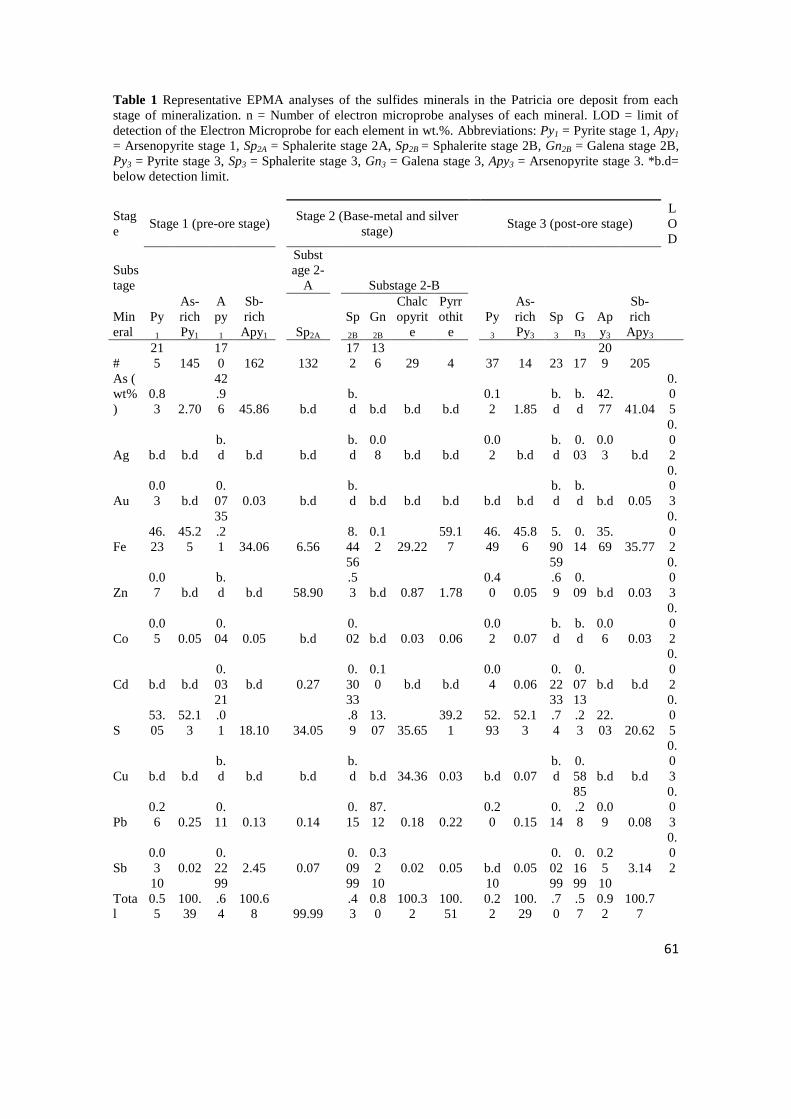
ACC
EPTE
D M
ANU
SCR
IPT
ACCEPTED MANUSCRIPT
61
Table 1 Representative EPMA analyses of the sulfides minerals in the Patricia ore deposit from each
stage of mineralization. n = Number of electron microprobe analyses of each mineral. LOD = limit of
detection of the Electron Microprobe for each element in wt.%. Abbreviations: Py1 = Pyrite stage 1, Apy1
= Arsenopyrite stage 1, Sp2A = Sphalerite stage 2A, Sp2B = Sphalerite stage 2B, Gn2B = Galena stage 2B,
Py3 = Pyrite stage 3, Sp3 = Sphalerite stage 3, Gn3 = Galena stage 3, Apy3 = Arsenopyrite stage 3. *b.d=
below detection limit.
Stag
e Stage 1 (pre-ore stage)
Stage 2 (Base-metal and silver
stage) Stage 3 (post-ore stage)
L
O
D
Subs
tage
Subst
age 2-
A Substage 2-B
Min
eral
Py
1
As-
rich
Py1
A
py
1
Sb-
rich
Apy1 Sp2A
Sp
2B
Gn
2B
Chalc
opyrit
e
Pyrr
othit
e
Py
3
As-
rich
Py3
Sp
3
G
n3
Ap
y3
Sb-
rich
Apy3
#
21
5 145
17
0 162 132
17
2
13
6 29 4 37 14 23 17
20
9 205
As (
wt%
)
0.8
3 2.70
42
.9
6 45.86 b.d
b.
d b.d b.d b.d
0.1
2 1.85
b.
d
b.
d
42.
77 41.04
0.
0
5
Ag b.d b.d
b.
d b.d b.d
b.
d
0.0
8 b.d b.d
0.0
2 b.d
b.
d
0.
03
0.0
3 b.d
0.
0
2
Au
0.0
3 b.d
0.
07 0.03 b.d
b.
d b.d b.d b.d b.d b.d
b.
d
b.
d b.d 0.05
0.
0
3
Fe
46.
23
45.2
5
35
.2
1 34.06 6.56
8.
44
0.1
2 29.22
59.1
7
46.
49
45.8
6
5.
90
0.
14
35.
69 35.77
0.
0
2
Zn
0.0
7 b.d
b.
d b.d 58.90
56
.5
3 b.d 0.87 1.78
0.4
0 0.05
59
.6
9
0.
09 b.d 0.03
0.
0
3
Co
0.0
5 0.05
0.
04 0.05 b.d
0.
02 b.d 0.03 0.06
0.0
2 0.07
b.
d
b.
d
0.0
6 0.03
0.
0
2
Cd b.d b.d
0.
03 b.d 0.27
0.
30
0.1
0 b.d b.d
0.0
4 0.06
0.
22
0.
07 b.d b.d
0.
0
2
S
53.
05
52.1
3
21
.0
1 18.10 34.05
33
.8
9
13.
07 35.65
39.2
1
52.
93
52.1
3
33
.7
4
13
.2
3
22.
03 20.62
0.
0
5
Cu b.d b.d
b.
d b.d b.d
b.
d b.d 34.36 0.03 b.d 0.07
b.
d
0.
58 b.d b.d
0.
0
3
Pb
0.2
6 0.25
0.
11 0.13 0.14
0.
15
87.
12 0.18 0.22
0.2
0 0.15
0.
14
85
.2
8
0.0
9 0.08
0.
0
3
Sb
0.0
3 0.02
0.
22 2.45 0.07
0.
09
0.3
2 0.02 0.05 b.d 0.05
0.
02
0.
16
0.2
5 3.14
0.
0
2
Tota
l
10
0.5
5
100.
39
99
.6
4
100.6
8 99.99
99
.4
3
10
0.8
0
100.3
2
100.
51
10
0.2
2
100.
29
99
.7
0
99
.5
7
10
0.9
2
100.7
7
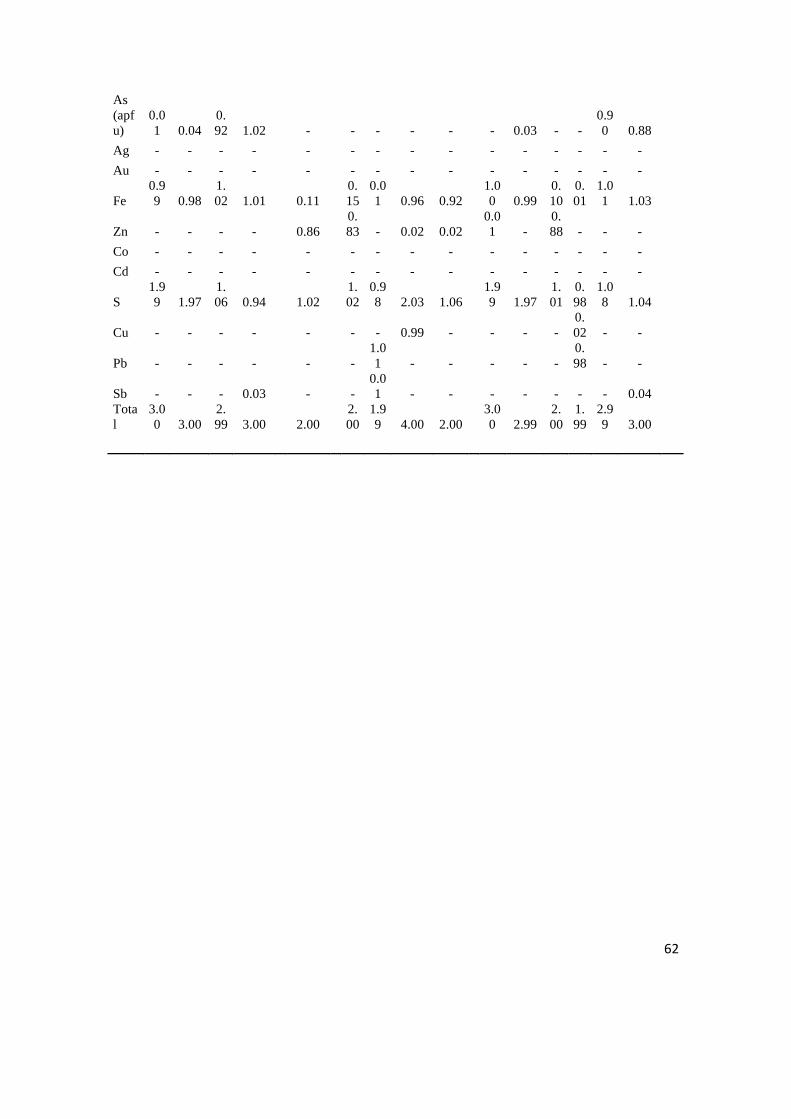
ACC
EPTE
D M
ANU
SCR
IPT
ACCEPTED MANUSCRIPT
62
As
(apf
u)
0.0
1 0.04
0.
92 1.02 - - - - - - 0.03 - -
0.9
0 0.88
Ag - - - - - - - - - - - - - - -
Au - - - - - - - - - - - - - - -
Fe
0.9
9 0.98
1.
02 1.01 0.11
0.
15
0.0
1 0.96 0.92
1.0
0 0.99
0.
10
0.
01
1.0
1 1.03
Zn - - - - 0.86
0.
83 - 0.02 0.02
0.0
1 -
0.
88 - - -
Co - - - - - - - - - - - - - - -
Cd - - - - - - - - - - - - - - -
S
1.9
9 1.97
1.
06 0.94 1.02
1.
02
0.9
8 2.03 1.06
1.9
9 1.97
1.
01
0.
98
1.0
8 1.04
Cu - - - - - - - 0.99 - - - -
0.
02 - -
Pb - - - - - -
1.0
1 - - - - -
0.
98 - -
Sb - - - 0.03 - -
0.0
1 - - - - - - - 0.04
Tota
l
3.0
0 3.00
2.
99 3.00 2.00
2.
00
1.9
9 4.00 2.00
3.0
0 2.99
2.
00
1.
99
2.9
9 3.00
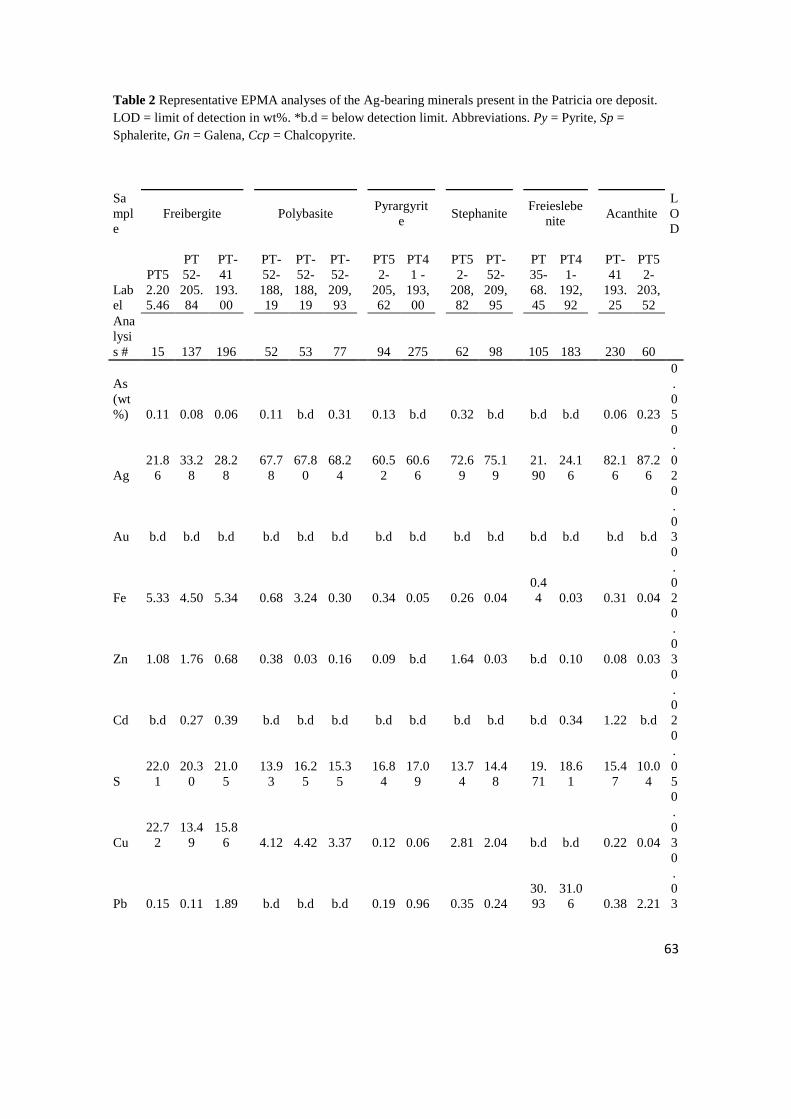
ACC
EPTE
D M
ANU
SCR
IPT
ACCEPTED MANUSCRIPT
63
Table 2 Representative EPMA analyses of the Ag-bearing minerals present in the Patricia ore deposit.
LOD = limit of detection in wt%. *b.d = below detection limit. Abbreviations. Py = Pyrite, Sp =
Sphalerite, Gn = Galena, Ccp = Chalcopyrite.
Sa
mpl
e
Freibergite Polybasite Pyrargyrit
e Stephanite
Freieslebe
nite Acanthite
L
O
D
Lab
el
PT5
2.20
5.46
PT
52-
205.
84
PT-
41
193.
00
PT-
52-
188,
19
PT-
52-
188,
19
PT-
52-
209,
93
PT5
2-
205,
62
PT4
1 -
193,
00
PT5
2-
208,
82
PT-
52-
209,
95
PT
35-
68.
45
PT4
1-
192,
92
PT-
41
193.
25
PT5
2-
203,
52
Ana
lysi
s # 15 137 196 52 53 77 94 275 62 98 105 183 230 60
As
(wt
%) 0.11 0.08 0.06 0.11 b.d 0.31 0.13 b.d 0.32 b.d b.d b.d 0.06 0.23
0
.
0
5
Ag
21.8
6
33.2
8
28.2
8
67.7
8
67.8
0
68.2
4
60.5
2
60.6
6
72.6
9
75.1
9
21.
90
24.1
6
82.1
6
87.2
6
0
.
0
2
Au b.d b.d b.d b.d b.d b.d b.d b.d b.d b.d b.d b.d b.d b.d
0
.
0
3
Fe 5.33 4.50 5.34 0.68 3.24 0.30 0.34 0.05 0.26 0.04
0.4
4 0.03 0.31 0.04
0
.
0
2
Zn 1.08 1.76 0.68 0.38 0.03 0.16 0.09 b.d 1.64 0.03 b.d 0.10 0.08 0.03
0
.
0
3
Cd b.d 0.27 0.39 b.d b.d b.d b.d b.d b.d b.d b.d 0.34 1.22 b.d
0
.
0
2
S
22.0
1
20.3
0
21.0
5
13.9
3
16.2
5
15.3
5
16.8
4
17.0
9
13.7
4
14.4
8
19.
71
18.6
1
15.4
7
10.0
4
0
.
0
5
Cu
22.7
2
13.4
9
15.8
6 4.12 4.42 3.37 0.12 0.06 2.81 2.04 b.d b.d 0.22 0.04
0
.
0
3
Pb 0.15 0.11 1.89 b.d b.d b.d 0.19 0.96 0.35 0.24
30.
93
31.0
6 0.38 2.21
0
.
0
3
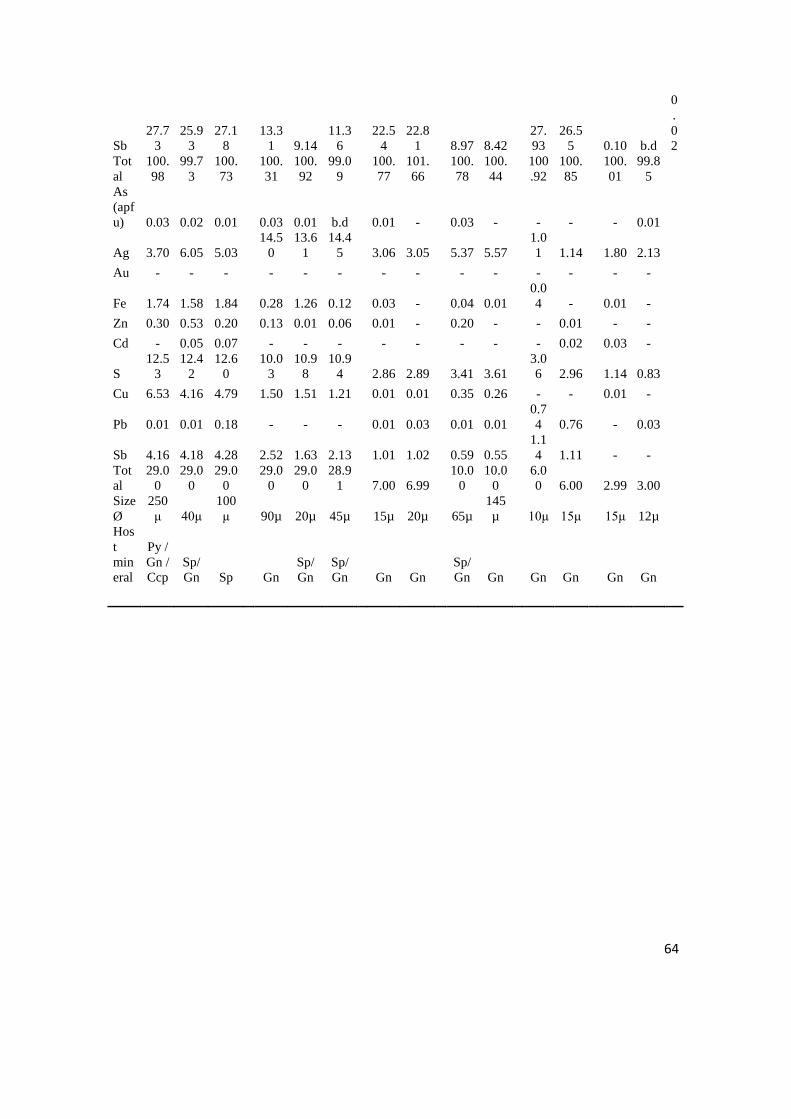
ACC
EPTE
D M
ANU
SCR
IPT
ACCEPTED MANUSCRIPT
64
Sb
27.7
3
25.9
3
27.1
8
13.3
1 9.14
11.3
6
22.5
4
22.8
1 8.97 8.42
27.
93
26.5
5 0.10 b.d
0
.
0
2
Tot
al
100.
98
99.7
3
100.
73
100.
31
100.
92
99.0
9
100.
77
101.
66
100.
78
100.
44
100
.92
100.
85
100.
01
99.8
5
As
(apf
u) 0.03 0.02 0.01 0.03 0.01 b.d 0.01 - 0.03 - - - - 0.01
Ag 3.70 6.05 5.03
14.5
0
13.6
1
14.4
5 3.06 3.05 5.37 5.57
1.0
1 1.14 1.80 2.13
Au - - - - - - - - - - - - - -
Fe 1.74 1.58 1.84 0.28 1.26 0.12 0.03 - 0.04 0.01
0.0
4 - 0.01 -
Zn 0.30 0.53 0.20 0.13 0.01 0.06 0.01 - 0.20 - - 0.01 - -
Cd - 0.05 0.07 - - - - - - - - 0.02 0.03 -
S
12.5
3
12.4
2
12.6
0
10.0
3
10.9
8
10.9
4 2.86 2.89 3.41 3.61
3.0
6 2.96 1.14 0.83
Cu 6.53 4.16 4.79 1.50 1.51 1.21 0.01 0.01 0.35 0.26 - - 0.01 -
Pb 0.01 0.01 0.18 - - - 0.01 0.03 0.01 0.01
0.7
4 0.76 - 0.03
Sb 4.16 4.18 4.28 2.52 1.63 2.13 1.01 1.02 0.59 0.55
1.1
4 1.11 - -
Tot
al
29.0
0
29.0
0
29.0
0
29.0
0
29.0
0
28.9
1 7.00 6.99
10.0
0
10.0
0
6.0
0 6.00 2.99 3.00
Size
Ø
250
μ 40μ
100
μ
90µ 20µ 45µ 15µ 20µ 65µ
145
µ 10μ 15μ 15μ 12µ
Hos
t
min
eral
Py /
Gn /
Ccp
Sp/
Gn Sp Gn
Sp/
Gn
Sp/
Gn Gn Gn
Sp/
Gn Gn Gn Gn Gn Gn
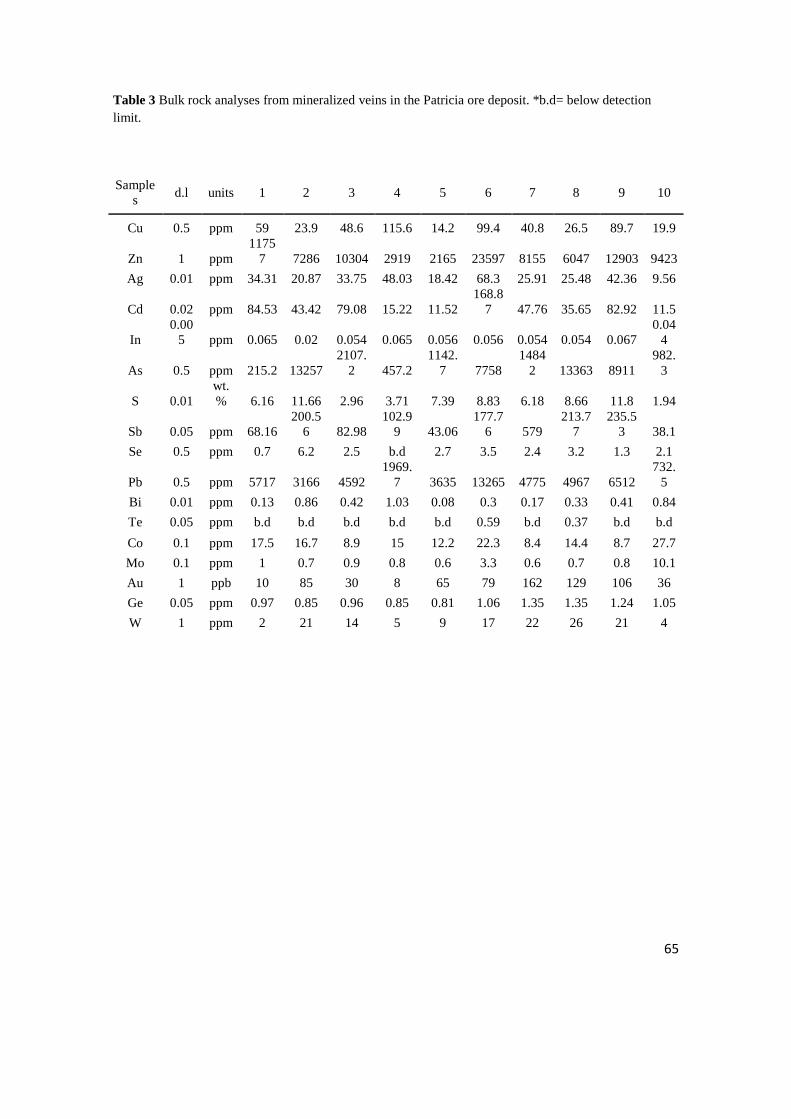
ACC
EPTE
D M
ANU
SCR
IPT
ACCEPTED MANUSCRIPT
65
Table 3 Bulk rock analyses from mineralized veins in the Patricia ore deposit. *b.d= below detection
limit.
Sample
s d.l units 1 2 3 4 5 6 7 8 9 10
Cu 0.5 ppm 59 23.9 48.6 115.6 14.2 99.4 40.8 26.5 89.7 19.9
Zn 1 ppm
1175
7 7286 10304 2919 2165 23597 8155 6047 12903 9423
Ag 0.01 ppm 34.31 20.87 33.75 48.03 18.42 68.3 25.91 25.48 42.36 9.56
Cd 0.02 ppm 84.53 43.42 79.08 15.22 11.52
168.8
7 47.76 35.65 82.92 11.5
In
0.00
5 ppm 0.065 0.02 0.054 0.065 0.056 0.056 0.054 0.054 0.067
0.04
4
As 0.5 ppm 215.2 13257
2107.
2 457.2
1142.
7 7758
1484
2 13363 8911
982.
3
S 0.01
wt.
% 6.16 11.66 2.96 3.71 7.39 8.83 6.18 8.66 11.8 1.94
Sb 0.05 ppm 68.16
200.5
6 82.98
102.9
9 43.06
177.7
6 579
213.7
7
235.5
3 38.1
Se 0.5 ppm 0.7 6.2 2.5 b.d 2.7 3.5 2.4 3.2 1.3 2.1
Pb 0.5 ppm 5717 3166 4592
1969.
7 3635 13265 4775 4967 6512
732.
5
Bi 0.01 ppm 0.13 0.86 0.42 1.03 0.08 0.3 0.17 0.33 0.41 0.84
Te 0.05 ppm b.d b.d b.d b.d b.d 0.59 b.d 0.37 b.d b.d
Co 0.1 ppm 17.5 16.7 8.9 15 12.2 22.3 8.4 14.4 8.7 27.7
Mo 0.1 ppm 1 0.7 0.9 0.8 0.6 3.3 0.6 0.7 0.8 10.1
Au 1 ppb 10 85 30 8 65 79 162 129 106 36
Ge 0.05 ppm 0.97 0.85 0.96 0.85 0.81 1.06 1.35 1.35 1.24 1.05
W 1 ppm 2 21 14 5 9 17 22 26 21 4
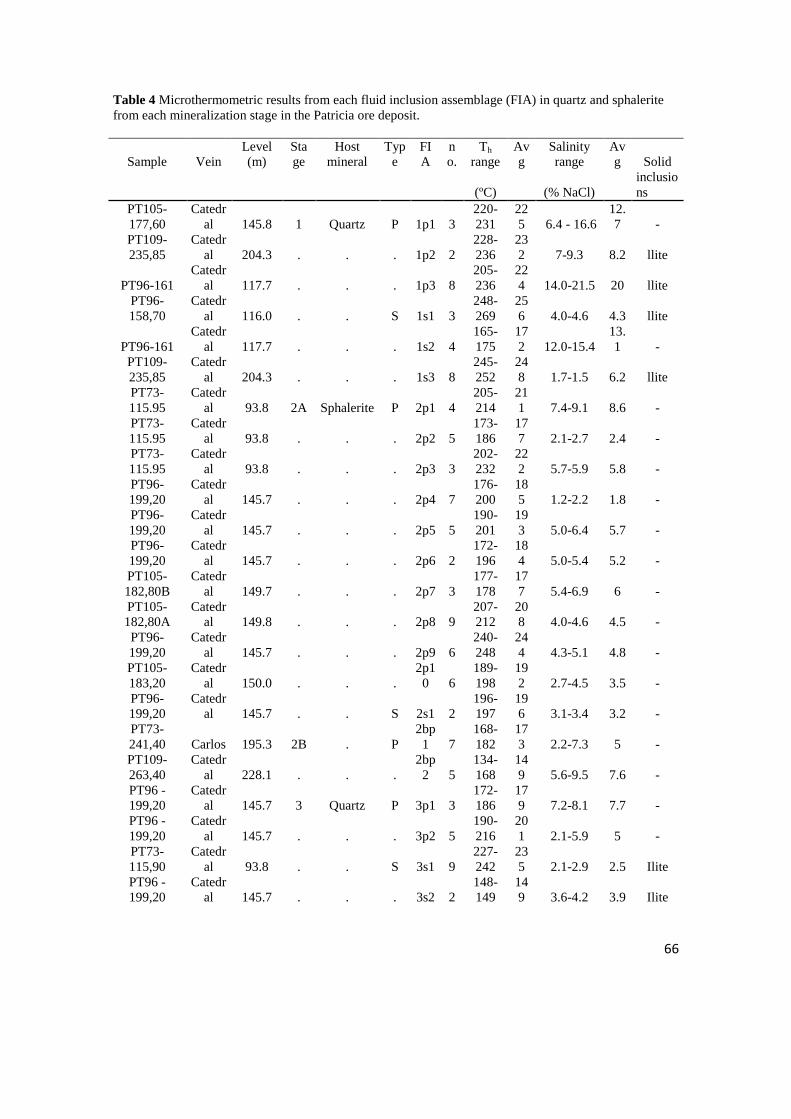
ACC
EPTE
D M
ANU
SCR
IPT
ACCEPTED MANUSCRIPT
66
Table 4 Microthermometric results from each fluid inclusion assemblage (FIA) in quartz and sphalerite
from each mineralization stage in the Patricia ore deposit.
Sample Vein
Level
(m)
Sta
ge
Host
mineral
Typ
e
FI
A
n
o.
Th
range
Av
g
Salinity
range
Av
g Solid
(ºC) (% NaCl)
inclusio
ns
PT105-
177,60
Catedr
al 145.8 1 Quartz P 1p1 3
220-
231
22
5 6.4 - 16.6
12.
7 -
PT109-
235,85
Catedr
al 204.3 . . . 1p2 2
228-
236
23
2 7-9.3 8.2 llite
PT96-161
Catedr
al 117.7 . . . 1p3 8
205-
236
22
4 14.0-21.5 20 llite
PT96-
158,70
Catedr
al 116.0 . . S 1s1 3
248-
269
25
6 4.0-4.6 4.3 llite
PT96-161
Catedr
al 117.7 . . . 1s2 4
165-
175
17
2 12.0-15.4
13.
1 -
PT109-
235,85
Catedr
al 204.3 . . . 1s3 8
245-
252
24
8 1.7-1.5 6.2 llite
PT73-
115.95
Catedr
al 93.8 2A Sphalerite P 2p1 4
205-
214
21
1 7.4-9.1 8.6 -
PT73-
115.95
Catedr
al 93.8 . . . 2p2 5
173-
186
17
7 2.1-2.7 2.4 -
PT73-
115.95
Catedr
al 93.8 . . . 2p3 3
202-
232
22
2 5.7-5.9 5.8 -
PT96-
199,20
Catedr
al 145.7 . . . 2p4 7
176-
200
18
5 1.2-2.2 1.8 -
PT96-
199,20
Catedr
al 145.7 . . . 2p5 5
190-
201
19
3 5.0-6.4 5.7 -
PT96-
199,20
Catedr
al 145.7 . . . 2p6 2
172-
196
18
4 5.0-5.4 5.2 -
PT105-
182,80B
Catedr
al 149.7 . . . 2p7 3
177-
178
17
7 5.4-6.9 6 -
PT105-
182,80A
Catedr
al 149.8 . . . 2p8 9
207-
212
20
8 4.0-4.6 4.5 -
PT96-
199,20
Catedr
al 145.7 . . . 2p9 6
240-
248
24
4 4.3-5.1 4.8 -
PT105-
183,20
Catedr
al 150.0 . . .
2p1
0 6
189-
198
19
2 2.7-4.5 3.5 -
PT96-
199,20
Catedr
al 145.7 . . S 2s1 2
196-
197
19
6 3.1-3.4 3.2 -
PT73-
241,40 Carlos 195.3 2B . P
2bp
1 7
168-
182
17
3 2.2-7.3 5 -
PT109-
263,40
Catedr
al 228.1 . . .
2bp
2 5
134-
168
14
9 5.6-9.5 7.6 -
PT96 -
199,20
Catedr
al 145.7 3 Quartz P 3p1 3
172-
186
17
9 7.2-8.1 7.7 -
PT96 -
199,20
Catedr
al 145.7 . . . 3p2 5
190-
216
20
1 2.1-5.9 5 -
PT73-
115,90
Catedr
al 93.8 . . S 3s1 9
227-
242
23
5 2.1-2.9 2.5 Ilite
PT96 -
199,20
Catedr
al 145.7 . . . 3s2 2
148-
149
14
9 3.6-4.2 3.9 Ilite

ACC
EPTE
D M
ANU
SCR
IPT
ACCEPTED MANUSCRIPT
67
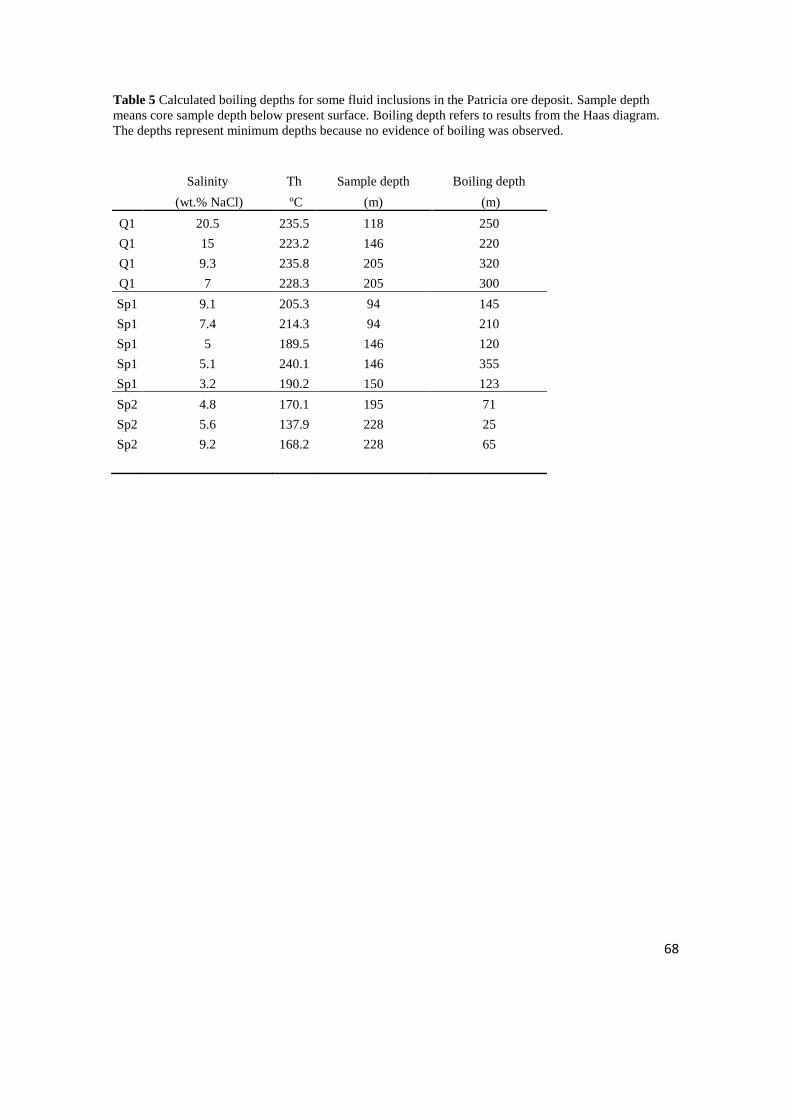
ACC
EPTE
D M
ANU
SCR
IPT
ACCEPTED MANUSCRIPT
68
Table 5 Calculated boiling depths for some fluid inclusions in the Patricia ore deposit. Sample depth
means core sample depth below present surface. Boiling depth refers to results from the Haas diagram.
The depths represent minimum depths because no evidence of boiling was observed.
Salinity Th Sample depth Boiling depth
(wt.% NaCl) ºC (m) (m)
Q1 20.5 235.5 118 250
Q1 15 223.2 146 220
Q1 9.3 235.8 205 320
Q1 7 228.3 205 300
Sp1 9.1 205.3 94 145
Sp1 7.4 214.3 94 210
Sp1 5 189.5 146 120
Sp1 5.1 240.1 146 355
Sp1 3.2 190.2 150 123
Sp2 4.8 170.1 195 71
Sp2 5.6 137.9 228 25
Sp2 9.2 168.2 228 65

ACC
EPTE
D M
ANU
SCR
IPT
ACCEPTED MANUSCRIPT
69
Conflict of Interest
There is no conflict of interest in our work.
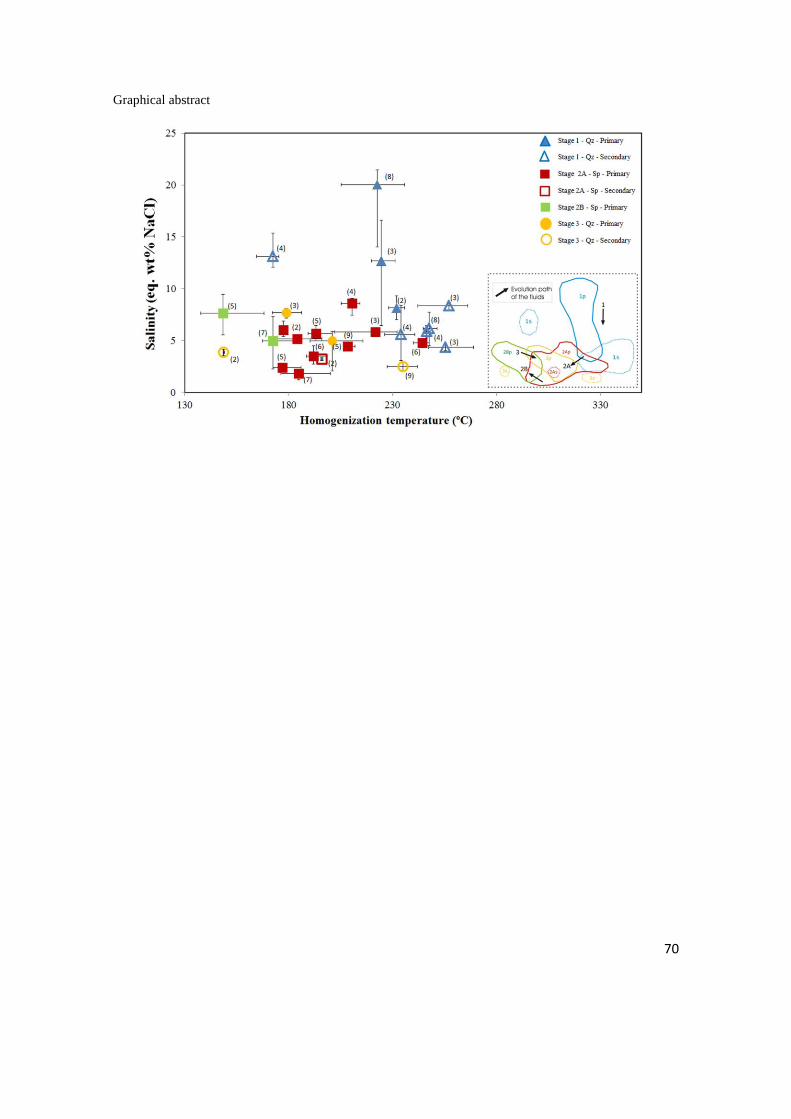
ACC
EPTE
D M
ANU
SCR
IPT
ACCEPTED MANUSCRIPT
70
Graphical abstract
ACC
EPTE
D M
ANU
SCR
IPT
ACCEPTED MANUSCRIPT
71
Highlights
1) Patricia is a recently discovered epithermal deposit located in northeastern Chile
2) Main mineralogy consists of base-metal sulfides, pyrite and Ag-sulfosalts.
3) Mineralization is emplaced as E-W veins within a sinistral strike-slip regime.
4) Mineralogy is consistent with an intermediate sulfidation epithermal deposit type.
5) High potential for hidden economic mineralization at depth in the western block.