the outlook for the oil storage industry - platts.com outlook for the oil storage industry 1. ......
TRANSCRIPT
January 2013
The outlook for the oil storage industry
Introduction
Charles Smissaert
General Manager
Botlek Tank Terminal
Rotterdam

Contents:
The outlook for the oil storage industry
1. Introduction Botlek Tank Terminal
2. Trends in the Oil products Market
3. Tank storage market (ARA)
4. Conclusion and future trends
Introduction BTT
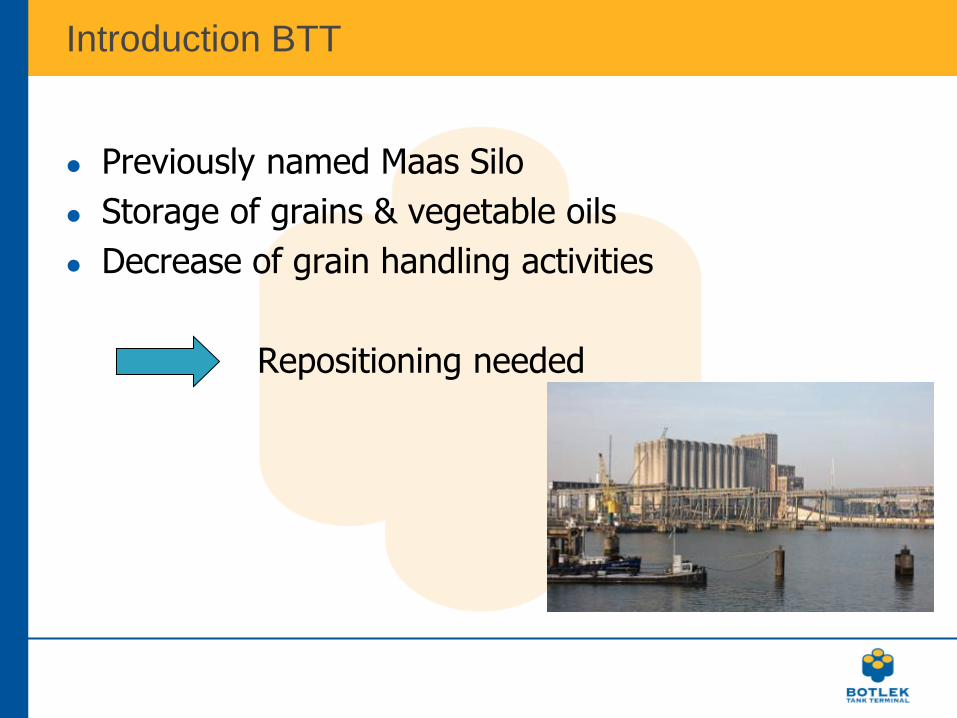
Previously named Maas Silo
Storage of grains & vegetable oils
Decrease of grain handling activities
Repositioning needed
Introduction BTT
Development of state-of-the-art tank terminal
Phase 1 – 200.000 cbm started-up in 2011
Phase 2 in development (start up from Q4 2014)
Key markets:
Gasoline and Gasoline components
Middle distillates and jetfuel
Bio Fuels
Edible Oils
Petrochemicals

December 2009

September 2010

August 2011
February 2012
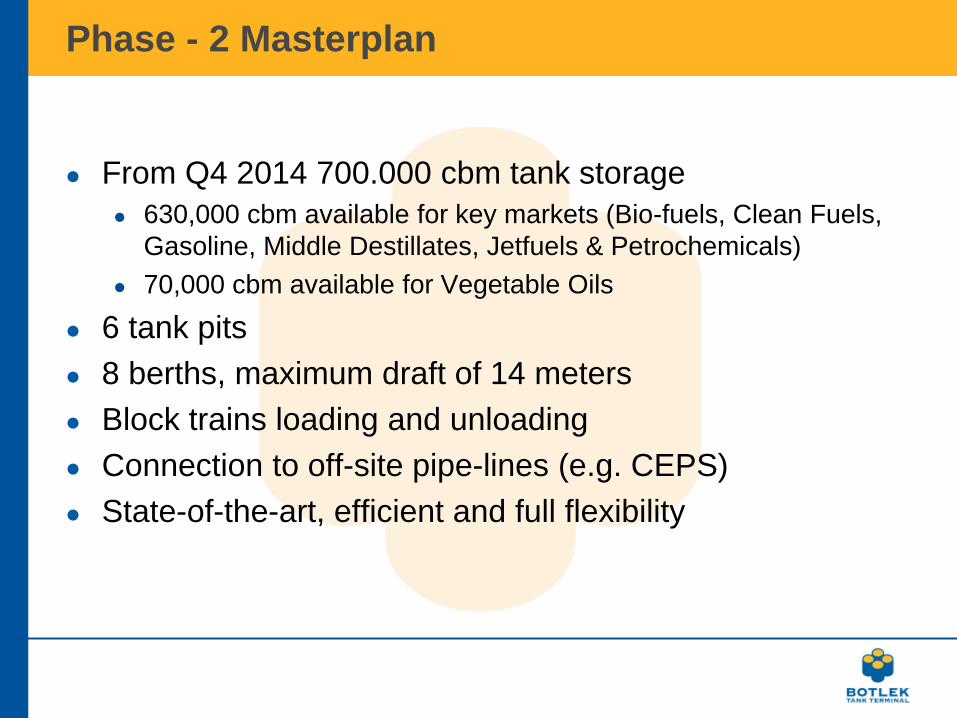
Phase - 2 Masterplan
From Q4 2014 700.000 cbm tank storage
630,000 cbm available for key markets (Bio-fuels, Clean Fuels,
Gasoline, Middle Destillates, Jetfuels & Petrochemicals)
70,000 cbm available for Vegetable Oils
6 tank pits
8 berths, maximum draft of 14 meters
Block trains loading and unloading
Connection to off-site pipe-lines (e.g. CEPS)
State-of-the-art, efficient and full flexibility

Phase -2
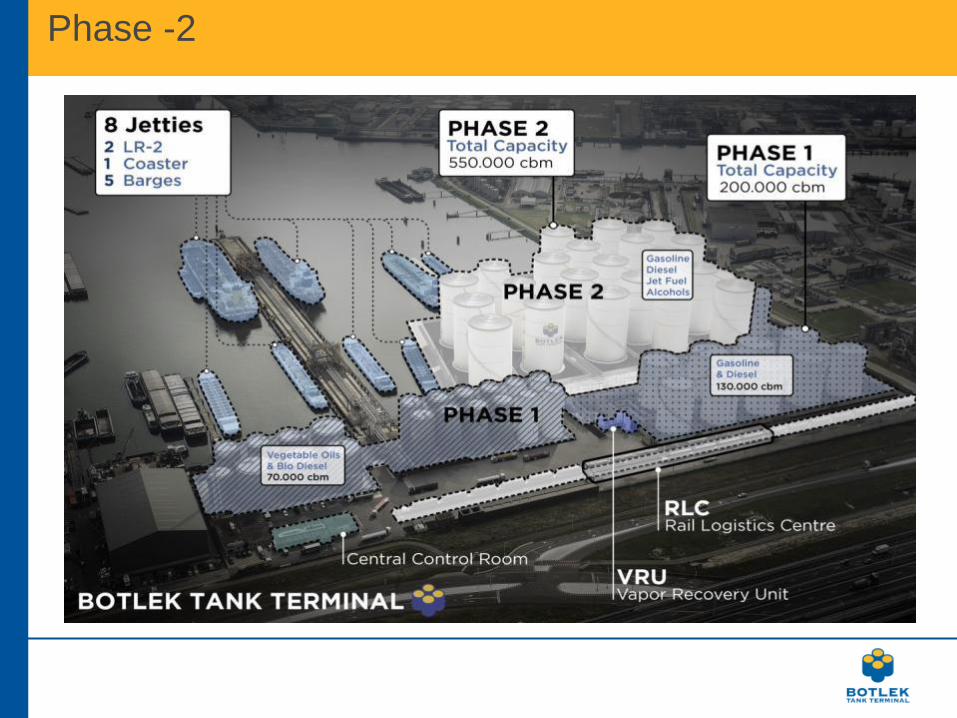
Phase -2
Contents:
The outlook for the oil storage industry
1. Introduction Botlek Tank Terminal
2. Trends in the Oil products Market
3. Tank storage market (ARA)
4. Conclusion and future trends

Worldwide trade flows - Exports
Globalization of fuels production:
strong growth in trade of oil products
Source: calculations EUR, based on Unctad, Worldbank and Eurostat.
Price corrections: oils by average crude, all products by EU inflation
0
50
100
150
200
250
300
350
400
Exports 1995-2011 (index, price corrected)
Nl all export
NL Oilproducts
WRLD all export
WRLD Crude
WRLD Oilproducts
Source: calculations EUR, based on Unctad, Worldbank and Eurostat.
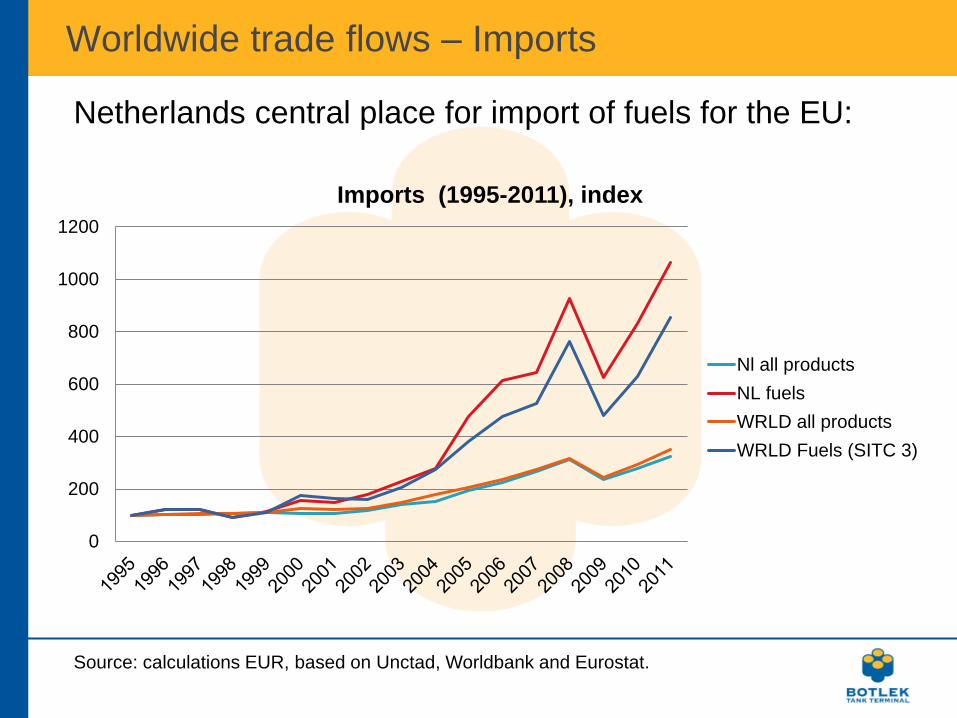
Worldwide trade flows – Imports
0
200
400
600
800
1000
1200
Imports (1995-2011), index
Nl all products
NL fuels
WRLD all products
WRLD Fuels (SITC 3)
Netherlands central place for import of fuels for the EU:
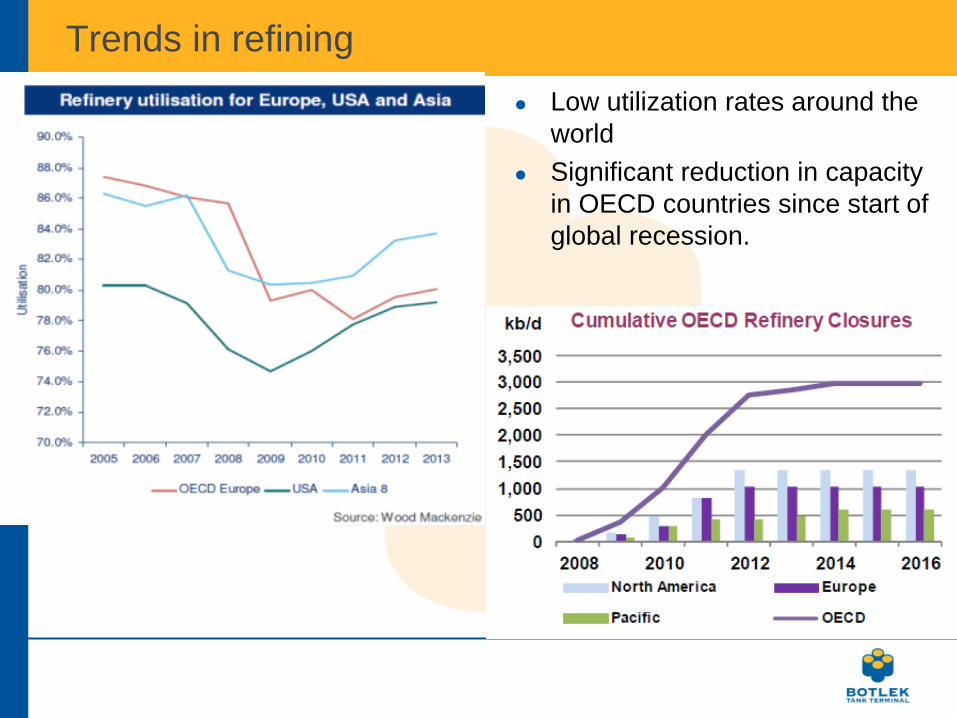
Trends in refining
Low utilization rates around the
world
Significant reduction in capacity
in OECD countries since start of
global recession.

Mid-term Trends in the EU Oil products Market
Gasoline Diesel/Jet
EU-position LONG SHORT
Refinery closures in EU decrease Increase
Biofuel (Ethanol /Diesel) Increase Decrease
Bunker market - Increase
USA More export to USA Less export to EU
Russia More export to EU More export EU
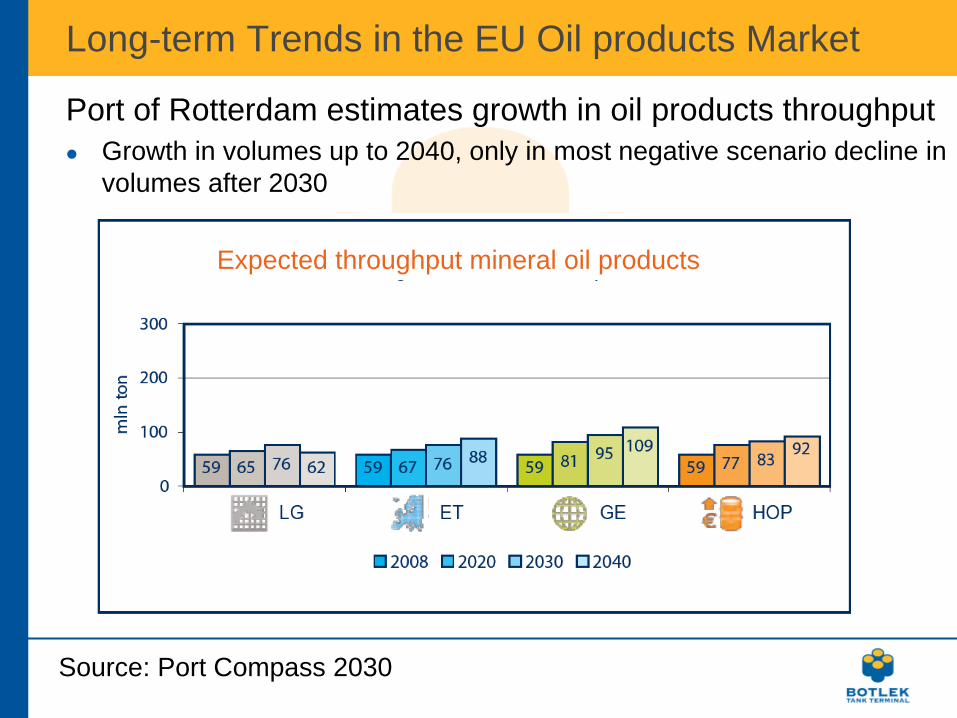
Long-term Trends in the EU Oil products Market
Port of Rotterdam estimates growth in oil products throughput
Growth in volumes up to 2040, only in most negative scenario decline in
volumes after 2030
Expected throughput mineral oil products
Source: Port Compass 2030
Contents:
The outlook for the oil storage industry
1. Introduction Botlek Tank Terminal
2. Trends in the Oil products Market
3. Tank storage market (ARA)
4. Conclusion and future trends

Oil products in the ARA-range
Quarterly throughput of refined oil products (x1000 tonnes) Source: Eurostat / EUR
0
5000
10000
15000
20000
2500020
00Q
1
20
00Q
3
20
01Q
1
20
01Q
3
20
02Q
1
20
02Q
3
20
03Q
1
20
03Q
3
20
04Q
1
20
04Q
3
20
05Q
1
20
05Q
3
20
06Q
1
20
06Q
3
20
07Q
1
20
07Q
3
20
08Q
1
20
08Q
3
20
09Q
1
20
09Q
3
20
10Q
1
20
10Q
3
20
11Q
1
20
11Q
3
20
12Q
1
x1
00
0 t
on
ne
s
Throughput of refined oil products ARA-range
Amsterdam refined oil products
Rotterdam refined oil products
Terneuzen refined oil products
Vlissingen refined oil products
Antwerp refined oil products
Ghent refined oil products
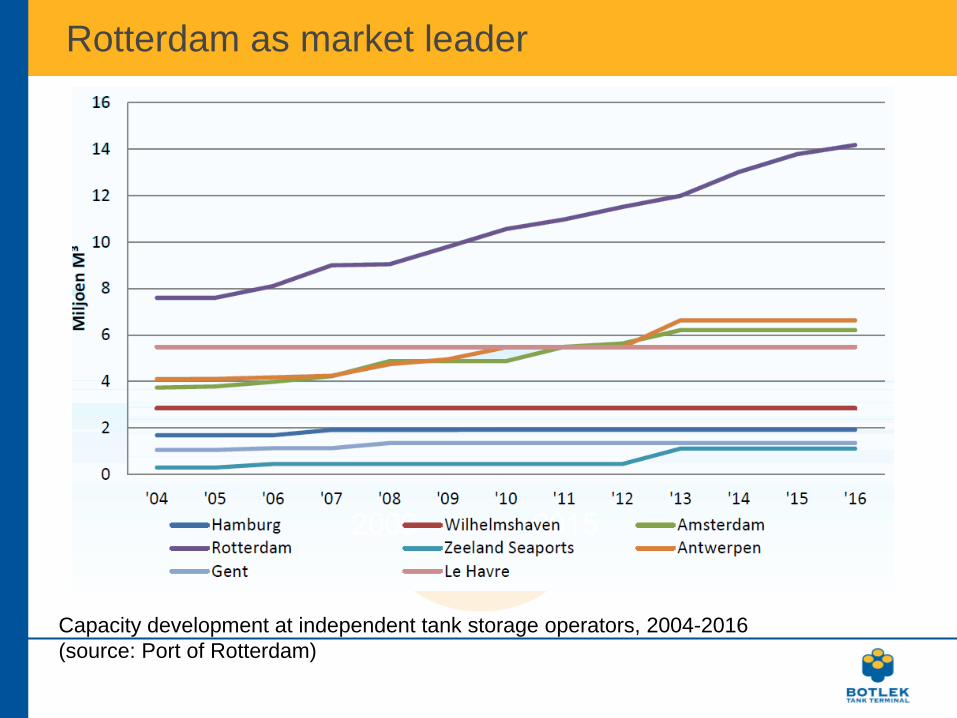
Rotterdam as market leader
Capacity development at independent tank storage operators, 2004-2016
(source: Port of Rotterdam)
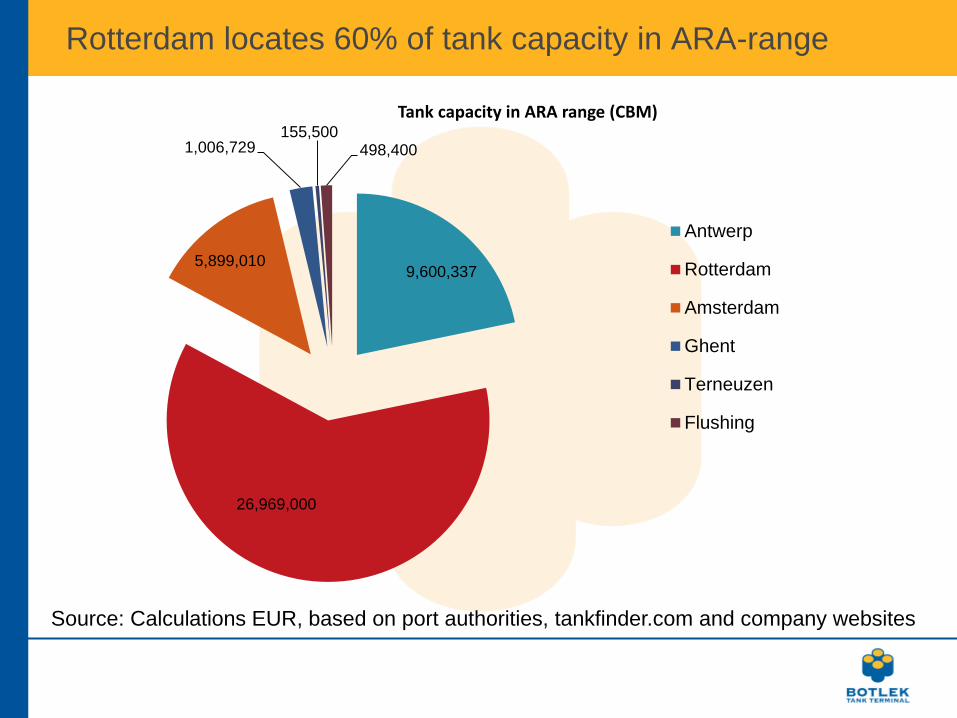
Rotterdam locates 60% of tank capacity in ARA-range
Source: Calculations EUR, based on port authorities, tankfinder.com and company websites
9,600,337
26,969,000
5,899,010
1,006,729 155,500
498,400
Tank capacity in ARA range (CBM)
Antwerp
Rotterdam
Amsterdam
Ghent
Terneuzen
Flushing

Only 20% of tank capacity in Rotterdam is independent
storage for oil products.
Source: EUR calculations based on Port Authorities of ARA ports and individual company information
12,385,000
800,000
4,500,000
5,884,000
2,300,000
200,000 900,000
Capacity in Rotterdam (CBM, 2011)
Crude oil at refineries
Crude oil, independent
Oil products at refinery
Oil products independent
Chemicals, independent
Veg oil at refineries
Veg oil independent

Oil product
usage
Fuel trading
Crude
extraction
Fuel
production
Storage
Storage
Storage
Storage is essential in the
fuel supply chain.
Most storage in seaports.
Ever present demand for
storage because of trading
and speculation on oil
price
Cargo transfers before
final consumption have
increased from 3 times up
to 10 times.
Trade and storage
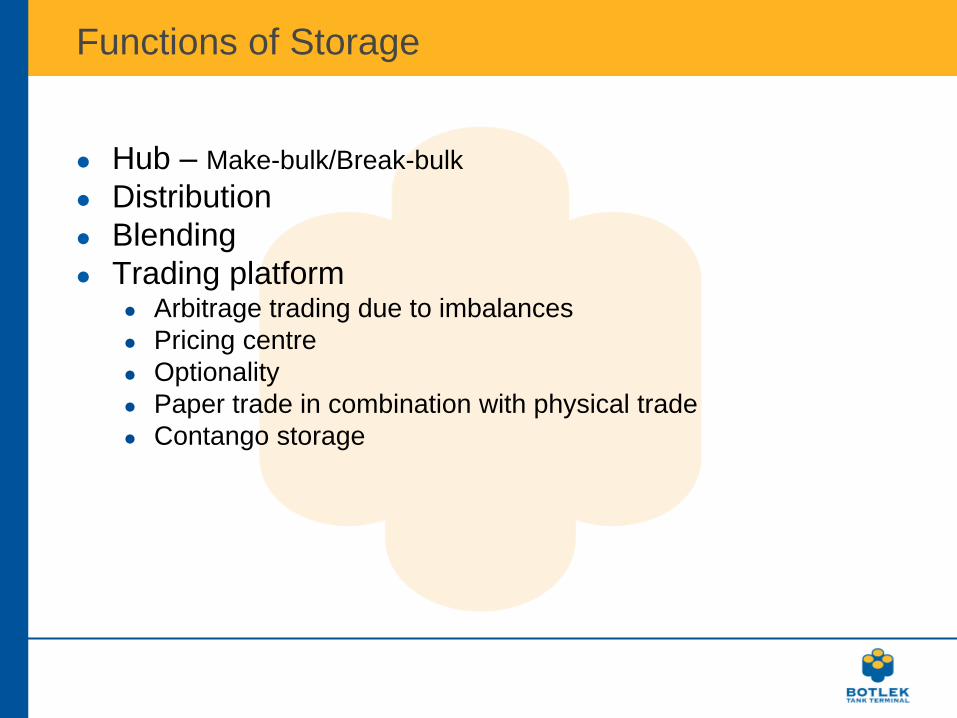
Functions of Storage
Hub – Make-bulk/Break-bulk
Distribution
Blending
Trading platform Arbitrage trading due to imbalances
Pricing centre
Optionality
Paper trade in combination with physical trade
Contango storage
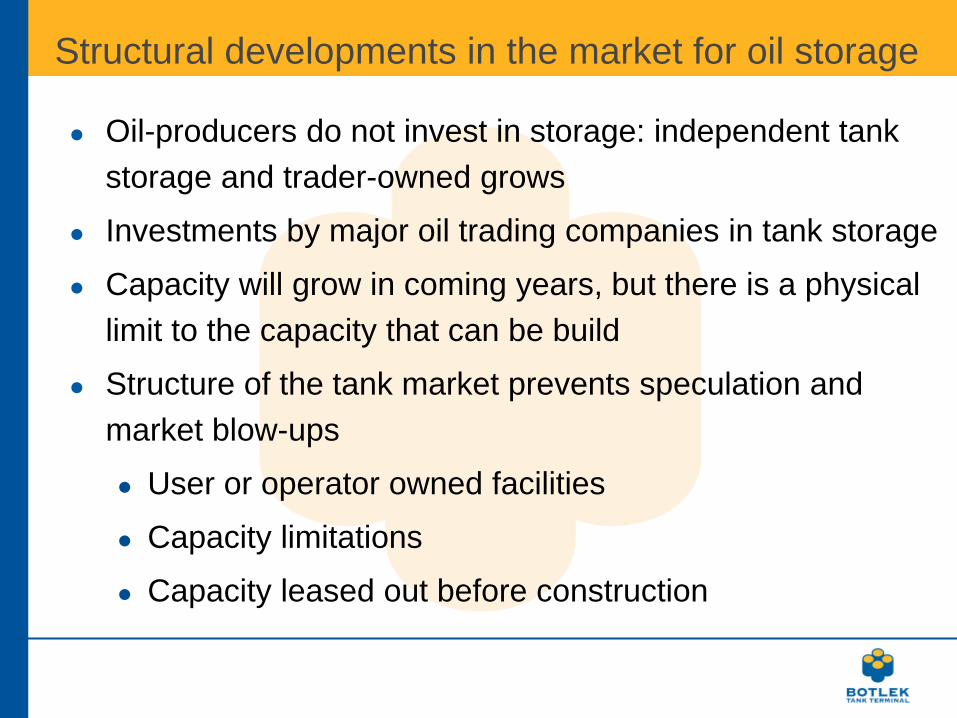
Structural developments in the market for oil storage
Oil-producers do not invest in storage: independent tank
storage and trader-owned grows
Investments by major oil trading companies in tank storage
Capacity will grow in coming years, but there is a physical
limit to the capacity that can be build
Structure of the tank market prevents speculation and
market blow-ups
User or operator owned facilities
Capacity limitations
Capacity leased out before construction
Current issues in tank storage market
Even though the prollonged backwardation in 2012 the
handling of mineral oil products in Rotterdam in went-
up with 12%.
Impact of Odfjell:
Sudden reduction of capacity
SHE becomes more important
Increase of sustaining CAPEX
Automation:
Efficiency & visibility
To increase Safety
Possible threats
Demand:
Faster than expected decline of fossil fuel demand for
transport (technology, high oil price)
Changing tax regimes for fuels that can change
demands and reduce the imbalance gasoline / diesel
Supply:
Expansion of capacity at other European locations
Large scale conversion of other tanks and refineries
into oil products storage

Contents:
The outlook for the oil storage industry
1. Introduction Botlek Tank Terminal
2. Trends in the Oil products Market
3. Tank storage market (ARA)
4. Conclusion and future trends
Conclusion
Demand for storage in ARA:
Long term trends are positive
Backwardation: Short term and limited effect
Affects only a small part of the demand
Difficult to forecast
Storage = long term business
Supply:
Limited number of good locations available
Future trends
Flexible & Multiproduct
Multi functional Hub
Distribution
Trading platform
High quality & SHE standard
Efficient; “i-terminal” Automation (internal)
Information (external)
Safety

Thank you
Questions ?