the origins of self-employment - world...
TRANSCRIPT
The Origins of Self-Employment
Asli Demirgüc – Kunt
Development Research Group, The World Bank
Leora F. Klapper* Development Research Group, The World Bank
Georgios A. Panos University of Aberdeen Business School
February, 2007
Abstract: We examine the factors affecting the transition to self-employment in Bosnia and Herzegovina, using a panel household survey for the years 2001-2004. The study represents a unique case in that in the early period of the panel (2000-2001) the country changed its legal framework concerning labor regulation and the business environment, with the primary aim to promote labor market flexibility and to encourage entrepreneurial activity, making it particularly interesting to examine entrepreneurship in the new environment. The data allows us to directly identify individuals that switched to self-employment during the sample period and the viability of this transition, in terms of business survival for more than one year. Our results suggest an important role for financing constraints. Specifically, wealthier households are more likely to become entrepreneurs and survive in self-employment, and having an existing bank relationship increases the chances of survival for the new entrepreneur. In contrast, we find that overseas – and in some cases domestic – remittances significantly decrease the likelihood of becoming an entrepreneur. Interestingly, NGO and government supported programs that provide grants and transfers to promote entrepreneurship seem to have worked not only in promoting entrepreneurship but also its success, filling an important financing gap in the absence of more developed formal financial institutions. Finally, people working in the informal sector are more likely to transition to becoming entrepreneurs and significantly more likely to survive. JEL Classification Codes: J23, M13, O16, O17 Keywords: Self-Employment, Entrepreneurship, Financial Constraints, Informal Sector We are grateful to Erwin Tiongson, Fahro Memic, Dragana Ostojic, Yan Li, Kostas Tzioumis and Taras Chernynski for helpful comments. Financial assistance from the Greek CTF Program is gratefully acknowledged. This paper’s findings, interpretations, and conclusions are entirely those of the authors and do not necessarily represent the views of the World Bank. * Corresponding author: Senior Financial Economist, Development Research Group, World Bank, Tel: +1-202-473-8738; Fax: +1-202-522-1155; e-mail address: [email protected].

1
1. Introduction
A flexible, well-functioning, and entrepreneurial labor market can contribute to
economic growth through the efficient allocation of labor and increased competitiveness.
A better understanding of the determinants of entrepreneurship - the environment that
motivates and supports the creation of self-employment – is essential for understanding
the microeconomic foundations of economic growth.
Conceptually, the self-employed can be considered as the smallest, but initially
most vital unit of entrepreneurial activity. The dynamics of this particular group are of
great interest since the literature has indicated that the self-employed have distinct
individual and labor market characteristics compared to individuals in paid employment.
In the past few years, there has been a notable amount of interest on issues of mobility
and transition into self-employment in developing countries. The literature stresses
individual, institutional and sociological factors (Djankov et al., 2005; 2006a; 2006b) as
well as labor market characteristics (Earle and Sakova, 2000; 2001; Dutz et al., 2001) in
identifying the determinants of labor market transitions and new business creation. Other
studies emphasize the importance of financial wealth and constraints (Paulson and
Townsend, 2004; 2005; Paulson et al., 2006).
Departing from this strand of the literature, we examine the nature of the
entrepreneurial decision for the transition to self employment in Bosnia & Herzegovina
(BiH) and its viability, using a rich panel survey for the years 2001-2004. In the transition
countries of Eastern and Central Europe, the small and medium enterprise (SME) sector
has been the largest creator of new jobs and the vast majority of these new enterprises are
microbusinesses (Ayyagari, Beck and Demirguc-Kunt, 2004; Klapper, Sarria-Allende and
Sulla, 2004). BiH is both a country in transition that emerged from a communist
background and post-conflict, following the violent collapse of the former Yugoslavia.
An interesting feature of this case study besides the rich dataset is that in the early period
of the panel (2000-2001) the country changed its legal framework concerning labor
regulation and the business environment, with the primary aim to promote labor market
flexibility and to encourage entrepreneurial activity.1 Therefore, BiH offers an interesting
1 Some of the basic features of the regulatory change are described in Section 2. For a full report, see World Bank (2005a).

2
natural experiment to examine the impact of these reforms on the dynamism of latent
entrepreneurship that was restricted before the market reforms. It is also important
because lessons learned can be generalized to other emerging economies, where private
sectors continue to develop.
We examine the profile of new entrepreneurs, defined as individuals who make
the transition to self-employment between the years 2001-2004. We further examine how
their profile differs from the rest of the labor force. It has been claimed that self-
employment can foster social mobility for low-paid individuals (Holtz-Eakin, Rosen and
Weathers, 2000). Furthermore it can work as an outlet – a “pushing mechanism” – to
escape unemployment. Another, equally important channel is the “pooling mechanism”,
the pooling of individuals with particular entrepreneurial skills, insights and spirits into
activities promoting innovation, technological change, reduction of the production costs,
and growth as a consequence (Schumpeter, 1942). In developing countries, both
channels are of great importance for different reasons, the former in the short-run and the
latter in a longer-run perspective.
The data allows us to directly identify individuals that switched during the sample
to self-employment. Compared to studies treating self-employment per se as the
dependent variable, the examination of entry into self-employment can provide a better
insight into the social origin, financial circumstances and career choices of new
entrepreneurs. Of particular interest are issues of interactions between access to finance
and labor status; the relationship between the informal sector and formal types of
entrepreneurial activity; and the effects of pushing and pooling factors in the transition
between market states. Finally, we study the ex-post performance of new entrepreneurs
in terms of their survival in the early period in business and the determinants of this
performance.
Our results suggest an important role for financing constraints. Specifically,
wealthier households with access to bank financing are more likely to become
entrepreneurs and survive the early period of adjustment. Having an existing bank
relationship significantly increases the chances of survival for the new entrepreneur,
further reinforcing the importance of access to finance. In contrast, we find that overseas
– and in some cases domestic – remittances significantly decrease the likelihood of

3
becoming an entrepreneur. Interestingly, NGO and government supported programs that
provide grants and transfers to promote entrepreneurship seem to have worked not only in
promoting entrepreneurship but also its success, filling an important financing gap in the
absence of more developed formal financial institutions. Finally, people working in the
informal sector are more likely to transition to becoming entrepreneurs and more likely to
survive.
The rest of the paper is organized as follows: Section 2 contains a brief survey of
the historic, macroeconomic and institutional background of self-employment in BiH.
Section 3 discusses the data. Section 4 presents our empirical strategy and results for
self-employment entry. Section 5 examines short-term survival. Section 6 concludes.
2. The Labor Market and Business Environment in Bosnia & Herzegovina
The establishment of BiH has been tragically marked by a four-year war in the
early 1990s. Almost 6% of a 4.4 million population were killed or registered as missing,
over 60% were forced to relocate, and an estimated 1,000,000 people left the country
(World Bank, 2005b). In 1995, the Dayton Peace Accords decentralized BiH, retaining
its international boundaries. The decentralization recognized a second tier of government
comprised of two entities roughly equal in size: the Bosniak/Croat Federation of Bosnia
and Herzegovina (FBiH) and the Bosnian Serb-led Republika Srpska (RS).
The macroeconomic instability that followed was characterized by a 75% drop in
per capita GDP between 1990 and 1995, from its initial US$ 2,400 level to an estimated
US$600. In the following years, high nominal rates of economic growth increased the
figure to US$1,200 by the end of 2000 and to its prewar levels as of 2005 (World
Development Indicators, 2006). The conflict also generated new categories of
unemployed, such as war widows, disabled soldiers and civilians, displaced refugees and
returnees. In 1996 the official self-reported unemployment rate was 80%, which
decreased to about 35% by 2001. However, BiH has a large informal sector that could
also account for as much as 50% of official GDP and half of the number of registered
unemployed; true unemployment rate – including informal employment – is estimated at
about 20% (World Bank, 2005c).

4
Before the war in the 1990s, BiH had a large entrepreneurial middle-class.
Although the environment of centrally planned economies in Eastern Europe had been
hostile to self-employment and entrepreneurship (Earle and Sakova, 2000), the regime in
the former Yugoslavia had a somewhat different treatment of small businesses, mostly
those related to crafts and services These were encouraged and provided with financing
mostly from local government-owned banks. Their interests were further supported
through the formation of local and politically influential crafts unions. Furthermore, in
the prewar period, BiH was a location where the former centrally-planned regime placed
heavy manufacturing industries, on which socialist regimes placed a huge emphasis.
However, the transition process and the war altered the environment, and together
with the destruction of the massive state-operated factories, unemployment skyrocketed.
The war left behind ruined infrastructure, devastated crops, demolished real estate and
ceased industrial production. This destruction of the stock of productive capital
combined with the dislocation of private social safety nets and social capital decreased
living standards and increased the vulnerability of the population to further economic
shocks (World Bank, 2002).
Facing massive unemployment and a deficient social welfare system, the
promotion of self-employment and microenterprise became a political priority. Several
initiatives were taken to encourage small and medium enterprises by establishing
microenterprise credit institutions.2 Furthermore, in 2000-2001 BiH introduced reforms
to the regulatory framework for the financial environment and the labor market. The
“Microcredit Organization” law passed the FBiH parliament in 2000 and the RS
parliament in 2001, establishing a legal and operational framework for microfinance.
Banking reform accelerated in 2001 as all Communist-era payment bureaus were closed
and the banking sector was liberalized. Foreign banks, primarily from Western Europe,
now control most of the banking sector. Moreover, one of the important barriers to labor
mobility and job creation – the extremely restrictive employment protection legislation –
was removed in 2000 and replaced by new Entity Labor Codes.
2 Notably, the Local Initiatives Project funded by the World Bank, the Micro-Enterprise Bank funded by the EBRD and the IFC, and Quick Impact Program funded by the UNDP/SRRP.

5
However, the labor market still faces major challenges, such as high and rigid
wages in the formal sector3, a large and growing share of workers in the informal sector
who are not covered by social insurance, and persistent unemployment. The formal
sector remains dominated by the public sector and implementation of privatization has
been slow.4 Further regulatory impediments include high taxation of wages and profits
and high employer contributions5, difficult access and high cost of credit, and lack of
systemic trust in the regulatory and financial environment (World Bank, 2005a). Relative
to other countries, BiH still suffers from a weak business environment and high barriers
to entrepreneurship, as shown by the World Bank’s Doing Business (2005) indicators
(among transition countries, BiH’s “Ease of Doing Business” ranking is only higher than
the ranking of Belarus and the Ukraine). In a total of 154 countries, the country ranks
particularly low, with respect to ease of starting a business, dealing with licenses,
registering property and trading across borders. Given this challenging macroeconomic
and institutional environment, in the next sections we examine determinants of self-
employment at the individual and the household level.
3. The Data
We use panel household data from four waves of the World Bank Living
Standards Measurement Study (LSMS) for the years 2001-2004. The first wave of the
LSMS survey was carried out in 2001, covering a sample of 5,400 households, 3,000
being selected from FBiH and 2,400 from RS. The sample was designed to be
representative at the country level, the entity level, and for urban, rural and mixed
municipalities. Wave 2 was conducted in 2002 and 50% of original LSMS respondents
were interviewed a second time. These respondents were followed in Waves 3 and 4.6
3 Wage setting regulation in BiH involves minimum wage “bunching”, high experience premiums for years of service, and collective agreements in which employers did not have the right to participate (a situation that changed in 2005, giving employers a limited but still restrictive co-signatory role). 4 For a description of the SME sector in Bosnia and Herzegovina, see: World Bank (2002) 5 The extent of taxes and contributions levied on wages is 55% (35%) of net (gross) wage in the FBiH and 66% (40%) in the RS. Social Security contributions exclusively burden employers in RS and are shared in FBiH (with employers still paying the highest past). 6 For more information on the survey design, LSMS sampling and the creation of the panel and the contents, see World Bank (2003) and Cuna (2004). Survey response rates were satisfying both at the household and the individual level, comparable to those of most well-established household surveys. The

6
This unique panel data provides rich demographic and socioeconomic information, and
importantly an insight into labor market dynamics in the two entities. The household
questionnaire included modules covering demographics, housing, education, labor,
migration, health, credit and social assistance. Waves 1 and 4 also contain modules on
consumption, privatization vouchers, non-agricultural business activities and agricultural
self-employment activities.
For the purposes of our study, we employ the labor force population, aged 15-64,
and classify them into mutually exclusive groups according to their employment status
every year. Individuals present in at least two consecutive waves are kept. Following the
design of the questionnaire, we define self-employed individuals as individuals
describing their status as owner/co-owner of: (i) an enterprise which employs workers
(“employer”), (ii) an enterprise which does not employ workers (“own account”). We
identify “formal” self-employment, as individuals who fall into the categories above, and
also declare work-related characteristics such as earnings and hours in self-employment
and whose pension and/or health contributions are paid. The remaining individuals are
identified as self-employed in the informal sector.
Standard ILO definitions classify a person as employed if they are presently
working or on leave from a job. We follow this practice and further distinguish between
the formal and the informal sector workers among the group of employed. We define
employees in formal sector paid employment as individuals working in public enterprises
and international organizations, as well as those in the private sector whose pension and
insurance contributions were paid. No distinction is made between full-time and part-
time work; both are considered employment, since flexible forms of employment are not
common in BiH. Informal sector employment is comprised of three groups: (a) unpaid
supporting family members, farmers on own farm, and workers engaged in other activity,
such as sale of agricultural products; (b) workers not employed by public enterprises (or
state sector) for which pension contributions are not paid; (c) workers declaring any other
out-of-employment activity, but reporting earnings or hours of work. While different
definitions of informal sector employment are always subject to debate, this one meets
truncation of the sample after Wave 1 was conducted ensuring the continuation of representation at the 3 levels mentioned.
7
previous official classification criteria and informal sector estimates for BiH (World
Bank, 2002).
By default, the unemployed are those who do not presently have a job, are
actively searching for employment and are able to take a job if it were offered to them.
All others of working age are classified as inactive. Hence individuals of working age,
who define their activity status as student, pensioner or housewife are defined as inactive
or voluntarily unemployed. Individuals who are inactive in all four waves of the panel
are dropped.
For BiH and its two entities, Table 1 presents frequencies for the partitioning of
the labor force in the categories described above over the sample period. Self-employed
comprise about 5% of the workforce on average, a figure that is mostly constant over the
period 2001-2004 (see Figure 1). This compares to a self-employment rate of about 10%
in OECD countries (Haber, Lamas and Lichtenstein, 1987; Parker, 2005). The
percentage of self-employed is somewhat higher in RS, compared to FBiH. Another
striking feature of the labor market in BiH is the high share of employment in the
informal sector. This is a feature that existed during the socialist era, but became even
more prominent in the early 1990s and continued to grow during the years of transition.
Our calculations indicate that informal employment accounts for more than one third of
total employment. There is an 8 percentage point difference between the entities, with
the RS having close to a quarter of the labor force in informal employment. This is a
relatively stable figure, while in FBiH the informal sector is lower but increasing in the
course of the panel. Finally, with respect to the unemployment statistics, our estimates
verify the picture that unemployment-inactivity comprises more than 40% of the
workforce, a figure persistently lower in RS (38%, but rising) than in FBiH (46.2% on
average). Our estimates of involuntary unemployment are about 19% for both entities.
This labor status classification allows us to directly observe transitions to self-
employment from year to year. We are able to identify 229 entries into self-employment
status during the course of the panel (Table 2). If we look at the subsample in 2001 of
household heads, we identify 119 new entries (not shown)7. Of further interest are the
7 This latter sub-sample is of interest, despite reducing the number of observations, because it is likely to capture new business openings and exclude participation in family enterprises.

8
outcomes of the new entries. Almost half of the transitions to self-employment do not
make it through their first year in business. This is a pattern observed in both samples of
individuals and household heads. Thus, it is of further interest to examine the
determinants of entrepreneurial survival as well as entrepreneurial entry.
4. Entry into Self-Employment
Entrepreneurship has been linked to both economic and social attributes. The
literature has distinguished between the role of institutions, sociological factors, and
individual characteristics, with a particular recent interest in psychological factors, in
identifying the determinants of the decision to start an entrepreneurial activity (Djankov
et al., 2006b).8 In the first stage of our analysis, we examine the microeconomic
determinants of entry into self-employment in BiH, comparing differences in human,
social and financial capital between groups of new entrepreneurs and individuals who did
not become self-employed. In a second stage, we examine the determinants of survival in
self-employment for more than one year, comparing individuals who made it through
their first year as small business operators and individuals who exited before their second
year of business. Definitions, means, and standard deviations for all variables are shown
in Table 3. Table 4 shows a correlation matrix between key variables.
4.1 Individual Characteristics
A review of theoretical studies and empirical evidence suggest the following
individual characteristics are likely to determine entry into self-employment:
(a) Generally, there is a positive relationship with gender (male) and a concave
relationship between self-employment occurrence and age and experience, with entry into
self-employment peeking between the ages 35 and 44. Theoretically, this can be justified
as “job shopping” in a process of learning and occupational matching (Miller, 1984). We
include a dummy variable equal to 1 if the individual is MALE and find that the sample is
almost evenly split between men and women. We include a variable AGE, which is
equal to the age of the respondent in year 2001; the average age of surveyed individuals
8 For a review of the factors affecting the decision to enter self-employment and undertake entrepreneurial ventures, see Parker (2004).
9
is about 35. We also include the squared value of age divided by 1,000, AGESQ, to test
the curvature of the relationship.
(b) The evidence on the role of education on entry into self-employment is mixed and
depends on the econometric specification employed, correlations with financial and
occupational variables (Le, 1999; Parker, 2004), and the specific sector of self-
employment activity (Bates, 1995). We include EDUCLOW, a dummy equal to 1 if the
respondent has no formal education or only primary school education. About 34% of the
sample has no advanced schooling.
(c) With respect to marital status and family considerations, the dominant view is that of
Borjas (1986), where family members can facilitate self-employment activity through the
provision of assistance and cheap labor. However, when entry into self-employment is
considered, the evidence is not clear, and could be confounded by the fact that married
population is generally less likely to take risks. We include MARRIED, which is a
dummy equal to 1 if the respondent is married or cohabitating in 2001 (61% of the
sample). We also include LCHILDREN, which is the natural logarithm of declared
number of children+1 (on average, 2.2 children per individual).
(d) On the impact of health status on entrepreneurship, the evidence is again mixed, but
the specific circumstances in BiH favor the argument that the disabled might prefer self-
employment, since several microcredit schemes are targeted to these groups. The
literature has further suggested that self-employment provides these groups with more
flexibility and potentially a way out of employer discrimination. The intuition for other
disadvantaged groups such as the displaced/immigrants is similar. We include
DISABLED, a dummy equal to 1 if the respondent considers him/herself disabled (5%).
For robustness, we also include GHEALTH, a dummy equal to 1 if the respondent
evaluates his/her health as “good” or “excellent” during the last 12 months (the two top
categories in a 5-scale Subjective Health Evaluation question).
(e) Entrepreneurial activity in terms of small businesses is more likely to occur in urban
areas in more developed countries (Parker, 2004). In these places, role models,
neighborhood characteristics and even status considerations among peers can have a role
in the entrepreneurial decisions. However, the provision of labor and other factors of
production can often be cheaper in rural areas, hence the evidence on the impact of rural
10
vs. urban location on entry decisions is again mixed. We therefore include a variable
RURAL equal to 1 if a respondent resides in a rural area (45%). We also include a
dummy equal to 1 if the individual lives in FBiH (55%) and equal to 0 if the individual
lives in RS.
4.2 Psychological Traits and Sociological Insights
Theory on the behavioral patterns of entrepreneurs stresses that the psychological
profile and sociological background of the individuals are important factors in the
decision to initiate one’s own business. Key entrepreneurial features include the ability
to resolve uncertainty (Cantillon, 1755), alertness (Knight, 1921), the ability to coordinate
factors of production (Say, 1828), innovation and instinctive motivation and leadership
skills (Schumpeter, 1934; 1939), the ability to resolve crises and risk-taking (Leibenstein,
1968), love for independence and job satisfaction. We will focus on two behavioral
dimensions available in the dataset: optimism and risk-sharing and support through social
capital.
Recent survey evidence suggests self-employed individuals are more optimistic
than regular wage-earners (Heaton and Lucas, 2000; Moskowitz and Vissing-Jorgensen,
2000; Hamilton, 2000; Gentry and Hubbard, 2001; Parker, 2006; Fraser and Greene,
2006). The rationale behind this relationship is that the entrepreneurial decisions are
much likely to be influenced by attitudes, emotional predispositions and cognitive biases
(Arabsheibani et al., 2000; Puri and Robinson, 2005). Furthermore, the literature
indicates that the self-employed are more likely to be risk-takers than the rest of the
population, since they are faced with more uncertain future prospects and lifetime
earnings profiles. The difficulty has always been how to measure optimism. Authors
have used several proxies, such as measures related to life expectancy, questions about
financial expectations about the following year, etc. We construct an index OPTIMISM,
which is the weighted average of the intensity measured by a 4-scale response in eight
questions from the General Health Questionnaire (GHQ), related to mental health and
anticipatory feelings, and is associated with greater self entry.9
9We also used a broader measure of optimism, product of 16 GHQ questions, which did not change the main findings of the paper. See Table 3 for the list of questions.

11
Social capital is the set of social relationships an individual can draw on for
various occasions.10 As a proxy for social capital, others have used club membership,
finding a positive effect on earnings from self-employment (Gomez and Santor, 2001).
We construct a proxy for social capital considerations, NOSOCPTL using the average of
two available questions: (i) "Is there anyone you can count on to listen to you when you
need to talk?", and (ii) "Is there anyone who you can really count on to help you out in a
crisis?" These variables proxy for social capital in terms of the help people can get from
friends, neighbors and relatives. This is an “increased security effect”, a psychological
safety net in the light of risk-sharing (Ravallion and Lokshin, 2006).
The sociology literature has further stressed the role of family background in
developing role models that can foster entrepreneurial aspirations. Empirical evidence on
the impact of past parental entrepreneurial activity in the individual’s current employment
status is ample. However, the data does not provide us with parental occupational or
educational status variables. In order to control for within family effects in self-
employment transitions we examine the impact of the presence of another self-employed
member in the household, OTHERSE. About 7% of the individuals in our sample have
family members that are self-employed.
4.3 Labor Market Experience
Past employment experience has been shown to exert significant effects on
current employment status (i.e. Jovanovic’s, 1982, “ability learning” view). In addition,
paid employment experience - particularly in small firms due to human capital
acquisition (Lucas, 1978) – has been shown to have positive effects on the probability of
becoming self-employed and obtaining higher entrepreneurial income (Boden, 1996).
The role of informal sector experience in entry into self employment and its
success is still being debated, which is an issue we also examine here. Whether prior
experience in “gray” or “unofficial” markets provides valuable human capital after
economic liberalization has implications for evaluation of the role of the informal
economy in the process of economic development (Kaufmann & Kaliberda, 1996;
10 For a review of literature on social capital and economic development, see Woolcock, 2002; 2005.

12
Johnson, Kaufmann and Shleifer, 1997).11 For instance, in economies under transition,
the regulatory environment might not foster formal entrepreneurship and entrepreneurial
individuals might choose to operate in the informal sector or shadow economy. In
addition, institutions such as labor unions, minimum wage legislation and public sector
hiring practices tend to keep formal sector wages in urban areas above market-clearing
levels, and the low-productivity informal sector provides a subsistence shelter for
unmatched employees (Harris and Todaro, 1970). Thus, while on the one hand, the
informal sector can work as an outlet from unemployment or poverty and an entry point
to entrepreneurial activity, it also creates impediments to growth through tax evasion and
unfair competition to the formal sector. Furthermore, the informal sector is characterized
by low-pay and low job security among its employees and large-extent informality in an
economy is an indicator of corruption, poor regulatory, financial and labor market
environment. However, departing from Lazear’s (2004) view of entrepreneurs as “jacks
of all trades”, one could perceive informal sector as an incubator for formal sector
entrepreneurship when the business environment improves.
We test the importance of past labor market experience in the decision to become
self-employed and the individuals success as an entrepreneur. We summarize the results
shown in Table 2 with the following dummies: EMPLOYED, equal to 1if the individual
was in paid employment in 2001; FORMAL, equal to 1if the individual was a formal
sector employee in 2001; INFORMAL, equal to 1 if the individual was an informal sector
employee in 2001; NONEMPLOYED, equal to 1 if the individual was not in paid
employment in 2001; UNEMPLOYED, equal to 1 if the individual was involuntarily
unemployed in 2001; and INACTIVE, equal to 1 if the individual was voluntarily
unemployed (declared status as student, retired, or housewife) in 2001.
In some specifications we also control for how much the individual must give up
in order to start their own business. We include HINSUR and PENSION, which equal 1
if the individual received in 2001 a pension or health insurance, respectively, from the
Employment Bureau. About 75% of individuals received health insurance and 34%
11 Blau (1985) reviews the theoretical framework for a role for an informal sector in less developed countries.

13
received a pension. We hypothesize that individuals receiving such benefits might be
less likely to leave secure jobs and take on the risk of self-employment.
4.4 Wealth, Access to Finance and Financial Institutions
An important branch of the literature on entrepreneurship has examined the links
between wealth and entrepreneurship. For instance, Evans and Jovanovic (1989) argue
that borrowing constraints imply that personal assets will be positively related to the
propensity of individuals to engage in entrepreneurial activities. Survey evidence from
Thai households indicates that individuals who switch to self-employment are more likely
to be wealthier (Paulson and Townsend, 2004). However, wealth is also likely to be
endogenous, since entrepreneurs have greater savings and shareholdings relative to the
general population (Bitler, et al., 2005; Heaton and Lucas, 2000). Quadrini (2000)
suggests that entrepreneurs might save more in order to finance new and future ventures
as well as to create a cushion to protect against business risks. Empirical evidence
indicates instrumented wealth is insignificantly related to entrepreneurship (Hurst and
Lusardi, 2004; Hochguertel, 2005). However, tackling the endogenous nature of wealth,
a number of papers examine the effect of “windfall gains” on entrepreneurship.
Empirical evidence from Sweden, U.K. and the U.S. indicate individuals winning the
lottery or receiving an inheritance are more likely to enter self-employment and remain
successfully self-employed (Lindh and Ohlsson, 1996; Taylor, 1999; Blanchflower and
Oswald, 1998; Holtz-Eakin et al., 1994a; 1994b).
The wealth proxy we use is equivalized per capita household consumption,
LHHCONS, which is calculated by adjusting household consumption to the number of
equivalent adults.12 The use of household consumption expenditure, deflated at the
regional level, is preferred to income, since consumption is more likely to be smoothed
by individuals. Furthermore, in transition countries, income under-reporting and non-
12 For full information concerning welfare in Bosnia and Herzegovina and the construction of the 2001 consumption aggregates, see “Welfare in Bosnia and Herzegovina, 2001: Measurement and Findings”, 2001. Two important dimensions of the calculations are that imputed values of the consumption flow associated with the possession of a consumer durable are included in the calculations, while expenditure on the purchase of the durable good is excluded. Furthermore, expenditures that reflect differences in tastes are excluded. The equivalized measure is calculated by adjusting household consumption to the number of equivalent adults: EA=(A+aK)θ, where A: number of adults; K: number of children; a: economies of scale parameter; θ: share of public goods consumed parameter.

14
reporting biases the calculations based on income. We therefore utilize household
consumption in the beginning of the panel as an indicator of overall financial wealth.
Using other wealth proxies, such as those that reflect property ownership or the ability to
“make ends meet”, do not change our main results.
While there is significant evidence on the positive impact of wealth (i.e., credit
constraints) on entrepreneurial activity, empirical evidence on the role of financial
institutions is relatively scarce. Notably, Paulson and Townsend (2004) examine the
impact of particular financial institutions on overcoming financial constraints and starting
a business. Departing from their work, we utilize household affiliation with particular
financial institutions and sources of finance in the past and examine their impact on the
likelihood of starting a new business. The role of financial institutions is of particular
interest in transition economies where the financial sector has undergone major reforms,
and in BiH in particular, where the creation of microfinance institutions has been
financed and advertised by most major international financial institutions. The anecdotal
evidence is that in BiH working capital finance is widely available, but quite expensive
and the availability of start-up loan and equity is still problematic.13 Microcredit
institutions on the other hand, target specific groups of the population. We include a
dummy MICROLOAN equal to 1 if the household received a loan from a
microinstitution (such as a credit union, cooperative or NGO) in 2001. We also identify
households that received a loan from a bank or government agency in 2001,
BANKLOAN, and households that received a loan from a family member, friend or other
individual in 2001, INFORMLOAN. Despite various initiatives, only about 2.5% of our
sample are members of households that received microloans, while about 17% of
individuals receive informal loans and about 12% of individuals receive bank loans.
Another important feature of the BiH economy, on which empirical evidence has
also been scarce, is the impact of international remittances on the local economy. In
general, past evidence suggests that the effect of remittance receivership on 13 In a Survey of 800 SMEs in FBiH, the World Bank (2002) reports the 10 most important barriers to SME development as: the high payroll taxes and social security contributions, the high income and profit taxes, the difficulty in access (loans, venture capital, equity capital) and the high cost of finance, bureaucracy, lack of trust in the economy, the state and its services. Previous work on BiH has identified administrative barriers to business creation as among the worst in the region. It has been described as “a labyrinth of formal and informal rules” (FIAS, 2001). Financial constraints, especially the lack of start up funds, seem to pose serious constraints on the establishment of new businesses.
15
entrepreneurial activity is ambiguous. It has been argued that remittances and aid are not
conducive to entrepreneurship or private sector development and reduce labor supply.
These have been framed as “disincentive effects” (Ahlburg, 1995) or “crowding-out
effects” (Connell and Brown, 2005). On the other hand, there is also evidence that
remittances can support private sector development. In a case study for Managua
(Nicaragua), Funkhouser (1992) finds that remittances increase participation in self-
employment, but reduce overall labor-force participation. Evidence from Philippines
suggests remittance receivership reduces labor supply (Rodriguez and Tiongson, 2001).
Amuedo-Dorantes and Pozo (2006) present evidence from Mexico, and after accounting
for endogeneity in remittance receivership, show that its impact may vary by gender,
region and sector. Thus, remittances in Mexico appear to reduce male formal sector labor
supply, as well as that of the self-employed. On the contrary, its impact on informal
sector labor supply is positive. Muço et al. (2004) find evidence from Albania that the
informal sector is fuelled by remittance flows from emigrants living permanently abroad
and by the earnings from short-term, temporary migration. A challenge in this literature
is that remittances are often channeled through the informal currency market, making it
hard to detect their size and direct influence.
The number of immigrants from BiH to the West has been large and estimates
indicate that during the war around a million people sought new homes around the world.
We directly test the effect of remittances on the switch to self-employment with two
dummies which importantly distinguish between international and domestic remittances:
REMITDOM, which equals 1 if the individual belongs to a household that received any
money, gifts, or services from friends or family working in BiH; and REMITABROAD,
which equals 1 if the household receives money, gifts or services from friends or family
working abroad in 2001. Our estimates indicate that 8.5% of households in the sample
receive some form of remittance domestically and 11.5% from abroad. We also identify
individuals that receive money from humanitarian and religious institutions that do not
need repayment, GRANT. These are of specific interest, because they include grants
from foreign NGOs and citizen associations provided specifically to promote self
employment and entrepreneurship (Lyman, 2005). Finally, we include SOCIALSERV,
16
equal to 1 if a member of the individual’s household received financial assistance, such as
payments from an old age or war veteran’s pension in 2001.
Finally, we construct our indicators of the switch to self-employment. Our
primary dependent variable is NEWSE, equal to 1 if an individual switched to self-
employment in 2002, 2003, or 2004. We also construct NEWSE-OA, equal to 1 if an
individual switched to own account self-employment after 2001 and NEWSE-EMPL,
equal to 1 if an individual switched to self-employment with employees after 2001.
Within this later category we further distinguish EMPLY_1-5, a dummy equal to 1 if the
entrepreneurs has 1 to 5 employees and EMPLY_5-20, equal to 1 if the entrepreneur has
between 5 and 20 employees (EMPLY_>20 is the excluded category). Finally, we create
a dummy, SURVIVE, to identify new self-employed firms that survive more than one
year.
4.5 Results
We model the decision to become self-employed in the years 2002-2004 in the
multivariate probit framework, excluding individuals already self-employed in 2001.
Thus, the choice of entering self-employment may be defined by the latent variable SET*:
iii xSET 111* εβ += (1)
where the transition to self-employment is made (SETi=1) if 0* >iSET , and not otherwise;
x1i is a vector of explanatory variables; β1 a vector of unknown parameters to be
estimated; and ε1׀x1 ~ N(0,1) .
The list of explanatory variables involves demographic, psychological and
sociological characteristics described in the last section and summarized in Table 3. In
separate specifications, we examine the impact of household financial wealth, the
relationship with financial institutions, as well as recent labor market history.
Table 5 presents univariate analysis results, in terms of the differences in the
means between individuals who were not self-employed in 2001 but chose to become
self-employed in the following years and those who did not. Married men and urban
residents are more likely to make the transition into self-employment.14 Individuals who
become self-employed tend to be better educated and assess themselves to be in better
14 The number of new entrepreneurs does not significantly differ by ethnicity: Bosnian, Croatian, Serbian or other (not shown).
17
health. Self-employed also significantly differ based on the optimism index and social
capital variables, indicating that the new entrepreneurs had been more optimistic and had
several more people around them to count on for support.
Self-employed are also more likely to transition from employment in the informal
sector and to have someone else in their current household that is self-employed.
Individuals who were unemployed or inactive in 2001 are less likely to switch to self-
employment at any point in the panel. The differences between new entrepreneurs and
non-entrepreneurs with respect to past household wealth and multiple property ownership
are statistically significant, indicating a positive effect of own wealth in the self-
employment transition. When it comes to the variables proxying for affiliation with
financial institutions in the past, interestingly there are no differences between the groups,
with respect to loan receivership either from banks or microcredit institutions or from
informal sources. This suggests that entry into self-employments might be financed with
personal wealth as opposed to loans from formal or informal financial institutions. The
univariate tests also suggest that individuals who receive remittances – particularly from
abroad- or social benefits are less likely to become self-employed.
Next, we examine which of these interesting patterns persist in a multivariate
analysis setting. Tables 6, 7 and 8 show our regression results for the determinants of the
transition to self-employment in BiH in the years after 2001. The estimation method is a
probit model in which the dependent variable takes the value 1 for individuals not self-
employed in 2001, becoming self-employed in the years 2002, 2003 and 2004. The
estimations are all non-linear forms with binary dependent variables (0/1), so we report
marginal effects instead of coefficients for the explanatory variables, to facilitate
evaluation of the magnitudes of their effects. For each of the dummy variables in our
specifications, the reported marginal effect is the difference in predicted value for the
dependent variable (e.g. transition to self-employment) for a dummy value of 1 versus 0,
with all other explanatory variables at their means. For the continuous explanatory
variables in our specifications, the reported marginal effects are the derivatives of the
predicted dependent variable for small changes in the exogenous variables. Robust z-
statistics of the coefficients are reported in absolute values. Standard errors were
18
clustered at the household level in estimates for all individuals at working age, to correct
for intra-household correlations.
Table 6 introduces the main specification, with individual and household
characteristics (column 1), household wealth – measured as household consumption in
2001 (column 2), past employment status (column 3), interactions between the latter 2
(column 4) and customer affiliation with financial institutions (columns 5-7). Results in
the first two columns of Table 6 are consistent with the earlier differences in the means.
The profile of the newly self-employed is more likely to be male, aged 43, residing in an
urban area, married with some formal education, in good health, and with past self-
employment experience. Interestingly, the effects of the proxies for optimism and social
capital persist, and are significant both when included together and separately. More
optimistic individuals are more likely to turn into self-employment, as well as people who
have a social support group in the time of need. The inclusion of the household
consumption variable in Column 2 indicates a significant positive effect of past wealth on
current self-employment. This suggests that self-employed rely on their own financial
means in making their decision.
Confirming the findings of the earlier literature that own financial wealth is a
significant determinant of the decision to become self-employed, in columns 5-7 we
extend our analysis by incorporating customer affiliation with financial institutions and
the relationship with informal sources of finance, prior to becoming an entrepreneur.
These are dummy variables capturing the affiliation of the household with formal and
informal loan sources, domestic remittances, remittances from abroad, and charity/NGO
money and financial social benefits15. Interestingly, our results indicate that the decision
to become an entrepreneur is unrelated to an existing relationship with financial
institutions, confirming that these institutions rarely finance entry into self-employment.
However, remittances from abroad exhibit a significantly negative effect on the
15 Since receivership of several types of loans and remittance money are not mutually exclusive, we have also conducted the analysis incorporating one variable at a time. All results presented are robust to these separate specifications and are available upon request. The inclusion of interaction terms between wealth and the affiliation with financial institution renders insignificant estimates of these interaction terms. This is likely to reflect the general climate of distrust towards the financial institutions that exist in B&H. During the war all household savings vanished and after the war several informal pyramid schemes cost households money. Furthermore, the network of banks and microfinance institutions are still considered very expensive.

19
probability of an individual becoming self-employed, in accordance with the
“disincentive effects” of remittances noted in the literature. This effect is economically
significant – an individual who switches from not receiving overseas remittances to
receiving payments is on average about 3.5% less likely to start a business. To the
contrary, transfers from institutional sources, such as charities and potentially
international NGO initiatives have a positive impact on the probability to become self-
employed. These results hold with the inclusion of the wealth variable. This result is
economically large – an unemployed individual who receives a grant is 13% more likely
to become self-employed, while individuals employed in the formal and informal sector
are 17% and 21% more likely to become self-employed, respectively (not shown).
Finally, we fail to see a positive effect of informal financing mechanisms – from friends
or family- or formal microfinance institutions.
In Table 7 we test the robustness of our results in three subsamples of individuals.
First, in Columns 1 to 3, we include only the sample of the 2001 household heads. The
complete sample is likely to contain individuals who move into self-employment because
another member of the family became self-employed, or because they join a family firm.
Since the dataset does not allow us to identify how many of the newly self-employed are
actually new business owners, the examination of the latter group of household heads
might be a more precise test of new business creation. We choose not to restrict the
analysis only to this sample of household heads, however, since it does not always make
sense to discard family workers from the group of self-employed, especially if they are
paid or owners and co-owners of the enterprise. These share directly and indirectly the
proceeds generated by the business and often significantly contribute to its operation and
growth (Blanchflower, 2000). When we focus on the sample of household heads, all
findings persist, except for the gender and education differentials. The former is likely to
reflect the dominance of the household head group by men. Furthermore, more
household heads appear to be initiating self-employment activities in RS. In addition, at
the household head level, the effect of receiving overseas remittances is no longer
significant, although the coefficient is still negative. However, transfers from NGOs
continue to have a positive impact on self-employment in the sample of household heads.

20
Table 7, Columns 4 to 6 exclude the 207 formal farmers in our 201 sample and
find that all prior results are robust. In particular, we find that self-employed individuals
continue to be significantly more likely to transition from the informal sector, which
suggests that this result is not driven by possible employment diversification of farmers.
Table 7, Columns 7 to 8 restrict the analysis to the sample of individuals in paid
employment in 2001, either formally or in the informal sector, from which almost 80% of
the inflows to self-employment are derived. We see that all findings hold and are further
reinforced in these specifications. Ceteris paribus, informal sector employees are more
likely to enter self-employment compared to employees in paid employment. The
inclusion of both past wealth and past employment status, together with an interaction
term between the two terms render all three variables insignificant indicating a significant
negative correlation between wealth and informal sector activity. With respect to sources
of finance, examination of the sub-sample of individuals employed in 2001 reinforces the
magnitude of the negative impact of remittances from abroad and the positive effect of
charity/NGO money.16We also find evidence that bank loans are associated with entering
self-employment with employers, which are likely to be larger firms that require greater
up-front capital.
In Table 8 we show a multinomial analysis, where the dependent variable takes a
value of 0 if the individual switches to self-employment with employees (NEWSE-EMP),
a value of 1 if the individual switches to self-employment without employees (NEWSE-
OA), and the value of 2 if the individual never switches to self-employment. In general,
the results are consistent with Tables 6 and 7 and across entrepreneurs that are employers
and own account. However, there are some interesting differences. For instance, only
entrepreneurs with employees are significantly more optimistic, which might indicate the
willingness to take a risk not only on your own behalf but also on the livelihood of others.
In addition, only the own account entrepreneurs are less likely to receive a pension and
only employers are significantly less likely to switch from unemployment; these results
are consistent with our “pull” theory (discussed earlier), that smaller entrepreneurs might
16 As a further robustness check (results not shown), we have excluded the 227 individuals who conducted agricultural activities in 2001, 10 of which became self-employed in later years. This is to examine whether farm diversification might have an impact on the results presented here. All findings of Table 6 remained in those specifications.
21
be those individuals with few other options. Finally, only employers are significantly less
likely to receive remittances from abroad, which adds further evidence that remittances
many not be used for productive purposes.
5. Firm Survival
5.1 Self-employment Performance
The literature has examined several definitions and measures of success and
performance in self-employment, such as self-employment earnings (Schiller and
Crewson, 1997; Burke et al., 2000), firm size - employment creation (Blüderl et al., 1992;
Burke et al., 2000), firm growth (Cooper et al., 1994; Lerner, 1999), longevity in self-
employment defined either as years of duration in business (Blüderl et al., 1992;
Audretsch and Mahmood, 1995; Taylor, 1999; van Praag, 2003; Astebrö and Simons,
2003) or as survival during a particular time interval17 (Bates, 1990; Cooper et al. 1994;
Cressy, 1996; Schiller and Crewson, 1997; Blüderl and Preisendörfer, 1998; Astebrö and
Bernhardt, 2003; Shutt and Sutherland, 2003; Baptista and Karaöz, 2006).
Given the particularities of BiH’s labor market and business environment, the
determinants of small business viability are of great interest to authorities, the
international institutions that have been involved in reforming the regulatory
environment, as well as commercially oriented institutions, such as banks and microcredit
institutions. Ex ante evaluation of firm survival rates can offer information on which
firms are more likely to survive and might worth funding with a loan or other sources of
microfinance. Firms that survive the market selection process in the first years of
existence are the ones the economy might actually benefit from (Baptista and Karaöz,
2006)
With respect to the individual-specific determinants of self-employment survival,
the evidence is often mixed. Cooper et al. (1994) find that firms with a male entrepreneur
have a greater probability of high growth, but not of survival. Other studies have shown
that the probability of survival increases with firm’s age (Evans, 1987), owner’s age
(Storey & Wynarczyk, 1996), and further with owner’s age and education (Bates, 1990)
17 van Praag (2003) further distinguishes between compulsory exits from membership in the self-employment community, failures and voluntary exits. The latter are not necessarily considered as business failure.
22
Furthermore, the size of the firm has shown to be positively related to survival in self-
employment (Evans, 1987; Audretsch and Mahmood, 1995). Jovanovic has described that
entrepreneurs with higher human capital might be faced with less uncertainty and learn
faster about market conditions, adjusting capacity therefore reducing the probability of
exit. Thus, effects of entrepreneurial human capital on the probability of new firm
success may occur prior to the founding of the business. Moreover, educated people may
be better able to detect profitable market opportunities and obtain the information set
required to explore them more efficiently.
With respect to financial variables, the evidence is often also mixed: Using U.S.
data, Holtz-Eakin et al. (1994) find that liquidity constraints play a key role in small firm
viability; Astebrö and Bernhardt (2003) find a negative correlation between having a
bank loan and small business survival and a positive correlation between having a non-
bank loan and survival. In contrast, Cressy (1996) uses U.K. data to assert that the
correlation between access to finance and survival is spurious, with human capital being
the true driving force.
Concerning past employment history, if the main incentive for starting a business
is a “pushing” mechanism out of unemployment-inactivity or self-subsistence activities,
there may not be time to look for good opportunities, make detailed plans and seek for
advice. Thus, independent from productivity and/or learning effects that occur after start-
up, chances of survival may be affected by selection effects occurring prior to start-up
(firms whose founder was previously unemployed might have a lower probability of
survival). On the other hand individuals starting from employment are more likely to be
in a position to raise more capital and set up larger and better equipped businesses
(Colombo et al., 2004), based on their higher earnings and more prestigious professional
status as employees.
Given the fact that our panel only covers the period 2001-2004, we examine the
individual-specific determinants of survival in self-employment for more than one year18.
Table 2 has already indicated that 47.8% of individuals (53.1% of household heads)
18 Observations of an individual in self-employment for two consecutive years do not necessarily establish survival in the same entrepreneurial activity. In order to ensure that survival in self-employment is captured we consider as “survivors”, individuals declaring their status as self-employed in at least two consecutive years and with activity tenure more than a year in the second year of observation.
23
becoming self-employed during the years 2002-2003 in BiH quit their new
entrepreneurial venture during their first year of activity. It is well-known that new
entrepreneurs bear the highest risk of failure during their first few years of activity
(Parker, 2004). Although firm and sector-specific determinants are also of vital
importance, the nature of the database only enables individual-specific analysis. The
literature has emphasized that “this focus on the individual as the level of analysis also
enables one to cope with the growing recognition that entrepreneurship may be a
“habitus” rather than a single-event action” (Wright and Westhead, 1998; van Praag,
2003).
In order to examine the determinants of survival of the new self-employed within
their first year in business, we employ a probit model with sample selection (van de Ven
and van Praag, 1981)19. The model assumes that there is a set of underlying
relationships:
(1) 222
*111
*
iii
iii
xSES
xSET
εβεβ
+=+=
where: subscript * indicates a latent variable; SETi denotes the transition in self-
employment for individual i, SESi denotes survival for more than a year in self-
employment, Ni ,...,2,1=∀ ; x1i and x2i are vectors of explanatory variables; β1, β2 are
vectors of unknown parameters; and ε1, ε2 are assumed zero-mean, bivariate normal
distributed error terms, with unit variances and a correlation coefficient ρ.
The dependent variables however are not always observed; rather the following
binary outcomes are observed for the selection equation and the survival equation,
respectively:
≤>=
employed-self becomenot does individual the:0SET if ,0
employed-self becomes individual the:0SET if ,1*i
*i
iSET
≤>=
employment-selfin year first thesurvivenot does individual the:0SES if ,0
employment-selfin year first thesurvive does individual the:0SES if ,1*i
*i
iSES
19 An interesting application in credit card loan defaults, conditional on credit card application acceptance is Greene (1992). Another application on loan defaults conditional on loan provision is Boyes, Hoffman and Low (1989). Ideally, one would model business longevity as months of duration in business. However, the nature of the dataset restricts our survival analysis into a one-year horizon.

24
Since we can only observe if the individual stops her self-employment activity if she has
become self-employed (for a given individual, SESi is not observed unless SETi=1), there
is not only a censoring rule for (SETi, SESi), but also an observation rule, giving rise to a
set of three types of observations in the sample: (a) never became self-employed, (b)
failed self-employed, (c) successful self-employed. The probability of each observation
is:
SETi=0: P(SETi=0 | x1, x2) = 1 – Φ(x2΄β2)
SESi=0, SETi=1: P(SESi=0, SETi=1 | x1, x2) = Φ2[-x1΄β1, x2΄β2, ρ)
SESi=1, SETi=1: P(SESi=1, SETi=1 | x1, x2) = Φ2(x1΄β1, x2΄β2, ρ)
where Φ2 is the cumulative bivariate normal distribution function and Φ is the standard
cumulative normal. The log-likelihood is based on these probabilities. When ρ≠0, probit
techniques applied to (1) yield biased estimates. The probit model with sample selection
provides consistent, asymptotically efficient estimates for all the parameters in the model.
5.2 Results
In this section we examine the post-entry performance of individuals becoming
self-employed in BiH during the period 2002-2003. Results in Table 9 present marginal
effects from Heckman two-step probit equations.20 In the first stage, we estimate the
probability of becoming self-employed in the years 2002-2003. Our three main
specifications are similar to those in Columns 3 to 6 of Table 6. In the second stage we
estimate the probability of remaining self-employed in the year following that of
transition. The dependent variable is a dummy variable coded 1 if the respondent
remained self-employed in the following year and 0 if not. As identifying restrictions in
the second stage equation, we exclude the variables capturing optimism and pension
receivership. Besides satisfying the statistical criteria, it seems intuitive that those two
variables, captured in the beginning of the panel, will have an effect on the decision to
become self-employed, but will not affect entrepreneurial outcomes in any way. Wald χ2
test-statistics testing the null hypothesis of independent equations reject the null in Table
9, rendering a positive correlation coefficient between the two equations. This indicates
that unobserved variables such as ability, talent etc. that positively affect the decision to
20 We also estimated a multinomial Probit (self-employed/survivor, self-employed/failed, not self-employed) and our main results are robust (not shown).

25
become self-employed also exhibit a positive impact on the survival chances of the new
business ventures.
Income as measured by household consumption at the initial year in the panel has
a persistently positive effect in the survival equation, indicating that higher potential of
self-financing is an essential component of self-employment activity and longevity in
BiH. Among the variables capturing sources of finance and membership in financial
institutions, it is the bank loan variable that exerts a significantly positive effect in the
survival equation. This finding is further reinforced by the positive impact of the variable
capturing transfers from NGO programs. This could be attributed to the good screening
mechanisms of the financial institutions with respect to the entrepreneurial prospects of
the individuals they choose to finance. Hence, while the decision to become an
entrepreneur is not related to financing from banks, the ability to survive is significantly
increased by an existing relationship with a bank. Programs established to promote
entrepreneurship appear to be successful in both promoting entry into self-employment
and probability of success.21 And consistent with our earlier findings, domestic
remittances and charitable donations discourage entrepreneurship and do not improve
probability of success.
Other results verify that men and urban area residents are more likely to survive
the difficult first year in self-employment. A positive concave relationship exists with
age, but the maximum occurs at a younger age compared to the first stage equation.
Thus, while the maximum for self-employment transition is at the age of 40, the
maximum in the survival equation occurs around the age of 35. Education increases the
probability of survival ceteris paribus, and so do previous self-employment experience
and the existence of another self-employed member in the household.
With respect to the past employment origins of the “survivors”, the results
indicate the presence of “pushing factors” and the motivation they entail for survival in
self-employment. Thus, informal sector employees are more likely to become self-
employed than formal sector employees, and further more likely to make it through their
first year.
21 This is consistent with Lerner (1999), which finds that awardees of a U.S. government program to finance small businesses experience faster growth and greater access to venture capital financing.

26
6. Concluding Remarks
We examine the factors affecting the transition to self employment and the
viability of transitions in the short-run in BiH, employing a longitudinal household survey
for the years 2001-2004. The study represents a natural experiment, since in 2000-2001
several regulatory changes concerning the financial and business environment, as well as
the labor market were implemented to promote entrepreneurship. Although the aggregate
proportion of the labor force self-employed did not increase over the sample period,
examining transitions into self-employment at the individual and household level suggest
that even after controlling for the role of individual and social characteristics, financing
constraints played an important role in promoting entry into self-employment and its
success. Specifically, wealthier households are more likely to become entrepreneurs and
survive the early period in business, emphasizing the importance of internal finance.
Variables indicating financial institution customer affiliation, in terms of loans from
formal financial institutions, or even informal sources that one needs to repay, have
insignificant impact on self-employment transitions, but a positive effect on sustainable
self-employment. Particularly an existing prior relationship with a bank significantly
increases the chances of survival for new entrepreneurs, suggesting that while banks
rarely finance entry decisions, they are still instrumental in survival.
In contrast, we find that overseas – and in some case domestic – remittances
significantly decrease the likelihood of becoming an entrepreneur. These results support
the disincentive effects that were documented in the earlier literature. Interestingly, NGO
and government supported programs that provide grants and transfers to promote
entrepreneurship seem to have worked not only in promoting entrepreneurship but also its
success, filling an important financing gap in the absence of more developed formal
financial institutions. However, we fail to see a positive effect of informal financing
mechanisms – from friends or family – or formal microfinance institutions.
Finally, our results indicate that individuals working in the informal sector are
more likely to transition to formal sector self-employment and are more likely to be
successful as entrepreneurs. These results support the perception of informal sector as an
incubator for self-employment in the formal sector in the early years of transition,

27
through which individuals acquire skills that can facilitate their future entrepreneurial
activities. Determinants of informality and of transition into formal sector employment –
both as employers and employers – are important questions which we leave for future
work.
28
References
Ahlburg, D., 1995. “Migration, Remittances and the Distribution of Income: Evidence from the Pacific”. Asian and Pacific Migration Journal, 4, 157-168.
Arabsheibani, G., de Meza, D., Maloney, J., and B. Pearson, 2000. “And a Vision Appeared unto them of a Great Profit: Evidence of Self-Deception Among the Self-Employed”. Economics Letters, 67, 35-41.
Amuedo–Dorantes, C., and S. Pozo, 2006. “Migration, Remittances and Male and Female Employment Patterns”. American Economic Review 96:2,
Astebro, T., and I. Bernhardt, 2003. “Start-up Financing, Owner Characteristics and Survival”. Journal of Economics and Business 55, 303-319.
Astebro, T., and K. L. Simmons, 2003. “Innovation Exit: Why Entrepreneurs Pull the Plug on their innovations”. Rotman Working Papers Series, 2003-7, University of Toronto.
Audretsch, D., and T. Mahmood, 1995, “New Firm Survival: New Results Using a Hazard Function”. Review of Economics and Statistics 77, 99-103.
Ayyagari, M., T. Beck and A. Demirgüc-Kunt, 2003. “Small and Medium Enterprises across the Globe: A New Database”. World Bank Policy Research Working Paper 3127.
Baptista, R., and M. Karaöz, 2006. “Emtrepreneurial Human Capital and the Early Survival Chances of new Start-ups: Opportunity-based versus Necessity-based Entrepreneurship”, Working paper.
Bates, T., 1990. “Entrepreneur Human Capital Inputs and Small Business Longevity”. Review of Economics and Statistics 4, 551-559.
Bates, T., 1995. “Self-Employment Entry Across Industry Groups”. Journal of Business Venturing 10, 143-156.
Bilter, M. P., Moskowitz, T. K., and A. Vissing-Jorgensen, 2005. “Testing Agency Theory with Entrepreneur Effort and Wealth”. Journal of Finance 60, 539-576.
Blanchflower, D., 2000. “Self-Employment in OECD Countries”. Labour Economics 7, 471-505.
Blanchflower. D. G., and A. J. Oswald, 1998. “What Makes an Entrepreneur?”. Journal of Labor Economics 16:1, 26-60.
Blau, D. M., 1985. “Self-Employment and Self-Selection in Developing Country Labour Markets”. Southern Economic Journal. 52, 351-363.
Boden, R. J., 1996. “Gender and Self-Employment Selection: An Empirical Assessment”. Journal of Socioeconomics, 25, 671-682.
Borjas, G. J., 1986. “The Self-Employment Experience of Immigrants”. Journal of Human Resources. 21, 485-506.
Boyes, W., Hoffman, D., and S. Low, 1989. “An Econometric Analysis of the Bank Credit Scoring Problem”. Journal of Econometrics, 40, 3-14.
29
Brüderl, J., Preisendörfer, P., and R. Ziegler, 1992. “Organizational Survival”. American Sociological Review. 57, 227-242.
Brüderl, J., and P. Preisendörfer, 1998. “Network Support and the Success of Newly Founded Businesses”. Small Business Economics. 10, 213-225.
Burke, A. E., FitzRoy, F. R., and M. A. Nolan, 2000. “When Less is More: Distinguishing Between Entrepreneurial Choice and Performance”. Oxford Bulletin of Economics and Statistics, 62, 5, 565-587.
Cantillon, R., 1755. “Essai Sur la Nature de Commerce en Général”, 1931 edn, ed. And tran. by H. Higgs, London, MacMillan.
Colombo, M., Delmastro. M., and L. Girilli, 2004.”Entrepreneurs’ human capital and the start-up size of new technology-based firms.” International Journal of Industrial Organization, 22, 1183-1211.
Cooper, A. C., Gimeno-Gascon, F. J., and C. Y. Woo, 1994. “Initial human and financial capital as predictors of new venture performance”. Journal of Business Venturing, Volume 9:5, 371-395.
Connell, J., and R. P. C. Brown, 2005. “Remittances in the Pacific: An Overview”. Asian Development Bank Report, March 2005, 1-73.
Cressy, R., 1996. “Are Business Start-Ups Debt-Rationed?”. Economic Journal, Vol. 106, No. 438 (Sept.), 1253-1270.
Cuna, L., 2004, “Assessing Household Vulnerability to Employment Shocks: A Simulation Methodology Applied to Bosnia and Herzegovina”, Working Paper, 1-30.
Djankov, S., Miguel, E., Qian, Y., Roland, G., and E. V. Zhuravskaya, 2005. “Who are Russia’s Entrepreneurs?” Journal of the European Economic Association, April/May 2005, Vol. 3, No. 2-3, 587-597.
Djankov, S., Qian, Y., Roland, G., and E. V. Zhuravskaya, 2006a. “Entrepreneurship in China and Russia Compared”. Journal of the European Economic Association, April/May 2006, Vol. 4, No. 2-3, 352-365.
Djankov, S., Qian, Y., Roland, G., and E. V. Zhuravskaya, 2006b. “Who are China’s Entrepreneurs”. The American Economic Review, Vol. 96, No. 2 (May 2006), 348-352.
Dutz, M., Kauffmann, C., Najarian S., Sanfey, P., and R. Yemtsov, 2001. “Labour Market States, Mobility and Entrepreneurship in Transition Economies”. European Bank for Reconstruction and Development, Working Paper, November 2001.
Earle, J. S., and Z. Sakova, 2000. “Business Start-ups or Disguised Unemployment? Evidence on the Character of Self-Employment from Transition Economies”. Labour Economics, 7, 575-601.
Earle, J. S., and Z. Sakova, 2001. “Entrepreneurship from Scratch”. Working Paper, 1-44.
Evans, D. S., 1987. “The Relationship Between Firm Growth, Size and Age: Estimates for 100 Manufacturing Firms”. Journal of Industrial Economics, 35, 567-581.
Evans, D. S., and B. Jovanovic, 1989. “An Estimated Model of Entrepreneurial Choice under Liquidity Constraints”. Journal of Political Economy, Vol. 97, No. 4 (Aug., 1989), 808-827.
30
Fraser, S., and F. J. Greene, 2006. “The Effects of Experience on Entrepreneurial Optimism and Uncertainty”. Economica, 73, 169-192.
Foreign Investment Agency Service, 2001. “Bosnia and Herzegovina: Commercial Legal Framework and Administrative Barriers to Investment”. Joint Service of the IFC and the World Bank, March 2001.
Funkhouser, E., 1992. “Migration from Nicaragua: Some Recent Evidence”. World Development, 20 (8), 1209-18.
Gentry, W., and G. Hubbard, 2001. “Entrepreneurship and Household Saving”. Advances in Economic Analysis and Policy, Berkeley Electronic Press, Vol. 4(1), 1,053-1,108.
Gomez, R. and E. Santor, 2001, “Membership has its Privileges: The Effect of Social Capital and Neighbourhood Characteristics on the Earnings of Microfinance Borrowers”, Canadian Journal of Economics, 34, 943-966.
Greene, W., 1992. “A Statistical Model for Credit Scoring”. Working Paper No. EC-92-29, New York University, Department of Economics, Stern School of Business.
Haber, S. E., E. J. Lamas, and J. Lichtenstein, 1987. “On their Own: The Self-Employed and Others in Private Business”. Monthly Labor Review, 110, 17-23.
Hamilton, B., 2000. “Does Entrepreneurship Pay? An Empirical Analysis of the Returns to Self-Employment”. Journal of Political Economy, 108, 604-631.
Harris, J. R., and M. P. Todaro, 1970. “Migration, Unemployment and Development: A Two-Sector Analysis”. American Economic Review. 60, 126-142.
Heaton, J., and D. Lucas, 2000. “Asset Pricing and Portfolio Choice: The Importance of Entrepreneurial Risk”. Journal of Finance, 55, 1163-1198.
Hochguertel, S., 2005. “The Dynamics of Self-Employment and Household Wealth: New Evidence from Panel Data”. Department of Economics, Gree University of Amsterdam Mimeo.
Holtz-Eakin, D., Joulfaian, D., and H. S. Rosen, 1994a. “Sticking it out: Entrepreneurial Survival and Liquidity Constraints”, Journal of Political Economy, 102 (February), 53-75.
Holtz-Eakin, D., Joulfaian, D., and H. S. Rosen, 1994b. “Entrepreneurial Decisions and Liquidity Constraints”, RAND Journal of Economics, Vol. 25, No. 2 (Summer 1994), 334-347.
Holtz-Eakin, D., Rosen, H. S., and R. Weathers, 2000. “Horatio Alger Meets the Mobility Tables”, Small Business Economics, vol. 14(4), 243-274.
Hurst, E., and A. Lusardi, 2004. “Liquidity Constraintsm Household Wealth, and Entrepreneurship”. Journal of Political Economy, 112, 319-347.
Johnson, Kaufmann and Shleifer, 1997. “The Unofficial Economy in Transition”. Brookings Papers of Economic Activity, No. 2 (February), 159-221.
Jovanovic, B., 1982. “Selection and the Evolution of Industry”. Econometrica, 50, 649-670.
Kaufmann, D., and A. Kaliberda, 1996. “Integrating the Unofficial Economy into the Dynamics of Post-Socialist Economies”. World Bank Policy Research Working Paper 1691, 1-52.
31
Klapper, L., L. Laeven, and R. Rajan, 2007, “Barriers to Entrepreneurship”, Journal of Financial Economics, forthcoming.
Klapper, L., V. Sarria-Allende, and V. Sulla, 2004. “SME Financing in Eastern Europe”. World Bank Working Paper.
Knight, F. H., 1921. “Risk, Uncertainty and Profit”, New York, Houghton-Mifflin.
Lazear, E. P., 2004. “Balanced Skills and Entrepreneurship”, American Economic Review, 94, 208-211.
Le, A. T., 1999. “Empirical Studies of Self-Employment”. Journal of Economic Surveys, 13, 381-416.
Leibenstein H., 1968. “Entrepreneurship and Development”. American Economic Review 58, 72-83.
Lerner, J., 1999. “The Government as Venture Capitalist: The Long-Run Impact of the SBIR Program”. Journal of Business 72, 285-328.
Lindh, T. and H. Ohlsson, 1996. “Self-Employment and Windfall Gains: Evidence from the Swedish Lottery”. Economic Journal. 106, 1515-1526.
Lucas, R. E., 1978. “On the Size Distribution of Business Firms”. Bell Journal of Economics. 9, 508-523.
Lyman, T. R., 2005. “Legal and Regulatory Environment for Microfinance in Bosnia and Herzegovina: A Decade of Evolution and Prognosis for the Future”. Essays on Regulation and Supervision (http://www.microfinancegateway.org/files/25462_file_Bosnia.pdf) .
Miller R., 1984. “Job Matching and Occupational Choice”. Journal of Political Economy, 92 (Oct. 1984), 1086-1120.
Moskowitz, T., and A. Vissing-Jorgensen, 2002. “The Returns to Entrepreneurial Investment: An Equity Premium Puzzle”, American Economic Review, 92, 745-778.
Muço, M., P. Sanfey, with E. Luçi and G. Hashorva, 2004, “Private Sector and Labour Market Developments in Albania: Formal versus Informal”, Working Paper, Global Development Network Southeast Europe, 1-45.
Norwegian Agency for Development Cooperation (NORAD), 2002. “Private Se ctor Development in Bosnia and Herzegovina.
Parker, S. C., 2004. “The Economics of Self-Employment and Entrepreneurship”. Cambidge University Press, 1-323.
Parker, S. C., 2005. “The Economics of Entrepreneurship: What we Know and What we Don’t”. Working Paper, 1-65.
Parker, S. C., 2006. “The New Agendas in the Economics of Entrepreneurship: Optimism, Education, Wealth and Entrepreneurship”. Mimeo, 1-25.
32
Paulson, A. L., and R. Townsend, 2004. “Entrepreneurship and Financial Constraints in Thailand”. Journal of Corporate Finance, 10, 229-262.
Paulson, A. L., and R. Townsend, 2005. “Financial Constraints and Entrepreneurship: Evidence from the Thai Financial Crisis”. Economic Perspectives, 29(3Q/2005), 34-48.
Paulson, A. L., Townsend, R., and A. Karaivanov, 2006. “Distinguishing Limited Liability from Moral Hazard in a Model of Entrepreneurship”. Journal of Political Economy, Vol. 114, No. 1 (Feb., 2006), 100-144.
Puri, M., and D. Robinson, 2005. “Optimism and Economic Choice”. NBER Working Paper 11361, 1-41.
Ravallion, M. and M. Lokshin, 2006. “Who Cares About Relative Deprivation?” The World Bank, Policy Research Working Paper Series No. 3782.
Rodriguez, E. R. and E. R. Tiongson, 2001. “Temporary Migration Overseas and Household Labor Supply: Evidence from Urban Philippines”, International Migration Review, 35(3), 708-725.
Say J. B., 1828. “Cours Complet d’ Economie Politique”, Paris.
Schiller, B. R., and P. E. Crewson, 1997. “Entrepreneurial Origins: A Longitudinal Inquiry”. Economic Inquiry, Vol. XXXV (July 1997), 523-531.
Schumpeter, J. A., 1934. “The Theory of Economic Development”. Cambridge, MA, Harvard University Press.
Schumpeter, J. A., 1939. “Business Cycles”. New York, McGraw-Hill.
Schumpeter, J. A., 1942. “Capitalism, Socialism and Democracy”. New York: Harper.
Shutt, J., and J. Sutherland, 2003. “Encouraging the Transition into Self-Employment”. Regional Studies, vol. 37, 1, 97-103.
Storey, D. J. and P. Wynarczyk, 1996. “The survival and non survival of micro firms in the UK”. Review of Industrial Organization. Vol. 11, No. 2 (April, 1996), 211-229.
Taylor, M. P., 1999, “Survival of the Fittest? An Analysis of Self-Employment Duration in Britain”. Economic Journal. 109, C140-C155.
Quadrini, V., 2000. “Entrepreneurship, Saving, and Social Mobility”. Review of Economic Dynamics, 3, 1-40.
United Nations Development Programme, 2002, “Human Development Report: Bosnia and Herzegovina”.
van de Ven, W. P. M. M., and B. M. S. van Praag, 1981. “The Demand for Deductibles in Private Health Insurance: A Probit Model with Sample Selection”. Journal of Econometrics, 17, 229-252.
van Praag, C. M., 2003. “Business Survival and Success of Young Small Business Owners”. Small Business Economics, 21, 1-17.
Westhead, P., and M. Wright, 1998. “Novice, Portfolio and Serial Founders in Rural and Urban Areas”. Entrepreneurship, Theory & Practice, Vol. 22 (4), 63-100.

33
Woolcock, M., 2002. “Social Capital in Theory and Practice: Where Do We Stand?” published in Jonathan Isham, Thomas Kelly, and Sunder Ramaswamy (eds.), 2002, “Social Capital and Economic Development: Well-Being in Developing Countries”, Northampton, MA: Edward Elgar Publishing, 19-39.
Woolcock, M., 2005. “Calling on Friends and Relatives: Social Capital”, published in Marianne Fay (ed.), “The Urban Poor in Latin America”, Washington, DC: The World Bank (June 2005), 219-238.
World Bank, 2002. “Labor Market in Postwar Bosnia and Herzegovina - How to Encourage Businesses to Create Jobs and Increase Worker Mobility”. Report No. 24889-BIH, Human Development Unit, South-East Europe Country Unit, Europe and Central Asia Region.
World Bank, 2003. “Bosnia and Herzegovina Poverty Assessment (In Two Volumes)”. Report No. 25343-BiH, Poverty Reduction and Economic Management Unit, Europe and Central Asia Region.
World Bank, 2005a. “Bosnia and Herzegovina, Labour Market Update: The Role of Industrial Relations”. Report No. 32650-BA, Human Development Sector Unit, Europe and Cental Asia Region.
World Bank, 2005b. “Bosnia and Herzegovina Country Economic Memorandum”. Poverty Reduction and Report No. 29500-BA, Economic Management Unit, Europe and Central Asia Region.
World Bank, 2005c. “Poverty and the Labor Market in Bosnia and Herzegovina: 2001 to 2004”.
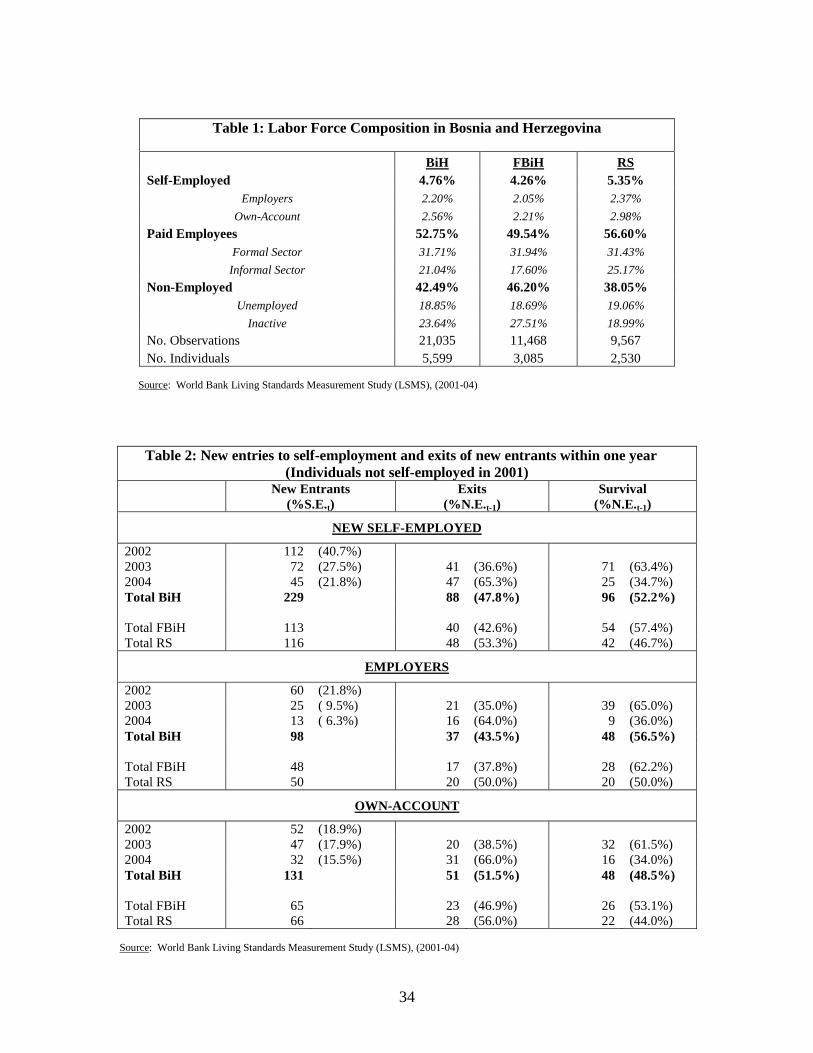
34
Source: World Bank Living Standards Measurement Study (LSMS), (2001-04)
Table 2: New entries to self-employment and exits of new entrants within one year (Individuals not self-employed in 2001)
New Entrants
(%S.E.t) Exits
(%N.E.t-1) Survival
(%N.E.t-1)
NEW SELF-EMPLOYED
2002 112 (40.7%) 2003 72 (27.5%) 41 (36.6%) 71 (63.4%) 2004 45 (21.8%) 47 (65.3%) 25 (34.7%) Total BiH 229 88 (47.8%) 96 (52.2%) Total FBiH 113 40 (42.6%) 54 (57.4%) Total RS 116 48 (53.3%) 42 (46.7%)
EMPLOYERS
2002 60 (21.8%) 2003 25 ( 9.5%) 21 (35.0%) 39 (65.0%) 2004 13 ( 6.3%) 16 (64.0%) 9 (36.0%) Total BiH 98 37 (43.5%) 48 (56.5%) Total FBiH 48 17 (37.8%) 28 (62.2%) Total RS 50 20 (50.0%) 20 (50.0%)
OWN-ACCOUNT
2002 52 (18.9%) 2003 47 (17.9%) 20 (38.5%) 32 (61.5%) 2004 32 (15.5%) 31 (66.0%) 16 (34.0%) Total BiH 131 51 (51.5%) 48 (48.5%) Total FBiH 65 23 (46.9%) 26 (53.1%) Total RS 66 28 (56.0%) 22 (44.0%)
Source: World Bank Living Standards Measurement Study (LSMS), (2001-04)
Table 1: Labor Force Composition in Bosnia and Herzegovina
BiH FBiH RS Self-Employed 4.76% 4.26% 5.35%
Employers 2.20% 2.05% 2.37%
Own-Account 2.56% 2.21% 2.98%
Paid Employees 52.75% 49.54% 56.60% Formal Sector 31.71% 31.94% 31.43%
Informal Sector 21.04% 17.60% 25.17%
Non-Employed 42.49% 46.20% 38.05% Unemployed 18.85% 18.69% 19.06%
Inactive 23.64% 27.51% 18.99%
No. Observations 21,035 11,468 9,567 No. Individuals 5,599 3,085 2,530

35
Table 3: Variable names, definitions and sample averages (World Bank LSMS, 2001-04)
Variable Name Definition Mean (S.D.)
Individual Characteristics:
MALE Dummy variable (DV=1/0) equal to 1 if respondent is male 51.3% (0.50)
AGE Age of the respondent in year 2001 35.80 (12.92)
FBiH DV equal to 1 if respondent resides in Federation of Bosnia & Herzegovina (0 in Republica Srpska) 55.3% (0.50)
URBAN DV equal to 1 if respondent resides in a urban area 45.6% (0.50)
MARRIED DV equal to 1 if respondent is married or cohabiting in 2001 60.9% (0.49)
LCHILDREN Natural Logarithm of declared number of children (natural or not) plus 1 0.65 (0.59)
EDUCLOW DV equal to 1 if respondent has no formal education or primary school education 34.3% (0.47)
DISABLED DV equal to 1 if respondent considers him/herself disabled 4.6% (0.21)
GHEALTH DV equal to 1 if respondent evaluates his/her health as good or excellent during the last 12 months, the two top categories in the 5-scale Subjective Health Evaluation Question
37.8% (0.48)
DISPLACED DV equal to 1 if respondent moved to his/her current place of residence because of: (a) the war, (b) property was occupied, (c) security reasons, (d) returnee, (e) property destroyed during the war, or respondent considers him/herself as permanently or temporarily displaced resident
32.0% (0.47)
TRAINING DV equal to 1 if respondent had any work-related training during the period 2001-2002 2.1% (0.14)
PASTSE DV equal to 1 if respondent's first occupation after school-leaving age was self-employed 2.2% (0.15)
OPTIMISM
Index [0,1] produced as the weighted average of the intensity measured by a 4-scale response in 8 mental health questions from the GHQ: During the last week how often have you: (1) Felt low in energy, slowed down? (2) Accused yourself for different things? (3) Felt you lost appetite? (4) Felt hopeless in terms of the future? (5) Felt Lonely? (6) Thought about ending your life? (7) Felt that everything was an effort? (8) Constantly had nightmares?
90.2% (0.11)
NOSOCPTL DV , proxy for individual social capital, equal to 1 if individual responded “No” to either question: (1) "Is there anyone you can count of to listen to you when you need to talk?", (2) "Is there anyone who you can really count on to help you out in a crisis?"
19.6% (0.40)
OTHERSE DV equal to 1 if another member of the household is self-employed in 2001 6.7% (0.25)
HINSUR DV equal to 1 if respondent receives health insurance, either from work or the Employment Bureau 75.2% (0.43)
PENSION DV equal to 1 if respondent receives pension insurance, either from work or Employment Bureau, or Centre for Social Work
34.4% (0.48)
Wealth and Financial Characteristics:
LHHCONS Natural Logarithm of Total per capita Household Consumption in 2001, deflated at the regional level by regional poverty line (Main Welfare Aggregate)
7.83 (0.52)
INFORMLOAN DV (1/0) if a household member received a loan from a family member, friend or other individual in 2001 17.1% (0.38)
MICROLOAN DV (1/0) if a household member received a loan from a microfinance institution or microloan from a credit union, co-operative or NGO in 2001
2.5% (0.16)
BANKLOAN DV (1/0) if a household member received a loan from a private or government Bank in 2001 11.6% (0.32)
REMITDOM DV (1/0) if a household member received any money from friends or family working in BiH in 2001 8.5% (0.28)
REMITABROAD DV (1/0) if a household member received any money from friends or family working abroad in 2001 11.4% (0.32)
GRANT DV (1/0) if a household member received money from NGOs or charities in 2001 2.1% (0.14)
SOCIALSERV DV (1/0) if a household member received old age or disability pension, or survivors, war veterans, or war disability pensions from the Civil Victims of War Program in 2001
27.5% (0.45)
Employment Status in 2001:
EMPLOYED DV (1/0) if respondent was in paid employment in 2001 (formal or informal) 56.1% (0.50)
FORMAL DV (1/0) if respondent was a formal sector employee in 2001 35.2% (0.48)
INFORMAL DV (1/0) if respondent was employed in the informal sector in 2001 20.8% (0.41)
NONEMPLOYED DV (1/0) if respondent was not in paid employment in 2001 (formal or informal) 43.9% (0.50)
UNEMPLOYED DV (1/0) if respondent declared status as unemployed in 2001 18.8% (0.39)
INACTIVE DV (1/0) if respondent declared status as student/retired/housewife in 2001 25.1% (0.43)
Switch to Self-Employment:
NEWSE DV (1,0) indicating that the individual switched to self-employment after 2001 4.29% (0.20)
NEWSE-OA DV (1,0) indicating that the individual switched to own-account self-employment after 2001 2.45% (0.15)
NEWSE-EMPL DV (1,0) indicating that the individual switched to self-employment with employees after 2001 1.84% (0.13)
EMPL_1-5 DV (1/0) indicating self-employed with 1-5 employees 1.3% (0.11)
EMPL_5-20 DV (1/0) indicating self-employed with 5-20 employees 0.3% (0.05)
YEAR02 DV (1/0) indicating that the year of transition to self-employment was 2002 2.1% (0.14)
YEAR03 DV (1/0) indicating that the year of transition to self-employment was 2003 1.3% (0.12)
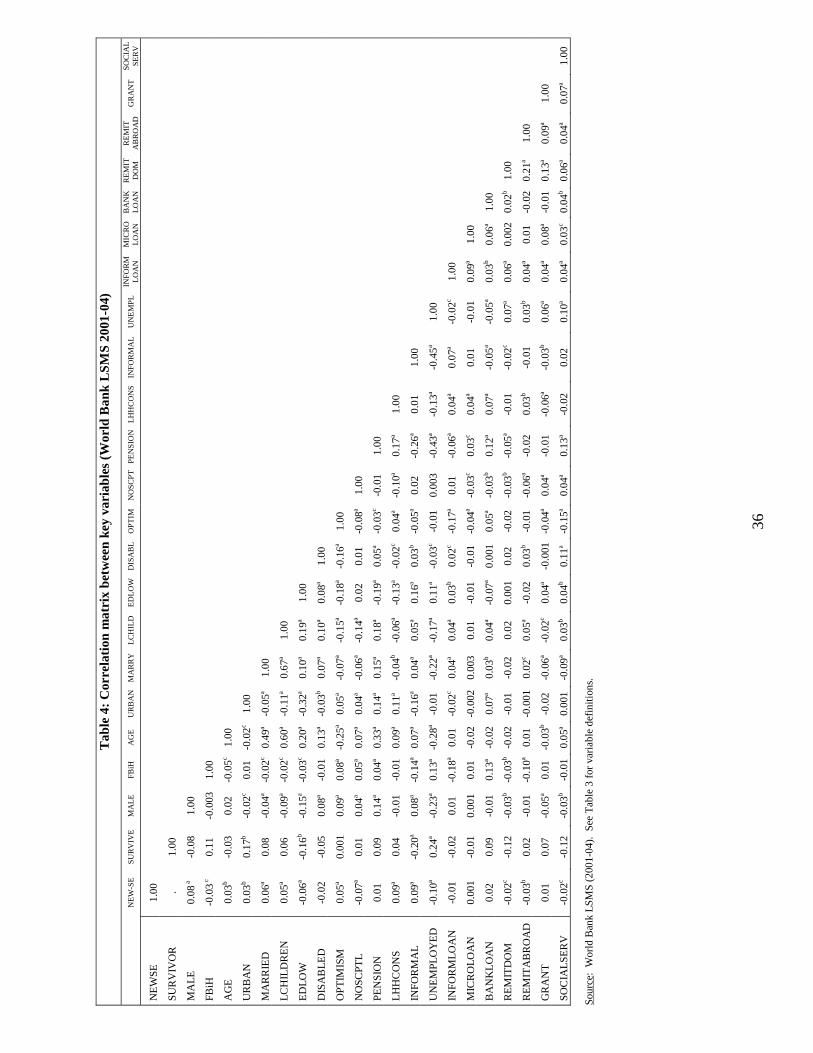
36
Tab
le 4
: C
orre
lati
on m
atri
x be
twee
n ke
y va
riab
les
(Wor
ld B
ank
LSM
S 20
01-0
4)
N
EW
-SE
S
UR
VIV
E
MA
LE
FB
iH
AG
E
UR
BA
N
MA
RR
Y
LC
HIL
D
ED
LO
W
DIS
AB
L
OP
TIM
N
OS
CP
T
PE
NS
ION
L
HH
CO
NS
IN
FOR
MA
L
UN
EM
PL
IN
FOR
M
LO
AN
M
ICR
O
LO
AN
B
AN
K
LO
AN
R
EM
IT
DO
M
RE
MIT
A
BR
OA
D
GR
AN
T
SO
CIA
L
SE
RV
NE
WSE
1.
00
SUR
VIV
OR
.
1.00
MA
LE
0.
08 a
-0.0
8 1.
00
FBiH
-0
.03 c
0.
11
-0.0
03
1.00
AG
E
0.03
b -0
.03
0.02
-0
.05c
1.00
UR
BA
N
0.03
b 0.
17b
-0.0
2c 0.
01
-0.0
2c 1.
00
MA
RR
IED
0.
06a
0.08
-0
.04a
-0.0
2c 0.
49a
-0.0
5a 1.
00
LC
HIL
DR
EN
0.
05a
0.06
-0
.09a
-0.0
2c 0.
60a
-0.1
1a 0.
67a
1.00
ED
LO
W
-0.0
6a -0
.16b
-0.1
5a -0
.03c
0.20
a -0
.32a
0.10
a 0.
19a
1.00
DIS
AB
LE
D
-0.0
2 -0
.05
0.08
a -0
.01
0.13
a -0
.03b
0.07
a 0.
10a
0.08
a 1.
00
OPT
IMIS
M
0.05
a 0.
001
0.09
a 0.
08a
-0.2
5a 0.
05a
-0.0
7a -0
.15a
-0.1
8a -0
.16a
1.00
NO
SCPT
L
-0.0
7a 0.
01
0.04
a 0.
05a
0.07
a 0.
04a
-0.0
6a -0
.14a
0.02
0.
01
-0.0
8a 1.
00
PEN
SIO
N
0.01
0.
09
0.14
a 0.
04a
0.33
a 0.
14a
0.15
a 0.
18a
-0.1
9a 0.
05a
-0.0
3c -0
.01
1.00
LH
HC
ON
S 0.
09a
0.04
-0
.01
-0.0
1 0.
09a
0.11
a -0
.04b
-0.0
6a -0
.13a
-0.0
2c 0.
04a
-0.1
0a 0.
17a
1.00
INFO
RM
AL
0.
09a
-0.2
0a 0.
08a
-0.1
4a 0.
07a
-0.1
6a 0.
04a
0.05
a 0.
16a
0.03
b -0
.05a
0.02
-0
.26a
0.01
1.
00
UN
EM
PLO
YE
D
-0.1
0a 0.
24a
-0.2
3a 0.
13a
-0.2
8a -0
.01
-0.2
2a -0
.17a
0.11
a -0
.03c
-0.0
1 0.
003
-0.4
3a -0
.13a
-0.4
5a 1.
00
INFO
RM
LO
AN
-0
.01
-0.0
2 0.
01
-0.1
8a 0.
01
-0.0
2c 0.
04a
0.04
a 0.
03b
0.02
c -0
.17a
0.01
-0
.06a
0.04
a 0.
07a
-0.0
2c 1.
00
MIC
RO
LO
AN
0.
001
-0.0
1 0.
001
0.01
-0
.02
-0.0
02
0.00
3 0.
01
-0.0
1 -0
.01
-0.0
4a -0
.03c
0.03
c 0.
04a
0.01
-0
.01
0.09
a 1.
00
BA
NK
LO
AN
0.
02
0.09
-0
.01
0.13
a -0
.02
0.07
a 0.
03b
0.04
a -0
.07a
0.00
1 0.
05a
-0.0
3b 0.
12a
0.07
a -0
.05a
-0.0
5a 0.
03b
0.06
a 1.
00
RE
MIT
DO
M
-0.0
2c -0
.12
-0.0
3b -0
.03b
-0.0
2 -0
.01
-0.0
2 0.
02
0.00
1 0.
02
-0.0
2 -0
.03b
-0.0
5a -0
.01
-0.0
2c 0.
07a
0.06
a 0.
002
0.02
b 1.
00
RE
MIT
AB
RO
AD
-0
.03b
0.02
-0
.01
-0.1
0a 0.
01
-0.0
01
0.02
c 0.
05a
-0.0
2 0.
03b
-0.0
1 -0
.06a
-0.0
2 0.
03b
-0.0
1 0.
03b
0.04
a 0.
01
-0.0
2 0.
21a
1.00
GR
AN
T
0.01
0.
07
-0.0
5a 0.
01
-0.0
3b -0
.02
-0.0
6a -0
.02c
0.04
a -0
.001
-0
.04a
0.04
a -0
.01
-0.0
6a -0
.03b
0.06
a 0.
04a
0.08
a -0
.01
0.13
a 0.
09a
1.00
SOC
IAL
SER
V
-0.0
2c -0
.12
-0.0
3b -0
.01
0.05
a 0.
001
-0.0
9a 0.
03b
0.04
b 0.
11a
-0.1
5a 0.
04a
0.13
a -0
.02
0.02
0.
10a
0.04
a 0.
03c
0.04
b 0.
06a
0.04
a 0.
07a
1.00
So
urce
: W
orld
Ban
k L
SMS
(200
1-04
). S
ee T
able
3 f
or v
aria
ble
defi
niti
ons.
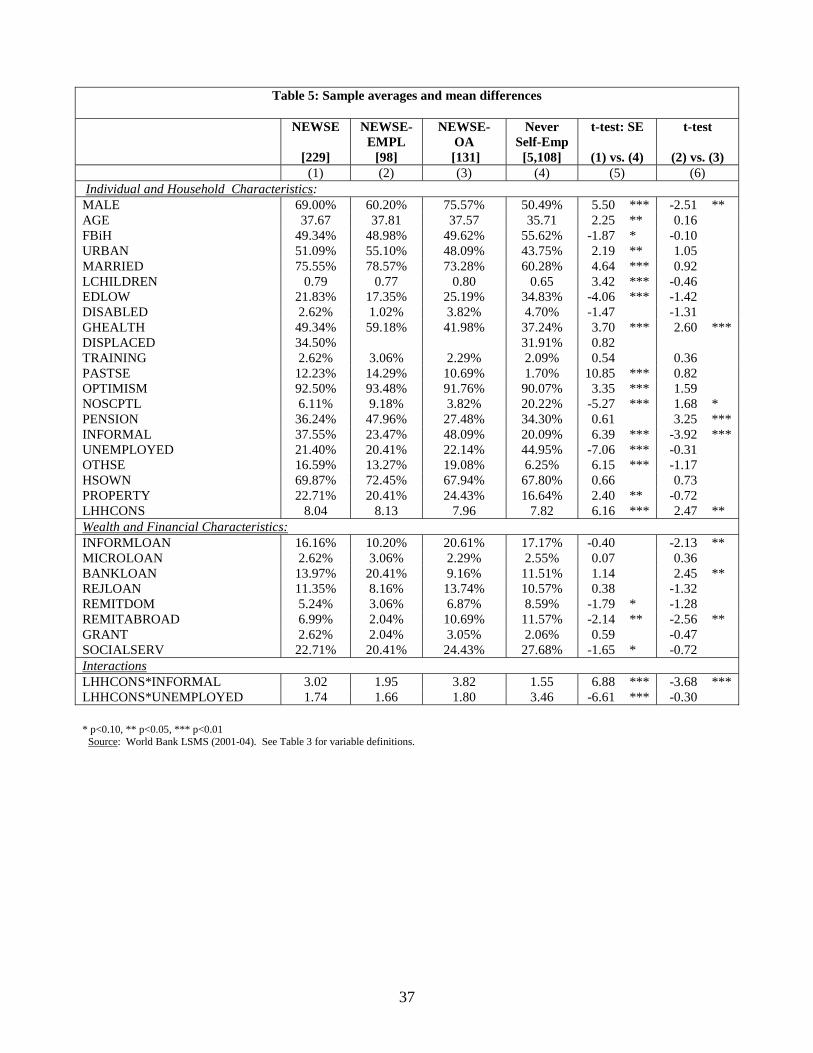
37
Table 5: Sample averages and mean differences
NEWSE
[229]
NEWSE- EMPL
[98]
NEWSE- OA
[131]
Never Self-Emp
[5,108]
t-test: SE
(1) vs. (4)
t-test
(2) vs. (3) (1) (2) (3) (4) (5) (6)
Individual and Household Characteristics: MALE 69.00% 60.20% 75.57% 50.49% 5.50 *** -2.51 ** AGE 37.67 37.81 37.57 35.71 2.25 ** 0.16 FBiH 49.34% 48.98% 49.62% 55.62% -1.87 * -0.10 URBAN 51.09% 55.10% 48.09% 43.75% 2.19 ** 1.05 MARRIED 75.55% 78.57% 73.28% 60.28% 4.64 *** 0.92 LCHILDREN 0.79 0.77 0.80 0.65 3.42 *** -0.46 EDLOW 21.83% 17.35% 25.19% 34.83% -4.06 *** -1.42 DISABLED 2.62% 1.02% 3.82% 4.70% -1.47 -1.31 GHEALTH 49.34% 59.18% 41.98% 37.24% 3.70 *** 2.60 *** DISPLACED 34.50% 31.91% 0.82 TRAINING 2.62% 3.06% 2.29% 2.09% 0.54 0.36 PASTSE 12.23% 14.29% 10.69% 1.70% 10.85 *** 0.82 OPTIMISM 92.50% 93.48% 91.76% 90.07% 3.35 *** 1.59 NOSCPTL 6.11% 9.18% 3.82% 20.22% -5.27 *** 1.68 * PENSION 36.24% 47.96% 27.48% 34.30% 0.61 3.25 *** INFORMAL 37.55% 23.47% 48.09% 20.09% 6.39 *** -3.92 *** UNEMPLOYED 21.40% 20.41% 22.14% 44.95% -7.06 *** -0.31 OTHSE 16.59% 13.27% 19.08% 6.25% 6.15 *** -1.17 HSOWN 69.87% 72.45% 67.94% 67.80% 0.66 0.73 PROPERTY 22.71% 20.41% 24.43% 16.64% 2.40 ** -0.72 LHHCONS 8.04 8.13 7.96 7.82 6.16 *** 2.47 ** Wealth and Financial Characteristics: INFORMLOAN 16.16% 10.20% 20.61% 17.17% -0.40 -2.13 ** MICROLOAN 2.62% 3.06% 2.29% 2.55% 0.07 0.36 BANKLOAN 13.97% 20.41% 9.16% 11.51% 1.14 2.45 ** REJLOAN 11.35% 8.16% 13.74% 10.57% 0.38 -1.32 REMITDOM 5.24% 3.06% 6.87% 8.59% -1.79 * -1.28 REMITABROAD 6.99% 2.04% 10.69% 11.57% -2.14 ** -2.56 ** GRANT 2.62% 2.04% 3.05% 2.06% 0.59 -0.47 SOCIALSERV 22.71% 20.41% 24.43% 27.68% -1.65 * -0.72 Interactions LHHCONS*INFORMAL 3.02 1.95 3.82 1.55 6.88 *** -3.68 *** LHHCONS*UNEMPLOYED 1.74 1.66 1.80 3.46 -6.61 *** -0.30 * p<0.10, ** p<0.05, *** p<0.01
Source: World Bank LSMS (2001-04). See Table 3 for variable definitions.

38
Table 6: The determinants of the transition to self-employment
Probit regressions, dependent variable: (1/0) New self-employed/Not (1) (2) (3) (4) (5) (6) (7)
MALE 0.028 0.030 0.022 0.023 0.029 0.030 0.022 [5.93]*** [6.11]*** [4.88]*** [4.95]*** [6.01]*** [6.21]*** [4.98]*** FBiH -0.006 -0.006 -0.003 -0.003 -0.007 -0.007 -0.005 [1.29] [1.16] [0.72] [0.56] [1.53] [1.47] [0.98] AGE 0.006 0.006 0.005 0.004 0.006 0.006 0.005 [4.45]*** [4.07]*** [3.60]*** [3.19]*** [4.53]*** [4.17]*** [3.72]*** AGESQ/1,000 -0.070 -0.069 -0.057 -0.053 -0.069 -0.069 -0.056 [4.16]*** [3.96]*** [3.40]*** [3.16]*** [4.22]*** [4.07]*** [3.52]*** URBAN 0.008 0.008 0.010 0.009 0.008 0.007 0.009 [1.69]* [1.65]* [1.99]** [1.93]* [1.58] [1.51] [1.89]* MARRIED 0.010 0.012 0.009 0.011 0.010 0.013 0.009 [1.54] [1.79]* [1.44] [1.71]* [1.62] [1.94]* [1.52] LCHILDREN 0.002 0.005 0.002 0.005 0.002 0.005 0.002 [0.31] [0.82] [0.40] [0.79] [0.28] [0.85] [0.34] EDUCLOW -0.015 -0.013 -0.015 -0.013 -0.015 -0.013 -0.015 [3.00]*** [2.54]** [3.28]*** [2.85]*** [3.11]*** [2.66]*** [3.39]*** DISABLED -0.017 -0.016 -0.017 -0.015 -0.016 -0.015 -0.016 [2.53]** [2.30]** [2.79]*** [2.57]** [2.47]** [2.23]** [2.80]*** PASTSE 0.190 0.178 0.155 0.144 0.186 0.174 0.150 [4.33]*** [4.01]*** [3.80]*** [3.52]*** [4.27]*** [3.94]*** [3.73]*** OPTIMISM 0.062 0.051 0.061 0.048 0.060 0.047 0.059 [2.61]*** [2.08]** [2.64]*** [2.10]** [2.58]*** [1.96]* [2.59]*** NOSOCPTL -0.025 -0.024 -0.024 -0.022 -0.026 -0.025 -0.024 [5.91]*** [5.42]*** [5.86]*** [5.40]*** [6.43]*** [5.98]*** [6.38]*** PENSION -0.011 -0.014 -0.008 -0.010 -0.012 -0.015 -0.009 [2.29]** [2.94]*** [1.31] [1.66]* [2.64]*** [3.34]*** [1.48] OTHERSE 0.061 0.050 0.060 0.047 0.060 0.048 0.059 [3.63]*** [3.27]*** [3.67]*** [3.28]*** [3.55]*** [3.17]*** [3.60]*** LHHCONS - 0.021 - 0.011 - 0.022 - [4.59]*** [1.64] [4.88]*** INFORMAL - - 0.019 -0.016 - - 0.020 [2.05]** [0.29] [2.07]** UNEMPLOYED - - -0.012 -0.288 - - -0.011 [1.75]* [1.40] [1.68]* LHHCONS*INFORMAL - - - 0.004 - - - [0.44] LHHCONS*UNEMPLOYED - - - 0.022 - - - [2.19]** INFORMLOAN - - - - -0.002 -0.005 -0.002 [0.32] [0.84] [0.39] MICROLOAN - - - - -0.005 -0.006 -0.007 [0.43] [0.59] [0.76] BANKLOAN - - - - 0.010 0.009 0.009 [1.21] [1.03] [1.15] REMITDOM - - - - -0.009 -0.008 -0.008 [1.44] [1.26] [1.25] REMITABROAD - - - - -0.012 -0.013 -0.012 [2.20]** [2.50]** [2.21]** GRANT - - - - 0.069 0.091 0.076 [1.92]* [2.16]** [1.97]** SOCIALSERV - - - - -0.0003 0.001 -0.00003 [0.05] [0.14] [0.01] No. of Individuals 5,277 5,051 5,277 5,051 5,277 5,051 5,277 Observed Transitions 229 228 229 228 229 228 229 Pseudo R2 0.121 0.131 0.135 0.146 0.129 0.141 0.143 Log-Likelihood -827.9 -807.2 -815.4 -793.5 -820.6 -798.4 -807.8 Log-Lik. at 1st iteration -942.4 -929.1 -942.4 -929.1 -942.4 -929.1 -942.4 Wald x2 194.9*** 192.2*** 213.5*** 214.8*** 223.2*** 218.0*** 235.9***
* p<0.10, ** p<0.05, *** p<0.01 Marginal Effects and Robust z-statistics of the coefficients, in absolute values, are presented in parentheses. Standard Errors are clustered at the household level. For dummy variables, the difference in the predicted value of the dependent variable for discrete changes (0 1) is reported. Continuous variables are evaluated at their means.
Source: World Bank LSMS (2001-04). See Table 3 for variable definitions.

39
Table 7: Robustness Regressions [Probit regressions, dependent variable: (1/0) New self-employed/Not]
Household Heads Excluding Farmers Employed in 2001 (1) (2) (3) (1) (2) (3) (1) (2) MALE 0.010 0.014 0.009 0.023 0.031 0.022 0.033 0.030 [0.63] [0.93] [0.56] [4.91]*** [6.19]*** [4.89]*** [4.38]*** [4.06]*** FBiH -0.013 -0.018 -0.012 -0.001 -0.006 -0.003 -0.004 -0.004 [1.33] [1.83]* [1.24] [0.33] [1.19] [0.76] [0.44] [0.54] AGE 0.007 0.008 0.007 0.004 0.006 0.005 0.004 0.006 [1.83]* [2.21]** [1.88]* [3.06]*** [4.11]*** [3.65]*** [1.59] [2.27]** AGESQ/1,000 -0.090 -0.103 -0.086 -0.052 -0.069 -0.055 -0.053 -0.066 [1.99]** [2.39]** [1.97]** [2.97]*** [3.98]*** [3.39]*** [1.66]* [2.20]** URBAN 0.023 0.020 0.023 0.009 0.008 0.009 0.020 0.021 [2.14]** [1.98]** [2.25]** [1.89]* [1.56] [1.86]* [2.22]** [2.43]** MARRIED 0.030 0.035 0.033 0.014 0.016 0.012 0.021 0.018 [2.44]** [2.96]*** [2.69]*** [2.25]** [2.49]** [2.06]** [2.00]** [1.82]* LCHILDREN -0.001 -0.002 -0.014 0.002 0.002 -0.001 0.006 0.002 [0.09] [0.19] [1.26] [0.34] [0.34] [0.18] [0.58] [0.21] EDUCLOW -0.016 -0.012 -0.020 -0.012 -0.013 -0.014 -0.014 -0.020 [1.54] [1.18] [2.02]** [2.54]** [2.57]** [3.14]*** [1.53] [2.31]** DISABLED -0.030 -0.031 -0.034 -0.016 -0.016 -0.016 -0.017 -0.020 [2.56]** [2.63]*** [3.33]*** [2.73]*** [2.31]** [2.82]*** [1.21] [1.61] PASTSE 0.074 0.100 0.089 0.183 0.212 0.181 0.148 0.143 [1.83]* [2.12]** [1.99]** [3.51]*** [3.87]*** [3.67]*** [3.25]*** [3.23]*** OPTIMISM 0.127 0.114 0.117 0.050 0.049 0.064 0.064 0.089 [2.72]*** [2.42]** [2.45]** [2.19]** [2.06]** [2.81]*** [1.51] [2.17]** NOSCPTL -0.019 -0.024 -0.024 -0.021 -0.024 -0.023 -0.040 -0.039 [1.48] [2.04]** [2.07]** [5.06]*** [5.78]*** [6.06]*** [5.18]*** [5.39]*** PENSION -0.013 -0.041 -0.010 -0.011 -0.017 -0.010 -0.036 -0.015 [1.01] [3.43]*** [0.74] [1.87]* [3.69]*** [1.65]* [3.85]*** [1.25] OTHERSE 0.044 0.045 0.056 0.069 0.077 [3.16]*** [3.04]*** [3.46]*** [2.67]*** [2.90]*** LHHCONS 0.023 0.042 0.011 0.022 0.025 [1.65]* [4.38]*** [1.61] [4.93]*** [3.11]*** INFORMAL -0.093 0.063 -0.027 0.022 0.029 [1.24] [2.83]*** [0.78] [2.10]** [2.23]** UNEMPLOYED -0.055 -0.008 -0.311 -0.011 [0.48] [0.53] [1.39] [1.65]* LHHCONS*INFORMAL 0.025 0.007 [1.23] [0.73] LHHCONS*UNEMPLOYED 0.010 0.022 [0.37] [2.20]** INFORMLOAN -0.021 -0.019 -0.003 -0.0005 -0.011 -0.007 [1.95]* [1.78]* [0.52] [0.08] [1.11] [0.70] MICROLOAN 0.022 0.007 -0.005 -0.006 0.008 0.004 [0.58] [0.24] [0.45] [0.63] [0.32] [0.17] BANKLOAN -0.012 -0.010 0.007 0.008 0.003 0.005 [0.90] [0.70] [0.81] [0.97] [0.27] [0.38] REMITDOM 0.010 0.011 -0.011 -0.010 -0.009 -0.009 [0.47] [0.55] [1.82]* [1.66]* [0.62] [0.70] REMITABROAD -0.017 -0.013 -0.015 -0.014 -0.023 -0.022 [1.50] [1.06] [3.00]*** [2.73]*** [2.48]** [2.43]** GRANT 0.160 0.176 0.101 0.082 0.142 0.109 [1.91]* [2.01]** [2.23]** [2.02]** [1.72]* [1.49] SOCIALSERV 0.019 0.012 0.0003 -0.0004 -0.002 -0.005 [1.46] [0.93] [0.06] [0.09] [0.26] [0.54] No. of obs. 1,839 1,839 1,842 4,824 4,824 5,050 2,856 2,967 No. of households 2,182 2,182 2,368 1,760 1,855 Pseudo R2 0.11 0.109 0.109 0.154 0.149 0.151 0.101 0.098 Log-Likelihood -392.4 -392.9 -392.9 -748.5 -752.8 -762.4 -601.6 -612.5 Log-Likelihood at 1st iteration -440.9 -440.9 -441.1 -885.1 -885.1 -898.3 -669.1 -678.8 Wald x2 96.5*** 82.6*** 108.3*** 212.9*** 212.7*** 234.2*** 113.4*** 116.1***
Source: World Bank LSMS (2001-04). See Table 3 for variable definitions.
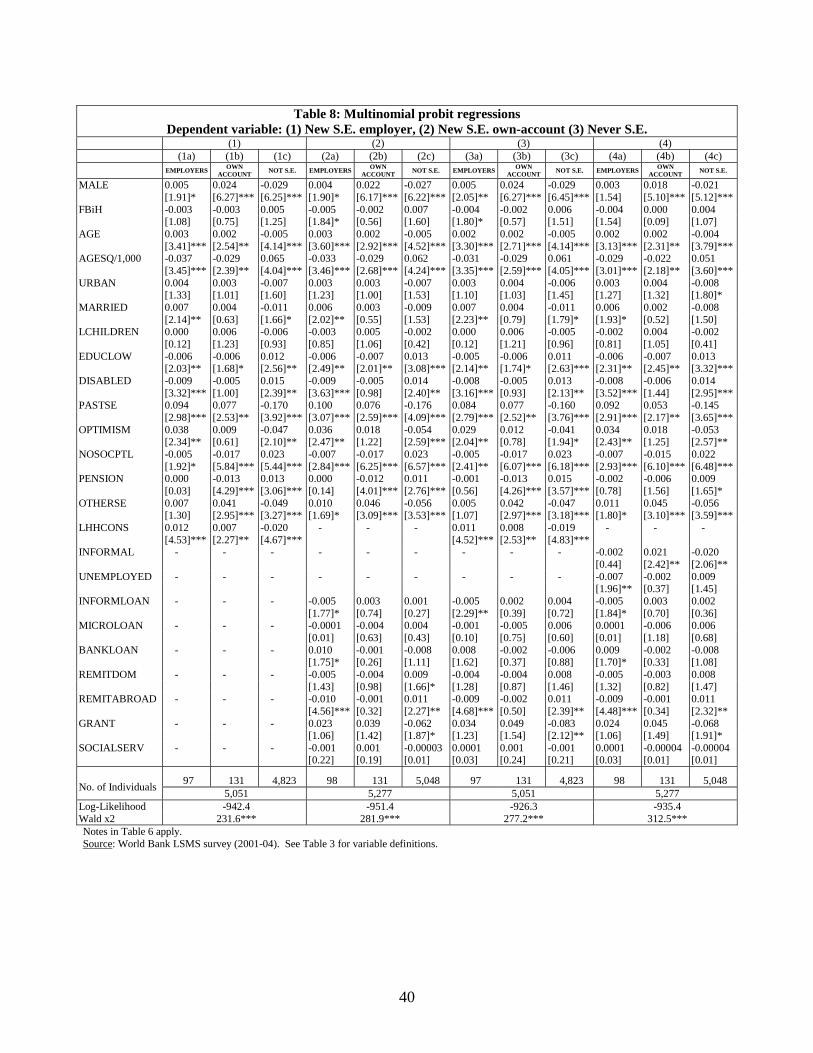
40
Table 8: Multinomial probit regressions
Dependent variable: (1) New S.E. employer, (2) New S.E. own-account (3) Never S.E. (1) (2) (3) (4) (1a) (1b) (1c) (2a) (2b) (2c) (3a) (3b) (3c) (4a) (4b) (4c) EMPLOYERS OWN
ACCOUNT NOT S.E. EMPLOYERS OWN ACCOUNT NOT S.E. EMPLOYERS OWN
ACCOUNT NOT S.E. EMPLOYERS OWN ACCOUNT NOT S.E.
MALE 0.005 0.024 -0.029 0.004 0.022 -0.027 0.005 0.024 -0.029 0.003 0.018 -0.021 [1.91]* [6.27]*** [6.25]*** [1.90]* [6.17]*** [6.22]*** [2.05]** [6.27]*** [6.45]*** [1.54] [5.10]*** [5.12]*** FBiH -0.003 -0.003 0.005 -0.005 -0.002 0.007 -0.004 -0.002 0.006 -0.004 0.000 0.004 [1.08] [0.75] [1.25] [1.84]* [0.56] [1.60] [1.80]* [0.57] [1.51] [1.54] [0.09] [1.07] AGE 0.003 0.002 -0.005 0.003 0.002 -0.005 0.002 0.002 -0.005 0.002 0.002 -0.004 [3.41]*** [2.54]** [4.14]*** [3.60]*** [2.92]*** [4.52]*** [3.30]*** [2.71]*** [4.14]*** [3.13]*** [2.31]** [3.79]*** AGESQ/1,000 -0.037 -0.029 0.065 -0.033 -0.029 0.062 -0.031 -0.029 0.061 -0.029 -0.022 0.051 [3.45]*** [2.39]** [4.04]*** [3.46]*** [2.68]*** [4.24]*** [3.35]*** [2.59]*** [4.05]*** [3.01]*** [2.18]** [3.60]*** URBAN 0.004 0.003 -0.007 0.003 0.003 -0.007 0.003 0.004 -0.006 0.003 0.004 -0.008 [1.33] [1.01] [1.60] [1.23] [1.00] [1.53] [1.10] [1.03] [1.45] [1.27] [1.32] [1.80]* MARRIED 0.007 0.004 -0.011 0.006 0.003 -0.009 0.007 0.004 -0.011 0.006 0.002 -0.008 [2.14]** [0.63] [1.66]* [2.02]** [0.55] [1.53] [2.23]** [0.79] [1.79]* [1.93]* [0.52] [1.50] LCHILDREN 0.000 0.006 -0.006 -0.003 0.005 -0.002 0.000 0.006 -0.005 -0.002 0.004 -0.002 [0.12] [1.23] [0.93] [0.85] [1.06] [0.42] [0.12] [1.21] [0.96] [0.81] [1.05] [0.41] EDUCLOW -0.006 -0.006 0.012 -0.006 -0.007 0.013 -0.005 -0.006 0.011 -0.006 -0.007 0.013 [2.03]** [1.68]* [2.56]** [2.49]** [2.01]** [3.08]*** [2.14]** [1.74]* [2.63]*** [2.31]** [2.45]** [3.32]*** DISABLED -0.009 -0.005 0.015 -0.009 -0.005 0.014 -0.008 -0.005 0.013 -0.008 -0.006 0.014 [3.32]*** [1.00] [2.39]** [3.63]*** [0.98] [2.40]** [3.16]*** [0.93] [2.13]** [3.52]*** [1.44] [2.95]*** PASTSE 0.094 0.077 -0.170 0.100 0.076 -0.176 0.084 0.077 -0.160 0.092 0.053 -0.145 [2.98]*** [2.53]** [3.92]*** [3.07]*** [2.59]*** [4.09]*** [2.79]*** [2.52]** [3.76]*** [2.91]*** [2.17]** [3.65]*** OPTIMISM 0.038 0.009 -0.047 0.036 0.018 -0.054 0.029 0.012 -0.041 0.034 0.018 -0.053 [2.34]** [0.61] [2.10]** [2.47]** [1.22] [2.59]*** [2.04]** [0.78] [1.94]* [2.43]** [1.25] [2.57]** NOSOCPTL -0.005 -0.017 0.023 -0.007 -0.017 0.023 -0.005 -0.017 0.023 -0.007 -0.015 0.022 [1.92]* [5.84]*** [5.44]*** [2.84]*** [6.25]*** [6.57]*** [2.41]** [6.07]*** [6.18]*** [2.93]*** [6.10]*** [6.48]*** PENSION 0.000 -0.013 0.013 0.000 -0.012 0.011 -0.001 -0.013 0.015 -0.002 -0.006 0.009 [0.03] [4.29]*** [3.06]*** [0.14] [4.01]*** [2.76]*** [0.56] [4.26]*** [3.57]*** [0.78] [1.56] [1.65]* OTHERSE 0.007 0.041 -0.049 0.010 0.046 -0.056 0.005 0.042 -0.047 0.011 0.045 -0.056 [1.30] [2.95]*** [3.27]*** [1.69]* [3.09]*** [3.53]*** [1.07] [2.97]*** [3.18]*** [1.80]* [3.10]*** [3.59]*** LHHCONS 0.012 0.007 -0.020 - - - 0.011 0.008 -0.019 - - - [4.53]*** [2.27]** [4.67]*** [4.52]*** [2.53]** [4.83]*** INFORMAL - - - - - - - - - -0.002 0.021 -0.020 [0.44] [2.42]** [2.06]** UNEMPLOYED - - - - - - - - - -0.007 -0.002 0.009 [1.96]** [0.37] [1.45] INFORMLOAN - - - -0.005 0.003 0.001 -0.005 0.002 0.004 -0.005 0.003 0.002 [1.77]* [0.74] [0.27] [2.29]** [0.39] [0.72] [1.84]* [0.70] [0.36] MICROLOAN - - - -0.0001 -0.004 0.004 -0.001 -0.005 0.006 0.0001 -0.006 0.006 [0.01] [0.63] [0.43] [0.10] [0.75] [0.60] [0.01] [1.18] [0.68] BANKLOAN - - - 0.010 -0.001 -0.008 0.008 -0.002 -0.006 0.009 -0.002 -0.008 [1.75]* [0.26] [1.11] [1.62] [0.37] [0.88] [1.70]* [0.33] [1.08] REMITDOM - - - -0.005 -0.004 0.009 -0.004 -0.004 0.008 -0.005 -0.003 0.008 [1.43] [0.98] [1.66]* [1.28] [0.87] [1.46] [1.32] [0.82] [1.47] REMITABROAD - - - -0.010 -0.001 0.011 -0.009 -0.002 0.011 -0.009 -0.001 0.011 [4.56]*** [0.32] [2.27]** [4.68]*** [0.50] [2.39]** [4.48]*** [0.34] [2.32]** GRANT - - - 0.023 0.039 -0.062 0.034 0.049 -0.083 0.024 0.045 -0.068 [1.06] [1.42] [1.87]* [1.23] [1.54] [2.12]** [1.06] [1.49] [1.91]* SOCIALSERV - - - -0.001 0.001 -0.00003 0.0001 0.001 -0.001 0.0001 -0.00004 -0.00004 [0.22] [0.19] [0.01] [0.03] [0.24] [0.21] [0.03] [0.01] [0.01]
97 131 4,823 98 131 5,048 97 131 4,823 98 131 5,048 No. of Individuals
5,051 5,277 5,051 5,277 Log-Likelihood -942.4 -951.4 -926.3 -935.4 Wald x2 231.6*** 281.9*** 277.2*** 312.5***
Notes in Table 6 apply. Source: World Bank LSMS survey (2001-04). See Table 3 for variable definitions.
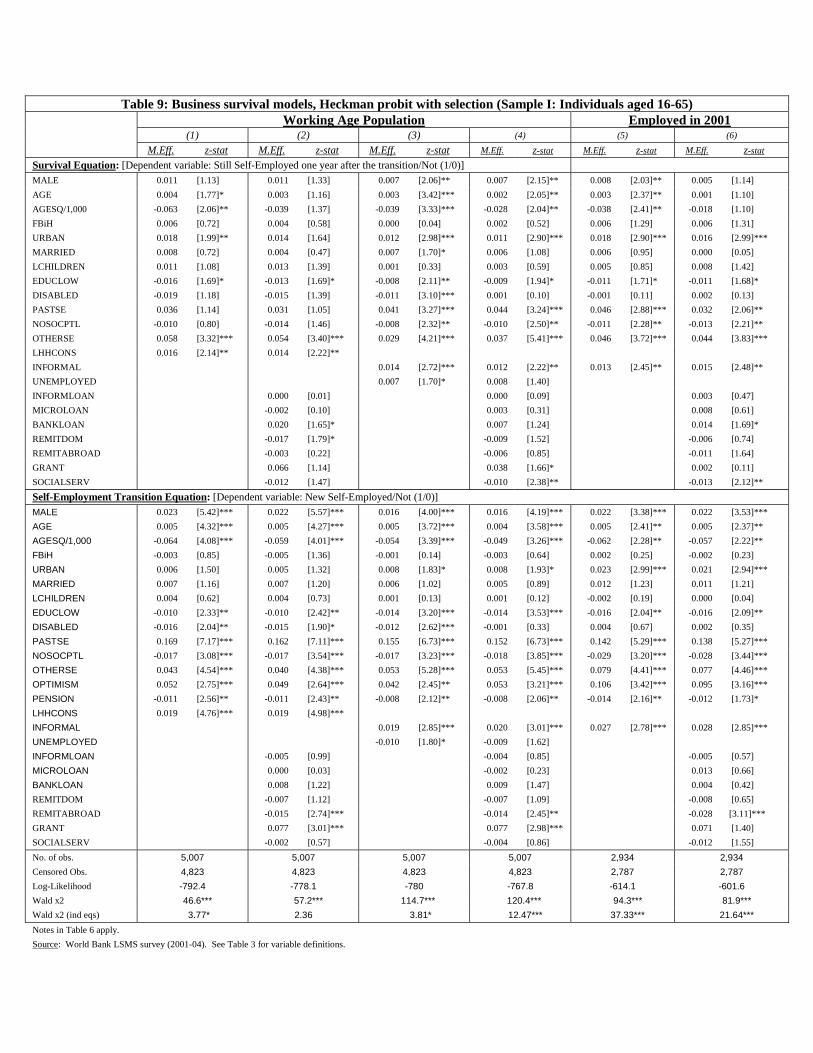
Table 9: Business survival models, Heckman probit with selection (Sample I: Individuals aged 16-65) Working Age Population Employed in 2001 (1) (2) (3) (4) (5) (6)
M.Eff. z-stat M.Eff. z-stat M.Eff. z-stat M.Eff. z-stat M.Eff. z-stat M.Eff. z-stat
Survival Equation: [Dependent variable: Still Self-Employed one year after the transition/Not (1/0)]
MALE 0.011 [1.13] 0.011 [1.33] 0.007 [2.06]** 0.007 [2.15]** 0.008 [2.03]** 0.005 [1.14]
AGE 0.004 [1.77]* 0.003 [1.16] 0.003 [3.42]*** 0.002 [2.05]** 0.003 [2.37]** 0.001 [1.10]
AGESQ/1,000 -0.063 [2.06]** -0.039 [1.37] -0.039 [3.33]*** -0.028 [2.04]** -0.038 [2.41]** -0.018 [1.10]
FBiH 0.006 [0.72] 0.004 [0.58] 0.000 [0.04] 0.002 [0.52] 0.006 [1.29] 0.006 [1.31]
URBAN 0.018 [1.99]** 0.014 [1.64] 0.012 [2.98]*** 0.011 [2.90]*** 0.018 [2.90]*** 0.016 [2.99]***
MARRIED 0.008 [0.72] 0.004 [0.47] 0.007 [1.70]* 0.006 [1.08] 0.006 [0.95] 0.000 [0.05]
LCHILDREN 0.011 [1.08] 0.013 [1.39] 0.001 [0.33] 0.003 [0.59] 0.005 [0.85] 0.008 [1.42]
EDUCLOW -0.016 [1.69]* -0.013 [1.69]* -0.008 [2.11]** -0.009 [1.94]* -0.011 [1.71]* -0.011 [1.68]*
DISABLED -0.019 [1.18] -0.015 [1.39] -0.011 [3.10]*** 0.001 [0.10] -0.001 [0.11] 0.002 [0.13]
PASTSE 0.036 [1.14] 0.031 [1.05] 0.041 [3.27]*** 0.044 [3.24]*** 0.046 [2.88]*** 0.032 [2.06]**
NOSOCPTL -0.010 [0.80] -0.014 [1.46] -0.008 [2.32]** -0.010 [2.50]** -0.011 [2.28]** -0.013 [2.21]**
OTHERSE 0.058 [3.32]*** 0.054 [3.40]*** 0.029 [4.21]*** 0.037 [5.41]*** 0.046 [3.72]*** 0.044 [3.83]***
LHHCONS 0.016 [2.14]** 0.014 [2.22]**
INFORMAL 0.014 [2.72]*** 0.012 [2.22]** 0.013 [2.45]** 0.015 [2.48]**
UNEMPLOYED 0.007 [1.70]* 0.008 [1.40]
INFORMLOAN 0.000 [0.01] 0.000 [0.09] 0.003 [0.47]
MICROLOAN -0.002 [0.10] 0.003 [0.31] 0.008 [0.61]
BANKLOAN 0.020 [1.65]* 0.007 [1.24] 0.014 [1.69]*
REMITDOM -0.017 [1.79]* -0.009 [1.52] -0.006 [0.74]
REMITABROAD -0.003 [0.22] -0.006 [0.85] -0.011 [1.64]
GRANT 0.066 [1.14] 0.038 [1.66]* 0.002 [0.11]
SOCIALSERV -0.012 [1.47] -0.010 [2.38]** -0.013 [2.12]**
Self-Employment Transition Equation: [Dependent variable: New Self-Employed/Not (1/0)] MALE 0.023 [5.42]*** 0.022 [5.57]*** 0.016 [4.00]*** 0.016 [4.19]*** 0.022 [3.38]*** 0.022 [3.53]***
AGE 0.005 [4.32]*** 0.005 [4.27]*** 0.005 [3.72]*** 0.004 [3.58]*** 0.005 [2.41]** 0.005 [2.37]**
AGESQ/1,000 -0.064 [4.08]*** -0.059 [4.01]*** -0.054 [3.39]*** -0.049 [3.26]*** -0.062 [2.28]** -0.057 [2.22]**
FBiH -0.003 [0.85] -0.005 [1.36] -0.001 [0.14] -0.003 [0.64] 0.002 [0.25] -0.002 [0.23]
URBAN 0.006 [1.50] 0.005 [1.32] 0.008 [1.83]* 0.008 [1.93]* 0.023 [2.99]*** 0.021 [2.94]***
MARRIED 0.007 [1.16] 0.007 [1.20] 0.006 [1.02] 0.005 [0.89] 0.012 [1.23] 0.011 [1.21]
LCHILDREN 0.004 [0.62] 0.004 [0.73] 0.001 [0.13] 0.001 [0.12] -0.002 [0.19] 0.000 [0.04]
EDUCLOW -0.010 [2.33]** -0.010 [2.42]** -0.014 [3.20]*** -0.014 [3.53]*** -0.016 [2.04]** -0.016 [2.09]**
DISABLED -0.016 [2.04]** -0.015 [1.90]* -0.012 [2.62]*** -0.001 [0.33] 0.004 [0.67] 0.002 [0.35]
PASTSE 0.169 [7.17]*** 0.162 [7.11]*** 0.155 [6.73]*** 0.152 [6.73]*** 0.142 [5.29]*** 0.138 [5.27]***
NOSOCPTL -0.017 [3.08]*** -0.017 [3.54]*** -0.017 [3.23]*** -0.018 [3.85]*** -0.029 [3.20]*** -0.028 [3.44]***
OTHERSE 0.043 [4.54]*** 0.040 [4.38]*** 0.053 [5.28]*** 0.053 [5.45]*** 0.079 [4.41]*** 0.077 [4.46]***
OPTIMISM 0.052 [2.75]*** 0.049 [2.64]*** 0.042 [2.45]** 0.053 [3.21]*** 0.106 [3.42]*** 0.095 [3.16]***
PENSION -0.011 [2.56]** -0.011 [2.43]** -0.008 [2.12]** -0.008 [2.06]** -0.014 [2.16]** -0.012 [1.73]*
LHHCONS 0.019 [4.76]*** 0.019 [4.98]***
INFORMAL 0.019 [2.85]*** 0.020 [3.01]*** 0.027 [2.78]*** 0.028 [2.85]***
UNEMPLOYED -0.010 [1.80]* -0.009 [1.62]
INFORMLOAN -0.005 [0.99] -0.004 [0.85] -0.005 [0.57]
MICROLOAN 0.000 [0.03] -0.002 [0.23] 0.013 [0.66]
BANKLOAN 0.008 [1.22] 0.009 [1.47] 0.004 [0.42]
REMITDOM -0.007 [1.12] -0.007 [1.09] -0.008 [0.65]
REMITABROAD -0.015 [2.74]*** -0.014 [2.45]** -0.028 [3.11]***
GRANT 0.077 [3.01]*** 0.077 [2.98]*** 0.071 [1.40]
SOCIALSERV -0.002 [0.57] -0.004 [0.86] -0.012 [1.55]
No. of obs. 5,007 5,007 5,007 5,007 2,934 2,934
Censored Obs. 4,823 4,823 4,823 4,823 2,787 2,787
Log-Likelihood -792.4 -778.1 -780 -767.8 -614.1 -601.6
Wald x2 46.6*** 57.2*** 114.7*** 120.4*** 94.3*** 81.9***
Wald x2 (ind eqs) 3.77* 2.36 3.81* 12.47*** 37.33*** 21.64***
Notes in Table 6 apply.
Source: World Bank LSMS survey (2001-04). See Table 3 for variable definitions.

42
Figure 1: Labor Force Composition (LSMS, 2001-04)
Self-Employed
Formal Sector
Informal Sector
Unemployed
Inactive
0.00%
5.00%
10.00%
15.00%
20.00%
25.00%
30.00%
35.00%
40.00%
2001 2002 2003 2004