the opinions of maine residents, landowners, …€¦ · responsive management national office mark...
TRANSCRIPT
THE OPINIONS OF MAINE RESIDENTS, LANDOWNERS, AND HUNTERS REGARDING
DEER, MOOSE, BEAR, AND TURKEY
Conducted for the Maine Department of Inland Fisheries and Wildlife
by Responsive Management
2016
THE OPINIONS OF MAINE RESIDENTS, LANDOWNERS, AND HUNTERS REGARDING
DEER, MOOSE, BEAR, AND TURKEY
2016
Responsive Management National Office Mark Damian Duda, Executive Director
Martin Jones, Senior Research Associate Tom Beppler, Research Associate
Steven J. Bissell, Ph.D., Qualitative Research Associate Amanda Center, Research Associate
Andrea Criscione, Research Associate Patrick Doherty, Research Associate
Gregory L. Hughes, P.E., Research Associate Tristan Kirkman, Research Associate
Claudia Reilly, Survey Center Manager Alison Lanier, Business Manager
130 Franklin Street Harrisonburg, VA 22801
540/432-1888 E-mail: [email protected]
www.responsivemanagement.com
Acknowledgments
Responsive Management thanks Nathan Webb and Judy Camuso of the Maine Department of
Inland Fisheries and Wildlife for their input, support, and guidance on this project.
Responsive Management also thanks the following:
Tom Abello, Sue Bickford, Jen Brophy, Barry Burgason, Mark Caron, Dave Chabot, Chris
Cloutier, Bob Cordes, Dan Cousins, Al Cowperthwaite, Randy Cross, Tom Doak, Don Dudley,
Jim Fahey, Eugenie Francine, Dave Hentosh, Gary Hilliard, Wally Jakubas, Doug Kane, Lee
Kantar, Nathan Kay, Rob Kieffer, Don Kleiner, Roger Lambert, Galen Larabee, Gerry Lavigne,
Chuck Lubelczyk, Kendall Marden, Erin Merrill, Bob Parker, Kevin Pelkey, Deb Perkins, Peter
Rand, Kyle Ravana, Phil Richter, Phil Savignano, Fred Servello, Alicyn Smart, Henning Stabins,
Kelsey Sullivan, Jen Vashon, Tom Ward, and Jim Wescott.
ii Responsive Management
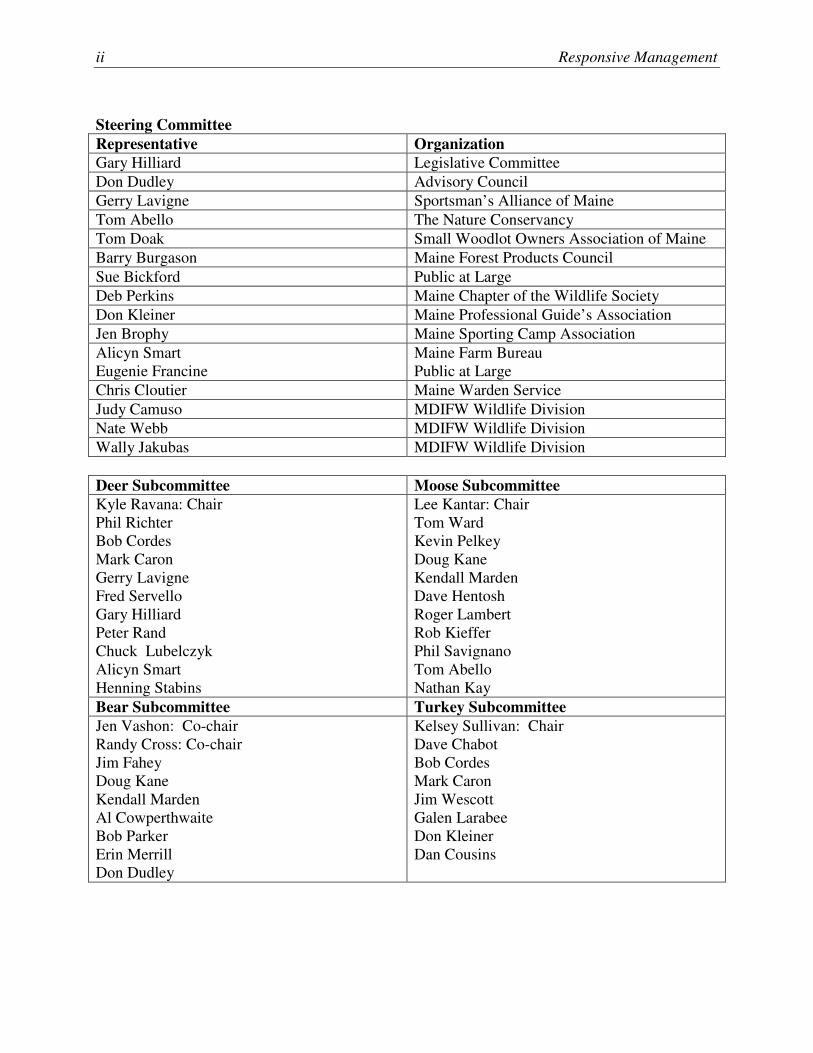
Steering Committee
Representative Organization
Gary Hilliard Legislative Committee
Don Dudley Advisory Council
Gerry Lavigne Sportsman’s Alliance of Maine
Tom Abello The Nature Conservancy
Tom Doak Small Woodlot Owners Association of Maine
Barry Burgason Maine Forest Products Council
Sue Bickford Public at Large
Deb Perkins Maine Chapter of the Wildlife Society
Don Kleiner Maine Professional Guide’s Association
Jen Brophy Maine Sporting Camp Association
Alicyn Smart
Eugenie Francine
Maine Farm Bureau
Public at Large
Chris Cloutier Maine Warden Service
Judy Camuso MDIFW Wildlife Division
Nate Webb MDIFW Wildlife Division
Wally Jakubas MDIFW Wildlife Division
Deer Subcommittee Moose Subcommittee
Kyle Ravana: Chair
Phil Richter
Bob Cordes
Mark Caron
Gerry Lavigne
Fred Servello
Gary Hilliard
Peter Rand
Chuck Lubelczyk
Alicyn Smart
Henning Stabins
Lee Kantar: Chair
Tom Ward
Kevin Pelkey
Doug Kane
Kendall Marden
Dave Hentosh
Roger Lambert
Rob Kieffer
Phil Savignano
Tom Abello
Nathan Kay
Bear Subcommittee Turkey Subcommittee
Jen Vashon: Co-chair
Randy Cross: Co-chair
Jim Fahey
Doug Kane
Kendall Marden
Al Cowperthwaite
Bob Parker
Erin Merrill
Don Dudley
Kelsey Sullivan: Chair
Dave Chabot
Bob Cordes
Mark Caron
Jim Wescott
Galen Larabee
Don Kleiner
Dan Cousins

Opinions of Residents, Landowners, and Hunters on Deer, Moose, Bear, and Turkey i
EXECUTIVE SUMMARY
INTRODUCTION AND METHODOLOGY
This study was conducted for the Maine Department of Inland Fisheries and Wildlife (hereinafter
referred to as the Department) to determine the opinions of the general population, landowners of
large tracts of land, and hunters regarding the management and hunting of deer, moose, bear, and
wild turkey. The study entailed scientific probability-based random sample surveys of the three
groups, with some questions that pertained to all three groups and some questions that were just
for one (or two) of the groups. (Note that the general population sample/survey is
interchangeably referred to as the sample/survey of residents.) Contact with respondents was
made by telephone, mail, and email.
For the survey, a multi-modal approach was selected to ensure complete coverage of the
populations. Initial contacts were made by postal mail (address-based sampling), by telephone
(random digit dialing), and through email (for hunters in the sample that contained an email
address). The survey was then administered by telephone and online.
The survey questionnaires were developed cooperatively by Responsive Management and the
Department.
The detailed sampling plans for residents, landowners, and hunters is discussed in the body of
the report, along with the extensive contact procedures. Each of the samples was probability-
based and was as representative of their populations as feasible.
Online surveys could be taken at the convenience of the respondent. Telephone surveying times
are Monday through Friday from 9:00 a.m. to 9:00 p.m., Saturday from noon to 5:00 p.m., and
Sunday from 5:00 p.m. to 9:00 p.m., local time. The survey was conducted in January and
February 2016.
The software used for telephone data collection was Questionnaire Programming Language
(QPL). The online data were downloaded into Responsive Management’s databased by the

ii Responsive Management
standard export software provided by the online surveying vendor. Responsive Management
obtained completed questionnaires from 933 residents, 304 landowners, and 956 hunters.
The analysis of data was performed using Statistical Package for the Social Sciences as well as
proprietary software developed by Responsive Management.
INTEREST IN AND KNOWLEDGE OF WILDLIFE
� Interest in wildlife in Maine is fairly high, with mean ratings of interest (on a 0 to 10 scale
where 0 is not at all interested and 10 is extremely interested) at 8.0 or above among the three
groups in the survey. Also, a majority of landowners (60%) and hunters (57%) gave their
interest in wildlife a rating of “10” (a third of the general population—36%—did so).
� Another question gauged respondents’ comfort level regarding wildlife around their homes.
Using a continuum from the most comfortable (“I enjoy seeing and having wildlife around
my home or on my property”) to the least comfortable (“I generally regard wildlife around
my home or on my property as dangerous”), a large majority of each group (70% of the
general population and 80% each of landowners and hunters) chose the highest comfort level,
and nearly all the rest chose the second most comfortable level.
� Finally in this section, the survey asked about respondents’ knowledge levels regarding the
four primary species of interest in the survey (deer, moose, bear, and turkey). The results of
all four questions are shown together. Two observations can be made:
• Hunters tend to claim to be more knowledgeable than the general population or
landowners.
• Self-rated knowledge levels are highest for deer, followed by moose, wild turkey, and
then bear, in that order. (Two graphs are shown of all groups together: one shows the
percentages who say that they know a great deal or a moderate amount; the second graph
shows the percentages who say that they know nothing at all.)

Opinions of Residents, Landowners, and Hunters on Deer, Moose, Bear, and Turkey iii
PARTICIPATION IN HUNTING
� The survey asked about hunting the four primary species of interest.
• The overwhelming majority of hunters (91%) had hunted for deer in the past 5 years.
• About a third of hunters (35%) had hunted moose in the past 15 years (note the timeframe
for moose is 15 years on this question, in part to get a larger group in follow-up questions
about moose hunting). Also, half of hunters (51%) say that they typically apply for a
moose permit in Maine.
• A third of hunters (33%) had hunted bear in Maine in the past 15 years (note that this also
uses a 15-year timeframe).
• Just under a third of hunters (30%) had hunted turkey in Maine in the past 5 years.
� When asked in which county they most often hunt, hunters most commonly said Aroostook
County, followed by Penobscot, Oxford, York, and Somerset (all with at least 8% of hunters
hunting in it most often).
� Motivations for hunting the various species were explored. For each species, hunters who
had hunted that species were given a list of possible reasons for hunting for that species, and
they were asked to choose the reason that was their most important. For each species, the list
contained the same six items: for the meat, for a trophy, to be with family and friends, for
the sport/recreation/challenge, to be close to nature, or to see a deer/moose/bear/turkey. For
the deer question, another item was added: to reduce damage to crops.
• The most important reasons given for hunting deer were for the meat (50% of deer
hunters chose this reason) or for the sport, recreation, and challenge (26%).
• As was the case with deer, the most important reasons given for hunting moose were for
the meat (58%) or for the sport, recreation, and challenge (26%).
• The most important reasons for hunting bear were for the sport, recreation, or challenge
(40%) or for the meat (36%).
• Hunters most commonly hunt turkey for the sport/recreation/challenge (42%) or for the
meat (33%).

iv Responsive Management
SATISFACTION AND DISSATISFACTION WITH HUNTING
� The survey asked about hunters’ satisfaction levels for hunting for the four primary species
of interest in the survey over the past 5 years (for deer and turkey) or over the past 15 years
(for moose and bear). All those who did not answer that they were very satisfied (and those
who answered “don’t know”) were then asked why they had not been more satisfied.
• The large majority of deer hunters were satisfied with their deer hunting: 82% were
satisfied; 15% were dissatisfied.
o Lack of harvest success is, by far, the most common reason for not being more
satisfied with deer hunting.
• The large majority of moose hunters were satisfied with their moose hunting: 91% were
satisfied; 7% were dissatisfied.
o Lack of harvest success is the most common reason for not being more satisfied with
moose hunting.
• The large majority of bear hunters were satisfied with their bear hunting: 90% were
satisfied; 7% were dissatisfied.
o As with other species, lack of harvest success is the most common reason for not
being more satisfied with bear hunting.
• The large majority of turkey hunters were satisfied with their turkey hunting: 92% were
satisfied; only 5% were dissatisfied.
o Again, lack of harvest success is the most common reason for not being more
satisfied with turkey hunting.
CONSTRAINTS TO HUNTING
� Hunters who had hunted deer in the past 5 years were asked about any things that might have
prevented them from hunting deer as much as they would have liked in the past 5 years. For
41% of these deer hunters, nothing had prevented them. Otherwise, lack of time/other
obligations was the most common reason—a reason over which agencies have little sway.
Opinions of Residents, Landowners, and Hunters on Deer, Moose, Bear, and Turkey v
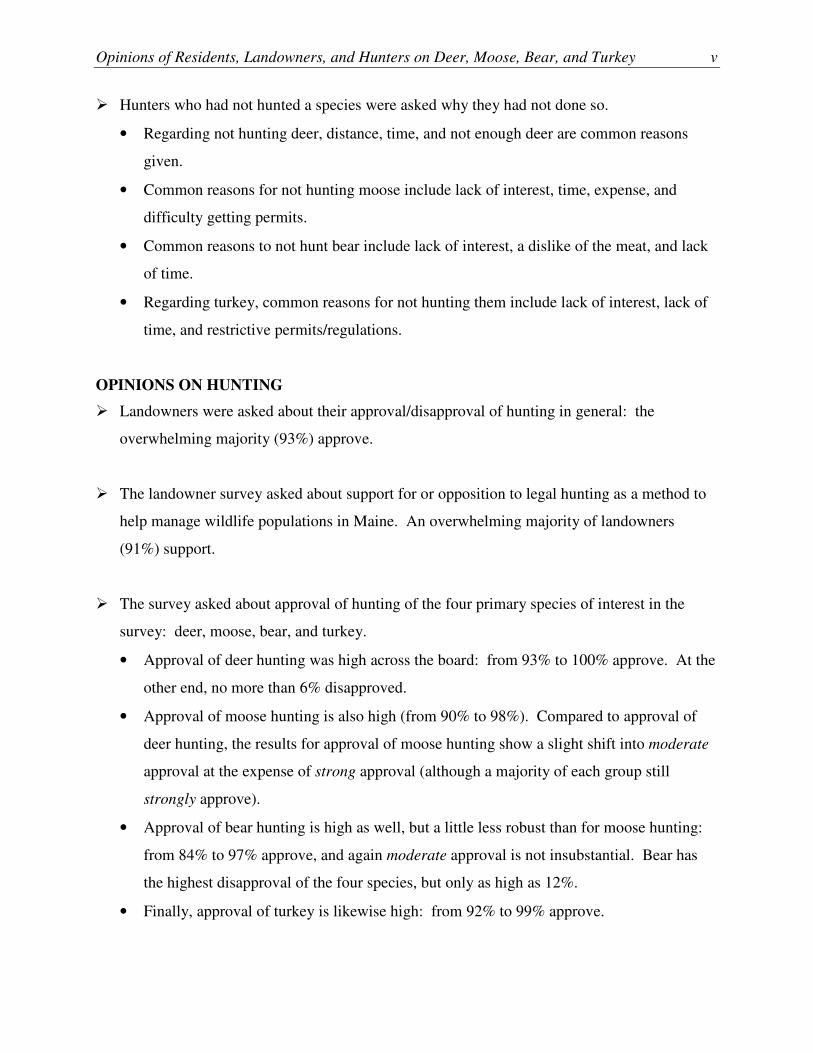
� Hunters who had not hunted a species were asked why they had not done so.
• Regarding not hunting deer, distance, time, and not enough deer are common reasons
given.
• Common reasons for not hunting moose include lack of interest, time, expense, and
difficulty getting permits.
• Common reasons to not hunt bear include lack of interest, a dislike of the meat, and lack
of time.
• Regarding turkey, common reasons for not hunting them include lack of interest, lack of
time, and restrictive permits/regulations.
OPINIONS ON HUNTING
� Landowners were asked about their approval/disapproval of hunting in general: the
overwhelming majority (93%) approve.
� The landowner survey asked about support for or opposition to legal hunting as a method to
help manage wildlife populations in Maine. An overwhelming majority of landowners
(91%) support.
� The survey asked about approval of hunting of the four primary species of interest in the
survey: deer, moose, bear, and turkey.
• Approval of deer hunting was high across the board: from 93% to 100% approve. At the
other end, no more than 6% disapproved.
• Approval of moose hunting is also high (from 90% to 98%). Compared to approval of
deer hunting, the results for approval of moose hunting show a slight shift into moderate
approval at the expense of strong approval (although a majority of each group still
strongly approve).
• Approval of bear hunting is high as well, but a little less robust than for moose hunting:
from 84% to 97% approve, and again moderate approval is not insubstantial. Bear has
the highest disapproval of the four species, but only as high as 12%.
• Finally, approval of turkey is likewise high: from 92% to 99% approve.

vi Responsive Management
� The survey explored opinions on bear hunting for various reasons, with five possible reasons
to hunt bear presented to respondents. The most support is for bear hunting as a way to
manage bear populations or bear hunting for the meat. Bear hunting to economically benefit
rural areas has middling support. At the low end, there is little support for human-centered
reasons (for a trophy—the least supported—or for recreation).
• Hunters express markedly more support than the other groups, with landowners narrowly
edging out the general population in support.
• A majority of all three groups strongly support bear hunting as a method to help manage
bear populations in Maine (59% to 83% strongly support) and for the meat (61% to 79%
strongly support). These are the only two reasons with a majority of the general
population or landowners in strong support.
HUNTING ACCESS
� Although a majority of hunters rate access to hunting lands in Maine as excellent or good
(64%), there is a substantial percentage giving a fair or poor rating (34%).
� Paralleling the results above, 34% of hunters agree that lack of access to hunting lands in
Maine has caused them to not hunt as much as they would have liked in the past 5 years. On
the other end, 61% disagree.
� Landowners were asked about allowing access for hunting on their land. Most of them do
so: 81% allow people other than household members to access their largest tract of land for
hunting. In breaking down type of access, 42% allow access by permission, and 28% allow
open access.
• A follow-up question asked for the main reasons landowners did not allow access to the
land for hunting other than family or friends. Common reasons are a disapproval of
hunting, firearm safety concerns, disrespectful behavior of hunters, property damage, and
privacy concerns.

Opinions of Residents, Landowners, and Hunters on Deer, Moose, Bear, and Turkey vii
HUNTING LICENSING AND FEES
� The majority of hunters think the current hunting license fees are about right (74%);
otherwise, 22% say that they are too much, compared to only 3% who say that they are not
high enough.
� Hunters’ disagreement exceeds their agreement that the current requirement to purchase
separate permits for some species prevents them from hunting those species as much as they
would like. While a majority (59%) disagree, a substantial percentage (35%) agree.
OPINIONS ON REGULATIONS AND SPECIFIC ASPECTS OF HUNTING
� Opinion is closely split regarding a law requiring that harvested bucks have at least 3 points
on one side: 46% of hunters would support, but 50% would oppose.
� Moose hunters and those who typically apply for a permit (even if they did not hunt moose)
were asked which month they most preferred for the moose hunting season. The majority of
these moose hunters/potential moose hunters chose October (60%), distantly followed by
September (22%) and November (12%).
• Follow-up questions asked respondents why they would most prefer having the season in
the month they chose. Those who prefer September most commonly cite the timing of
the rut/that there is greater moose activity then. Those who prefer October most
commonly say that they prefer the weather then, with the timing of the rut/greater moose
activity being the second ranked reason. Those who prefer November most commonly
say that they prefer the weather then, with the timing of the rut/more moose activity a
distant second.
� A 6-day season with fewer hunters is preferred over a 12-day season with more hunters:
among moose hunters/potential moose hunters, 58% choose the 6-day season, while 34%
choose the 12-day season.
� Moose hunters and those who typically apply for a permit were asked to choose among two
alternatives: having the Department offer more moose permits with a lower harvest rate or
offering fewer moose permits with a higher harvest rate. Although a slight majority of

viii Responsive Management
moose hunters/potential moose hunters (52%) choose fewer permits/higher harvest rate over
the alternative, there is still a substantial percentage (38%) who choose more permits/lower
harvest rate.
LAND MANAGEMENT IN GENERAL
� Just under half of landowners (48%) actively manage for wildlife on their land.
� The survey asked respondents to rate the management of each of the four primary species of
interest in the survey, the results of which are shown individually in the following sections
about deer management, moose management, bear management, and turkey management.
However, the results are first discussed here with all four species compared.
• Among the findings: hunters have a markedly better opinion regarding bear management
than do the general population or landowners. Otherwise, those three groups are similar
to each other.
� The last question in this section concerned coyote management. There is much more support
for (from 71% to 91%) than opposition to (from 6% to 20%) a coyote management program,
which may cause an increase in deer and/or wild turkey populations in local areas.
DEER MANAGEMENT
� Ratings of deer management in Maine are more positive than negative, although there are
substantial percentages giving ratings in the lower half of the scale. While from 61% to 70%
give a rating of excellent or good (the top half of the scale), from 25% to 36% give a rating of
fair or poor.
Opinions of Residents, Landowners, and Hunters on Deer, Moose, Bear, and Turkey ix
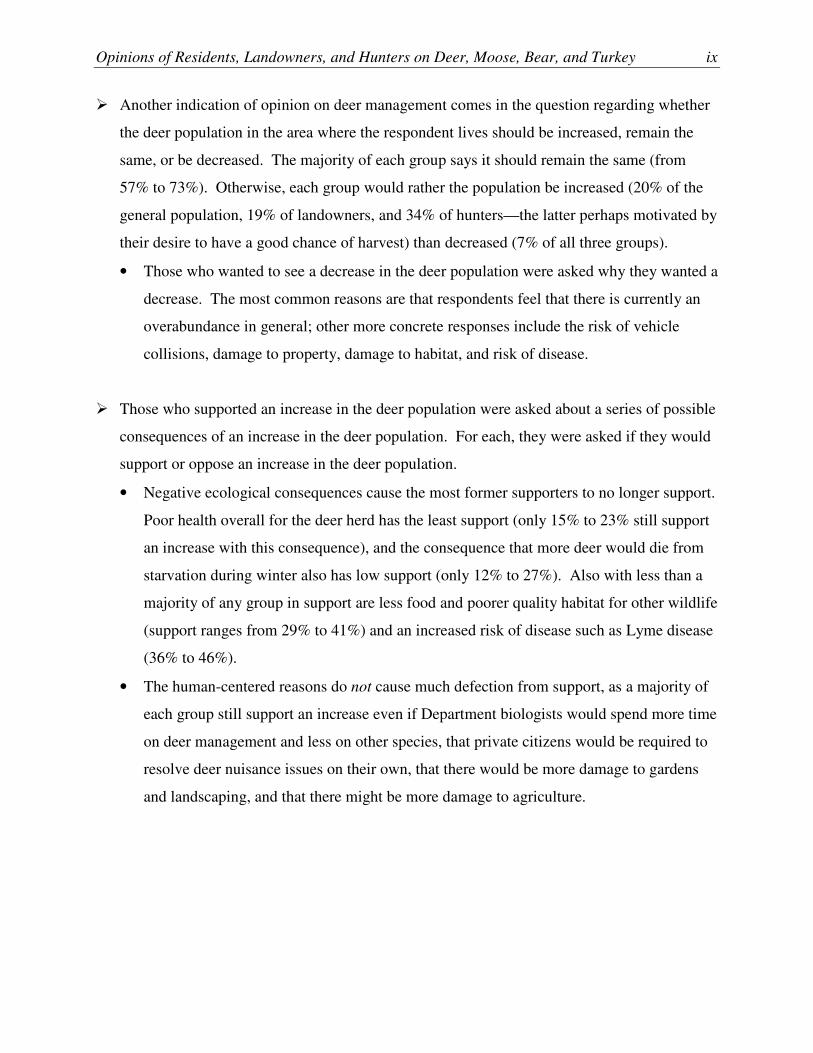
� Another indication of opinion on deer management comes in the question regarding whether
the deer population in the area where the respondent lives should be increased, remain the
same, or be decreased. The majority of each group says it should remain the same (from
57% to 73%). Otherwise, each group would rather the population be increased (20% of the
general population, 19% of landowners, and 34% of hunters—the latter perhaps motivated by
their desire to have a good chance of harvest) than decreased (7% of all three groups).
• Those who wanted to see a decrease in the deer population were asked why they wanted a
decrease. The most common reasons are that respondents feel that there is currently an
overabundance in general; other more concrete responses include the risk of vehicle
collisions, damage to property, damage to habitat, and risk of disease.
� Those who supported an increase in the deer population were asked about a series of possible
consequences of an increase in the deer population. For each, they were asked if they would
support or oppose an increase in the deer population.
• Negative ecological consequences cause the most former supporters to no longer support.
Poor health overall for the deer herd has the least support (only 15% to 23% still support
an increase with this consequence), and the consequence that more deer would die from
starvation during winter also has low support (only 12% to 27%). Also with less than a
majority of any group in support are less food and poorer quality habitat for other wildlife
(support ranges from 29% to 41%) and an increased risk of disease such as Lyme disease
(36% to 46%).
• The human-centered reasons do not cause much defection from support, as a majority of
each group still support an increase even if Department biologists would spend more time
on deer management and less on other species, that private citizens would be required to
resolve deer nuisance issues on their own, that there would be more damage to gardens
and landscaping, and that there might be more damage to agriculture.

x Responsive Management
� The survey presented to respondents a series of eight possible factors that could be
considered in the management of deer. For each factor, respondents rated it from 0 (not at all
important) to 10 (extremely important).
• The top-rated factor is the health of the typical deer in the herd (mean ratings of 8.1 or
higher)—an ecological factor. Then comes providing deer hunting opportunities (mean
of 7.6 or higher), the opportunity to see deer (6.9 or higher), and then another ecological
one—impacts on habitat (6.5 or higher).
• Damage to gardens/landscaping damage to agriculture are the lowest rated.
� Support for legal deer hunting as a method to help manage deer is high: from 92% to 98%
support, most of it strong support. Only 4% or less oppose it.
� A series of possible deer management options in areas where deer become overabundant was
presented in the survey. For each, respondents were asked whether they would support or
oppose each one. There were seven possible options presented.
• For all options except two, there are majorities in support. At the top are the creation of a
special archery season, targeted doe permits, and a controlled hunt with a limited number
of hunters (the lowest support among any group for any of these three was 72%).
• The two items with less than a majority of all three groups in support are a longer
firearms season (supported by a majority of the general population and hunters, but just
less than half of landowners) and sharpshooters (no more than 48% of any group in
support).
� A final question in this section concerned deer and moose together. First, respondents were
informed of the following: “Because moose and deer have very different habitat
requirements, it is difficult to have large numbers of moose and deer in the same area.”
Respondents were then asked to choose on a continuum from abundant moose/very few deer
to relatively few moose/moderate numbers of deer in northern Maine. Respondents favor
lower moose numbers, most commonly choosing either the lowest moose or the middle
option in the continuum; relatively few chose to have abundant moose/few deer.

Opinions of Residents, Landowners, and Hunters on Deer, Moose, Bear, and Turkey xi
MOOSE MANAGEMENT
� Large majorities of the groups (from 63% to 67%) give positive ratings of moose
management—excellent or good. On the other end, from 19% to 22% give ratings of fair or
poor. The percentages who do not know range from 11% to 18%.
� The majority or a near-majority of each group says the moose population should remain the
same (from 49% to 61%). Otherwise, each group has a higher percentage who would rather
see the population be increased (15% of the general population, 15% of landowners, and 23%
of hunters) than decreased (from 4% to 6% of the groups).
� Those who supported an increase in the moose population were asked about a series of
possible consequences of an increase in the moose population (some consequences that have
counterparts in the deer section of the survey, and some unique to moose). For each of four
consequences, respondents were asked if they would support or oppose an increase in the
moose population.
• The possible negative ecological consequences cause the most defection from support.
No more than 26% of any of the groups would still support an increase if it meant poor
health overall for the moose herd, and just under half (from 45% to 46%) would still
support if it meant that forest regeneration would be negatively impacted.
• An increase in agricultural damage caused little defection: from 58% to 71% would
support an increase if this was the consequence. An increased likelihood of vehicle
collisions also does not cause mass defection, as a majority of each group would still
support the increase with this consequence—from 50% (a majority because it is rounded
from 50.4) to 62%.
� The survey presented to respondents a series of possible factors that could be considered in
the management of moose. For each factor, respondents rated it from 0 (not at all important)
to 10 (extremely important).
• The top-rated factor is the health of the typical moose in the herd (mean ratings ranging
from 8.0 to 8.4)—an ecological factor. Next in the ranking by mean is providing moose

xii Responsive Management
hunting opportunities (mean of 7.2 to 7.7) and the opportunity to see moose (7.1 to 7.4).
Risk of vehicle collisions is next at 6.9 to 7.2.
• After that, the importance markedly drops for impacts on habitat (6.1 to 6.6) and damage
to agriculture (4.2 to 5.1).
� Support for legal moose hunting as a method to help manage moose is high: from 91% to
97% support, most of it strong support. Only 7% or less oppose it.
� One question asked about “adjusting the hunting harvest of female moose” to improve the
health of the moose population, but included the caveat, “even if it meant fewer moose in
Maine.” A majority support this adjustment (68% of the general population, 66% of
landowners, and 80% of hunters). Nonetheless, opposition ranges from 21% among the
general population down to 10% among hunters.
� There is much more support for (ranging from 54% to 68%) than opposition to (9% to 13%)
the current moose hunting season in southern Maine.
BEAR MANAGEMENT
� Ratings of bear management in Maine are more positive than negative, with substantial
percentages, nonetheless, giving ratings in the lower half of the scale. Majorities of 57% to
72% give a rating of excellent or good (the top half of the scale), while 13% to 28% give a
rating of fair or poor. The percentages who do not know range from 15% to 22%.
� The majority of each group says the bear population should remain the same (56% of the
general population, but 67% and 71% among the other two groups). Otherwise, there is a
fairly even split among the remainder (from 4% to 8% want an increase, and from 4% to 8%
want a decrease).

Opinions of Residents, Landowners, and Hunters on Deer, Moose, Bear, and Turkey xiii
� Those who supported an increase in the bear population were asked about a series of possible
consequences of an increase in the bear population. For each consequence, respondents were
asked if they would support or oppose an increase in the bear population.
• The ecological consequence caused the most defection among those who had supported
an increase: only from 15% to 28% of the groups would still support an increase if it
meant poor health overall for the bear population.
• Less than a majority of the general population and landowners would still support an
increase if it meant an increased risk to public safety.
• Human-centered reasons do not cause this defection from support, as a majority of all
groups would still support an increase if it meant that additional/special bear hunting
seasons would need to be opened to manage bear, if bear-proof trash containers were
necessitated, if more bears would be killed because of conflicts with humans, and if
government staff would spend more time on bears.
� The survey presented to respondents a series of possible factors that could be considered in
the management of bear. For each factor, respondents rated it from 0 (not at all important) to
10 (extremely important).
• The top-rated factor is the health of the typical bear (mean ratings ranging from 7.6 to
8.4)—an ecological factor. This was followed by providing moose hunting opportunities
(mean of 7.0 to 8.1)—these top two being markedly above the others. Risks to public
safety and risk to pets/livestock are in the middle, along with impacts on other wildlife.
• After that, the importance markedly drops for damage to agriculture, risks of vehicle
collisions, and damage to gardens.
� Support for legal bear hunting as a method to help manage bear is high: from 87% to 95%
support, most of it strong support. Only 9% or less oppose it.

xiv Responsive Management
� Each group is split on opinion regarding allowing the bear population to expand into central
and southern Maine. While a majority of each group support doing so, there is substantial
opposition. Among the general population, 54% support, but 30% oppose. Among
landowners, 54% support, while 29% oppose. Finally, among hunters, 63% support, but
25% oppose.
TURKEY MANAGEMENT
� Ratings of turkey management in Maine are more positive than negative, with 49% to 58%
giving a positive rating of excellent or good, but 28% to 34% giving a rating of turkey
management as only fair or poor. The percentages who do not know range from 14%
to 18%.
� The majority of each group says the turkey population should remain the same (from 52% to
62%). However, the remainder more often want a decrease than an increase: from 27% to
31% want to see a decrease, compared to just 6% to 13% who want an increase. This is the
only species of the four in the survey for which decrease is markedly more than increase.
� A series of follow-up questions was asked of those who said that they wanted to see an
increase in turkey populations, asking if they would support or oppose an increase based on
seven possible consequences of an increase.
• In the face of ecological consequences (more turkey dying from starvation in winter; poor
health overall for the turkey population), most of those who formerly supported an
increase no longer support it.
• The human-centered consequences do not cause this defection from support (that private
citizens would be required to resolve problems on their own; that there would be an
increase in damage to gardens, landscaping, or agriculture), nor does the consequence of
an increase in predators (being seen, perhaps, as a positive ecological consequence or at
least a “natural” ecological consequence).

Opinions of Residents, Landowners, and Hunters on Deer, Moose, Bear, and Turkey xv
� The survey presented to respondents a series of possible factors that could be considered in
the management of turkey. For each factor, respondents rated it from 0 (not at all important)
to 10 (extremely important).
• Turkey hunting is valued in Maine, as the top-rated factor is providing turkey hunting
opportunities (mean of 7.4 to 8.3), closely followed by the health of the typical turkey in
the population (mean of 7.4 to 7.9). There is a drop in importance placed on the next
items: the opportunity to see turkey (6.1 to 6.9) and damage to agriculture (5.8 to 6.5).
• Lowest in importance are damage to gardens (5.2 to 5.7) and the risk of vehicle collisions
with turkey (4.6 to 5.0).
� Support for legal turkey hunting as a method to help manage turkey is high: from 92% to
98% support, most of it strong support. Only 5% or less oppose it.
� A series of possible turkey management options in the event that turkey became
overabundant in an area was presented in the survey, and respondents were asked whether
they would support or oppose each one. For each of all four options, an overwhelming
majority would support it (no less than 77% among any group for any option), and in fact a
majority of the general population would strongly support it, ranging from 54% to 61%.
Strong support is a little higher among landowners, ranging from 55% up to 71%, and then
markedly higher among hunters, ranging from 78% to 82%. For all groups, the least favored
is extending the hunting season later into the fall or winter; the three other options are about
even with one another and just slightly higher than that last-placed option. Opposition is no
more than 17% among any group for any of the four options.
• The three items with the most support are: implementing a controlled hunt in areas
experiencing damage from turkeys, allowing landowners to apply for a permit to remove
turkeys that are causing problems on their land, and increasing the bag limit for turkey in
areas experiencing damage.

xvi Responsive Management
PROBLEMS WITH WILDLIFE
� While most landowners in the survey (61%) did not experience any problems with wildlife
on their largest tract of land in the past 2 years, the obverse of this means that a fairly large
percentage (39%) reported having problems.
• The most common culprits were coyotes, deer, and turkeys.

Opinions of Residents, Landowners, and Hunters on Deer, Moose, Bear, and Turkey xvii
TABLE OF CONTENTS
Introduction and Methodology ........................................................................................................1
Use of Multi-Modal Survey .....................................................................................................1
Questionnaire Design ..............................................................................................................1
Survey Samples and Contact Procedures ................................................................................2
The Sample of Residents .................................................................................................2
Contact of Residents by Telephone.................................................................................5
Contact of Residents by Mail ..........................................................................................5
The Samples of Landowners and Hunters ......................................................................7
Initial Contact of Landowners and Hunters ....................................................................7
Follow-Up Contacts and Reminders to Landowners and Hunters ..................................8
Survey Facilities ......................................................................................................................8
Interviewing Dates and Times .................................................................................................9
Survey Data Collection and Quality Control ...........................................................................9
Data Analysis .........................................................................................................................10
Sampling Error ......................................................................................................................13
Additional Information About the Presentation of Results in the Report .............................13
Interest in and Knowledge of Wildlife...........................................................................................15
Participation in Hunting .................................................................................................................31
Satisfaction and Dissatisfaction With Hunting ..............................................................................54
Constraints to Hunting ...................................................................................................................67
Opinions on Hunting ......................................................................................................................77
Hunting Access ..............................................................................................................................93
Hunting Licensing and Fees.........................................................................................................103
Opinions on Regulations and Specific Aspects of Hunting .........................................................106
Land Management in General ......................................................................................................119
Deer Management ........................................................................................................................139
Moose Management .....................................................................................................................171
Bear Management ........................................................................................................................195
Turkey Management ....................................................................................................................216
Problems With Wildlife ...............................................................................................................243
Demographic Data .......................................................................................................................246
Appendix A: All Regional Results .............................................................................................256
About Responsive Management ..................................................................................................542


Opinions of Residents, Landowners, and Hunters on Deer, Moose, Bear, and Turkey 1
INTRODUCTION AND METHODOLOGY
This study was conducted for the Maine Department of Inland Fisheries and Wildlife (hereinafter
referred to as the Department) to determine the opinions of the general population, landowners of
large tracts of land, and hunters regarding the management and hunting of deer, moose, bear, and
wild turkey. The study entailed scientific probability-based random sample surveys of the three
groups, with some questions that pertained to all three groups and some questions that were just
for one (or two) of the groups. (Note that the general population sample/survey is
interchangeably referred to as the sample/survey of residents.) Contact with respondents was
made by telephone, mail, and email. Specific aspects of the research methodology are discussed
below.
USE OF MULTI-MODAL SURVEY
For the survey, a multi-modal approach was selected to ensure complete coverage of the
populations. Initial contacts were made by postal mail (address-based sampling), by telephone
(random digit dialing), and through email (for hunters in the sample that contained an email
address). The survey was then administered by telephone and online. Note that the online
portion was a closed survey, meaning that it could be completed only by those invited to
participate from the original survey; people could not simply surf across the survey and take it.
QUESTIONNAIRE DESIGN
The survey questionnaires were developed cooperatively by Responsive Management and the
Department, based on the research team’s familiarity with hunting and wildlife management.
The surveys were coded in Questionnaire Programming Language (QPL) for approval from the
Department and for use in administering the surveys by telephone. Online versions of the
surveys were coded in HyperText Markup Language (HTML) based on the QPL versions. Both
the telephone and online versions produced data that could be exported directly into Responsive
Management’s data analyses programs.
The survey instruments were programmed to automatically skip questions that did not apply and
to substitute phrases in the survey based upon previous responses, as necessary, for the logic and
2 Responsive Management
flow of the interviews. Responsive Management conducted pre-tests of the questionnaires to
ensure proper wording, flow, and logic in the surveys.
SURVEY SAMPLES AND CONTACT PROCEDURES
As stated previously, three samples were surveyed: residents, landowners, and hunters. The
information below details each of the samples.
The Sample of Residents
The general population resident sample was obtained from Marketing Systems Group, a firm
specializing in scientific survey samples representative of the general population. To ensure the
widest possible coverage of the Maine general population, the overall sample included both
telephone and mail components.
Although current estimates are that 98.7% of Maine households use a landline telephone, a
wireless telephone, or both (see the December 2013 report from the National Centers for Disease
Control and Prevention, Wireless Substitution: State-Level Estimates From the National Health
Interview Survey), the survey also included an address-based system (ABS) component. ABS
entails the sampling of physical addresses from a near-universal database. In theory, every
parcel of land in the United States with a residence and every lot in urban areas has an address
associated with it, providing complete coverage. The resulting sampling design ensured that
every Maine resident had an equal chance of being contacted for the survey.
For the telephone component of the general population resident survey, a dual-frame sample was
used that combined a sample of listed landline telephone numbers with a sample of wireless
telephone numbers in their proper proportions (in other words, the proportions of landline and
wireless numbers in the sample matched the actual proportions of the two telephone types as
they exist in Maine households). The resulting coverage rate is estimated to be 97.7% of U.S.
households—only 2.3% have no telephone at all. This dual-frame approach was first developed
by researchers at the University of Virginia’s Center for Survey Research.

Opinions of Residents, Landowners, and Hunters on Deer, Moose, Bear, and Turkey 3
For the mail component of the general population resident survey, letters were mailed to a
random sample of residents using the ABS approach. The letters included a link to an online
version of the questionnaire as well as a toll-free number for respondents to contact Responsive
Management. Note that the survey was available only to those who were selected in the sample.
Appropriately designed surveys with an Internet component require that a closed group of
potential respondents be invited to participate in the survey. Internet surveys are an excellent
survey method to use when the sample consists of a closed population of respondents, as was the
case in this study (i.e., a person surfing the Internet could not stumble upon the survey and
take it).
The overall sample of Maine general population residents was stratified based on three regions,
with a predetermined number of surveys completed in each region (note that the geographic area
of the respondent’s residence was also verified in the survey itself). The regions are shown in
the map on the following page.

4 Responsive Management
Map of Regions
Note: Map produced in color; may not be legible in black and white prints.

Opinions of Residents, Landowners, and Hunters on Deer, Moose, Bear, and Turkey 5
Contact of Residents by Telephone
A five-callback design was used to maintain the representativeness of the telephone sample, to
avoid bias toward people easy to reach by telephone, and to provide an equal opportunity for all
residents in the telephone sample to participate. When a respondent could not be reached on the
first call, subsequent calls were placed on different days of the week and at different times of the
day.
Contact of Residents by Mail
Letters to residents in the mail sample were sent using Department letterhead and envelopes.
Each letter included a unique identification code assigned to the respondent allowing him/her to
be tracked so that he/she would not be contacted after already completing the survey, as well as
to ensure that only residents who were supposed to be contacted were taking the survey. The
tracking number was also used to help those who called or emailed for assistance.
The letters provided a link to the survey, a toll-free number, and an email address. The toll-free
number and email address allowed respondents to contact Responsive Management to take the
survey by telephone, schedule another time for the interview, or request a link for the online
survey. The template for the letter is shown on the following page.

6 Responsive Management
Letter for Mail Contact

Opinions of Residents, Landowners, and Hunters on Deer, Moose, Bear, and Turkey 7
The Samples of Landowners and Hunters
The landowner sample was derived from tax records and included all types of landowners. A
randomly selected probability-based sample was drawn from the database.
The sample of Maine hunters was obtained from license databases provided by the Department.
The hunter database included license holders from the previous 3 years and included lifetime
license holders and nonresident license holders as well as resident license holders. As was done
for the landowner survey, a randomly selected probability-based sample of hunters was drawn
from the database, with the mode of contact(s) determined by the information available for each
hunter (i.e., a telephone number, a mailing address, and/or an email address).
Contacts were made by telephone, mail (via letters similar to those used for the resident mail
sample), and email. Note that only after the probability-based random samples were selected
from the database were attempts made at contacting those who had been selected. The overall
landowner and hunter samples were designed to ensure a 95% confidence level and low
sampling errors.
Initial Contact of Landowners and Hunters
For each of the samples, letters were sent to those in the selected random sample who only had a
postal address and no telephone number or email address. All those in each sample with an
email address were initially sent an email with the link to the online survey. Those with
telephone numbers but not email addresses were initially contacted by telephone.
Letters and emails both provided a link to the survey. The letters also provided a unique
identification number to access the survey (emails did not require the unique identification
number as the number was embedded in the unique link that each email recipient received). All
landowners and hunters could be accounted for so that no landowner or hunter could complete
the survey more than once, nor could those who had not been selected in the sample take the
survey. A toll-free number was made available to letter recipients and an email address was
made available to email recipients for those who needed assistance. The toll-free number and the
email address allowed landowners and hunters to contact Responsive Management to take the

8 Responsive Management
survey by telephone, schedule another time for the interview, or request a link for the online
survey.
As with the letters sent to general population residents, letters and emails to landowners and
hunters explained the purpose of the study, included a link to the online survey, and provided a
deadline for completion.
Follow-Up Contacts and Reminders to Landowners and Hunters
Responsive Management carefully tracked participation in the survey through the identification
numbers. Approximately 1 to 3 weeks after sending the first contacts, Responsive Management
began making follow-up contact with those who had not yet responded. Multiple follow-up
contacts were made to encourage participation and obtain completed interviews using the most
convenient method for respondents. Responsive Management continued with a total of two to
five follow-up contacts. The reminders again provided a link to the online survey and a toll-free
contact number.
SURVEY FACILITIES
A central polling site at the Responsive Management office allowed for rigorous quality control
over the telephone interviews and the online data collection. Responsive Management maintains
its own in-house telephone interviewing and data gathering facilities. These facilities are staffed
by interviewers and data managers with experience conducting computer-assisted telephone
interviews and online surveys on the subjects of outdoor recreation and natural resources.
To ensure the integrity of the telephone survey data portion of the study, Responsive
Management has interviewers who have been trained according to the standards established by
the Council of American Survey Research Organizations. Methods of instruction included
lecture and role-playing. The Survey Center Managers and other professional staff conducted a
project briefing with the interviewers prior to the administration of these surveys. Interviewers
were instructed on type of study, study goals and objectives, handling of survey questions,
interview length, termination points and qualifiers for participation, interviewer instructions

Opinions of Residents, Landowners, and Hunters on Deer, Moose, Bear, and Turkey 9
within the survey questionnaires, reading of the survey questions, skip patterns, and probing and
clarifying techniques necessary for specific questions on the survey questionnaires.
INTERVIEWING DATES AND TIMES
Online surveys could be taken at the convenience of the respondent. Telephone surveying times
are Monday through Friday from 9:00 a.m. to 9:00 p.m., Saturday from noon to 5:00 p.m., and
Sunday from 5:00 p.m. to 9:00 p.m., local time. For the telephone portion, a five-callback design
was used to maintain the representativeness of the sample, to avoid bias toward people easy to
reach by telephone, and to provide an equal opportunity for all to participate. When a respondent
could not be reached on the first call, subsequent calls were placed on different days of the week
and at different times of the day. The survey was conducted in January and February 2016.
SURVEY DATA COLLECTION AND QUALITY CONTROL
The software used for telephone data collection was Questionnaire Programming Language
(QPL). For the telephone interviews, the survey data were entered into the computer as each
interview was being conducted, eliminating manual data entry after the completion of the survey
and the concomitant data entry errors that may occur with manual data entry. The survey
questionnaire was programmed so that QPL branched, coded, and substituted phrases in the
survey based on previous responses to ensure the integrity and consistency of the data collection.
The online data were downloaded into Responsive Management’s databased by the standard
export software provided by the online surveying vendor.
The Survey Center Managers and statisticians monitored the data collection, including
monitoring of the actual telephone interviews without the interviewers’ knowledge, to evaluate
the performance of each interviewer and ensure the integrity of the data. The survey
questionnaire itself contains error checkers and computation statements to ensure quality and
consistent data. After the surveys, both the telephone and the online versions, were obtained, the
Survey Center Managers and/or statisticians checked each completed survey to ensure clarity and
completeness. Responsive Management obtained completed questionnaires from 933 residents,
304 landowners, and 956 hunters.

10 Responsive Management
DATA ANALYSIS
The analysis of data was performed using Statistical Package for the Social Sciences as well as
proprietary software developed by Responsive Management.
Regional crosstabulations were run on nearly all questions. For the general population survey,
the region was determined by where the respondent lived. For the landowner survey, some
regional crosstabulations were run by where the largest tract of land was located, and others were
run by where the landowner lived, depending on the question and which crosstabulation made
more sense. While some questions were directly tied to their largest tract of land, the survey also
asked about wildlife populations where the respondent lives. (Note that the landowner regional
crosstabulations, whether by residence or location of the largest tract, will be close to each other
because a high percentage of landowners—91% overall and from 89% to 92% in the three
regions—live on their largest tract of land. Furthermore, among those who do not, many live in
the same region as their biggest tract. See the graphs that follow.) Finally, for the hunter survey,
some regional crosstabulations were based on where the hunter lives, and others were based on
the region in which he/she most often hunted.
91
9
0 20 40 60 80 100
Yes
No
Percent (n=304)
Is your primary place of residence on [your largest]
tract of land? (Landowners)

Opinions of Residents, Landowners, and Hunters on Deer, Moose, Bear, and Turkey 11
89
11
92
8
91
9
0 20 40 60 80 100
Yes
No
Percent
Is your primary place of residence on that tract of land? (Landowners)
Lives in the North/EastRegion (n=102)
Lives in the Central Region(n=112)
Lives in the South Region(n=90)

12 Responsive Management
100
0
0
3
96
1
1
2
98
0 20 40 60 80 100
Largest tract is in theNorth/East Region
Largest tract is in theCentral Region
Largest tract is in theSouth Region
Percent
Region of largest tract of land. (Landowners)
Lives in the North/EastRegion (n=102)
Lives in the Central Region(n=112)
Lives in the South Region(n=90)

Opinions of Residents, Landowners, and Hunters on Deer, Moose, Bear, and Turkey 13
All of the regional results are included in the report in Appendix A. To not overwhelm the
reader, however, only regional results that have marked differences among regions are shown
and discussed in the body of the report.
SAMPLING ERROR
Throughout this report, findings of the telephone survey are reported at a 95% confidence
interval. The sample sizes and the estimated sampling errors they would produce are shown in
the tabulation below, as well as the formula used to calculate them.
Sample Type Sample Size Sampling Error
Residents 933 4.07
Landowners 304 6.81
Hunters 956 3.26
Sampling Error Equation
( )
( )96.11
25.25.
−
−
=p
s
p
N
N
N
B
Derived from formula: p. 206 in Dillman, D. A. 2000. Mail and Internet Surveys. John Wiley & Sons, NY.
Note: This is a simplified version of the formula that calculates the maximum sampling error using a 50:50
split (the most conservative calculation because a 50:50 split would give maximum variation).
ADDITIONAL INFORMATION ABOUT THE PRESENTATION OF RESULTS IN THE REPORT
In examining the results, it is important to be aware that the questionnaire included several types
of questions:
• Open-ended questions are those in which no answer set is read to the respondents; rather,
they can respond with anything that comes to mind from the question.
• Closed-ended questions have an answer set from which to choose.
• Single or multiple response questions: Some questions allow only a single response,
while other questions allow respondents to give more than one response or choose all that
apply. Those that allow more than a single response are indicated on the graphs with the
label, “Multiple Responses Allowed.”
Where: B = maximum sampling error (as decimal)
NP = population size (i.e., total number who could be surveyed)
NS = sample size (i.e., total number of respondents surveyed)

14 Responsive Management
• Scaled questions: Many closed-ended questions (but not all) are in a scale, such as
excellent-good-fair-poor.
• Series questions: Many questions are part of a series, and the results are primarily
intended to be examined relative to the other questions in that series (although results of
the questions individually can also be valuable). Typically, results of all questions in a
series are shown together.
Most graphs show results rounded to the nearest integer; however, all data are stored in decimal
format, and all calculations are performed on unrounded numbers. For this reason, some results
may not sum to exactly 100% because of this rounding on the graphs. Additionally, rounding
may cause apparent discrepancies of 1 percentage point between the graphs and the reported
results of combined responses (e.g., when “strongly support” and “moderately support” are
summed to determine the total percentage in support).
Note that some references in the crosstabulations are made to three groups. The term “groups”
in this context refers to the three samples: residents, landowners, and hunters.
As explained previously, all regional results are included in Appendix A, but only regional
results for which there are marked differences among the regions are shown and discussed in the
body of the report.
Opinions of Residents, Landowners, and Hunters on Deer, Moose, Bear, and Turkey 15
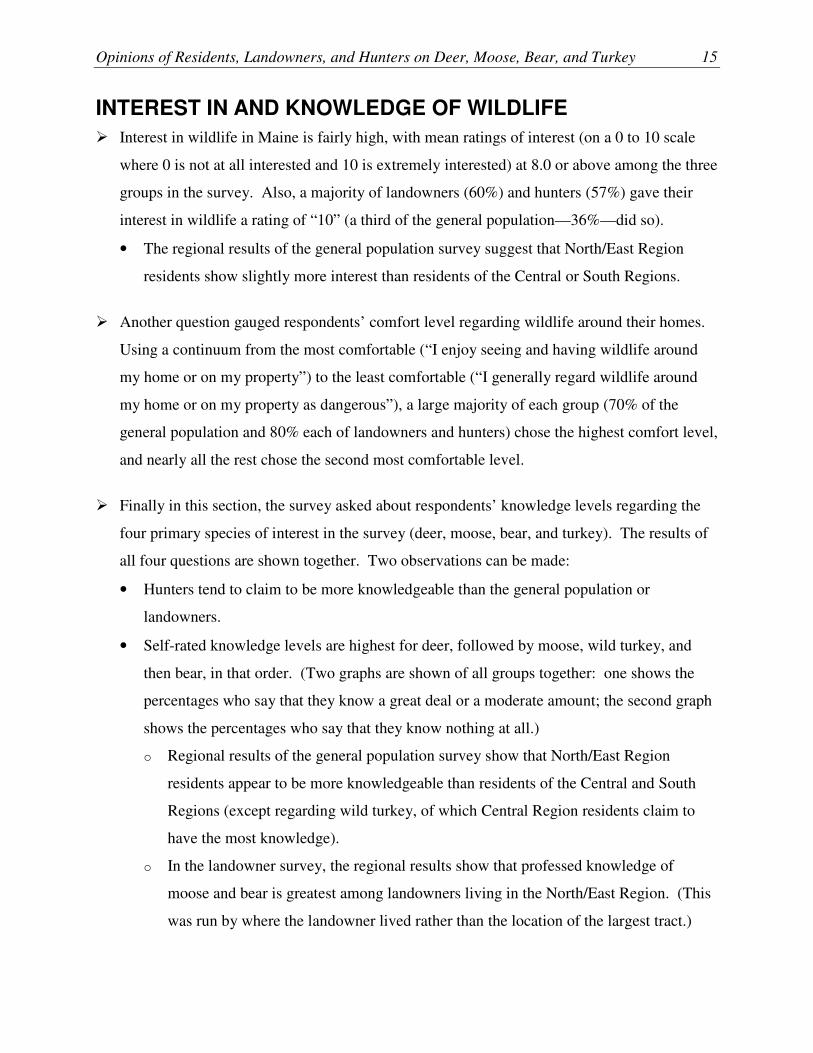
INTEREST IN AND KNOWLEDGE OF WILDLIFE
� Interest in wildlife in Maine is fairly high, with mean ratings of interest (on a 0 to 10 scale
where 0 is not at all interested and 10 is extremely interested) at 8.0 or above among the three
groups in the survey. Also, a majority of landowners (60%) and hunters (57%) gave their
interest in wildlife a rating of “10” (a third of the general population—36%—did so).
• The regional results of the general population survey suggest that North/East Region
residents show slightly more interest than residents of the Central or South Regions.
� Another question gauged respondents’ comfort level regarding wildlife around their homes.
Using a continuum from the most comfortable (“I enjoy seeing and having wildlife around
my home or on my property”) to the least comfortable (“I generally regard wildlife around
my home or on my property as dangerous”), a large majority of each group (70% of the
general population and 80% each of landowners and hunters) chose the highest comfort level,
and nearly all the rest chose the second most comfortable level.
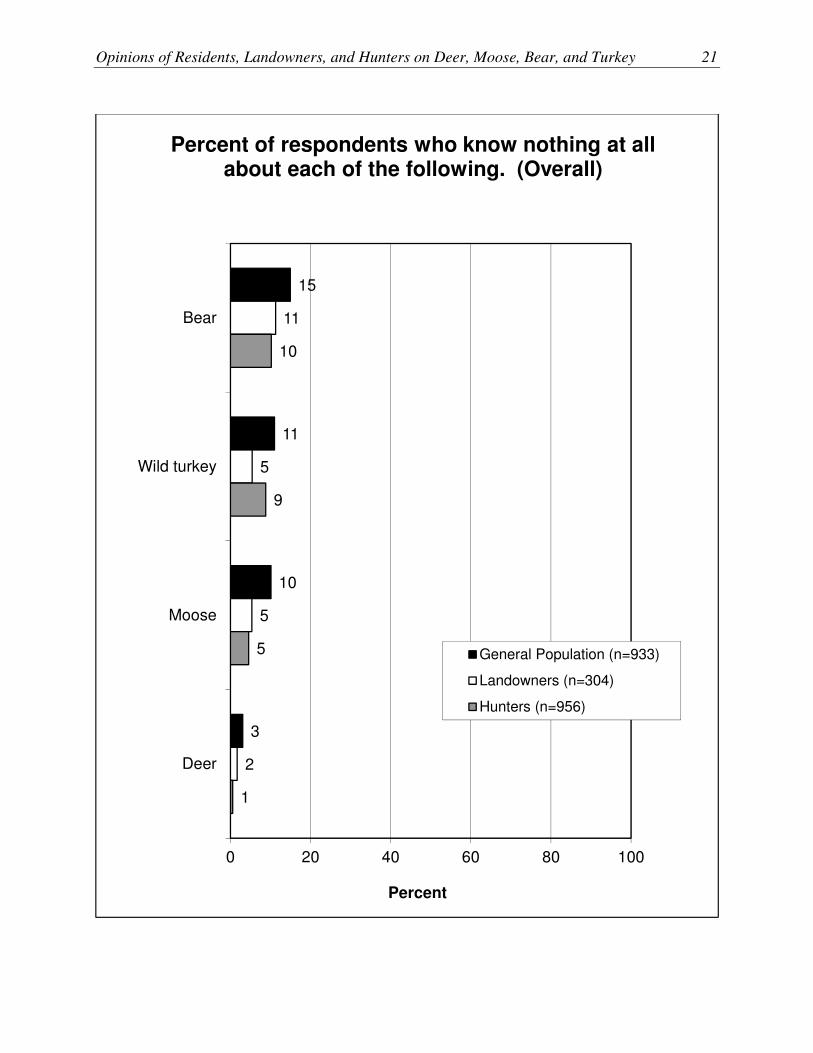
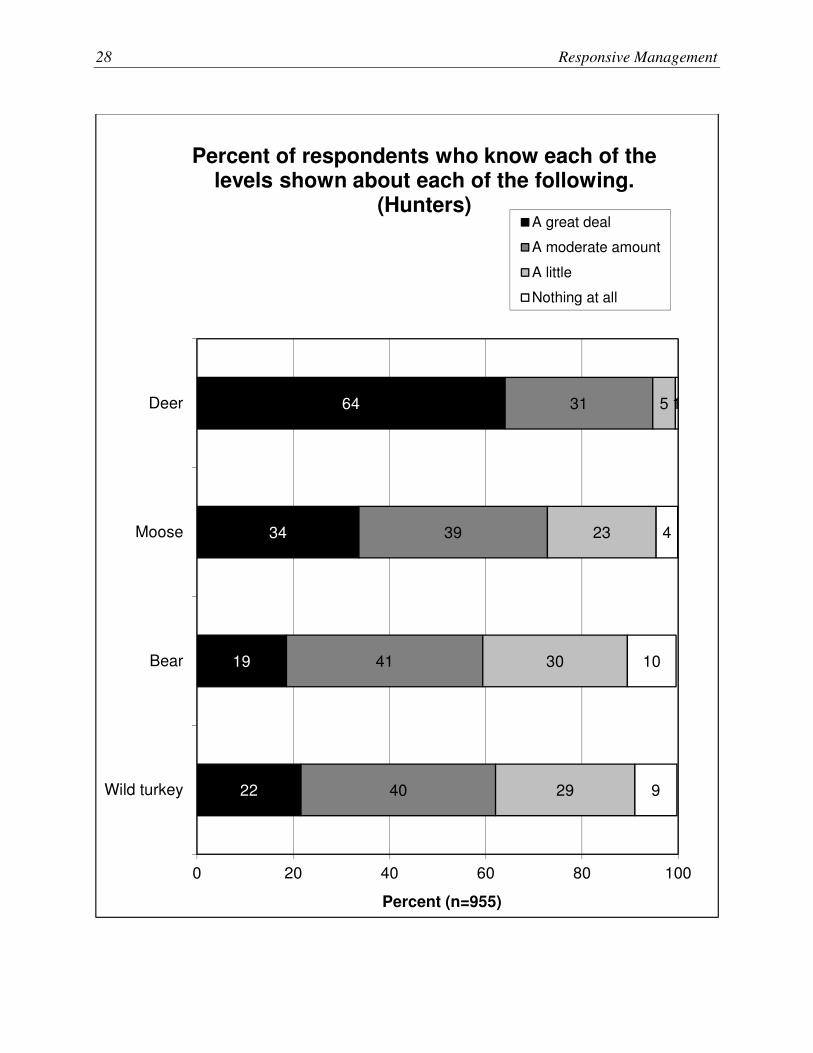
� Finally in this section, the survey asked about respondents’ knowledge levels regarding the
four primary species of interest in the survey (deer, moose, bear, and turkey). The results of
all four questions are shown together. Two observations can be made:
• Hunters tend to claim to be more knowledgeable than the general population or
landowners.
• Self-rated knowledge levels are highest for deer, followed by moose, wild turkey, and
then bear, in that order. (Two graphs are shown of all groups together: one shows the
percentages who say that they know a great deal or a moderate amount; the second graph
shows the percentages who say that they know nothing at all.)
o Regional results of the general population survey show that North/East Region
residents appear to be more knowledgeable than residents of the Central and South
Regions (except regarding wild turkey, of which Central Region residents claim to
have the most knowledge).
o In the landowner survey, the regional results show that professed knowledge of
moose and bear is greatest among landowners living in the North/East Region. (This
was run by where the landowner lived rather than the location of the largest tract.)

16 Responsive Management
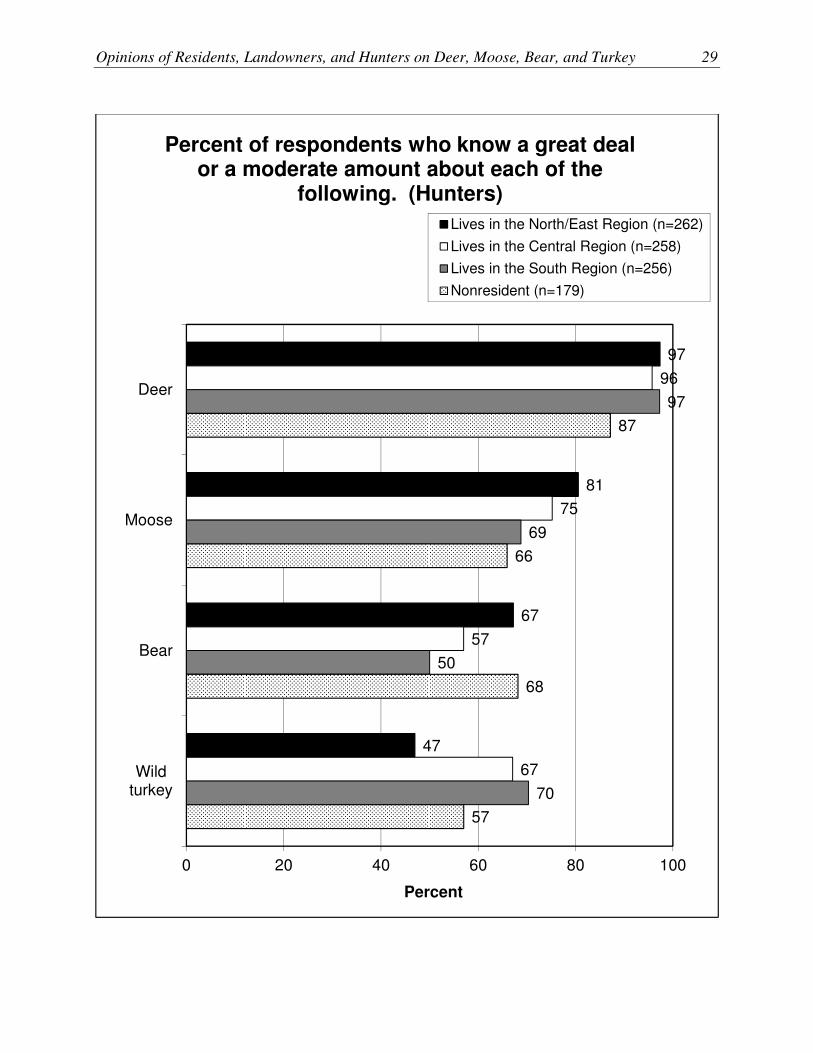
o Among hunters, regional results show that North/East Region hunters (based on
where they live) claim more knowledge than hunters from other regions regarding
moose and bear, but they claim the least amount of knowledge about wild turkey.
(Regarding deer, the regions are about the same.)

Opinions of Residents, Landowners, and Hunters on Deer, Moose, Bear, and Turkey 17
36
11
23
9
6
9
2
1
1
0
2
0
60
6
15
7
4
6
0
0
0
0
1
1
57
12
19
7
2
2
1
0
0
0
0
0
0 20 40 60 80 100
10
9
8
7
6
5
4
3
2
1
0
Don't know
Percent
How interested are you in wildlife in Maine, on a scale of 0 to 10, where 0 is not at all interested
and 10 is extremely interested? (Overall)
General Population (n=933)
Landowners (n=304)
Hunters (n=956)
General Population mean: 8.0Landowners mean: 8.8Hunters mean: 9.0

18 Responsive Management
44
12
19
9
4
6
2
0
1
0
1
36
9
27
8
6
9
2
0
1
0
2
33
11
21
10
8
11
2
1
1
0
1
0 20 40 60 80 100
10
9
8
7
6
5
4
3
2
1
0
Percent
How interested are you in wildlife in Maine, on a scale of 0 to 10, where 0 is not at all interested
and 10 is extremely interested? (General Population)
Lives in the North/EastRegion (n=301)
Lives in the Central Region(n=331)
Lives in the South Region(n=301)
North/East mean: 8.3Central mean: 8.0South mean: 7.9

Opinions of Residents, Landowners, and Hunters on Deer, Moose, Bear, and Turkey 19
70
21
2
1
6
80
18
1
0
1
80
15
1
0
4
0 20 40 60 80 100
I enjoy seeing and having wildlifearound my home or on my property
I enjoy seeing a few animals aroundmy home or on my property but worry
about the problems they cause
I generally regard wildlife around myhome or on my property as a
nuisance
I generally regard wildlife around myhome or on my property as
dangerous
I have no particular feeling aboutwildlife around my home or on my
property
Percent
Generally, which of the following best describes your feelings about wildlife around your home
or on your property? (Overall)
General Population (n=933)
Landowners (n=304)
Hunters (n=956)

20 Responsive Management
75
59
55
44
88
64
64
50
95
73
62
59
0 20 40 60 80 100
Deer
Moose
Wild turkey
Bear
Percent
Percent of respondents who know a great deal or a moderate amount about each of the
following. (Overall)
General Population (n=933)
Landowners (n=304)
Hunters (n=956)
Opinions of Residents, Landowners, and Hunters on Deer, Moose, Bear, and Turkey 21
15
11
10
3
11
5
5
2
10
9
5
1
0 20 40 60 80 100
Bear
Wild turkey
Moose
Deer
Percent
Percent of respondents who know nothing at all about each of the following. (Overall)
General Population (n=933)
Landowners (n=304)
Hunters (n=956)

22 Responsive Management
34
21
10
19
41
38
34
36
21
31
41
34
3
10
15
11
0 20 40 60 80 100
Deer
Moose
Bear
Wild turkey
Percent (n=933)
Percent of respondents who know each of the levels shown about each of the following.
(General Population)
A great deal
A moderate amount
A little
Nothing at all

Opinions of Residents, Landowners, and Hunters on Deer, Moose, Bear, and Turkey 23
83
71
45
54
80
63
58
48
69
51
56
37
0 20 40 60 80 100
Deer
Moose
Wild turkey
Bear
Percent
Percent of respondents who know a great deal or a moderate amount about each of the
following. (General Population)
Lives in the North/East Region (n=301)
Lives in the Central Region (n=331)
Lives in the South Region (n=301)

24 Responsive Management
8
15
5
1
11
12
9
3
21
9
13
4
0 20 40 60 80 100
Bear
Wild turkey
Moose
Deer
Percent
Percent of respondents who know nothing at all about each of the following. (General
Population)
Lives in the North/East Region (n=301)
Lives in the Central Region (n=331)
Lives in the South Region (n=301)

Opinions of Residents, Landowners, and Hunters on Deer, Moose, Bear, and Turkey 25
37
20
11
23
51
43
39
41
10
31
39
30
2
5
11
5
0 20 40 60 80 100
Deer
Moose
Bear
Wild turkey
Percent (n=304)
Percent of respondents who know each of the levels shown about each of the following.
(Landowners)
A great deal
A moderate amount
A little
Nothing at all

26 Responsive Management
85
54
69
62
91
67
68
49
83
68
47
37
0 20 40 60 80 100
Deer
Wild turkey
Moose
Bear
Percent
Percent of respondents who know a great deal or a moderate amount about each of the
following. (Landowners)
Lives in the North/EastRegion (n=102)
Lives in the CentralRegion (n=112)
Lives in the SouthRegion (n=90)

Opinions of Residents, Landowners, and Hunters on Deer, Moose, Bear, and Turkey 27
4
14
1
1
11
3
7
3
22
1
7
0
0 20 40 60 80 100
Bear
Wild turkey
Moose
Deer
Percent
Percent of respondents who know nothing at all about each of the following. (Landowners)
Lives in the North/East Region (n=102)
Lives in the Central Region (n=112)
Lives in the South Region (n=90)
28 Responsive Management
64
34
19
22
31
39
41
40
5
23
30
29
1
4
10
9
0 20 40 60 80 100
Deer
Moose
Bear
Wild turkey
Percent (n=955)
Percent of respondents who know each of the levels shown about each of the following.
(Hunters)A great deal
A moderate amount
A little
Nothing at all
Opinions of Residents, Landowners, and Hunters on Deer, Moose, Bear, and Turkey 29
97
81
67
47
96
75
57
67
97
69
50
70
87
66
68
57
0 20 40 60 80 100
Deer
Moose
Bear
Wildturkey
Percent
Percent of respondents who know a great deal or a moderate amount about each of the
following. (Hunters)
Lives in the North/East Region (n=262)
Lives in the Central Region (n=258)
Lives in the South Region (n=256)
Nonresident (n=179)

30 Responsive Management
0
3
6
11
0
3
9
5
0
4
13
7
2
9
12
16
0 20 40 60 80 100
Deer
Moose
Bear
Wildturkey
Percent
Percent of respondents who know nothing at all about each of the following. (Hunters)
Lives in the North/East Region (n=262)
Lives in the Central Region (n=258)
Lives in the South Region (n=256)
Nonresident (n=179)
Opinions of Residents, Landowners, and Hunters on Deer, Moose, Bear, and Turkey 31
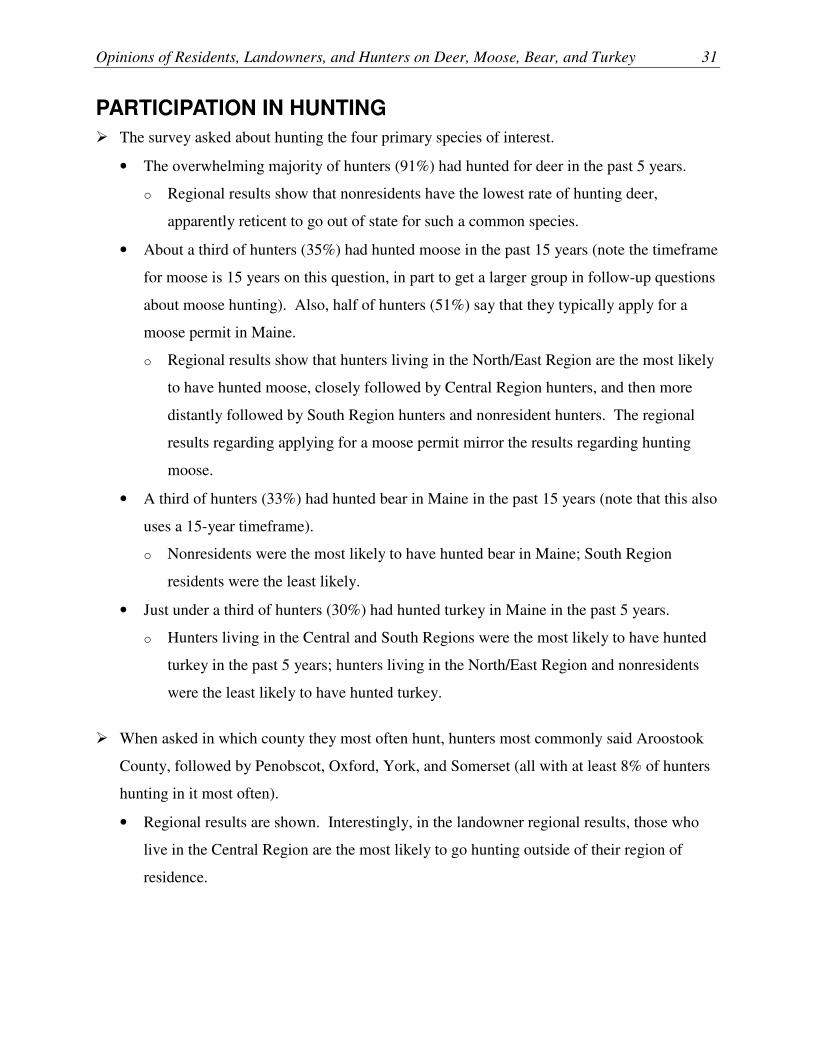
PARTICIPATION IN HUNTING
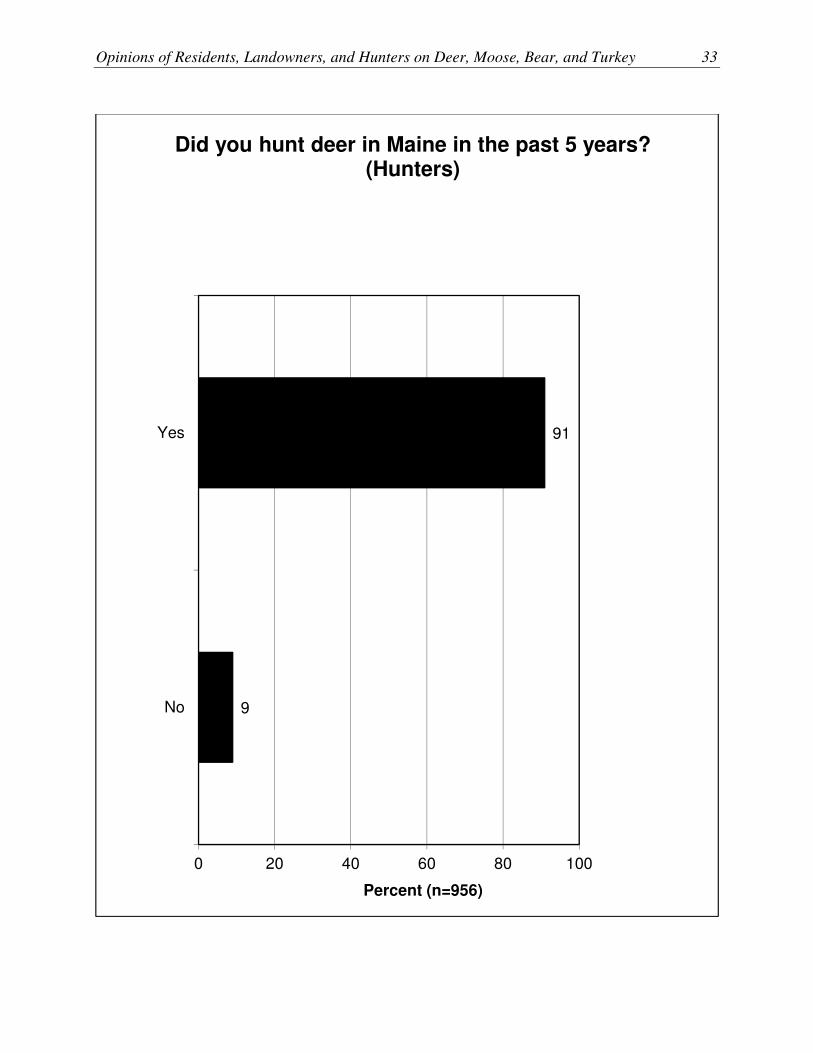
� The survey asked about hunting the four primary species of interest.
• The overwhelming majority of hunters (91%) had hunted for deer in the past 5 years.
o Regional results show that nonresidents have the lowest rate of hunting deer,
apparently reticent to go out of state for such a common species.
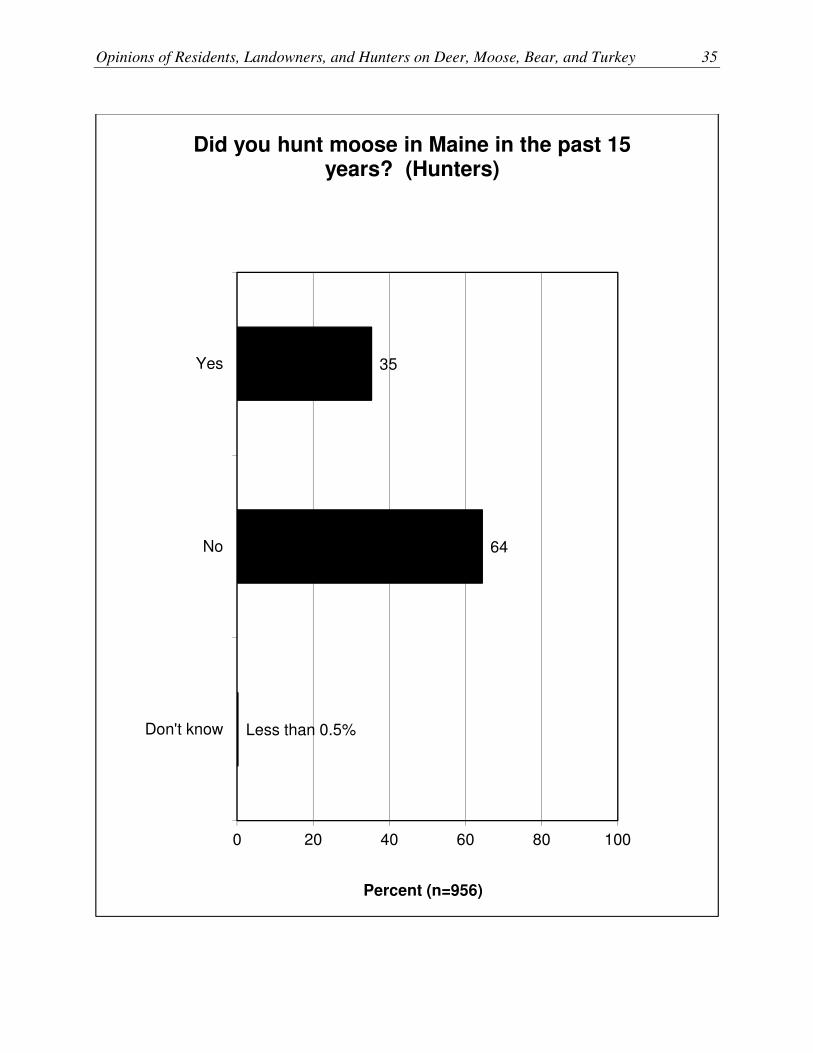
• About a third of hunters (35%) had hunted moose in the past 15 years (note the timeframe
for moose is 15 years on this question, in part to get a larger group in follow-up questions
about moose hunting). Also, half of hunters (51%) say that they typically apply for a
moose permit in Maine.
o Regional results show that hunters living in the North/East Region are the most likely
to have hunted moose, closely followed by Central Region hunters, and then more
distantly followed by South Region hunters and nonresident hunters. The regional
results regarding applying for a moose permit mirror the results regarding hunting
moose.
• A third of hunters (33%) had hunted bear in Maine in the past 15 years (note that this also
uses a 15-year timeframe).
o Nonresidents were the most likely to have hunted bear in Maine; South Region
residents were the least likely.
• Just under a third of hunters (30%) had hunted turkey in Maine in the past 5 years.
o Hunters living in the Central and South Regions were the most likely to have hunted
turkey in the past 5 years; hunters living in the North/East Region and nonresidents
were the least likely to have hunted turkey.
� When asked in which county they most often hunt, hunters most commonly said Aroostook
County, followed by Penobscot, Oxford, York, and Somerset (all with at least 8% of hunters
hunting in it most often).
• Regional results are shown. Interestingly, in the landowner regional results, those who
live in the Central Region are the most likely to go hunting outside of their region of
residence.

32 Responsive Management
� Motivations for hunting the various species were explored. For each species, hunters who
had hunted that species were given a list of possible reasons for hunting for that species, and
they were asked to choose the reason that was their most important. For each species, the list
contained the same six items: for the meat, for a trophy, to be with family and friends, for
the sport/recreation/challenge, to be close to nature, or to see a deer/moose/bear/turkey. For
the deer question, another item was added: to reduce damage to crops.
• The most important reasons given for hunting deer were for the meat (50% of deer
hunters chose this reason) or for the sport, recreation, and challenge (26%).
o “For the meat” as the primary reason for hunting deer was strongest among hunters
who hunted most often in the South Region.
• As was the case with deer, the most important reasons given for hunting moose were for
the meat (58%) or for the sport, recreation, and challenge (26%).
o The differences among regions were slight.
• The most important reasons for hunting bear were for the sport, recreation, or challenge
(40%) or for the meat (36%).
o Those who most often hunt in the North/East Region are the most likely to hunt bear
for the sport/recreation/challenge.
• Hunters most commonly hunt turkey for the sport/recreation/challenge (42%) or for the
meat (33%).
o For the sport/recreation/challenge is more commonly given as a reason by hunters
who most often hunt in the Central Region, relative to those who most often hunt in
the other regions.
Opinions of Residents, Landowners, and Hunters on Deer, Moose, Bear, and Turkey 33
91
9
0 20 40 60 80 100
Yes
No
Percent (n=956)
Did you hunt deer in Maine in the past 5 years? (Hunters)

34 Responsive Management
95
5
98
2
95
5
68
32
0 20 40 60 80 100
Yes
No
Percent
Did you hunt deer in Maine in the past 5 years? (Hunters)
Lives in the North/EastRegion (n=262)
Lives in the Central Region(n=258)
Lives in the South Region(n=256)
Nonresident (n=180)
Opinions of Residents, Landowners, and Hunters on Deer, Moose, Bear, and Turkey 35
35
64
Less than 0.5%
0 20 40 60 80 100
Yes
No
Don't know
Percent (n=956)
Did you hunt moose in Maine in the past 15 years? (Hunters)
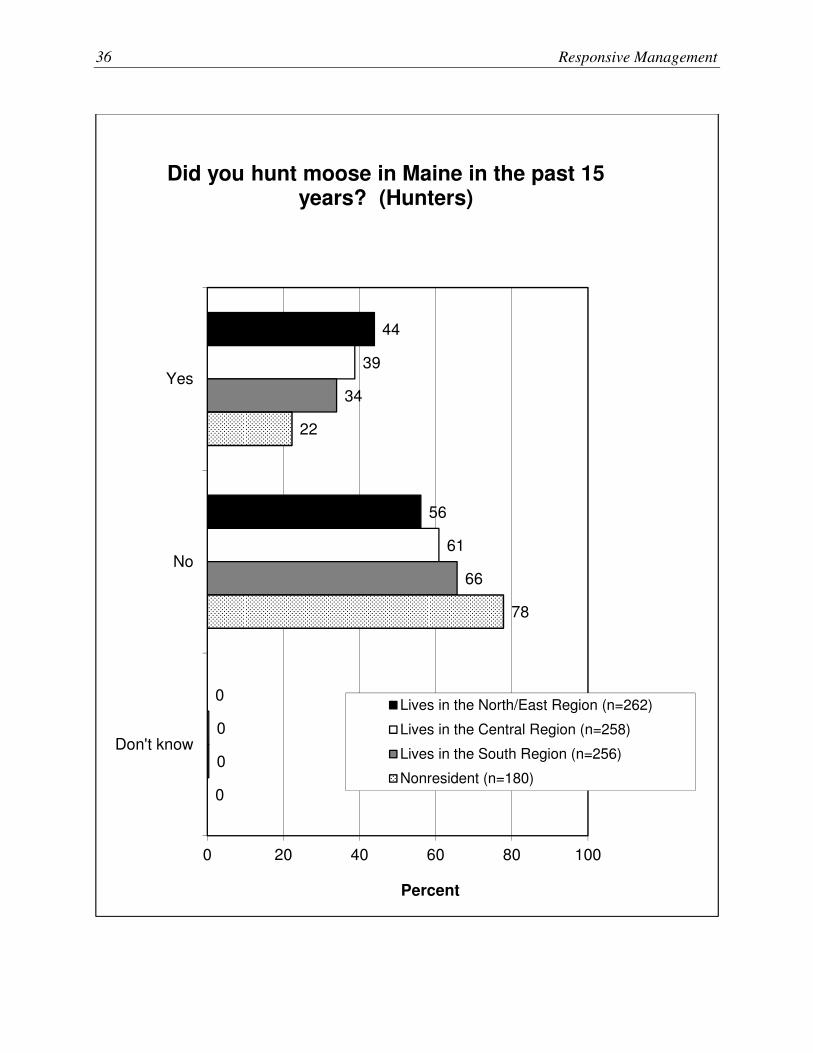
36 Responsive Management
44
56
0
39
61
0
34
66
0
22
78
0
0 20 40 60 80 100
Yes
No
Don't know
Percent
Did you hunt moose in Maine in the past 15 years? (Hunters)
Lives in the North/East Region (n=262)
Lives in the Central Region (n=258)
Lives in the South Region (n=256)
Nonresident (n=180)

Opinions of Residents, Landowners, and Hunters on Deer, Moose, Bear, and Turkey 37
51
49
1
0 20 40 60 80 100
Yes
No
Don't know
Percent (n=956)
Do you typically apply for a moose permit in Maine? (Hunters)

38 Responsive Management
63
37
0
52
48
1
49
50
0
40
59
1
0 20 40 60 80 100
Yes
No
Don't know
Percent
Do you typically apply for a moose permit in Maine? (Hunters)
Lives in the North/EastRegion (n=262)
Lives in the Central Region(n=258)
Lives in the South Region(n=256)
Nonresident (n=180)

Opinions of Residents, Landowners, and Hunters on Deer, Moose, Bear, and Turkey 39
33
67
0 20 40 60 80 100
Yes
No
Percent (n=956)
Did you hunt bear in Maine in the past 15 years? (Hunters)

40 Responsive Management
36
64
0
33
67
0
22
77
1
42
58
0
0 20 40 60 80 100
Yes
No
Don't know
Percent
Did you hunt bear in Maine in the past 15 years? (Hunters)
Lives in the North/EastRegion (n=262)
Lives in the Central Region(n=258)
Lives in the South Region(n=256)
Nonresident (n=180)

Opinions of Residents, Landowners, and Hunters on Deer, Moose, Bear, and Turkey 41
30
70
1
0 20 40 60 80 100
Yes
No
Don't know
Percent (n=956)
Did you hunt turkey in Maine in the past 5 years? (Hunters)

42 Responsive Management
22
76
2
40
60
0
38
63
0
9
91
0
0 20 40 60 80 100
Yes
No
Don't know
Percent
Did you hunt turkey in Maine in the past 5 years? (Hunters)
Lives in the North/East Region (n=262)
Lives in the Central Region (n=258)
Lives in the South Region (n=256)
Nonresident (n=180)

Opinions of Residents, Landowners, and Hunters on Deer, Moose, Bear, and Turkey 43
14
10
9
9
8
7
7
6
5
5
5
4
4
3
2
2
1
0 20 40 60 80 100
Aroostook
Penobscot
Oxford
York
Somerset
Cumberland
Kennebec
Piscataquis
Washington
Androscoggin
Waldo
Hancock
Franklin
Lincoln
Sagadahoc
Knox
Don't know
Percent (n=956)
In which county do you hunt most often? (Asked of those who have participated in
recreational hunting in Maine in the past 2 years.) (Hunters)

44 Responsive Management
38
13
0
0
2
0
0
11
18
0
1
15
0
0
0
0
0
2
16
17
0
14
0
17
4
1
10
9
2
6
0
0
0
0
3
0
3
28
4
26
1
2
1
2
1
1
2
10
10
6
0
27
8
10
8
9
4
3
8
5
2
4
2
5
2
0
1
3
0 20 40 60 80 100
Aroostook
Penobscot
Oxford
York
Somerset
Cumberland
Kennebec
Piscataquis
Washington
Androscoggin
Waldo
Hancock
Franklin
Lincoln
Sagadahoc
Knox
Don't know
Percent
In which county do you hunt most often? (Asked of those who have participated in
recreational hunting in Maine in the past 2 years.) (Hunters)
Lives in the North/EastRegion (n=262)
Lives in the Central Region(n=258)
Lives in the South Region(n=256)
Nonresident (n=180)

Opinions of Residents, Landowners, and Hunters on Deer, Moose, Bear, and Turkey 45
96
0
0
4
13
78
5
4
6
1
92
0
0 20 40 60 80 100
Most often huntsin the North/East
Region
Most often huntsin the Central
Region
Most often huntsin the South
Region
Region mostoften hunts in is
unknown
Percent
Region hunted in as determined by answered county, township, and landmark (Landowners)
Lives in the North/East Region (n=38)
Lives in the Central Region (n=36)
Lives in the South Region (n=24)

46 Responsive Management
50
26
11
10
2
1
1
0
0 20 40 60 80 100
For the meat
For the sport,recreation, and
challenge
To be with family andfriends
To be close to nature
For a trophy
To reduce damageto crops
To see a deer
Don't know
Percent (n=869)
What was your most important reason for hunting deer in the past 5 years? (Asked of
those who hunted deer in Maine in the past 5 years.) (Hunters)
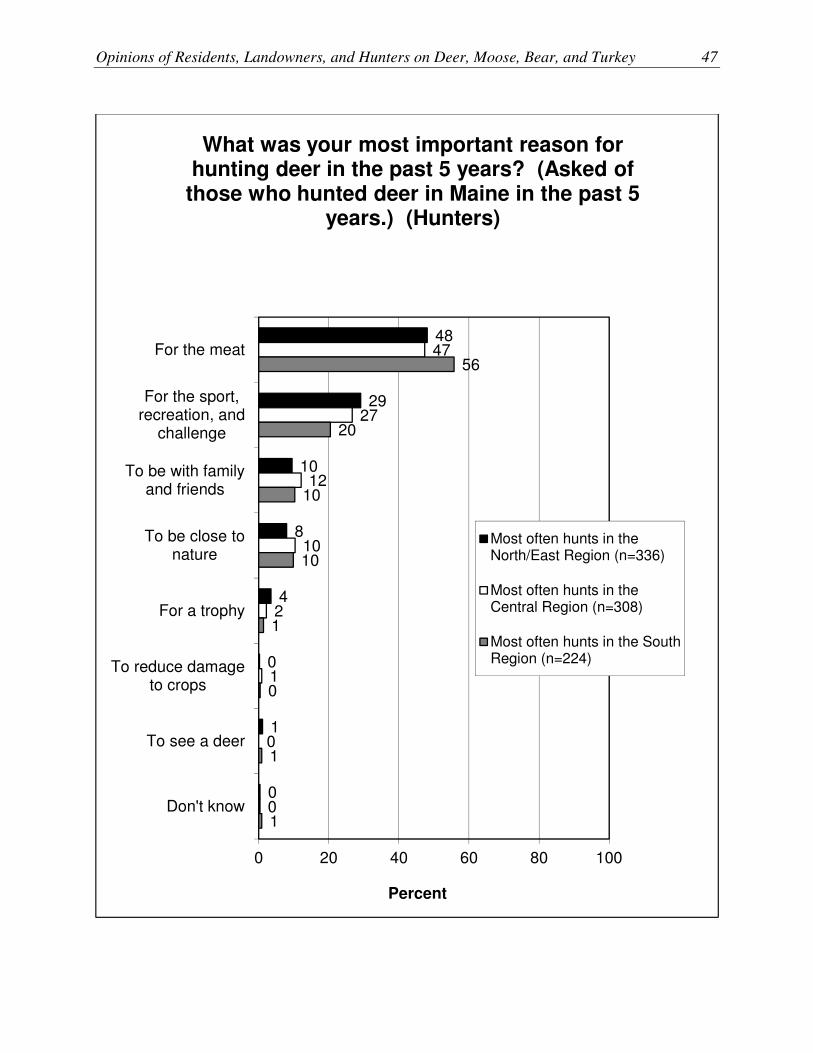
Opinions of Residents, Landowners, and Hunters on Deer, Moose, Bear, and Turkey 47
48
29
10
8
4
0
1
0
47
27
12
10
2
1
0
0
56
20
10
10
1
0
1
1
0 20 40 60 80 100
For the meat
For the sport,recreation, and
challenge
To be with familyand friends
To be close tonature
For a trophy
To reduce damageto crops
To see a deer
Don't know
Percent
What was your most important reason for hunting deer in the past 5 years? (Asked of
those who hunted deer in Maine in the past 5 years.) (Hunters)
Most often hunts in theNorth/East Region (n=336)
Most often hunts in theCentral Region (n=308)
Most often hunts in the SouthRegion (n=224)

48 Responsive Management
58
26
9
3
3
1
1
0 20 40 60 80 100
For the meat
For the sport,recreation, and
challenge
To be with familyand friends
For a trophy
To be close tonature
To see a moose
Don't know
Percent (n=557)
What was or would be your most important reason for hunting moose? (Asked of those
who hunted moose in Maine in the past 15 years or typically apply for a moose permit.)
(Hunters)
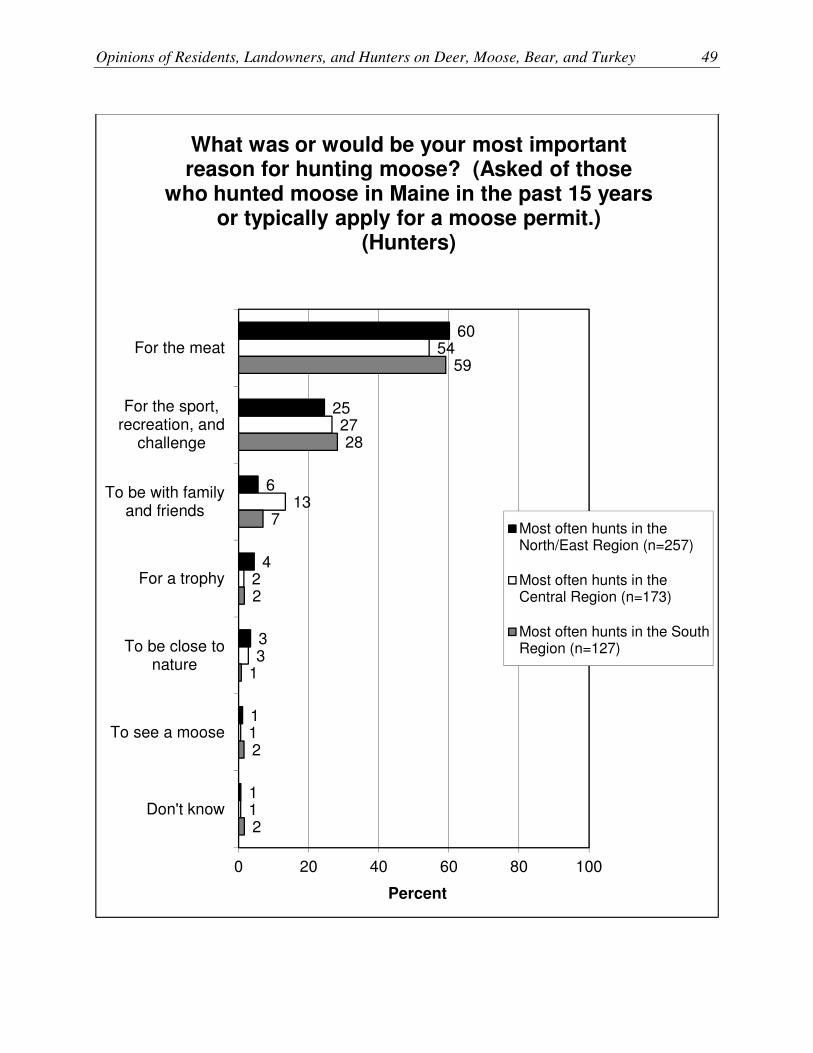
Opinions of Residents, Landowners, and Hunters on Deer, Moose, Bear, and Turkey 49
60
25
6
4
3
1
1
54
27
13
2
3
1
1
59
28
7
2
1
2
2
0 20 40 60 80 100
For the meat
For the sport,recreation, and
challenge
To be with familyand friends
For a trophy
To be close tonature
To see a moose
Don't know
Percent
What was or would be your most important reason for hunting moose? (Asked of those
who hunted moose in Maine in the past 15 years or typically apply for a moose permit.)
(Hunters)
Most often hunts in theNorth/East Region (n=257)
Most often hunts in theCentral Region (n=173)
Most often hunts in the SouthRegion (n=127)

50 Responsive Management
40
36
12
6
3
3
1
0 20 40 60 80 100
For the sport,recreation, and
challenge
For the meat
To be with familyand friends
To be close tonature
For a trophy
To see a bear
Don't know
Percent (n=310)
What was your most important reason for hunting bear? (Asked of those who hunted bear
in Maine in the past 15 years.) (Hunters)

Opinions of Residents, Landowners, and Hunters on Deer, Moose, Bear, and Turkey 51
46
34
8
6
4
2
0
36
39
16
4
3
3
0
34
36
10
10
2
5
4
0 20 40 60 80 100
For the sport,recreation, and
challenge
For the meat
To be with familyand friends
To be close tonature
For a trophy
To see a bear
Don't know
Percent
What was your most important reason for hunting bear? (Asked of those who hunted bear
in Maine in the past 15 years.) (Hunters)
Most often hunts in theNorth/East Region (n=154)
Most often hunts in theCentral Region (n=105)
Most often hunts in the SouthRegion (n=51)
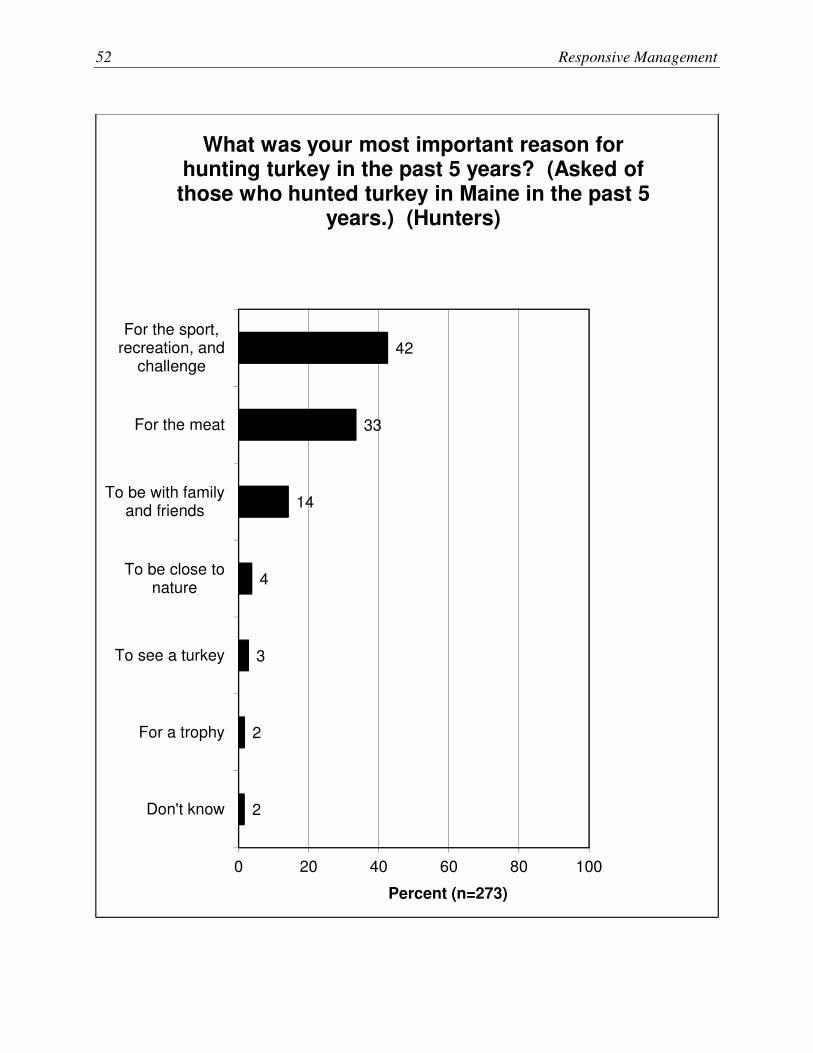
52 Responsive Management
42
33
14
4
3
2
2
0 20 40 60 80 100
For the sport,recreation, and
challenge
For the meat
To be with familyand friends
To be close tonature
To see a turkey
For a trophy
Don't know
Percent (n=273)
What was your most important reason for hunting turkey in the past 5 years? (Asked of
those who hunted turkey in Maine in the past 5 years.) (Hunters)
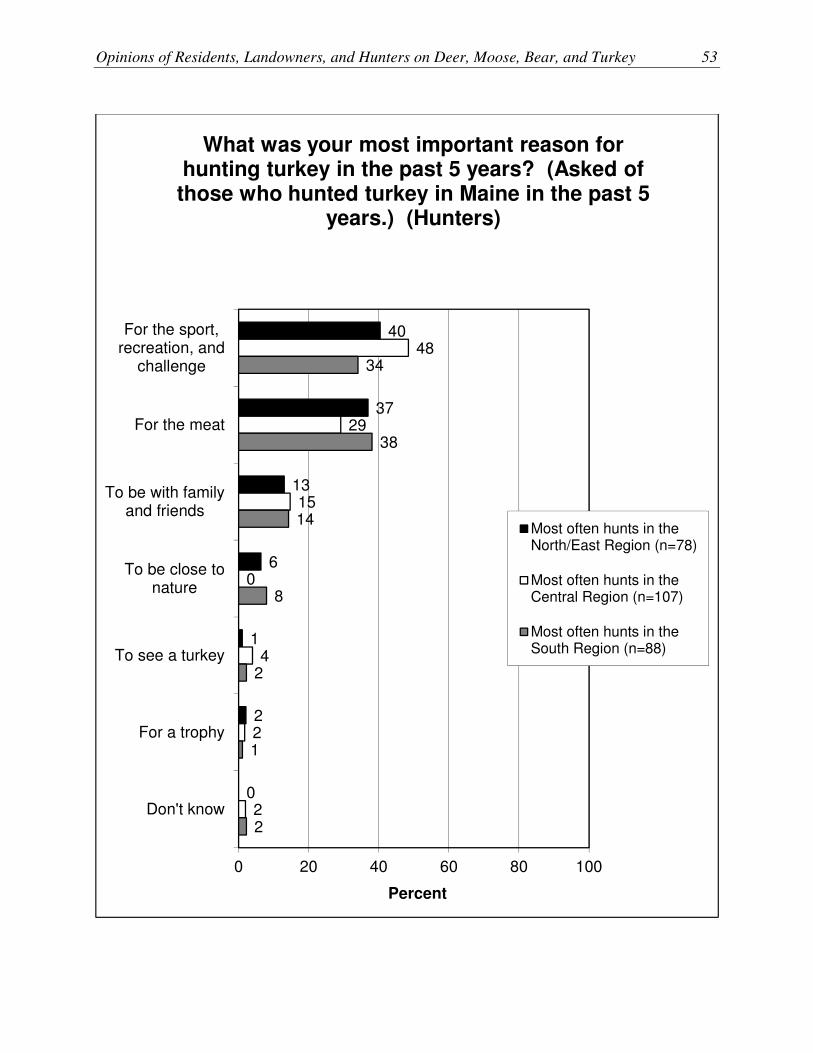
Opinions of Residents, Landowners, and Hunters on Deer, Moose, Bear, and Turkey 53
40
37
13
6
1
2
0
48
29
15
0
4
2
2
34
38
14
8
2
1
2
0 20 40 60 80 100
For the sport,recreation, and
challenge
For the meat
To be with familyand friends
To be close tonature
To see a turkey
For a trophy
Don't know
Percent
What was your most important reason for hunting turkey in the past 5 years? (Asked of
those who hunted turkey in Maine in the past 5 years.) (Hunters)
Most often hunts in theNorth/East Region (n=78)
Most often hunts in theCentral Region (n=107)
Most often hunts in theSouth Region (n=88)

54 Responsive Management
SATISFACTION AND DISSATISFACTION WITH HUNTING � The survey asked about hunters’ satisfaction levels for hunting for the four primary species
of interest in the survey over the past 5 years (for deer and turkey) or over the past 15 years
(for moose and bear). All those who did not answer that they were very satisfied (and those
who answered “don’t know”) were then asked why they had not been more satisfied.
• The large majority of deer hunters were satisfied with their deer hunting: 82% were
satisfied; 15% were dissatisfied.
o The highest satisfaction levels are from hunters who most often hunt in the South
Region.
o Lack of harvest success is, by far, the most common reason for not being more
satisfied with deer hunting.
• The large majority of moose hunters were satisfied with their moose hunting: 91% were
satisfied; 7% were dissatisfied.
o Although the regions are not greatly different (because all are so high in satisfaction),
hunters who most often hunted in the North/East Region are the most satisfied. (It is
important to note that the crosstabulation is by where the hunter hunted the most
often, which may or may not have been the same place he/she hunted moose).
o Lack of harvest success is the most common reason for not being more satisfied with
moose hunting.
• The large majority of bear hunters were satisfied with their bear hunting: 90% were
satisfied; 7% were dissatisfied.
o The regional analysis is shown, based on the county in which the hunter most often
hunted, with slightly less satisfaction/more dissatisfaction among hunters in the South
Region. (Again, it is important to note that the crosstabulation is by where the hunter
hunted the most often, which may or may not have been the same place he/she hunted
bear).
o As with other species, lack of harvest success is the most common reason for not
being more satisfied with bear hunting.
• The large majority of turkey hunters were satisfied with their turkey hunting: 92% were
satisfied; only 5% were dissatisfied.
o The regions are almost identical to one another on this question.
o Again, lack of harvest success is the most common reason for not being more
satisfied with turkey hunting.

Opinions of Residents, Landowners, and Hunters on Deer, Moose, Bear, and Turkey 55
60
22
2
8
7
0 20 40 60 80 100
Very satisfied
Somewhatsatisfied
Neither satisfiednor dissatisfied
Somewhatdissatisfied
Very dissatisfied
Percent (n=868)
In general, how satisfied or dissatisfied were you with your deer hunting experiences in
Maine in the past 5 years? (Asked of those who hunted deer in Maine in the past 5 years.)
(Hunters)
82%
15%

56 Responsive Management
49
28
1
12
10
63
20
2
8
7
70
18
4
6
3
0 20 40 60 80 100
Very satisfied
Somewhatsatisfied
Neither satisfiednor dissatisfied
Somewhatdissatisfied
Very dissatisfied
Percent
In general, how satisfied or dissatisfied were you with your deer hunting experiences in
Maine in the past 5 years? (Asked of those who hunted deer in Maine in the past 5 years.)
(Hunters)
Most often hunts in theNorth/East Region (n=336)
Most often hunts in theCentral Region (n=308)
Most often hunts in the SouthRegion (n=224)
77% 83% 88%
21% * 15%
9% * Rounding on graph causes apparent discrepancy in sum;
calculation made on unrounded numbers.

Opinions of Residents, Landowners, and Hunters on Deer, Moose, Bear, and Turkey 57
70
8
7
7
6
2
6
2
0 20 40 60 80 100
Too few deer / lack of harvest success
Buck / doe imbalance
Not enough permits / mismanagement ofregulations
Hunter overcrowding / lack of access
Not enough time / season too short
Poor behavior from other hunters
Other
Don't know
Percent (n=350)
Mu
ltip
le R
es
po
ns
es
All
ow
ed
Why weren't you more satisfied with your deer hunting experiences? (Asked of those who hunted deer in Maine in the past 5 years and
were not 'very satisfied'.) (Hunters)

58 Responsive Management
80
11
1
4
3
0
0 20 40 60 80 100
Very satisfied
Somewhatsatisfied
Neither satisfiednor dissatisfied
Somewhatdissatisfied
Very dissatisfied
Don't know
Percent (n=342)
In general, how satisfied or dissatisfied were you with your moose hunting experiences in Maine in the past 15 years? (Asked of those who hunted moose in Maine in the past 15
years.) (Hunters)
91%
7%

Opinions of Residents, Landowners, and Hunters on Deer, Moose, Bear, and Turkey 59
85
11
1
2
2
0
76
11
2
5
5
1
79
12
3
5
1
0
0 20 40 60 80 100
Very satisfied
Somewhatsatisfied
Neither satisfiednor dissatisfied
Somewhatdissatisfied
Very dissatisfied
Don't know
Percent
In general, how satisfied or dissatisfied were you with your moose hunting experiences in Maine in the past 15 years? (Asked of those who hunted moose in Maine in the past 15
years.) (Hunters)
Most often hunts in theNorth/East Region (n=158)
Most often hunts in theCentral Region (n=109)
Most often hunts in the SouthRegion (n=75)
96% 88% * 91%
3% * 10% 7% *
* Rounding on graph causes apparent discrepancy in sum;
calculation made on unrounded numbers.
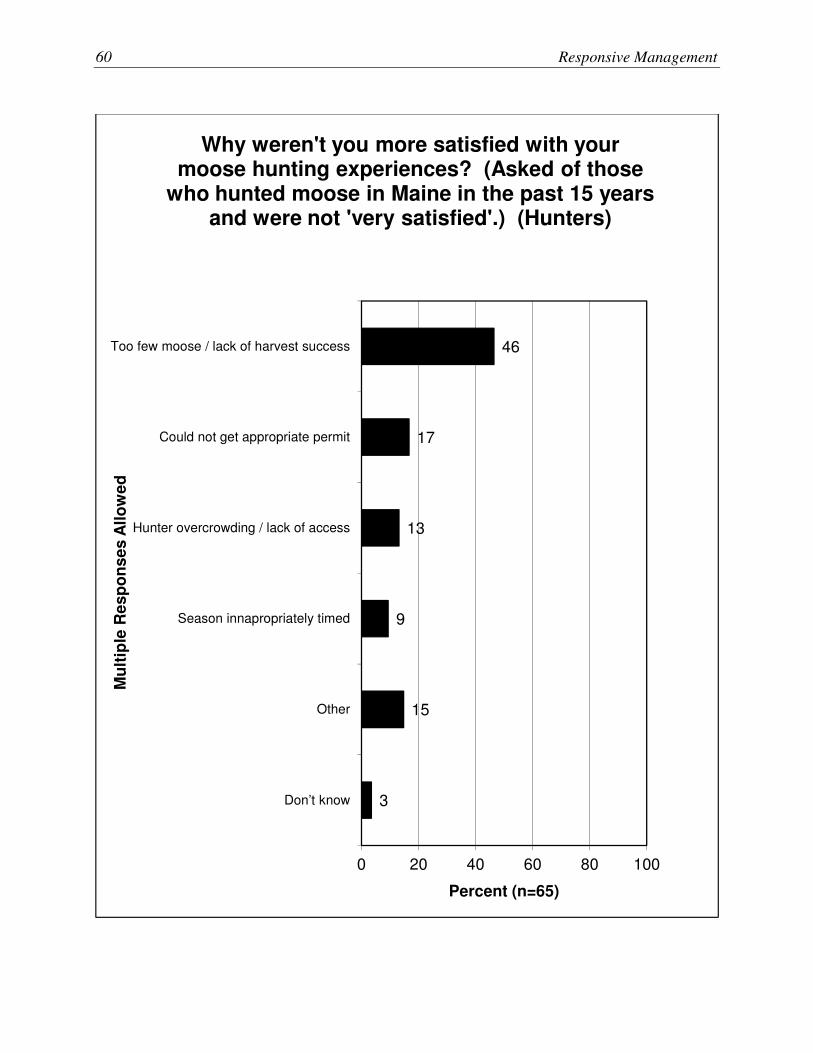
60 Responsive Management
46
17
13
9
15
3
0 20 40 60 80 100
Too few moose / lack of harvest success
Could not get appropriate permit
Hunter overcrowding / lack of access
Season innapropriately timed
Other
Don’t know
Percent (n=65)
Mu
ltip
le R
es
po
ns
es
All
ow
ed
Why weren't you more satisfied with your moose hunting experiences? (Asked of those
who hunted moose in Maine in the past 15 years and were not 'very satisfied'.) (Hunters)

Opinions of Residents, Landowners, and Hunters on Deer, Moose, Bear, and Turkey 61
73
17
3
3
3
1
0 20 40 60 80 100
Very satisfied
Somewhatsatisfied
Neither satisfiednor dissatisfied
Somewhatdissatisfied
Very dissatisfied
Don't know
Percent (n=310)
In general, how satisfied or dissatisfied were you with your bear hunting experiences in
Maine in the past 15 years? (Asked of those who hunted bear in Maine in the past 15 years.)
(Hunters)
90%
7% * * Rounding on graph causes apparent discrepancy in sum;
calculation made on unrounded numbers.
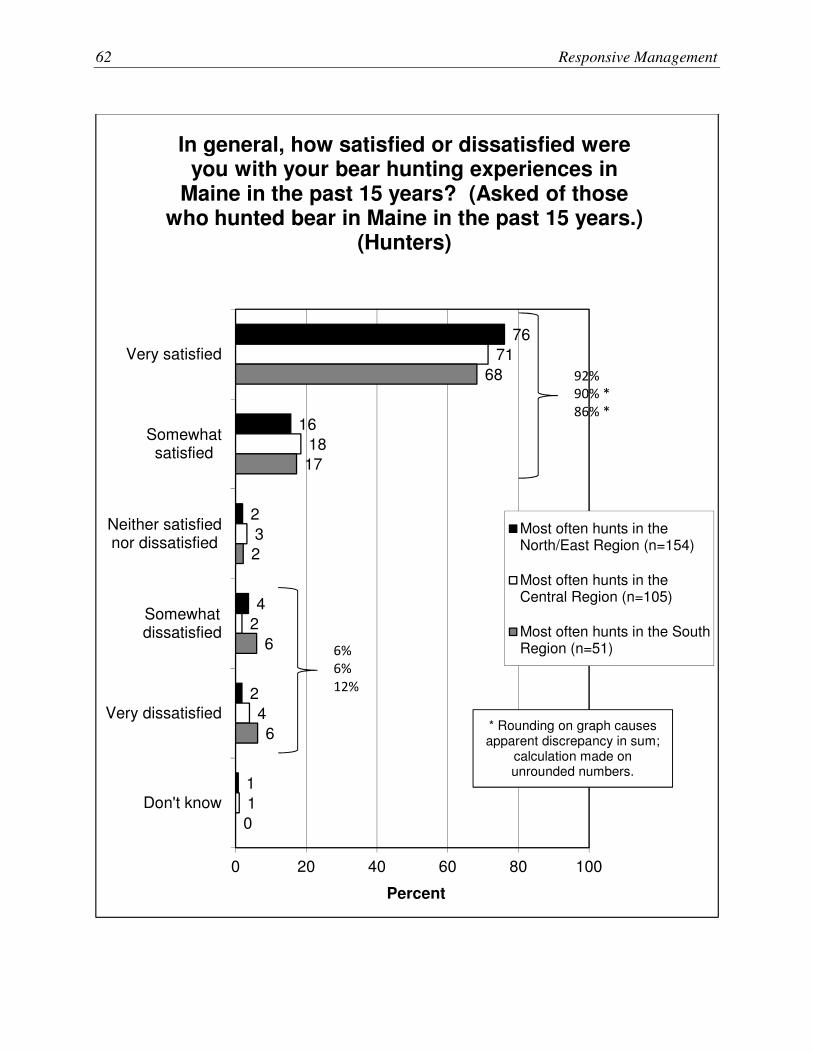
62 Responsive Management
76
16
2
4
2
1
71
18
3
2
4
1
68
17
2
6
6
0
0 20 40 60 80 100
Very satisfied
Somewhatsatisfied
Neither satisfiednor dissatisfied
Somewhatdissatisfied
Very dissatisfied
Don't know
Percent
In general, how satisfied or dissatisfied were you with your bear hunting experiences in
Maine in the past 15 years? (Asked of those who hunted bear in Maine in the past 15 years.)
(Hunters)
Most often hunts in theNorth/East Region (n=154)
Most often hunts in theCentral Region (n=105)
Most often hunts in the SouthRegion (n=51)
92% 90% * 86% *
6% 6%
12%
* Rounding on graph causes apparent discrepancy in sum;
calculation made on unrounded numbers.

Opinions of Residents, Landowners, and Hunters on Deer, Moose, Bear, and Turkey 63
73
10
6
13
1
0 20 40 60 80 100
Too few bear / lack of harvest success
Season innapropriately timed
Hunter overcrowding / lack of access
Other
Don’t know
Percent (n=81)
Mu
ltip
le R
es
po
ns
es
All
ow
ed
Why weren't you more satisfied with your bear hunting experiences? (Asked of those who
hunted bear in Maine in the past 15 years and were not 'very satisfied'.) (Hunters)

64 Responsive Management
72
20
2
3
3
1
0 20 40 60 80 100
Very satisfied
Somewhatsatisfied
Neither satisfiednor dissatisfied
Somewhatdissatisfied
Very dissatisfied
Don't know
Percent (n=273)
In general, how satisfied or dissatisfied were you with your turkey hunting experiences in
Maine in the past 5 years? (Asked of those who hunted turkey in Maine in the past 5 years.)
(Hunters)
92%
5% * * Rounding on graph causes apparent discrepancy in sum;
calculation made on unrounded numbers.

Opinions of Residents, Landowners, and Hunters on Deer, Moose, Bear, and Turkey 65
71
20
1
3
4
0
75
18
1
2
2
2
69
22
3
3
2
0
0 20 40 60 80 100
Very satisfied
Somewhatsatisfied
Neither satisfiednor dissatisfied
Somewhatdissatisfied
Very dissatisfied
Don't know
Percent
In general, how satisfied or dissatisfied were you with your turkey hunting experiences in
Maine in the past 5 years? (Asked of those who hunted turkey in Maine in the past 5 years.)
(Hunters)
Most often hunts in theNorth/East Region (n=78)
Most often hunts in theCentral Region (n=107)
Most often hunts in theSouth Region (n=88)
91% 93% 91%
7% 4% 6% *

66 Responsive Management
59
9
8
5
15
4
0 20 40 60 80 100
Too few turkey / lack of harvest success
Hunter overcrowding / lack of access
Not enough time / season too short
Restrictions on harvests
Other
Don't know
Percent (n=73)
Mu
ltip
le R
es
po
ns
es
All
ow
ed
Why weren't you more satisfied with your turkey hunting experiences? (Asked of those who
hunted turkey in Maine in the past 5 years and were not 'very satisfied'.) (Hunters)
Opinions of Residents, Landowners, and Hunters on Deer, Moose, Bear, and Turkey 67
CONSTRAINTS TO HUNTING
� Hunters who had hunted deer in the past 5 years were asked about any things that might have
prevented them from hunting deer as much as they would have liked in the past 5 years. For
41% of these deer hunters, nothing had prevented them. Otherwise, lack of time/other
obligations was the most common reason—a reason over which agencies have little sway.
� Hunters who had not hunted a species were asked why they had not done so.
• Regarding not hunting deer, distance, time, and not enough deer are common reasons
given.
o Note that there is a low sample size (because only those hunters who did not hunt
deer got the question) among resident hunters; the regional graph is shown primarily
to show how nonresidents affect the results. Not surprisingly, they are more likely
than residents to claim that going to Maine to hunt deer is too far a distance.
• Common reasons for not hunting moose include lack of interest, time, expense, and
difficulty getting permits.
o There are minor differences regionally.
• Common reasons to not hunt bear include lack of interest, a dislike of the meat, and lack
of time.
o There are minor differences regionally.
• Regarding turkey, common reasons for not hunting them include lack of interest, lack of
time, and restrictive permits/regulations.
o There are minor differences regionally.

68 Responsive Management
41
32
9
9
3
3
2
2
3
0 20 40 60 80 100
No
Other obligations / not enough time
Age or health
Not enough access / overcrowding
Incompatible season scheduling / lack of Sundayhunting
Too few deer
Poor weather
Cost or financial reasons
Other
Percent (n=287)
Mu
ltip
le R
es
po
ns
es
All
ow
ed
Are there things that have prevented you from going deer hunting as much as you would like
in the past 5 years? (Asked of those who hunted deer in Maine in the past 5 years.)
(Hunters)
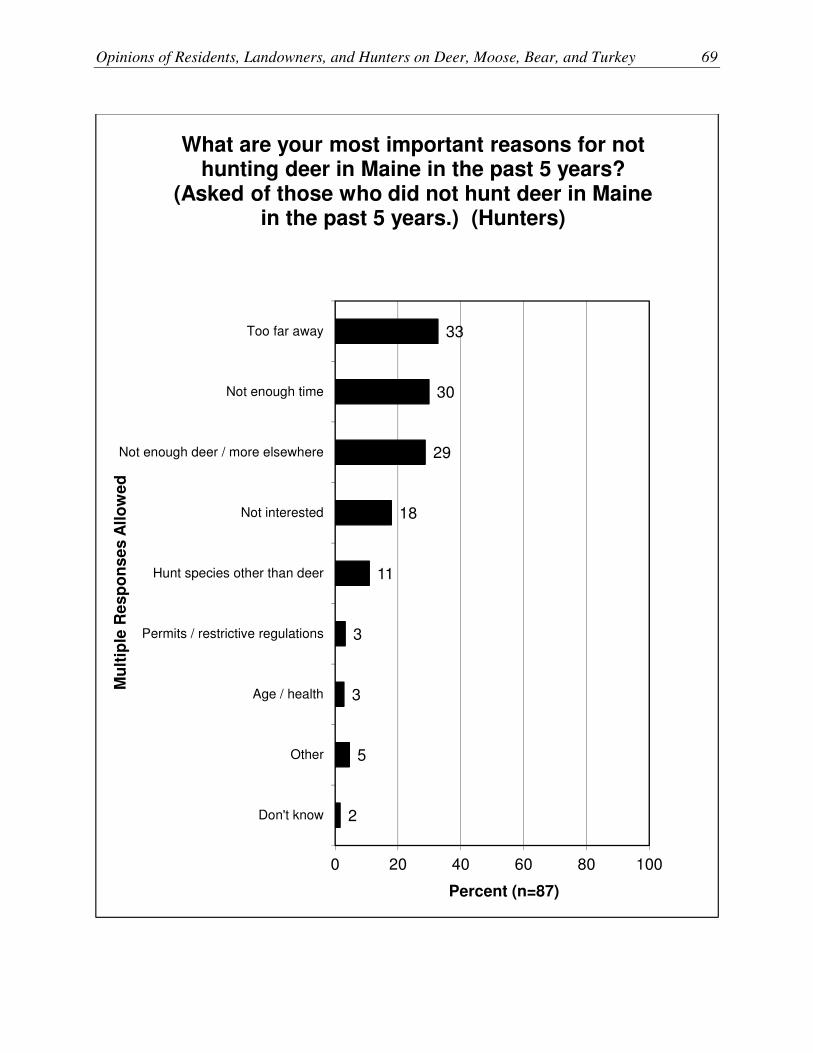
Opinions of Residents, Landowners, and Hunters on Deer, Moose, Bear, and Turkey 69
33
30
29
18
11
3
3
5
2
0 20 40 60 80 100
Too far away
Not enough time
Not enough deer / more elsewhere
Not interested
Hunt species other than deer
Permits / restrictive regulations
Age / health
Other
Don't know
Percent (n=87)
Mu
ltip
le R
es
po
ns
es
All
ow
ed
What are your most important reasons for not hunting deer in Maine in the past 5 years?
(Asked of those who did not hunt deer in Maine in the past 5 years.) (Hunters)

70 Responsive Management
0
46
15
23
8
8
15
0
0
0
0
25
50
25
0
0
0
25
0
25
0
58
0
0
0
17
0
47
31
36
7
12
3
2
3
0
0 20 40 60 80 100
Too far away
Not enough time
Not enough deer / more elsewhere
Not interested
Hunt species other than deer
Permits / restrictive regulations
Age / health
Other
Don't know
Percent
Mu
ltip
le R
es
po
ns
es
All
ow
ed
What are your most important reasons for not hunting deer in Maine in the past 5 years?
(Asked of those who did not hunt deer in Maine in the past 5 years.) (Hunters)
Lives in the North/East Region (n=13)
Lives in the Central Region (n=4)
Lives in the South Region (n=12)
Nonresident (n=58)

Opinions of Residents, Landowners, and Hunters on Deer, Moose, Bear, and Turkey 71
24
21
17
17
11
9
5
4
2
2
5
3
0 20 40 60 80 100
Not interested
Not enough time
Too expensive
Permits / restrictive regulations
Too big / too much work
Too far away
Hunt species other than moose
Don't like / need meat
Age / health
Not enough moose / more elsewhere
Other
Don't know
Percent (n=397)
Mu
ltip
le R
es
po
ns
es
All
ow
ed
What are your most important reasons for not hunting moose in Maine? (Asked of those who
did not hunt moose in Maine in the past 15 years and do not typically apply for a moose
permit.) (Hunters)

72 Responsive Management
19
25
13
28
5
8
5
8
5
1
8
3
27
19
20
14
15
4
6
6
0
2
4
3
29
21
13
13
11
12
2
4
4
2
7
2
16
22
20
21
7
14
4
0
3
4
4
3
0 20 40 60 80 100
Not interested
Not enough time
Too expensive
Permits / restrictive regulations
Too big / too much work
Too far away
Hunt species other than moose
Don't like / need meat
Age / health
Not enough moose / more elsewhere
Other
Don't know
Percent
Mu
ltip
le R
es
po
ns
es
All
ow
ed
What are your most important reasons for not hunting moose in Maine? (Asked of those who
did not hunt moose in Maine in the past 15 years and do not typically apply for a moose
permit.) (Hunters)
Lives in the North/East Region (n=80)
Lives in the Central Region (n=108)
Lives in the South Region (n=112)
Nonresident (n=97)
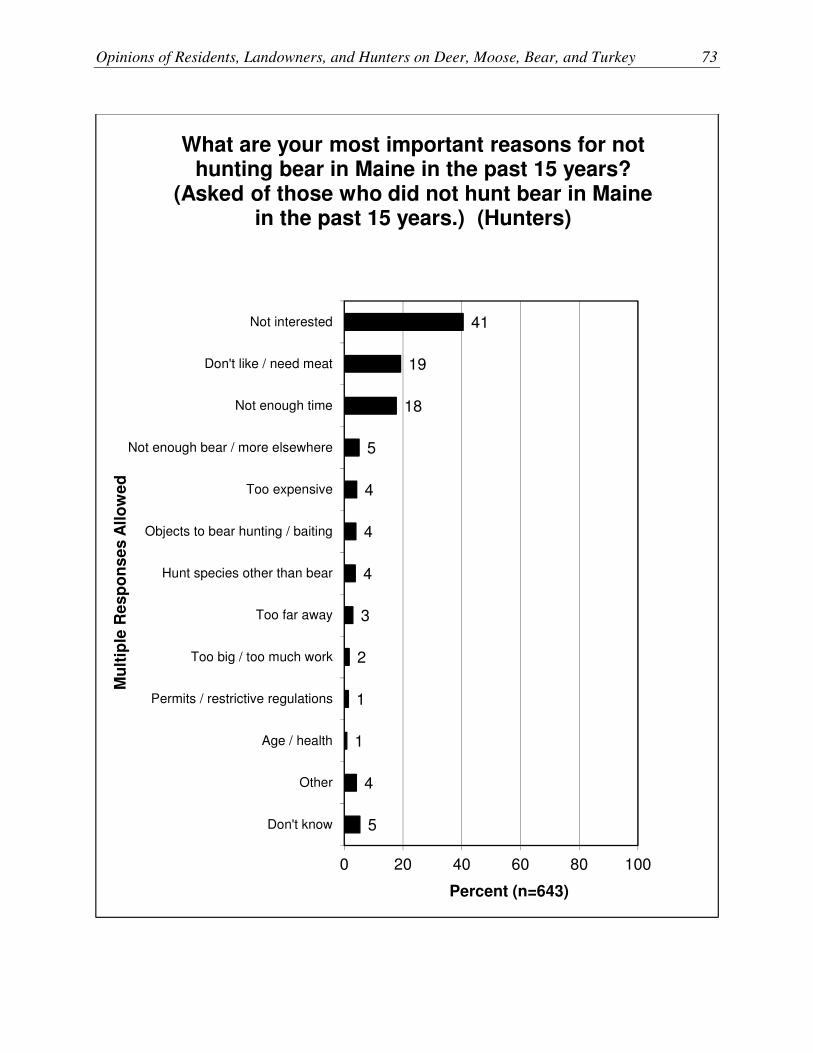
Opinions of Residents, Landowners, and Hunters on Deer, Moose, Bear, and Turkey 73
41
19
18
5
4
4
4
3
2
1
1
4
5
0 20 40 60 80 100
Not interested
Don't like / need meat
Not enough time
Not enough bear / more elsewhere
Too expensive
Objects to bear hunting / baiting
Hunt species other than bear
Too far away
Too big / too much work
Permits / restrictive regulations
Age / health
Other
Don't know
Percent (n=643)
Mu
ltip
le R
es
po
ns
es
All
ow
ed
What are your most important reasons for not hunting bear in Maine in the past 15 years?
(Asked of those who did not hunt bear in Maine in the past 15 years.) (Hunters)
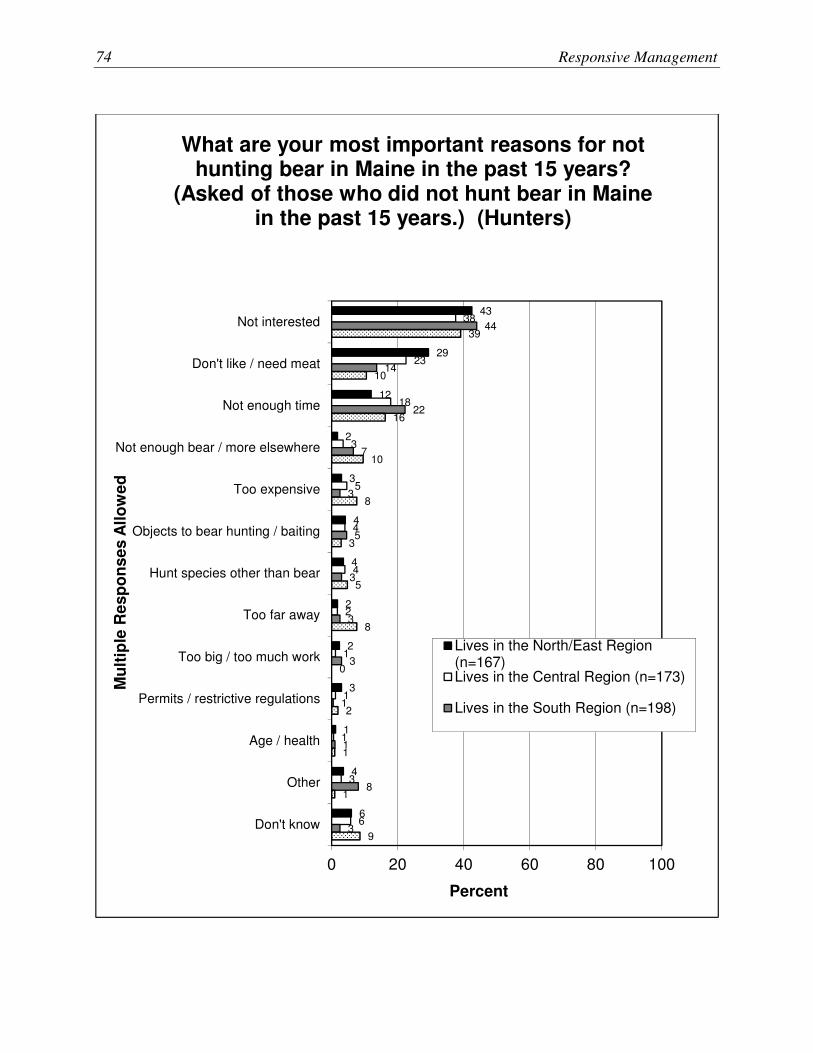
74 Responsive Management
43
29
12
2
3
4
4
2
2
3
1
4
6
38
23
18
3
5
4
4
2
1
1
1
3
6
44
14
22
7
3
5
3
3
3
1
1
8
3
39
10
16
10
8
3
5
8
0
2
1
1
9
0 20 40 60 80 100
Not interested
Don't like / need meat
Not enough time
Not enough bear / more elsewhere
Too expensive
Objects to bear hunting / baiting
Hunt species other than bear
Too far away
Too big / too much work
Permits / restrictive regulations
Age / health
Other
Don't know
Percent
Mu
ltip
le R
es
po
ns
es
All
ow
ed
What are your most important reasons for not hunting bear in Maine in the past 15 years?
(Asked of those who did not hunt bear in Maine in the past 15 years.) (Hunters)
Lives in the North/East Region(n=167)Lives in the Central Region (n=173)
Lives in the South Region (n=198)

Opinions of Residents, Landowners, and Hunters on Deer, Moose, Bear, and Turkey 75
29
24
14
10
9
7
7
5
3
2
1
6
3
0 20 40 60 80 100
Not interested
Not enough time
Permits / restrictive regulations
Not enough turkey / more elsewhere
Too far away
Don't like / need meat
Too expensive
Hunt species other than turkey
Too much work
Age / health
Objects to turkey hunting
Other
Don't know
Percent (n=677)
Mu
ltip
le R
es
po
ns
es
All
ow
ed
What are your most important reasons for not hunting turkey in Maine in the past 5 years? (Asked of those who did not hunt turkey in
Maine in the past 5 years.) (Hunters)

76 Responsive Management
29
17
19
20
6
9
6
2
3
1
2
7
3
35
25
14
3
0
9
10
5
3
3
1
6
5
27
38
16
1
1
9
8
4
4
3
3
6
2
25
17
10
17
30
3
4
10
1
1
1
5
2
0 20 40 60 80 100
Not interested
Not enough time
Permits / restrictive regulations
Not enough turkey / more elsewhere
Too far away
Don't like / need meat
Too expensive
Hunt species other than turkey
Too much work
Age / health
Objects to turkey hunting
Other
Don't know
Percent
Mu
ltip
le R
es
po
ns
es
All
ow
ed
What are your most important reasons for not hunting turkey in Maine in the past 5 years? (Asked of those who did not hunt turkey in
Maine in the past 5 years.) (Hunters)
Lives in the North/East Region (n=199)
Lives in the Central Region (n=155)
Lives in the South Region (n=160)
Nonresident (n=163)

Opinions of Residents, Landowners, and Hunters on Deer, Moose, Bear, and Turkey 77
OPINIONS ON HUNTING
� Landowners were asked about their approval/disapproval of hunting in general: the
overwhelming majority (93%) approve.
• There are some regional differences, but mostly in the strongly support or moderately
support rather than overall support. Landowners whose largest tract is in the North/East
Region are the most likely to strongly support.
� The landowner survey asked about support for or opposition to legal hunting as a method to
help manage wildlife populations in Maine. An overwhelming majority of landowners
(91%) support.
• Regional results mirror those in the question discussed immediately above.
� The survey asked about approval of hunting of the four primary species of interest in the
survey: deer, moose, bear, and turkey.
• Approval of deer hunting was high across the board: from 93% to 100% approve. At the
other end, no more than 6% disapproved.
• Approval of moose hunting is also high (from 90% to 98%). Compared to approval of
deer hunting, the results for approval of moose hunting show a slight shift into moderate
approval at the expense of strong approval (although a majority of each group still
strongly approve).
• Approval of bear hunting is high as well, but a little less robust than for moose hunting:
from 84% to 97% approve, and again moderate approval is not insubstantial. Bear has
the highest disapproval of the four species, but only as high as 12%.
• Finally, approval of turkey is likewise high: from 92% to 99% approve.

78 Responsive Management
� The survey explored opinions on bear hunting for various reasons, with five possible reasons
to hunt bear presented to respondents. The most support is for bear hunting as a way to
manage bear populations or bear hunting for the meat. Bear hunting to economically benefit
rural areas has middling support. At the low end, there is little support for human-centered
reasons (for a trophy—the least supported—or for recreation).
• Hunters express markedly more support than the other groups, with landowners narrowly
edging out the general population in support.
• A majority of all three groups strongly support bear hunting as a method to help manage
bear populations in Maine (59% to 83% strongly support) and for the meat (61% to 79%
strongly support). These are the only two reasons with a majority of the general
population or landowners in strong support.
o Four graphs are shown of the series: strongly support by itself, strongly and
moderately support combined, strongly and moderately oppose combined, and then
strongly oppose by itself.
o A regional breakdown of landowners by where their largest tract is located shows
some slight differences. In particular, landowners whose largest tract is in the South
Region are more likely to oppose hunting bear for a trophy, for recreation, or for
economic benefits to rural areas, compared to landowners whose largest tract is in
another region.

Opinions of Residents, Landowners, and Hunters on Deer, Moose, Bear, and Turkey 79
72
21
3
0
3
0 20 40 60 80 100
Strongly support
Moderatelysupport
Neither supportnor oppose
Moderatelyoppose
Strongly oppose
Percent (n=304)
In general, do you approve or disapprove of legal hunting? (Landowners)
93%
4% *
* Rounding on graph causes apparent
discrepancy in sum; calculation made on unrounded numbers.

80 Responsive Management
80
17
1
0
2
72
20
4
0
4
62
30
3
1
4
0 20 40 60 80 100
Strongly support
Moderatelysupport
Neither supportnor oppose
Moderatelyoppose
Strongly oppose
Percent
In general, do you approve or disapprove of legal hunting? (Landowners)
Largest tract is in theNorth/East Region (n=105)
Largest tract is in the CentralRegion (n=112)
Largest tract is in the SouthRegion (n=87)
97%
92%
92%
2%
4% *
5%
* Rounding on graph causes apparent discrepancy in sum;
calculation made on unrounded numbers.

Opinions of Residents, Landowners, and Hunters on Deer, Moose, Bear, and Turkey 81
71
20
3
0
4
1
0 20 40 60 80 100
Strongly support
Moderatelysupport
Neither supportnor oppose
Moderatelyoppose
Strongly oppose
Don't know
Percent (n=304)
Do you support or oppose legal hunting as a method to help manage wildlife populations in
Maine? (Landowners)
91%
5% * * Rounding on graph causes apparent
discrepancy in sum; calculation made on unrounded numbers.
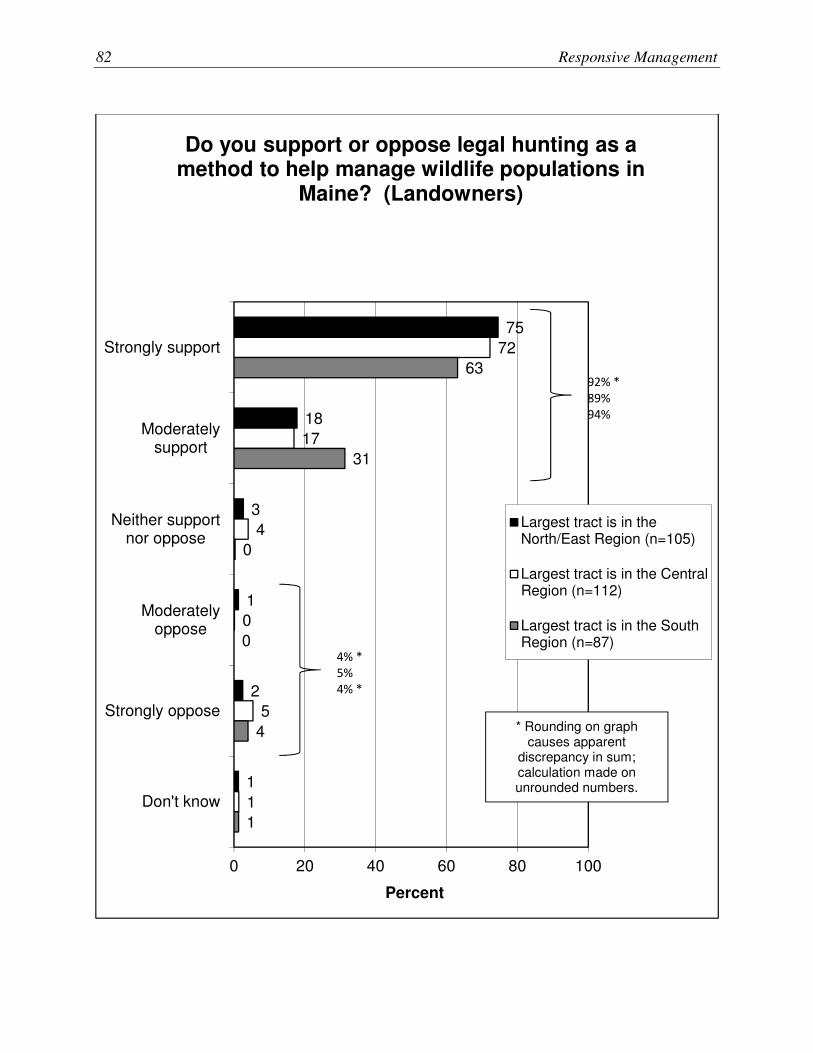
82 Responsive Management
75
18
3
1
2
1
72
17
4
0
5
1
63
31
0
0
4
1
0 20 40 60 80 100
Strongly support
Moderatelysupport
Neither supportnor oppose
Moderatelyoppose
Strongly oppose
Don't know
Percent
Do you support or oppose legal hunting as a method to help manage wildlife populations in
Maine? (Landowners)
Largest tract is in theNorth/East Region (n=105)
Largest tract is in the CentralRegion (n=112)
Largest tract is in the SouthRegion (n=87)
92% *
89%
94%
4% *
5%
4% *
* Rounding on graph causes apparent
discrepancy in sum; calculation made on unrounded numbers.
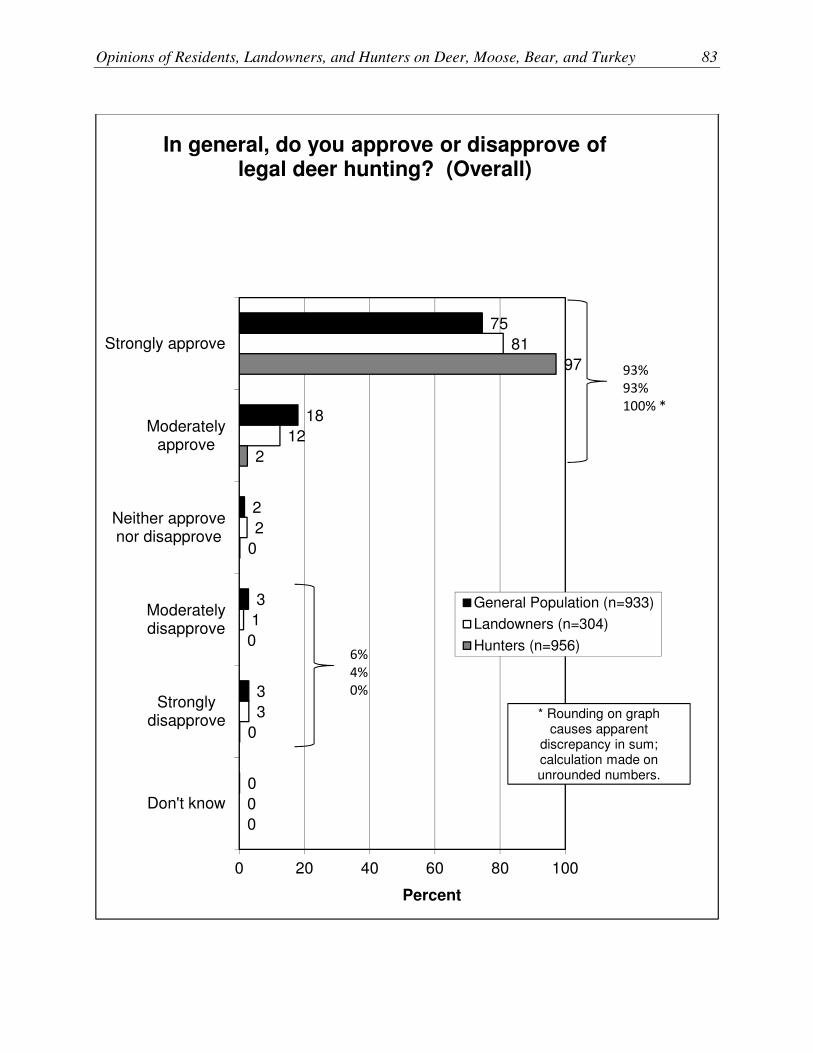
Opinions of Residents, Landowners, and Hunters on Deer, Moose, Bear, and Turkey 83
75
18
2
3
3
0
81
12
2
1
3
0
97
2
0
0
0
0
0 20 40 60 80 100
Strongly approve
Moderatelyapprove
Neither approvenor disapprove
Moderatelydisapprove
Stronglydisapprove
Don't know
Percent
In general, do you approve or disapprove of legal deer hunting? (Overall)
General Population (n=933)
Landowners (n=304)
Hunters (n=956)
93%
93%
100% *
6%
4%
0%
* Rounding on graph causes apparent
discrepancy in sum; calculation made on unrounded numbers.

84 Responsive Management
64
26
2
2
6
0
68
22
2
3
4
0
90
9
0
0
1
0
0 20 40 60 80 100
Strongly approve
Moderatelyapprove
Neither approvenor disapprove
Moderatelydisapprove
Stronglydisapprove
Don't know
Percent
In general, do you approve or disapprove of legal moose hunting? (Overall)
General Population (n=933)
Landowners (n=304)
Hunters (n=956)
* Rounding on graph causes apparent
discrepancy in sum; calculation made on unrounded numbers.
90% 90% 98% *
8% 7%
1%

Opinions of Residents, Landowners, and Hunters on Deer, Moose, Bear, and Turkey 85
58
26
3
4
8
1
64
20
3
5
7
1
87
11
1
1
1
0
0 20 40 60 80 100
Strongly approve
Moderatelyapprove
Neither approvenor disapprove
Moderatelydisapprove
Stronglydisapprove
Don't know
Percent
In general, do you approve or disapprove of legal bear hunting? (Overall)
General Population (n=933)
Landowners (n=304)
Hunters (n=956)
84%
84%
97% *
12%
12%
1% *
* Rounding on graph causes apparent
discrepancy in sum; calculation made on unrounded numbers.

86 Responsive Management
69
24
1
2
3
1
77
15
3
2
3
0
92
7
0
0
1
0
0 20 40 60 80 100
Strongly approve
Moderatelyapprove
Neither approvenor disapprove
Moderatelydisapprove
Stronglydisapprove
Don't know
Percent
In general, do you approve or disapprove of legal turkey hunting? (Overall)
General Population (n=933)
Landowners (n=304)
Hunters (n=956)
93%
92%
99%
5%
5%
1%

Opinions of Residents, Landowners, and Hunters on Deer, Moose, Bear, and Turkey 87
59
61
38
25
10
62
64
43
31
12
83
79
58
52
26
0 20 40 60 80 100
As a method tohelp manage bear
populations inMaine
For the meat
For economicbenefits to rural
areas
For recreation
For a trophy
Percent
Percent of respondents who would strongly support hunting bear for each of the following
reasons. (Overall)
General Population (n=933)
Landowners (n=304)
Hunters (n=956)

88 Responsive Management
87
86
67
51
30
91
87
71
56
32
95
94
81
75
53
0 20 40 60 80 100
As a method to helpmanage bear
populations in Maine
For the meat
For economicbenefits to rural
areas
For recreation
For a trophy
Percent
Percent of respondents who would strongly support or moderately support hunting bear for
each of the following reasons. (Overall)
General Population (n=933)
Landowners (n=304)
Hunters (n=956)

Opinions of Residents, Landowners, and Hunters on Deer, Moose, Bear, and Turkey 89
66
45
24
11
9
61
37
20
8
7
38
19
12
4
3
0 20 40 60 80 100
For a trophy
For recreation
For economicbenefits to rural
areas
For the meat
As a method to helpmanage bear
populations in Maine
Percent
Percent of respondents who would moderately oppose or strongly oppose hunting bear for
each of the following reasons. (Overall)
General Population (n=933)
Landowners (n=304)
Hunters (n=956)

90 Responsive Management
49
29
12
6
5
48
27
10
5
4
24
10
6
2
1
0 20 40 60 80 100
For a trophy
For recreation
For economicbenefits to rural
areas
For the meat
As a method tohelp manage bear
populations inMaine
Percent
Percent of respondents who would strongly oppose hunting bear for each of the following
reasons. (Overall)
General Population (n=933)
Landowners (n=304)
Hunters (n=956)

Opinions of Residents, Landowners, and Hunters on Deer, Moose, Bear, and Turkey 91
93
90
76
57
37
89
84
70
57
32
91
88
68
52
26
0 20 40 60 80 100
As a method to helpmanage bear
populations in Maine
For the meat
For economicbenefits to rural
areas
For recreation
For a trophy
Percent
Percent of respondents who would strongly support or moderately support hunting bear for
each of the following reasons. (Landowners)
Largest tract is in theNorth/East Region(n=105)
Largest tract is in theCentral Region (n=112)
Largest tract is in theSouth Region (n=87)

92 Responsive Management
57
37
18
8
5
60
33
19
8
8
69
45
25
7
5
0 20 40 60 80 100
For a trophy
For recreation
For economicbenefits to rural
areas
For the meat
As a method to helpmanage bear
populations in Maine
Percent
Percent of respondents who would moderately oppose or strongly oppose hunting bear for
each of the following reasons. (Landowners)
Largest tract is in theNorth/East Region(n=105)
Largest tract is in theCentral Region (n=112)
Largest tract is in theSouth Region (n=87)

Opinions of Residents, Landowners, and Hunters on Deer, Moose, Bear, and Turkey 93
HUNTING ACCESS
� Although a majority of hunters rate access to hunting lands in Maine as excellent or good
(64%), there is a substantial percentage giving a fair or poor rating (34%).
• A regional breakdown of hunters, based on where they live, shows that those who live in
the Central Region tend to give the worse ratings of the three regions.
• A second regional breakdown is shown based on the region in which hunters most often
hunt (based on the question that asked them to name the county in which they most often
hunted).
� Paralleling the results above, 34% of hunters agree that lack of access to hunting lands in
Maine has caused them to not hunt as much as they would have liked in the past 5 years. On
the other end, 61% disagree.
• South and Central Region hunters are more likely to agree with this statement than are
North/East Region hunters and nonresidents.
• Another crosstabulation is shown based on the region in which the hunter most often
hunts. The least agreement/most disagreement is from hunters hunting in the North/East
Region.
� Landowners were asked about allowing access for hunting on their land. Most of them do
so: 81% allow people other than household members to access their largest tract of land for
hunting. In breaking down type of access, 42% allow access by permission, and 28% allow
open access.
• In the regional analysis, landowners whose largest tract is in the North/East Region are
the most likely to allow open access.
o A follow-up question asked for the main reasons landowners did not allow access to
the land for hunting other than family or friends. Common reasons are a disapproval
of hunting, firearm safety concerns, disrespectful behavior of hunters, property
damage, and privacy concerns.

94 Responsive Management
20
44
27
7
1
0 20 40 60 80 100
Excellent
Good
Fair
Poor
Don't know
Percent (n=956)
In general, how would you rate access to hunting lands in Maine? (Hunters)
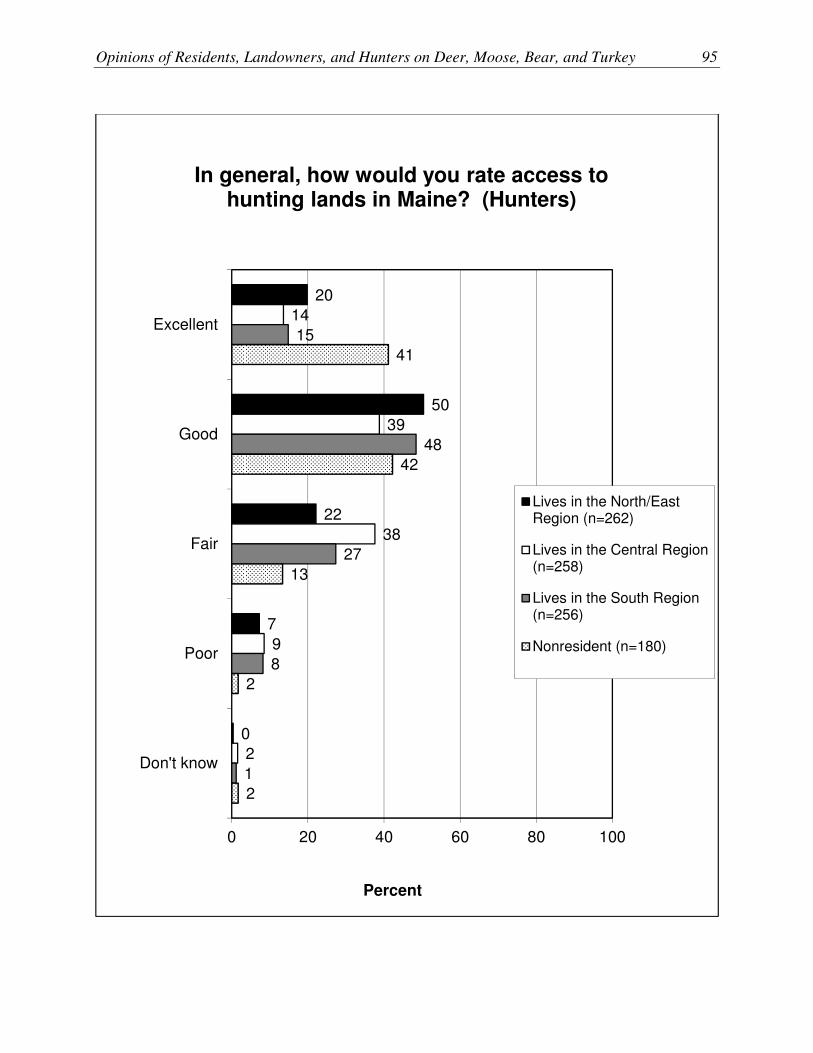
Opinions of Residents, Landowners, and Hunters on Deer, Moose, Bear, and Turkey 95
20
50
22
7
0
14
39
38
9
2
15
48
27
8
1
41
42
13
2
2
0 20 40 60 80 100
Excellent
Good
Fair
Poor
Don't know
Percent
In general, how would you rate access to hunting lands in Maine? (Hunters)
Lives in the North/EastRegion (n=262)
Lives in the Central Region(n=258)
Lives in the South Region(n=256)
Nonresident (n=180)

96 Responsive Management
28
44
21
5
1
16
42
33
8
1
17
48
26
8
1
0 20 40 60 80 100
Excellent
Good
Fair
Poor
Don't know
Percent
In general, how would you rate access to hunting lands in Maine? (Hunters)
Most often hunts in theNorth/East Region (n=396)
Most often hunts in theCentral Region (n=326)
Most often hunts in the SouthRegion (n=234)

Opinions of Residents, Landowners, and Hunters on Deer, Moose, Bear, and Turkey 97
19
15
5
27
33
1
0 20 40 60 80 100
Strongly agree
Moderately agree
Neither agree nordisagree
Moderatelydisagree
Strongly disagree
Don't know
Percent (n=956)
Do you agree or disagree that a lack of access to hunting lands in Maine has caused you to not hunt any species as much as you would like in
the past 5 years? (Hunters)
34%
61% *
* Rounding on graph causes apparent discrepancy in sum;
calculation made on unrounded numbers.

98 Responsive Management
13
15
5
31
36
1
21
17
3
28
29
1
23
18
4
27
28
1
14
8
9
23
46
0
0 20 40 60 80 100
Strongly agree
Moderately agree
Neither agree nordisagree
Moderatelydisagree
Strongly disagree
Don't know
Percent
Do you agree or disagree that a lack of access to hunting lands in Maine has caused you to not hunt any species as much as you would like in
the past 5 years? (Hunters)
Lives in the North/EastRegion (n=262)
Lives in the Central Region(n=258)
Lives in the South Region(n=256)
Nonresident (n=180)

Opinions of Residents, Landowners, and Hunters on Deer, Moose, Bear, and Turkey 99
13
12
7
30
38
0
22
15
4
27
30
1
20
19
3
23
33
1
0 20 40 60 80 100
Strongly agree
Moderately agree
Neither agree nordisagree
Moderatelydisagree
Strongly disagree
Don't know
Percent
Do you agree or disagree that a lack of access to hunting lands in Maine has caused you to not hunt any species as much as you would like in
the past 5 years? (Hunters)
Most often hunts in theNorth/East Region (n=396)
Most often hunts in theCentral Region (n=326)
Most often hunts in the SouthRegion (n=234)

100 Responsive Management
28
42
11
19
0 20 40 60 80 100
Open access
Access bypermission
Limited access tofamily and friends
only
Does not allowaccess to those
outside theirhousehold
Percent (n=304)
Do you typically allow open hunting access, allow hunting access by permission, or allow limited hunting access to family and friends
only? (Landowners)
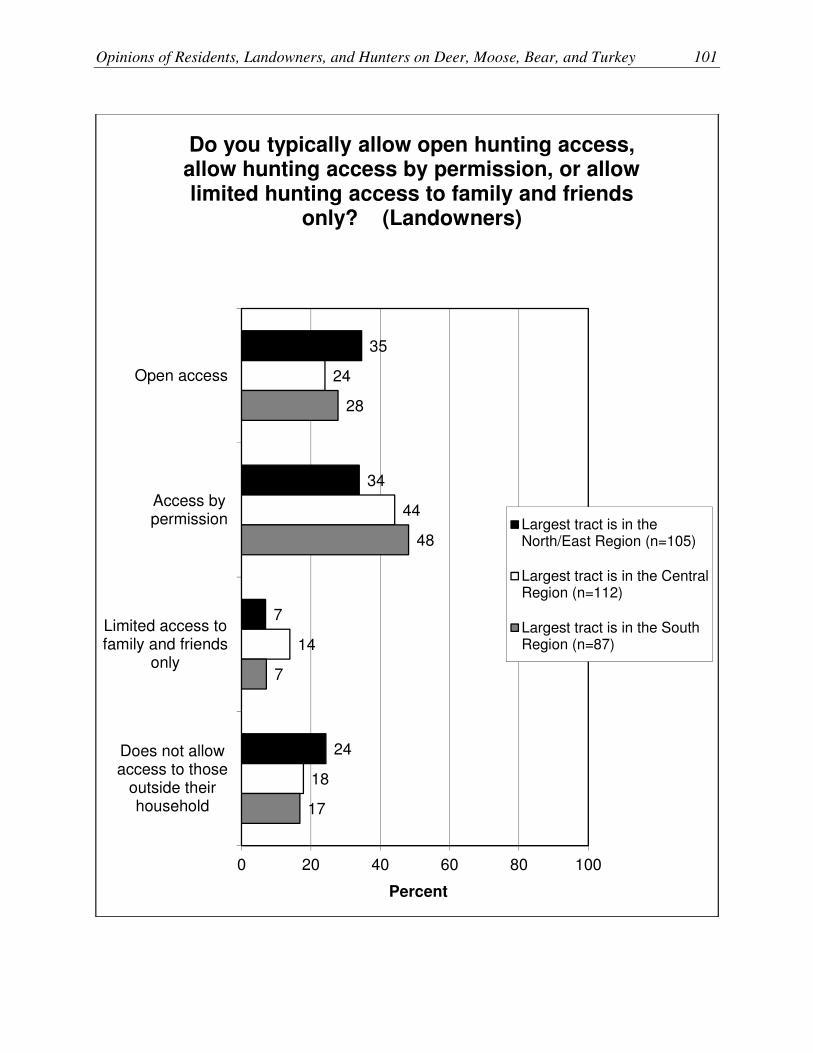
Opinions of Residents, Landowners, and Hunters on Deer, Moose, Bear, and Turkey 101
35
34
7
24
24
44
14
18
28
48
7
17
0 20 40 60 80 100
Open access
Access bypermission
Limited access tofamily and friends
only
Does not allowaccess to those
outside theirhousehold
Percent
Do you typically allow open hunting access, allow hunting access by permission, or allow limited hunting access to family and friends
only? (Landowners)
Largest tract is in theNorth/East Region (n=105)
Largest tract is in the CentralRegion (n=112)
Largest tract is in the SouthRegion (n=87)

102 Responsive Management
20
14
12
11
10
14
0 20 40 60 80 100
Disapprove of hunting or harminganimals
Firearm-related safety concerns
Disrespectful behavior by hunters
Property damage
Do not want strangers on land
Other
Percent (n=53)
Mu
ltip
le R
es
po
ns
es
All
ow
ed
What are the main reasons you do not allow access to the land for hunting other than for
family and friends? (Asked of those who do not allow access beyond members of their
household) (Landowners)
Opinions of Residents, Landowners, and Hunters on Deer, Moose, Bear, and Turkey 103
HUNTING LICENSING AND FEES
� The majority of hunters think the current hunting license fees are about right (74%);
otherwise, 22% say that they are too much, compared to only 3% who say that they are not
high enough.
� Hunters’ disagreement exceeds their agreement that the current requirement to purchase
separate permits for some species prevents them from hunting those species as much as they
would like. While a majority (59%) disagree, a substantial percentage (35%) agree.

104 Responsive Management
22
74
3
2
0 20 40 60 80 100
Too much
About right
Not enough
Don't know
Percent (n=956)
In general, do you think current hunting license fees are too much, about right, or not enough?
(Hunters)

Opinions of Residents, Landowners, and Hunters on Deer, Moose, Bear, and Turkey 105
21
14
5
27
32
1
0 20 40 60 80 100
Strongly agree
Moderately agree
Neither agree nordisagree
Moderatelydisagree
Strongly disagree
Don't know
Percent (n=956)
Do you agree or disagree that the current requirement to purchase separate permits for some species, such as wild turkey and bear,
prevents you from hunting for those species as much as you would like? (Hunters)
35%
59%

106 Responsive Management
OPINIONS ON REGULATIONS AND SPECIFIC ASPECTS OF HUNTING
� Opinion is closely split regarding a law requiring that harvested bucks have at least 3 points
on one side: 46% of hunters would support, but 50% would oppose.
• Most of the differences among the regions (based on the region in which the hunter most
often hunted) are in the strong responses rather than overall support (ranging from 42%
to 53%) or overall opposition (ranging from 43% to 54%).
� Moose hunters and those who typically apply for a permit (even if they did not hunt moose)
were asked which month they most preferred for the moose hunting season. The majority of
these moose hunters/potential moose hunters chose October (60%), distantly followed by
September (22%) and November (12%).
• In the regional analysis, the North/East Region has a higher percentage than the other
regions choosing September, but the difference is slight.
• Follow-up questions asked respondents why they would most prefer having the season in
the month they chose. Graphs are shown for those preferring September, October, and
November.
o Those who prefer September most commonly cite the timing of the rut/that there is
greater moose activity then.
o Those who prefer October most commonly say that they prefer the weather then, with
the timing of the rut/greater moose activity being the second ranked reason.
o Those who prefer November most commonly say that they prefer the weather then,
with the timing of the rut/more moose activity a distant second.
� A 6-day season with fewer hunters is preferred over a 12-day season with more hunters:
among moose hunters/potential moose hunters, 58% choose the 6-day season, while 34%
choose the 12-day season.
• The regional differences are slight, but hunters who most often hunt in the Central
Region are the most likely of hunters of the three regions to say that they would prefer a
12-day season.
Opinions of Residents, Landowners, and Hunters on Deer, Moose, Bear, and Turkey 107
� Moose hunters and those who typically apply for a permit were asked to choose among two
alternatives: having the Department offer more moose permits with a lower harvest rate or
offering fewer moose permits with a higher harvest rate. Although a slight majority of
moose hunters/potential moose hunters (52%) choose fewer permits/higher harvest rate over
the alternative, there is still a substantial percentage (38%) who choose more permits/lower
harvest rate.
• In the regional analysis by where the hunter most often hunts, those who most often hunt
in the South Region are the most likely to want fewer permits/higher harvest rate.
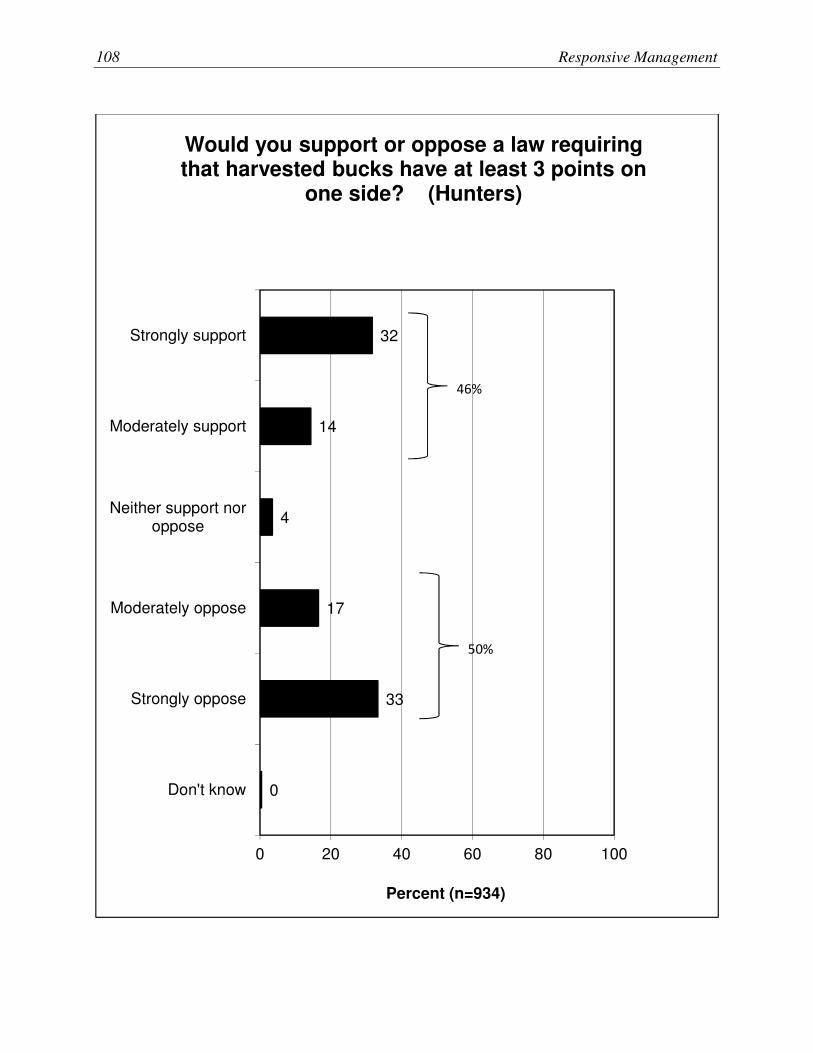
108 Responsive Management
32
14
4
17
33
0
0 20 40 60 80 100
Strongly support
Moderately support
Neither support noroppose
Moderately oppose
Strongly oppose
Don't know
Percent (n=934)
Would you support or oppose a law requiring that harvested bucks have at least 3 points on
one side? (Hunters)
46%
50%

Opinions of Residents, Landowners, and Hunters on Deer, Moose, Bear, and Turkey 109
38
14
4
17
26
1
29
13
3
19
36
1
26
17
4
12
40
0
0 20 40 60 80 100
Strongly support
Moderatelysupport
Neither supportnor oppose
Moderatelyoppose
Strongly oppose
Don't know
Percent
Would you support or oppose a law requiring that harvested bucks have at least 3 points on
one side? (Hunters)
Most often hunts in theNorth/East Region (n=382)
Most often hunts in theCentral Region (n=320)
Most often hunts in the SouthRegion (n=232)
53% * 42%
44% *
43% 54% *
52%
* Rounding on graph causes apparent
discrepancy in sum; calculation made on unrounded numbers.

110 Responsive Management
22
60
12
4
1
0 20 40 60 80 100
September
October
November
No preference
Don't know
Percent (n=557)
Which month do you most prefer for the moose hunting season? (Asked of those who hunted
moose in Maine in the past 15 years or typically apply for a moose permit.) (Hunters)

Opinions of Residents, Landowners, and Hunters on Deer, Moose, Bear, and Turkey 111
25
53
14
5
2
21
64
11
3
1
19
65
10
6
0
0 20 40 60 80 100
September
October
November
No preference
Don't know
Percent
Which month do you most prefer for the moose hunting season? (Asked of those who hunted
moose in Maine in the past 15 years or typically apply for a moose permit.) (Hunters)
Most often hunts in theNorth/East Region (n=257)
Most often hunts in theCentral Region (n=173)
Most often hunts in the SouthRegion (n=127)

112 Responsive Management
60
17
13
6
7
2
0 20 40 60 80 100
Timing of rutting season / greater moose activity
Weather preference
Lack of conflict with other hunting seasons
Fits better with personal schedule
Other
Don't know
Percent (n=125)
Mu
ltip
le R
es
po
ns
es
All
ow
ed
Why do you most prefer for the moose hunting season to be in September? (Asked of those
who hunted moose in Maine in the past 15 years or typically apply for a moose permit and prefer
for moose hunting in September.) (Hunters)

Opinions of Residents, Landowners, and Hunters on Deer, Moose, Bear, and Turkey 113
50
28
15
6
6
8
2
0 20 40 60 80 100
Weather preference
Timing of rutting season / greater moose activity
Lack of conflict with other hunting seasons
Overlap with other hunting seasons
Fits better with personal schedule
Other
Don't know
Percent (n=330)
Mu
ltip
le R
es
po
ns
es
All
ow
ed
Why do you most prefer for the moose hunting season to be in October? (Asked of those who hunted moose in Maine in the past 15 years or
typically apply for a moose permit and prefer for moose hunting in October.) (Hunters)

114 Responsive Management
54
19
5
5
4
16
3
0 20 40 60 80 100
Weather preference
Timing of rutting season / greater moose activity
Lack of conflict with other hunting seasons
Overlap with other hunting seasons
Fits better with personal schedule
Other
Don't know
Percent (n=71)
Mu
ltip
le R
es
po
ns
es
All
ow
ed
Why do you most prefer for the moose hunting season to be in November? (Asked of those
who hunted moose in Maine in the past 15 years or typically apply for a moose permit and prefer
for moose hunting in November.) (Hunters)
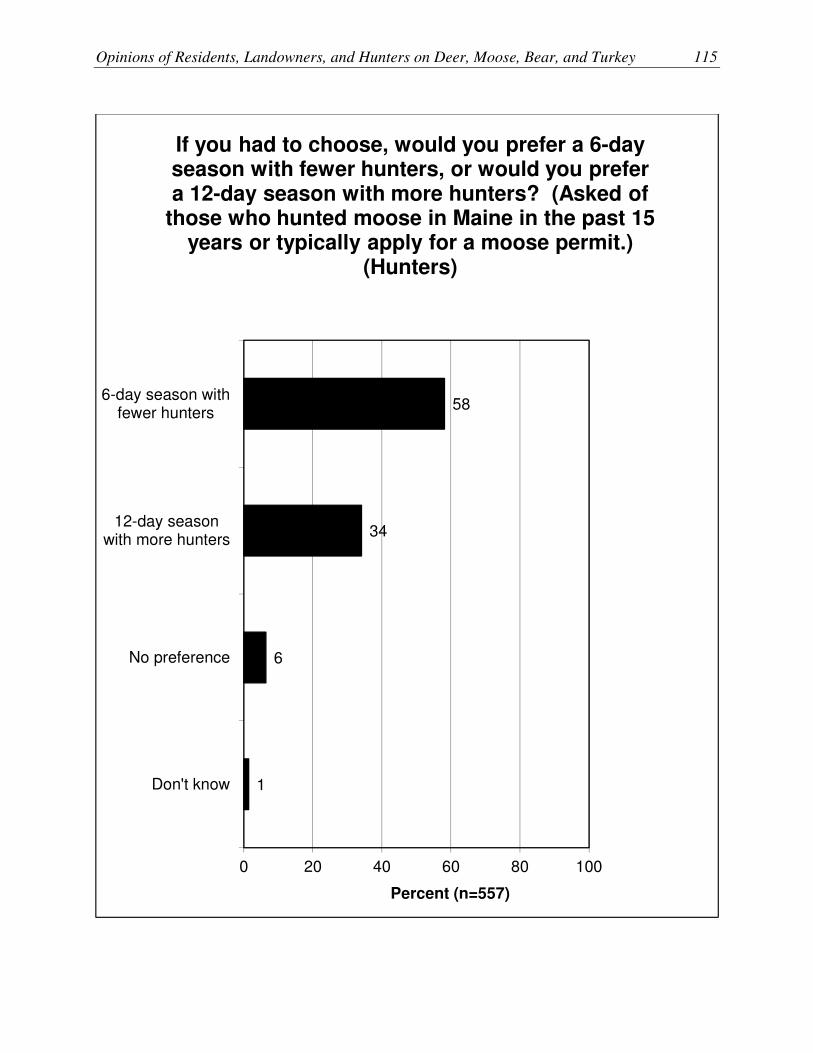
Opinions of Residents, Landowners, and Hunters on Deer, Moose, Bear, and Turkey 115
58
34
6
1
0 20 40 60 80 100
6-day season withfewer hunters
12-day seasonwith more hunters
No preference
Don't know
Percent (n=557)
If you had to choose, would you prefer a 6-day season with fewer hunters, or would you prefer a 12-day season with more hunters? (Asked of
those who hunted moose in Maine in the past 15 years or typically apply for a moose permit.)
(Hunters)

116 Responsive Management
62
29
7
3
53
40
6
1
61
33
6
0
0 20 40 60 80 100
6-day season withfewer hunters
12-day seasonwith more hunters
No preference
Don't know
Percent
If you had to choose, would you prefer a 6-day season with fewer hunters, or would you prefer a 12-day season with more hunters? (Asked of
those who hunted moose in Maine in the past 15 years or typically apply for a moose permit.)
(Hunters)
Most often hunts in theNorth/East Region (n=257)
Most often hunts in theCentral Region (n=173)
Most often hunts in the SouthRegion (n=127)

Opinions of Residents, Landowners, and Hunters on Deer, Moose, Bear, and Turkey 117
38
52
9
0 20 40 60 80 100
More permitswith lower
harvest rate
Fewer permitswith higherharvest rate
Don't know
Percent (n=557)
Would you prefer the Department offer more moose permits but a lower harvest success rate
or fewer moose permits with a higher harvest success rate? (Of those who hunted moose in ME in the past 15 years or typically apply for a
moose permit.) (Hunters)
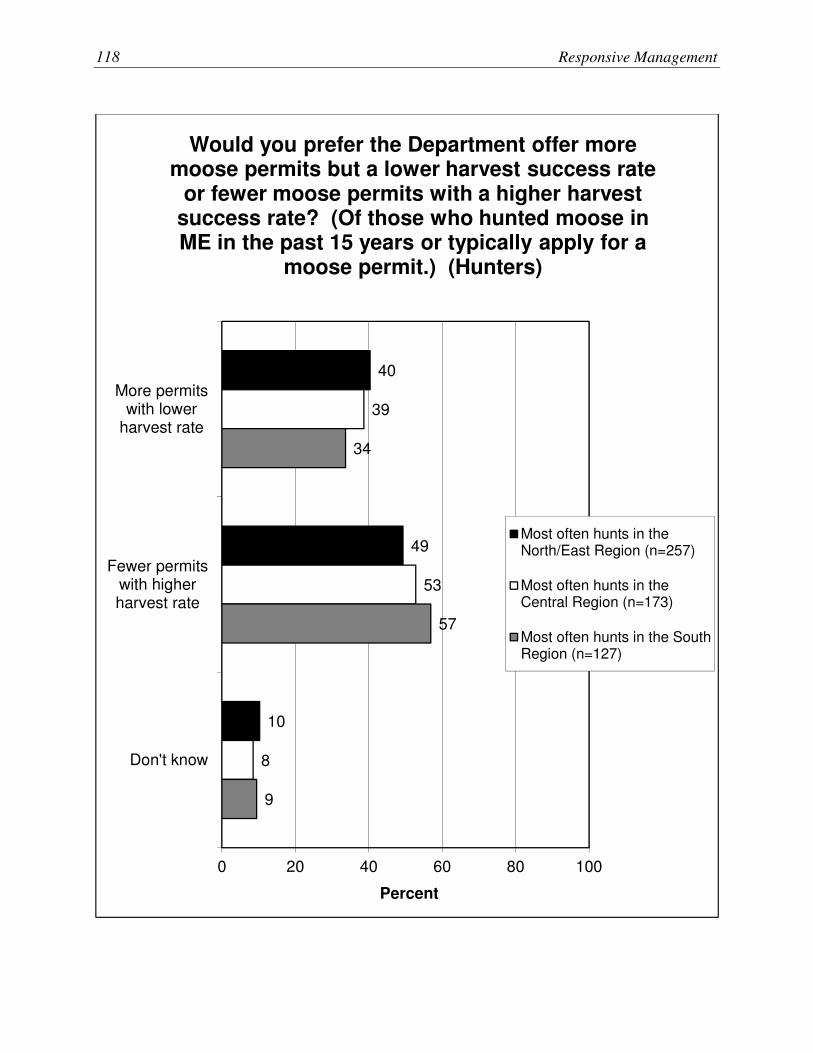
118 Responsive Management
40
49
10
39
53
8
34
57
9
0 20 40 60 80 100
More permitswith lower
harvest rate
Fewer permitswith higherharvest rate
Don't know
Percent
Would you prefer the Department offer more moose permits but a lower harvest success rate
or fewer moose permits with a higher harvest success rate? (Of those who hunted moose in ME in the past 15 years or typically apply for a
moose permit.) (Hunters)
Most often hunts in theNorth/East Region (n=257)
Most often hunts in theCentral Region (n=173)
Most often hunts in the SouthRegion (n=127)

Opinions of Residents, Landowners, and Hunters on Deer, Moose, Bear, and Turkey 119
LAND MANAGEMENT IN GENERAL
� Just under half of landowners (48%) actively manage for wildlife on their land.
• There is little difference regionally, based on where landowners’ largest tract of land is
located.
� The survey asked respondents to rate the management of each of the four primary species of
interest in the survey, the results of which are shown individually in the following sections
about deer management, moose management, bear management, and turkey management.
However, the results are first shown here with all four species compared.
• Among the findings: hunters have a markedly better opinion regarding bear management
than do the general population or landowners. Otherwise, those three groups are similar
to each other.
o Four graphs are shown: excellent by itself, excellent and good combined, fair and
poor combined, and then poor by itself.
o Another way to look at the same data is presented. For each group, their ratings for
each species are shown in a stacked-bar graph: a graph of the general population’s
ratings of each species, a graph of landowners’ ratings, and a graph of hunters’
ratings.
o Regional results are shown for the general population, which show that the Central
Region tends to give the most positive ratings and the North/East Region tends to
give the most negative ratings.
o In the landowners survey, the results of this question were examined based on where
the landowner’s land was located. The best ratings of deer management and moose
management are from landowners whose land is in the South and Central Regions;
the best ratings of bear management are from landowners whose land is in the
North/East Region. For turkey, the ratings are about the same among the regions.
o Among hunters, regional results show that hunters who live in the South Region are
the most positive about deer and turkey; hunters living in the North/East Region are
the most negative about deer and moose management. (All regions are about the
same regarding bear.)

120 Responsive Management
� The last question in this section concerned coyote management. There is much more support
for (from 71% to 91%) than opposition to (from 6% to 20%) a coyote management program,
which may cause an increase in deer and/or wild turkey populations in local areas.
• The regional analysis of the general population results shows that the most support is in
the North/East Region (79% support) and the least support is in the South Region (66%
support).
• Among landowners, the regional analysis finds the most opposition to landowners whose
largest tract is in the Central Region.

Opinions of Residents, Landowners, and Hunters on Deer, Moose, Bear, and Turkey 121
48
48
4
0 20 40 60 80 100
Yes
No
Don't know
Percent (n=304)
Do you actively manage for wildlife on your land? (Landowners)
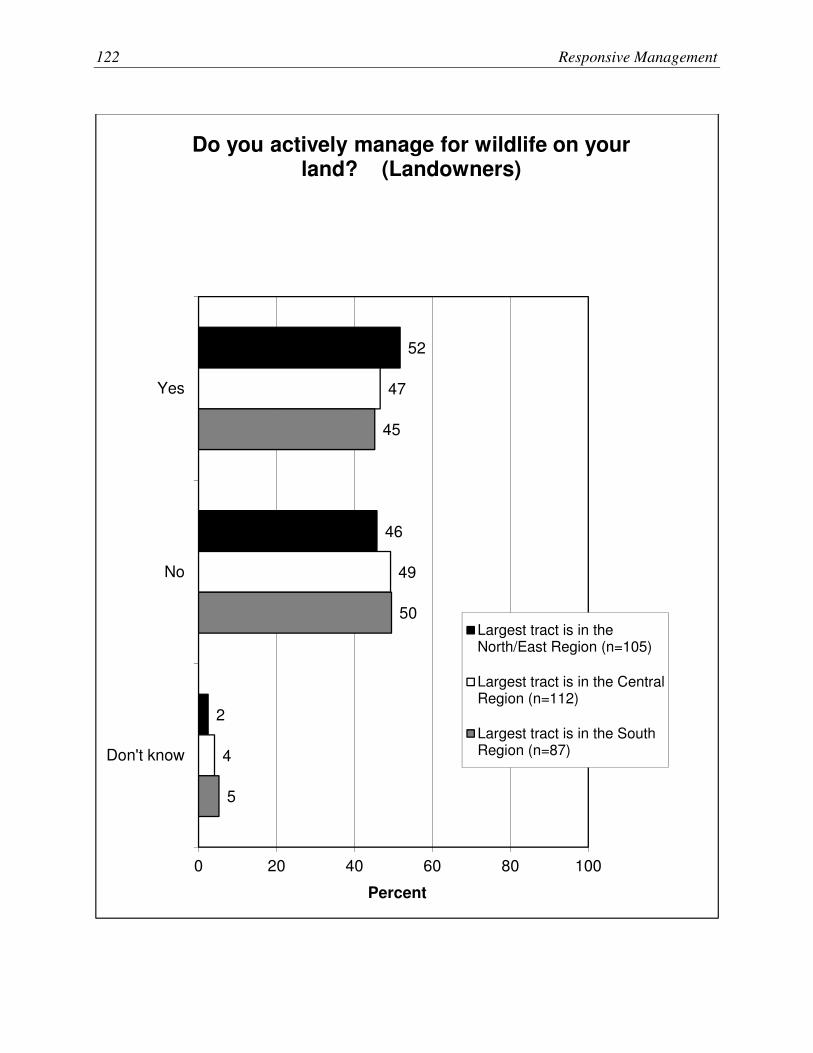
122 Responsive Management
52
46
2
47
49
4
45
50
5
0 20 40 60 80 100
Yes
No
Don't know
Percent
Do you actively manage for wildlife on your land? (Landowners)
Largest tract is in theNorth/East Region (n=105)
Largest tract is in the CentralRegion (n=112)
Largest tract is in the SouthRegion (n=87)

Opinions of Residents, Landowners, and Hunters on Deer, Moose, Bear, and Turkey 123
24
24
23
18
20
19
25
18
21
28
36
24
0 20 40 60 80 100
Deer
Moose
Bear
Turkey
Percent
Percent of respondents who rated the management of each of the following species as
excellent in Maine. (Overall)
General Population (n=933)
Landowners (n=304)
Hunters (n=956)

124 Responsive Management
67
63
57
49
70
63
57
52
61
67
72
58
0 20 40 60 80 100
Deer
Moose
Bear
Turkey
Percent
Percent of respondents who rated the management of each of the following species as
excellent or good in Maine. (Overall)
General Population (n=933)
Landowners (n=304)
Hunters (n=956)
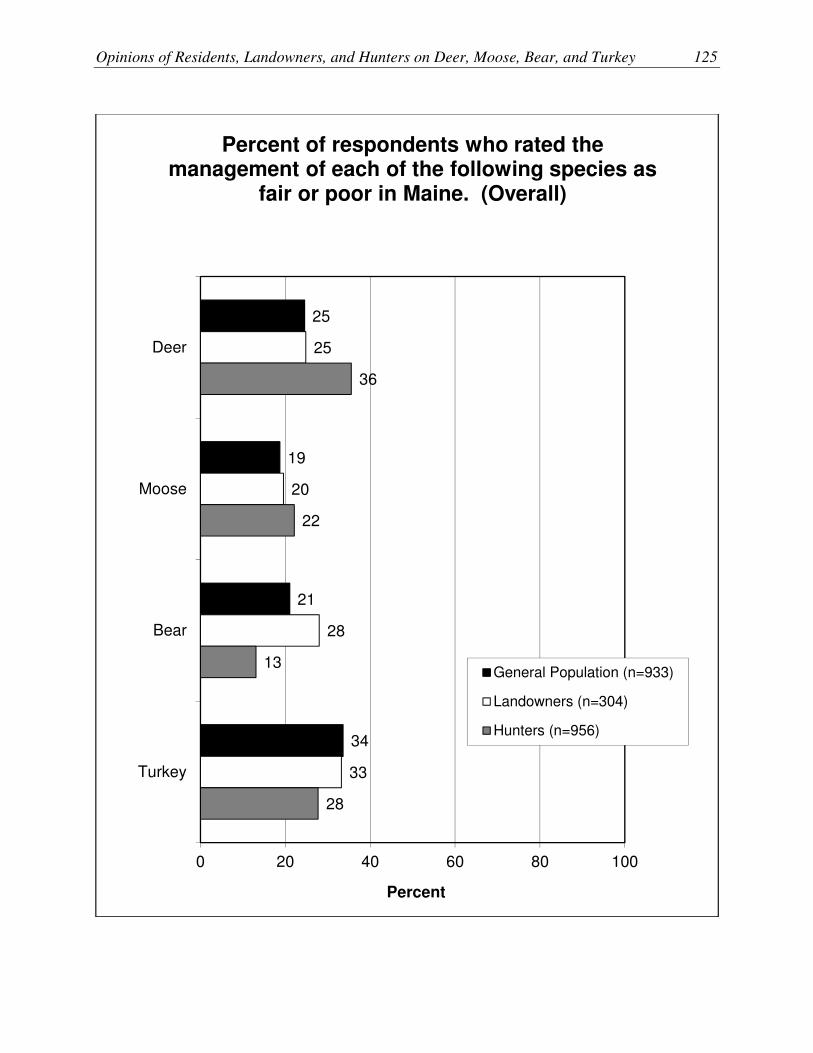
Opinions of Residents, Landowners, and Hunters on Deer, Moose, Bear, and Turkey 125
25
19
21
34
25
20
28
33
36
22
13
28
0 20 40 60 80 100
Deer
Moose
Bear
Turkey
Percent
Percent of respondents who rated the management of each of the following species as
fair or poor in Maine. (Overall)
General Population (n=933)
Landowners (n=304)
Hunters (n=956)

126 Responsive Management
5
4
5
11
5
5
6
17
10
6
3
13
0 20 40 60 80 100
Deer
Moose
Bear
Turkey
Percent
Percent of respondents who rated the management of each of the following species as
poor in Maine. (Overall)
General Population (n=933)
Landowners (n=304)
Hunters (n=956)

Opinions of Residents, Landowners, and Hunters on Deer, Moose, Bear, and Turkey 127
24
24
23
18
43
39
34
31
19
15
16
22
5
4
5
11
8
18
22
18
0 20 40 60 80 100
Deer
Moose
Bear
Turkey
Percent (n=933)
Percent of respondents who rated the management of each of the following species as
each of the levels shown in Maine. (General Population)
Excellent
Good
Fair
Poor
Don't know

128 Responsive Management
20
19
25
18
51
44
32
34
20
15
22
16
5
5
6
17
5
18
15
15
0 20 40 60 80 100
Deer
Moose
Bear
Turkey
Percent (n=304)
Percent of respondents who rated the management of each of the following species as
each of the levels shown in Maine. (Landowners)
Excellent
Good
Fair
Poor
Don't know

Opinions of Residents, Landowners, and Hunters on Deer, Moose, Bear, and Turkey 129
36
28
24
21
36
40
34
40
10
16
15
25
3
6
13
10
15
11
14
3
0 20 40 60 80 100
Bear
Moose
Turkey
Deer
Percent (n=956)
Percent of respondents who rated the management of each of the following species as
each of the levels shown in Maine. (Hunters)Excellent
Good
Fair
Poor
Don't know

130 Responsive Management
58
61
58
45
70
70
58
44
68
58
55
54
0 20 40 60 80 100
Deer
Moose
Bear
Turkey
Percent
Percent of respondents who rated the management of each of the following species as
excellent or good in Maine. (General Population)
Lives in the North/East Region (n=301)
Lives in the Central Region (n=331)
Lives in the South Region (n=301)

Opinions of Residents, Landowners, and Hunters on Deer, Moose, Bear, and Turkey 131
37
30
27
30
26
19
22
43
18
14
19
26
0 20 40 60 80 100
Deer
Moose
Bear
Turkey
Percent
Percent of respondents who rated the management of each of the following species as
fair or poor in Maine. (General Population)
Lives in the North/East Region (n=301)
Lives in the Central Region (n=331)
Lives in the South Region (n=301)

132 Responsive Management
59
56
70
53
74
63
51
52
75
69
54
51
0 20 40 60 80 100
Deer
Moose
Bear
Turkey
Percent
Percent of respondents who rated the management of each of the following species as
excellent or good in Maine. (Landowners)
Largest tract is in the North/East Region (n=105)
Largest tract is in the Central Region (n=112)
Largest tract is in the South Region (n=87)

Opinions of Residents, Landowners, and Hunters on Deer, Moose, Bear, and Turkey 133
36
27
22
30
23
17
31
31
15
16
29
41
0 20 40 60 80 100
Deer
Moose
Bear
Turkey
Percent
Percent of respondents who rated the management of each of the following species as
fair or poor in Maine. (Landowners)
Largest tract is in the North/East Region (n=105)
Largest tract is in the Central Region (n=112)
Largest tract is in the South Region (n=87)

134 Responsive Management
49
63
75
56
62
68
72
57
71
72
72
70
59
66
69
48
0 20 40 60 80 100
Deer
Moose
Bear
Turkey
Percent
Percent of respondents who rated the management of each of the following species as
excellent or good in Maine. (Hunters)
Lives in the North/East Region (n=262)
Lives in the Central Region (n=258)
Lives in the South Region (n=256)
Nonresident (n=180)
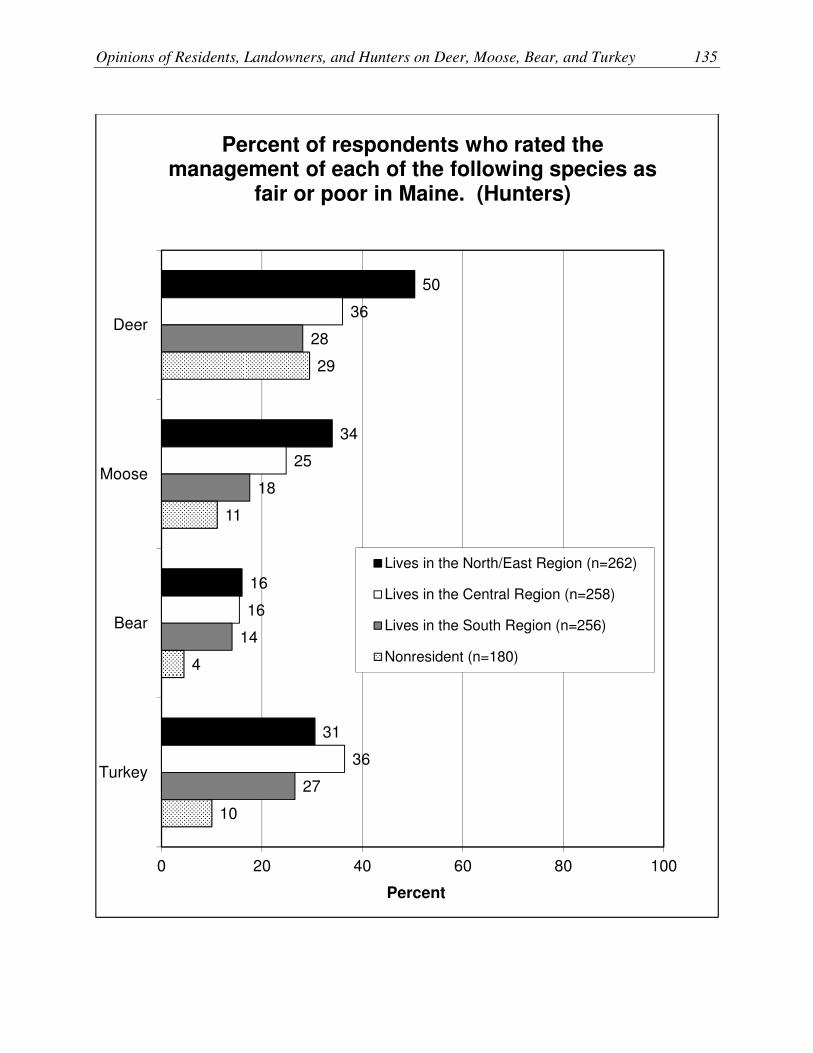
Opinions of Residents, Landowners, and Hunters on Deer, Moose, Bear, and Turkey 135
50
34
16
31
36
25
16
36
28
18
14
27
29
11
4
10
0 20 40 60 80 100
Deer
Moose
Bear
Turkey
Percent
Percent of respondents who rated the management of each of the following species as
fair or poor in Maine. (Hunters)
Lives in the North/East Region (n=262)
Lives in the Central Region (n=258)
Lives in the South Region (n=256)
Nonresident (n=180)

136 Responsive Management
47
23
6
11
8
5
59
14
4
7
12
4
80
11
2
3
4
1
0 20 40 60 80 100
Strongly support
Moderatelysupport
Neither supportnor oppose
Moderatelyoppose
Strongly oppose
Don't know
Percent
Would you support or oppose a coyote management program in Maine, which may
cause an increase in deer and/or wild turkeys in local areas? (Overall)
General Population (n=933)
Landowners (n=304)
Hunters (n=956)
71% *
72% *
91%
19%
20% *
6% * * Rounding on graph causes apparent
discrepancy in sum; calculation made on unrounded numbers.

Opinions of Residents, Landowners, and Hunters on Deer, Moose, Bear, and Turkey 137
62
17
0
6
10
4
47
26
6
9
7
5
42
23
7
13
8
6
0 20 40 60 80 100
Strongly support
Moderatelysupport
Neither supportnor oppose
Moderatelyoppose
Strongly oppose
Don't know
Percent
Would you support or oppose a coyote management program in Maine, which may
cause an increase in deer and/or wild turkeys in local areas? (General Population)
Lives in the North/EastRegion (n=301)
Lives in the Central Region(n=331)
Lives in the South Region(n=301)
79% 73%
66% *
17% * 16% 21%
* Rounding on graph causes apparent
discrepancy in sum; calculation made on unrounded numbers.
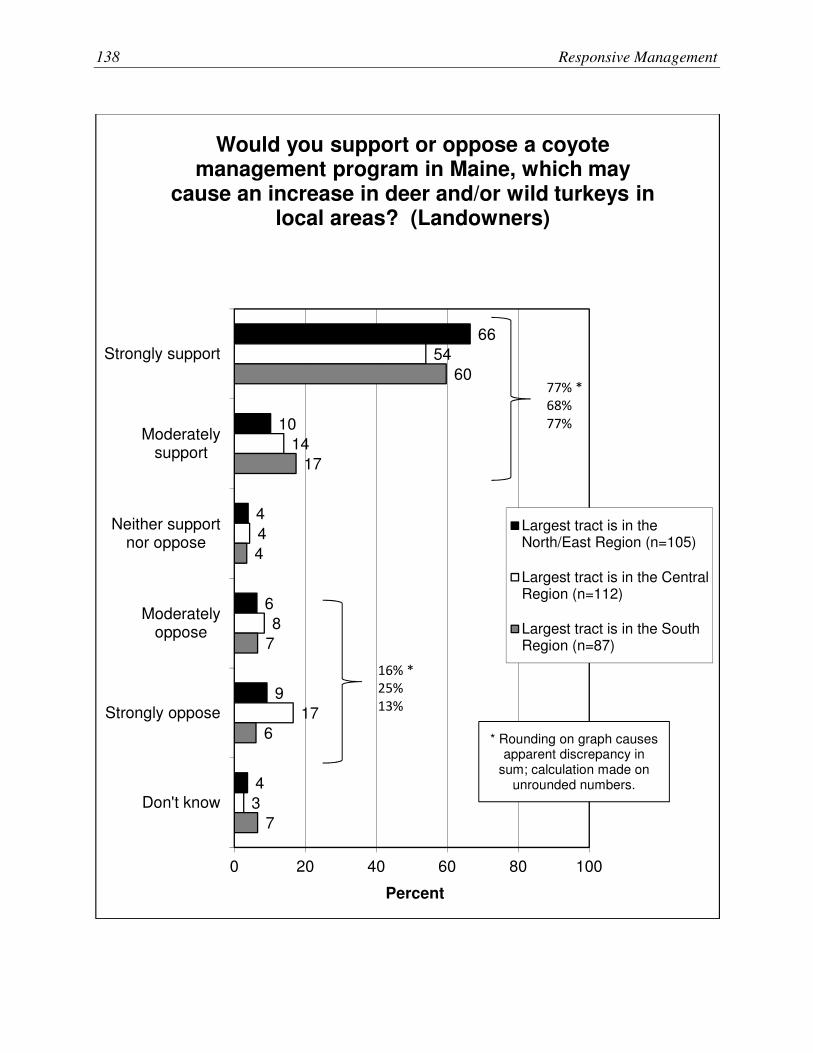
138 Responsive Management
66
10
4
6
9
4
54
14
4
8
17
3
60
17
4
7
6
7
0 20 40 60 80 100
Strongly support
Moderatelysupport
Neither supportnor oppose
Moderatelyoppose
Strongly oppose
Don't know
Percent
Would you support or oppose a coyote management program in Maine, which may
cause an increase in deer and/or wild turkeys in local areas? (Landowners)
Largest tract is in theNorth/East Region (n=105)
Largest tract is in the CentralRegion (n=112)
Largest tract is in the SouthRegion (n=87)
16% * 25% 13%
77% * 68%
77%
* Rounding on graph causes apparent discrepancy in
sum; calculation made on unrounded numbers.

Opinions of Residents, Landowners, and Hunters on Deer, Moose, Bear, and Turkey 139
DEER MANAGEMENT
� Ratings of deer management in Maine are more positive than negative, although there are
substantial percentages giving ratings in the lower half of the scale. While from 61% to 70%
give a rating of excellent or good (the top half of the scale), from 25% to 36% give a rating of
fair or poor.
• In the general population survey, North/East Region residents are more likely than are
residents of the other regions to give negative ratings (37% of them give a fair or poor
rating, compared to 26% of Central Region residents and 18% of South Region
residents).
• Among landowners, the best ratings are in the South Region; the worst are in the
North/East Region.
• The regional analysis of the hunter survey found that hunters living in the North/East
Region give the worst ratings, compared to the other regions and nonresidents. (Note that
this regional analysis was done based on where the hunter lived.)
� Another indication of opinion on deer management comes in the question regarding whether
the deer population in the area where the respondent lives should be increased, remain the
same, or be decreased. The majority of each group says it should remain the same (from
57% to 73%). Otherwise, each group would rather the population be increased (20% of the
general population, 19% of landowners, and 34% of hunters—the latter perhaps motivated by
their desire to have a good chance of harvest) than decreased (7% of all three groups).
• Regional results of the general population survey show that North/East Region residents
are the most likely, compared to residents of the other regions, to want to see an increase
(33% of North/East Region residents want an increase, compared to 23% of Central
Region residents and 13% of South Region residents).
• The regional results of the hunter survey also show those living in the North/East Region
wanting an increase in the deer population where they live.
o Those who wanted to see a decrease in the deer population were asked why they
wanted a decrease. The most common reasons are that respondents feel that there is
currently an overabundance in general; other more concrete responses include the risk
of vehicle collisions, damage to property, damage to habitat, and risk of disease.

140 Responsive Management
� Those who supported an increase in the deer population were asked about a series of possible
consequences of an increase in the deer population. For each, they were asked if they would
support or oppose an increase in the deer population.
• Negative ecological consequences cause the most former supporters to no longer support.
Poor health overall for the deer herd has the least support (only 15% to 23% still support
an increase with this consequence), and the consequence that more deer would die from
starvation during winter also has low support (only 12% to 27%). Also with less than a
majority of any group in support are less food and poorer quality habitat for other wildlife
(support ranges from 29% to 41%) and an increased risk of disease such as Lyme disease
(36% to 46%).
• The human-centered reasons do not cause much defection from support, as a majority of
each group still support an increase even if Department biologists would spend more time
on deer management and less on other species, that private citizens would be required to
resolve deer nuisance issues on their own, that there would be more damage to gardens
and landscaping, and that there might be more damage to agriculture.
o The results of all nine possible consequences are shown together on four graphs:
strongly support by itself, strongly and moderately support combined, strongly and
moderately oppose combined, and then strongly oppose by itself.
o The regional analysis shows that South Region residents in the general population
survey have more opposition than residents of other regions for increasing the deer
herd if it means any of the negative ecological consequences (poor health of deer,
more starvation deaths, less food/poorer quality habitat). Also, Central Region
residents appear to be the most concerned about damage to gardens and landscaping.
� The survey presented to respondents a series of eight possible factors that could be
considered in the management of deer. For each factor, respondents rated it from 0 (not at all
important) to 10 (extremely important).
• The top-rated factor is the health of the typical deer in the herd (mean ratings of 8.1 or
higher)—an ecological factor. Then comes providing deer hunting opportunities (mean
of 7.6 or higher), the opportunity to see deer (6.9 or higher), and then another ecological
one—impacts on habitat (6.5 or higher).

Opinions of Residents, Landowners, and Hunters on Deer, Moose, Bear, and Turkey 141
• Damage to gardens/landscaping damage to agriculture are the lowest rated.
o The regional breakdown of the landowner survey shows that landowners whose
largest tract is located in the South Region give the highest ratings of the three
regions to damage to agricultural crops and damage to gardens and ornamental plants
(although these are not the highest rated factors in any of the regions).
� Support for legal deer hunting as a method to help manage deer is high: from 92% to 98%
support, most of it strong support. Only 4% or less oppose it.
� A series of possible deer management options in areas where deer become overabundant was
presented in the survey. For each, respondents were asked whether they would support or
oppose each one. There were seven possible options presented.
• For all options except two, there are majorities in support. At the top are the creation of a
special archery season, targeted doe permits, and a controlled hunt with a limited number
of hunters (the lowest support among any group for any of these three was 72%).
• The two items with less than a majority of all three groups in support are a longer
firearms season (supported by a majority of the general population and hunters, but just
less than half of landowners) and sharpshooters (no more than 48% of any group in
support).
o Four graphs are shown: strongly support by itself, strongly and moderately support
combined, strongly and moderately oppose combined, and then strongly oppose by
itself.
o The regional analysis found that overall support among the general population was
about the same in the three regions, but strong support had some differences, with
North/East Region residents being more supportive than those from other regions for
a longer firearms season and for a controlled hunt with a limited number of hunters.
o The landowner survey’s regional analysis (by the region in which the largest tract is
located) suggests that those whose largest tract is in the South Region are markedly
more supportive of a controlled hunt and for sharpshooters. On the other hand,
landowners whose largest tract is in the North/East are more supportive of allowing
hunters to harvest multiple deer and for having a longer firearms season.

142 Responsive Management
o In the regional analysis of the hunter survey, there were marked differences among
the regions when looking at strong support. The South Region and nonresidents tend
to be more supportive of the options, particularly an additional legal hunting season,
targeted doe permits, allowing harvest of multiple deer, and a controlled hunt with a
limited number of hunters.
� A final question in this section concerned deer and moose together. First, respondents were
informed of the following: “Because moose and deer* have very different habitat
requirements, it is difficult to have large numbers of moose and deer* in the same area.”
Respondents were then asked to choose on a continuum from abundant moose/very few deer
to relatively few moose/moderate numbers of deer in northern Maine.* Respondents favor
lower moose numbers, most commonly choosing either the lowest moose or the middle
option in the continuum; relatively few chose to have abundant moose/few deer.
• In the general population survey, the regions are slightly different on this, with
North/East Region residents the most likely of the three regions to want relatively few
moose with moderate numbers of deer.
• In the hunter survey, the regional results mirror those of the general population: hunters
who live in the North/East Region are the most likely to want few moose/moderate
numbers of deer.
o *The sample was halved on this question, with one half getting “moose and deer”
(i.e. in that order) and the other half getting “deer and moose” in the wording. Also,
northern Maine was defined as referring to the counties of Aroostook, Piscataquis,
northern Franklin, northern Somerset, and northern Penobscot.

Opinions of Residents, Landowners, and Hunters on Deer, Moose, Bear, and Turkey 143
24
43
19
5
8
20
51
20
5
5
21
40
25
10
3
0 20 40 60 80 100
Excellent
Good
Fair
Poor
Don't know
Percent
Overall, how would you rate deer management in Maine? (Overall)
General Population (n=933)
Landowners (n=304)
Hunters (n=956)
67%
70% *
61%
25% *
25%
36% * * Rounding on graph causes apparent discrepancy in
sum; calculation made on unrounded numbers.
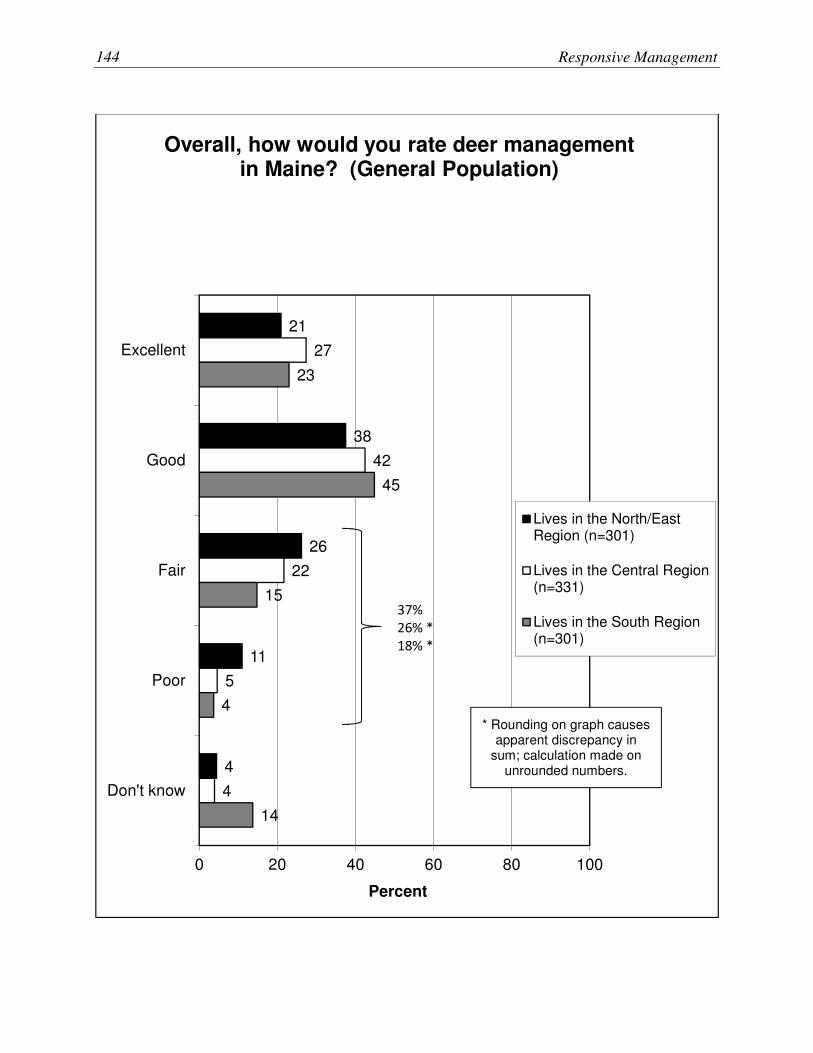
144 Responsive Management
21
38
26
11
4
27
42
22
5
4
23
45
15
4
14
0 20 40 60 80 100
Excellent
Good
Fair
Poor
Don't know
Percent
Overall, how would you rate deer management in Maine? (General Population)
Lives in the North/EastRegion (n=301)
Lives in the Central Region(n=331)
Lives in the South Region(n=301)
37% 26% * 18% *
* Rounding on graph causes apparent discrepancy in
sum; calculation made on unrounded numbers.
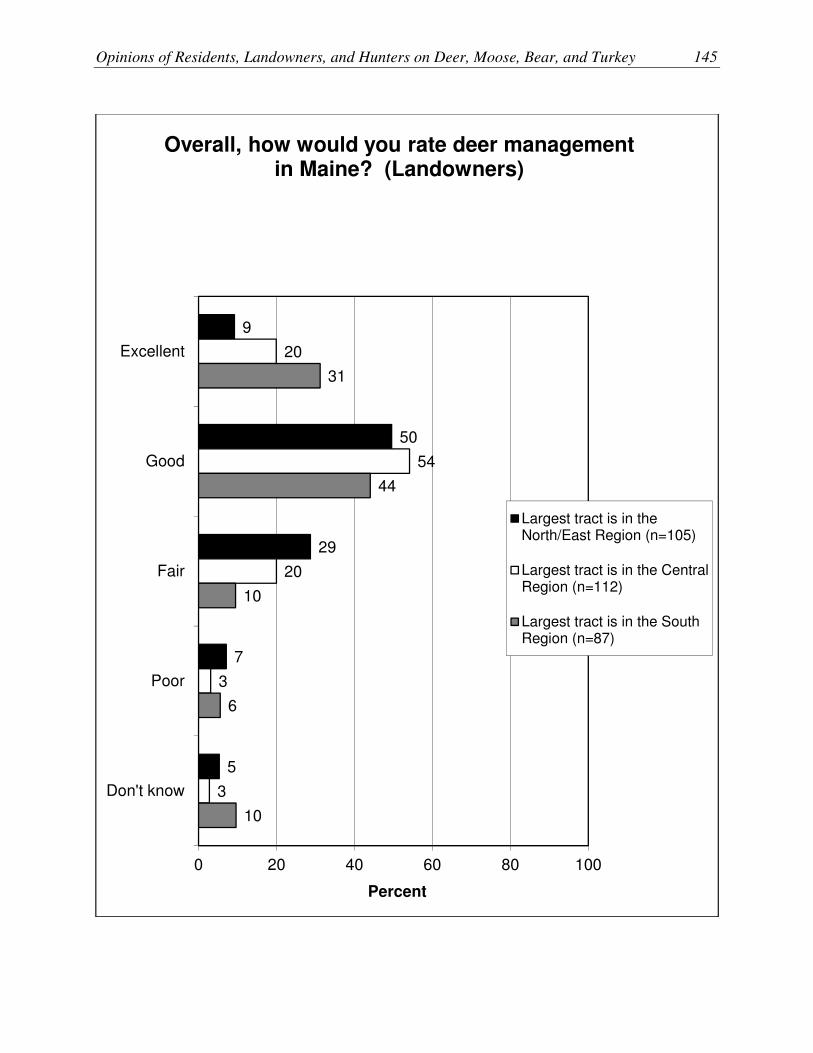
Opinions of Residents, Landowners, and Hunters on Deer, Moose, Bear, and Turkey 145
9
50
29
7
5
20
54
20
3
3
31
44
10
6
10
0 20 40 60 80 100
Excellent
Good
Fair
Poor
Don't know
Percent
Overall, how would you rate deer management in Maine? (Landowners)
Largest tract is in theNorth/East Region (n=105)
Largest tract is in the CentralRegion (n=112)
Largest tract is in the SouthRegion (n=87)

146 Responsive Management
16
32
33
18
1
22
40
26
10
2
29
43
21
7
1
15
44
22
8
12
0 20 40 60 80 100
Excellent
Good
Fair
Poor
Don't know
Percent
Overall, how would you rate deer management in Maine? (Hunters)
Lives in the North/EastRegion (n=262)
Lives in the Central Region(n=258)
Lives in the South Region(n=256)
Nonresident (n=180)

Opinions of Residents, Landowners, and Hunters on Deer, Moose, Bear, and Turkey 147
20
65
7
6
2
19
73
7
0
2
34
57
7
0
1
0 20 40 60 80 100
Increased
Remain the same
Decreased
There are no deerin the area
Don't know
Percent
In your opinion, should the deer population in the area where you live be increased, remain the same, or be decreased? Or are there no deer in
the area where you live? (Asked of Maine residents.) (Overall)
General Population (n=933)
Landowners (n=304)
Hunters (n=376)

148 Responsive Management
33
53
10
1
3
23
63
4
8
2
13
70
8
6
3
0 20 40 60 80 100
Increased
Remain the same
Decreased
There are no deerin the area
Don't know
Percent
In your opinion, should the deer population in the area where you live be increased, remain the same, or be decreased? Or are there no deer in the area where you live? (General Population)
Lives in the North/EastRegion (n=301)
Lives in the Central Region(n=331)
Lives in the South Region(n=301)

Opinions of Residents, Landowners, and Hunters on Deer, Moose, Bear, and Turkey 149
54
36
9
1
0
32
59
7
0
2
23
70
5
1
1
0 20 40 60 80 100
Increased
Remain the same
Decreased
There are no deerin the area
Don't know
Percent
In your opinion, should the deer population in the area where you live be increased, remain the same, or be decreased? Or are there no deer in
the area where you live? (Asked of Maine residents.) (Hunters)
Lives in the North/EastRegion (n=124)
Lives in the Central Region(n=121)
Lives in the South Region(n=131)
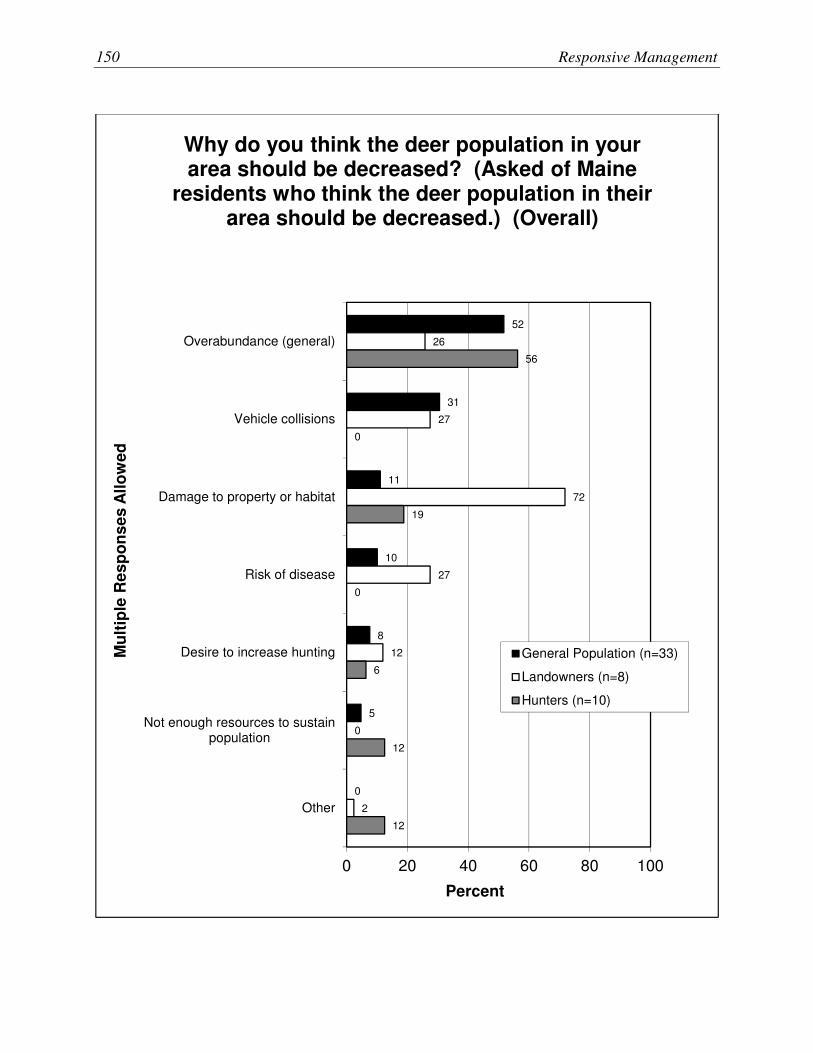
150 Responsive Management
52
31
11
10
8
5
0
26
27
72
27
12
0
2
56
0
19
0
6
12
12
0 20 40 60 80 100
Overabundance (general)
Vehicle collisions
Damage to property or habitat
Risk of disease
Desire to increase hunting
Not enough resources to sustainpopulation
Other
Percent
Mu
ltip
le R
es
po
ns
es
All
ow
ed
Why do you think the deer population in your area should be decreased? (Asked of Maine
residents who think the deer population in their area should be decreased.) (Overall)
General Population (n=33)
Landowners (n=8)
Hunters (n=10)

Opinions of Residents, Landowners, and Hunters on Deer, Moose, Bear, and Turkey 151
39
31
27
28
15
11
12
7
9
34
34
40
41
20
26
22
8
10
48
50
45
37
29
22
21
16
12
0 20 40 60 80 100
Private citizens would be required to resolvedeer nuisance issues on their own
That Department biologists would spend moretime on deer management and less time on
other species
An increased likelihood that deer would damagegardens or landscaping
An increased likelihood that deer would damageagricultural crops
An increased likelihood of vehicle collisions withdeer
Less food and poorer quality habitat for otherwildlife
An increased risk of disease, such as Lymedisease
More deer would die from starvation duringwinter
Poor health overall for the deer herd
Percent
Percent who would strongly support increasing deer population in area where they live if it
meant the following. (Asked of ME residents who think the deer population in their area
should be increased.) (Overall)
General Population (n=216)
Landowners (n=68)
Hunters (n=136)

152 Responsive Management
71
70
63
63
49
36
29
20
18
64
62
69
75
51
40
38
12
15
77
70
74
67
58
46
41
27
23
0 20 40 60 80 100
That Department biologists would spend moretime on deer management and less time on
other species
Private citizens would be required to resolvedeer nuisance issues on their own
An increased likelihood that deer would damagegardens or landscaping
An increased likelihood that deer would damageagricultural crops
An increased likelihood of vehicle collisions withdeer
An increased risk of disease, such as Lymedisease
Less food and poorer quality habitat for otherwildlife
More deer would die from starvation duringwinter
Poor health overall for the deer herd
Percent
Percent who would strongly support or moderately support increasing deer population in area where they live if it meant the following.
(Asked of ME residents who think the deer population in their area should be increased.)
(Overall)
General Population(n=216)
Landowners (n=68)
Hunters (n=136)

Opinions of Residents, Landowners, and Hunters on Deer, Moose, Bear, and Turkey 153
80
72
52
55
41
28
26
21
16
83
77
56
49
36
22
30
28
20
70
64
53
45
34
27
21
25
14
0 20 40 60 80 100
Poor health overall for the deer herd
More deer would die from starvation duringwinter
Less food and poorer quality habitat for otherwildlife
An increased risk of disease, such as Lymedisease
An increased likelihood of vehicle collisions withdeer
An increased likelihood that deer would damageagricultural crops
An increased likelihood that deer would damagegardens or landscaping
Private citizens would be required to resolvedeer nuisance issues on their own
That Department biologists would spend moretime on deer management and less time on
other species
Percent
Percent who would moderately oppose or strongly oppose increasing deer population in area where they live if it meant the following. (Asked of ME residents who think the deer
population in their area should be increased.) (Overall)
General Population (n=216)
Landowners (n=68)
Hunters (n=136)

154 Responsive Management
48
43
22
22
15
12
10
9
7
48
53
30
26
20
15
4
3
0
53
49
30
28
21
15
10
9
5
0 20 40 60 80 100
More deer would die from starvation duringwinter
Poor health overall for the deer herd
An increased risk of disease, such as Lymedisease
Less food and poorer quality habitat for otherwildlife
An increased likelihood of vehicle collisions withdeer
Private citizens would be required to resolvedeer nuisance issues on their own
An increased likelihood that deer woulddamage agricultural crops
An increased likelihood that deer woulddamage gardens or landscaping
That Department biologists would spend moretime on deer management and less time on
other species
Percent
Percent who would strongly oppose increasing deer population in area where they live if it
meant the following. (Asked of ME residents who think the deer population in their area
should be increased.) (Overall)
General Population (n=216)
Landowners (n=68)
Hunters (n=136)
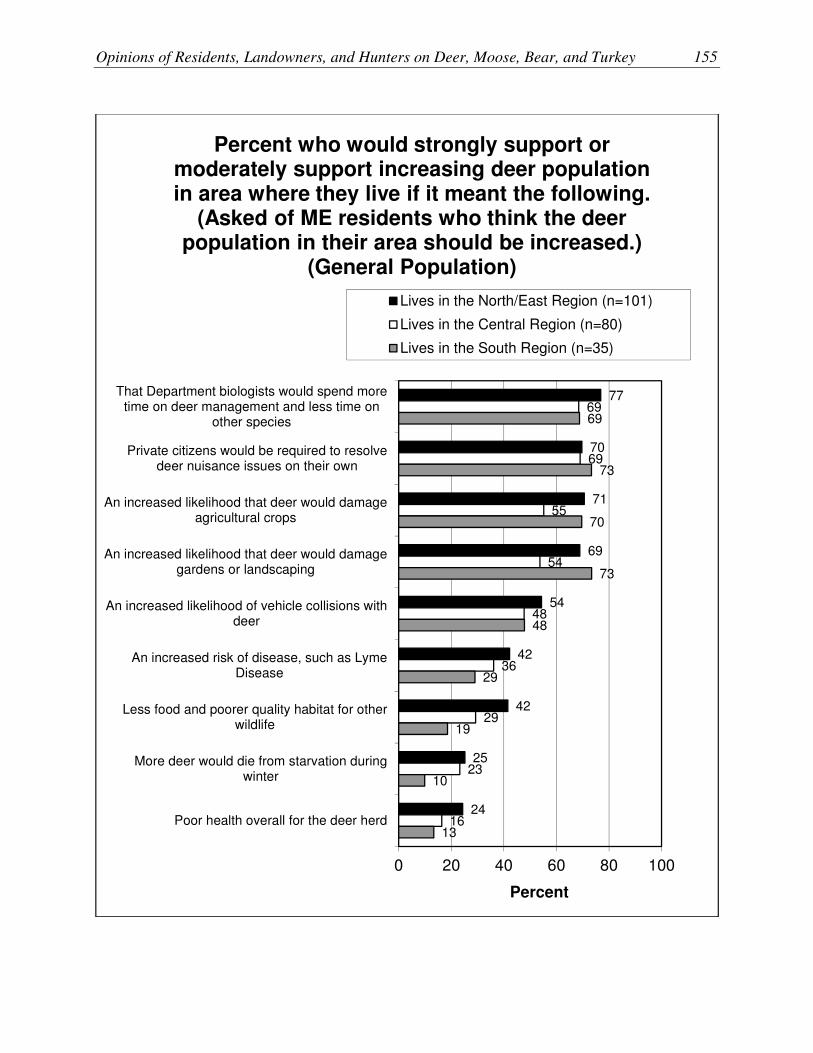
Opinions of Residents, Landowners, and Hunters on Deer, Moose, Bear, and Turkey 155
77
70
71
69
54
42
42
25
24
69
69
55
54
48
36
29
23
16
69
73
70
73
48
29
19
10
13
0 20 40 60 80 100
That Department biologists would spend moretime on deer management and less time on
other species
Private citizens would be required to resolvedeer nuisance issues on their own
An increased likelihood that deer would damageagricultural crops
An increased likelihood that deer would damagegardens or landscaping
An increased likelihood of vehicle collisions withdeer
An increased risk of disease, such as LymeDisease
Less food and poorer quality habitat for otherwildlife
More deer would die from starvation duringwinter
Poor health overall for the deer herd
Percent
Percent who would strongly support or moderately support increasing deer population in area where they live if it meant the following.
(Asked of ME residents who think the deer population in their area should be increased.)
(General Population)
Lives in the North/East Region (n=101)
Lives in the Central Region (n=80)
Lives in the South Region (n=35)

156 Responsive Management
72
67
54
49
38
23
24
16
13
80
67
51
47
40
32
34
23
14
87
85
65
63
47
24
14
23
21
0 20 40 60 80 100
Poor health overall for the deer herd
More deer would die from starvation duringwinter
An increased risk of disease, such as LymeDisease
Less food and poorer quality habitat for otherwildlife
An increased likelihood of vehicle collisions withdeer
An increased likelihood that deer would damageagricultural crops
An increased likelihood that deer would damagegardens or landscaping
Private citizens would be required to resolvedeer nuisance issues on their own
That Department biologists would spend moretime on deer management and less time on
other species
Percent
Percent who would moderately oppose or strongly oppose increasing deer population in area where they live if it meant the following. (Asked of ME residents who think the deer
population in their area should be increased.) (General Population)
Lives in the North/East Region (n=101)
Lives in the Central Region (n=80)
Lives in the South Region (n=35)

Opinions of Residents, Landowners, and Hunters on Deer, Moose, Bear, and Turkey 157
8.1
7.8
6.9
6.8
6.9
6.8
6.0
5.0
8.5
7.6
7.6
6.5
6.5
6.5
6.1
5.2
8.8
8.8
7.7
7.1
6.7
6.6
6.1
4.9
0 2 4 6 8 10
The health of the typicaldeer in the herd
Providing deer huntingopportunities
The opportunity to seedeer
Impacts on habitat
Risk of vehicle collisionswith deer
Risk of human disease,such as Lyme Disease
Damage to agriculturalcrops
Damage to gardens andornamental plants
Mean
On a scale of 0 to 10, where 0 is not at all important and 10 is extremely important, how important do you think each of the following
factors should be for managing the deer population in Maine? (Overall)
General Population (604≤n≤661)
Landowners (179≤n≤194)
Hunters (266≤n≤303)

158 Responsive Management
8.6
7.8
7.9
6.9
7.0
6.7
5.5
4.8
8.6
7.4
7.4
6.4
6.1
6.3
6.0
5.1
8.3
8.0
7.7
6.5
6.7
6.7
6.8
5.9
0 2 4 6 8 10
The health of the typicaldeer in the herd
Providing deer huntingopportunities
The opportunity to see deer
Impacts on habitat
Risk of vehicle collisions withdeer
Risk of human disease, suchas Lyme Disease
Damage to agricultural crops
Damage to gardens andornamental plants
Mean
On a scale of 0 to 10, where 0 is not at all important and 10 is extremely important, how important do you think each of the following
factors should be for managing the deer population in Maine? (Landowners)
Largest tract is in the North/East Region (57≤n≤69)
Largest tract is in the Central Region (64≤n≤76)
Largest tract is in the South Region (45≤n≤59)

Opinions of Residents, Landowners, and Hunters on Deer, Moose, Bear, and Turkey 159
75
19
1
3
2
0
76
16
3
1
3
1
93
5
0
1
1
0
0 20 40 60 80 100
Strongly support
Moderatelysupport
Neither supportnor oppose
Moderatelyoppose
Strongly oppose
Don't know
Percent
Do you support or oppose legal hunting as a method to help manage the deer populations in
Maine? (Overall)
General Population (n=933)
Landowners (n=304)
Hunters (n=956)
94%
92%
98%
4% *
4%
1% *
* Rounding on graph causes apparent
discrepancy in sum; calculation made on unrounded numbers.

160 Responsive Management
60
50
46
42
41
38
20
54
55
48
39
31
44
26
76
69
69
71
61
52
15
0 20 40 60 80 100
A special archeryseason
Targeted doe permitsvalid only in specifictowns or locations
An additional legalhunting season
Allowing hunters toharvest multiple deer
A longer firearmsseason
A controlled hunt with alimited number of
hunters
Sharpshooters
Percent
Percent of respondents who would strongly support each of the following deer management
options in areas of Maine where the deer population became overabundant. (Overall)
General Population (575≤n≤627)
Landowners (171≤n≤177)
Hunters (254≤n≤288)

Opinions of Residents, Landowners, and Hunters on Deer, Moose, Bear, and Turkey 161
86
78
75
71
65
61
44
72
83
72
63
68
48
48
92
88
76
84
87
77
28
0 20 40 60 80 100
A special archery season
Targeted doe permitsvalid only in specifictowns or locations
A controlled hunt with alimited number of hunters
An additional legalhunting season
Allowing hunters toharvest multiple deer
A longer firearms season
Sharpshooters
Percent
Percent of respondents who would strongly support or moderately support each of the
following deer management options in areas of Maine where the deer population became
overabundant. (Overall)
General Population (575≤n≤627)
Landowners (171≤n≤177)
Hunters (254≤n≤288)

162 Responsive Management
47
34
32
24
20
16
10
45
50
27
34
21
13
19
64
20
12
14
23
10
5
0 20 40 60 80 100
Sharpshooters
A longer firearmsseason
Allowing hunters toharvest multiple deer
An additional legalhunting season
A controlled hunt with alimited number of
hunters
Targeted doe permitsvalid only in specifictowns or locations
A special archeryseason
Percent
Percent of respondents who would moderately oppose or strongly oppose each of the
following deer management options in areas of Maine where the deer population became
overabundant. (Overall)
General Population (575≤n≤627)
Landowners (171≤n≤177)
Hunters (254≤n≤288)

Opinions of Residents, Landowners, and Hunters on Deer, Moose, Bear, and Turkey 163
30
17
19
14
10
8
6
38
30
14
22
12
9
12
50
10
7
8
12
6
2
0 20 40 60 80 100
Sharpshooters
A longer firearmsseason
Allowing hunters toharvest multiple deer
An additional legalhunting season
A controlled hunt with alimited number of
hunters
Targeted doe permitsvalid only in specifictowns or locations
A special archeryseason
Percent
Percent of respondents who would strongly oppose each of the following deer management
options in areas of Maine where the deer population became overabundant. (Overall)
General Population (575≤n≤627)
Landowners (171≤n≤177)
Hunters (254≤n≤288)

164 Responsive Management
66
56
53
41
52
49
26
60
54
48
43
43
38
18
57
45
41
40
34
35
22
0 20 40 60 80 100
A special archery season
Targeted doe permits validonly in specific towns or
locations
An additional legal huntingseason
Allowing hunters to harvestmultiple deer
A longer firearms season
A controlled hunt with alimited number of hunters
Sharpshooters
Percent
Percent of respondents who would strongly support each of the following deer management
options in areas of Maine where the deer population became overabundant. (General
Population)
Lives in the North/East Region (166≤n≤183)
Lives in the Central Region (244≤n≤273)
Lives in the South Region (151≤n≤192)

Opinions of Residents, Landowners, and Hunters on Deer, Moose, Bear, and Turkey 165
85
71
75
79
65
49
58
82
68
69
62
63
42
44
86
82
75
71
63
61
41
0 20 40 60 80 100
Targeted doe permitsvalid only in specifictowns or locations
A controlled hunt with alimited number of hunters
A special archery season
Allowing hunters toharvest multiple deer
An additional legalhunting season
Sharpshooters
A longer firearms season
Percent
Percent of respondents who would strongly support or moderately support each of the
following deer management options in areas of Maine where the deer population became
overabundant. (Landowners)
Largest tract is in the North/East Region (57≤n≤64)
Largest tract is in the Central Region (60≤n≤70)
Largest tract is in the South Region (47≤n≤53)

166 Responsive Management
39
40
31
19
13
22
15
53
51
34
30
27
21
13
56
38
38
28
16
12
11
0 20 40 60 80 100
A longer firearmsseason
Sharpshooters
An additional legalhunting season
Allowing hunters toharvest multiple deer
A controlled hunt with alimited number of
hunters
A special archeryseason
Targeted doe permitsvalid only in specifictowns or locations
Percent
Percent of respondents who would moderately oppose or strongly oppose each of the
following deer management options in areas of Maine where the deer population became
overabundant. (Landowners)
Largest tract is in the North/East Region (57≤n≤64)
Largest tract is in the Central Region (60≤n≤70)
Largest tract is in the South Region (47≤n≤53)

Opinions of Residents, Landowners, and Hunters on Deer, Moose, Bear, and Turkey 167
64
61
63
58
54
44
18
80
69
66
63
65
45
9
76
78
71
75
55
58
17
79
73
79
82
67
60
19
0 20 40 60 80 100
A special archeryseason
Allowing hunters toharvest multiple deer
Targeted doe permitsvalid only in specifictowns or locations
An additional legalhunting season
A longer firearmsseason
A controlled hunt with alimited number of
hunters
Sharpshooters
Percent
Percent of respondents who would strongly support each of the following deer management
options in areas of Maine where the deer population became overabundant. (Hunters)
Lives in the North/East Region (59≤n≤80)
Lives in the Central Region (64≤n≤77)
Lives in the South Region (69≤n≤78)
Nonresident (42≤n≤58)
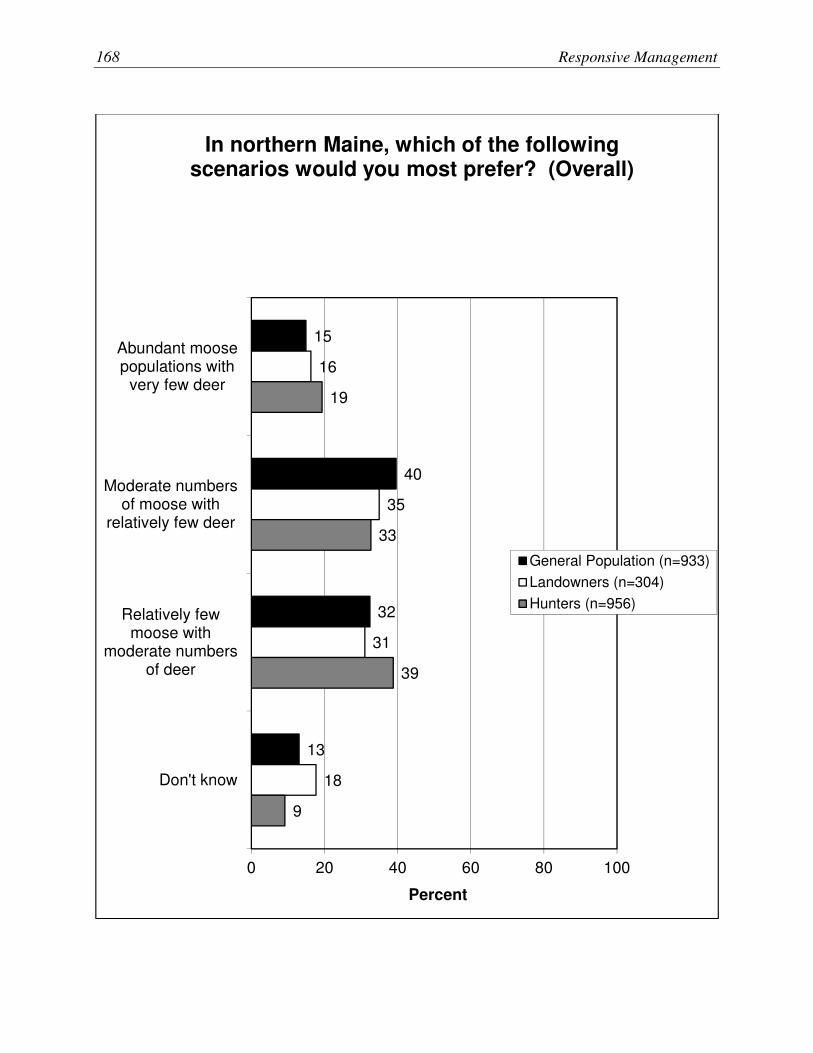
168 Responsive Management
15
40
32
13
16
35
31
18
19
33
39
9
0 20 40 60 80 100
Abundant moosepopulations with
very few deer
Moderate numbersof moose with
relatively few deer
Relatively fewmoose with
moderate numbersof deer
Don't know
Percent
In northern Maine, which of the following scenarios would you most prefer? (Overall)
General Population (n=933)
Landowners (n=304)
Hunters (n=956)

Opinions of Residents, Landowners, and Hunters on Deer, Moose, Bear, and Turkey 169
12
31
47
9
17
39
32
12
14
43
27
15
0 20 40 60 80 100
Abundant moosepopulations with
very few deer
Moderatenumbers ofmoose with
relatively fewdeer
Relatively fewmoose withmoderate
numbers of deer
Don't know
Percent
In northern Maine, which of the following scenarios would you most prefer? (General
Population)
Lives in the North/EastRegion (n=301)
Lives in the Central Region(n=331)
Lives in the South Region(n=301)

170 Responsive Management
13
32
48
7
24
34
33
9
16
34
39
10
21
29
39
11
0 20 40 60 80 100
Abundant moosepopulations with
very few deer
Moderatenumbers ofmoose with
relatively fewdeer
Relatively fewmoose withmoderate
numbers of deer
Don't know
Percent
In northern Maine, which of the following scenarios would you most prefer? (Hunters)
Lives in the North/EastRegion (n=262)
Lives in the Central Region(n=258)
Lives in the South Region(n=256)
Nonresident (n=180)
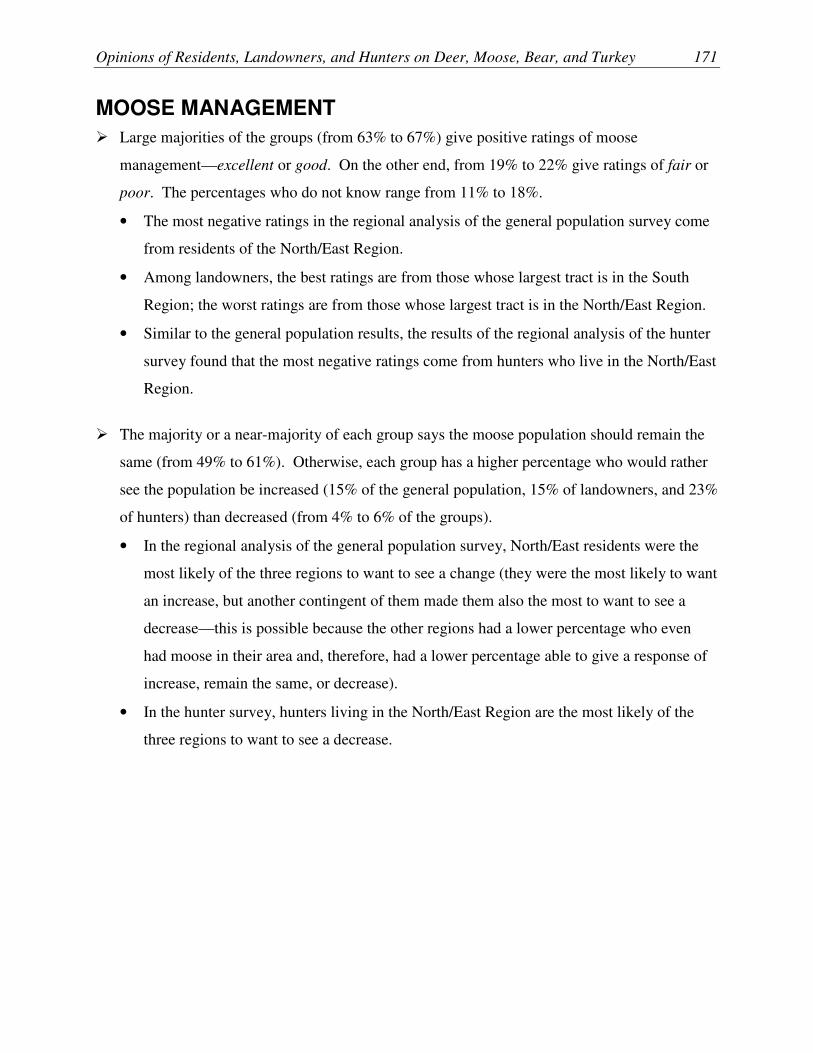
Opinions of Residents, Landowners, and Hunters on Deer, Moose, Bear, and Turkey 171
MOOSE MANAGEMENT
� Large majorities of the groups (from 63% to 67%) give positive ratings of moose
management—excellent or good. On the other end, from 19% to 22% give ratings of fair or
poor. The percentages who do not know range from 11% to 18%.
• The most negative ratings in the regional analysis of the general population survey come
from residents of the North/East Region.
• Among landowners, the best ratings are from those whose largest tract is in the South
Region; the worst ratings are from those whose largest tract is in the North/East Region.
• Similar to the general population results, the results of the regional analysis of the hunter
survey found that the most negative ratings come from hunters who live in the North/East
Region.
� The majority or a near-majority of each group says the moose population should remain the
same (from 49% to 61%). Otherwise, each group has a higher percentage who would rather
see the population be increased (15% of the general population, 15% of landowners, and 23%
of hunters) than decreased (from 4% to 6% of the groups).
• In the regional analysis of the general population survey, North/East residents were the
most likely of the three regions to want to see a change (they were the most likely to want
an increase, but another contingent of them made them also the most to want to see a
decrease—this is possible because the other regions had a lower percentage who even
had moose in their area and, therefore, had a lower percentage able to give a response of
increase, remain the same, or decrease).
• In the hunter survey, hunters living in the North/East Region are the most likely of the
three regions to want to see a decrease.

172 Responsive Management
� Those who supported an increase in the moose population were asked about a series of
possible consequences of an increase in the moose population (some consequences that have
counterparts in the deer section of the survey, and some unique to moose). For each of four
consequences, respondents were asked if they would support or oppose an increase in the
moose population.
• The possible negative ecological consequences cause the most defection from support.
No more than 26% of any of the groups would still support an increase if it meant poor
health overall for the moose herd, and just under half (from 45% to 46%) would still
support if it meant that forest regeneration would be negatively impacted.
• An increase in agricultural damage caused little defection: from 58% to 71% would
support an increase if this was the consequence. An increased likelihood of vehicle
collisions also does not cause mass defection, as a majority of each group would still
support the increase with this consequence—from 50% (a majority because it is rounded
from 50.4) to 62%.
o The results of all the possible consequences are shown together on four graphs:
strongly support by itself, strongly and moderately support combined, strongly and
moderately oppose combined, and then strongly oppose by itself.
o The regional results of the general population survey suggest that Central Region
residents are the more opposed, relative to those from the other regions, to an increase
in the moose population when the increase would mean poor health overall of the
moose herd or that forest regeneration would be negatively impacted.
o In the hunter survey’s results, the regional analysis shows that South Region hunters
are more likely to change to oppose when the consequence is poor health overall for
the moose herd. Central Region hunters are the most likely in the regional analysis to
oppose when the consequence is that forest regeneration would be negatively
impacted.

Opinions of Residents, Landowners, and Hunters on Deer, Moose, Bear, and Turkey 173
� The survey presented to respondents a series of possible factors that could be considered in
the management of moose. For each factor, respondents rated it from 0 (not at all important)
to 10 (extremely important).
• The top-rated factor is the health of the typical moose in the herd (mean ratings ranging
from 8.0 to 8.4)—an ecological factor. Next in the ranking by mean is providing moose
hunting opportunities (mean of 7.2 to 7.7) and the opportunity to see moose (7.1 to 7.4).
Risk of vehicle collisions is next at 6.9 to 7.2.
• After that, the importance markedly drops for impacts on habitat (6.1 to 6.6) and damage
to agriculture (4.2 to 5.1).
o Regarding the landowner survey, the regional differences are slight, but damage to
agricultural crops was markedly lower rated by those whose largest tract is in the
Central Region (although this is the lowest rated of all the factors in all three groups).
� Support for legal moose hunting as a method to help manage moose is high: from 91% to
97% support, most of it strong support. Only 7% or less oppose it.
� One question asked about “adjusting the hunting harvest of female moose” to improve the
health of the moose population, but included the caveat, “even if it meant fewer moose in
Maine.” A majority support this adjustment (68% of the general population, 66% of
landowners, and 80% of hunters). Nonetheless, opposition ranges from 21% among the
general population down to 10% among hunters.
� There is much more support for (ranging from 54% to 68%) than opposition to (9% to 13%)
the current moose hunting season in southern Maine.
• Among landowners, the most support is from those whose largest tract is in the South
Region.
• The regional analysis of the hunter survey found that support is strongest among hunters
who live in the South Region.

174 Responsive Management
� The final question in this section concerned deer and moose together and was shown in the
Deer Management section of this report. Recall that respondents were presented with a
continuum from abundant moose to few moose, and they were asked to choose whether
moose should be abundant (at the expense of deer) or whether there should be relatively few
moose (with more deer) in northern Maine. Respondents favor lower moose numbers, most
commonly choosing either the lowest moose population or the middle option; relatively few
chose to have abundant moose with few deer. (This graph is presented in the section titled,
“Deer Management.”)

Opinions of Residents, Landowners, and Hunters on Deer, Moose, Bear, and Turkey 175
24
39
15
4
18
19
44
15
5
18
28
40
16
6
11
0 20 40 60 80 100
Excellent
Good
Fair
Poor
Don't know
Percent
Overall, how would you rate moose management in Maine? (Overall)
General Population (n=933)
Landowners (n=304)
Hunters (n=956)
63%
63%
67% *
19%
20%
22%
* Rounding on graph causes apparent
discrepancy in sum; calculation made on unrounded numbers.
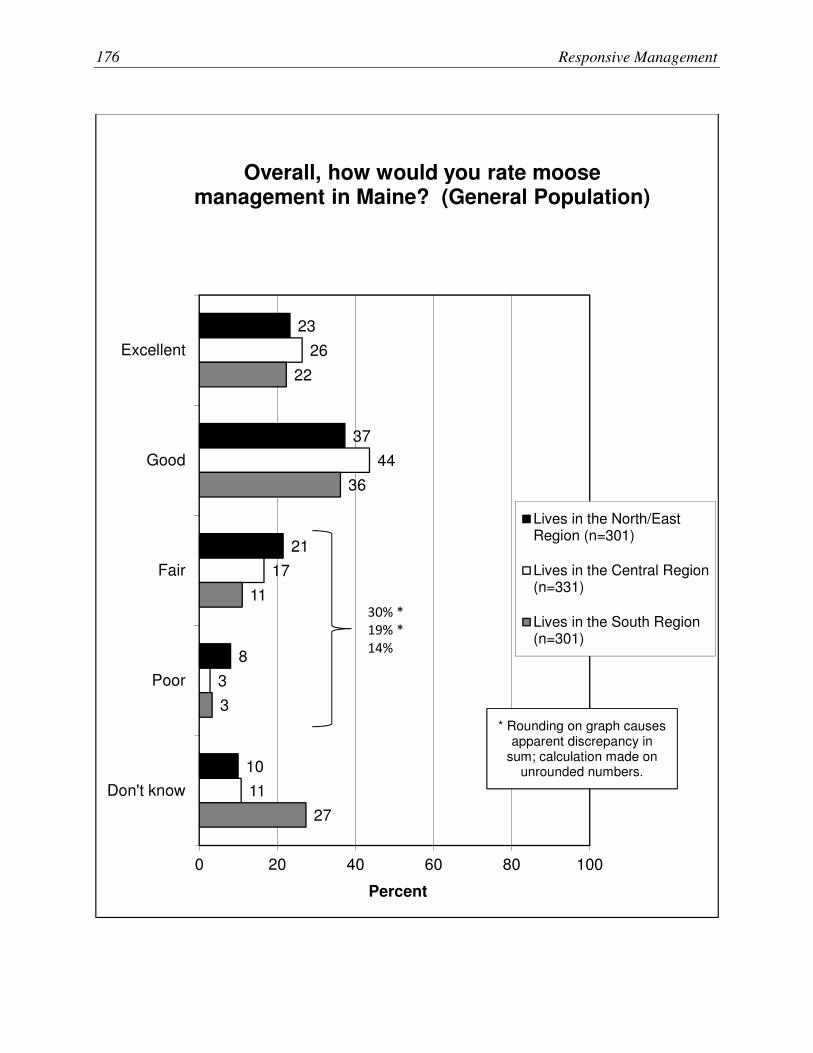
176 Responsive Management
23
37
21
8
10
26
44
17
3
11
22
36
11
3
27
0 20 40 60 80 100
Excellent
Good
Fair
Poor
Don't know
Percent
Overall, how would you rate moose management in Maine? (General Population)
Lives in the North/EastRegion (n=301)
Lives in the Central Region(n=331)
Lives in the South Region(n=301)
30% * 19% * 14%
* Rounding on graph causes apparent discrepancy in
sum; calculation made on unrounded numbers.
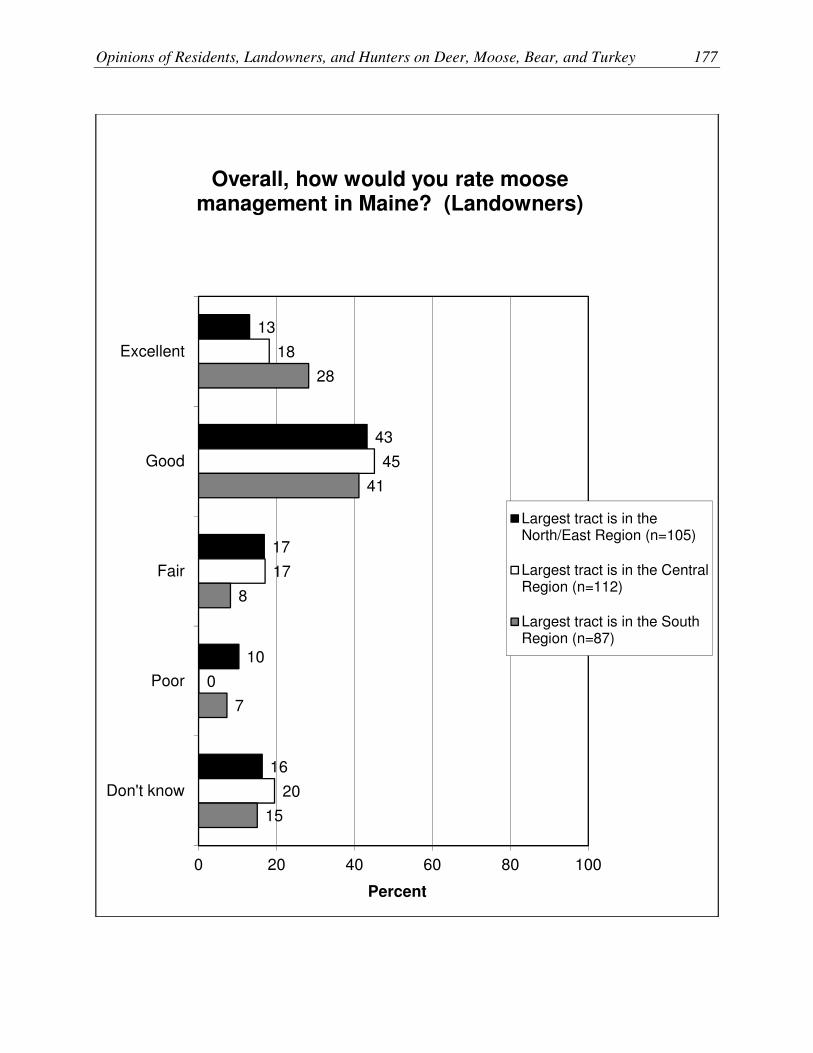
Opinions of Residents, Landowners, and Hunters on Deer, Moose, Bear, and Turkey 177
13
43
17
10
16
18
45
17
0
20
28
41
8
7
15
0 20 40 60 80 100
Excellent
Good
Fair
Poor
Don't know
Percent
Overall, how would you rate moose management in Maine? (Landowners)
Largest tract is in theNorth/East Region (n=105)
Largest tract is in the CentralRegion (n=112)
Largest tract is in the SouthRegion (n=87)

178 Responsive Management
19
44
21
13
3
28
40
20
5
7
30
42
14
3
11
32
34
8
3
23
0 20 40 60 80 100
Excellent
Good
Fair
Poor
Don't know
Percent
Overall, how would you rate moose management in Maine? (Hunters)
Lives in the North/EastRegion (n=262)
Lives in the Central Region(n=258)
Lives in the South Region(n=256)
Nonresident (n=180)

Opinions of Residents, Landowners, and Hunters on Deer, Moose, Bear, and Turkey 179
15
49
4
30
3
15
61
6
16
3
23
52
5
17
2
0 20 40 60 80 100
Increased
Remain the same
Decreased
There are nomoose in the area
Don't know
Percent
In your opinion, should the moose population in the area where you live be increased, remain the same, or be decreased? Or are there no moose
in the area where you live? (Asked of Maine residents.) (Overall)
General Population (n=933)
Landowners (n=304)
Hunters (n=390)

180 Responsive Management
20
52
14
11
3
17
54
2
26
3
11
44
1
41
3
0 20 40 60 80 100
Increased
Remain the same
Decreased
There are nomoose in the area
Don't know
Percent
In your opinion, should the moose population in the area where you live be increased, remain the same, or be decreased? Or are there no moose
in the area where you live? (Asked of Maine residents.) (General Population)
Lives in the North/EastRegion (n=301)
Lives in the Central Region(n=331)
Lives in the South Region(n=301)

Opinions of Residents, Landowners, and Hunters on Deer, Moose, Bear, and Turkey 181
27
51
13
7
1
23
57
2
17
1
21
45
3
25
6
0 20 40 60 80 100
Increased
Remain the same
Decreased
There are nomoose in the area
Don't know
Percent
In your opinion, should the moose population in the area where you live be increased, remain the same, or be decreased? Or are there no moose
in the area where you live? (Asked of Maine residents.) (Hunters)
Lives in the North/EastRegion (n=144)
Lives in the Central Region(n=125)
Lives in the South Region(n=121)
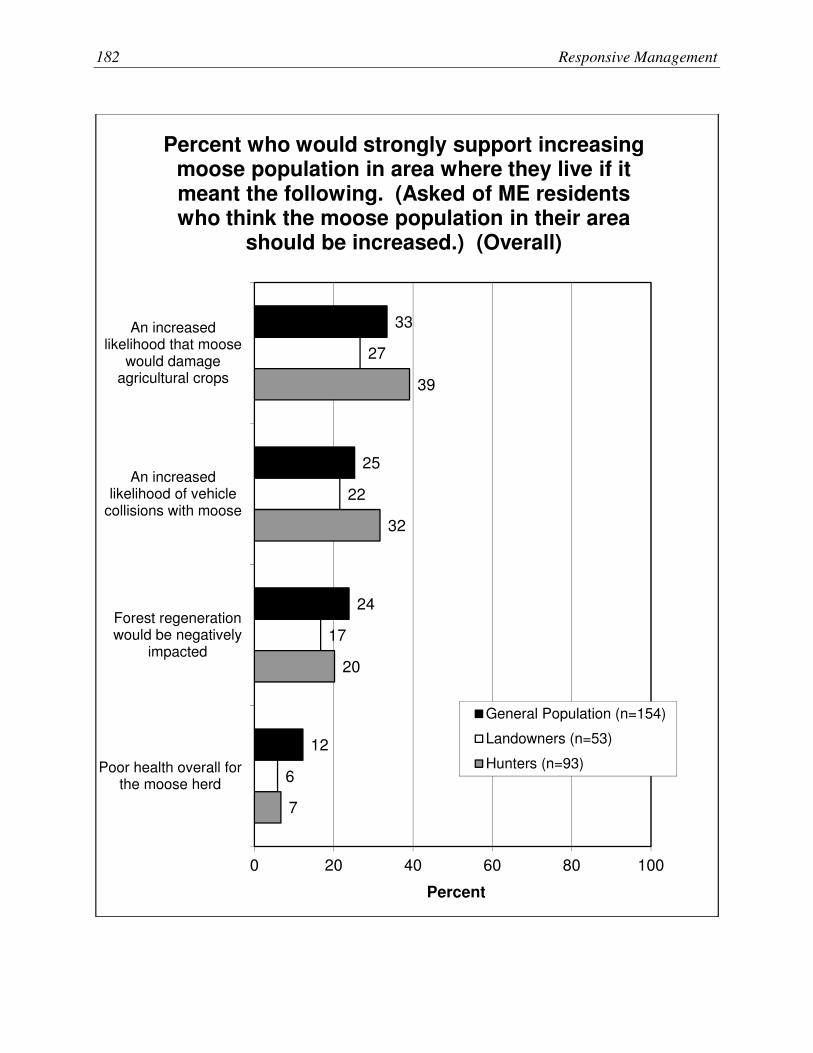
182 Responsive Management
33
25
24
12
27
22
17
6
39
32
20
7
0 20 40 60 80 100
An increasedlikelihood that moose
would damageagricultural crops
An increasedlikelihood of vehicle
collisions with moose
Forest regenerationwould be negatively
impacted
Poor health overall forthe moose herd
Percent
Percent who would strongly support increasing moose population in area where they live if it meant the following. (Asked of ME residents who think the moose population in their area
should be increased.) (Overall)
General Population (n=154)
Landowners (n=53)
Hunters (n=93)
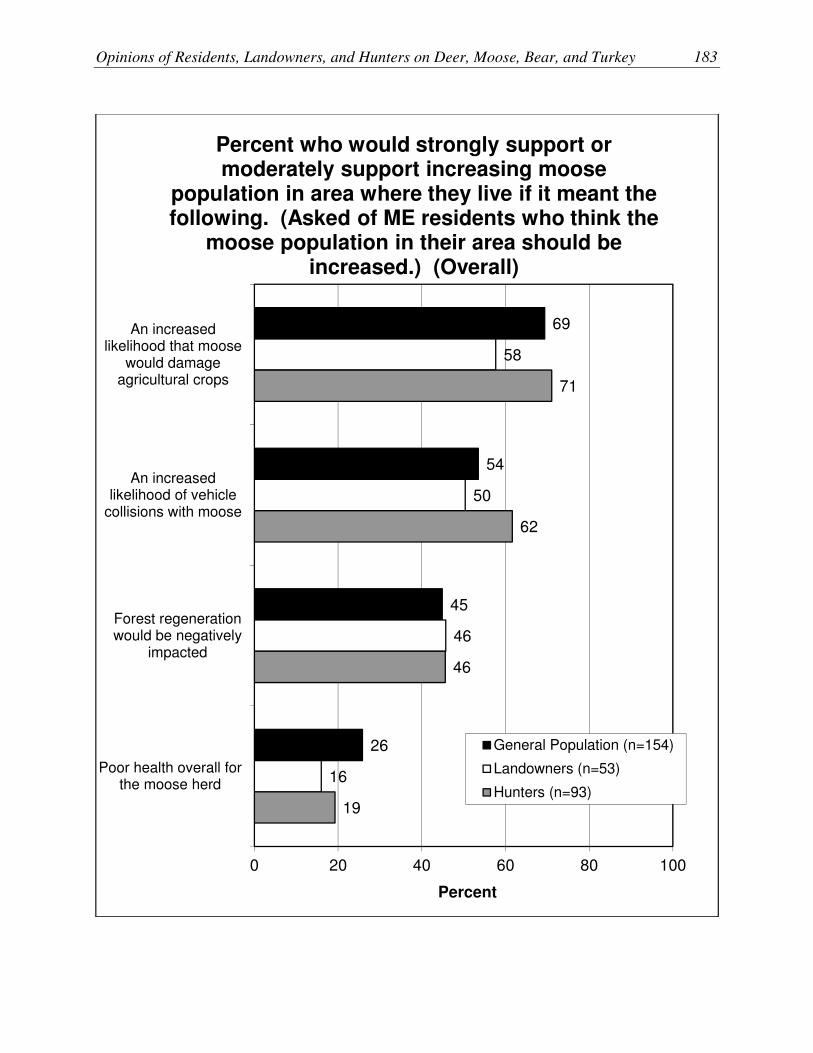
Opinions of Residents, Landowners, and Hunters on Deer, Moose, Bear, and Turkey 183
69
54
45
26
58
50
46
16
71
62
46
19
0 20 40 60 80 100
An increasedlikelihood that moose
would damageagricultural crops
An increasedlikelihood of vehicle
collisions with moose
Forest regenerationwould be negatively
impacted
Poor health overall forthe moose herd
Percent
Percent who would strongly support or moderately support increasing moose
population in area where they live if it meant the following. (Asked of ME residents who think the
moose population in their area should be increased.) (Overall)
General Population (n=154)
Landowners (n=53)
Hunters (n=93)

184 Responsive Management
65
41
35
21
78
28
40
37
75
41
25
18
0 20 40 60 80 100
Poor health overall forthe moose herd
Forest regenerationwould be negatively
impacted
An increasedlikelihood of vehicle
collisions with moose
An increasedlikelihood that moose
would damageagricultural crops
Percent
Percent who would moderately oppose or strongly oppose increasing moose population in area where they live if it meant the following.
(Asked of ME residents who think the moose population in their area should be increased.)
(Overall)
General Population (n=154)
Landowners (n=53)
Hunters (n=93)

Opinions of Residents, Landowners, and Hunters on Deer, Moose, Bear, and Turkey 185
41
14
13
3
36
17
19
12
53
18
16
7
0 20 40 60 80 100
Poor health overall forthe moose herd
Forest regenerationwould be negatively
impacted
An increasedlikelihood of vehicle
collisions with moose
An increasedlikelihood that moose
would damageagricultural crops
Percent
Percent who would strongly oppose increasing moose population in area where they live if it meant the following. (Asked of ME residents who think the moose population in their area
should be increased.) (Overall)
General Population (n=154)
Landowners (n=53)
Hunters (n=93)
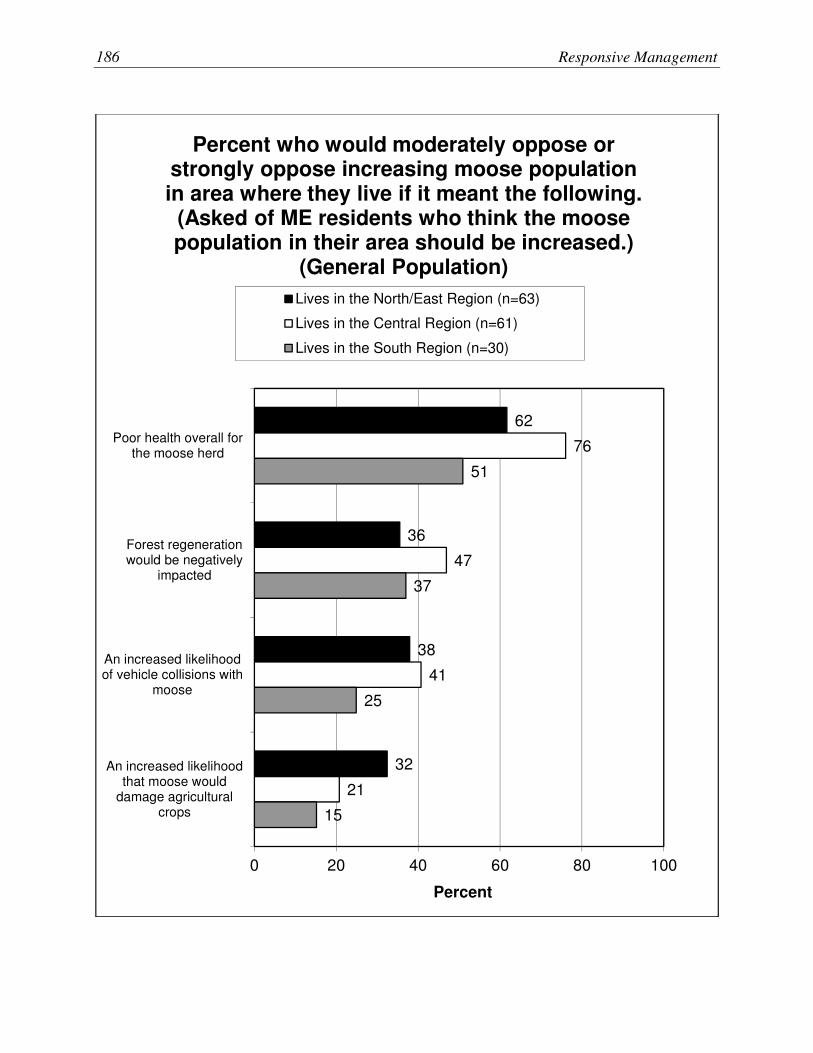
186 Responsive Management
62
36
38
32
76
47
41
21
51
37
25
15
0 20 40 60 80 100
Poor health overall forthe moose herd
Forest regenerationwould be negatively
impacted
An increased likelihoodof vehicle collisions with
moose
An increased likelihoodthat moose would
damage agriculturalcrops
Percent
Percent who would moderately oppose or strongly oppose increasing moose population in area where they live if it meant the following.
(Asked of ME residents who think the moose population in their area should be increased.)
(General Population)
Lives in the North/East Region (n=63)
Lives in the Central Region (n=61)
Lives in the South Region (n=30)

Opinions of Residents, Landowners, and Hunters on Deer, Moose, Bear, and Turkey 187
64
31
31
28
76
52
21
14
88
36
24
12
0 20 40 60 80 100
Poor health overall forthe moose herd
Forest regenerationwould be negatively
impacted
An increased likelihoodof vehicle collisions with
moose
An increased likelihoodthat moose would
damage agriculturalcrops
Percent
Percent who would moderately oppose or strongly oppose increasing moose population in area where they live if it meant the following.
(Asked of ME residents who think the moose population in their area should be increased.)
(Hunters)
Lives in the North/East Region (n=39)
Lives in the Central Region (n=29)
Lives in the South Region (n=25)

188 Responsive Management
8.0
7.2
7.1
7.2
6.1
5.1
8.0
7.4
7.1
7.1
6.2
4.2
8.4
7.7
7.4
6.9
6.6
5.0
0 2 4 6 8 10
The health of the typicalmoose in the herd
Providing moose huntingopportunities
The opportunity to seemoose
Risk of vehicle collisionswith moose
Impacts on habitat
Damage to agriculturalcrops
Mean
On a scale of 0 to 10, where 0 is not at all important and 10 is extremely important, how important do you think each of the following factors should be for managing the moose
population in Maine? (Overall)
General Population (637≤n≤684)
Landowners (190≤n≤206)
Hunters (292≤n≤322)

Opinions of Residents, Landowners, and Hunters on Deer, Moose, Bear, and Turkey 189
8.2
7.4
7.4
7.3
6.0
4.6
7.8
7.4
6.8
7.2
6.5
3.6
8.3
7.4
7.6
6.6
5.9
4.9
0 2 4 6 8 10
The health of the typicalmoose in the herd
Providing moose huntingopportunities
The opportunity to seemoose
Risk of vehicle collisionswith moose
Impacts on habitat
Damage to agriculturalcrops
Mean
On a scale of 0 to 10, where 0 is not at all important and 10 is extremely important, how important do you think each of the following factors should be for managing the moose
population in Maine? (Landowners)
Largest tract is in the North/East Region (63≤n≤75)
Largest tract is in the Central Region (66≤n≤75)
Largest tract is in the South Region (52≤n≤63)
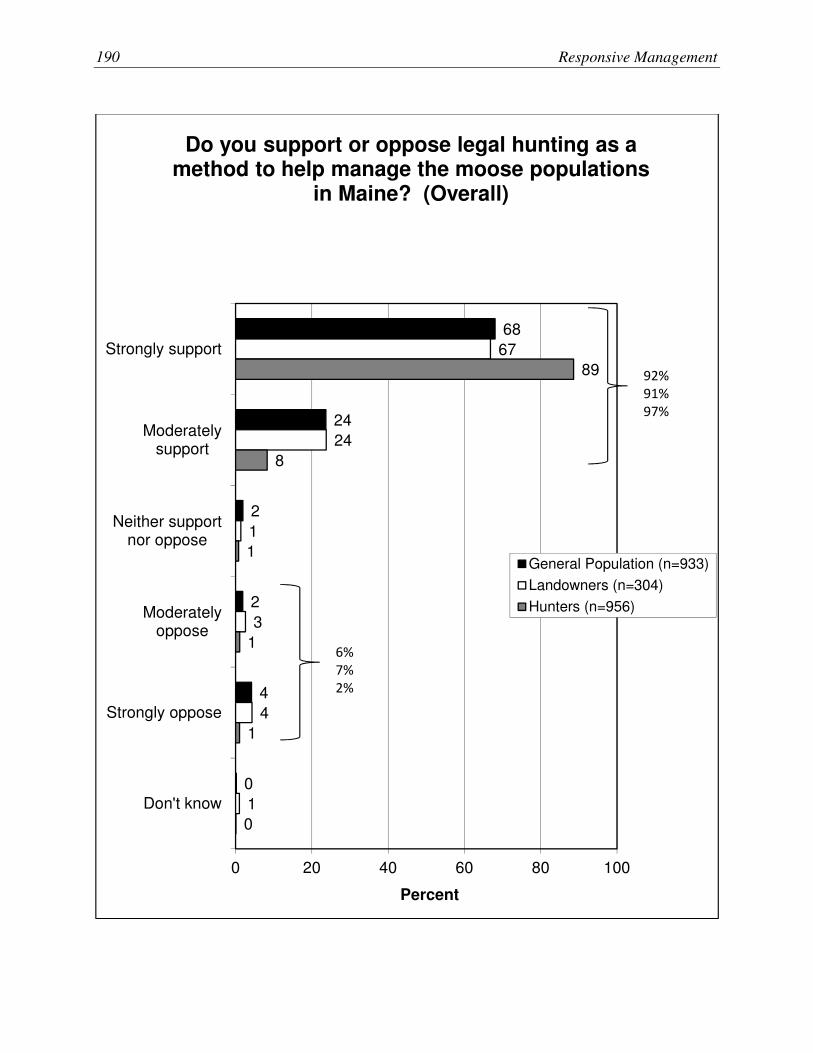
190 Responsive Management
68
24
2
2
4
0
67
24
1
3
4
1
89
8
1
1
1
0
0 20 40 60 80 100
Strongly support
Moderatelysupport
Neither supportnor oppose
Moderatelyoppose
Strongly oppose
Don't know
Percent
Do you support or oppose legal hunting as a method to help manage the moose populations
in Maine? (Overall)
General Population (n=933)
Landowners (n=304)
Hunters (n=956)
92%
91%
97%
6%
7%
2%

Opinions of Residents, Landowners, and Hunters on Deer, Moose, Bear, and Turkey 191
37
31
7
12
9
4
39
27
9
9
9
7
57
23
6
4
6
4
0 20 40 60 80 100
Strongly support
Moderatelysupport
Neither supportnor oppose
Moderatelyoppose
Strongly oppose
Don't know
Percent
Would you support or oppose adjusting the hunting harvest of female moose to help
minimize the impacts of parasites and improve the overall health of the moose population, even
if it meant fewer moose in Maine? (Overall)
General Population (n=933)
Landowners (n=304)
Hunters (n=956)
68%
66%
80%
21%
18%
10%
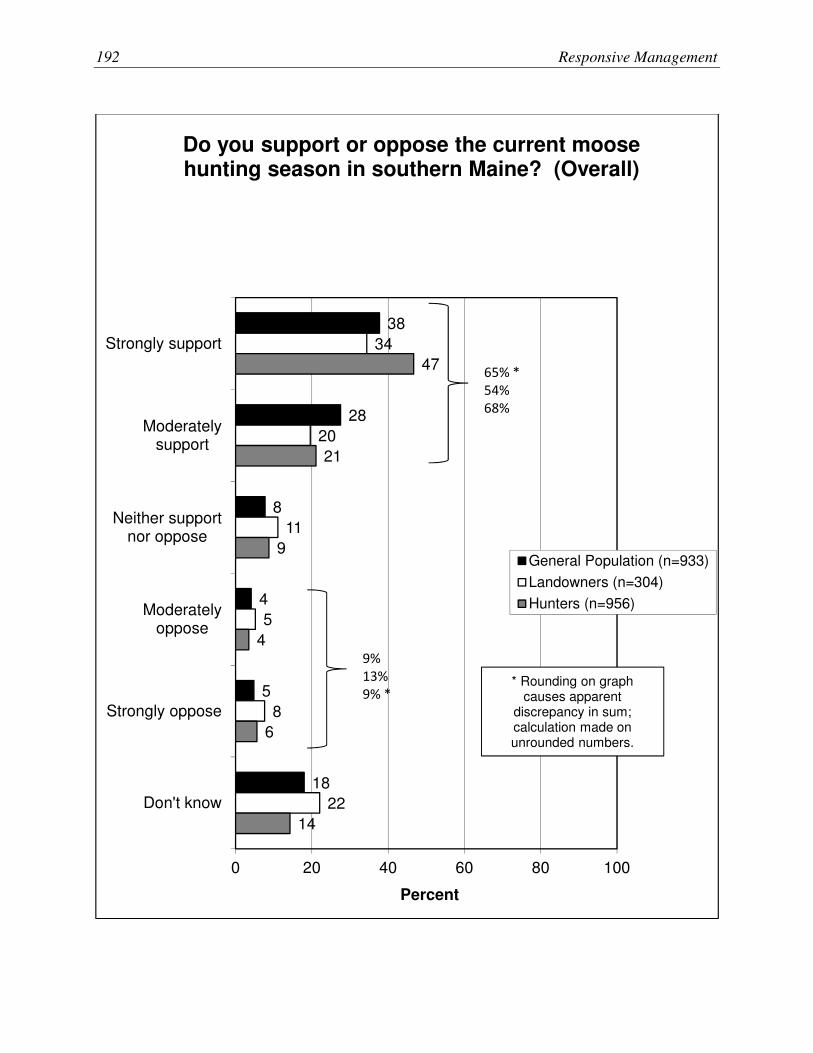
192 Responsive Management
38
28
8
4
5
18
34
20
11
5
8
22
47
21
9
4
6
14
0 20 40 60 80 100
Strongly support
Moderatelysupport
Neither supportnor oppose
Moderatelyoppose
Strongly oppose
Don't know
Percent
Do you support or oppose the current moose hunting season in southern Maine? (Overall)
General Population (n=933)
Landowners (n=304)
Hunters (n=956)
65% *
54%
68%
9%
13%
9% ** Rounding on graph
causes apparent discrepancy in sum; calculation made on unrounded numbers.

Opinions of Residents, Landowners, and Hunters on Deer, Moose, Bear, and Turkey 193
36
16
8
5
5
30
29
21
16
4
7
22
44
22
3
7
13
12
0 20 40 60 80 100
Strongly support
Moderatelysupport
Neither supportnor oppose
Moderatelyoppose
Strongly oppose
Don't know
Percent
Do you support or oppose the current moose hunting season in Southern Maine?
(Landowners)
Largest tract is in theNorth/East Region (n=105)
Largest tract is in the CentralRegion (n=112)
Largest tract is in the SouthRegion (n=87)
52% 50%
65% *
10% 11%
19% *
* Rounding on graph causes apparent
discrepancy in sum; calculation made on unrounded numbers.

194 Responsive Management
33
27
12
2
3
23
43
22
10
4
7
14
60
19
5
4
8
4
51
17
8
3
3
19
0 20 40 60 80 100
Strongly support
Moderatelysupport
Neither supportnor oppose
Moderatelyoppose
Strongly oppose
Don't know
Percent
Do you support or oppose the current moose hunting season in Southern Maine? (Hunters)
Lives in the North/EastRegion (n=262)
Lives in the Central Region(n=258)
Lives in the South Region(n=256)
Nonresident (n=180)
60%
65%
79%
68%
5%
11%
12%
6%

Opinions of Residents, Landowners, and Hunters on Deer, Moose, Bear, and Turkey 195
BEAR MANAGEMENT
� Ratings of bear management in Maine are more positive than negative, with substantial
percentages, nonetheless, giving ratings in the lower half of the scale. Majorities of 57% to
72% give a rating of excellent or good (the top half of the scale), while 13% to 28% give a
rating of fair or poor. The percentages who do not know range from 15% to 22%.
• The regional analysis of the general population survey shows that, of the three regions,
North/East Region residents are the most negative.
• Among landowners, the best ratings are among those whose largest tract is in the
North/East Region.
� The majority of each group says the bear population should remain the same (56% of the
general population, but 67% and 71% among the other two groups). Otherwise, there is a
fairly even split among the remainder (from 4% to 8% want an increase, and from 4% to 8%
want a decrease).
• The largest regional differences in the general population survey occur primarily because
there are more bear in the North/East Region: that region has a higher percentage of
residents choosing “remain the same” and a slightly higher percentage wanting a decrease
than in the other regions primarily because those other regions have more respondents
choosing the response, “there are no bear in the area.”
• Among hunters, the same general regional differences occur: hunters living in the
North/East Region have a higher percentage responding with “remain the same” or
“decreased” and have a much lower percentage saying that “there are no bear in the
area.”
� Those who supported an increase in the bear population were asked about a series of possible
consequences of an increase in the bear population. For each consequence, respondents were
asked if they would support or oppose an increase in the bear population.
• The ecological consequence caused the most defection among those who had supported
an increase: only from 15% to 28% of the groups would still support an increase if it
meant poor health overall for the bear population.

196 Responsive Management
• Less than a majority of the general population and landowners would still support an
increase if it meant an increased risk to public safety.
• Human-centered reasons do not cause this defection from support, as a majority of all
groups would still support an increase if it meant that additional/special bear hunting
seasons would need to be opened to manage bear, if bear-proof trash containers were
necessitated, if more bears would be killed because of conflicts with humans, and if
government staff would spend more time on bears.
o The results of all the possible consequences (there were nine of them tested) are
shown together on four graphs: strongly support by itself, strongly and moderately
support combined, strongly and moderately oppose combined, and then strongly
oppose by itself.
o The regional results of the general population survey suggest that North/East Region
residents (of those who support an increase in bear population) would still be more
supportive of an increase with nearly all the consequences, compared to Central
Region residents. (South Region residents could not be included in the regional
analysis because not enough of them wanted to see an increase in the bear population
to get the follow-up questions.)
� The survey presented to respondents a series of possible factors that could be considered in
the management of bear. For each factor, respondents rated it from 0 (not at all important) to
10 (extremely important).
• The top-rated factor is the health of the typical bear (mean ratings ranging from 7.6 to
8.4)—an ecological factor. This was followed by providing moose hunting opportunities
(mean of 7.0 to 8.1)—these top two being markedly above the others. Risks to public
safety and risk to pets/livestock are in the middle, along with impacts on other wildlife.
• After that, the importance markedly drops for damage to agriculture, risks of vehicle
collisions, and damage to gardens.
o The regional analysis of the landowner survey finds some differences. Those
landowners whose largest tract is in the North/East Region give a markedly higher
rating to the importance of impacts on other wildlife as a factor. Meanwhile, those

Opinions of Residents, Landowners, and Hunters on Deer, Moose, Bear, and Turkey 197
whose largest tract is in the Central Region give a markedly lower rating to risks to
public safety or risks to pets/livestock.
� Support for legal bear hunting as a method to help manage bear is high: from 87% to 95%
support, most of it strong support. Only 9% or less oppose it.
� Each group is split on opinion regarding allowing the bear population to expand into central
and southern Maine. While a majority of each group support doing so, there is substantial
opposition. Among the general population, 54% support, but 30% oppose. Among
landowners, 54% support, while 29% oppose. Finally, among hunters, 63% support, but
25% oppose.
• In the general population survey, the regional analysis finds residents of the South Region
with slightly higher opposition.
• A regional breakdown of the landowners, based on where the largest tract is located,
finds that the differences are primarily between strong and moderate answers rather than
overall support or overall opposition.
• Interestingly, while the regions are about the same in the regional analysis of the hunter
survey, nonresidents are more supportive of allowing the bear population to expand
further into central and southern Maine.

198 Responsive Management
23
34
16
5
22
25
32
22
6
15
36
36
10
3
15
0 20 40 60 80 100
Excellent
Good
Fair
Poor
Don't know
Percent
Overall, how would you rate bear management in Maine? (Overall)
General Population (n=933)
Landowners (n=304)
Hunters (n=956)
57%
57%
72%
21%
28%
13%

Opinions of Residents, Landowners, and Hunters on Deer, Moose, Bear, and Turkey 199
29
29
21
6
15
22
36
17
5
20
21
34
13
6
27
0 20 40 60 80 100
Excellent
Good
Fair
Poor
Don't know
Percent
Overall, how would you rate bear management in Maine? (General Population)
Lives in the North/EastRegion (n=301)
Lives in the Central Region(n=331)
Lives in the South Region(n=301)
27% 22%
19%

200 Responsive Management
33
37
16
6
8
20
31
26
4
18
24
30
18
11
17
0 20 40 60 80 100
Excellent
Good
Fair
Poor
Don't know
Percent
Overall, how would you rate bear management in Maine? (Landowners)
Largest tract is in theNorth/East Region (n=105)
Largest tract is in the CentralRegion (n=112)
Largest tract is in the SouthRegion (n=87)

Opinions of Residents, Landowners, and Hunters on Deer, Moose, Bear, and Turkey 201
5
56
4
31
4
4
71
8
16
0
8
67
6
18
1
0 20 40 60 80 100
Increased
Remain the same
Decreased
There are no bearin the area
Don't know
Percent
In your opinion, should the bear population in the area where you live be increased, remain the same, or be decreased? Or are there no bear in
the area where you live? (Asked of Maine residents.) (Overall)
General Population (n=933)
Landowners (n=304)
Hunters (n=400)

202 Responsive Management
6
70
8
12
4
9
58
3
25
5
2
50
3
43
2
0 20 40 60 80 100
Increased
Remain the same
Decreased
There are no bearin the area
Don't know
Percent
In your opinion, should the bear population in the area where you live be increased, remain the same, or be decreased? Or are there no bear in
the area where you live? (Asked of Maine residents.) (General Population)
Lives in the North/EastRegion (n=301)
Lives in the Central Region(n=331)
Lives in the South Region(n=301)

Opinions of Residents, Landowners, and Hunters on Deer, Moose, Bear, and Turkey 203
8
74
14
4
1
7
70
4
18
1
10
56
2
31
2
0 20 40 60 80 100
Increased
Remain the same
Decreased
There are no bearin the area
Don't know
Percent
In your opinion, should the bear population in the area where you live be increased, remain the same, or be decreased? Or are there no bear in
the area where you live? (Asked of Maine residents.) (Hunters)
Lives in the North/EastRegion (n=138)
Lives in the Central Region(n=137)
Lives in the South Region(n=125)

204 Responsive Management
65
41
32
33
29
27
24
22
17
13
47
26
39
25
20
34
14
8
73
41
41
31
39
32
30
33
19
0 20 40 60 80 100
Additional or special bear hunting seasons hadto be opened to manage the bear population
Private citizens would be required to purchasebear-resistant garbage containers
Private citizens would be required to resolvebear nuisance issues on their own
An increased likelihood that bear would damageagricultural crops, gardens, and beehives
Government staff would need to spend moretime on bear nuisance or conflict complaints
More bears had to be killed in response toconflicts
Increased likelihood that bear would damageprivate property in general
An increased risk to public safety
Poor health overall for the bear population
Percent
Percent who would strongly support increasing bear population in area where they live if it
meant the following. (Asked of ME residents who think the bear population in their area
should be increased.) (Overall)
General Population (n=59)
Landowners (n=18)
Hunters (n=32)

Opinions of Residents, Landowners, and Hunters on Deer, Moose, Bear, and Turkey 205
88
72
57
60
54
44
49
44
28
76
64
66
60
35
66
50
46
15
92
57
68
60
64
61
56
59
24
0 20 40 60 80 100
Additional or special bear hunting seasons had tobe opened to manage the bear population
Private citizens would be required to purchasebear-resistant garbage containers
More bears had to be killed in response toconflicts
Government staff would need to spend more timeon bear nuisance or conflict complaints
Private citizens would be required to resolve bearnuisance issues on their own
Increased likelihood that bear would damageprivate property in general
An increased likelihood that bear would damageagricultural crops, gardens, and beehives
An increased risk to public safety
Poor health overall for the bear population
Percent
Percent who would strongly support or moderately support increasing bear population in area where they live if it meant the following.
(Asked of ME residents who think the bear population in their area should be increased.)
(Overall)
General Population(n=59)
Landowners (n=18)
Hunters (n=32)

206 Responsive Management
65
39
38
42
36
37
26
26
8
75
34
36
34
50
33
32
25
24
66
37
36
30
27
24
34
31
5
0 20 40 60 80 100
Poor health overall for the bear population
An increased likelihood that bear would damageagricultural crops, gardens, and beehives
An increased risk to public safety
Increased likelihood that bear would damageprivate property in general
Private citizens would be required to resolvebear nuisance issues on their own
More bears had to be killed in response toconflicts
Private citizens would be required to purchasebear-resistant garbage containers
Government staff would need to spend moretime on bear nuisance or conflict complaints
Additional or special bear hunting seasons hadto be opened to manage the bear population
Percent
Percent who would moderately oppose or strongly oppose increasing bear population in area where they live if it meant the following. (Asked of ME residents who think the bear
population in their area should be increased.) (Overall)
General Population (n=59)
Landowners (n=18)
Hunters (n=32)

Opinions of Residents, Landowners, and Hunters on Deer, Moose, Bear, and Turkey 207
33
23
15
11
13
14
9
10
7
58
26
15
9
11
3
1
1
15
49
19
17
17
10
10
13
7
5
0 20 40 60 80 100
Poor health overall for the bear population
Private citizens would be required to resolvebear nuisance issues on their own
More bears had to be killed in response toconflicts
Private citizens would be required to purchasebear-resistant garbage containers
An increased risk to public safety
Government staff would need to spend moretime on bear nuisance or conflict complaints
An increased likelihood that bear woulddamage agricultural crops, gardens, and
beehives
Increased likelihood that bear would damageprivate property in general
Additional or special bear hunting seasons hadto be opened to manage the bear population
Percent
Percent who would strongly oppose increasing bear population in area where they live if it
meant the following. (Asked of ME residents who think the bear population in their area
should be increased.) (Overall)
General Population (n=59)
Landowners (n=18)
Hunters (n=32)
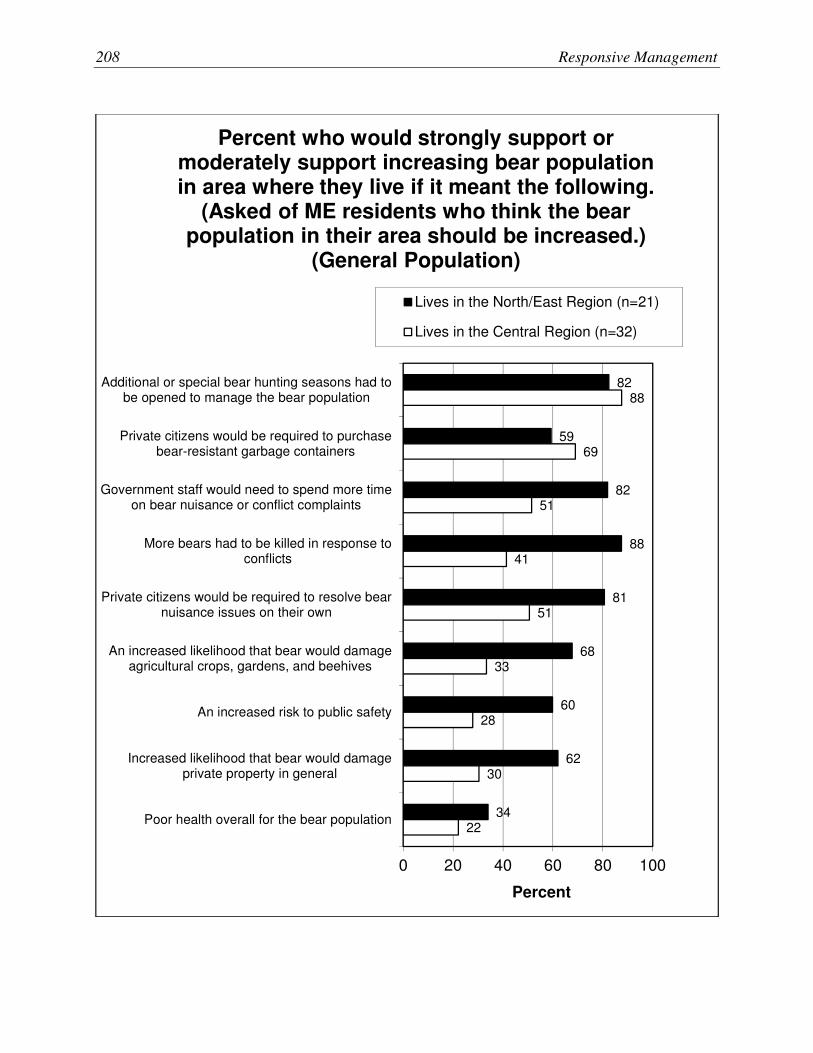
208 Responsive Management
82
59
82
88
81
68
60
62
34
88
69
51
41
51
33
28
30
22
0 20 40 60 80 100
Additional or special bear hunting seasons had tobe opened to manage the bear population
Private citizens would be required to purchasebear-resistant garbage containers
Government staff would need to spend more timeon bear nuisance or conflict complaints
More bears had to be killed in response toconflicts
Private citizens would be required to resolve bearnuisance issues on their own
An increased likelihood that bear would damageagricultural crops, gardens, and beehives
An increased risk to public safety
Increased likelihood that bear would damageprivate property in general
Poor health overall for the bear population
Percent
Percent who would strongly support or moderately support increasing bear population in area where they live if it meant the following.
(Asked of ME residents who think the bear population in their area should be increased.)
(General Population)
Lives in the North/East Region (n=21)
Lives in the Central Region (n=32)

Opinions of Residents, Landowners, and Hunters on Deer, Moose, Bear, and Turkey 209
7.6
7.0
6.4
5.2
5.1
4.7
4.4
4.2
7.6
7.1
5.3
4.9
4.8
4.8
3.6
4.1
8.4
8.1
5.7
5.2
5.4
4.6
4.1
4.0
0 2 4 6 8 10
The health of the typicalbear
Providing bear huntingopportunities
Risks to public safety
Risk to pets or livestock
Impacts on other wildlife
Damage to agriculturalcrops
Risk of vehicle collisionswith bear
Damage to gardens
Mean
On a scale of 0 to 10, where 0 is not at all important and 10 is extremely important, how important do you think each of the following
factors should be for managing the bear population in Maine? (Overall)
General Population (597≤n≤649)
Landowners (161≤n≤215)
Hunters (276≤n≤319)

210 Responsive Management
7.9
7.3
5.9
5.4
4.8
5.7
4.1
3.4
7.5
7.2
4.5
4.3
4.6
4.4
3.8
3.6
7.4
6.4
6.3
5.5
5.3
4.8
4.6
3.7
0 2 4 6 8 10
The health of the typicalbear
Providing bear huntingopportunities
Risks to public safety
Risk to pets or livestock
Damage to agricultural crops
Impacts on other wildlife
Damage to gardens
Risk of vehicle collisions withbear
Mean
On a scale of 0 to 10, where 0 is not at all important and 10 is extremely important, how important do you think each of the following
factors should be for managing the bear population in Maine? (Landowners)
Largest tract is in the North/East Region (51≤n≤73)
Largest tract is in the Central Region (58≤n≤82)
Largest tract is in the South Region (44≤n≤60)
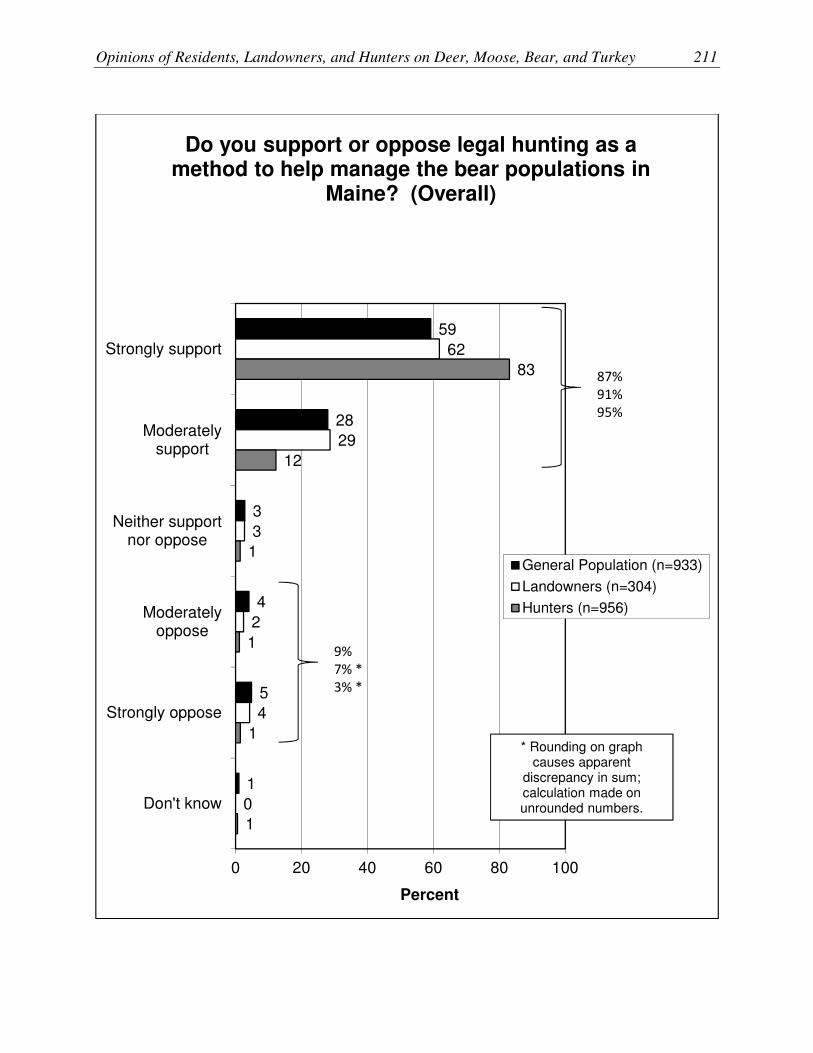
Opinions of Residents, Landowners, and Hunters on Deer, Moose, Bear, and Turkey 211
59
28
3
4
5
1
62
29
3
2
4
0
83
12
1
1
1
1
0 20 40 60 80 100
Strongly support
Moderatelysupport
Neither supportnor oppose
Moderatelyoppose
Strongly oppose
Don't know
Percent
Do you support or oppose legal hunting as a method to help manage the bear populations in
Maine? (Overall)
General Population (n=933)
Landowners (n=304)
Hunters (n=956)
87%
91%
95%
9%
7% *
3% *
* Rounding on graph causes apparent
discrepancy in sum; calculation made on unrounded numbers.

212 Responsive Management
23
31
9
17
14
6
24
30
11
17
12
6
39
24
8
12
12
4
0 20 40 60 80 100
Strongly support
Moderatelysupport
Neither supportnor oppose
Moderatelyoppose
Strongly oppose
Don't know
Percent
Do you support or oppose allowing the bear population to expand further into central and
southern Maine? (Overall)
General Population (n=845)
Landowners (n=304)
Hunters (n=956)
54%
54%
63%
30% *
29%
25% *
* Rounding on graph causes apparent
discrepancy in sum; calculation made on unrounded numbers.

Opinions of Residents, Landowners, and Hunters on Deer, Moose, Bear, and Turkey 213
30
28
9
14
11
9
25
32
10
14
13
6
21
31
8
20
15
5
0 20 40 60 80 100
Strongly support
Moderatelysupport
Neither supportnor oppose
Moderatelyoppose
Strongly oppose
Don't know
Percent
Do you support or oppose allowing the bear population to expand further into central and
southern Maine? (General Population)
Lives in the North/EastRegion (n=301)
Lives in the Central Region(n=243)
Lives in the South Region(n=301)
57% * 57% 52%
25% 27%
35%
* Rounding on graph causes apparent discrepancy in
sum; calculation made on unrounded numbers.

214 Responsive Management
18
33
12
18
7
12
29
26
12
19
13
1
19
36
8
11
18
7
0 20 40 60 80 100
Strongly support
Moderatelysupport
Neither supportnor oppose
Moderatelyoppose
Strongly oppose
Don't know
Percent
Do you support or oppose allowing the bear population to expand further into central and
southern Maine? (Landowners)
Largest tract is in theNorth/East Region (n=105)
Largest tract is in the CentralRegion (n=112)
Largest tract is in the SouthRegion (n=87)
51% 55%
55%
25% 31% *
29%
* Rounding on graph causes apparent
discrepancy in sum; calculation made on unrounded numbers.
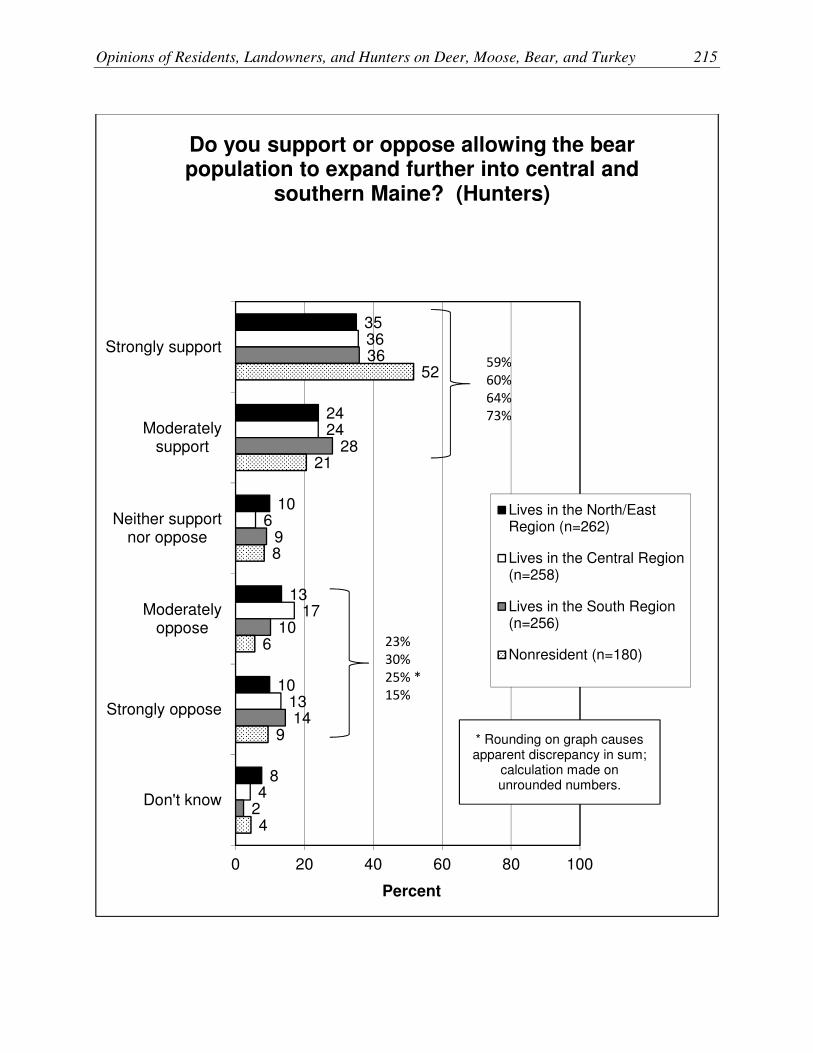
Opinions of Residents, Landowners, and Hunters on Deer, Moose, Bear, and Turkey 215
35
24
10
13
10
8
36
24
6
17
13
4
36
28
9
10
14
2
52
21
8
6
9
4
0 20 40 60 80 100
Strongly support
Moderatelysupport
Neither supportnor oppose
Moderatelyoppose
Strongly oppose
Don't know
Percent
Do you support or oppose allowing the bear population to expand further into central and
southern Maine? (Hunters)
Lives in the North/EastRegion (n=262)
Lives in the Central Region(n=258)
Lives in the South Region(n=256)
Nonresident (n=180)
59% 60% 64%
73%
23% 30% 25% *
15%
* Rounding on graph causes apparent discrepancy in sum;
calculation made on unrounded numbers.
216 Responsive Management
TURKEY MANAGEMENT
� Ratings of turkey management in Maine are more positive than negative, with 49% to 58%
giving a positive rating of excellent or good, but 28% to 34% giving a rating of turkey
management as only fair or poor. The percentages who do not know range from 14%
to 18%.
• The region with the most positive ratings is the South Region in the general population
survey (54% of them give a rating of excellent or good, compared to no more than 45%
in the other regions); the region with the most negative ratings is the Central Region
(43% of them give a rating of fair or poor, compared to no more than 30% of any other
region).
• In the landowner survey, the regional breakdown by where the largest tract is located
finds poor ratings higher among South Region landowners than in the other regions.
• The regional analysis of hunters based on where they live finds some differences: the best
ratings come from hunters living in the South Region, while hunters living in the Central
Region have a slightly higher percentage giving a poor rating than the other Regions.
� The majority of each group says the turkey population should remain the same (from 52% to
62%). However, the remainder more often want a decrease than an increase: from 27% to
31% want to see a decrease, compared to just 6% to 13% who want an increase. This is the
only species of the four in the survey for which decrease is markedly more than increase.
• Of the three regions, residents in the general population survey of the North/East Region
are the most likely to want to see an increase; residents of the Central Region are the
most likely to want to see a decrease.
• The regional analysis of the landowner survey found that landowners living in the Central
Region are the region most often wanting to see the population remain the same;
landowners living in the North/East Region are the most likely of the three regions to
want an increase.
• In the hunter survey, the regional analysis shows that hunters who live in the North/East
Region are the most likely to want an increase.

Opinions of Residents, Landowners, and Hunters on Deer, Moose, Bear, and Turkey 217
� A series of follow-up questions was asked of those who said that they wanted to see an
increase in turkey populations, asking if they would support or oppose an increase based on
seven possible consequences of an increase.
• In the face of ecological consequences (more turkey dying from starvation in winter; poor
health overall for the turkey population), most of those who formerly supported an
increase no longer support it.
• The human-centered consequences do not cause this defection from support (that private
citizens would be required to resolve problems on their own; that there would be an
increase in damage to gardens, landscaping, or agriculture), nor does the consequence of
an increase in predators (being seen, perhaps, as a positive ecological consequence or at
least a “natural” ecological consequence).
o The results of all seven questions are shown together. There are four graphs:
strongly support on its own, strongly and moderately support combined, strongly and
moderately oppose combined, and then strongly oppose on its own.
o The regional results of the general population survey suggest that Central Region
residents are more likely to change to opposition when presented with negative
ecological consequences or with negative impacts to agriculture than are residents of
other regions.
� The survey presented to respondents a series of possible factors that could be considered in
the management of turkey. For each factor, respondents rated it from 0 (not at all important)
to 10 (extremely important).
• Turkey hunting is valued in Maine, as the top-rated factor is providing turkey hunting
opportunities (mean of 7.4 to 8.3), closely followed by the health of the typical turkey in
the population (mean of 7.4 to 7.9). There is a drop in importance placed on the next
items: the opportunity to see turkey (6.1 to 6.9) and damage to agriculture (5.8 to 6.5).
• Lowest in importance are damage to gardens (5.2 to 5.7) and the risk of vehicle collisions
with turkey (4.6 to 5.0).
o In the landowner survey, the regional analysis finds that those landowners whose
largest tract is in the South Region are more concerned about damage to gardens and
risk of vehicle collisions.
218 Responsive Management
� Support for legal turkey hunting as a method to help manage turkey is high: from 92% to
98% support, most of it strong support. Only 5% or less oppose it.
� A series of possible turkey management options in the event that turkey became
overabundant in an area was presented in the survey, and respondents were asked whether
they would support or oppose each one. For each of all four options, an overwhelming
majority would support it (no less than 77% among any group for any option), and in fact a
majority of the general population would strongly support it, ranging from 54% to 61%.
Strong support is a little higher among landowners, ranging from 55% up to 71%, and then
markedly higher among hunters, ranging from 78% to 82%. For all groups, the least favored
is extending the hunting season later into the fall or winter; the three other options are about
even with one another and just slightly higher than that last-placed option. Opposition is no
more than 17% among any group for any of the four options.
• The three items with the most support are: implementing a controlled hunt in areas
experiencing damage from turkeys, allowing landowners to apply for a permit to remove
turkeys that are causing problems on their land, and increasing the bag limit for turkey in
areas experiencing damage.
o Four graphs are shown: strongly support by itself, strongly and moderately support
combined, strongly and moderately oppose combined, and then strongly oppose by
itself.
o Two graphs are included that suggest that South Region residents in the general
population survey are different than residents of the other regions regarding their
opinion on extending the hunting season later into the fall or winter, being more
opposed to it than their counterparts in other regions.

Opinions of Residents, Landowners, and Hunters on Deer, Moose, Bear, and Turkey 219
18
31
22
11
18
18
34
16
17
15
24
34
15
13
14
0 20 40 60 80 100
Excellent
Good
Fair
Poor
Don't know
Percent
Overall, how would you rate turkey management in Maine? (Overall)
General Population (n=933)
Landowners (n=304)
Hunters (n=956)
49%
52%
58%
34% *
33%
28%
* Rounding on graph causes apparent
discrepancy in sum; calculation made on unrounded numbers.
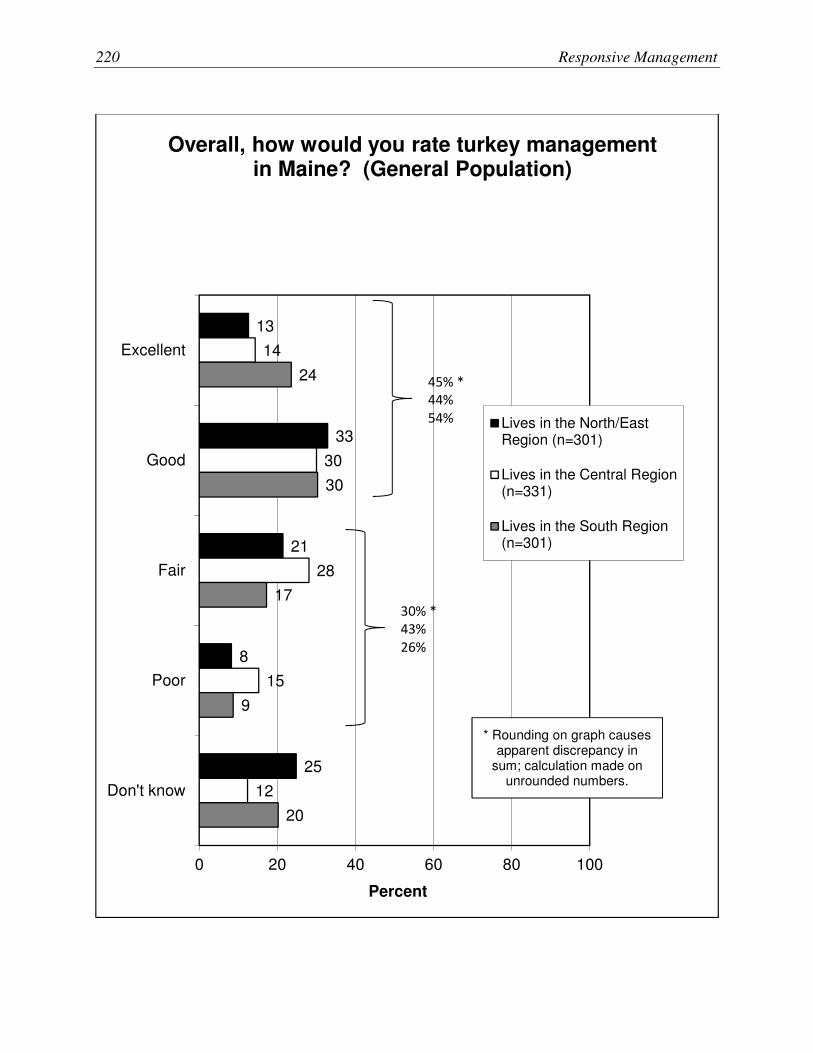
220 Responsive Management
13
33
21
8
25
14
30
28
15
12
24
30
17
9
20
0 20 40 60 80 100
Excellent
Good
Fair
Poor
Don't know
Percent
Overall, how would you rate turkey management in Maine? (General Population)
Lives in the North/EastRegion (n=301)
Lives in the Central Region(n=331)
Lives in the South Region(n=301)
30% * 43%
26%
* Rounding on graph causes apparent discrepancy in
sum; calculation made on unrounded numbers.
45% * 44%
54%

Opinions of Residents, Landowners, and Hunters on Deer, Moose, Bear, and Turkey 221
22
31
17
13
17
14
38
14
17
17
22
29
18
24
8
0 20 40 60 80 100
Excellent
Good
Fair
Poor
Don't know
Percent
Overall, how would you rate turkey management in Maine? (Landowners)
Largest tract is in theNorth/East Region (n=105)
Largest tract is in the CentralRegion (n=112)
Largest tract is in the SouthRegion (n=87)
53% 52%
51%
30% 31%
41% *
* Rounding on graph causes apparent discrepancy in
sum; calculation made on unrounded numbers.

222 Responsive Management
20
36
20
10
14
24
33
18
19
7
34
36
14
13
4
17
32
7
3
42
0 20 40 60 80 100
Excellent
Good
Fair
Poor
Don't know
Percent
Overall, how would you rate turkey management in Maine? (Hunters)
Lives in the North/EastRegion (n=262)
Lives in the Central Region(n=258)
Lives in the South Region(n=256)
Nonresident (n=180)
31% *
36% *
27%
10%
56%
57%
70%
48% *
* Rounding on graph causes apparent discrepancy in
sum; calculation made on unrounded numbers.

Opinions of Residents, Landowners, and Hunters on Deer, Moose, Bear, and Turkey 223
8
55
27
6
3
6
62
29
2
1
13
52
31
4
1
0 20 40 60 80 100
Increased
Remain the same
Decreased
There are noturkey in the area
Don't know
Percent
In your opinion, should the turkey population in the area where you live be increased, remain the same, or be decreased? Or are there no turkey
in the area where you live? (Asked of Maine residents.) (Overall)
General Population (n=933)
Landowners (n=304)
Hunters (n=386)

224 Responsive Management
21
46
18
11
4
5
51
35
6
3
5
63
23
5
4
0 20 40 60 80 100
Increased
Remain the same
Decreased
There are noturkey in the area
Don't know
Percent
In your opinion, should the turkey population in the area where you live be increased, remain the same, or be decreased? Or are there no turkey
in the area where you live? (Asked of Maine residents.) (General Population)
Lives in the North/EastRegion (n=301)
Lives in the Central Region(n=331)
Lives in the South Region(n=301)

Opinions of Residents, Landowners, and Hunters on Deer, Moose, Bear, and Turkey 225
13
53
25
9
0
3
69
27
0
1
5
56
38
0
1
0 20 40 60 80 100
Increased
Remain the same
Decreased
There are noturkey in the area
Don't know
Percent
In your opinion, should the turkey population in the area where you live be increased, remain the same, or be decreased? Or are there no turkey
in the area where you live? (Asked of Maine residents.) (Landowners)
Lives in the North/EastRegion (n=102)
Lives in the Central Region(n=112)
Lives in the South Region(n=90)
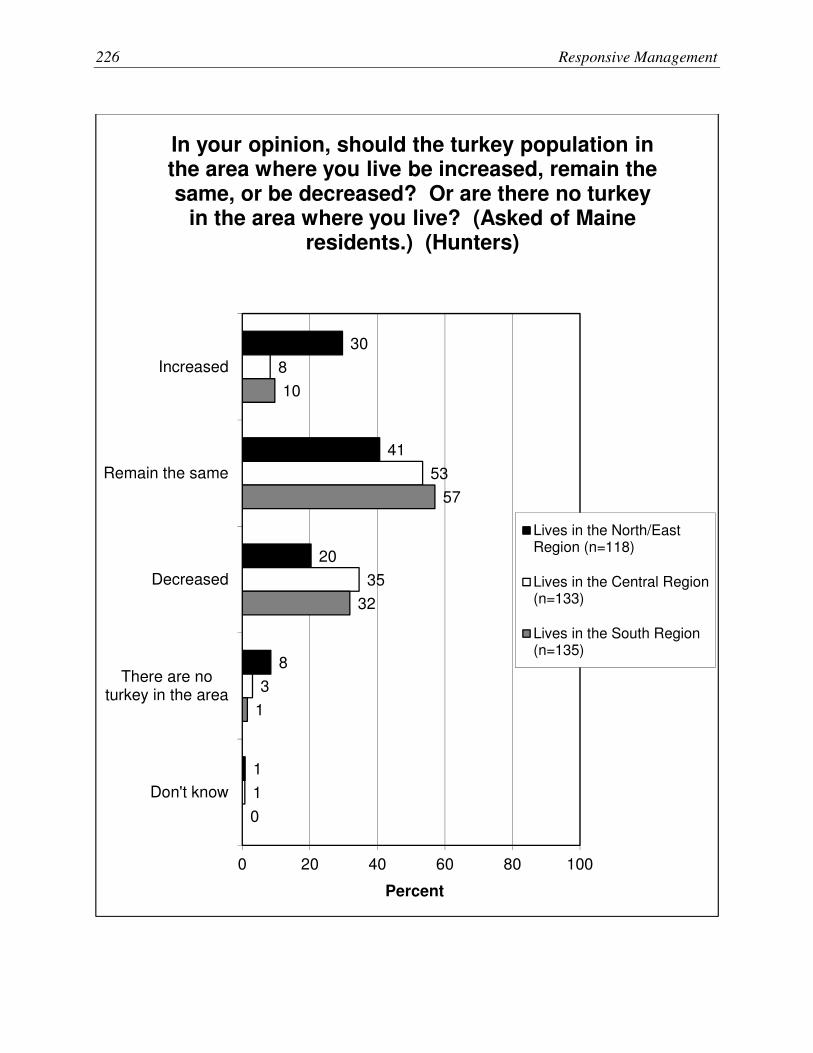
226 Responsive Management
30
41
20
8
1
8
53
35
3
1
10
57
32
1
0
0 20 40 60 80 100
Increased
Remain the same
Decreased
There are noturkey in the area
Don't know
Percent
In your opinion, should the turkey population in the area where you live be increased, remain the same, or be decreased? Or are there no turkey
in the area where you live? (Asked of Maine residents.) (Hunters)
Lives in the North/EastRegion (n=118)
Lives in the Central Region(n=133)
Lives in the South Region(n=135)

Opinions of Residents, Landowners, and Hunters on Deer, Moose, Bear, and Turkey 227
32
26
27
20
21
7
6
59
42
13
31
1
13
7
57
32
34
22
18
17
10
0 20 40 60 80 100
Private citizens would be required to resolveturkey nuisance issues on their own
An increased likelihood that turkey woulddamage gardens or landscaping
An increase in predator populations, such asbobcat or coyotes
An increased likelihood that turkey woulddamage agricultural crops
That Department biologists would spend moretime on turkey management and less time on
other species
Poor health overall for the turkey population
More turkey would die from starvation duringwinter
Percent
Percent who would strongly support increasing turkey population in area where they live if it meant the following. (Asked of ME residents who think the turkey population in their area
should be increased.) (Overall)
General Population (100≤n≤103)
Landowners (n=22)
Hunters (n=59)

228 Responsive Management
77
64
64
56
52
25
21
84
59
56
54
25
14
31
77
59
53
53
45
32
25
0 20 40 60 80 100
Private citizens would be required to resolveturkey nuisance issues on their own
An increased likelihood that turkey would damagegardens or landscaping
An increase in predator populations, such asbobcat or coyotes
An increased likelihood that turkey would damageagricultural crops
That Department biologists would spend moretime on turkey management and less time on
other species
Poor health overall for the turkey population
More turkey would die from starvation duringwinter
Percent
Percent who would strongly support or moderately support increasing turkey
population in area where they live if it meant the following. (Asked of ME residents who think the
turkey population in their area should be increased.) (Overall)
General Population (100≤n≤103)
Landowners (n=22)
Hunters (n=59)
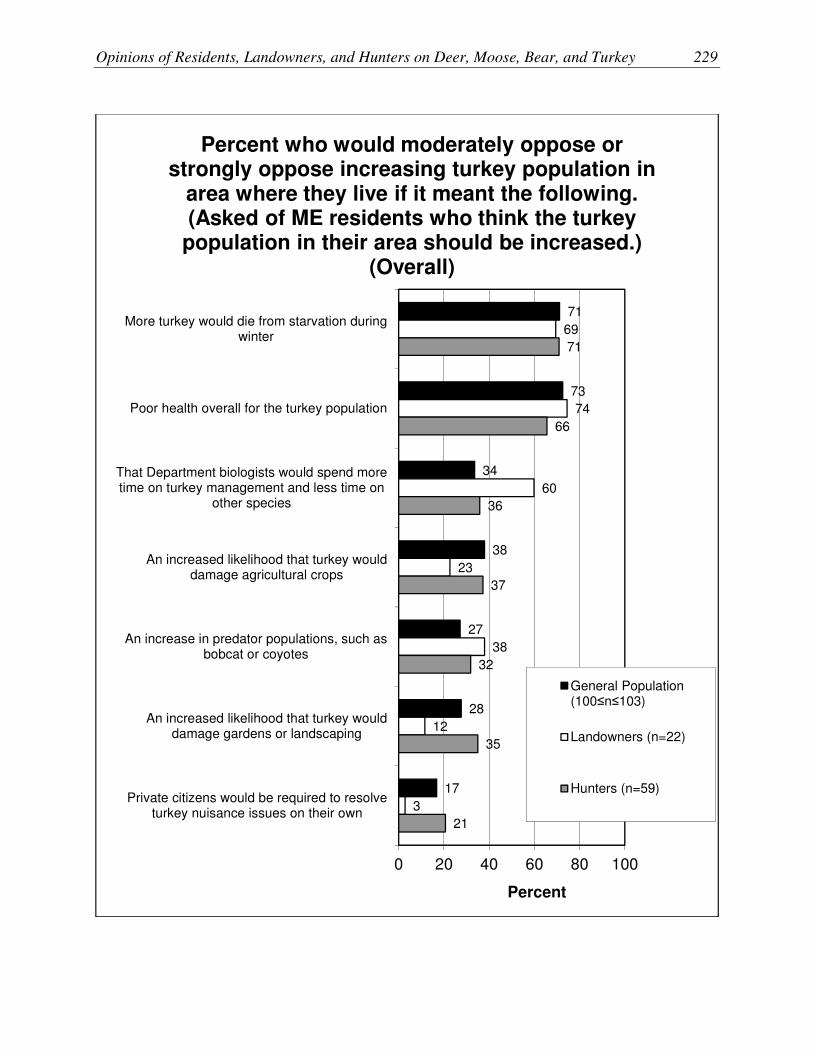
Opinions of Residents, Landowners, and Hunters on Deer, Moose, Bear, and Turkey 229
71
73
34
38
27
28
17
69
74
60
23
38
12
3
71
66
36
37
32
35
21
0 20 40 60 80 100
More turkey would die from starvation duringwinter
Poor health overall for the turkey population
That Department biologists would spend moretime on turkey management and less time on
other species
An increased likelihood that turkey woulddamage agricultural crops
An increase in predator populations, such asbobcat or coyotes
An increased likelihood that turkey woulddamage gardens or landscaping
Private citizens would be required to resolveturkey nuisance issues on their own
Percent
Percent who would moderately oppose or strongly oppose increasing turkey population in
area where they live if it meant the following. (Asked of ME residents who think the turkey
population in their area should be increased.) (Overall)
General Population (100≤n≤103)
Landowners (n=22)
Hunters (n=59)
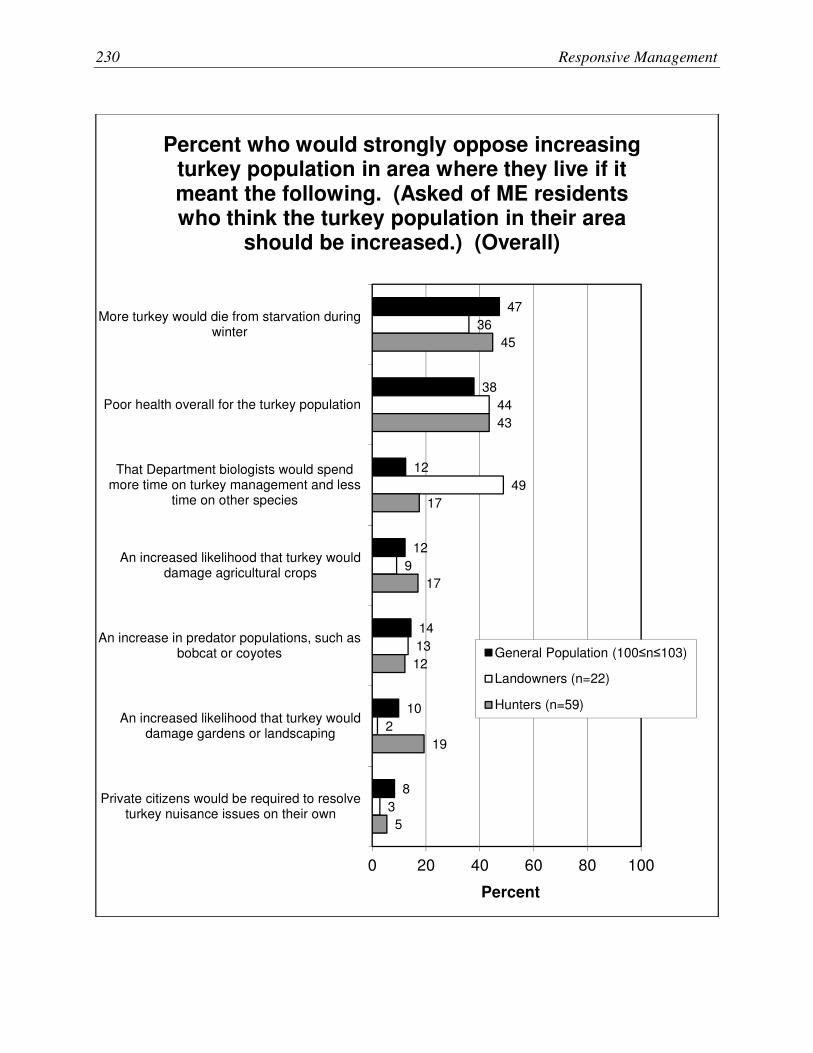
230 Responsive Management
47
38
12
12
14
10
8
36
44
49
9
13
2
3
45
43
17
17
12
19
5
0 20 40 60 80 100
More turkey would die from starvation duringwinter
Poor health overall for the turkey population
That Department biologists would spendmore time on turkey management and less
time on other species
An increased likelihood that turkey woulddamage agricultural crops
An increase in predator populations, such asbobcat or coyotes
An increased likelihood that turkey woulddamage gardens or landscaping
Private citizens would be required to resolveturkey nuisance issues on their own
Percent
Percent who would strongly oppose increasing turkey population in area where they live if it meant the following. (Asked of ME residents who think the turkey population in their area
should be increased.) (Overall)
General Population (100≤n≤103)
Landowners (n=22)
Hunters (n=59)

Opinions of Residents, Landowners, and Hunters on Deer, Moose, Bear, and Turkey 231
63
62
32
31
23
24
13
88
94
63
35
38
33
15
71
64
24
37
24
27
23
0 20 40 60 80 100
Poor health overall for the turkey population
More turkey would die from starvation duringwinter
An increased likelihood that turkey woulddamage agricultural crops
That Department biologists would spend moretime on turkey management and less time on
other species
An increased likelihood that turkey woulddamage gardens or landscaping
An increase in predator populations, such asbobcat or coyotes
Private citizens would be required to resolveturkey nuisance issues on their own
Percent
Percent who would moderately oppose or strongly oppose increasing turkey population in
area where they live if it meant the following. (Asked of ME residents who think the turkey
population in their area should be increased.) (General Population)
Lives in the North/East Region (n=65)
Lives in the Central Region (15≤n≤18)
Lives in the South Region (n=20)
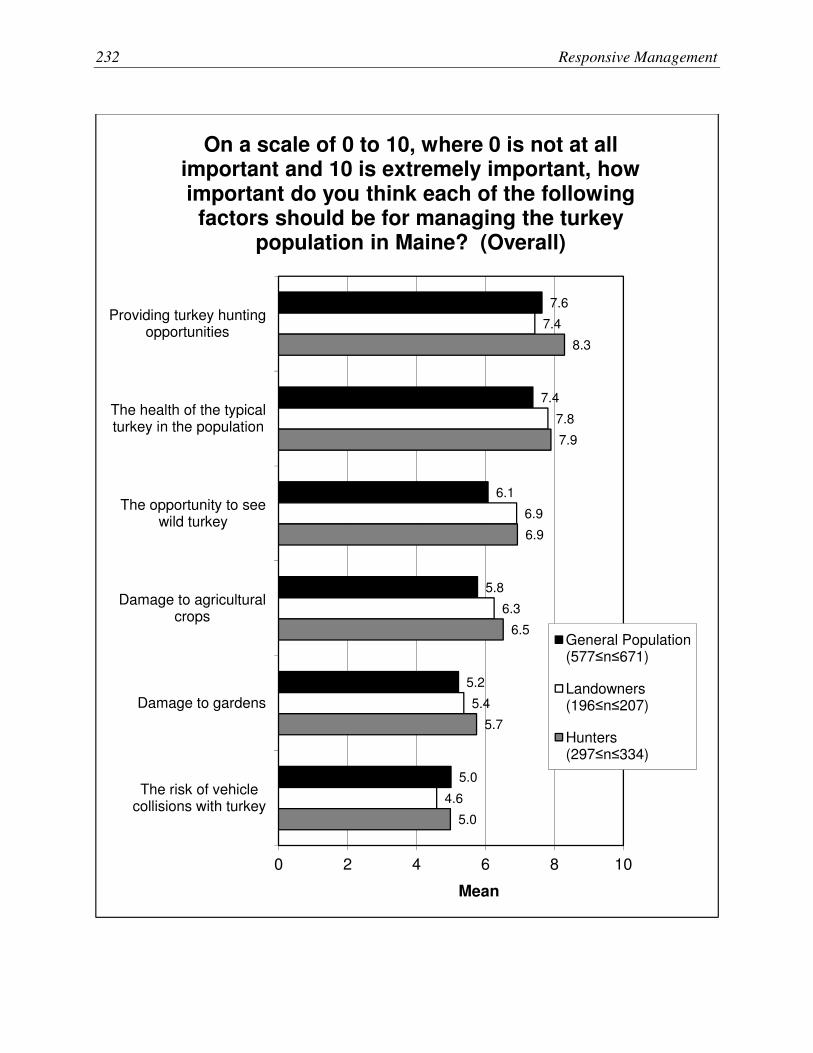
232 Responsive Management
7.6
7.4
6.1
5.8
5.2
5.0
7.4
7.8
6.9
6.3
5.4
4.6
8.3
7.9
6.9
6.5
5.7
5.0
0 2 4 6 8 10
Providing turkey huntingopportunities
The health of the typicalturkey in the population
The opportunity to seewild turkey
Damage to agriculturalcrops
Damage to gardens
The risk of vehiclecollisions with turkey
Mean
On a scale of 0 to 10, where 0 is not at all important and 10 is extremely important, how important do you think each of the following factors should be for managing the turkey
population in Maine? (Overall)
General Population (577≤n≤671)
Landowners (196≤n≤207)
Hunters (297≤n≤334)
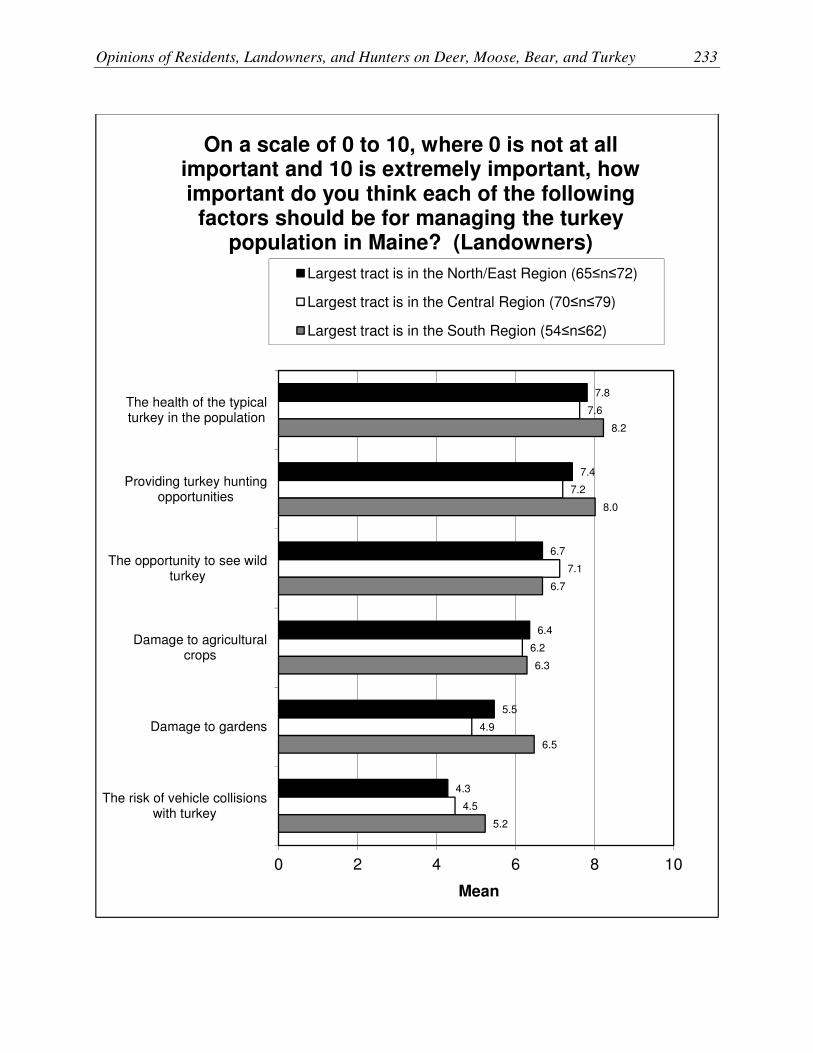
Opinions of Residents, Landowners, and Hunters on Deer, Moose, Bear, and Turkey 233
7.8
7.4
6.7
6.4
5.5
4.3
7.6
7.2
7.1
6.2
4.9
4.5
8.2
8.0
6.7
6.3
6.5
5.2
0 2 4 6 8 10
The health of the typicalturkey in the population
Providing turkey huntingopportunities
The opportunity to see wildturkey
Damage to agriculturalcrops
Damage to gardens
The risk of vehicle collisionswith turkey
Mean
On a scale of 0 to 10, where 0 is not at all important and 10 is extremely important, how important do you think each of the following factors should be for managing the turkey
population in Maine? (Landowners)
Largest tract is in the North/East Region (65≤n≤72)
Largest tract is in the Central Region (70≤n≤79)
Largest tract is in the South Region (54≤n≤62)

234 Responsive Management
70
22
3
2
2
1
74
18
2
2
3
0
92
7
0
0
0
1
0 20 40 60 80 100
Strongly support
Moderatelysupport
Neither supportnor oppose
Moderatelyoppose
Strongly oppose
Don't know
Percent
Do you support or oppose legal hunting as a method to help manage the turkey population in
Maine? (Overall)
General Population (n=933)
Landowners (n=304)
Hunters (n=956)
92%
93% *
98% *
5% *
5%
1% *
* Rounding on graph causes apparent
discrepancy in sum; calculation made on unrounded numbers.

Opinions of Residents, Landowners, and Hunters on Deer, Moose, Bear, and Turkey 235
61
60
60
54
69
68
71
55
82
80
78
78
0 20 40 60 80 100
Increasing the numberof turkeys that hunterscan harvest in areasexperiencing damage
by turkey
Implementing acontrolled hunt in areasexperiencing damage
by turkeys
Allowing landowners toapply for a permit to
remove turkeys that arecausing problems on
their land
Extending the huntingseason later into the fall
or winter
Percent
Percent of respondents who would strongly support each of the following turkey
management options in areas of Maine where the turkey population became overabundant.
(Overall)
General Population(n=933)
Landowners (n=304)
Hunters (n=485)
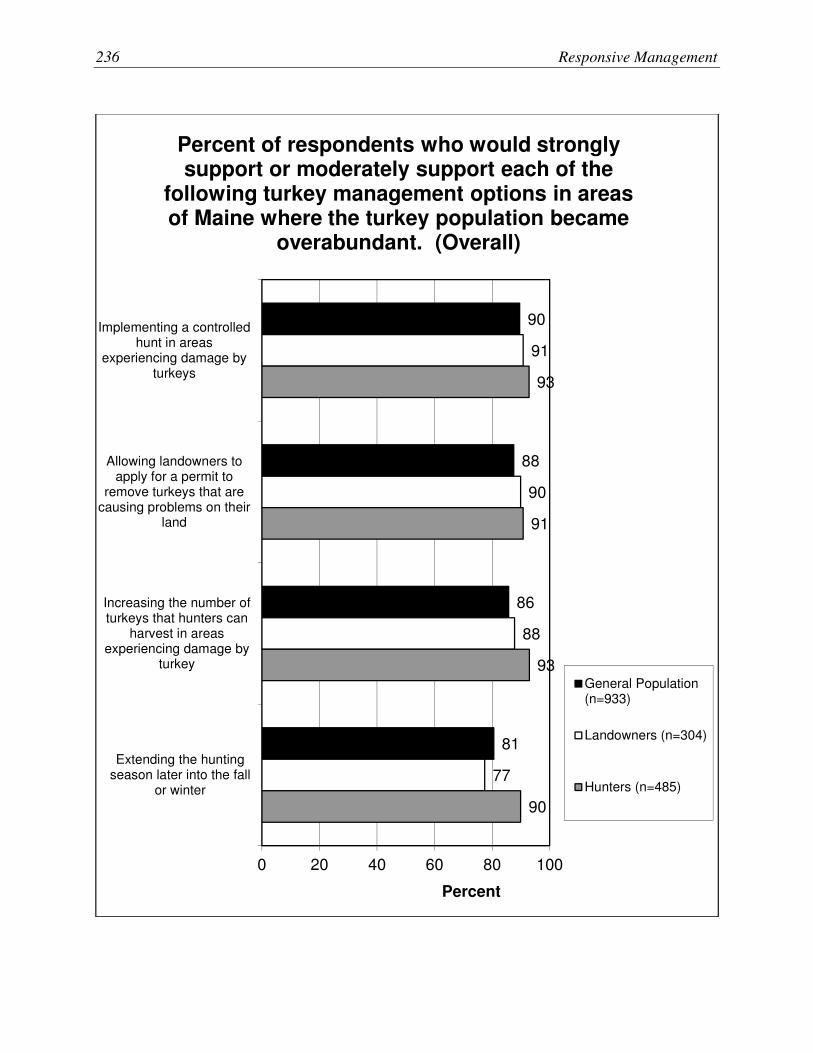
236 Responsive Management
90
88
86
81
91
90
88
77
93
91
93
90
0 20 40 60 80 100
Implementing a controlledhunt in areas
experiencing damage byturkeys
Allowing landowners toapply for a permit to
remove turkeys that arecausing problems on their
land
Increasing the number ofturkeys that hunters can
harvest in areasexperiencing damage by
turkey
Extending the huntingseason later into the fall
or winter
Percent
Percent of respondents who would strongly support or moderately support each of the
following turkey management options in areas of Maine where the turkey population became
overabundant. (Overall)
General Population(n=933)
Landowners (n=304)
Hunters (n=485)

Opinions of Residents, Landowners, and Hunters on Deer, Moose, Bear, and Turkey 237
14
8
7
6
17
10
6
5
6
5
6
5
0 20 40 60 80 100
Extending the huntingseason later into the fall
or winter
Increasing the number ofturkeys that hunters can
harvest in areasexperiencing damage by
turkey
Allowing landowners toapply for a permit to
remove turkeys that arecausing problems on
their land
Implementing acontrolled hunt in areasexperiencing damage by
turkeys
Percent
Percent of respondents who would moderately oppose or strongly oppose each of the
following turkey management options in areas of Maine where the turkey population became
overabundant. (Overall)
General Population (n=933)
Landowners (n=304)
Hunters (n=485)

238 Responsive Management
6
4
3
3
7
6
3
3
3
3
4
3
0 20 40 60 80 100
Extending the huntingseason later into the fall
or winter
Increasing the numberof turkeys that hunterscan harvest in areasexperiencing damage
by turkey
Allowing landowners toapply for a permit to
remove turkeys that arecausing problems on
their land
Implementing acontrolled hunt in areasexperiencing damage
by turkeys
Percent
Percent of respondents who would strongly oppose each of the following turkey
management options in areas of Maine where the turkey population became overabundant.
(Overall)
General Population (n=933)
Landowners (n=304)
Hunters (n=485)
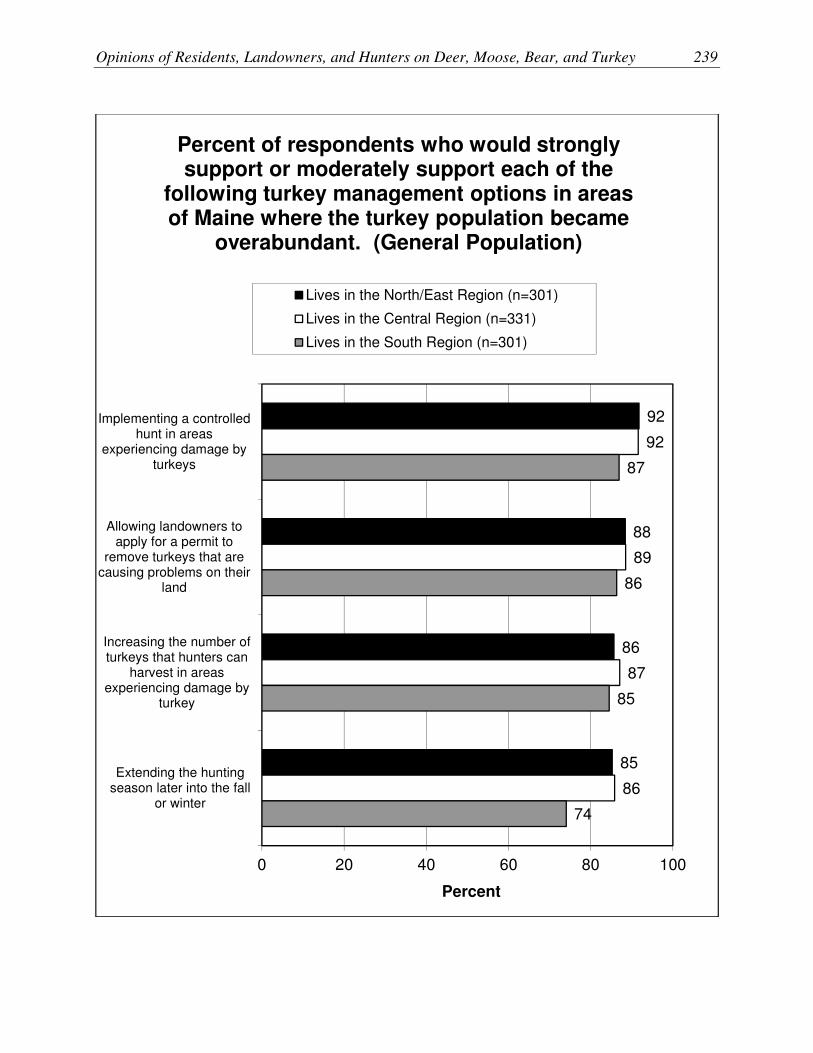
Opinions of Residents, Landowners, and Hunters on Deer, Moose, Bear, and Turkey 239
92
88
86
85
92
89
87
86
87
86
85
74
0 20 40 60 80 100
Implementing a controlledhunt in areas
experiencing damage byturkeys
Allowing landowners toapply for a permit to
remove turkeys that arecausing problems on their
land
Increasing the number ofturkeys that hunters can
harvest in areasexperiencing damage by
turkey
Extending the huntingseason later into the fall
or winter
Percent
Percent of respondents who would strongly support or moderately support each of the
following turkey management options in areas of Maine where the turkey population became
overabundant. (General Population)
Lives in the North/East Region (n=301)
Lives in the Central Region (n=331)
Lives in the South Region (n=301)

240 Responsive Management
11
10
7
6
9
6
5
4
21
10
10
7
0 20 40 60 80 100
Extending the huntingseason later into the fall
or winter
Increasing the number ofturkeys that hunters can
harvest in areasexperiencing damage by
turkey
Allowing landowners toapply for a permit to
remove turkeys that arecausing problems on
their land
Implementing acontrolled hunt in areasexperiencing damage by
turkeys
Percent
Percent of respondents who would moderately oppose or strongly oppose each of the
following turkey management options in areas of Maine where the turkey population became
overabundant. (General Population)
Lives in the North/East Region (n=301)
Lives in the Central Region (n=331)
Lives in the South Region (n=301)

Opinions of Residents, Landowners, and Hunters on Deer, Moose, Bear, and Turkey 241
95
90
89
81
89
90
87
75
90
88
89
80
0 20 40 60 80 100
Implementing a controlledhunt in areas
experiencing damage byturkeys
Allowing landowners toapply for a permit to
remove turkeys that arecausing problems on their
land
Increasing the number ofturkeys that hunters can
harvest in areasexperiencing damage by
turkey
Extending the huntingseason later into the fall
or winter
Percent
Percent of respondents who would strongly support or moderately support each of the
following turkey management options in areas of Maine where the turkey population became
overabundant. (Landowners)
Lives in the North/East Region (n=102)
Lives in the Central Region (n=112)
Lives in the South Region (n=90)

242 Responsive Management
11
10
6
3
21
9
7
5
16
11
5
7
0 20 40 60 80 100
Extending the huntingseason later into the fall
or winter
Increasing the number ofturkeys that hunters can
harvest in areasexperiencing damage by
turkey
Allowing landowners toapply for a permit to
remove turkeys that arecausing problems on
their land
Implementing acontrolled hunt in areasexperiencing damage by
turkeys
Percent
Percent of respondents who would moderately oppose or strongly oppose each of the
following turkey management options in areas of Maine where the turkey population became
overabundant. (Landowners)
Lives in the North/East Region (n=102)
Lives in the Central Region (n=112)
Lives in the South Region (n=90)

Opinions of Residents, Landowners, and Hunters on Deer, Moose, Bear, and Turkey 243
PROBLEMS WITH WILDLIFE
� While most landowners in the survey (61%) did not experience any problems with wildlife
on their largest tract of land in the past 2 years, the obverse of this means that a fairly large
percentage (39%) reported having problems.
• The most common culprits were coyotes, deer, and turkeys.
o Landowners whose largest tract is in the Central Region are the most likely to have
experienced problems.
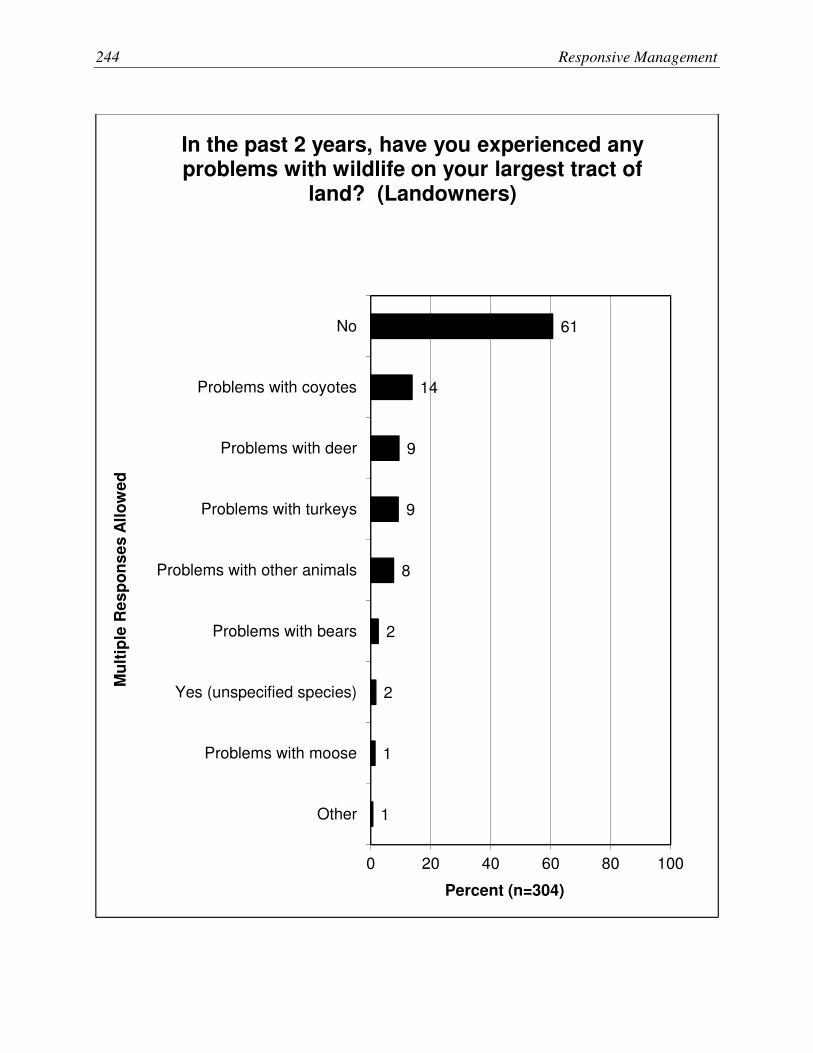
244 Responsive Management
61
14
9
9
8
2
2
1
1
0 20 40 60 80 100
No
Problems with coyotes
Problems with deer
Problems with turkeys
Problems with other animals
Problems with bears
Yes (unspecified species)
Problems with moose
Other
Percent (n=304)
Mu
ltip
le R
es
po
ns
es
All
ow
ed
In the past 2 years, have you experienced any problems with wildlife on your largest tract of
land? (Landowners)

Opinions of Residents, Landowners, and Hunters on Deer, Moose, Bear, and Turkey 245
66
8
8
10
10
5
0
5
0
56
16
10
8
7
2
3
0
1
64
15
8
10
6
1
1
0
0
0 20 40 60 80 100
No
Problems with coyotes
Problems with deer
Problems with turkeys
Problems with other animals
Problems with bears
Yes (unspecified species)
Problems with moose
Other
Percent
Mu
ltip
le R
es
po
ns
es
All
ow
ed
In the past 2 years, have you experienced any problems with wildlife on your largest tract of
land? (Landowners)
Largest tract is in theNorth/East Region (n=105)
Largest tract is in the CentralRegion (n=112)
Largest tract is in the SouthRegion (n=87)

246 Responsive Management
DEMOGRAPHIC DATA
� The following demographic data were gathered:
• Gender: This is shown for the general population (the general population sample was
weighted by gender and age to match the actual population) and for hunters—the latter
being 90% male. Gender is not shown for landowners because many land parcels were
owned by more than one person (e.g., a husband and wife), so in many cases there is not
a gender associated with the land, and the survey data would only show the gender of the
person who took the survey.
• Age: The general population sample was weighted by this characteristic. Adult hunters’
mean age is 51.6 years old (the means shown are among adults, as nobody under 18 years
old was interviewed; had children been interviewed, the mean ages would be lower).
Again, age is not shown for landowners for the same reason as discussed above regarding
gender.
• County of residence: This is shown for all three groups. (Note that some questions were
based on the county in which the hunter most often hunted or the county in which the
landowner’s largest tract was located.) Region of residence is also shown.
o A regional breakdown is shown of county of residence by where the hunter most
often hunts.
• For hunters, state of residence is shown (because just under 20% of hunters were from
out of state).
• Education: This is shown for the general population sample and for hunters; the latter
group is slightly less educated than the general population. Education is not shown for
landowners for the same reason as discussed above regarding gender and age.
• Residential character of where the respondent lives: Rural areas and small cities/towns
predominate among the general population of Maine as well as among hunters. Because
a criteria for the survey among landowners was ownership of a tract at least 25 acres,
rural areas predominate. (Note that some landowners did not live on their property that
was the subject of the survey; ergo, the small percentage that live in an urban
area/suburban area or a small city/town. Most, however, lived on the tract about which
the survey asked.)

Opinions of Residents, Landowners, and Hunters on Deer, Moose, Bear, and Turkey 247
48
52
90
10
0 20 40 60 80 100
Male
Female
Percent
Respondent's gender (not asked; observed by interviewer). (Overall)
General Population (n=933)
Hunters (n=956)
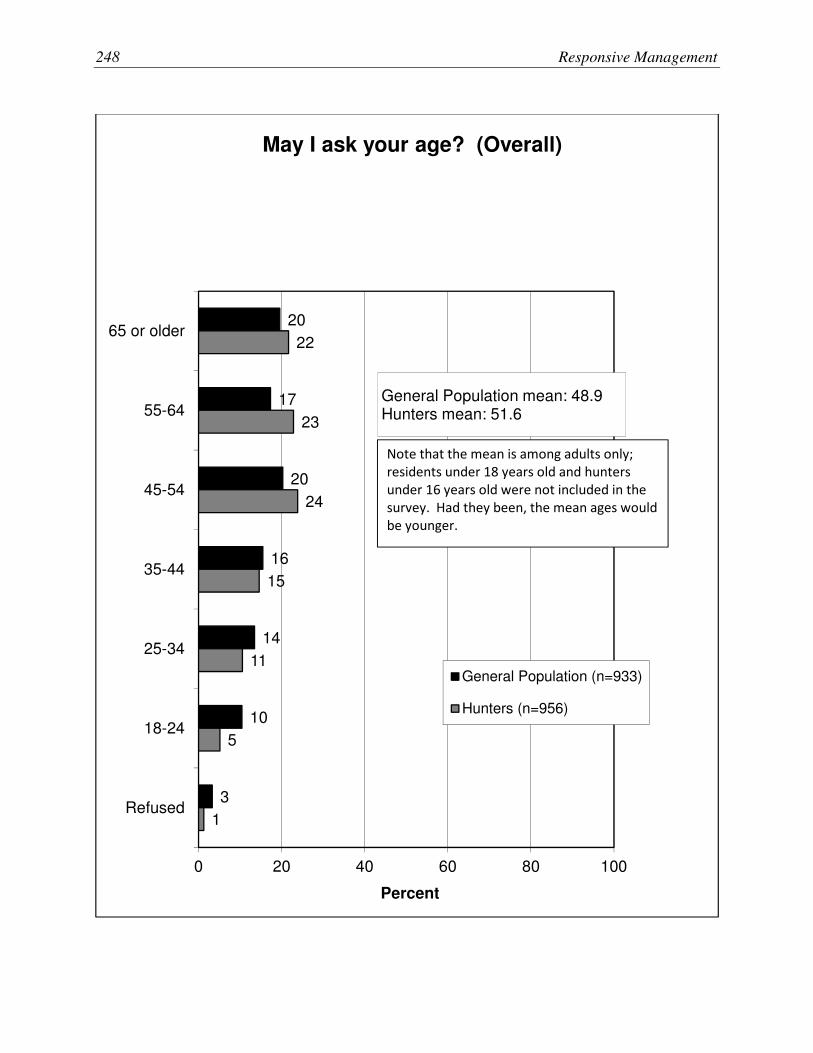
248 Responsive Management
20
17
20
16
14
10
3
22
23
24
15
11
5
1
0 20 40 60 80 100
65 or older
55-64
45-54
35-44
25-34
18-24
Refused
Percent
May I ask your age? (Overall)
General Population (n=933)
Hunters (n=956)
General Population mean: 48.9Hunters mean: 51.6
Note that the mean is among adults only;
residents under 18 years old and hunters
under 16 years old were not included in the
survey. Had they been, the mean ages would
be younger.

Opinions of Residents, Landowners, and Hunters on Deer, Moose, Bear, and Turkey 249
20
11
13
10
7
7
4
4
4
4
3
3
3
4
3
2
0
4
9
7
11
8
7
8
8
6
4
7
5
5
4
3
3
1
11
13
10
10
9
5
8
7
4
3
5
4
4
2
3
3
0
0 20 40 60 80 100
Cumberland
Penobscot
York
Kennebec
Aroostook
Androscoggin
Oxford
Somerset
Hancock
Sagadahoc
Washington
Waldo
Lincoln
Knox
Franklin
Piscataquis
Don't know
Percent
What county do you live in? (Asked of Maine residents.) (Overall)
General Population (n=933)
Landowners (n=304)
Hunters (n=769)

250 Responsive Management
17
3
2
2
29
0
3
1
14
14
1
1
2
1
9
1
0
17
5
1
19
0
17
13
11
1
0
9
0
1
5
0
0
0
0
33
34
1
0
1
0
1
0
0
0
12
10
0
0
8
1
0 20 40 60 80 100
Penobscot
Cumberland
York
Kennebec
Aroostook
Oxford
Somerset
Androscoggin
Washington
Hancock
Waldo
Lincoln
Sagadahoc
Franklin
Piscataquis
Knox
Don't know
Percent
What county do you live in? (Asked of Maine residents.) (Ranked by the total.) (Hunters)
Most often hunts in theNorth/East Region (n=302)
Most often hunts in theCentral Region (n=264)
Most often hunts in the SouthRegion (n=210)

Opinions of Residents, Landowners, and Hunters on Deer, Moose, Bear, and Turkey 251
15
41
44
0
26
52
22
0
19
37
24
20
0 20 40 60 80 100
Lives in theNorth/East Region
Lives in the CentralRegion
Lives in the SouthRegion
Nonresident
Percent
Region of residence. (Overall)
General Population (n=933)
Landowners (n=304)
Hunters (n=956)
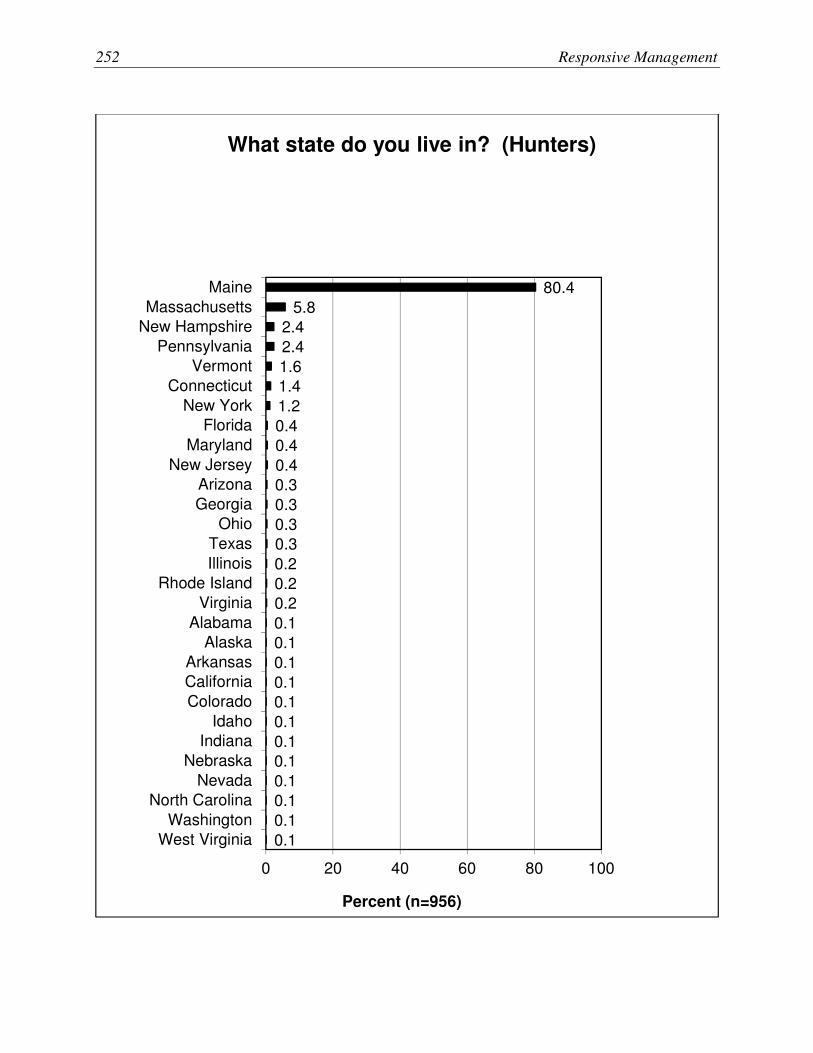
252 Responsive Management
80.4
5.8
2.4
2.4
1.6
1.4
1.2
0.4
0.4
0.4
0.3
0.3
0.3
0.3
0.2
0.2
0.2
0.1
0.1
0.1
0.1
0.1
0.1
0.1
0.1
0.1
0.1
0.1
0.1
0 20 40 60 80 100
Maine
Massachusetts
New Hampshire
Pennsylvania
Vermont
Connecticut
New York
Florida
Maryland
New Jersey
Arizona
Georgia
Ohio
Texas
Illinois
Rhode Island
Virginia
Alabama
Alaska
Arkansas
California
Colorado
Idaho
Indiana
Nebraska
Nevada
North Carolina
Washington
West Virginia
Percent (n=956)
What state do you live in? (Hunters)
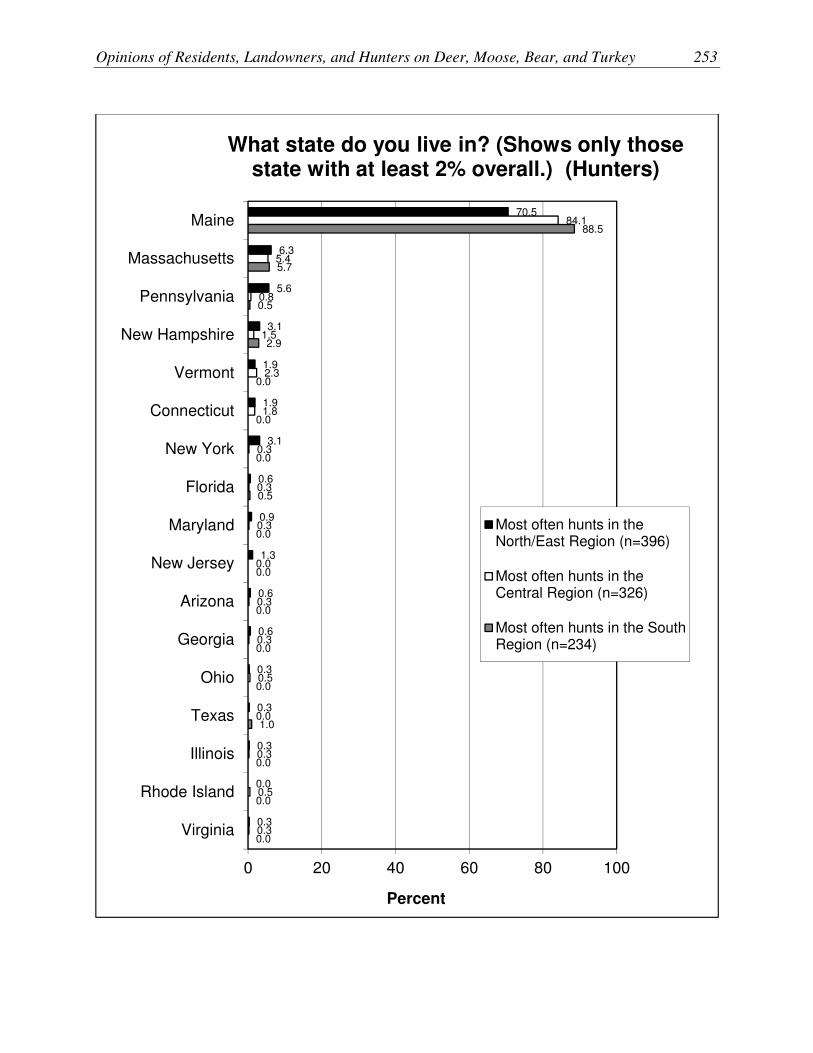
Opinions of Residents, Landowners, and Hunters on Deer, Moose, Bear, and Turkey 253
70.5
6.3
5.6
3.1
1.9
1.9
3.1
0.6
0.9
1.3
0.6
0.6
0.3
0.3
0.3
0.0
0.3
84.1
5.4
0.8
1.5
2.3
1.8
0.3
0.3
0.3
0.0
0.3
0.3
0.5
0.0
0.3
0.5
0.3
88.5
5.7
0.5
2.9
0.0
0.0
0.0
0.5
0.0
0.0
0.0
0.0
0.0
1.0
0.0
0.0
0.0
0 20 40 60 80 100
Maine
Massachusetts
Pennsylvania
New Hampshire
Vermont
Connecticut
New York
Florida
Maryland
New Jersey
Arizona
Georgia
Ohio
Texas
Illinois
Rhode Island
Virginia
Percent
What state do you live in? (Shows only those state with at least 2% overall.) (Hunters)
Most often hunts in theNorth/East Region (n=396)
Most often hunts in theCentral Region (n=326)
Most often hunts in the SouthRegion (n=234)

254 Responsive Management
2
25
18
11
28
11
3
3
37
19
13
19
5
3
0 20 40 60 80 100
Not a high school graduate
High school graduate orequivalent
Some college or trade school, nodegree
Associate's or trade school degree
Bachelor's degree
Master's degree
Professional or doctorate degree
Percent
What is the highest level of education you have completed? (Overall)
General Population(n=933)

Opinions of Residents, Landowners, and Hunters on Deer, Moose, Bear, and Turkey 255
6
10
40
8
35
1
1
2
11
38
47
0
7
7
33
12
40
1
0 20 40 60 80 100
Large city or urbanarea
Suburban area
Small city or town
Rural area on afarm
Rural area NOT ona farm
Refused
Percent
Do you consider your place of residence to be a large city or urban area, a suburban area, a
small city or town, a rural area on a farm, or a rural area not on a farm? (Overall)
General Population (n=933)
Landowners (n=304)
Hunters (n=956)
256 Responsive Management
APPENDIX A: ALL REGIONAL RESULTS
This appendix has three main sections: the first presents the regional results of the general
population survey, the second of the landowner survey, and the third of the hunter survey. Each of
these three sections is organized in the same way as the body of the report, with the graphs presented
in sub-sections based on theme, as shown below, with the questions in each section as indicated.
Note, however, that some sub-sections are not included under a particular survey when the questions
in that sub-section were not asked of a particular group. For instance, the general population was not
asked about satisfaction/dissatisfaction with hunting, so this sub-section is not within the general
population section.
Interest in and Knowledge of Wildlife
Overall interest in wildlife.
Feelings about wildlife around home.
Level of knowledge about each species.
Participation in Hunting
Where hunted.
Participation in deer, moose, bear, and turkey hunting.
Reasons for hunting deer, moose, bear, and turkey.
Applying for moose permits.
Satisfaction and Dissatisfaction With Hunting
Satisfaction with deer, moose, bear, and turkey hunting.
Reasons for not being more satisfied.
Constraints to Hunting
Constraints to deer hunting.
Reasons for not hunting deer, moose, bear, and turkey.
Opinions on Hunting Approval/disapproval of hunting.
Support for/opposition to hunting to help manage species/land.
Support for/opposition to hunting bear for various reasons.
Hunting Access
Hunters: ratings of access.
Whether lack of access has been constraint to hunting participation.
Landowners: allowing access on land.
Types of access allowed.
Reasons for not allowing access.

Opinions of Residents, Landowners, and Hunters on Deer, Moose, Bear, and Turkey 257
Hunting Licensing and Fees
Whether cost of hunting fees is too much.
Whether separate purchase requirements inhibit hunting.
Opinions on Regulations and Specific Aspects of Hunting
Opinions on the 3-point rule.
Which month preferred for moose hunting.
Why that month is preferred.
Opinion on a split moose season.
Opinions regarding tradeoff on number of permits versus chance of harvest.
Support for/opposition to coyote management.
Land Management in General
Whether landowners actively manages land for wildlife.
Deer Management
Ratings of deer management.
Opinions on the size of the deer population.
Why the deer population should be decreased.
Support for increasing deer population with various caveats.
Factors to be considered in managing deer.
Support for/opposition to hunting as a way to manage deer.
Support for/opposition to various methods to control deer.
Opinions on deer and moose tradeoffs.
Moose Management
Ratings of moose management.
Opinions on the size of the moose population.
Support for increasing moose population with various caveats.
Factors to be considered in managing moose.
Support for/opposition to hunting as a way to manage moose.
Opinion on adjusting moose harvest for health of the moose population.
Opinion on moose hunting in southern Maine.
Bear Management
Ratings of bear management.
Opinions on the size of the bear population.
Support for increasing bear population with various caveats.
Factors to be considered in managing bear.
Support for/opposition to hunting as a way to manage bear.
Opinion on allowing bear populations to expand south.
258 Responsive Management
Turkey Management
Ratings of turkey management.
Opinions on the size of the turkey population.
Support for increasing turkey population with various caveats.
Factors to be considered in managing turkey.
Support for/opposition to hunting as a way to manage turkey.
Opinion on methods to control turkey if they become overabundant.
Problems With Wildlife
Experiencing problems with wildlife.
Which wildlife caused problems.
Demographic Data
Gender.
Age.
Education.
Residential character of where residence is located.
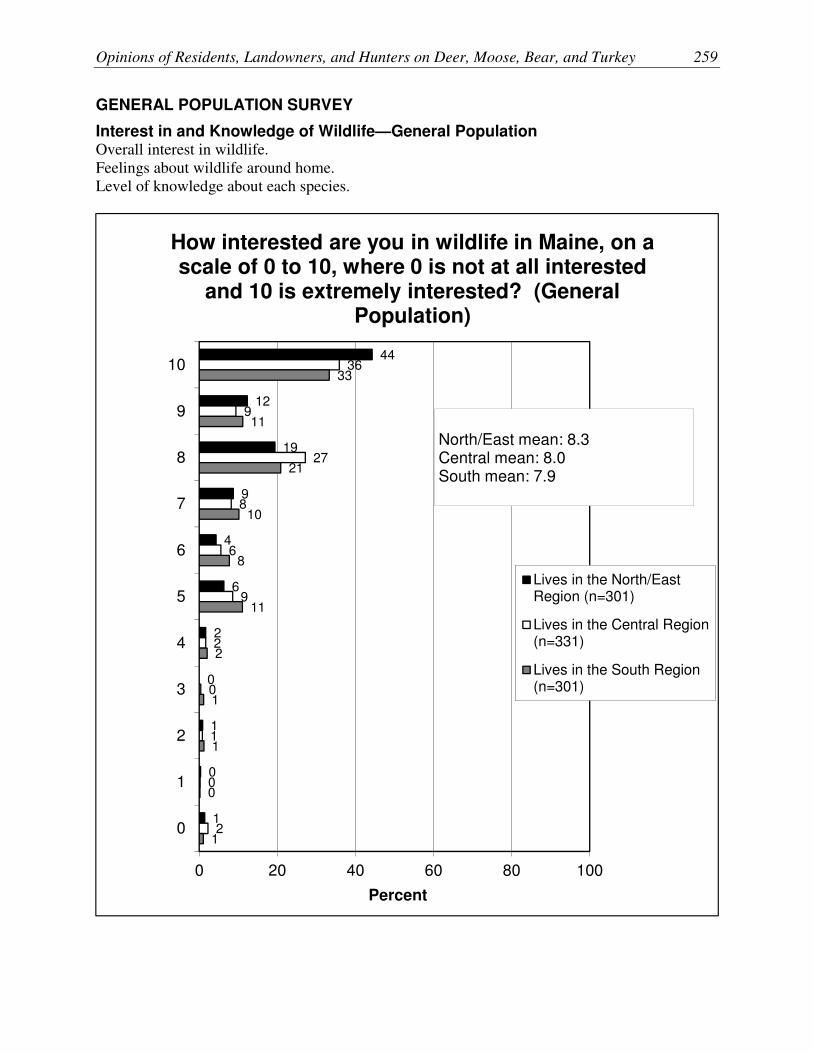
Opinions of Residents, Landowners, and Hunters on Deer, Moose, Bear, and Turkey 259
GENERAL POPULATION SURVEY
Interest in and Knowledge of Wildlife—General Population Overall interest in wildlife.
Feelings about wildlife around home.
Level of knowledge about each species.
44
12
19
9
4
6
2
0
1
0
1
36
9
27
8
6
9
2
0
1
0
2
33
11
21
10
8
11
2
1
1
0
1
0 20 40 60 80 100
10
9
8
7
6
5
4
3
2
1
0
Percent
How interested are you in wildlife in Maine, on a scale of 0 to 10, where 0 is not at all interested
and 10 is extremely interested? (General Population)
Lives in the North/EastRegion (n=301)
Lives in the Central Region(n=331)
Lives in the South Region(n=301)
North/East mean: 8.3Central mean: 8.0South mean: 7.9

260 Responsive Management
70
21
3
1
4
1
70
21
2
0
7
0
70
22
2
1
5
0
0 20 40 60 80 100
I enjoy seeing and having wildlifearound my home or on my property
I enjoy seeing a few animals aroundmy home or on my property butworry about the problems they
cause
I generally regard wildlife aroundmy home or on my property as a
nuisance
I generally regard wildlife aroundmy home or on my property as
dangerous
I have no particular feeling aboutwildlife around my home or on my
property
Don't know
Percent
Generally, which of the following best describes your feelings about wildlife around your home
or on your property? (General Population)
Lives in the North/EastRegion (n=301)
Lives in the Central Region(n=331)
Lives in the South Region(n=301)
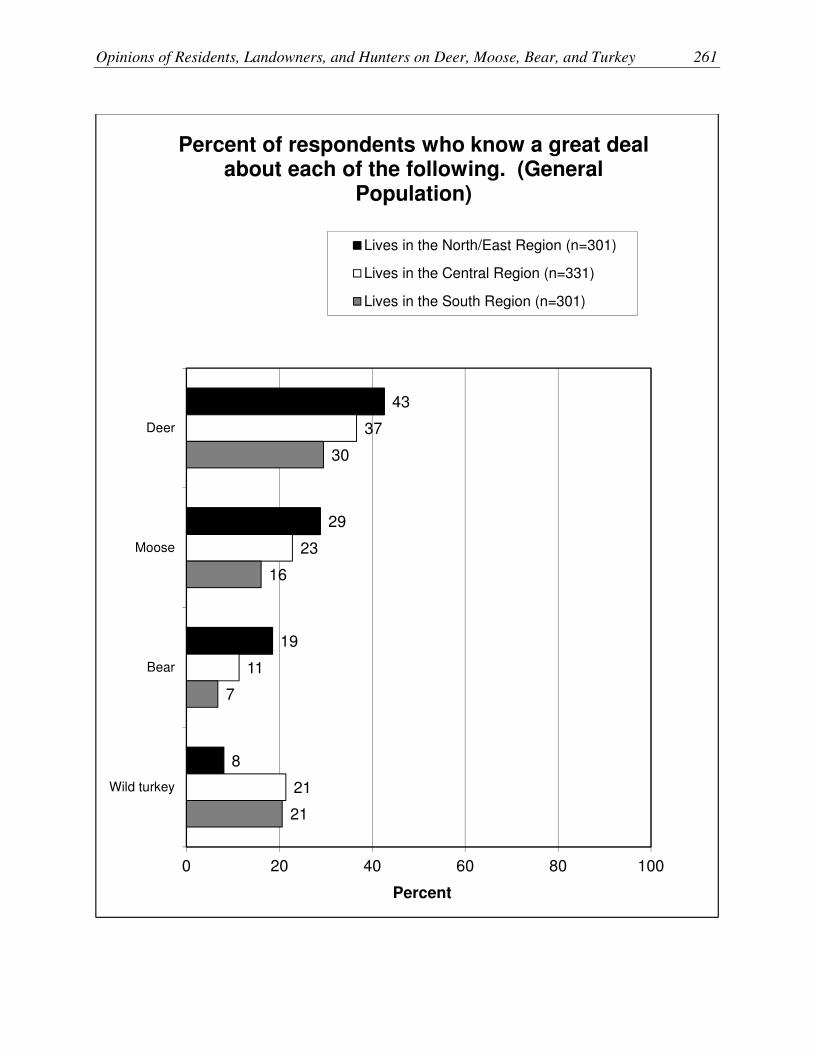
Opinions of Residents, Landowners, and Hunters on Deer, Moose, Bear, and Turkey 261
43
29
19
8
37
23
11
21
30
16
7
21
0 20 40 60 80 100
Deer
Moose
Bear
Wild turkey
Percent
Percent of respondents who know a great deal about each of the following. (General
Population)
Lives in the North/East Region (n=301)
Lives in the Central Region (n=331)
Lives in the South Region (n=301)

262 Responsive Management
83
71
54
45
80
63
48
58
69
51
37
56
0 20 40 60 80 100
Deer
Moose
Bear
Wild turkey
Percent
Percent of respondents who know a great deal or a moderate amount about each of the
following. (General Population)
Lives in the North/East Region (n=301)
Lives in the Central Region (n=331)
Lives in the South Region (n=301)
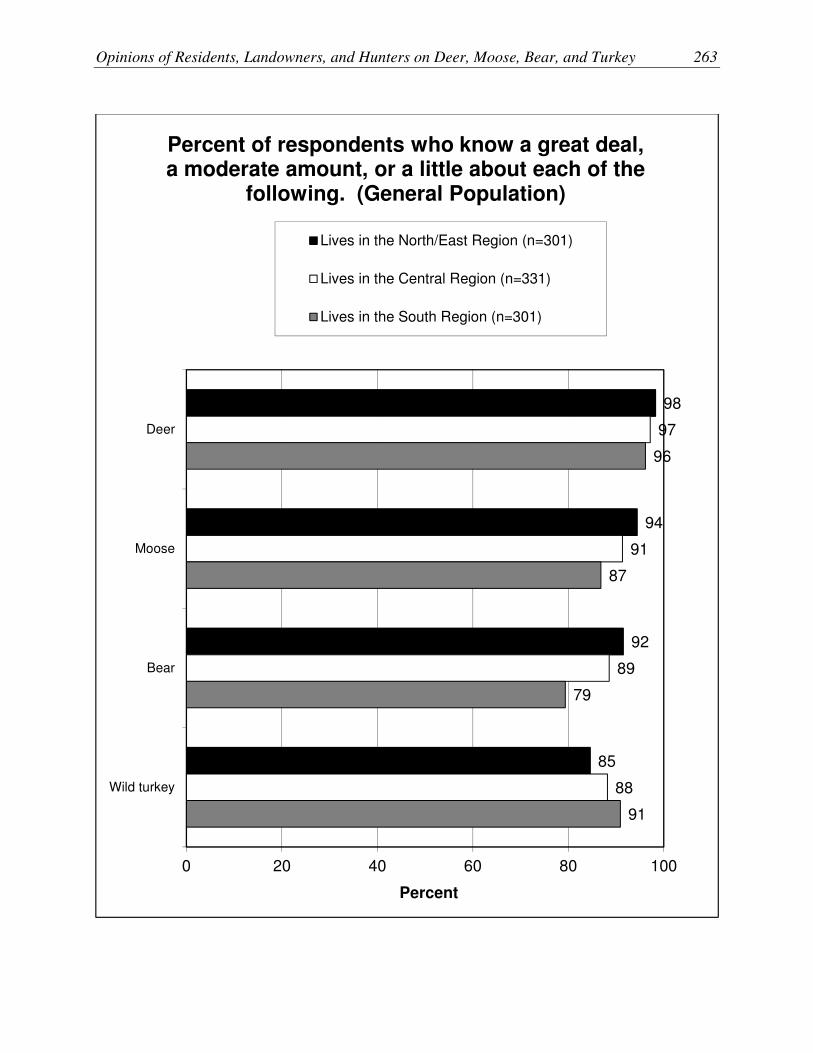
Opinions of Residents, Landowners, and Hunters on Deer, Moose, Bear, and Turkey 263
98
94
92
85
97
91
89
88
96
87
79
91
0 20 40 60 80 100
Deer
Moose
Bear
Wild turkey
Percent
Percent of respondents who know a great deal, a moderate amount, or a little about each of the
following. (General Population)
Lives in the North/East Region (n=301)
Lives in the Central Region (n=331)
Lives in the South Region (n=301)

264 Responsive Management
1
5
8
15
3
9
11
12
4
13
21
9
0 20 40 60 80 100
Deer
Moose
Bear
Wild turkey
Percent
Percent of respondents who know nothing at all about each of the following. (General
Population)
Lives in the North/East Region (n=301)
Lives in the Central Region (n=331)
Lives in the South Region (n=301)

Opinions of Residents, Landowners, and Hunters on Deer, Moose, Bear, and Turkey 265
Opinions on Hunting—General Population Approval/disapproval of hunting.
Support for/opposition to hunting bear for various reasons.
82
13
0
1
2
0
80
14
1
3
3
0
67
24
3
3
3
0
0 20 40 60 80 100
Strongly approve
Moderatelyapprove
Neither approvenor disapprove
Moderatelydisapprove
Stronglydisapprove
Don't know
Percent
In general, do you approve or disapprove of legal deer hunting? (General Population)
Lives in the North/EastRegion (n=301)
Lives in the Central Region(n=331)
Lives in the South Region(n=301)

266 Responsive Management
74
19
2
2
3
1
68
24
0
1
6
0
56
30
3
4
7
0
0 20 40 60 80 100
Strongly approve
Moderatelyapprove
Neither approvenor disapprove
Moderatelydisapprove
Stronglydisapprove
Don't know
Percent
In general, do you approve or disapprove of legal moose hunting? (General Population)
Lives in the North/EastRegion (n=301)
Lives in the Central Region(n=331)
Lives in the South Region(n=301)

Opinions of Residents, Landowners, and Hunters on Deer, Moose, Bear, and Turkey 267
69
17
3
3
7
1
64
23
2
4
7
0
48
33
4
6
9
0
0 20 40 60 80 100
Strongly approve
Moderatelyapprove
Neither approvenor disapprove
Moderatelydisapprove
Stronglydisapprove
Don't know
Percent
In general, do you approve or disapprove of legal bear hunting? (General Population)
Lives in the North/EastRegion (n=301)
Lives in the Central Region(n=331)
Lives in the South Region(n=301)

268 Responsive Management
69
68
45
31
15
65
60
36
23
11
55
55
37
24
8
0 20 40 60 80 100
For the meat
As a method to helpmanage bear
populations in Maine
For economic benefitsto rural areas
For recreation
For a trophy
Percent
Percent of respondents who would strongly support hunting bear for each of the following
reasons. (General Population)
Lives in the North/East Region (n=301)
Lives in the Central Region (n=331)
Lives in the South Region (n=301)

Opinions of Residents, Landowners, and Hunters on Deer, Moose, Bear, and Turkey 269
87
86
71
54
34
89
87
65
51
29
86
84
67
49
29
0 20 40 60 80 100
As a method to helpmanage bear populations
in Maine
For the meat
For economic benefits torural areas
For recreation
For a trophy
Percent
Percent of respondents who would strongly support or moderately support hunting bear for
each of the following reasons. (General Population)
Lives in the North/East Region (n=301)
Lives in the Central Region (n=331)
Lives in the South Region (n=301)
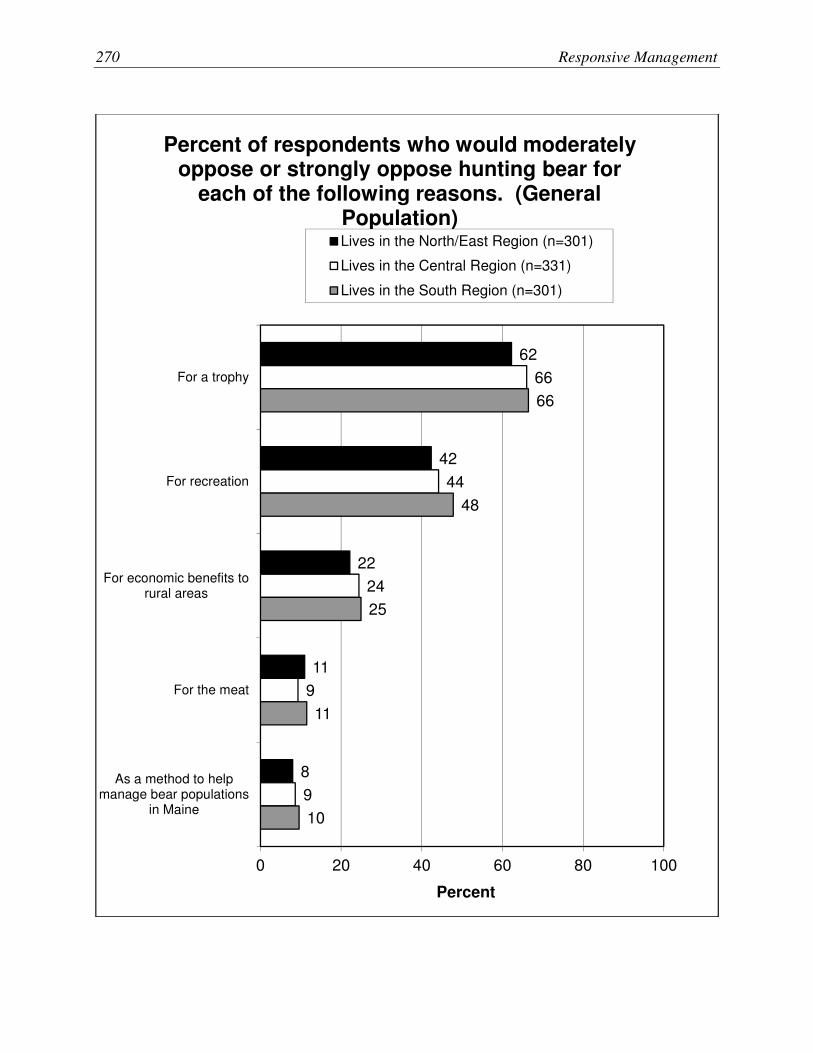
270 Responsive Management
62
42
22
11
8
66
44
24
9
9
66
48
25
11
10
0 20 40 60 80 100
For a trophy
For recreation
For economic benefits torural areas
For the meat
As a method to helpmanage bear populations
in Maine
Percent
Percent of respondents who would moderately oppose or strongly oppose hunting bear for
each of the following reasons. (General Population)Lives in the North/East Region (n=301)
Lives in the Central Region (n=331)
Lives in the South Region (n=301)

Opinions of Residents, Landowners, and Hunters on Deer, Moose, Bear, and Turkey 271
47
30
11
8
4
49
28
12
6
6
49
31
12
6
4
0 20 40 60 80 100
For a trophy
For recreation
For economic benefitsto rural areas
For the meat
As a method to helpmanage bear
populations in Maine
Percent
Percent of respondents who would strongly oppose hunting bear for each of the following
reasons. (General Population)
Lives in the North/East Region (n=301)
Lives in the Central Region (n=331)
Lives in the South Region (n=301)
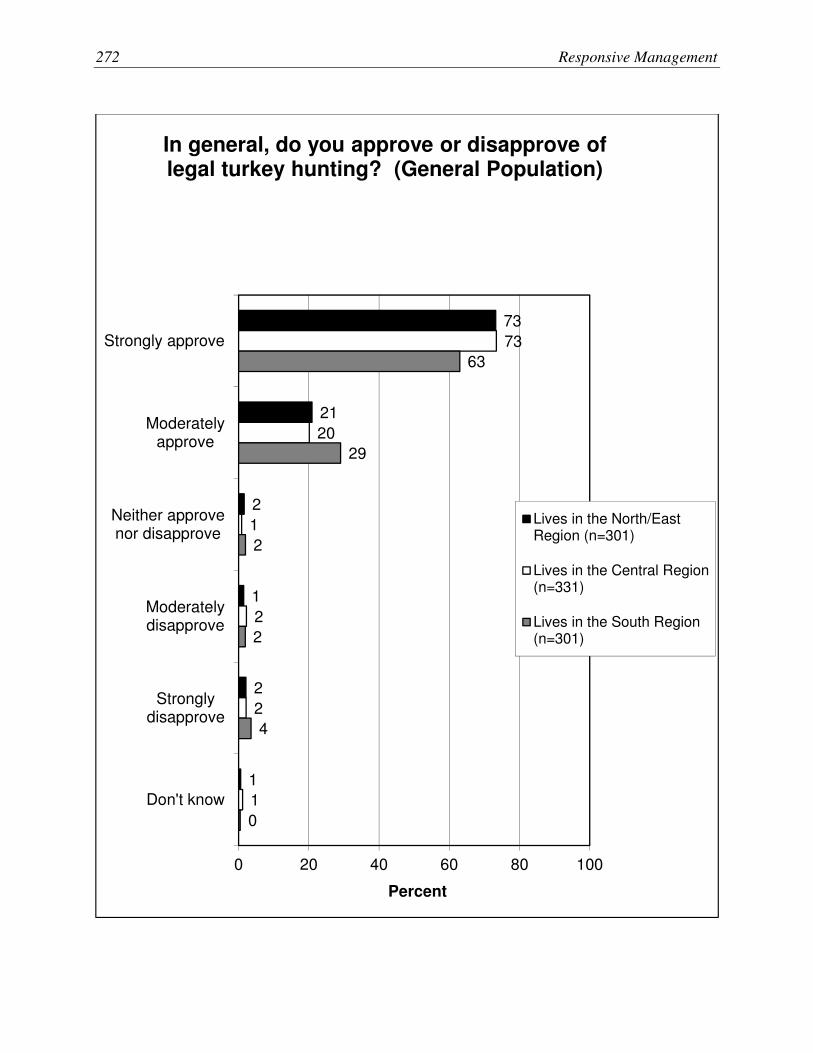
272 Responsive Management
73
21
2
1
2
1
73
20
1
2
2
1
63
29
2
2
4
0
0 20 40 60 80 100
Strongly approve
Moderatelyapprove
Neither approvenor disapprove
Moderatelydisapprove
Stronglydisapprove
Don't know
Percent
In general, do you approve or disapprove of legal turkey hunting? (General Population)
Lives in the North/EastRegion (n=301)
Lives in the Central Region(n=331)
Lives in the South Region(n=301)
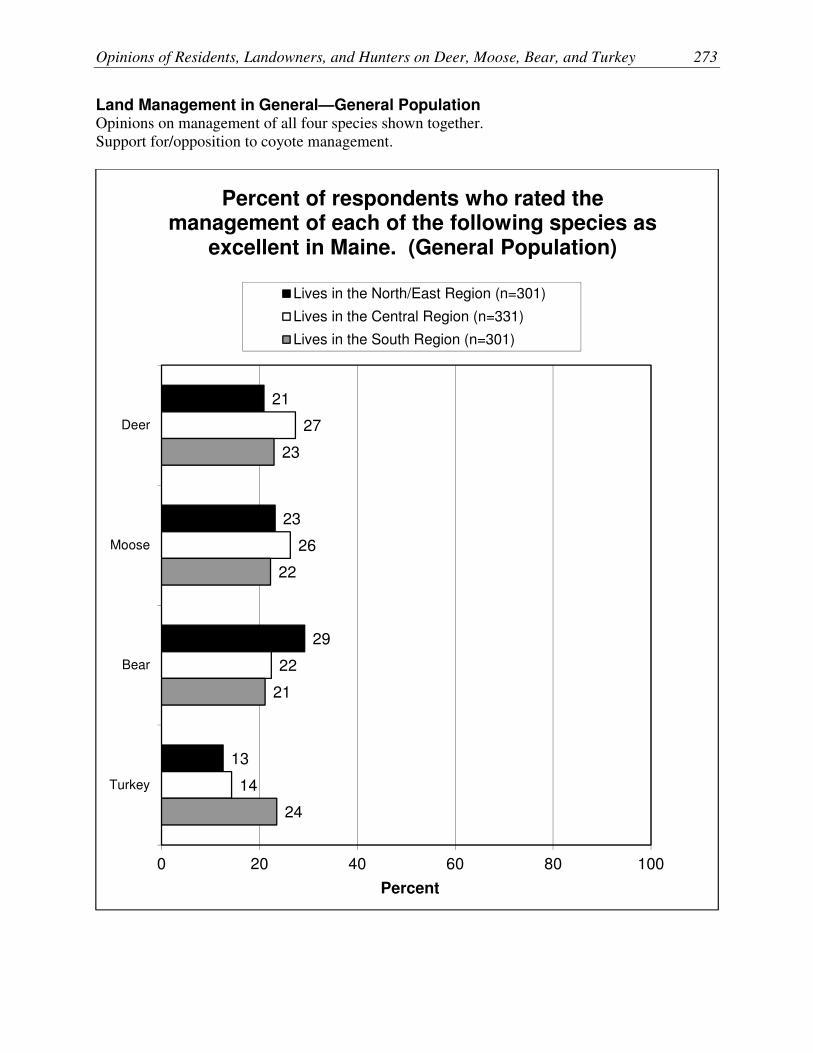
Opinions of Residents, Landowners, and Hunters on Deer, Moose, Bear, and Turkey 273
Land Management in General—General Population Opinions on management of all four species shown together.
Support for/opposition to coyote management.
21
23
29
13
27
26
22
14
23
22
21
24
0 20 40 60 80 100
Deer
Moose
Bear
Turkey
Percent
Percent of respondents who rated the management of each of the following species as
excellent in Maine. (General Population)
Lives in the North/East Region (n=301)
Lives in the Central Region (n=331)
Lives in the South Region (n=301)

274 Responsive Management
58
61
58
45
70
70
58
44
68
58
55
54
0 20 40 60 80 100
Deer
Moose
Bear
Turkey
Percent
Percent of respondents who rated the management of each of the following species as
excellent or good in Maine. (General Population)
Lives in the North/East Region (n=301)
Lives in the Central Region (n=331)
Lives in the South Region (n=301)
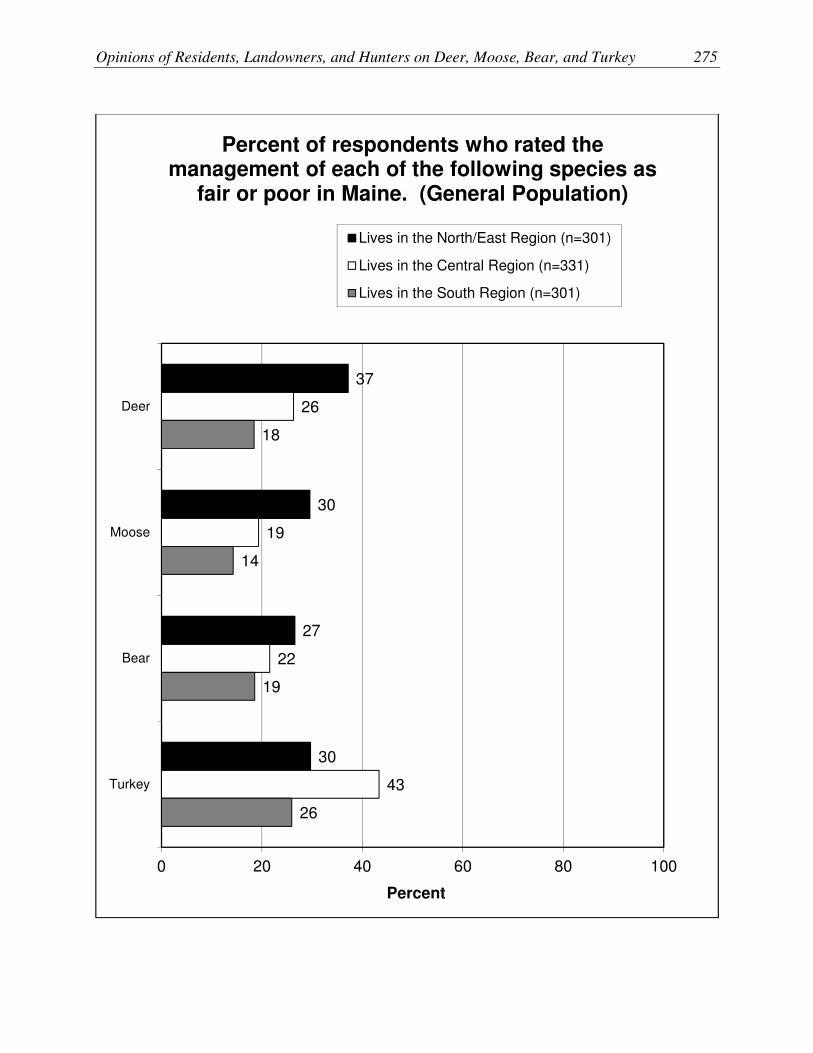
Opinions of Residents, Landowners, and Hunters on Deer, Moose, Bear, and Turkey 275
37
30
27
30
26
19
22
43
18
14
19
26
0 20 40 60 80 100
Deer
Moose
Bear
Turkey
Percent
Percent of respondents who rated the management of each of the following species as
fair or poor in Maine. (General Population)
Lives in the North/East Region (n=301)
Lives in the Central Region (n=331)
Lives in the South Region (n=301)

276 Responsive Management
11
8
6
8
5
3
5
15
4
3
6
9
0 20 40 60 80 100
Deer
Moose
Bear
Turkey
Percent
Percent of respondents who rated the management of each of the following species as
poor in Maine. (General Population)
Lives in the North/East Region (n=301)
Lives in the Central Region (n=331)
Lives in the South Region (n=301)

Opinions of Residents, Landowners, and Hunters on Deer, Moose, Bear, and Turkey 277
62
17
0
6
10
4
47
26
6
9
7
5
42
23
7
13
8
6
0 20 40 60 80 100
Strongly support
Moderatelysupport
Neither supportnor oppose
Moderatelyoppose
Strongly oppose
Don't know
Percent
Would you support or oppose a coyote management program in Maine, which may
cause an increase in deer and/or wild turkeys in local areas? (General Population)
Lives in the North/EastRegion (n=301)
Lives in the Central Region(n=331)
Lives in the South Region(n=301)

278 Responsive Management
Deer Management—General Population Ratings of deer management.
Opinions on the size of the deer population.
Why the deer population should be decreased.
Support for increasing deer population with various caveats.
Factors to be considered in managing deer.
Support for/opposition to hunting as a way to manage deer.
Support for/opposition to various methods to control deer.
Opinions on deer and moose tradeoffs.

Opinions of Residents, Landowners, and Hunters on Deer, Moose, Bear, and Turkey 279
21
38
26
11
4
27
42
22
5
4
23
45
15
4
14
0 20 40 60 80 100
Excellent
Good
Fair
Poor
Don't know
Percent
Overall, how would you rate deer management in Maine? (General Population)
Lives in the North/EastRegion (n=301)
Lives in the Central Region(n=331)
Lives in the South Region(n=301)
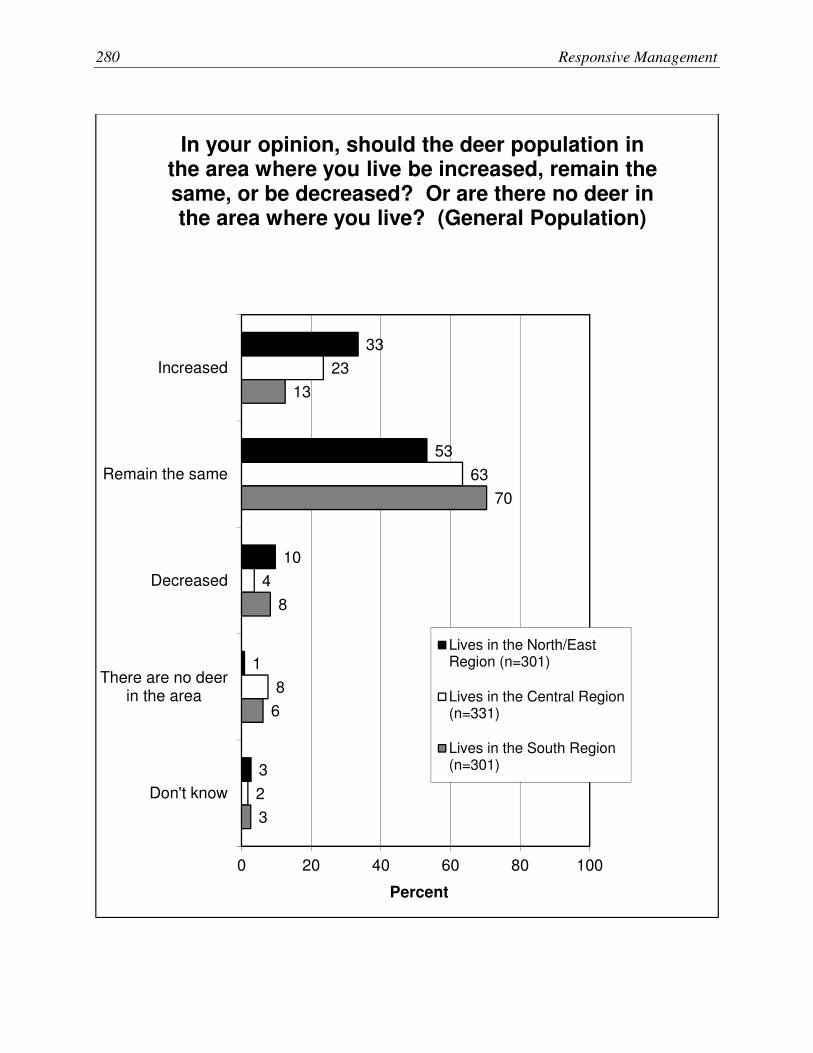
280 Responsive Management
33
53
10
1
3
23
63
4
8
2
13
70
8
6
3
0 20 40 60 80 100
Increased
Remain the same
Decreased
There are no deerin the area
Don't know
Percent
In your opinion, should the deer population in the area where you live be increased, remain the same, or be decreased? Or are there no deer in the area where you live? (General Population)
Lives in the North/EastRegion (n=301)
Lives in the Central Region(n=331)
Lives in the South Region(n=301)
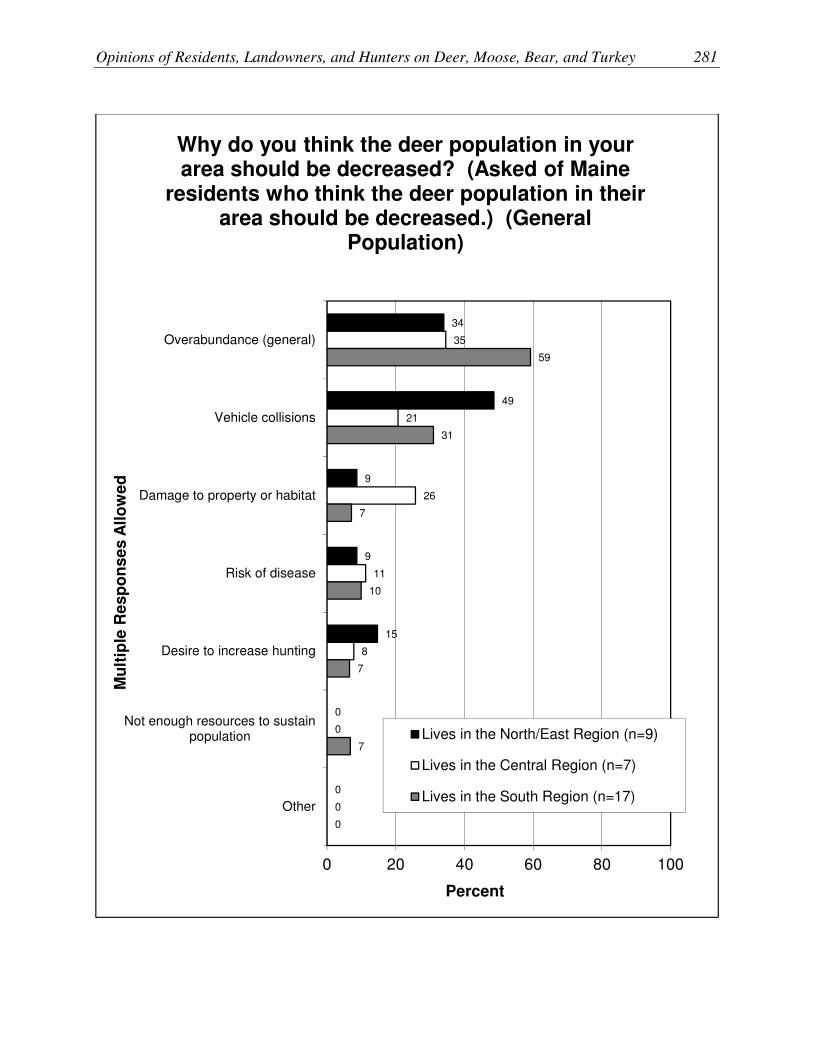
Opinions of Residents, Landowners, and Hunters on Deer, Moose, Bear, and Turkey 281
34
49
9
9
15
0
0
35
21
26
11
8
0
0
59
31
7
10
7
7
0
0 20 40 60 80 100
Overabundance (general)
Vehicle collisions
Damage to property or habitat
Risk of disease
Desire to increase hunting
Not enough resources to sustainpopulation
Other
Percent
Mu
ltip
le R
es
po
ns
es
All
ow
ed
Why do you think the deer population in your area should be decreased? (Asked of Maine
residents who think the deer population in their area should be decreased.) (General
Population)
Lives in the North/East Region (n=9)
Lives in the Central Region (n=7)
Lives in the South Region (n=17)
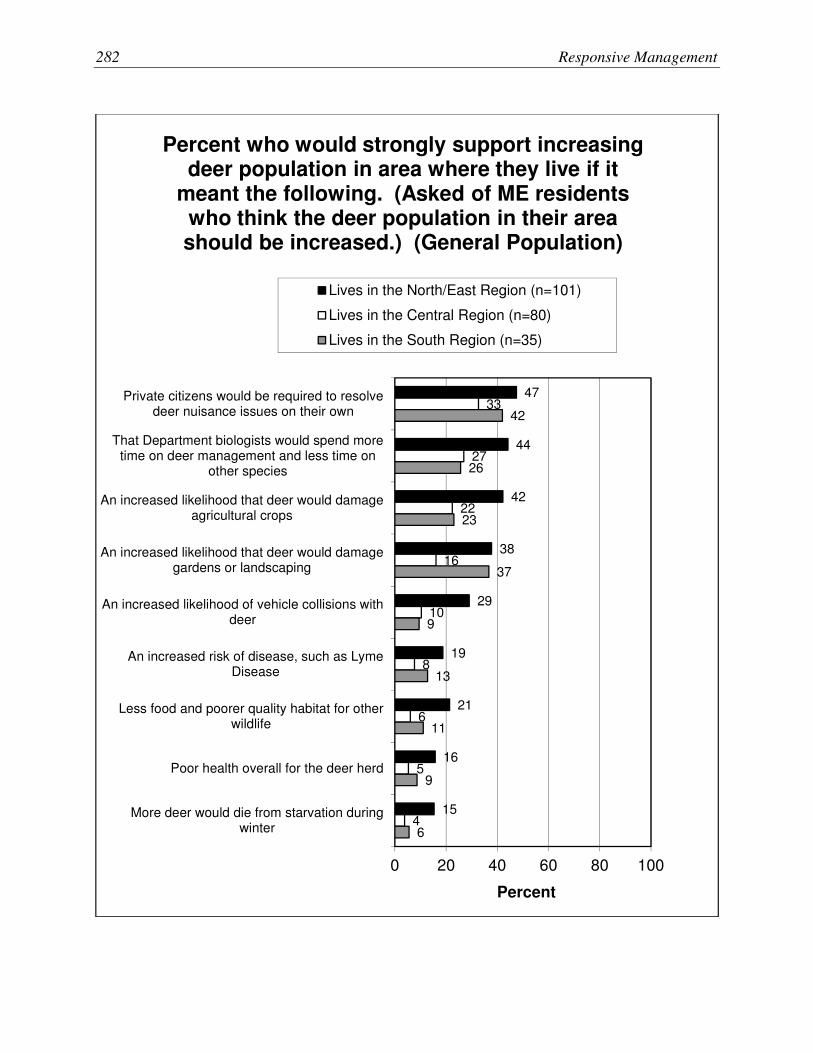
282 Responsive Management
47
44
42
38
29
19
21
16
15
33
27
22
16
10
8
6
5
4
42
26
23
37
9
13
11
9
6
0 20 40 60 80 100
Private citizens would be required to resolvedeer nuisance issues on their own
That Department biologists would spend moretime on deer management and less time on
other species
An increased likelihood that deer would damageagricultural crops
An increased likelihood that deer would damagegardens or landscaping
An increased likelihood of vehicle collisions withdeer
An increased risk of disease, such as LymeDisease
Less food and poorer quality habitat for otherwildlife
Poor health overall for the deer herd
More deer would die from starvation duringwinter
Percent
Percent who would strongly support increasing deer population in area where they live if it
meant the following. (Asked of ME residents who think the deer population in their area should be increased.) (General Population)
Lives in the North/East Region (n=101)
Lives in the Central Region (n=80)
Lives in the South Region (n=35)

Opinions of Residents, Landowners, and Hunters on Deer, Moose, Bear, and Turkey 283
77
70
71
69
54
42
42
25
24
69
69
55
54
48
36
29
23
16
69
73
70
73
48
29
19
10
13
0 20 40 60 80 100
That Department biologists would spend moretime on deer management and less time on
other species
Private citizens would be required to resolvedeer nuisance issues on their own
An increased likelihood that deer would damageagricultural crops
An increased likelihood that deer would damagegardens or landscaping
An increased likelihood of vehicle collisions withdeer
An increased risk of disease, such as LymeDisease
Less food and poorer quality habitat for otherwildlife
More deer would die from starvation duringwinter
Poor health overall for the deer herd
Percent
Percent who would strongly support or moderately support increasing deer population in area where they live if it meant the following.
(Asked of ME residents who think the deer population in their area should be increased.)
(General Population)
Lives in the North/East Region (n=101)
Lives in the Central Region (n=80)
Lives in the South Region (n=35)

284 Responsive Management
72
67
54
49
38
23
24
16
13
80
67
51
47
40
32
34
23
14
87
85
65
63
47
24
14
23
21
0 20 40 60 80 100
Poor health overall for the deer herd
More deer would die from starvation duringwinter
An increased risk of disease, such as LymeDisease
Less food and poorer quality habitat for otherwildlife
An increased likelihood of vehicle collisions withdeer
An increased likelihood that deer would damageagricultural crops
An increased likelihood that deer would damagegardens or landscaping
Private citizens would be required to resolvedeer nuisance issues on their own
That Department biologists would spend moretime on deer management and less time on
other species
Percent
Percent who would moderately oppose or strongly oppose increasing deer population in area where they live if it meant the following. (Asked of ME residents who think the deer
population in their area should be increased.) (General Population)
Lives in the North/East Region (n=101)
Lives in the Central Region (n=80)
Lives in the South Region (n=35)

Opinions of Residents, Landowners, and Hunters on Deer, Moose, Bear, and Turkey 285
39
41
25
29
12
7
10
8
4
51
39
24
22
17
13
11
12
6
51
51
15
14
15
14
7
4
11
0 20 40 60 80 100
More deer would die from starvation duringwinter
Poor health overall for the deer herd
Less food and poorer quality habitat for otherwildlife
An increased risk of disease, such as LymeDisease
An increased likelihood of vehicle collisions withdeer
Private citizens would be required to resolvedeer nuisance issues on their own
An increased likelihood that deer woulddamage agricultural crops
An increased likelihood that deer woulddamage gardens or landscaping
That Department biologists would spend moretime on deer management and less time on
other species
Percent
Percent who would strongly oppose increasing deer population in area where they live if it
meant the following. (Asked of ME residents who think the deer population in their area should be increased.) (General Population)
Lives in the North/East Region (n=101)
Lives in the Central Region (n=80)
Lives in the South Region (n=35)
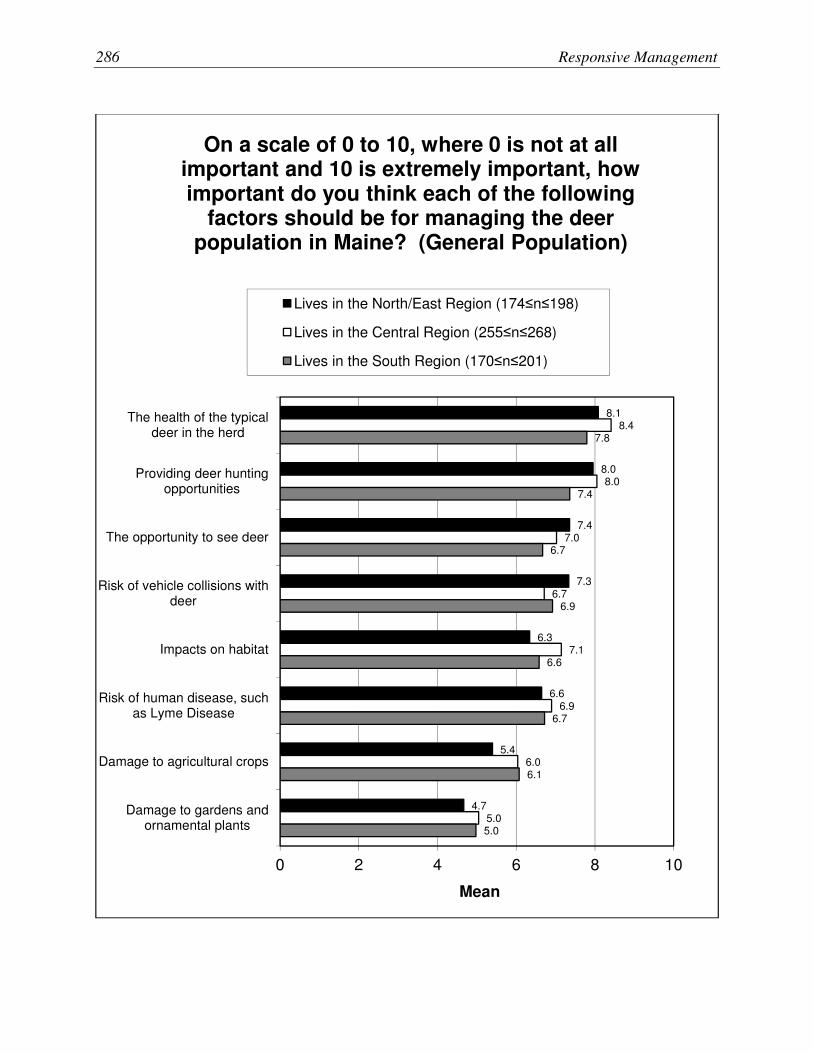
286 Responsive Management
8.1
8.0
7.4
7.3
6.3
6.6
5.4
4.7
8.4
8.0
7.0
6.7
7.1
6.9
6.0
5.0
7.8
7.4
6.7
6.9
6.6
6.7
6.1
5.0
0 2 4 6 8 10
The health of the typicaldeer in the herd
Providing deer huntingopportunities
The opportunity to see deer
Risk of vehicle collisions withdeer
Impacts on habitat
Risk of human disease, suchas Lyme Disease
Damage to agricultural crops
Damage to gardens andornamental plants
Mean
On a scale of 0 to 10, where 0 is not at all important and 10 is extremely important, how important do you think each of the following
factors should be for managing the deer population in Maine? (General Population)
Lives in the North/East Region (174≤n≤198)
Lives in the Central Region (255≤n≤268)
Lives in the South Region (170≤n≤201)

Opinions of Residents, Landowners, and Hunters on Deer, Moose, Bear, and Turkey 287
82
16
0
1
2
0
78
16
2
2
1
1
69
23
2
3
2
0
0 20 40 60 80 100
Strongly support
Moderatelysupport
Neither supportnor oppose
Moderatelyoppose
Strongly oppose
Don't know
Percent
Do you support or oppose legal hunting as a method to help manage the deer populations in
Maine? (General Population)
Lives in the North/EastRegion (n=301)
Lives in the Central Region(n=331)
Lives in the South Region(n=301)

288 Responsive Management
66
56
53
41
52
49
26
60
54
48
43
43
38
18
57
45
41
40
34
35
22
0 20 40 60 80 100
A special archery season
Targeted doe permits validonly in specific towns or
locations
An additional legal huntingseason
Allowing hunters to harvestmultiple deer
A longer firearms season
A controlled hunt with alimited number of hunters
Sharpshooters
Percent
Percent of respondents who would strongly support each of the following deer management
options in areas of Maine where the deer population became overabundant. (General
Population)
Lives in the North/East Region (166≤n≤183)
Lives in the Central Region (244≤n≤273)
Lives in the South Region (151≤n≤192)

Opinions of Residents, Landowners, and Hunters on Deer, Moose, Bear, and Turkey 289
85
78
74
75
61
66
43
87
82
73
73
63
62
42
86
74
79
68
68
57
47
0 20 40 60 80 100
A special archery season
Targeted doe permitsvalid only in specifictowns or locations
A controlled hunt with alimited number of hunters
An additional legalhunting season
Allowing hunters toharvest multiple deer
A longer firearms season
Sharpshooters
Percent
Percent of respondents who would strongly support or moderately support each of the
following deer management options in areas of Maine where the deer population became
overabundant. (General Population)
Lives in the North/East Region (166≤n≤183)
Lives in the Central Region (244≤n≤273)
Lives in the South Region (151≤n≤192)

290 Responsive Management
47
31
37
17
20
19
9
49
32
35
23
21
12
9
44
37
28
27
19
19
10
0 20 40 60 80 100
Sharpshooters
A longer firearmsseason
Allowing hunters toharvest multiple deer
An additional legalhunting season
A controlled hunt with alimited number of
hunters
Targeted doe permitsvalid only in specifictowns or locations
A special archeryseason
Percent
Percent of respondents who would moderately oppose or strongly oppose each of the
following deer management options in areas of Maine where the deer population became
overabundant. (General Population)
Lives in the North/East Region (166≤n≤183)
Lives in the Central Region (244≤n≤273)
Lives in the South Region (151≤n≤192)

Opinions of Residents, Landowners, and Hunters on Deer, Moose, Bear, and Turkey 291
33
25
20
10
13
14
7
33
21
16
15
13
5
6
26
13
17
15
6
9
6
0 20 40 60 80 100
Sharpshooters
Allowing hunters toharvest multiple deer
A longer firearmsseason
An additional legalhunting season
A controlled hunt with alimited number of
hunters
Targeted doe permitsvalid only in specifictowns or locations
A special archeryseason
Percent
Percent of respondents who would strongly oppose each of the following deer management
options in areas of Maine where the deer population became overabundant. (General
Population)
Lives in the North/East Region (166≤n≤183)
Lives in the Central Region (244≤n≤273)
Lives in the South Region (151≤n≤192)

292 Responsive Management
12
31
47
9
17
39
32
12
14
43
27
15
0 20 40 60 80 100
Abundant moosepopulations with
very few deer
Moderatenumbers ofmoose with
relatively fewdeer
Relatively fewmoose withmoderate
numbers of deer
Don't know
Percent
In northern Maine, which of the following scenarios would you most prefer? (General
Population)
Lives in the North/EastRegion (n=301)
Lives in the Central Region(n=331)
Lives in the South Region(n=301)

Opinions of Residents, Landowners, and Hunters on Deer, Moose, Bear, and Turkey 293
Moose Management—General Population Ratings of moose management.
Opinions on the size of the moose population.
Support for increasing moose population with various caveats.
Factors to be considered in managing moose.
Support for/opposition to hunting as a way to manage moose.
Opinion on adjusting moose harvest for health of the moose population.
Opinion on moose hunting in southern Maine.

294 Responsive Management
23
37
21
8
10
26
44
17
3
11
22
36
11
3
27
0 20 40 60 80 100
Excellent
Good
Fair
Poor
Don't know
Percent
Overall, how would you rate moose management in Maine? (General Population)
Lives in the North/EastRegion (n=301)
Lives in the Central Region(n=331)
Lives in the South Region(n=301)

Opinions of Residents, Landowners, and Hunters on Deer, Moose, Bear, and Turkey 295
20
52
14
11
3
17
54
2
26
3
11
44
1
41
3
0 20 40 60 80 100
Increased
Remain the same
Decreased
There are nomoose in the area
Don't know
Percent
In your opinion, should the moose population in the area where you live be increased, remain the same, or be decreased? Or are there no moose
in the area where you live? (Asked of Maine residents.) (General Population)
Lives in the North/EastRegion (n=301)
Lives in the Central Region(n=331)
Lives in the South Region(n=301)

296 Responsive Management
32
21
32
19
34
21
17
5
34
34
27
18
0 20 40 60 80 100
An increased likelihoodthat moose would
damage agriculturalcrops
An increased likelihoodof vehicle collisions with
moose
Forest regenerationwould be negatively
impacted
Poor health overall forthe moose herd
Percent
Percent who would strongly support increasing moose population in area where they live if it meant the following. (Asked of ME residents who think the moose population in their area should be increased.) (General Population)
Lives in the North/East Region (n=63)
Lives in the Central Region (n=61)
Lives in the South Region (n=30)
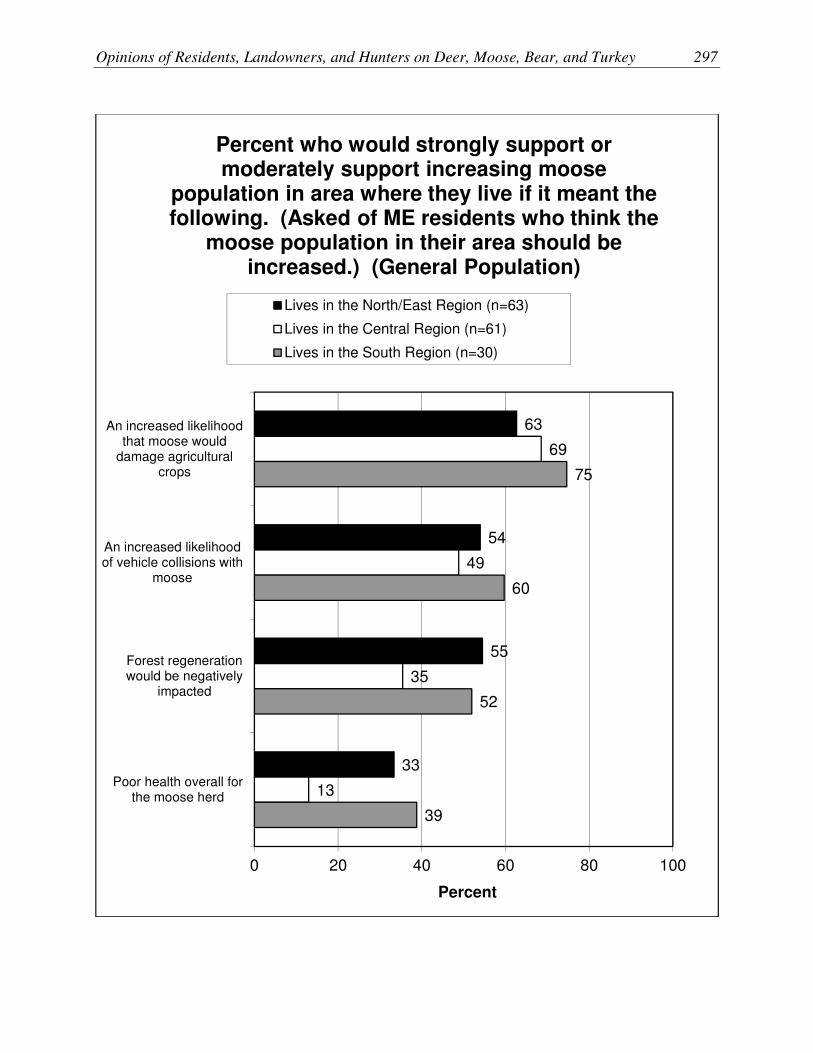
Opinions of Residents, Landowners, and Hunters on Deer, Moose, Bear, and Turkey 297
63
54
55
33
69
49
35
13
75
60
52
39
0 20 40 60 80 100
An increased likelihoodthat moose would
damage agriculturalcrops
An increased likelihoodof vehicle collisions with
moose
Forest regenerationwould be negatively
impacted
Poor health overall forthe moose herd
Percent
Percent who would strongly support or moderately support increasing moose
population in area where they live if it meant the following. (Asked of ME residents who think the
moose population in their area should be increased.) (General Population)
Lives in the North/East Region (n=63)
Lives in the Central Region (n=61)
Lives in the South Region (n=30)

298 Responsive Management
62
36
38
32
76
47
41
21
51
37
25
15
0 20 40 60 80 100
Poor health overall forthe moose herd
Forest regenerationwould be negatively
impacted
An increased likelihoodof vehicle collisions with
moose
An increased likelihoodthat moose would
damage agriculturalcrops
Percent
Percent who would moderately oppose or strongly oppose increasing moose population in area where they live if it meant the following.
(Asked of ME residents who think the moose population in their area should be increased.)
(General Population)
Lives in the North/East Region (n=63)
Lives in the Central Region (n=61)
Lives in the South Region (n=30)

Opinions of Residents, Landowners, and Hunters on Deer, Moose, Bear, and Turkey 299
39
13
15
10
44
18
15
1
38
10
10
0
0 20 40 60 80 100
Poor health overall forthe moose herd
Forest regenerationwould be negatively
impacted
An increased likelihoodof vehicle collisions with
moose
An increased likelihoodthat moose would
damage agriculturalcrops
Percent
Percent who would strongly oppose increasing moose population in area where they live if it meant the following. (Asked of ME residents who think the moose population in their area should be increased.) (General Population)
Lives in the North/East Region (n=63)
Lives in the Central Region (n=61)
Lives in the South Region (n=30)

300 Responsive Management
7.8
7.5
7.8
7.0
6.2
4.9
8.3
7.2
7.5
7.5
6.4
5.3
7.8
7.1
6.4
6.7
5.7
4.9
0 2 4 6 8 10
The health of the typicalmoose in the herd
Risk of vehicle collisionswith moose
Providing moose huntingopportunities
The opportunity to seemoose
Impacts on habitat
Damage to agriculturalcrops
Mean
On a scale of 0 to 10, where 0 is not at all important and 10 is extremely important, how important do you think each of the following factors should be for managing the moose population in Maine? (General Population)
Lives in the North/East Region (183≤n≤205)
Lives in the Central Region (258≤n≤285)
Lives in the South Region (178≤n≤208)
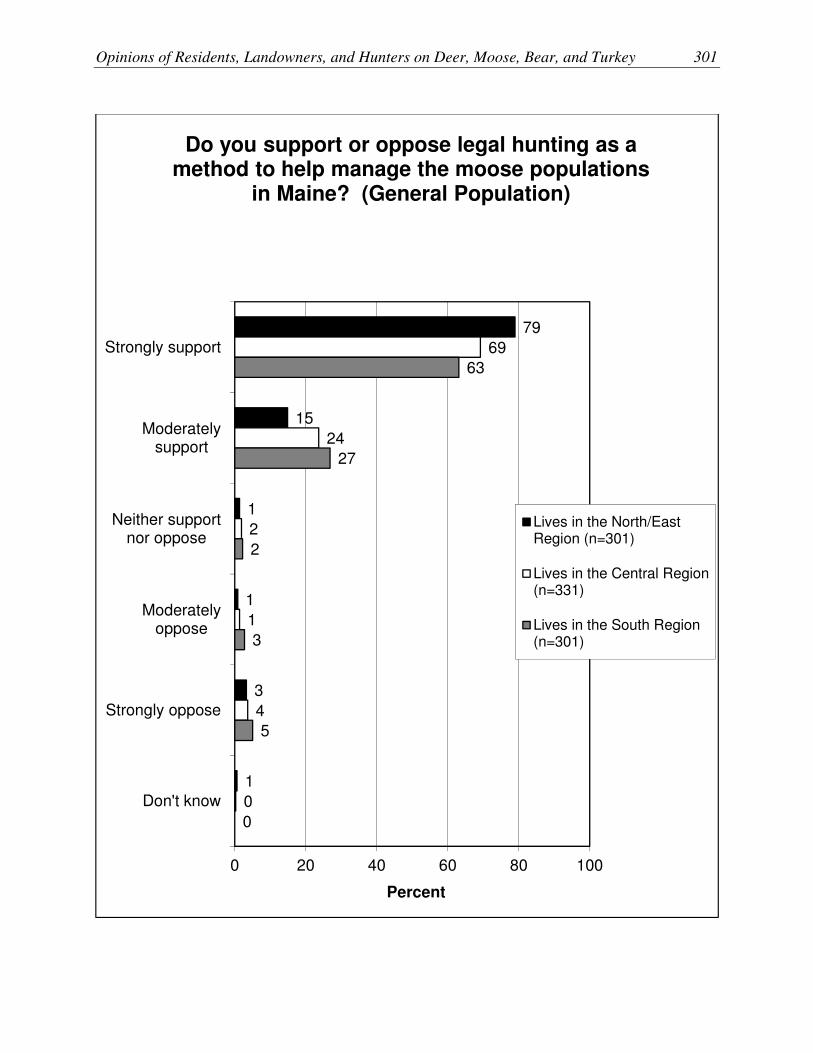
Opinions of Residents, Landowners, and Hunters on Deer, Moose, Bear, and Turkey 301
79
15
1
1
3
1
69
24
2
1
4
0
63
27
2
3
5
0
0 20 40 60 80 100
Strongly support
Moderatelysupport
Neither supportnor oppose
Moderatelyoppose
Strongly oppose
Don't know
Percent
Do you support or oppose legal hunting as a method to help manage the moose populations
in Maine? (General Population)
Lives in the North/EastRegion (n=301)
Lives in the Central Region(n=331)
Lives in the South Region(n=301)
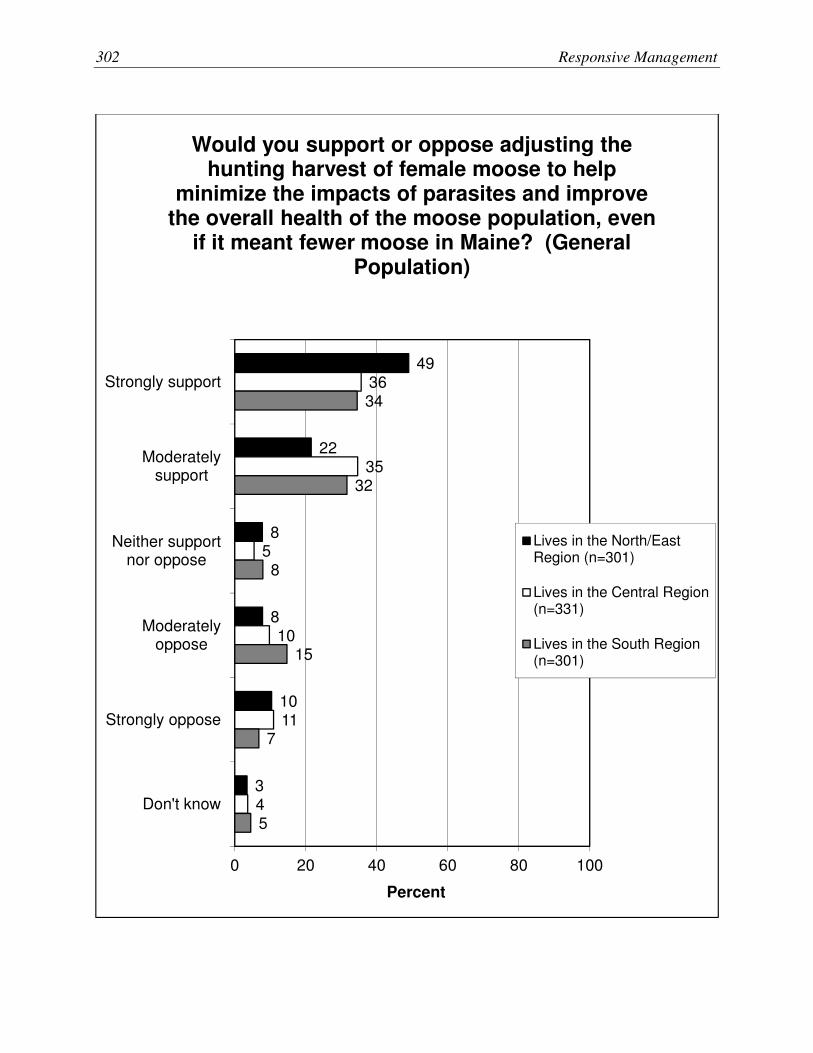
302 Responsive Management
49
22
8
8
10
3
36
35
5
10
11
4
34
32
8
15
7
5
0 20 40 60 80 100
Strongly support
Moderatelysupport
Neither supportnor oppose
Moderatelyoppose
Strongly oppose
Don't know
Percent
Would you support or oppose adjusting the hunting harvest of female moose to help
minimize the impacts of parasites and improve the overall health of the moose population, even
if it meant fewer moose in Maine? (General Population)
Lives in the North/EastRegion (n=301)
Lives in the Central Region(n=331)
Lives in the South Region(n=301)

Opinions of Residents, Landowners, and Hunters on Deer, Moose, Bear, and Turkey 303
31
19
10
5
4
32
36
32
7
3
4
18
41
27
8
5
6
13
0 20 40 60 80 100
Strongly support
Moderatelysupport
Neither supportnor oppose
Moderatelyoppose
Strongly oppose
Don't know
Percent
Do you support or oppose the current moose hunting season in Southern Maine? (General
Population)
Lives in the North/EastRegion (n=301)
Lives in the Central Region(n=331)
Lives in the South Region(n=301)

304 Responsive Management
Bear Management—General Population Ratings of bear management.
Opinions on the size of the bear population.
Support for increasing bear population with various caveats.
Factors to be considered in managing bear.
Support for/opposition to hunting as a way to manage bear.
Opinion on allowing bear populations to expand south.

Opinions of Residents, Landowners, and Hunters on Deer, Moose, Bear, and Turkey 305
29
29
21
6
15
22
36
17
5
20
21
34
13
6
27
0 20 40 60 80 100
Excellent
Good
Fair
Poor
Don't know
Percent
Overall, how would you rate bear management in Maine? (General Population)
Lives in the North/EastRegion (n=301)
Lives in the Central Region(n=331)
Lives in the South Region(n=301)

306 Responsive Management
6
70
8
12
4
9
58
3
25
5
2
50
3
43
2
0 20 40 60 80 100
Increased
Remain the same
Decreased
There are no bearin the area
Don't know
Percent
In your opinion, should the bear population in the area where you live be increased, remain the same, or be decreased? Or are there no bear in
the area where you live? (Asked of Maine residents.) (General Population)
Lives in the North/EastRegion (n=301)
Lives in the Central Region(n=331)
Lives in the South Region(n=301)

Opinions of Residents, Landowners, and Hunters on Deer, Moose, Bear, and Turkey 307
73
35
52
58
39
59
32
34
25
61
35
20
28
22
20
17
19
18
70
81
69
19
51
19
41
19
0
0 20 40 60 80 100
Additional or special bear hunting seasons hadto be opened to manage the bear population
Private citizens would be required to purchasebear-resistant garbage containers
An increased likelihood that bear would damageagricultural crops, gardens, and beehives
Private citizens would be required to resolvebear nuisance issues on their own
Government staff would need to spend moretime on bear nuisance or conflict complaints
More bears had to be killed in response toconflicts
Increased likelihood that bear would damageprivate property in general
An increased risk to public safety
Poor health overall for the bear population
Percent
Percent who would strongly support increasing bear population in area where they live if it
meant the following. (Asked of ME residents who think the bear population in their area should be increased.) (General Population)
Lives in the North/East Region (n=21)
Lives in the Central Region (n=32)
Lives in the South Region (n=6)

308 Responsive Management
82
59
82
88
81
68
60
62
34
88
69
51
41
51
33
28
30
22
100
100
70
88
38
100
100
81
50
0 20 40 60 80 100
Additional or special bear hunting seasons had tobe opened to manage the bear population
Private citizens would be required to purchasebear-resistant garbage containers
Government staff would need to spend more timeon bear nuisance or conflict complaints
More bears had to be killed in response toconflicts
Private citizens would be required to resolve bearnuisance issues on their own
An increased likelihood that bear would damageagricultural crops, gardens, and beehives
An increased risk to public safety
Increased likelihood that bear would damageprivate property in general
Poor health overall for the bear population
Percent
Percent who would strongly support or moderately support increasing bear population in area where they live if it meant the following.
(Asked of ME residents who think the bear population in their area should be increased.)
(General Population)
Lives in the North/East Region (n=21)
Lives in the Central Region (n=32)
Lives in the South Region (n=6)
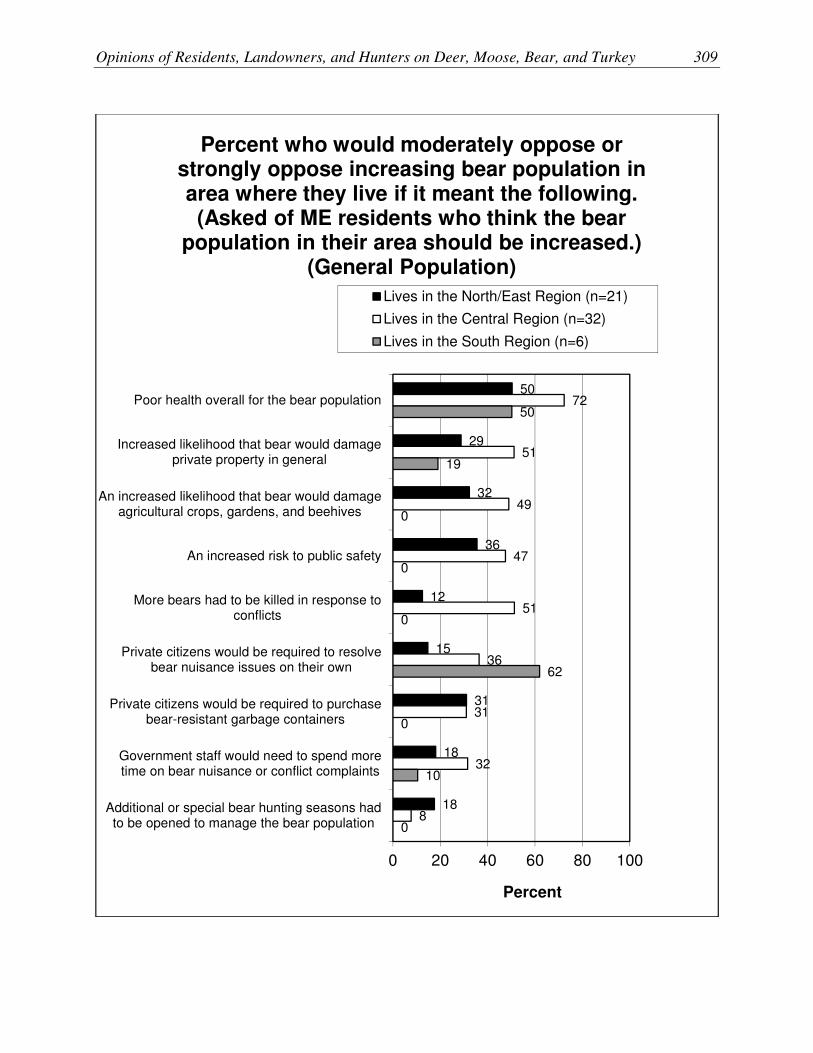
Opinions of Residents, Landowners, and Hunters on Deer, Moose, Bear, and Turkey 309
50
29
32
36
12
15
31
18
18
72
51
49
47
51
36
31
32
8
50
19
0
0
0
62
0
10
0
0 20 40 60 80 100
Poor health overall for the bear population
Increased likelihood that bear would damageprivate property in general
An increased likelihood that bear would damageagricultural crops, gardens, and beehives
An increased risk to public safety
More bears had to be killed in response toconflicts
Private citizens would be required to resolvebear nuisance issues on their own
Private citizens would be required to purchasebear-resistant garbage containers
Government staff would need to spend moretime on bear nuisance or conflict complaints
Additional or special bear hunting seasons hadto be opened to manage the bear population
Percent
Percent who would moderately oppose or strongly oppose increasing bear population in area where they live if it meant the following. (Asked of ME residents who think the bear
population in their area should be increased.) (General Population)
Lives in the North/East Region (n=21)
Lives in the Central Region (n=32)
Lives in the South Region (n=6)
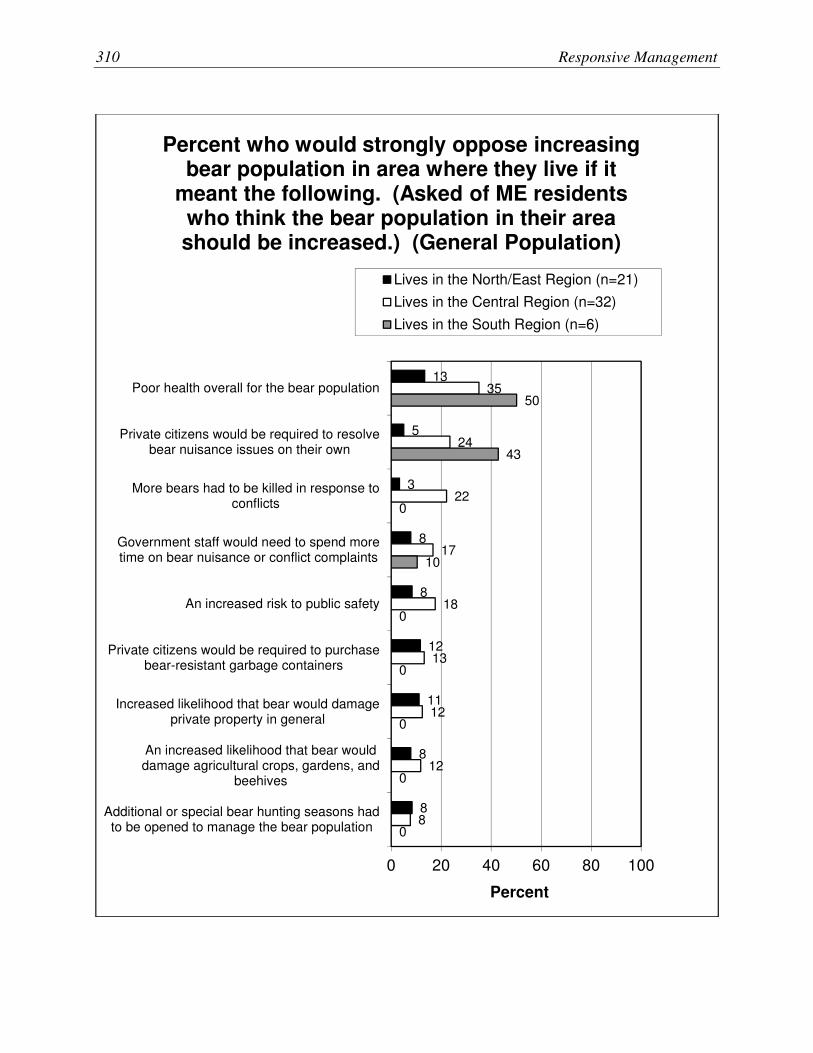
310 Responsive Management
13
5
3
8
8
12
11
8
8
35
24
22
17
18
13
12
12
8
50
43
0
10
0
0
0
0
0
0 20 40 60 80 100
Poor health overall for the bear population
Private citizens would be required to resolvebear nuisance issues on their own
More bears had to be killed in response toconflicts
Government staff would need to spend moretime on bear nuisance or conflict complaints
An increased risk to public safety
Private citizens would be required to purchasebear-resistant garbage containers
Increased likelihood that bear would damageprivate property in general
An increased likelihood that bear woulddamage agricultural crops, gardens, and
beehives
Additional or special bear hunting seasons hadto be opened to manage the bear population
Percent
Percent who would strongly oppose increasing bear population in area where they live if it
meant the following. (Asked of ME residents who think the bear population in their area should be increased.) (General Population)
Lives in the North/East Region (n=21)
Lives in the Central Region (n=32)
Lives in the South Region (n=6)

Opinions of Residents, Landowners, and Hunters on Deer, Moose, Bear, and Turkey 311
7.6
7.3
5.9
5.1
5.4
4.4
4.4
4.1
8.0
7.2
6.5
5.3
5.1
5.0
4.4
4.4
7.2
6.7
6.5
5.1
4.9
4.3
4.3
3.9
0 2 4 6 8 10
The health of the typicalbear
Providing bear huntingopportunities
Risks to public safety
Risk to pets or livestock
Impacts on other wildlife
Damage to agricultural crops
Risk of vehicle collisions withbear
Damage to gardens
Mean
On a scale of 0 to 10, where 0 is not at all important and 10 is extremely important, how important do you think each of the following
factors should be for managing the bear population in Maine? (General Population)
Lives in the North/East Region (157≤n≤205)
Lives in the Central Region (254≤n≤266)
Lives in the South Region (172≤n≤194)

312 Responsive Management
30
28
9
14
11
9
25
32
10
14
13
6
21
31
8
20
15
5
0 20 40 60 80 100
Strongly support
Moderatelysupport
Neither supportnor oppose
Moderatelyoppose
Strongly oppose
Don't know
Percent
Do you support or oppose allowing the bear population to expand further into central and
southern Maine? (General Population)
Lives in the North/EastRegion (n=301)
Lives in the Central Region(n=243)
Lives in the South Region(n=301)

Opinions of Residents, Landowners, and Hunters on Deer, Moose, Bear, and Turkey 313
Turkey Management—General Population Ratings of turkey management.
Opinions on the size of the turkey population.
Support for increasing turkey population with various caveats.
Factors to be considered in managing turkey.
Support for/opposition to hunting as a way to manage turkey.
Opinion on methods to control turkey if they become overabundant.

314 Responsive Management
13
33
21
8
25
14
30
28
15
12
24
30
17
9
20
0 20 40 60 80 100
Excellent
Good
Fair
Poor
Don't know
Percent
Overall, how would you rate turkey management in Maine? (General Population)
Lives in the North/EastRegion (n=301)
Lives in the Central Region(n=331)
Lives in the South Region(n=301)

Opinions of Residents, Landowners, and Hunters on Deer, Moose, Bear, and Turkey 315
21
46
18
11
4
5
51
35
6
3
5
63
23
5
4
0 20 40 60 80 100
Increased
Remain the same
Decreased
There are noturkey in the area
Don't know
Percent
In your opinion, should the turkey population in the area where you live be increased, remain the same, or be decreased? Or are there no turkey
in the area where you live? (Asked of Maine residents.) (General Population)
Lives in the North/EastRegion (n=301)
Lives in the Central Region(n=331)
Lives in the South Region(n=301)

316 Responsive Management
47
34
30
21
29
11
8
20
25
16
17
12
0
0
20
18
30
25
14
7
7
0 20 40 60 80 100
Private citizens would be required to resolveturkey nuisance issues on their own
An increase in predator populations, such asbobcat or coyotes
An increased likelihood that turkey woulddamage gardens or landscaping
That Department biologists would spend moretime on turkey management and less time on
other species
An increased likelihood that turkey woulddamage agricultural crops
Poor health overall for the turkey population
More turkey would die from starvation duringwinter
Percent
Percent who would strongly support increasing turkey population in area where they live if it meant the following. (Asked of ME residents who think the turkey population in their area should be increased.) (General Population)
Lives in the North/East Region (n=65)
Lives in the Central Region (15≤n≤18)
Lives in the South Region (n=20)

Opinions of Residents, Landowners, and Hunters on Deer, Moose, Bear, and Turkey 317
78
67
67
61
52
32
27
80
49
64
34
49
9
3
73
72
59
69
53
29
29
0 20 40 60 80 100
Private citizens would be required to resolveturkey nuisance issues on their own
An increased likelihood that turkey would damagegardens or landscaping
An increase in predator populations, such asbobcat or coyotes
An increased likelihood that turkey would damageagricultural crops
That Department biologists would spend moretime on turkey management and less time on
other species
Poor health overall for the turkey population
More turkey would die from starvation duringwinter
Percent
Percent who would strongly support or moderately support increasing turkey
population in area where they live if it meant the following. (Asked of ME residents who think the
turkey population in their area should be increased.) (General Population)
Lives in the North/East Region (n=65)
Lives in the Central Region (15≤n≤18)
Lives in the South Region (n=20)

318 Responsive Management
63
62
32
31
23
24
13
88
94
63
35
38
33
15
71
64
24
37
24
27
23
0 20 40 60 80 100
Poor health overall for the turkey population
More turkey would die from starvation duringwinter
An increased likelihood that turkey woulddamage agricultural crops
That Department biologists would spend moretime on turkey management and less time on
other species
An increased likelihood that turkey woulddamage gardens or landscaping
An increase in predator populations, such asbobcat or coyotes
Private citizens would be required to resolveturkey nuisance issues on their own
Percent
Percent who would moderately oppose or strongly oppose increasing turkey population in
area where they live if it meant the following. (Asked of ME residents who think the turkey
population in their area should be increased.) (General Population)
Lives in the North/East Region (n=65)
Lives in the Central Region (15≤n≤18)
Lives in the South Region (n=20)
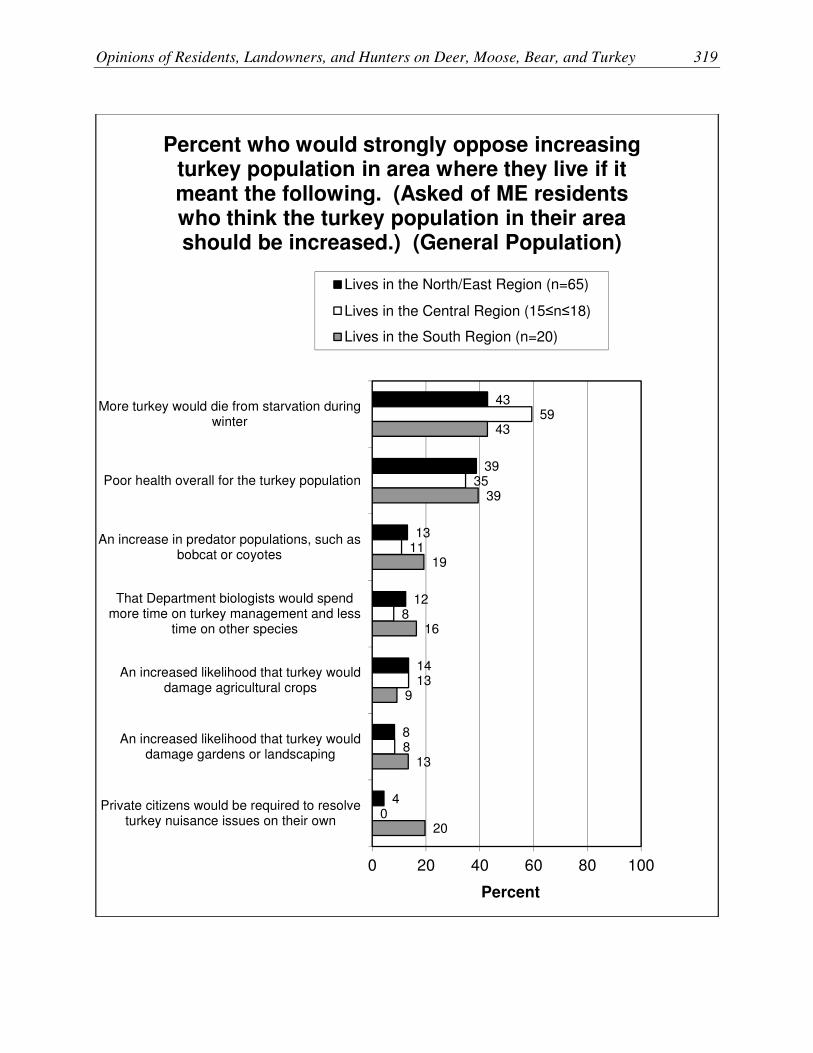
Opinions of Residents, Landowners, and Hunters on Deer, Moose, Bear, and Turkey 319
43
39
13
12
14
8
4
59
35
11
8
13
8
0
43
39
19
16
9
13
20
0 20 40 60 80 100
More turkey would die from starvation duringwinter
Poor health overall for the turkey population
An increase in predator populations, such asbobcat or coyotes
That Department biologists would spendmore time on turkey management and less
time on other species
An increased likelihood that turkey woulddamage agricultural crops
An increased likelihood that turkey woulddamage gardens or landscaping
Private citizens would be required to resolveturkey nuisance issues on their own
Percent
Percent who would strongly oppose increasing turkey population in area where they live if it meant the following. (Asked of ME residents who think the turkey population in their area should be increased.) (General Population)
Lives in the North/East Region (n=65)
Lives in the Central Region (15≤n≤18)
Lives in the South Region (n=20)
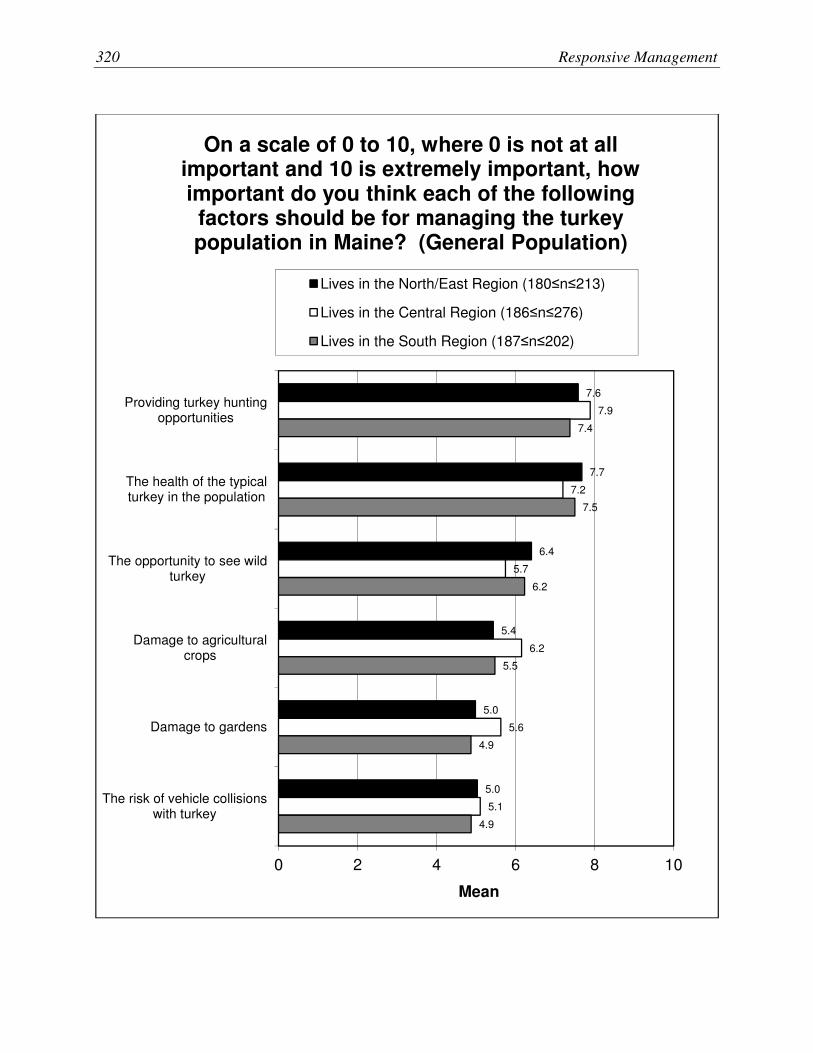
320 Responsive Management
7.6
7.7
6.4
5.4
5.0
5.0
7.9
7.2
5.7
6.2
5.6
5.1
7.4
7.5
6.2
5.5
4.9
4.9
0 2 4 6 8 10
Providing turkey huntingopportunities
The health of the typicalturkey in the population
The opportunity to see wildturkey
Damage to agriculturalcrops
Damage to gardens
The risk of vehicle collisionswith turkey
Mean
On a scale of 0 to 10, where 0 is not at all important and 10 is extremely important, how important do you think each of the following factors should be for managing the turkey population in Maine? (General Population)
Lives in the North/East Region (180≤n≤213)
Lives in the Central Region (186≤n≤276)
Lives in the South Region (187≤n≤202)

Opinions of Residents, Landowners, and Hunters on Deer, Moose, Bear, and Turkey 321
77
18
2
1
1
1
71
21
3
2
2
1
66
24
3
3
3
0
0 20 40 60 80 100
Strongly support
Moderatelysupport
Neither supportnor oppose
Moderatelyoppose
Strongly oppose
Don't know
Percent
Do you support or oppose legal hunting as a method to help manage the turkey population in
Maine? (General Population)
Lives in the North/EastRegion (n=301)
Lives in the Central Region(n=331)
Lives in the South Region(n=301)

322 Responsive Management
66
69
69
64
61
64
63
62
58
54
54
43
0 20 40 60 80 100
Increasing the numberof turkeys that hunterscan harvest in areasexperiencing damage
by turkey
Implementing acontrolled hunt in areasexperiencing damage
by turkeys
Allowing landowners toapply for a permit to
remove turkeys that arecausing problems on
their land
Extending the huntingseason later into the fall
or winter
Percent
Percent of respondents who would strongly support each of the following turkey
management options in areas of Maine where the turkey population became overabundant.
(General Population)
Lives in the North/East Region (n=301)
Lives in the Central Region (n=331)
Lives in the South Region (n=301)

Opinions of Residents, Landowners, and Hunters on Deer, Moose, Bear, and Turkey 323
92
88
86
85
92
89
87
86
87
86
85
74
0 20 40 60 80 100
Implementing a controlledhunt in areas
experiencing damage byturkeys
Allowing landowners toapply for a permit to
remove turkeys that arecausing problems on their
land
Increasing the number ofturkeys that hunters can
harvest in areasexperiencing damage by
turkey
Extending the huntingseason later into the fall
or winter
Percent
Percent of respondents who would strongly support or moderately support each of the
following turkey management options in areas of Maine where the turkey population became
overabundant. (General Population)
Lives in the North/East Region (n=301)
Lives in the Central Region (n=331)
Lives in the South Region (n=301)
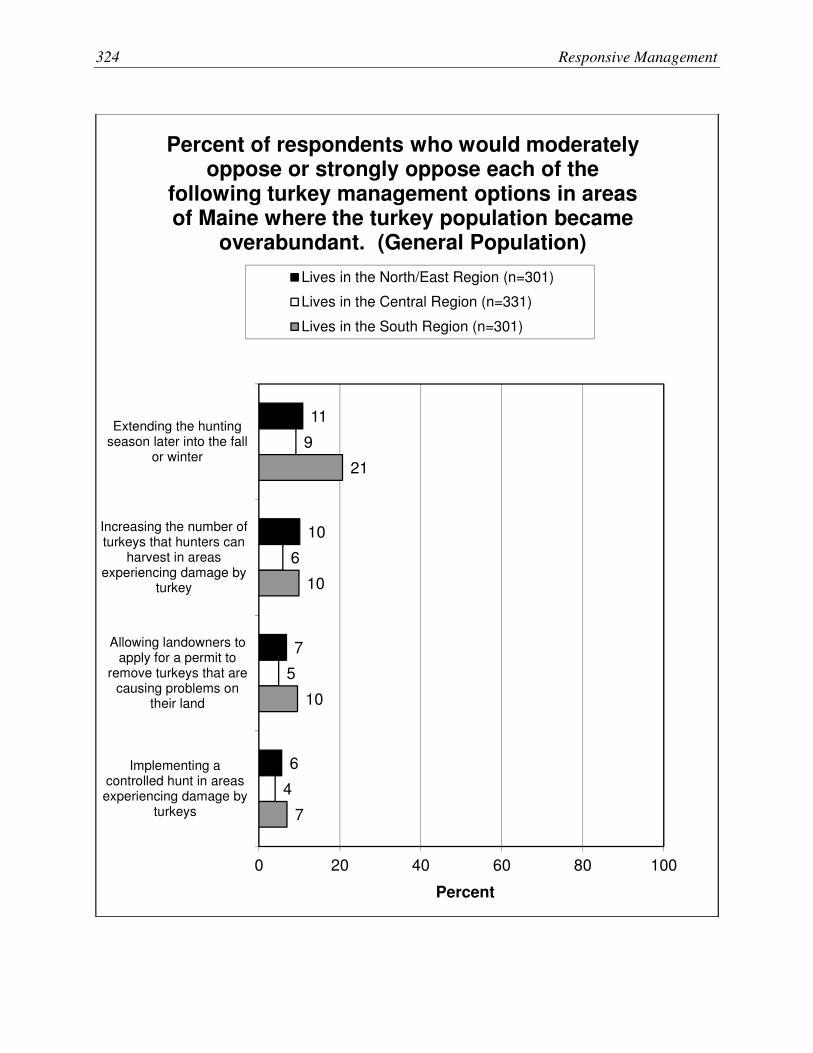
324 Responsive Management
11
10
7
6
9
6
5
4
21
10
10
7
0 20 40 60 80 100
Extending the huntingseason later into the fall
or winter
Increasing the number ofturkeys that hunters can
harvest in areasexperiencing damage by
turkey
Allowing landowners toapply for a permit to
remove turkeys that arecausing problems on
their land
Implementing acontrolled hunt in areasexperiencing damage by
turkeys
Percent
Percent of respondents who would moderately oppose or strongly oppose each of the
following turkey management options in areas of Maine where the turkey population became
overabundant. (General Population)
Lives in the North/East Region (n=301)
Lives in the Central Region (n=331)
Lives in the South Region (n=301)
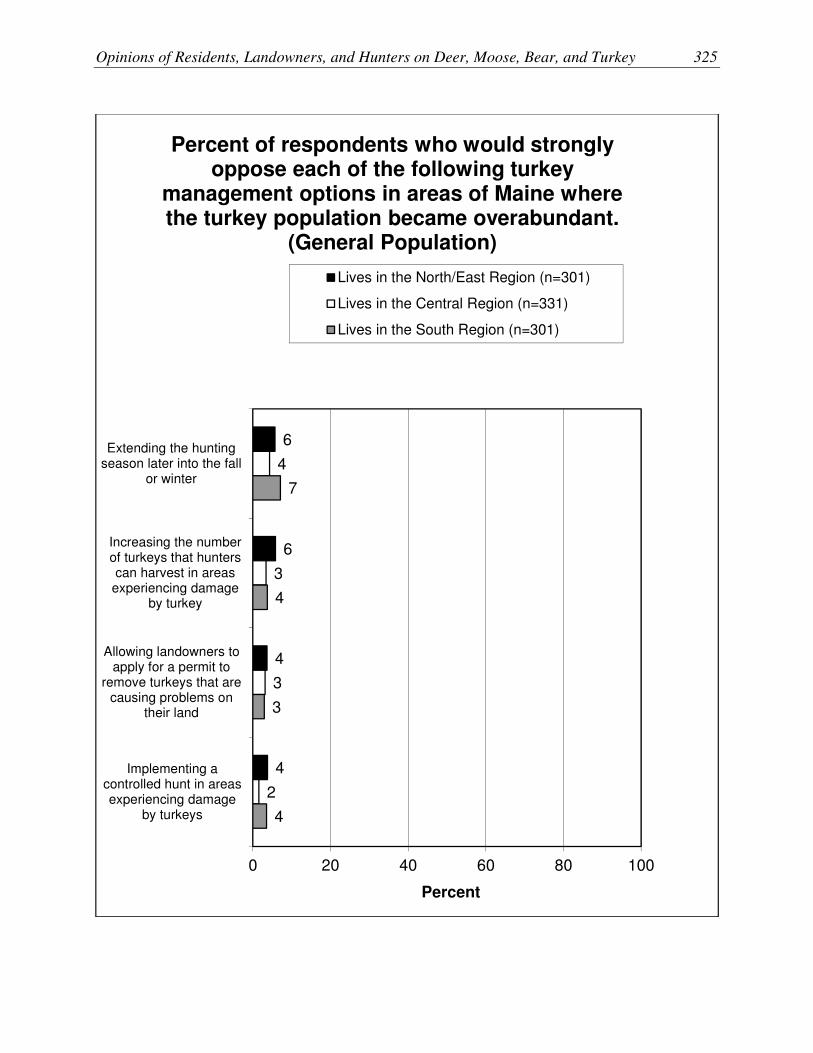
Opinions of Residents, Landowners, and Hunters on Deer, Moose, Bear, and Turkey 325
6
6
4
4
4
3
3
2
7
4
3
4
0 20 40 60 80 100
Extending the huntingseason later into the fall
or winter
Increasing the numberof turkeys that hunterscan harvest in areasexperiencing damage
by turkey
Allowing landowners toapply for a permit to
remove turkeys that arecausing problems on
their land
Implementing acontrolled hunt in areasexperiencing damage
by turkeys
Percent
Percent of respondents who would strongly oppose each of the following turkey
management options in areas of Maine where the turkey population became overabundant.
(General Population)
Lives in the North/East Region (n=301)
Lives in the Central Region (n=331)
Lives in the South Region (n=301)

326 Responsive Management
Demographic Data—General Population Gender.
Age.
Education.
Residential character of where residence is located.
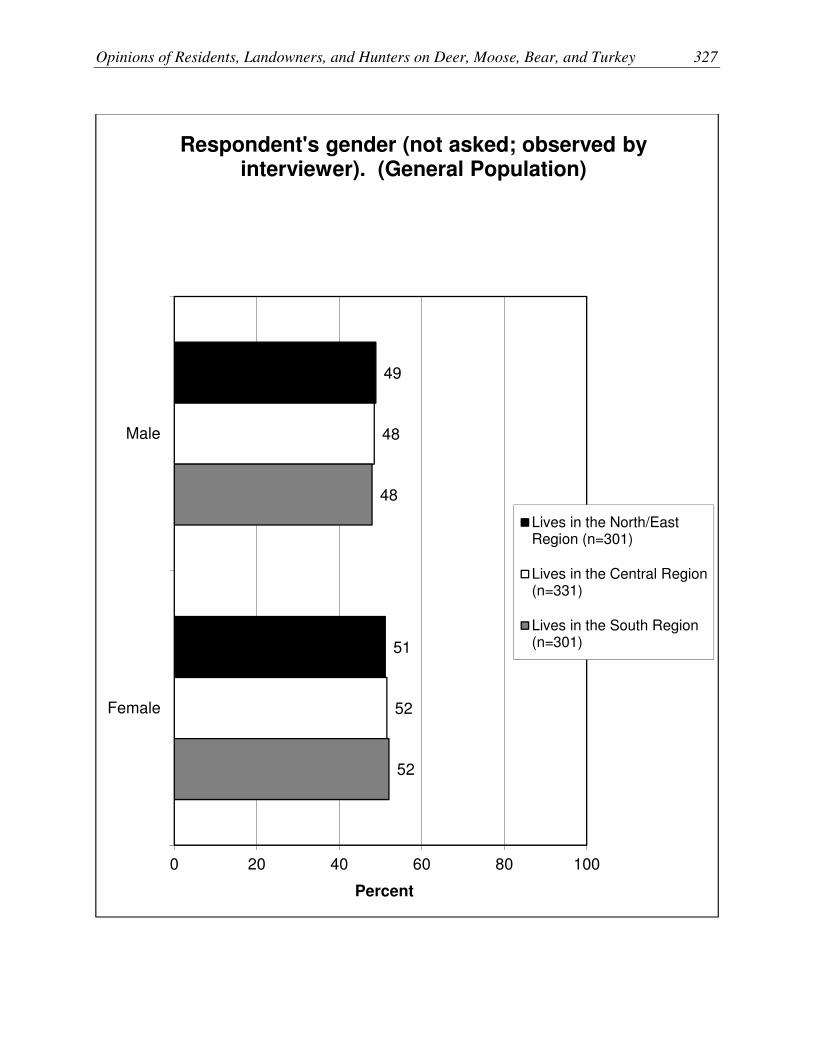
Opinions of Residents, Landowners, and Hunters on Deer, Moose, Bear, and Turkey 327
49
51
48
52
48
52
0 20 40 60 80 100
Male
Female
Percent
Respondent's gender (not asked; observed by interviewer). (General Population)
Lives in the North/EastRegion (n=301)
Lives in the Central Region(n=331)
Lives in the South Region(n=301)

328 Responsive Management
23
19
20
14
11
9
3
19
17
21
16
14
13
1
19
17
20
16
14
9
5
0 20 40 60 80 100
65 or older
55-64
45-54
35-44
25-34
18-24
Refused
Percent
May I ask your age? (General Population)
Lives in the North/EastRegion (n=301)
Lives in the Central Region(n=331)
Lives in the South Region(n=301)
North/East mean: 50.8Central mean: 47.8South mean: 49.2

Opinions of Residents, Landowners, and Hunters on Deer, Moose, Bear, and Turkey 329
3
33
24
12
18
7
2
0
0
2
29
17
11
28
9
2
1
2
2
19
17
11
32
14
4
0
1
0 20 40 60 80 100
Not a high school graduate
High school graduate orequivalent
Some college or trade school, nodegree
Associate's or trade school degree
Bachelor's degree
Master's degree
Professional or doctorate degree
Don't know
Refused
Percent
What is the highest level of education you have completed? (General Population)
Lives in the North/EastRegion (n=301)
Lives in the Central Region(n=331)
Lives in the South Region(n=301)
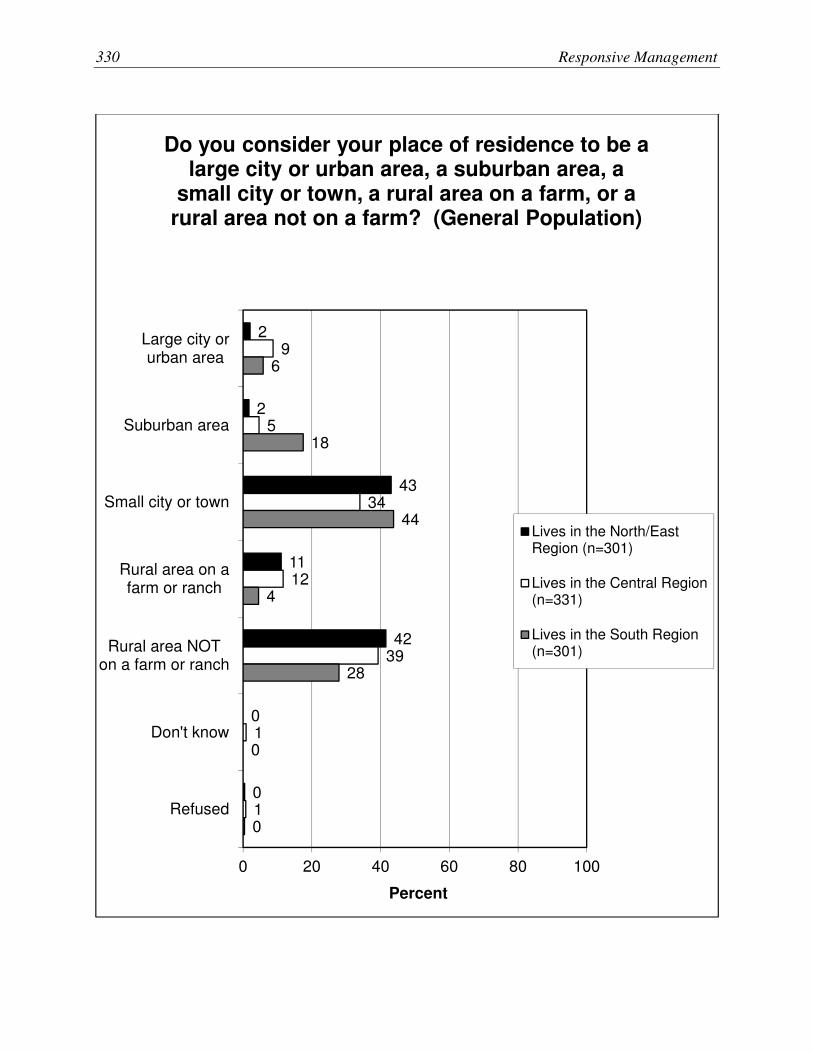
330 Responsive Management
2
2
43
11
42
0
0
9
5
34
12
39
1
1
6
18
44
4
28
0
0
0 20 40 60 80 100
Large city orurban area
Suburban area
Small city or town
Rural area on afarm or ranch
Rural area NOTon a farm or ranch
Don't know
Refused
Percent
Do you consider your place of residence to be a large city or urban area, a suburban area, a
small city or town, a rural area on a farm, or a rural area not on a farm? (General Population)
Lives in the North/EastRegion (n=301)
Lives in the Central Region(n=331)
Lives in the South Region(n=301)
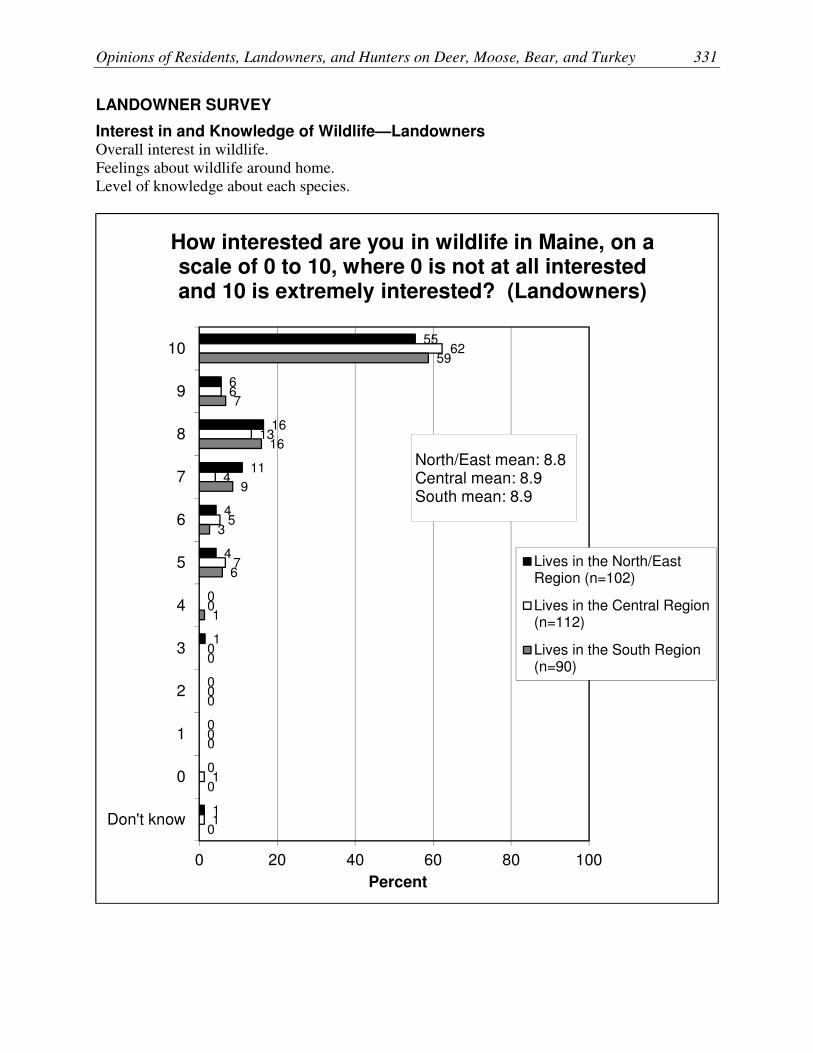
Opinions of Residents, Landowners, and Hunters on Deer, Moose, Bear, and Turkey 331
LANDOWNER SURVEY
Interest in and Knowledge of Wildlife—Landowners Overall interest in wildlife.
Feelings about wildlife around home.
Level of knowledge about each species.
55
6
16
11
4
4
0
1
0
0
0
1
62
6
13
4
5
7
0
0
0
0
1
1
59
7
16
9
3
6
1
0
0
0
0
0
0 20 40 60 80 100
10
9
8
7
6
5
4
3
2
1
0
Don't know
Percent
How interested are you in wildlife in Maine, on a scale of 0 to 10, where 0 is not at all interested and 10 is extremely interested? (Landowners)
Lives in the North/EastRegion (n=102)
Lives in the Central Region(n=112)
Lives in the South Region(n=90)
North/East mean: 8.8Central mean: 8.9South mean: 8.9

332 Responsive Management
80
16
0
1
1
1
81
19
0
0
0
0
76
19
4
0
1
0
0 20 40 60 80 100
I enjoy seeing and having wildlifearound my home or on my property
I enjoy seeing a few animalsaround my home or on my propertybut worry about the problems they
cause
I generally regard wildlife aroundmy home or on my property as a
nuisance
I generally regard wildlife aroundmy home or on my property as
dangerous
I have no particular feeling aboutwildlife around my home or on my
property
Don't know
Percent
Generally, which of the following best describes your feelings about wildlife around your home
or on your property? (Landowners)
Largest tract is in theNorth/East Region (n=105)
Largest tract is in the CentralRegion (n=112)
Largest tract is in the SouthRegion (n=87)
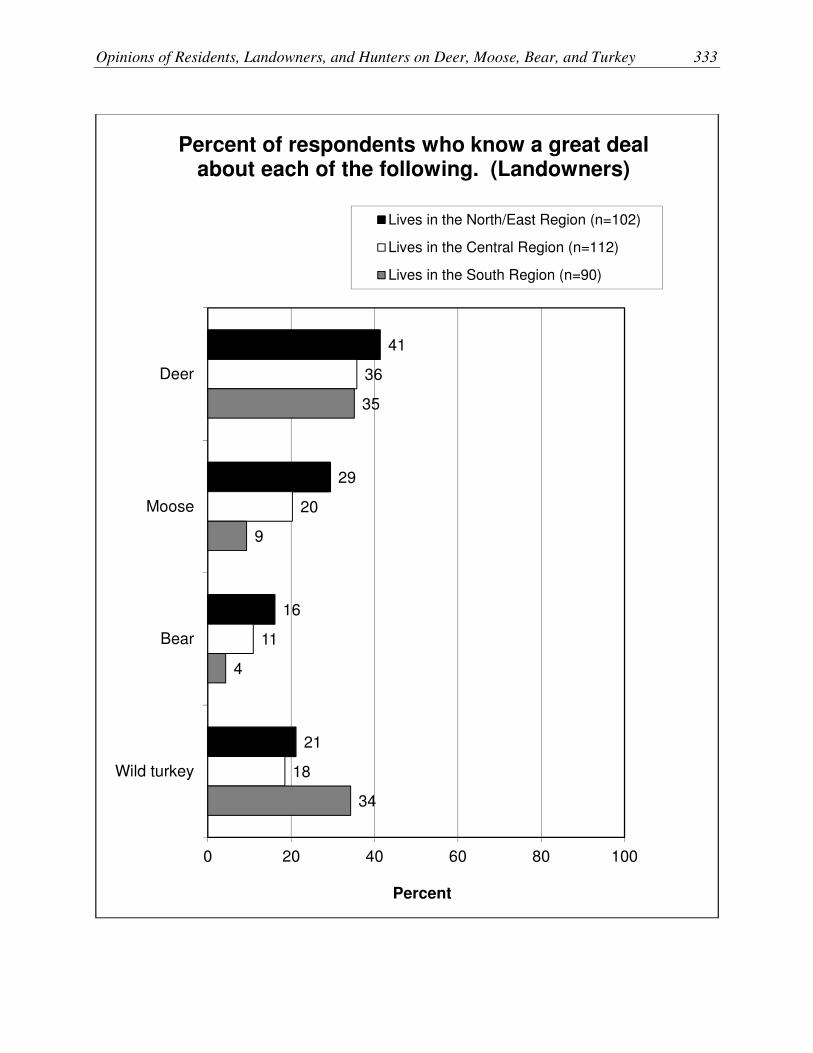
Opinions of Residents, Landowners, and Hunters on Deer, Moose, Bear, and Turkey 333
41
29
16
21
36
20
11
18
35
9
4
34
0 20 40 60 80 100
Deer
Moose
Bear
Wild turkey
Percent
Percent of respondents who know a great deal about each of the following. (Landowners)
Lives in the North/East Region (n=102)
Lives in the Central Region (n=112)
Lives in the South Region (n=90)

334 Responsive Management
85
69
62
54
91
68
49
67
83
47
37
68
0 20 40 60 80 100
Deer
Moose
Bear
Wild turkey
Percent
Percent of respondents who know a great deal or a moderate amount about each of the
following. (Landowners)
Lives in the North/East Region (n=102)
Lives in the Central Region (n=112)
Lives in the South Region (n=90)

Opinions of Residents, Landowners, and Hunters on Deer, Moose, Bear, and Turkey 335
97
97
96
86
97
93
89
97
93
78
99
0 20 40 60 80 100
Deer
Moose
Bear
Wildturkey
Percent
Percent of respondents who know a great deal, a moderate amount, or a little about each of the
following. (Landowners)
Lives in the North/East Region (n=102)
Lives in the Central Region (n=112)
Lives in the South Region (n=90)

336 Responsive Management
1
1
4
14
3
7
11
3
0
7
22
1
0 20 40 60 80 100
Deer
Moose
Bear
Wild turkey
Percent
Percent of respondents who know nothing at all about each of the following. (Landowners)
Lives in the North/East Region (n=102)
Lives in the Central Region (n=112)
Lives in the South Region (n=90)
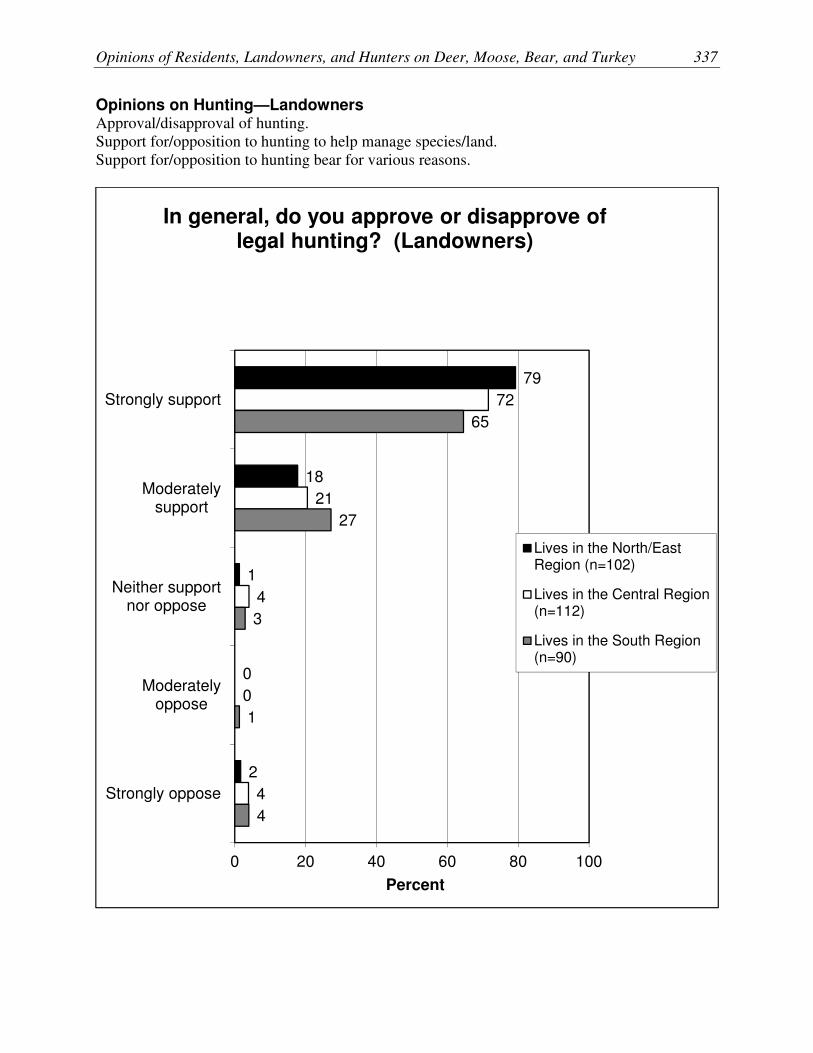
Opinions of Residents, Landowners, and Hunters on Deer, Moose, Bear, and Turkey 337
Opinions on Hunting—Landowners Approval/disapproval of hunting.
Support for/opposition to hunting to help manage species/land.
Support for/opposition to hunting bear for various reasons.
79
18
1
0
2
72
21
4
0
4
65
27
3
1
4
0 20 40 60 80 100
Strongly support
Moderatelysupport
Neither supportnor oppose
Moderatelyoppose
Strongly oppose
Percent
In general, do you approve or disapprove of legal hunting? (Landowners)
Lives in the North/EastRegion (n=102)
Lives in the Central Region(n=112)
Lives in the South Region(n=90)

338 Responsive Management
80
17
1
0
2
72
20
4
0
4
62
30
3
1
4
0 20 40 60 80 100
Strongly support
Moderatelysupport
Neither supportnor oppose
Moderatelyoppose
Strongly oppose
Percent
In general, do you approve or disapprove of legal hunting? (Landowners)
Largest tract is in theNorth/East Region (n=105)
Largest tract is in the CentralRegion (n=112)
Largest tract is in the SouthRegion (n=87)

Opinions of Residents, Landowners, and Hunters on Deer, Moose, Bear, and Turkey 339
89
7
0
1
3
79
13
4
1
3
75
18
1
1
4
0 20 40 60 80 100
Strongly approve
Moderatelyapprove
Neither approvenor disapprove
Moderatelydisapprove
Stronglydisapprove
Percent
In general, do you approve or disapprove of legal deer hunting? (Landowners)
Lives in the North/EastRegion (n=102)
Lives in the Central Region(n=112)
Lives in the South Region(n=90)

340 Responsive Management
89
7
0
1
2
80
12
4
1
3
72
21
1
1
4
0 20 40 60 80 100
Strongly approve
Moderatelyapprove
Neither approvenor disapprove
Moderatelydisapprove
Stronglydisapprove
Percent
In general, do you approve or disapprove of legal deer hunting? (Landowners)
Largest tract is in theNorth/East Region (n=105)
Largest tract is in the CentralRegion (n=112)
Largest tract is in the SouthRegion (n=87)
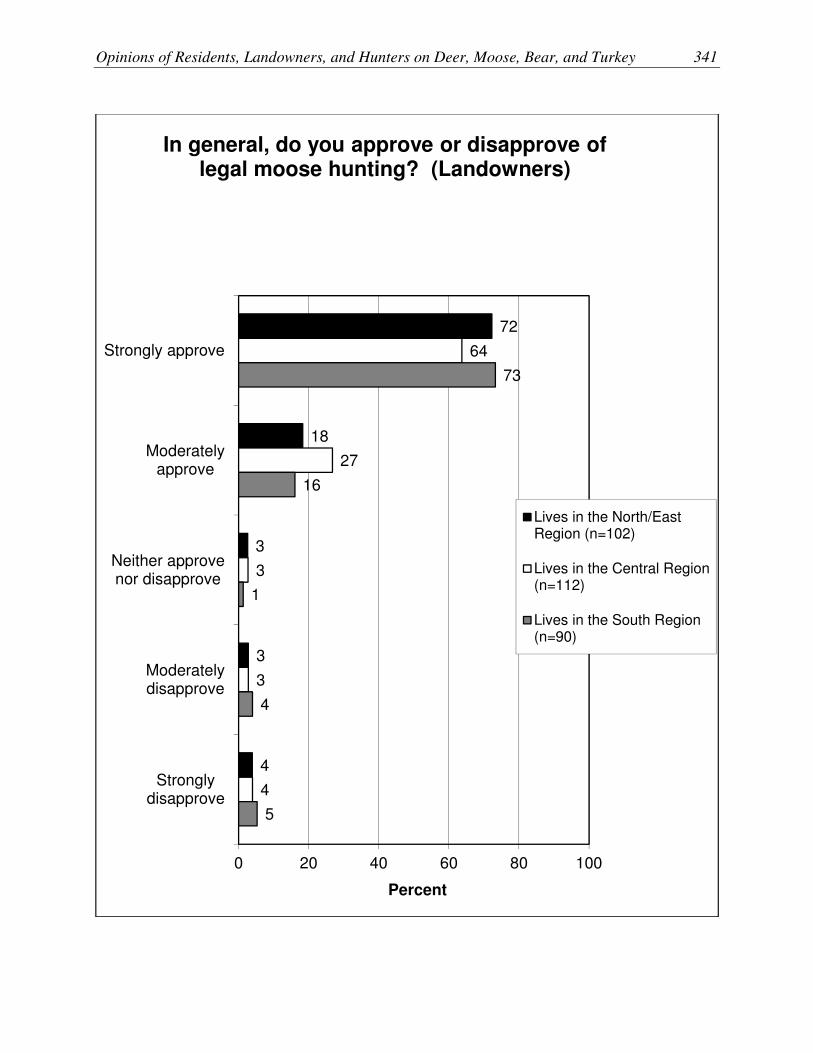
Opinions of Residents, Landowners, and Hunters on Deer, Moose, Bear, and Turkey 341
72
18
3
3
4
64
27
3
3
4
73
16
1
4
5
0 20 40 60 80 100
Strongly approve
Moderatelyapprove
Neither approvenor disapprove
Moderatelydisapprove
Stronglydisapprove
Percent
In general, do you approve or disapprove of legal moose hunting? (Landowners)
Lives in the North/EastRegion (n=102)
Lives in the Central Region(n=112)
Lives in the South Region(n=90)

342 Responsive Management
73
18
2
3
4
64
26
3
3
4
71
19
1
4
5
0 20 40 60 80 100
Strongly approve
Moderatelyapprove
Neither approvenor disapprove
Moderatelydisapprove
Stronglydisapprove
Percent
In general, do you approve or disapprove of legal moose hunting? (Landowners)
Largest tract is in theNorth/East Region (n=105)
Largest tract is in the CentralRegion (n=112)
Largest tract is in the SouthRegion (n=87)

Opinions of Residents, Landowners, and Hunters on Deer, Moose, Bear, and Turkey 343
74
17
1
2
6
0
58
23
3
7
8
1
67
17
6
4
5
1
0 20 40 60 80 100
Strongly approve
Moderatelyapprove
Neither approvenor disapprove
Moderatelydisapprove
Stronglydisapprove
Don't know
Percent
In general, do you approve or disapprove of legal bear hunting? (Landowners)
Lives in the North/EastRegion (n=102)
Lives in the Central Region(n=112)
Lives in the South Region(n=90)

344 Responsive Management
75
17
1
2
5
0
58
24
3
7
7
1
64
16
6
4
8
1
0 20 40 60 80 100
Strongly approve
Moderatelyapprove
Neither approvenor disapprove
Moderatelydisapprove
Stronglydisapprove
Don't know
Percent
In general, do you approve or disapprove of legal bear hunting? (Landowners)
Largest tract is in theNorth/East Region (n=105)
Largest tract is in the CentralRegion (n=112)
Largest tract is in the SouthRegion (n=87)

Opinions of Residents, Landowners, and Hunters on Deer, Moose, Bear, and Turkey 345
61
60
38
34
14
65
61
45
31
11
62
67
47
26
14
0 20 40 60 80 100
For the meat
As a method to helpmanage bear
populations in Maine
For economicbenefits to rural
areas
For recreation
For a trophy
Percent
Percent of respondents who would strongly support hunting bear for each of the following
reasons. (Landowners)
Lives in theNorth/East Region(n=102)
Lives in the CentralRegion (n=112)
Lives in the SouthRegion (n=90)
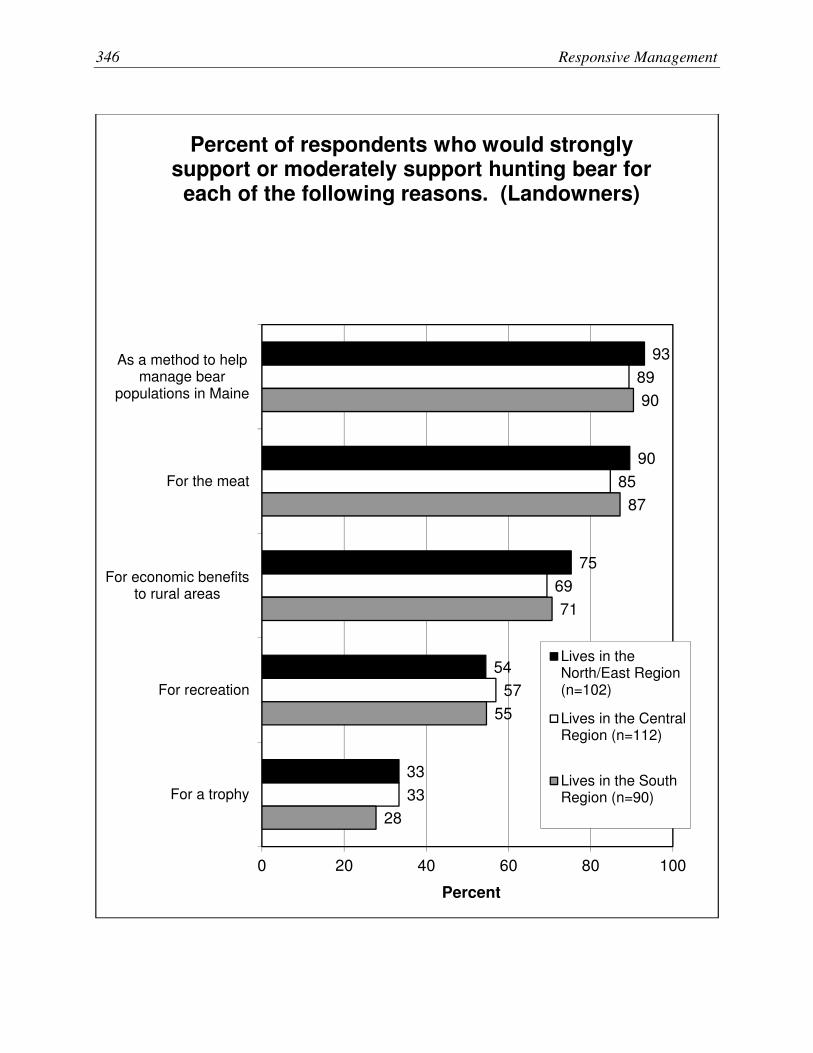
346 Responsive Management
93
90
75
54
33
89
85
69
57
33
90
87
71
55
28
0 20 40 60 80 100
As a method to helpmanage bear
populations in Maine
For the meat
For economic benefitsto rural areas
For recreation
For a trophy
Percent
Percent of respondents who would strongly support or moderately support hunting bear for
each of the following reasons. (Landowners)
Lives in theNorth/East Region(n=102)
Lives in the CentralRegion (n=112)
Lives in the SouthRegion (n=90)

Opinions of Residents, Landowners, and Hunters on Deer, Moose, Bear, and Turkey 347
60
38
19
8
6
59
33
20
8
8
67
42
22
7
5
0 20 40 60 80 100
For a trophy
For recreation
For economic benefitsto rural areas
For the meat
As a method to helpmanage bear
populations in Maine
Percent
Percent of respondents who would moderately oppose or strongly oppose hunting bear for
each of the following reasons. (Landowners)
Lives in the North/East Region(n=102)
Lives in the Central Region(n=112)
Lives in the South Region(n=90)

348 Responsive Management
48
28
12
5
3
47
26
8
4
5
51
28
14
6
4
0 20 40 60 80 100
For a trophy
For recreation
For economicbenefits to rural
areas
For the meat
As a method to helpmanage bear
populations in Maine
Percent
Percent of respondents who would strongly oppose hunting bear for each of the following
reasons. (Landowners)
Lives in the North/EastRegion (n=102)
Lives in the CentralRegion (n=112)
Lives in the SouthRegion (n=90)

Opinions of Residents, Landowners, and Hunters on Deer, Moose, Bear, and Turkey 349
63
62
41
35
16
65
61
44
32
10
60
64
44
24
12
0 20 40 60 80 100
For the meat
As a method to helpmanage bear
populations in Maine
For economic benefitsto rural areas
For recreation
For a trophy
Percent
Percent of respondents who would strongly support hunting bear for each of the following
reasons. (Landowners)
Largest tract is in the North/East Region (n=105)
Largest tract is in the Central Region (n=112)
Largest tract is in the South Region (n=87)
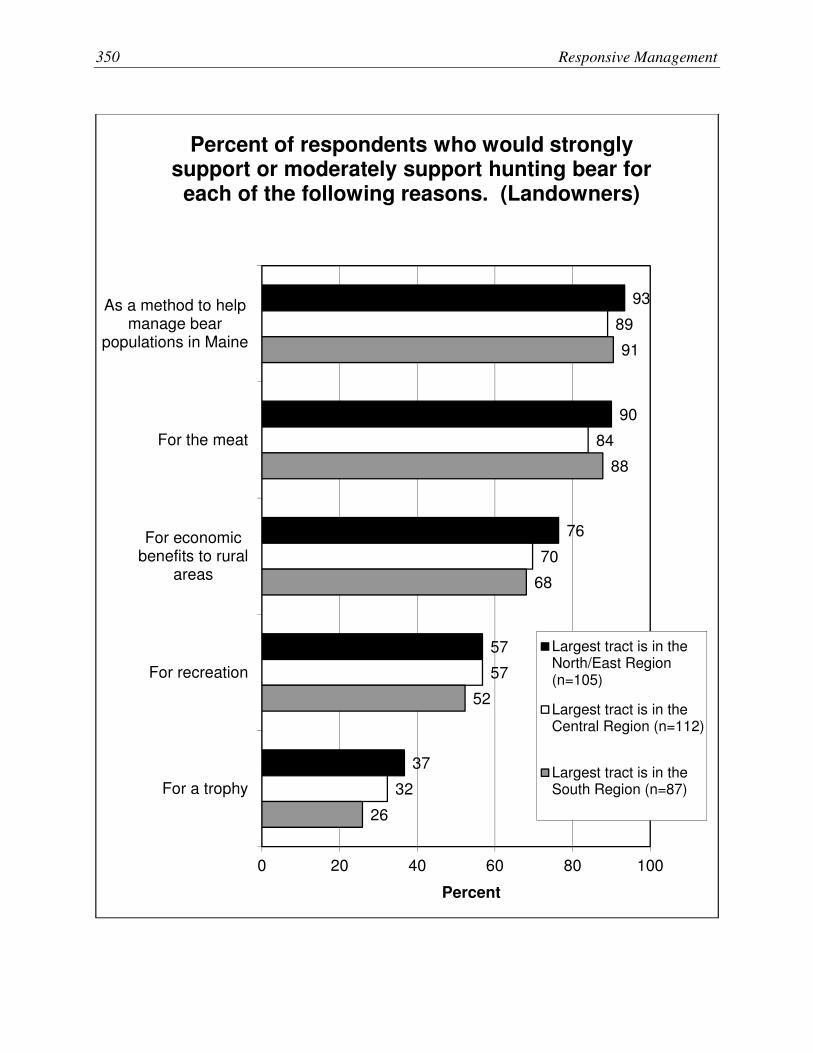
350 Responsive Management
93
90
76
57
37
89
84
70
57
32
91
88
68
52
26
0 20 40 60 80 100
As a method to helpmanage bear
populations in Maine
For the meat
For economicbenefits to rural
areas
For recreation
For a trophy
Percent
Percent of respondents who would strongly support or moderately support hunting bear for
each of the following reasons. (Landowners)
Largest tract is in theNorth/East Region(n=105)
Largest tract is in theCentral Region (n=112)
Largest tract is in theSouth Region (n=87)

Opinions of Residents, Landowners, and Hunters on Deer, Moose, Bear, and Turkey 351
57
37
18
8
5
60
33
19
8
8
69
45
25
7
5
0 20 40 60 80 100
For a trophy
For recreation
For economicbenefits to rural
areas
For the meat
As a method to helpmanage bear
populations in Maine
Percent
Percent of respondents who would moderately oppose or strongly oppose hunting bear for
each of the following reasons. (Landowners)
Largest tract is in theNorth/East Region(n=105)
Largest tract is in theCentral Region (n=112)
Largest tract is in theSouth Region (n=87)

352 Responsive Management
46
27
11
5
3
47
26
7
4
5
53
31
17
5
4
0 20 40 60 80 100
For a trophy
For recreation
For economic benefitsto rural areas
For the meat
As a method to helpmanage bear
populations in Maine
Percent
Percent of respondents who would strongly oppose hunting bear for each of the following
reasons. (Landowners)
Largest tract is in the North/East Region (n=105)
Largest tract is in the Central Region (n=112)
Largest tract is in the South Region (n=87)
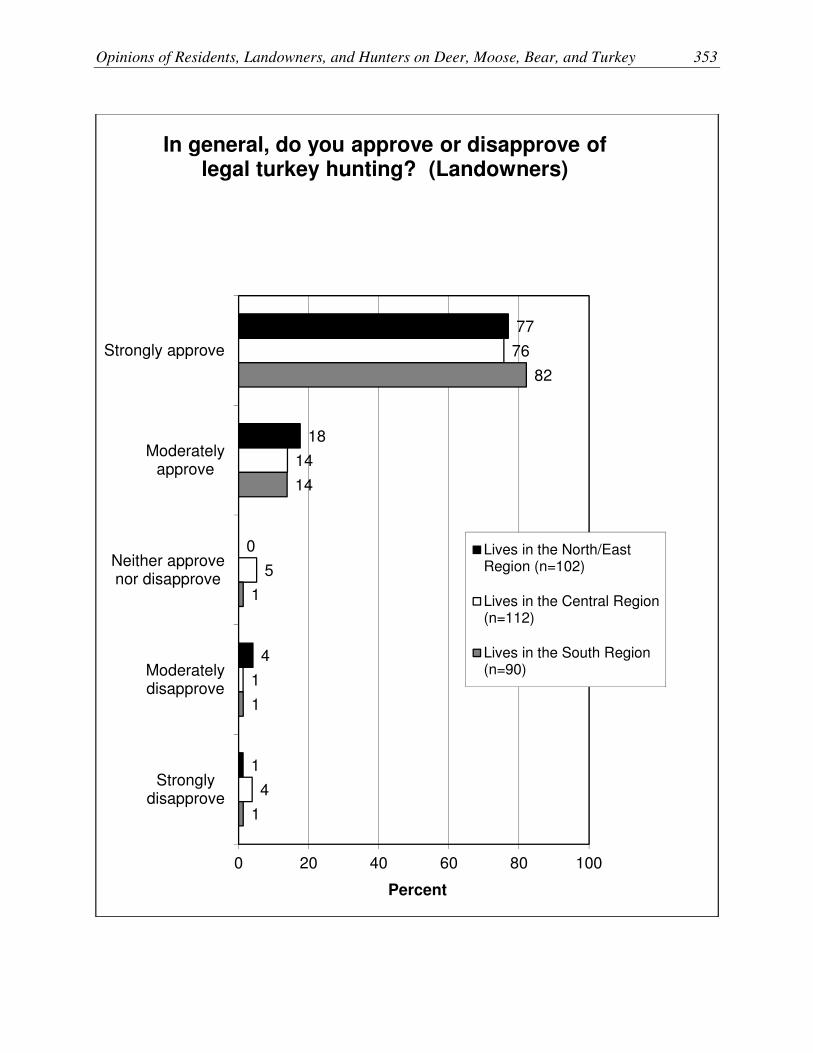
Opinions of Residents, Landowners, and Hunters on Deer, Moose, Bear, and Turkey 353
77
18
0
4
1
76
14
5
1
4
82
14
1
1
1
0 20 40 60 80 100
Strongly approve
Moderatelyapprove
Neither approvenor disapprove
Moderatelydisapprove
Stronglydisapprove
Percent
In general, do you approve or disapprove of legal turkey hunting? (Landowners)
Lives in the North/EastRegion (n=102)
Lives in the Central Region(n=112)
Lives in the South Region(n=90)
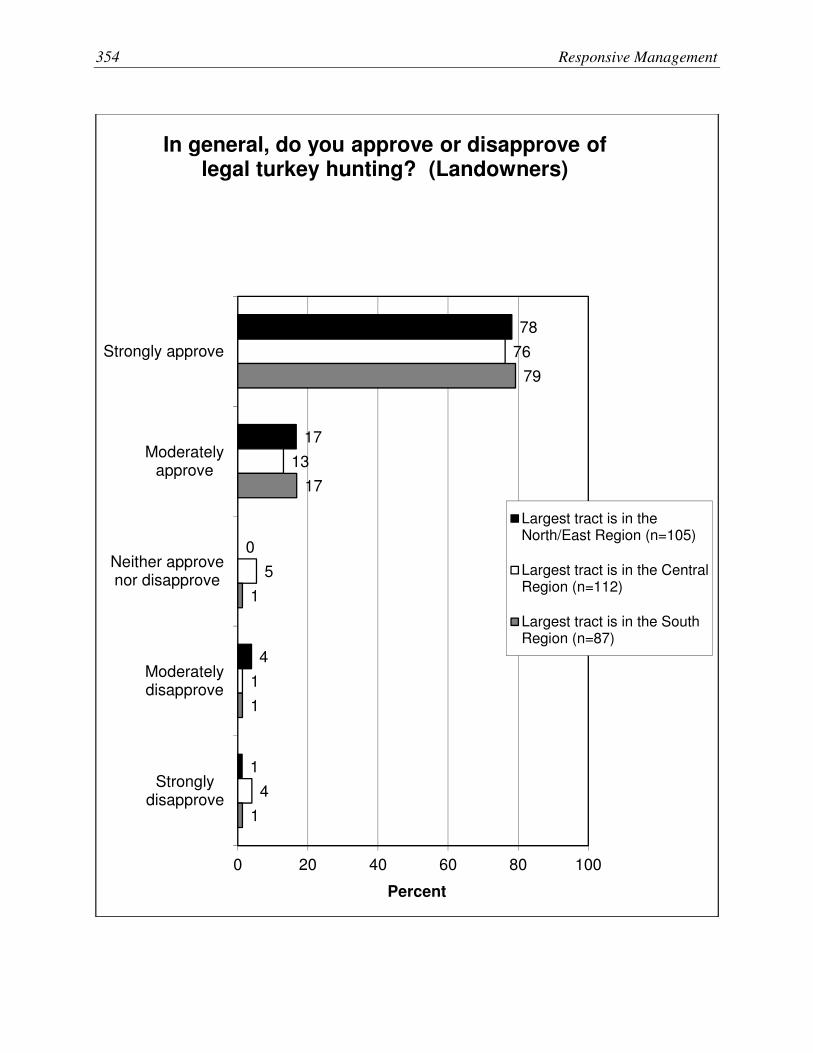
354 Responsive Management
78
17
0
4
1
76
13
5
1
4
79
17
1
1
1
0 20 40 60 80 100
Strongly approve
Moderatelyapprove
Neither approvenor disapprove
Moderatelydisapprove
Stronglydisapprove
Percent
In general, do you approve or disapprove of legal turkey hunting? (Landowners)
Largest tract is in theNorth/East Region (n=105)
Largest tract is in the CentralRegion (n=112)
Largest tract is in the SouthRegion (n=87)
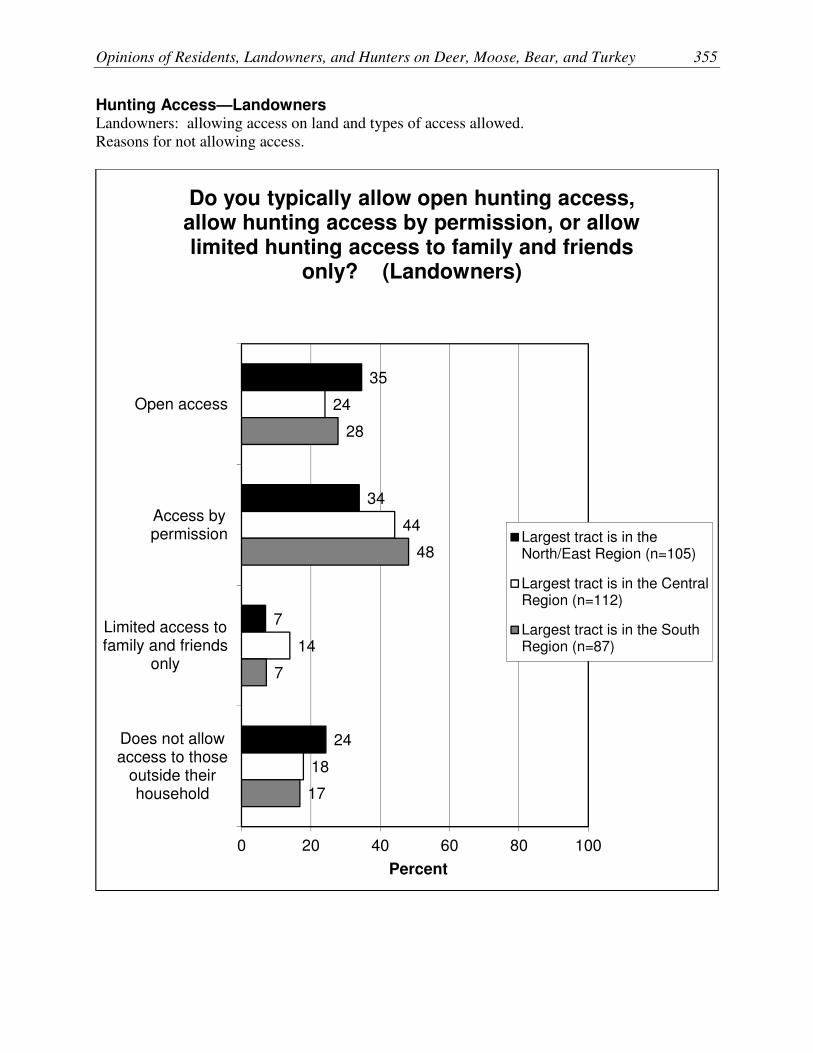
Opinions of Residents, Landowners, and Hunters on Deer, Moose, Bear, and Turkey 355
Hunting Access—Landowners Landowners: allowing access on land and types of access allowed.
Reasons for not allowing access.
35
34
7
24
24
44
14
18
28
48
7
17
0 20 40 60 80 100
Open access
Access bypermission
Limited access tofamily and friends
only
Does not allowaccess to those
outside theirhousehold
Percent
Do you typically allow open hunting access, allow hunting access by permission, or allow limited hunting access to family and friends
only? (Landowners)
Largest tract is in theNorth/East Region (n=105)
Largest tract is in the CentralRegion (n=112)
Largest tract is in the SouthRegion (n=87)

356 Responsive Management
15
16
5
10
10
11
22
7
16
9
7
22
24
28
18
16
16
0
0 20 40 60 80 100
Disapprove of hunting or harminganimals
Firearm-related safety concerns
Disrespectful behavior by hunters
Property damage
Do not want strangers on land
Other
Percent
Mu
ltip
le R
es
po
ns
es
All
ow
ed
What are the main reasons you do not allow access to the land for hunting other than for
family and friends? (Asked of those who do not allow access beyond members of their
household) (Landowners)
Largest tract is in theNorth/East Region(n=23)
Largest tract is in theCentral Region (n=17)
Largest tract is in theSouth Region (n=13)

Opinions of Residents, Landowners, and Hunters on Deer, Moose, Bear, and Turkey 357
Land Management in General—Landowners Whether landowners actively manages land for wildlife.
Opinions on management of all four species shown together.
Support for/opposition to coyote management.
52
46
2
47
49
4
45
50
5
0 20 40 60 80 100
Yes
No
Don't know
Percent
Do you actively manage for wildlife on your land? (Landowners)
Largest tract is in theNorth/East Region (n=105)
Largest tract is in the CentralRegion (n=112)
Largest tract is in the SouthRegion (n=87)

358 Responsive Management
10
14
32
23
19
18
20
13
33
29
25
23
0 20 40 60 80 100
Deer
Moose
Bear
Turkey
Percent
Percent of respondents who rated the management of each of the following species as
excellent in Maine. (Landowners)
Lives in the North/East Region (n=102)
Lives in the Central Region (n=112)
Lives in the South Region (n=90)

Opinions of Residents, Landowners, and Hunters on Deer, Moose, Bear, and Turkey 359
59
57
69
50
72
62
51
54
78
71
57
50
0 20 40 60 80 100
Deer
Moose
Bear
Turkey
Percent
Percent of respondents who rated the management of each of the following species as
excellent or good in Maine. (Landowners)
Lives in the North/East Region (n=102)
Lives in the Central Region (n=112)
Lives in the South Region (n=90)

360 Responsive Management
35
26
23
32
24
19
31
30
16
13
26
42
0 20 40 60 80 100
Deer
Moose
Bear
Turkey
Percent
Percent of respondents who rated the management of each of the following species as
fair or poor in Maine. (Landowners)
Lives in the North/EastRegion (n=102)
Lives in the Central Region(n=112)
Lives in the South Region(n=90)

Opinions of Residents, Landowners, and Hunters on Deer, Moose, Bear, and Turkey 361
7
11
7
14
3
1
6
17
6
5
8
24
0 20 40 60 80 100
Deer
Moose
Bear
Turkey
Percent
Percent of respondents who rated the management of each of the following species as
poor in Maine. (Landowners)
Lives in the North/East Region(n=102)
Lives in the Central Region(n=112)
Lives in the South Region(n=90)

362 Responsive Management
9
13
33
22
20
18
20
14
31
28
24
22
0 20 40 60 80 100
Deer
Moose
Bear
Turkey
Percent
Percent of respondents who rated the management of each of the following species as
excellent in Maine. (Landowners)
Largest tract is in the North/East Region (n=105)
Largest tract is in the Central Region (n=112)
Largest tract is in the South Region (n=87)

Opinions of Residents, Landowners, and Hunters on Deer, Moose, Bear, and Turkey 363
59
56
70
53
74
63
51
52
75
69
54
51
0 20 40 60 80 100
Deer
Moose
Bear
Turkey
Percent
Percent of respondents who rated the management of each of the following species as
excellent or good in Maine. (Landowners)
Largest tract is in the North/East Region (n=105)
Largest tract is in the Central Region (n=112)
Largest tract is in the South Region (n=87)

364 Responsive Management
36
27
22
30
23
17
31
31
15
16
29
41
0 20 40 60 80 100
Deer
Moose
Bear
Turkey
Percent
Percent of respondents who rated the management of each of the following species as
fair or poor in Maine. (Landowners)
Largest tract is in the North/East Region (n=105)
Largest tract is in the Central Region (n=112)
Largest tract is in the South Region (n=87)

Opinions of Residents, Landowners, and Hunters on Deer, Moose, Bear, and Turkey 365
7
10
6
13
3
0
5
17
6
7
11
24
0 20 40 60 80 100
Deer
Moose
Bear
Turkey
Percent
Percent of respondents who rated the management of each of the following species as
poor in Maine. (Landowners)
Largest tract is in the North/East Region (n=105)
Largest tract is in the Central Region (n=112)
Largest tract is in the South Region (n=87)

366 Responsive Management
65
11
4
7
10
4
55
13
4
8
16
3
59
18
4
7
6
7
0 20 40 60 80 100
Strongly support
Moderatelysupport
Neither supportnor oppose
Moderatelyoppose
Strongly oppose
Don't know
Percent
Would you support or oppose a coyote management program in Maine, which may
cause an increase in deer and/or wild turkeys in local areas? (Landowners)
Lives in the North/EastRegion (n=102)
Lives in the Central Region(n=112)
Lives in the South Region(n=90)

Opinions of Residents, Landowners, and Hunters on Deer, Moose, Bear, and Turkey 367
66
10
4
6
9
4
54
14
4
8
17
3
60
17
4
7
6
7
0 20 40 60 80 100
Strongly support
Moderatelysupport
Neither supportnor oppose
Moderatelyoppose
Strongly oppose
Don't know
Percent
Would you support or oppose a coyote management program in Maine, which may
cause an increase in deer and/or wild turkeys in local areas? (Landowners)
Largest tract is in theNorth/East Region (n=105)
Largest tract is in the CentralRegion (n=112)
Largest tract is in the SouthRegion (n=87)
368 Responsive Management
Deer Management—Landowners Ratings of deer management.
Opinions on the size of the deer population.
Why the deer population should be decreased.
Support for increasing deer population with various caveats.
Factors to be considered in managing deer.
Support for/opposition to hunting as a way to manage deer.
Support for/opposition to various methods to control deer.
Opinions on deer and moose tradeoffs.

Opinions of Residents, Landowners, and Hunters on Deer, Moose, Bear, and Turkey 369
9
50
29
7
5
20
54
20
3
3
31
44
10
6
10
0 20 40 60 80 100
Excellent
Good
Fair
Poor
Don't know
Percent
Overall, how would you rate deer management in Maine? (Landowners)
Largest tract is in theNorth/East Region (n=105)
Largest tract is in the CentralRegion (n=112)
Largest tract is in the SouthRegion (n=87)

370 Responsive Management
23
68
6
0
3
17
75
7
0
1
18
75
6
0
1
0 20 40 60 80 100
Increased
Remain the same
Decreased
There are no deerin the area
Don't know
Percent
In your opinion, should the deer population in the area where you live be increased, remain the same, or be decreased? Or are there no deer in
the area where you live? (Asked of Maine residents.) (Landowners)
Lives in the North/EastRegion (n=102)
Lives in the Central Region(n=112)
Lives in the South Region(n=90)
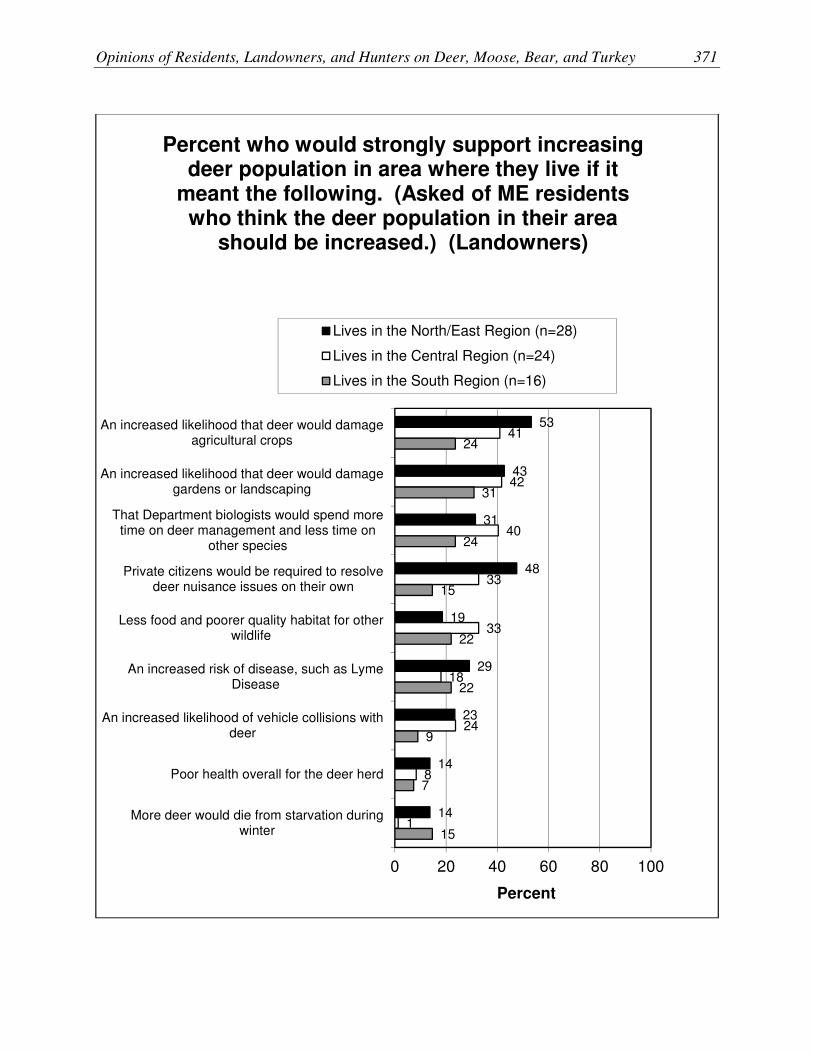
Opinions of Residents, Landowners, and Hunters on Deer, Moose, Bear, and Turkey 371
53
43
31
48
19
29
23
14
14
41
42
40
33
33
18
24
8
1
24
31
24
15
22
22
9
7
15
0 20 40 60 80 100
An increased likelihood that deer would damageagricultural crops
An increased likelihood that deer would damagegardens or landscaping
That Department biologists would spend moretime on deer management and less time on
other species
Private citizens would be required to resolvedeer nuisance issues on their own
Less food and poorer quality habitat for otherwildlife
An increased risk of disease, such as LymeDisease
An increased likelihood of vehicle collisions withdeer
Poor health overall for the deer herd
More deer would die from starvation duringwinter
Percent
Percent who would strongly support increasing deer population in area where they live if it
meant the following. (Asked of ME residents who think the deer population in their area
should be increased.) (Landowners)
Lives in the North/East Region (n=28)
Lives in the Central Region (n=24)
Lives in the South Region (n=16)

372 Responsive Management
79
79
68
68
61
53
54
20
26
81
67
66
65
41
35
33
8
1
56
56
56
46
56
31
24
24
15
0 20 40 60 80 100
An increased likelihood that deer would damageagricultural crops
An increased likelihood that deer would damagegardens or landscaping
That Department biologists would spend moretime on deer management and less time on
other species
Private citizens would be required to resolvedeer nuisance issues on their own
An increased likelihood of vehicle collisions withdeer
An increased risk of disease, such as LymeDisease
Less food and poorer quality habitat for otherwildlife
Poor health overall for the deer herd
More deer would die from starvation duringwinter
Percent
Percent who would strongly support or moderately support increasing deer population in area where they live if it meant the following.
(Asked of ME residents who think the deer population in their area should be increased.)
(Landowners)
Lives in the North/East Region (n=28)
Lives in the Central Region (n=24)
Lives in the South Region (n=16)

Opinions of Residents, Landowners, and Hunters on Deer, Moose, Bear, and Turkey 373
80
74
31
31
19
19
14
19
13
89
81
64
56
48
32
33
17
24
75
75
75
60
37
44
40
37
22
0 20 40 60 80 100
Poor health overall for the deer herd
More deer would die from starvation duringwinter
Less food and poorer quality habitat for otherwildlife
An increased risk of disease, such as LymeDisease
An increased likelihood of vehicle collisions withdeer
An increased likelihood that deer would damagegardens or landscaping
Private citizens would be required to resolvedeer nuisance issues on their own
An increased likelihood that deer would damageagricultural crops
That Department biologists would spend moretime on deer management and less time on
other species
Percent
Percent who would moderately oppose or strongly oppose increasing deer population in area where they live if it meant the following. (Asked of ME residents who think the deer
population in their area should be increased.) (Landowners)
Lives in the North/East Region (n=28)
Lives in the Central Region (n=24)
Lives in the South Region (n=16)
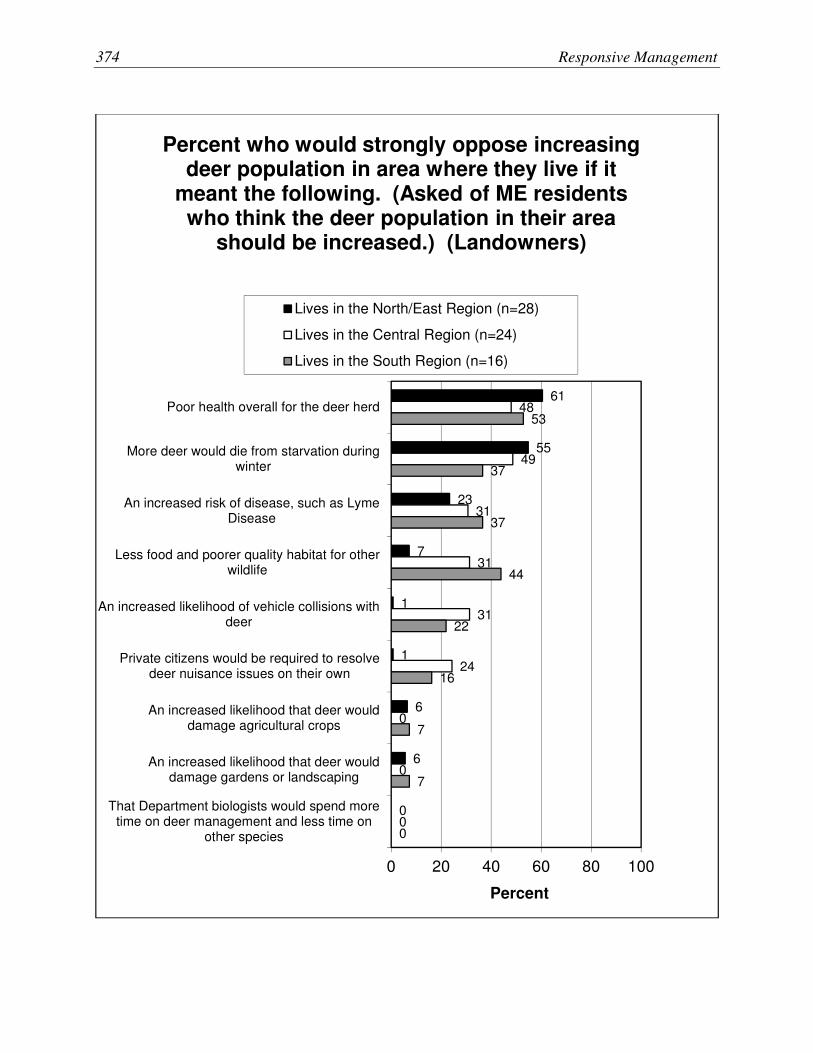
374 Responsive Management
61
55
23
7
1
1
6
6
0
48
49
31
31
31
24
0
0
0
53
37
37
44
22
16
7
7
0
0 20 40 60 80 100
Poor health overall for the deer herd
More deer would die from starvation duringwinter
An increased risk of disease, such as LymeDisease
Less food and poorer quality habitat for otherwildlife
An increased likelihood of vehicle collisions withdeer
Private citizens would be required to resolvedeer nuisance issues on their own
An increased likelihood that deer woulddamage agricultural crops
An increased likelihood that deer woulddamage gardens or landscaping
That Department biologists would spend moretime on deer management and less time on
other species
Percent
Percent who would strongly oppose increasing deer population in area where they live if it
meant the following. (Asked of ME residents who think the deer population in their area
should be increased.) (Landowners)
Lives in the North/East Region (n=28)
Lives in the Central Region (n=24)
Lives in the South Region (n=16)

Opinions of Residents, Landowners, and Hunters on Deer, Moose, Bear, and Turkey 375
8.6
7.8
7.9
6.9
7.0
6.7
5.5
4.8
8.6
7.4
7.4
6.4
6.1
6.3
6.0
5.1
8.3
8.0
7.7
6.5
6.7
6.7
6.8
5.9
0 2 4 6 8 10
The health of the typicaldeer in the herd
Providing deer huntingopportunities
The opportunity to see deer
Impacts on habitat
Risk of vehicle collisions withdeer
Risk of human disease, suchas Lyme Disease
Damage to agricultural crops
Damage to gardens andornamental plants
Mean
On a scale of 0 to 10, where 0 is not at all important and 10 is extremely important, how important do you think each of the following
factors should be for managing the deer population in Maine? (Landowners)
Largest tract is in the North/East Region (57≤n≤69)
Largest tract is in the Central Region (64≤n≤76)
Largest tract is in the South Region (45≤n≤59)

376 Responsive Management
82
14
1
0
1
1
73
16
5
0
4
1
77
15
0
3
4
1
0 20 40 60 80 100
Strongly support
Moderatelysupport
Neither supportnor oppose
Moderatelyoppose
Strongly oppose
Don't know
Percent
Do you support or oppose legal hunting as a method to help manage the deer populations in
Maine? (Landowners)
Lives in the North/EastRegion (n=102)
Lives in the Central Region(n=112)
Lives in the South Region(n=90)

Opinions of Residents, Landowners, and Hunters on Deer, Moose, Bear, and Turkey 377
83
14
1
0
1
1
73
16
5
0
4
1
74
18
0
3
4
1
0 20 40 60 80 100
Strongly support
Moderatelysupport
Neither supportnor oppose
Moderatelyoppose
Strongly oppose
Don't know
Percent
Do you support or oppose legal hunting as a method to help manage the deer populations in
Maine? (Landowners)
Largest tract is in theNorth/East Region (n=105)
Largest tract is in the CentralRegion (n=112)
Largest tract is in the SouthRegion (n=87)
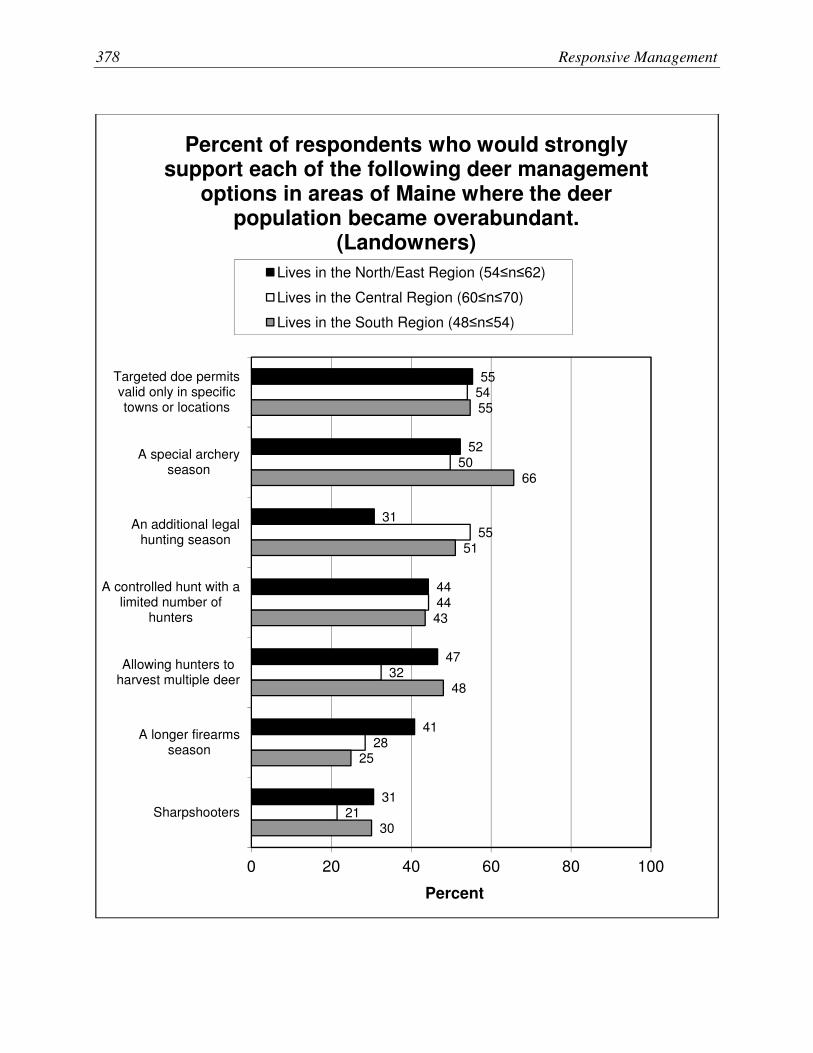
378 Responsive Management
55
52
31
44
47
41
31
54
50
55
44
32
28
21
55
66
51
43
48
25
30
0 20 40 60 80 100
Targeted doe permitsvalid only in specifictowns or locations
A special archeryseason
An additional legalhunting season
A controlled hunt with alimited number of
hunters
Allowing hunters toharvest multiple deer
A longer firearmsseason
Sharpshooters
Percent
Percent of respondents who would strongly support each of the following deer management
options in areas of Maine where the deer population became overabundant.
(Landowners)
Lives in the North/East Region (54≤n≤62)
Lives in the Central Region (60≤n≤70)
Lives in the South Region (48≤n≤54)

Opinions of Residents, Landowners, and Hunters on Deer, Moose, Bear, and Turkey 379
84
70
73
77
63
51
57
82
69
69
63
64
41
45
85
82
76
73
63
60
43
0 20 40 60 80 100
Targeted doe permitsvalid only in specifictowns or locations
A controlled hunt with alimited number of hunters
A special archery season
Allowing hunters toharvest multiple deer
An additional legalhunting season
Sharpshooters
A longer firearms season
Percent
Percent of respondents who would strongly support or moderately support each of the
following deer management options in areas of Maine where the deer population became
overabundant. (Landowners)
Lives in the North/East Region (54≤n≤62)
Lives in the Central Region (60≤n≤70)
Lives in the South Region (48≤n≤54)

380 Responsive Management
41
37
32
20
14
23
15
53
52
34
31
26
20
13
54
39
37
24
16
12
12
0 20 40 60 80 100
A longer firearmsseason
Sharpshooters
An additional legalhunting season
Allowing hunters toharvest multiple deer
A controlled hunt with alimited number of
hunters
A special archeryseason
Targeted doe permitsvalid only in specifictowns or locations
Percent
Percent of respondents who would moderately oppose or strongly oppose each of the
following deer management options in areas of Maine where the deer population became
overabundant. (Landowners)
Lives in the North/East Region (54≤n≤62)
Lives in the Central Region (60≤n≤70)
Lives in the South Region (48≤n≤54)

Opinions of Residents, Landowners, and Hunters on Deer, Moose, Bear, and Turkey 381
29
19
20
17
11
13
13
46
34
25
15
11
13
8
31
33
17
9
16
9
7
0 20 40 60 80 100
Sharpshooters
A longer firearmsseason
An additional legalhunting season
Allowing hunters toharvest multiple deer
A controlled hunt with alimited number of
hunters
A special archeryseason
Targeted doe permitsvalid only in specifictowns or locations
Percent
Percent of respondents who would strongly oppose each of the following deer management
options in areas of Maine where the deer population became overabundant.
(Landowners)
Lives in the North/East Region (54≤n≤62)
Lives in the Central Region (60≤n≤70)
Lives in the South Region (48≤n≤54)
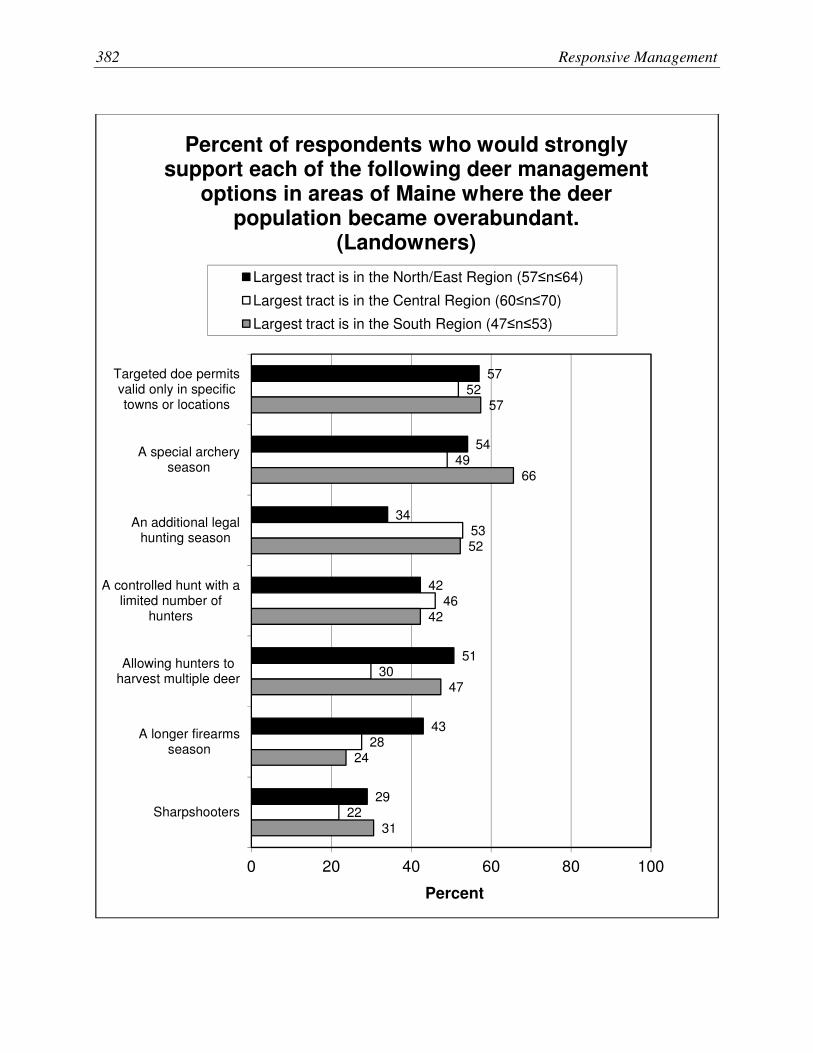
382 Responsive Management
57
54
34
42
51
43
29
52
49
53
46
30
28
22
57
66
52
42
47
24
31
0 20 40 60 80 100
Targeted doe permitsvalid only in specifictowns or locations
A special archeryseason
An additional legalhunting season
A controlled hunt with alimited number of
hunters
Allowing hunters toharvest multiple deer
A longer firearmsseason
Sharpshooters
Percent
Percent of respondents who would strongly support each of the following deer management
options in areas of Maine where the deer population became overabundant.
(Landowners)
Largest tract is in the North/East Region (57≤n≤64)
Largest tract is in the Central Region (60≤n≤70)
Largest tract is in the South Region (47≤n≤53)

Opinions of Residents, Landowners, and Hunters on Deer, Moose, Bear, and Turkey 383
85
71
75
79
65
49
58
82
68
69
62
63
42
44
86
82
75
71
63
61
41
0 20 40 60 80 100
Targeted doe permitsvalid only in specifictowns or locations
A controlled hunt with alimited number of hunters
A special archery season
Allowing hunters toharvest multiple deer
An additional legalhunting season
Sharpshooters
A longer firearms season
Percent
Percent of respondents who would strongly support or moderately support each of the
following deer management options in areas of Maine where the deer population became
overabundant. (Landowners)
Largest tract is in the North/East Region (57≤n≤64)
Largest tract is in the Central Region (60≤n≤70)
Largest tract is in the South Region (47≤n≤53)

384 Responsive Management
39
40
31
19
13
22
15
53
51
34
30
27
21
13
56
38
38
28
16
12
11
0 20 40 60 80 100
A longer firearmsseason
Sharpshooters
An additional legalhunting season
Allowing hunters toharvest multiple deer
A controlled hunt with alimited number of
hunters
A special archeryseason
Targeted doe permitsvalid only in specifictowns or locations
Percent
Percent of respondents who would moderately oppose or strongly oppose each of the
following deer management options in areas of Maine where the deer population became
overabundant. (Landowners)
Largest tract is in the North/East Region (57≤n≤64)
Largest tract is in the Central Region (60≤n≤70)
Largest tract is in the South Region (47≤n≤53)

Opinions of Residents, Landowners, and Hunters on Deer, Moose, Bear, and Turkey 385
32
18
19
16
11
12
13
45
33
25
14
12
13
8
30
37
18
15
16
10
7
0 20 40 60 80 100
Sharpshooters
A longer firearmsseason
An additional legalhunting season
Allowing hunters toharvest multiple deer
A controlled hunt with alimited number of
hunters
A special archeryseason
Targeted doe permitsvalid only in specifictowns or locations
Percent
Percent of respondents who would strongly oppose each of the following deer management
options in areas of Maine where the deer population became overabundant.
(Landowners)
Largest tract is in the North/East Region (57≤n≤64)
Largest tract is in the Central Region (60≤n≤70)
Largest tract is in the South Region (47≤n≤53)
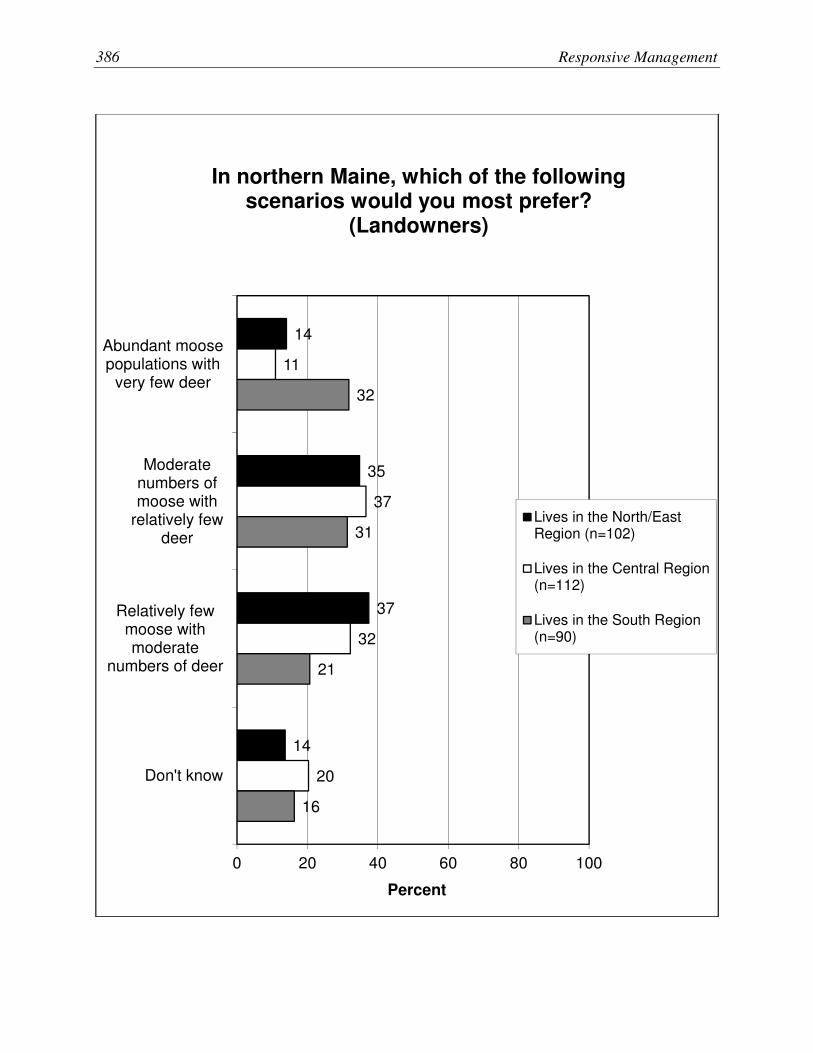
386 Responsive Management
14
35
37
14
11
37
32
20
32
31
21
16
0 20 40 60 80 100
Abundant moosepopulations with
very few deer
Moderatenumbers ofmoose with
relatively fewdeer
Relatively fewmoose withmoderate
numbers of deer
Don't know
Percent
In northern Maine, which of the following scenarios would you most prefer?
(Landowners)
Lives in the North/EastRegion (n=102)
Lives in the Central Region(n=112)
Lives in the South Region(n=90)

Opinions of Residents, Landowners, and Hunters on Deer, Moose, Bear, and Turkey 387
Moose Management—Landowners Ratings of moose management.
Opinions on the size of the moose population.
Support for increasing moose population with various caveats.
Factors to be considered in managing moose.
Support for/opposition to hunting as a way to manage moose.
Opinion on adjusting moose harvest for health of the moose population.
Opinion on moose hunting in southern Maine.

388 Responsive Management
13
43
17
10
16
18
45
17
0
20
28
41
8
7
15
0 20 40 60 80 100
Excellent
Good
Fair
Poor
Don't know
Percent
Overall, how would you rate moose management in Maine? (Landowners)
Largest tract is in theNorth/East Region (n=105)
Largest tract is in the CentralRegion (n=112)
Largest tract is in the SouthRegion (n=87)

Opinions of Residents, Landowners, and Hunters on Deer, Moose, Bear, and Turkey 389
19
59
12
10
0
12
65
5
13
4
15
52
0
29
4
0 20 40 60 80 100
Increased
Remain the same
Decreased
There are nomoose in the area
Don't know
Percent
In your opinion, should the moose population in the area where you live be increased, remain the same, or be decreased? Or are there no moose
in the area where you live? (Asked of Maine residents.) (Landowners)
Lives in the North/EastRegion (n=102)
Lives in the Central Region(n=112)
Lives in the South Region(n=90)

390 Responsive Management
51
29
17
15
3
12
11
1
38
29
27
2
0 20 40 60 80 100
An increased likelihoodthat moose would
damage agriculturalcrops
An increased likelihoodof vehicle collisions with
moose
Forest regenerationwould be negatively
impacted
Poor health overall forthe moose herd
Percent
Percent who would strongly support increasing moose population in area where they live if it meant the following. (Asked of ME residents who think the moose population in their area
should be increased.) (Landowners)
Lives in the North/East Region (n=22)
Lives in the Central Region (n=16)
Lives in the South Region (n=15)

Opinions of Residents, Landowners, and Hunters on Deer, Moose, Bear, and Turkey 391
68
52
40
29
45
44
54
12
67
60
38
4
0 20 40 60 80 100
An increased likelihoodthat moose would
damage agriculturalcrops
An increased likelihoodof vehicle collisions with
moose
Forest regenerationwould be negatively
impacted
Poor health overall forthe moose herd
Percent
Percent who would strongly support or moderately support increasing moose
population in area where they live if it meant the following. (Asked of ME residents who think the
moose population in their area should be increased.) (Landowners)
Lives in the North/East Region (n=22)
Lives in the Central Region (n=16)
Lives in the South Region (n=15)
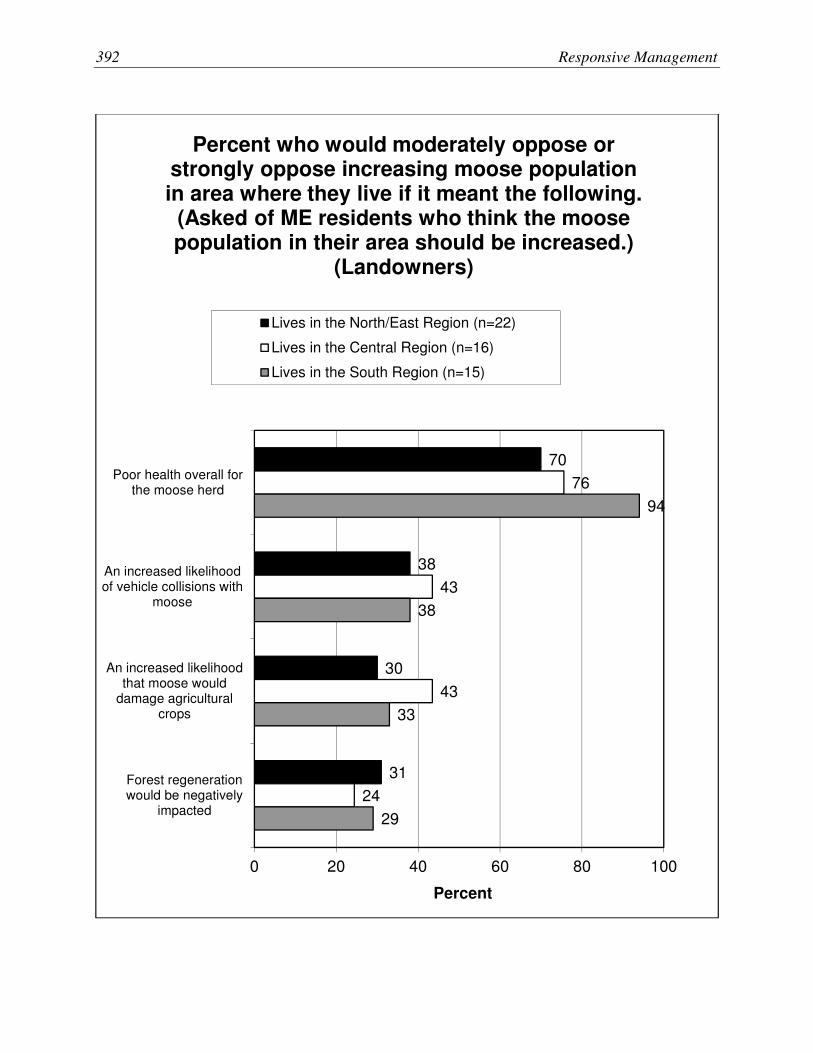
392 Responsive Management
70
38
30
31
76
43
43
24
94
38
33
29
0 20 40 60 80 100
Poor health overall forthe moose herd
An increased likelihoodof vehicle collisions with
moose
An increased likelihoodthat moose would
damage agriculturalcrops
Forest regenerationwould be negatively
impacted
Percent
Percent who would moderately oppose or strongly oppose increasing moose population in area where they live if it meant the following.
(Asked of ME residents who think the moose population in their area should be increased.)
(Landowners)
Lives in the North/East Region (n=22)
Lives in the Central Region (n=16)
Lives in the South Region (n=15)

Opinions of Residents, Landowners, and Hunters on Deer, Moose, Bear, and Turkey 393
39
29
29
15
33
22
12
11
36
0
9
9
0 20 40 60 80 100
Poor health overall forthe moose herd
An increased likelihoodof vehicle collisions with
moose
Forest regenerationwould be negatively
impacted
An increased likelihoodthat moose would
damage agriculturalcrops
Percent
Percent who would strongly oppose increasing moose population in area where they live if it meant the following. (Asked of ME residents who think the moose population in their area
should be increased.) (Landowners)
Lives in the North/East Region (n=22)
Lives in the Central Region (n=16)
Lives in the South Region (n=15)

394 Responsive Management
8.2
7.4
7.4
7.3
6.0
4.6
7.8
7.4
6.8
7.2
6.5
3.6
8.3
7.4
7.6
6.6
5.9
4.9
0 2 4 6 8 10
The health of the typicalmoose in the herd
Providing moose huntingopportunities
The opportunity to seemoose
Risk of vehicle collisionswith moose
Impacts on habitat
Damage to agriculturalcrops
Mean
On a scale of 0 to 10, where 0 is not at all important and 10 is extremely important, how important do you think each of the following factors should be for managing the moose
population in Maine? (Landowners)
Largest tract is in the North/East Region (63≤n≤75)
Largest tract is in the Central Region (66≤n≤75)
Largest tract is in the South Region (52≤n≤63)
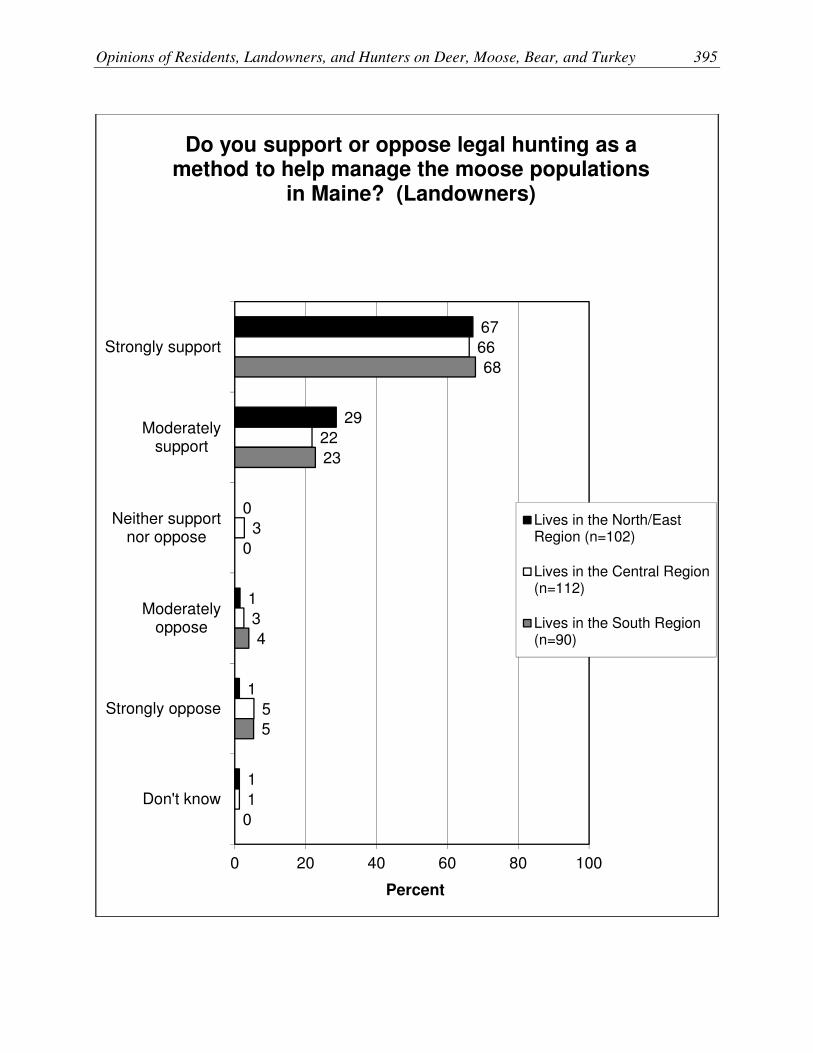
Opinions of Residents, Landowners, and Hunters on Deer, Moose, Bear, and Turkey 395
67
29
0
1
1
1
66
22
3
3
5
1
68
23
0
4
5
0
0 20 40 60 80 100
Strongly support
Moderatelysupport
Neither supportnor oppose
Moderatelyoppose
Strongly oppose
Don't know
Percent
Do you support or oppose legal hunting as a method to help manage the moose populations
in Maine? (Landowners)
Lives in the North/EastRegion (n=102)
Lives in the Central Region(n=112)
Lives in the South Region(n=90)
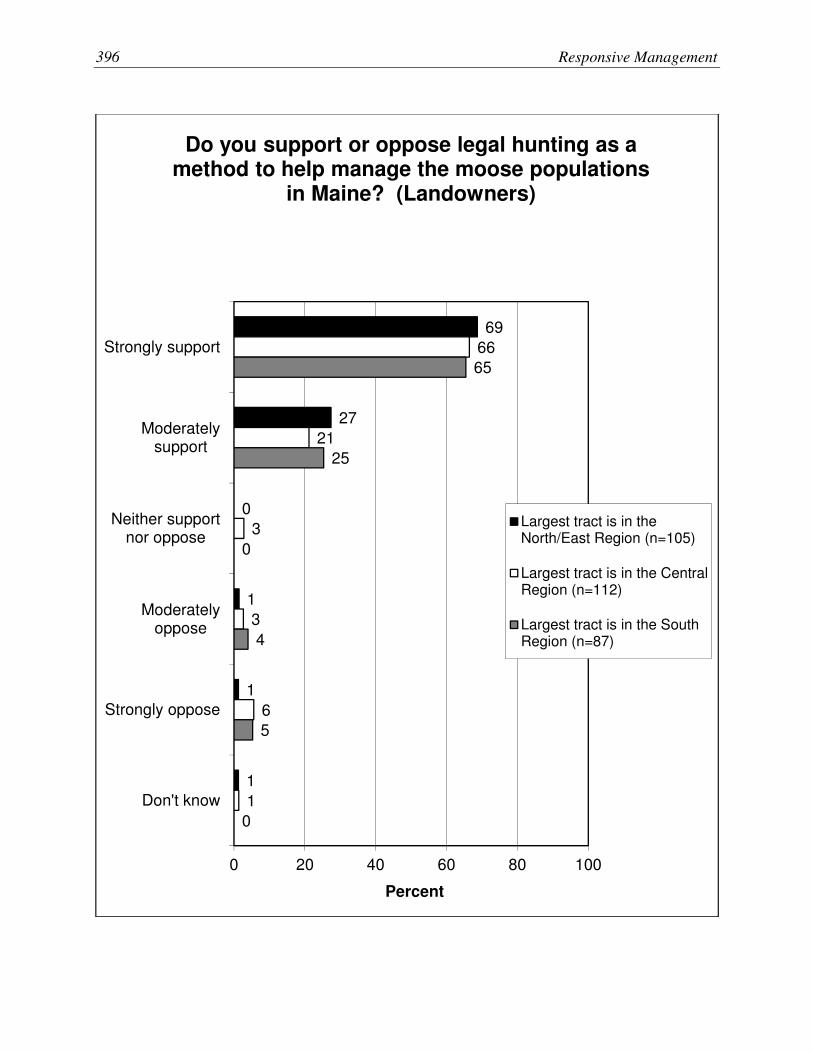
396 Responsive Management
69
27
0
1
1
1
66
21
3
3
6
1
65
25
0
4
5
0
0 20 40 60 80 100
Strongly support
Moderatelysupport
Neither supportnor oppose
Moderatelyoppose
Strongly oppose
Don't know
Percent
Do you support or oppose legal hunting as a method to help manage the moose populations
in Maine? (Landowners)
Largest tract is in theNorth/East Region (n=105)
Largest tract is in the CentralRegion (n=112)
Largest tract is in the SouthRegion (n=87)

Opinions of Residents, Landowners, and Hunters on Deer, Moose, Bear, and Turkey 397
42
31
8
7
5
7
37
25
8
12
10
8
41
26
10
7
9
7
0 20 40 60 80 100
Strongly support
Moderatelysupport
Neither supportnor oppose
Moderatelyoppose
Strongly oppose
Don't know
Percent
Would you support or oppose adjusting the hunting harvest of female moose to help
minimize the impacts of parasites and improve the overall health of the moose population, even
if it meant fewer moose in Maine? (Landowners)
Lives in the North/EastRegion (n=102)
Lives in the Central Region(n=112)
Lives in the South Region(n=90)

398 Responsive Management
42
30
8
7
8
6
36
26
9
11
9
8
41
25
8
10
9
7
0 20 40 60 80 100
Strongly support
Moderatelysupport
Neither supportnor oppose
Moderatelyoppose
Strongly oppose
Don't know
Percent
Would you support or oppose adjusting the hunting harvest of female moose to help
minimize the impacts of parasites and improve the overall health of the moose population, even
if it meant fewer moose in Maine? (Landowners)
Largest tract is in theNorth/East Region (n=105)
Largest tract is in the CentralRegion (n=112)
Largest tract is in the SouthRegion (n=87)
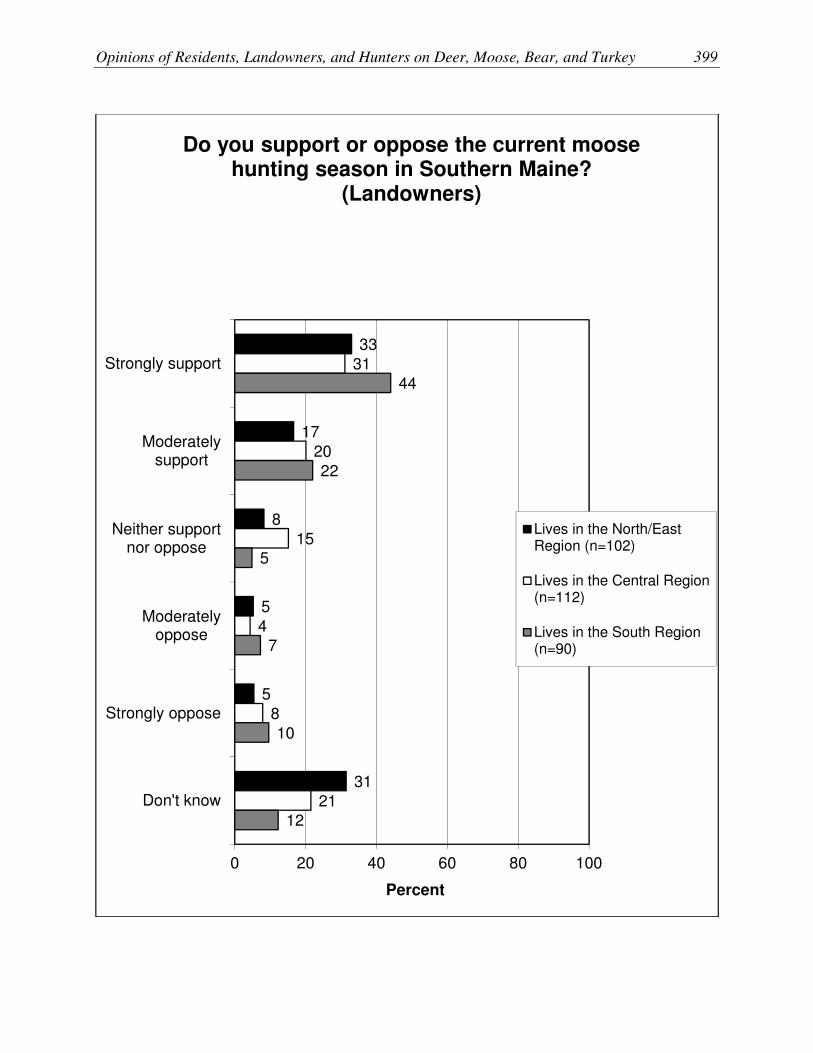
Opinions of Residents, Landowners, and Hunters on Deer, Moose, Bear, and Turkey 399
33
17
8
5
5
31
31
20
15
4
8
21
44
22
5
7
10
12
0 20 40 60 80 100
Strongly support
Moderatelysupport
Neither supportnor oppose
Moderatelyoppose
Strongly oppose
Don't know
Percent
Do you support or oppose the current moose hunting season in Southern Maine?
(Landowners)
Lives in the North/EastRegion (n=102)
Lives in the Central Region(n=112)
Lives in the South Region(n=90)

400 Responsive Management
36
16
8
5
5
30
29
21
16
4
7
22
44
22
3
7
13
12
0 20 40 60 80 100
Strongly support
Moderatelysupport
Neither supportnor oppose
Moderatelyoppose
Strongly oppose
Don't know
Percent
Do you support or oppose the current moose hunting season in Southern Maine?
(Landowners)
Largest tract is in theNorth/East Region (n=105)
Largest tract is in the CentralRegion (n=112)
Largest tract is in the SouthRegion (n=87)
Opinions of Residents, Landowners, and Hunters on Deer, Moose, Bear, and Turkey 401
Bear Management—Landowners Ratings of bear management.
Opinions on the size of the bear population.
Support for increasing bear population with various caveats.
Factors to be considered in managing bear.
Support for/opposition to hunting as a way to manage bear.
Opinion on allowing bear populations to expand south.

402 Responsive Management
33
37
16
6
8
20
31
26
4
18
24
30
18
11
17
0 20 40 60 80 100
Excellent
Good
Fair
Poor
Don't know
Percent
Overall, how would you rate bear management in Maine? (Landowners)
Largest tract is in theNorth/East Region (n=105)
Largest tract is in the CentralRegion (n=112)
Largest tract is in the SouthRegion (n=87)

Opinions of Residents, Landowners, and Hunters on Deer, Moose, Bear, and Turkey 403
3
78
10
7
1
4
76
6
14
0
6
52
10
31
0
0 20 40 60 80 100
Increased
Remain the same
Decreased
There are no bearin the area
Don't know
Percent
In your opinion, should the bear population in the area where you live be increased, remain the same, or be decreased? Or are there no bear in
the area where you live? (Asked of Maine residents.) (Landowners)
Lives in the North/EastRegion (n=102)
Lives in the Central Region(n=112)
Lives in the South Region(n=90)

404 Responsive Management
7.9
7.3
5.9
5.4
4.8
5.7
4.1
3.4
7.5
7.2
4.5
4.3
4.6
4.4
3.8
3.6
7.4
6.4
6.3
5.5
5.3
4.8
4.6
3.7
0 2 4 6 8 10
The health of the typicalbear
Providing bear huntingopportunities
Risks to public safety
Risk to pets or livestock
Damage to agricultural crops
Impacts on other wildlife
Damage to gardens
Risk of vehicle collisions withbear
Mean
On a scale of 0 to 10, where 0 is not at all important and 10 is extremely important, how important do you think each of the following
factors should be for managing the bear population in Maine? (Landowners)
Largest tract is in the North/East Region (51≤n≤73)
Largest tract is in the Central Region (58≤n≤82)
Largest tract is in the South Region (44≤n≤60)

Opinions of Residents, Landowners, and Hunters on Deer, Moose, Bear, and Turkey 405
19
32
12
16
7
13
29
27
11
19
12
1
18
37
9
12
18
7
0 20 40 60 80 100
Strongly support
Moderatelysupport
Neither supportnor oppose
Moderatelyoppose
Strongly oppose
Don't know
Percent
Do you support or oppose allowing the bear population to expand further into central and
southern Maine? (Landowners)
Lives in the North/EastRegion (n=102)
Lives in the Central Region(n=112)
Lives in the South Region(n=90)

406 Responsive Management
18
33
12
18
7
12
29
26
12
19
13
1
19
36
8
11
18
7
0 20 40 60 80 100
Strongly support
Moderatelysupport
Neither supportnor oppose
Moderatelyoppose
Strongly oppose
Don't know
Percent
Do you support or oppose allowing the bear population to expand further into central and
southern Maine? (Landowners)
Largest tract is in theNorth/East Region (n=105)
Largest tract is in the CentralRegion (n=112)
Largest tract is in the SouthRegion (n=87)

Opinions of Residents, Landowners, and Hunters on Deer, Moose, Bear, and Turkey 407
Turkey Management—Landowners Ratings of turkey management.
Opinions on the size of the turkey population.
Support for increasing turkey population with various caveats.
Factors to be considered in managing turkey.
Support for/opposition to hunting as a way to manage turkey.
Opinion on methods to control turkey if they become overabundant.

408 Responsive Management
22
31
17
13
17
14
38
14
17
17
22
29
18
24
8
0 20 40 60 80 100
Excellent
Good
Fair
Poor
Don't know
Percent
Overall, how would you rate turkey management in Maine? (Landowners)
Largest tract is in theNorth/East Region (n=105)
Largest tract is in the CentralRegion (n=112)
Largest tract is in the SouthRegion (n=87)

Opinions of Residents, Landowners, and Hunters on Deer, Moose, Bear, and Turkey 409
13
53
25
9
0
3
69
27
0
1
5
56
38
0
1
0 20 40 60 80 100
Increased
Remain the same
Decreased
There are noturkey in the area
Don't know
Percent
In your opinion, should the turkey population in the area where you live be increased, remain the same, or be decreased? Or are there no turkey
in the area where you live? (Asked of Maine residents.) (Landowners)
Lives in the North/EastRegion (n=102)
Lives in the Central Region(n=112)
Lives in the South Region(n=90)

410 Responsive Management
62
42
32
22
13
12
1
50
50
50
0
0
0
0
58
29
0
0
29
0
0
0 20 40 60 80 100
Private citizens would be required to resolveturkey nuisance issues on their own
An increased likelihood that turkey woulddamage gardens or landscaping
An increased likelihood that turkey woulddamage agricultural crops
An increase in predator populations, such asbobcat or coyotes
Poor health overall for the turkey population
More turkey would die from starvation duringwinter
That Department biologists would spend moretime on turkey management and less time on
other species
Percent
Percent who would strongly support increasing turkey population in area where they live if it meant the following. (Asked of ME residents who think the turkey population in their area
should be increased.) (Landowners)
Lives in the North/East Region (n=15)
Lives in the Central Region (n=2)
Lives in the South Region (n=5)
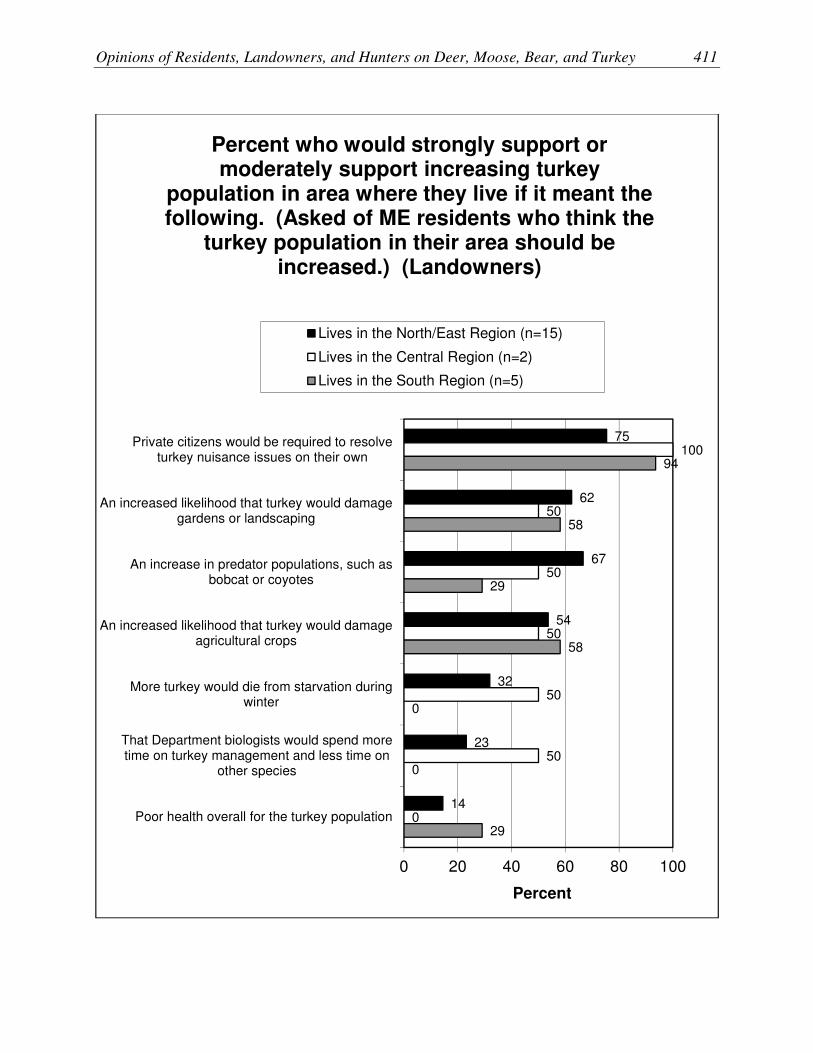
Opinions of Residents, Landowners, and Hunters on Deer, Moose, Bear, and Turkey 411
75
62
67
54
32
23
14
100
50
50
50
50
50
0
94
58
29
58
0
0
29
0 20 40 60 80 100
Private citizens would be required to resolveturkey nuisance issues on their own
An increased likelihood that turkey would damagegardens or landscaping
An increase in predator populations, such asbobcat or coyotes
An increased likelihood that turkey would damageagricultural crops
More turkey would die from starvation duringwinter
That Department biologists would spend moretime on turkey management and less time on
other species
Poor health overall for the turkey population
Percent
Percent who would strongly support or moderately support increasing turkey
population in area where they live if it meant the following. (Asked of ME residents who think the
turkey population in their area should be increased.) (Landowners)
Lives in the North/East Region (n=15)
Lives in the Central Region (n=2)
Lives in the South Region (n=5)

412 Responsive Management
65
68
54
23
26
7
3
100
50
50
50
0
0
0
71
100
94
71
42
42
6
0 20 40 60 80 100
Poor health overall for the turkey population
More turkey would die from starvation duringwinter
That Department biologists would spend moretime on turkey management and less time on
other species
An increase in predator populations, such asbobcat or coyotes
An increased likelihood that turkey would damageagricultural crops
An increased likelihood that turkey would damagegardens or landscaping
Private citizens would be required to resolveturkey nuisance issues on their own
Percent
Percent who would moderately oppose or strongly oppose increasing turkey population in
area where they live if it meant the following. (Asked of ME residents who think the turkey
population in their area should be increased.) (Landowners)
Lives in the North/East Region (n=15)
Lives in the Central Region (n=2)
Lives in the South Region (n=5)
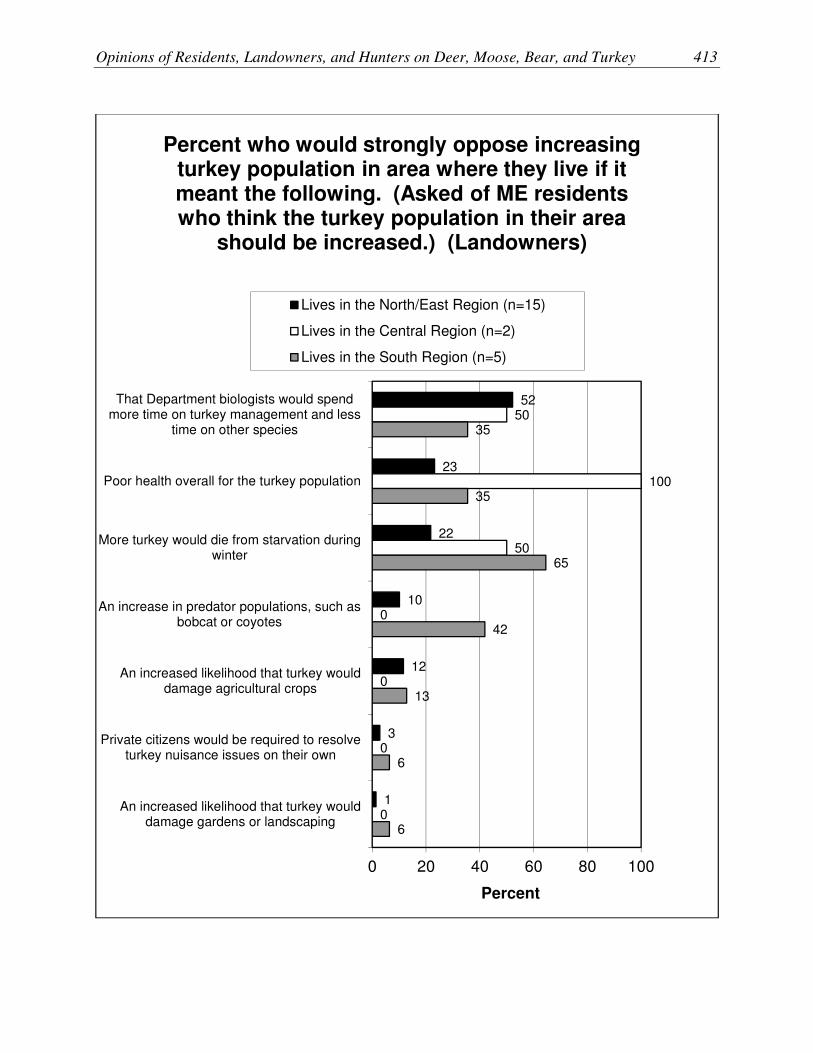
Opinions of Residents, Landowners, and Hunters on Deer, Moose, Bear, and Turkey 413
52
23
22
10
12
3
1
50
100
50
0
0
0
0
35
35
65
42
13
6
6
0 20 40 60 80 100
That Department biologists would spendmore time on turkey management and less
time on other species
Poor health overall for the turkey population
More turkey would die from starvation duringwinter
An increase in predator populations, such asbobcat or coyotes
An increased likelihood that turkey woulddamage agricultural crops
Private citizens would be required to resolveturkey nuisance issues on their own
An increased likelihood that turkey woulddamage gardens or landscaping
Percent
Percent who would strongly oppose increasing turkey population in area where they live if it meant the following. (Asked of ME residents who think the turkey population in their area
should be increased.) (Landowners)
Lives in the North/East Region (n=15)
Lives in the Central Region (n=2)
Lives in the South Region (n=5)

414 Responsive Management
7.8
7.4
6.7
6.4
5.5
4.3
7.6
7.2
7.1
6.2
4.9
4.5
8.2
8.0
6.7
6.3
6.5
5.2
0 2 4 6 8 10
The health of the typicalturkey in the population
Providing turkey huntingopportunities
The opportunity to see wildturkey
Damage to agriculturalcrops
Damage to gardens
The risk of vehicle collisionswith turkey
Mean
On a scale of 0 to 10, where 0 is not at all important and 10 is extremely important, how important do you think each of the following factors should be for managing the turkey
population in Maine? (Landowners)
Largest tract is in the North/East Region (65≤n≤72)
Largest tract is in the Central Region (70≤n≤79)
Largest tract is in the South Region (54≤n≤62)

Opinions of Residents, Landowners, and Hunters on Deer, Moose, Bear, and Turkey 415
75
20
1
1
3
73
18
4
3
3
77
18
0
3
3
0 20 40 60 80 100
Strongly support
Moderatelysupport
Neither supportnor oppose
Moderatelyoppose
Strongly oppose
Percent
Do you support or oppose legal hunting as a method to help manage the turkey population in
Maine? (Landowners)
Lives in the North/EastRegion (n=102)
Lives in the Central Region(n=112)
Lives in the South Region(n=90)

416 Responsive Management
76
19
1
1
3
73
17
4
3
3
74
21
0
3
3
0 20 40 60 80 100
Strongly support
Moderatelysupport
Neither supportnor oppose
Moderatelyoppose
Strongly oppose
Percent
Do you support or oppose legal hunting as a method to help manage the turkey population in
Maine? (Landowners)
Largest tract is in theNorth/East Region (n=105)
Largest tract is in the CentralRegion (n=112)
Largest tract is in the SouthRegion (n=87)

Opinions of Residents, Landowners, and Hunters on Deer, Moose, Bear, and Turkey 417
70
76
72
52
69
66
66
55
78
67
69
57
0 20 40 60 80 100
Allowing landowners toapply for a permit to
remove turkeys that arecausing problems on
their land
Increasing the numberof turkeys that hunterscan harvest in areasexperiencing damage
by turkey
Implementing acontrolled hunt in areasexperiencing damage
by turkeys
Extending the huntingseason later into the fall
or winter
Percent
Percent of respondents who would strongly support each of the following turkey
management options in areas of Maine where the turkey population became overabundant.
(Landowners)
Lives in the North/East Region (n=102)
Lives in the Central Region (n=112)
Lives in the South Region (n=90)

418 Responsive Management
95
90
89
81
89
90
87
75
90
88
89
80
0 20 40 60 80 100
Implementing a controlledhunt in areas
experiencing damage byturkeys
Allowing landowners toapply for a permit to
remove turkeys that arecausing problems on their
land
Increasing the number ofturkeys that hunters can
harvest in areasexperiencing damage by
turkey
Extending the huntingseason later into the fall
or winter
Percent
Percent of respondents who would strongly support or moderately support each of the
following turkey management options in areas of Maine where the turkey population became
overabundant. (Landowners)
Lives in the North/East Region (n=102)
Lives in the Central Region (n=112)
Lives in the South Region (n=90)

Opinions of Residents, Landowners, and Hunters on Deer, Moose, Bear, and Turkey 419
11
10
6
3
21
9
7
5
16
11
5
7
0 20 40 60 80 100
Extending the huntingseason later into the fall
or winter
Increasing the number ofturkeys that hunters can
harvest in areasexperiencing damage by
turkey
Allowing landowners toapply for a permit to
remove turkeys that arecausing problems on
their land
Implementing acontrolled hunt in areasexperiencing damage by
turkeys
Percent
Percent of respondents who would moderately oppose or strongly oppose each of the
following turkey management options in areas of Maine where the turkey population became
overabundant. (Landowners)
Lives in the North/East Region (n=102)
Lives in the Central Region (n=112)
Lives in the South Region (n=90)

420 Responsive Management
5
4
1
0
8
7
4
4
8
6
3
3
0 20 40 60 80 100
Extending the huntingseason later into the fall
or winter
Increasing the numberof turkeys that hunterscan harvest in areasexperiencing damage
by turkey
Implementing acontrolled hunt in areasexperiencing damage
by turkeys
Allowing landowners toapply for a permit to
remove turkeys that arecausing problems on
their land
Percent
Percent of respondents who would strongly oppose each of the following turkey
management options in areas of Maine where the turkey population became overabundant.
(Landowners)
Lives in the North/East Region (n=102)
Lives in the Central Region (n=112)
Lives in the South Region (n=90)

Opinions of Residents, Landowners, and Hunters on Deer, Moose, Bear, and Turkey 421
71
77
73
52
69
67
66
57
75
64
67
55
0 20 40 60 80 100
Allowing landowners toapply for a permit to
remove turkeys that arecausing problems on
their land
Increasing the numberof turkeys that hunterscan harvest in areasexperiencing damage
by turkey
Implementing acontrolled hunt in areasexperiencing damage
by turkeys
Extending the huntingseason later into the fall
or winter
Percent
Percent of respondents who would strongly support each of the following turkey
management options in areas of Maine where the turkey population became overabundant.
(Landowners)
Largest tract is in the North/East Region (n=105)
Largest tract is in the Central Region (n=112)
Largest tract is in the South Region (n=87)

422 Responsive Management
95
91
90
79
89
90
86
77
90
88
89
77
0 20 40 60 80 100
Implementing a controlledhunt in areas
experiencing damage byturkeys
Allowing landowners toapply for a permit to
remove turkeys that arecausing problems on their
land
Increasing the number ofturkeys that hunters can
harvest in areasexperiencing damage by
turkey
Extending the huntingseason later into the fall
or winter
Percent
Percent of respondents who would strongly support or moderately support each of the
following turkey management options in areas of Maine where the turkey population became
overabundant. (Landowners)
Largest tract is in the North/East Region (n=105)
Largest tract is in the Central Region (n=112)
Largest tract is in the South Region (n=87)

Opinions of Residents, Landowners, and Hunters on Deer, Moose, Bear, and Turkey 423
13
9
5
2
19
10
7
6
19
11
5
7
0 20 40 60 80 100
Extending the huntingseason later into the fall
or winter
Increasing the number ofturkeys that hunters can
harvest in areasexperiencing damage by
turkey
Allowing landowners toapply for a permit to
remove turkeys that arecausing problems on
their land
Implementing acontrolled hunt in areasexperiencing damage by
turkeys
Percent
Percent of respondents who would moderately oppose or strongly oppose each of the
following turkey management options in areas of Maine where the turkey population became
overabundant. (Landowners)
Largest tract is in the North/East Region (n=105)
Largest tract is in the Central Region (n=112)
Largest tract is in the South Region (n=87)

424 Responsive Management
5
4
1
0
7
7
4
4
11
5
3
3
0 20 40 60 80 100
Extending the huntingseason later into the fall
or winter
Increasing the numberof turkeys that hunterscan harvest in areasexperiencing damage
by turkey
Implementing acontrolled hunt in areasexperiencing damage
by turkeys
Allowing landowners toapply for a permit to
remove turkeys that arecausing problems on
their land
Percent
Percent of respondents who would strongly oppose each of the following turkey
management options in areas of Maine where the turkey population became overabundant.
(Landowners)
Largest tract is in the North/East Region (n=105)
Largest tract is in the Central Region (n=112)
Largest tract is in the South Region (n=87)

Opinions of Residents, Landowners, and Hunters on Deer, Moose, Bear, and Turkey 425
Problems With Wildlife—Landowners Experiencing problems with wildlife.
Which wildlife caused problems.
66
8
8
10
10
5
0
5
0
56
16
10
8
7
2
3
0
1
64
15
8
10
6
1
1
0
0
0 20 40 60 80 100
No
Problems with coyotes
Problems with deer
Problems with turkeys
Problems with other animals
Problems with bears
Yes (unspecified species)
Problems with moose
Other
Percent
Mu
ltip
le R
es
po
ns
es
All
ow
ed
In the past 2 years, have you experienced any problems with wildlife on your largest tract of
land? (Landowners)
Largest tract is in theNorth/East Region (n=105)
Largest tract is in theCentral Region (n=112)
Largest tract is in theSouth Region (n=87)

426 Responsive Management
HUNTER SURVEY
Interest in and Knowledge of Wildlife—Hunters Overall interest in wildlife.
Feelings about wildlife around home.
Level of knowledge about each species.
57
8
21
9
2
2
0
0
0
0
0
0
60
10
18
7
2
2
1
0
0
0
0
0
51
15
22
6
3
2
0
0
0
0
0
0
57
14
16
7
2
2
1
0
1
0
0
1
0 20 40 60 80 100
10
9
8
7
6
5
4
3
2
1
0
Don't know
Percent
How interested are you in wildlife in Maine, on a scale of 0 to 10, where 0 is not at all interested
and 10 is extremely interested? (Hunters)
Lives in the North/EastRegion (n=262)
Lives in the Central Region(n=258)
Lives in the South Region(n=256)
Nonresident (n=180)
North/East mean: 9.0Central mean: 9.1South mean: 8.9Nonresident mean: 9.0

Opinions of Residents, Landowners, and Hunters on Deer, Moose, Bear, and Turkey 427
79
18
1
0
2
0
81
14
1
0
4
0
79
15
1
0
4
0
82
13
1
0
4
0
0 20 40 60 80 100
I enjoy seeing and having wildlifearound my home or on my
property
I enjoy seeing a few animalsaround my home or on my
property but worry about theproblems they cause
I generally regard wildlife aroundmy home or on my property as a
nuisance
I generally regard wildlife aroundmy home or on my property as
dangerous
I have no particular feeling aboutwildlife around my home or on my
property
Don't know
Percent
Generally, which of the following best describes your feelings about wildlife around your home
or on your property? (Hunters)
Lives in the North/EastRegion (n=262)
Lives in the Central Region(n=258)
Lives in the South Region(n=256)
Nonresident (n=180)

428 Responsive Management
63
43
25
15
69
34
17
25
63
30
15
27
57
27
19
15
0 20 40 60 80 100
Deer
Moose
Bear
Wildturkey
Percent
Percent of respondents who know a great deal about each of the following. (Hunters)
Lives in the North/East Region (n=262)
Lives in the Central Region (n=258)
Lives in the South Region (n=256)
Nonresident (n=179)

Opinions of Residents, Landowners, and Hunters on Deer, Moose, Bear, and Turkey 429
97
81
67
47
96
75
57
67
97
69
50
70
87
66
68
57
0 20 40 60 80 100
Deer
Moose
Bear
Wildturkey
Percent
Percent of respondents who know a great deal or a moderate amount about each of the
following. (Hunters)
Lives in the North/East Region (n=262)
Lives in the Central Region (n=258)
Lives in the South Region (n=256)
Nonresident (n=179)

430 Responsive Management
97
94
89
100
97
91
95
96
87
93
98
91
86
83
0 20 40 60 80 100
Deer
Moose
Bear
Wildturkey
Percent
Percent of respondents who know a great deal, a moderate amount, or a little about each of the
following. (Hunters)
Lives in the North/East Region (n=262)
Lives in the Central Region (n=258)
Lives in the South Region (n=256)
Nonresident (n=179)

Opinions of Residents, Landowners, and Hunters on Deer, Moose, Bear, and Turkey 431
0
3
6
11
0
3
9
5
0
4
13
7
2
9
12
16
0 20 40 60 80 100
Deer
Moose
Bear
Wildturkey
Percent
Percent of respondents who know nothing at all about each of the following. (Hunters)
Lives in the North/East Region (n=262)
Lives in the Central Region (n=258)
Lives in the South Region (n=256)
Nonresident (n=179)

432 Responsive Management
Participation in Hunting—Hunters Where hunted.
Participation in deer, moose, bear, and turkey hunting.
Applying for moose permits.
Reasons for hunting deer, moose, bear, and turkey.

Opinions of Residents, Landowners, and Hunters on Deer, Moose, Bear, and Turkey 433
38
13
0
0
2
0
0
11
18
0
1
15
0
0
0
0
0
2
16
17
0
14
0
17
4
1
10
9
2
6
0
0
0
0
3
0
3
28
4
26
1
2
1
2
1
1
2
10
10
6
0
27
8
10
8
9
4
3
8
5
2
4
2
5
2
0
1
3
0 20 40 60 80 100
Aroostook
Penobscot
Oxford
York
Somerset
Cumberland
Kennebec
Piscataquis
Washington
Androscoggin
Waldo
Hancock
Franklin
Lincoln
Sagadahoc
Knox
Don't know
Percent
In which county do you hunt most often? (Asked of those who have participated in
recreational hunting in Maine in the past 2 years.) (Hunters)
Lives in the North/EastRegion (n=262)
Lives in the Central Region(n=258)
Lives in the South Region(n=256)
Nonresident (n=180)

434 Responsive Management
95
5
98
2
95
5
68
32
0 20 40 60 80 100
Yes
No
Percent
Did you hunt deer in Maine in the past 5 years? (Hunters)
Lives in the North/EastRegion (n=262)
Lives in the Central Region(n=258)
Lives in the South Region(n=256)
Nonresident (n=180)

Opinions of Residents, Landowners, and Hunters on Deer, Moose, Bear, and Turkey 435
83
17
0
95
5
0
96
4
0
0 20 40 60 80 100
Yes
No
Don't know
Percent
Did you hunt deer in Maine in the past 5 years? (Hunters)
Most often hunts in theNorth/East Region (n=396)
Most often hunts in theCentral Region (n=326)
Most often hunts in the SouthRegion (n=234)

436 Responsive Management
48
29
10
8
4
0
1
0
47
27
12
10
2
1
0
0
56
20
10
10
1
0
1
1
0 20 40 60 80 100
For the meat
For the sport,recreation, and
challenge
To be with familyand friends
To be close tonature
For a trophy
To reduce damageto crops
To see a deer
Don't know
Percent
What was your most important reason for hunting deer in the past 5 years? (Asked of
those who hunted deer in Maine in the past 5 years.) (Hunters)
Most often hunts in theNorth/East Region (n=336)
Most often hunts in theCentral Region (n=308)
Most often hunts in the SouthRegion (n=224)

Opinions of Residents, Landowners, and Hunters on Deer, Moose, Bear, and Turkey 437
44
56
0
39
61
0
34
66
0
22
78
0
0 20 40 60 80 100
Yes
No
Don't know
Percent
Did you hunt moose in Maine in the past 15 years? (Hunters)
Lives in the North/East Region (n=262)
Lives in the Central Region (n=258)
Lives in the South Region (n=256)
Nonresident (n=180)

438 Responsive Management
39
61
0
35
65
0
32
68
0
0 20 40 60 80 100
Yes
No
Don't know
Percent
Did you hunt moose in Maine in the past 15 years? (Hunters)
Most often hunts in theNorth/East Region (n=396)
Most often hunts in theCentral Region (n=326)
Most often hunts in the SouthRegion (n=234)
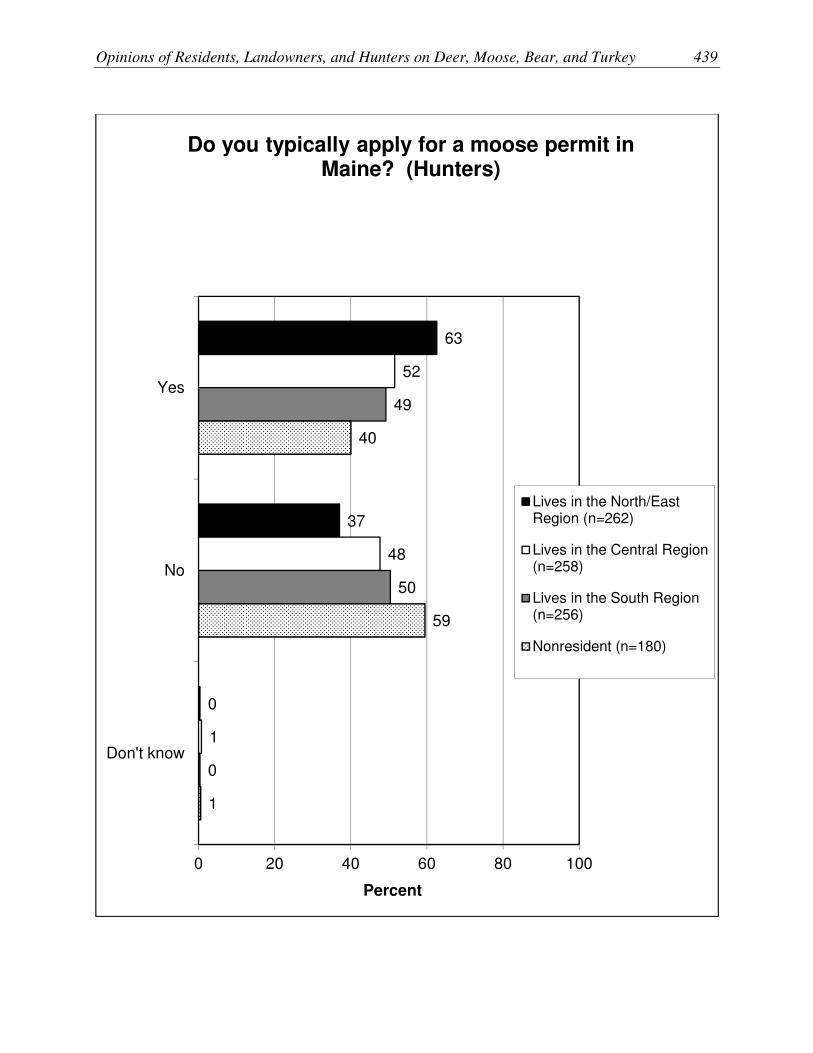
Opinions of Residents, Landowners, and Hunters on Deer, Moose, Bear, and Turkey 439
63
37
0
52
48
1
49
50
0
40
59
1
0 20 40 60 80 100
Yes
No
Don't know
Percent
Do you typically apply for a moose permit in Maine? (Hunters)
Lives in the North/EastRegion (n=262)
Lives in the Central Region(n=258)
Lives in the South Region(n=256)
Nonresident (n=180)

440 Responsive Management
59
40
1
46
53
1
47
53
0
0 20 40 60 80 100
Yes
No
Don't know
Percent
Do you typically apply for a moose permit in Maine? (Hunters)
Most often hunts in theNorth/East Region (n=396)
Most often hunts in theCentral Region (n=326)
Most often hunts in the SouthRegion (n=234)

Opinions of Residents, Landowners, and Hunters on Deer, Moose, Bear, and Turkey 441
60
25
6
4
3
1
1
54
27
13
2
3
1
1
59
28
7
2
1
2
2
0 20 40 60 80 100
For the meat
For the sport,recreation, and
challenge
To be with familyand friends
For a trophy
To be close tonature
To see a moose
Don't know
Percent
What was or would be your most important reason for hunting moose? (Asked of those
who hunted moose in Maine in the past 15 years or typically apply for a moose permit.)
(Hunters)
Most often hunts in theNorth/East Region (n=257)
Most often hunts in theCentral Region (n=173)
Most often hunts in the SouthRegion (n=127)

442 Responsive Management
36
64
0
33
67
0
22
77
1
42
58
0
0 20 40 60 80 100
Yes
No
Don't know
Percent
Did you hunt bear in Maine in the past 15 years? (Hunters)
Lives in the North/EastRegion (n=262)
Lives in the Central Region(n=258)
Lives in the South Region(n=256)
Nonresident (n=180)
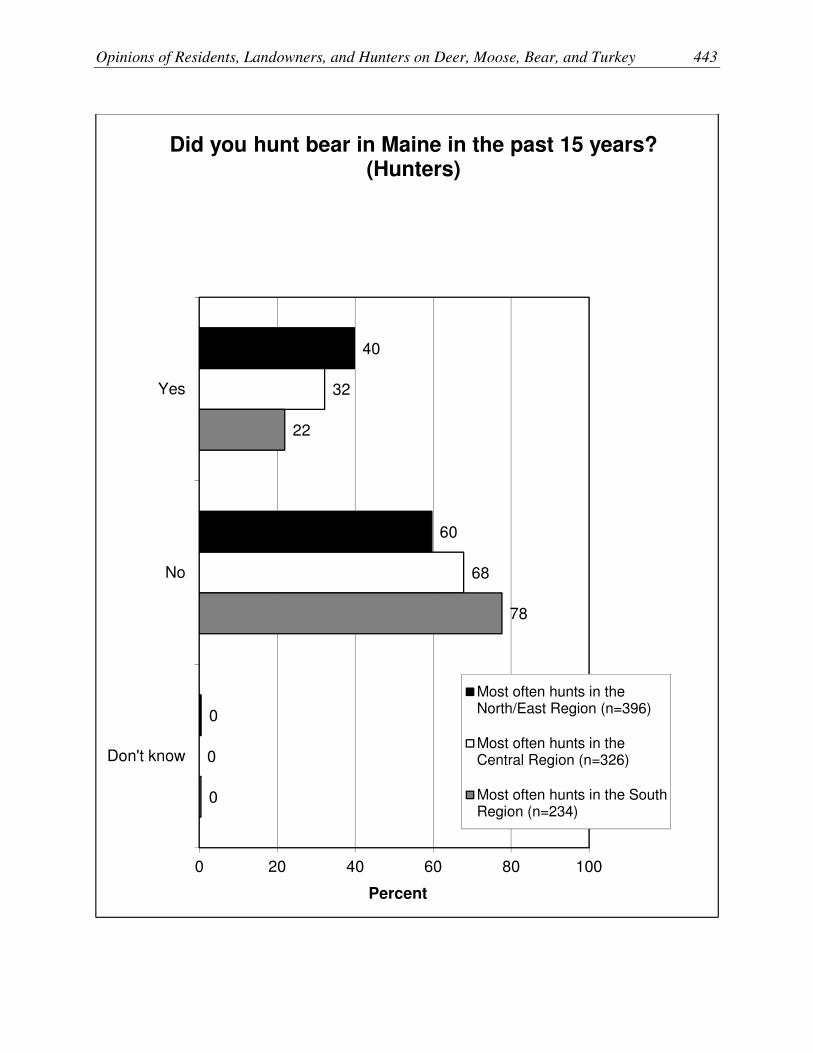
Opinions of Residents, Landowners, and Hunters on Deer, Moose, Bear, and Turkey 443
40
60
0
32
68
0
22
78
0
0 20 40 60 80 100
Yes
No
Don't know
Percent
Did you hunt bear in Maine in the past 15 years? (Hunters)
Most often hunts in theNorth/East Region (n=396)
Most often hunts in theCentral Region (n=326)
Most often hunts in the SouthRegion (n=234)
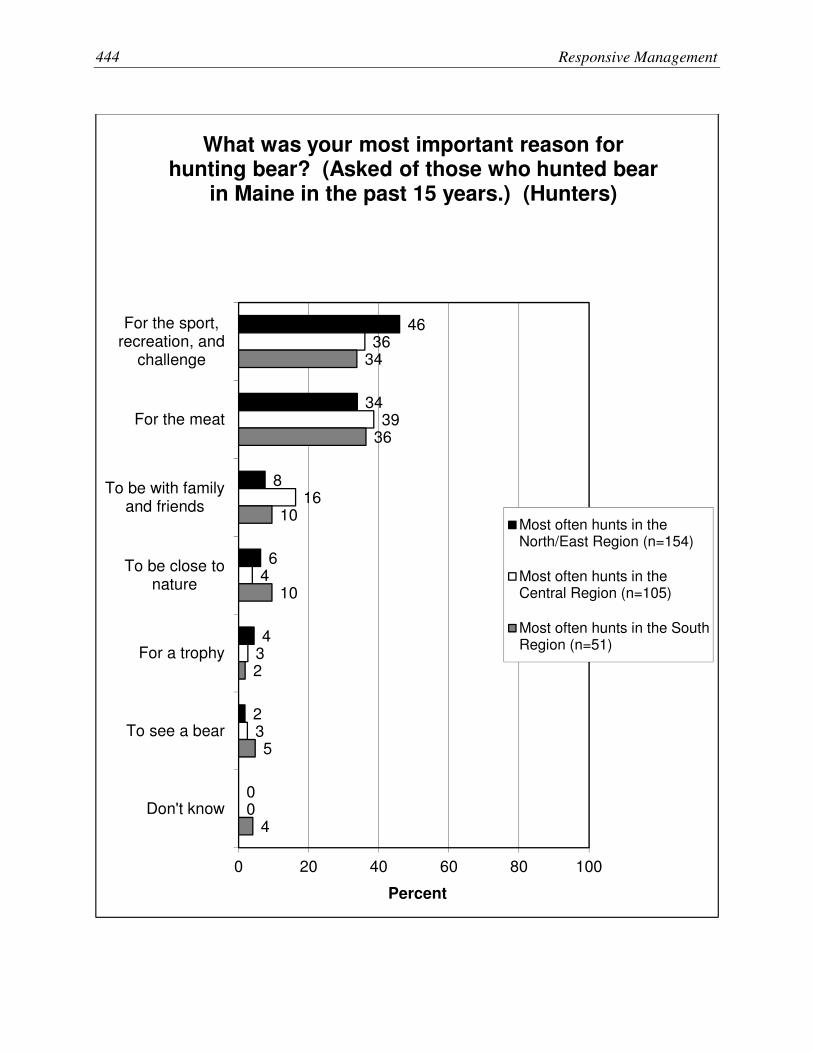
444 Responsive Management
46
34
8
6
4
2
0
36
39
16
4
3
3
0
34
36
10
10
2
5
4
0 20 40 60 80 100
For the sport,recreation, and
challenge
For the meat
To be with familyand friends
To be close tonature
For a trophy
To see a bear
Don't know
Percent
What was your most important reason for hunting bear? (Asked of those who hunted bear
in Maine in the past 15 years.) (Hunters)
Most often hunts in theNorth/East Region (n=154)
Most often hunts in theCentral Region (n=105)
Most often hunts in the SouthRegion (n=51)

Opinions of Residents, Landowners, and Hunters on Deer, Moose, Bear, and Turkey 445
22
76
2
40
60
0
38
63
0
9
91
0
0 20 40 60 80 100
Yes
No
Don't know
Percent
Did you hunt turkey in Maine in the past 5 years? (Hunters)
Lives in the North/East Region (n=262)
Lives in the Central Region (n=258)
Lives in the South Region (n=256)
Nonresident (n=180)
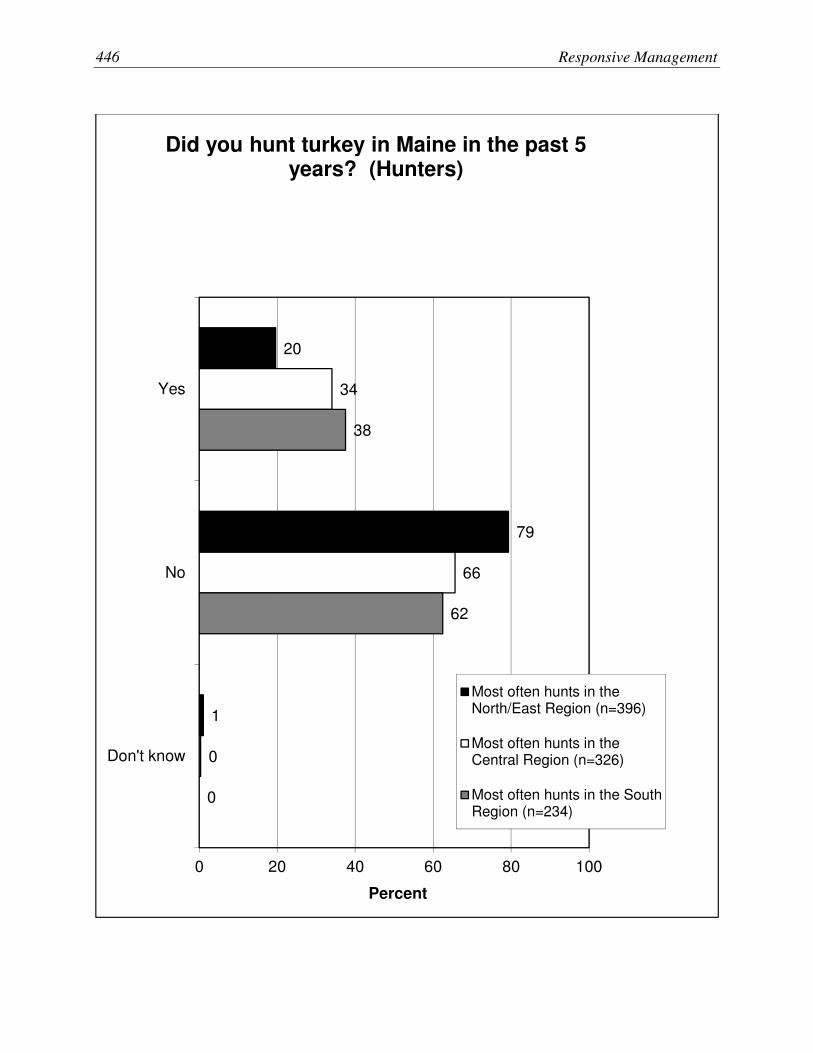
446 Responsive Management
20
79
1
34
66
0
38
62
0
0 20 40 60 80 100
Yes
No
Don't know
Percent
Did you hunt turkey in Maine in the past 5 years? (Hunters)
Most often hunts in theNorth/East Region (n=396)
Most often hunts in theCentral Region (n=326)
Most often hunts in the SouthRegion (n=234)

Opinions of Residents, Landowners, and Hunters on Deer, Moose, Bear, and Turkey 447
40
37
13
6
1
2
0
48
29
15
0
4
2
2
34
38
14
8
2
1
2
0 20 40 60 80 100
For the sport,recreation, and
challenge
For the meat
To be with familyand friends
To be close tonature
To see a turkey
For a trophy
Don't know
Percent
What was your most important reason for hunting turkey in the past 5 years? (Asked of
those who hunted turkey in Maine in the past 5 years.) (Hunters)
Most often hunts in theNorth/East Region (n=78)
Most often hunts in theCentral Region (n=107)
Most often hunts in theSouth Region (n=88)

448 Responsive Management
Satisfaction and Dissatisfaction With Hunting—Hunters Satisfaction with deer, moose, bear, and turkey hunting.
Reasons for not being more satisfied.
49
28
1
12
10
63
20
2
8
7
70
18
4
6
3
0 20 40 60 80 100
Very satisfied
Somewhatsatisfied
Neither satisfiednor dissatisfied
Somewhatdissatisfied
Very dissatisfied
Percent
In general, how satisfied or dissatisfied were you with your deer hunting experiences in
Maine in the past 5 years? (Asked of those who hunted deer in Maine in the past 5 years.)
(Hunters)
Most often hunts in theNorth/East Region (n=336)
Most often hunts in theCentral Region (n=308)
Most often hunts in the SouthRegion (n=224)

Opinions of Residents, Landowners, and Hunters on Deer, Moose, Bear, and Turkey 449
85
11
1
2
2
0
76
11
2
5
5
1
79
12
3
5
1
0
0 20 40 60 80 100
Very satisfied
Somewhatsatisfied
Neither satisfiednor dissatisfied
Somewhatdissatisfied
Very dissatisfied
Don't know
Percent
In general, how satisfied or dissatisfied were you with your moose hunting experiences in Maine in the past 15 years? (Asked of those who hunted moose in Maine in the past 15
years.) (Hunters)
Most often hunts in theNorth/East Region (n=158)
Most often hunts in theCentral Region (n=109)
Most often hunts in the SouthRegion (n=75)

450 Responsive Management
76
16
2
4
2
1
71
18
3
2
4
1
68
17
2
6
6
0
0 20 40 60 80 100
Very satisfied
Somewhatsatisfied
Neither satisfiednor dissatisfied
Somewhatdissatisfied
Very dissatisfied
Don't know
Percent
In general, how satisfied or dissatisfied were you with your bear hunting experiences in
Maine in the past 15 years? (Asked of those who hunted bear in Maine in the past 15 years.)
(Hunters)
Most often hunts in theNorth/East Region (n=154)
Most often hunts in theCentral Region (n=105)
Most often hunts in the SouthRegion (n=51)

Opinions of Residents, Landowners, and Hunters on Deer, Moose, Bear, and Turkey 451
71
20
1
3
4
0
75
18
1
2
2
2
69
22
3
3
2
0
0 20 40 60 80 100
Very satisfied
Somewhatsatisfied
Neither satisfiednor dissatisfied
Somewhatdissatisfied
Very dissatisfied
Don't know
Percent
In general, how satisfied or dissatisfied were you with your turkey hunting experiences in
Maine in the past 5 years? (Asked of those who hunted turkey in Maine in the past 5 years.)
(Hunters)
Most often hunts in theNorth/East Region (n=78)
Most often hunts in theCentral Region (n=107)
Most often hunts in theSouth Region (n=88)
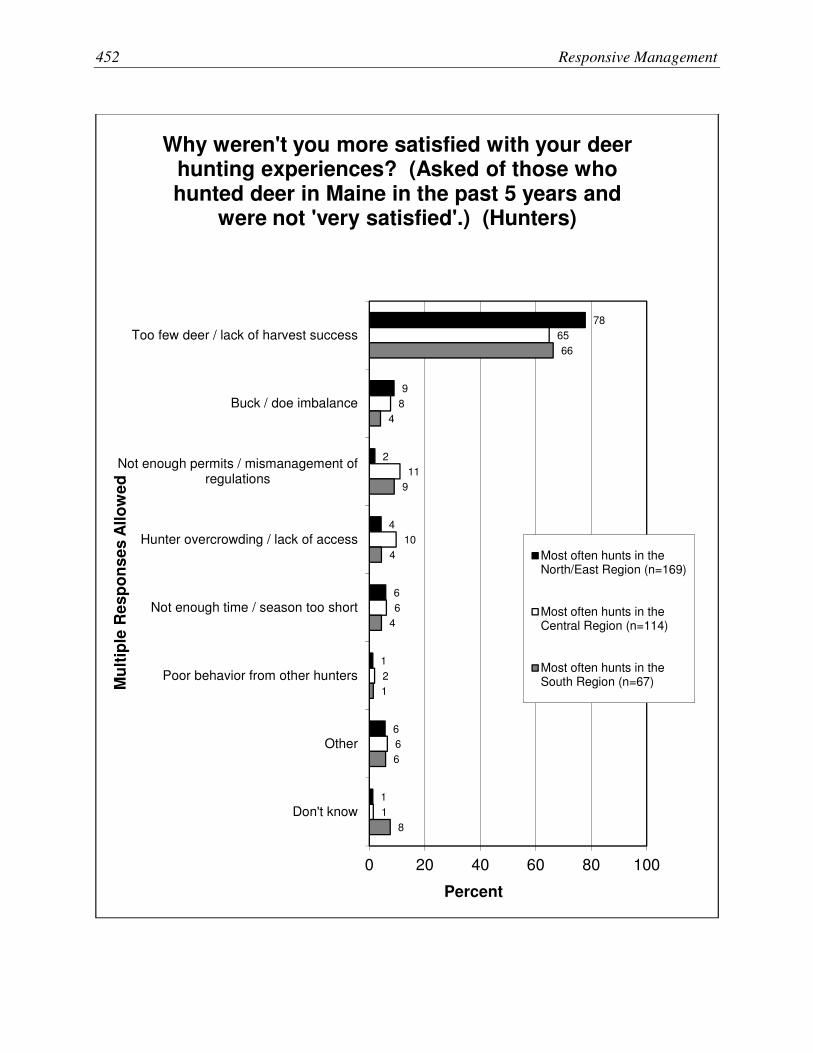
452 Responsive Management
78
9
2
4
6
1
6
1
65
8
11
10
6
2
6
1
66
4
9
4
4
1
6
8
0 20 40 60 80 100
Too few deer / lack of harvest success
Buck / doe imbalance
Not enough permits / mismanagement ofregulations
Hunter overcrowding / lack of access
Not enough time / season too short
Poor behavior from other hunters
Other
Don't know
Percent
Mu
ltip
le R
es
po
ns
es
All
ow
ed
Why weren't you more satisfied with your deer hunting experiences? (Asked of those who hunted deer in Maine in the past 5 years and
were not 'very satisfied'.) (Hunters)
Most often hunts in theNorth/East Region (n=169)
Most often hunts in theCentral Region (n=114)
Most often hunts in theSouth Region (n=67)

Opinions of Residents, Landowners, and Hunters on Deer, Moose, Bear, and Turkey 453
43
28
7
4
21
0
47
9
17
9
12
7
50
19
13
19
13
0
0 20 40 60 80 100
Too few moose / lack of harvest success
Could not get appropriate permit
Hunter overcrowding / lack of access
Season innapropriately timed
Other
Don’t know
Percent
Mu
ltip
le R
es
po
ns
es
All
ow
ed
Why weren't you more satisfied with your moose hunting experiences? (Asked of those
who hunted moose in Maine in the past 15 years and were not 'very satisfied'.) (Hunters)
Most often hunts in theNorth/East Region (n=25)
Most often hunts in theCentral Region (n=24)
Most often hunts in theSouth Region (n=16)
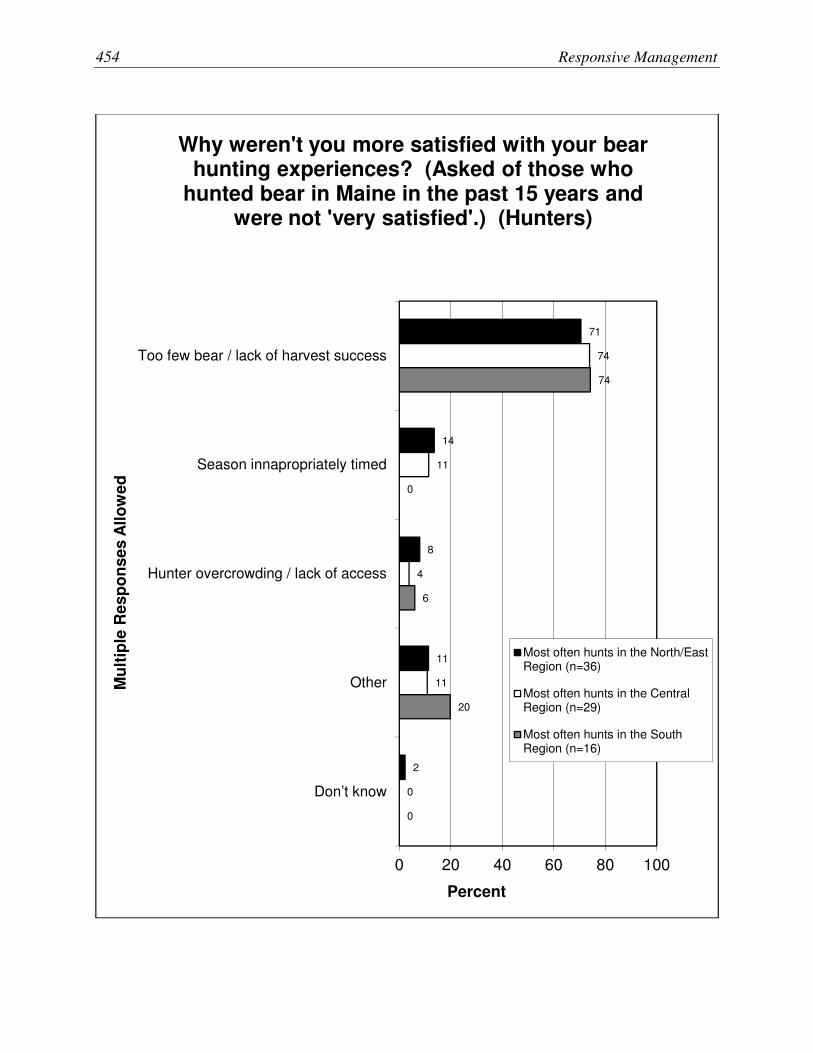
454 Responsive Management
71
14
8
11
2
74
11
4
11
0
74
0
6
20
0
0 20 40 60 80 100
Too few bear / lack of harvest success
Season innapropriately timed
Hunter overcrowding / lack of access
Other
Don’t know
Percent
Mu
ltip
le R
es
po
ns
es
All
ow
ed
Why weren't you more satisfied with your bear hunting experiences? (Asked of those who
hunted bear in Maine in the past 15 years and were not 'very satisfied'.) (Hunters)
Most often hunts in the North/EastRegion (n=36)
Most often hunts in the CentralRegion (n=29)
Most often hunts in the SouthRegion (n=16)

Opinions of Residents, Landowners, and Hunters on Deer, Moose, Bear, and Turkey 455
49
18
11
6
16
0
66
9
3
6
16
0
56
4
11
4
14
11
0 20 40 60 80 100
Too few turkey / lack of harvest success
Hunter overcrowding / lack of access
Not enough time / season too short
Restrictions on harvests
Other
Don't know
Percent
Mu
ltip
le R
es
po
ns
es
All
ow
ed
Why weren't you more satisfied with your turkey hunting experiences? (Asked of those who
hunted turkey in Maine in the past 5 years and were not 'very satisfied'.) (Hunters)
Most often hunts in the North/East Region (n=21)
Most often hunts in the Central Region (n=25)
Most often hunts in the South Region (n=27)

456 Responsive Management
Constraints to Hunting—Hunters Constraints to deer hunting.
Reasons for not hunting deer, moose, bear, and turkey.
44
33
5
5
3
4
2
2
5
42
29
12
10
2
2
2
2
2
35
38
9
10
5
1
3
1
3
0 20 40 60 80 100
No
Other obligations / not enough time
Age or health
Not enough access / overcrowding
Incompatible season scheduling / lack of Sundayhunting
Too few deer
Poor weather
Cost or financial reasons
Other
Percent
Mu
ltip
le R
es
po
ns
es
All
ow
ed
Are there things that have prevented you from going deer hunting as much as you would like
in the past 5 years? (Asked of those who hunted deer in Maine in the past 5 years.)
(Hunters)
Most often hunts in theNorth/East Region(n=107)
Most often hunts in theCentral Region (n=104)
Most often hunts in theSouth Region (n=76)

Opinions of Residents, Landowners, and Hunters on Deer, Moose, Bear, and Turkey 457
0
46
15
23
8
8
15
0
0
0
0
25
50
25
0
0
0
25
0
25
0
58
0
0
0
17
0
47
31
36
7
12
3
2
3
0
0 20 40 60 80 100
Too far away
Not enough time
Not enough deer / more elsewhere
Not interested
Hunt species other than deer
Permits / restrictive regulations
Age / health
Other
Don't know
Percent
Mu
ltip
le R
es
po
ns
es
All
ow
ed
What are your most important reasons for not hunting deer in Maine in the past 5 years?
(Asked of those who did not hunt deer in Maine in the past 5 years.) (Hunters)
Lives in the North/East Region (n=13)
Lives in the Central Region (n=4)
Lives in the South Region (n=12)
Nonresident (n=58)
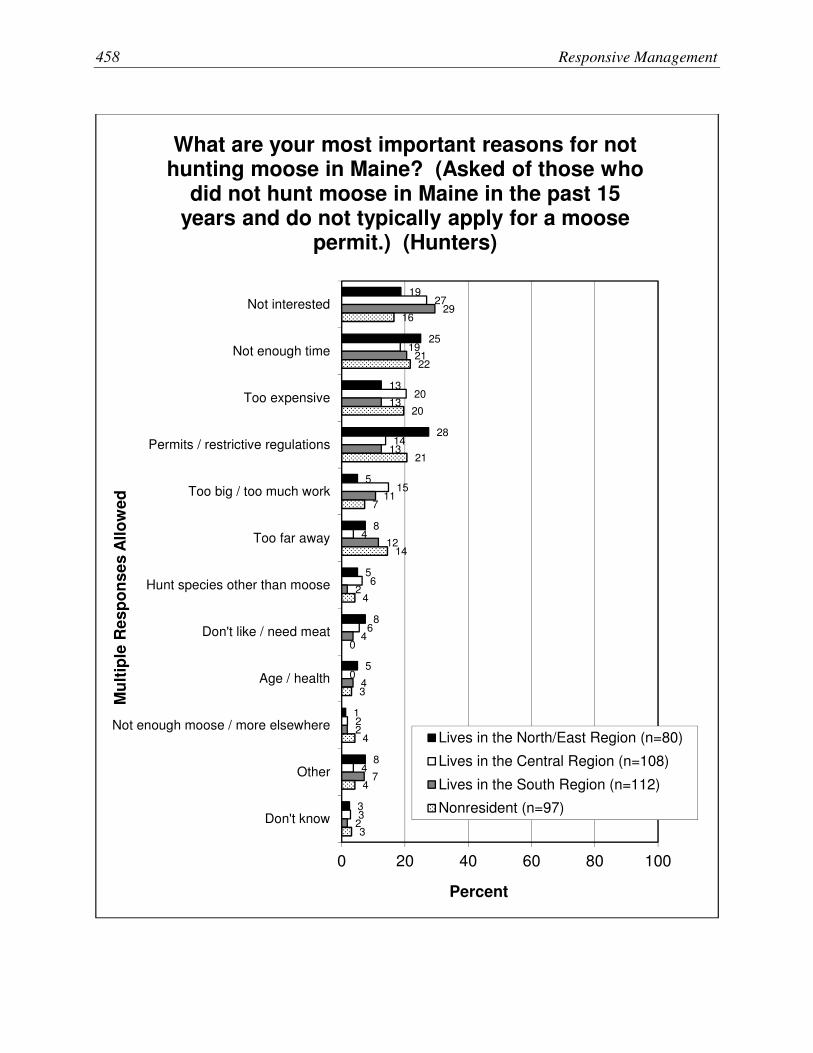
458 Responsive Management
19
25
13
28
5
8
5
8
5
1
8
3
27
19
20
14
15
4
6
6
0
2
4
3
29
21
13
13
11
12
2
4
4
2
7
2
16
22
20
21
7
14
4
0
3
4
4
3
0 20 40 60 80 100
Not interested
Not enough time
Too expensive
Permits / restrictive regulations
Too big / too much work
Too far away
Hunt species other than moose
Don't like / need meat
Age / health
Not enough moose / more elsewhere
Other
Don't know
Percent
Mu
ltip
le R
es
po
ns
es
All
ow
ed
What are your most important reasons for not hunting moose in Maine? (Asked of those who
did not hunt moose in Maine in the past 15 years and do not typically apply for a moose
permit.) (Hunters)
Lives in the North/East Region (n=80)
Lives in the Central Region (n=108)
Lives in the South Region (n=112)
Nonresident (n=97)
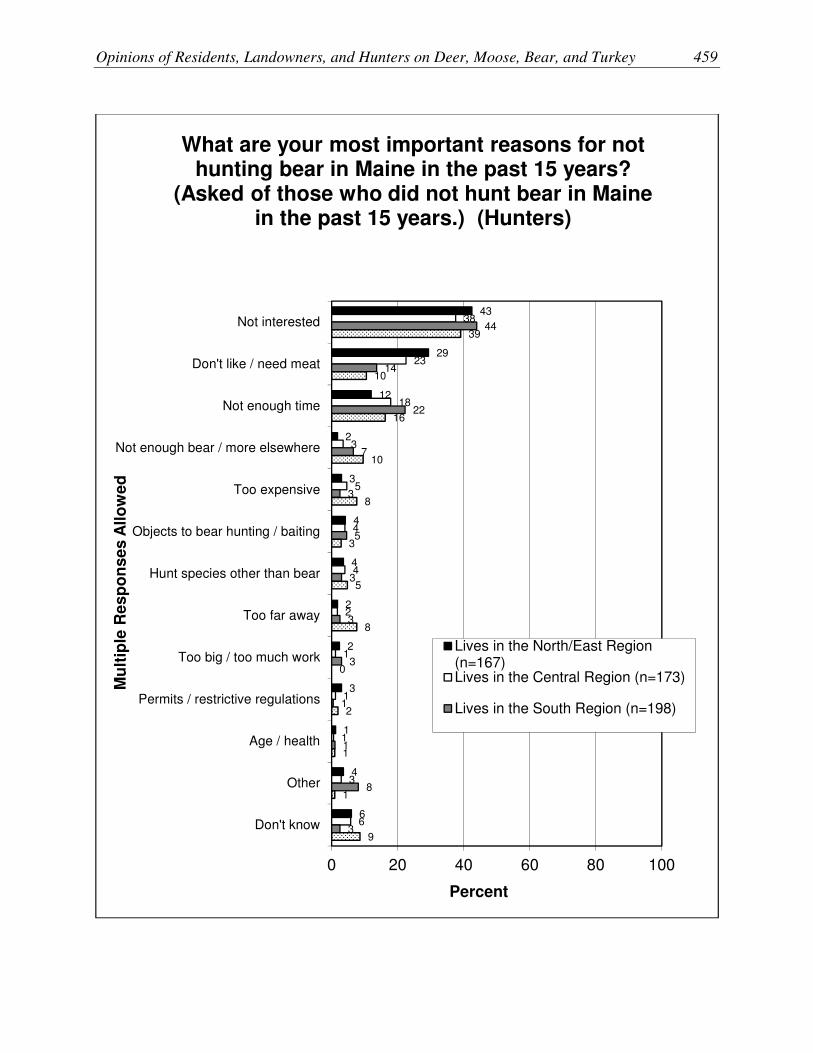
Opinions of Residents, Landowners, and Hunters on Deer, Moose, Bear, and Turkey 459
43
29
12
2
3
4
4
2
2
3
1
4
6
38
23
18
3
5
4
4
2
1
1
1
3
6
44
14
22
7
3
5
3
3
3
1
1
8
3
39
10
16
10
8
3
5
8
0
2
1
1
9
0 20 40 60 80 100
Not interested
Don't like / need meat
Not enough time
Not enough bear / more elsewhere
Too expensive
Objects to bear hunting / baiting
Hunt species other than bear
Too far away
Too big / too much work
Permits / restrictive regulations
Age / health
Other
Don't know
Percent
Mu
ltip
le R
es
po
ns
es
All
ow
ed
What are your most important reasons for not hunting bear in Maine in the past 15 years?
(Asked of those who did not hunt bear in Maine in the past 15 years.) (Hunters)
Lives in the North/East Region(n=167)Lives in the Central Region (n=173)
Lives in the South Region (n=198)
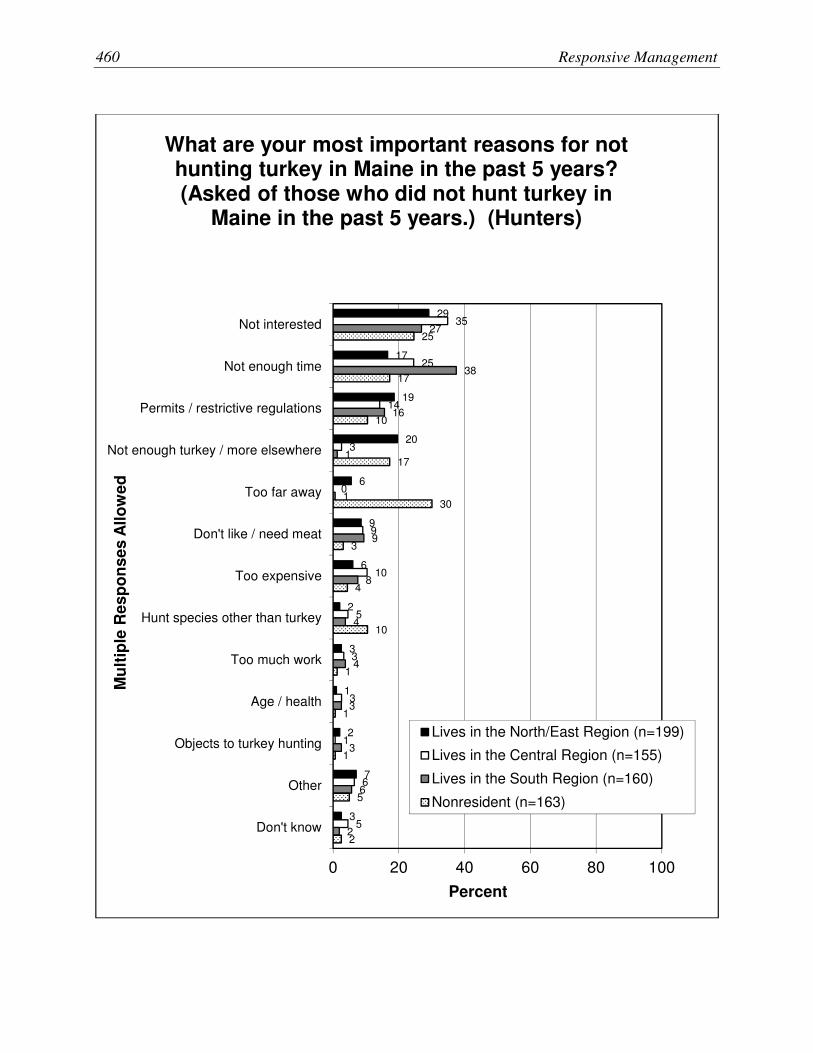
460 Responsive Management
29
17
19
20
6
9
6
2
3
1
2
7
3
35
25
14
3
0
9
10
5
3
3
1
6
5
27
38
16
1
1
9
8
4
4
3
3
6
2
25
17
10
17
30
3
4
10
1
1
1
5
2
0 20 40 60 80 100
Not interested
Not enough time
Permits / restrictive regulations
Not enough turkey / more elsewhere
Too far away
Don't like / need meat
Too expensive
Hunt species other than turkey
Too much work
Age / health
Objects to turkey hunting
Other
Don't know
Percent
Mu
ltip
le R
es
po
ns
es
All
ow
ed
What are your most important reasons for not hunting turkey in Maine in the past 5 years? (Asked of those who did not hunt turkey in
Maine in the past 5 years.) (Hunters)
Lives in the North/East Region (n=199)
Lives in the Central Region (n=155)
Lives in the South Region (n=160)
Nonresident (n=163)

Opinions of Residents, Landowners, and Hunters on Deer, Moose, Bear, and Turkey 461
Opinions on Hunting—Hunters Approval/disapproval of hunting.
Support for/opposition to hunting bear for various reasons.
95
4
0
1
98
2
0
0
97
3
0
0
97
2
1
0
0 20 40 60 80 100
Strongly approve
Moderatelyapprove
Neither approvenor disapprove
Stronglydisapprove
Percent
In general, do you approve or disapprove of legal deer hunting? (Hunters)
Lives in the North/EastRegion (n=262)
Lives in the Central Region(n=258)
Lives in the South Region(n=256)
Nonresident (n=180)

462 Responsive Management
89
9
0
0
1
0
88
10
0
0
1
0
88
9
0
1
2
0
94
4
1
1
0
0
0 20 40 60 80 100
Strongly approve
Moderatelyapprove
Neither approvenor disapprove
Moderatelydisapprove
Stronglydisapprove
Don't know
Percent
In general, do you approve or disapprove of legal moose hunting? (Hunters)
Lives in the North/EastRegion (n=262)
Lives in the Central Region(n=258)
Lives in the South Region(n=256)
Nonresident (n=180)

Opinions of Residents, Landowners, and Hunters on Deer, Moose, Bear, and Turkey 463
84
13
1
1
0
1
86
12
1
0
0
0
87
9
1
2
2
0
91
7
2
0
1
0
0 20 40 60 80 100
Strongly approve
Moderatelyapprove
Neither approvenor disapprove
Moderatelydisapprove
Stronglydisapprove
Don't know
Percent
In general, do you approve or disapprove of legal bear hunting? (Hunters)
Lives in the North/EastRegion (n=262)
Lives in the Central Region(n=258)
Lives in the South Region(n=256)
Nonresident (n=180)

464 Responsive Management
89
8
1
0
1
1
94
5
0
0
1
0
92
7
0
0
1
0
91
9
0
0
0
1
0 20 40 60 80 100
Strongly approve
Moderatelyapprove
Neither approvenor disapprove
Moderatelydisapprove
Stronglydisapprove
Don't know
Percent
In general, do you approve or disapprove of legal turkey hunting? (Hunters)
Lives in the North/EastRegion (n=262)
Lives in the Central Region(n=258)
Lives in the South Region(n=256)
Nonresident (n=180)

Opinions of Residents, Landowners, and Hunters on Deer, Moose, Bear, and Turkey 465
81
77
57
44
21
80
78
58
50
26
85
82
58
51
21
88
77
61
63
38
0 20 40 60 80 100
As a method to helpmanage bear
populations in Maine
For the meat
For economic benefitsto rural areas
For recreation
For a trophy
Percent
Percent of respondents who would strongly support hunting bear for each of the following
reasons. (Hunters)
Lives in the North/East Region (n=262)
Lives in the Central Region (n=258)
Lives in the South Region (n=256)
Nonresident (n=180)

466 Responsive Management
95
91
78
71
50
95
95
84
75
51
96
95
80
74
47
95
92
80
82
69
0 20 40 60 80 100
As a method to helpmanage bear populations
in Maine
For the meat
For economic benefits torural areas
For recreation
For a trophy
Percent
Percent of respondents who would strongly support or moderately support hunting bear for
each of the following reasons. (Hunters)
Lives in the North/East Region (n=262)
Lives in the Central Region (n=258)
Lives in the South Region (n=256)
Nonresident (n=180)
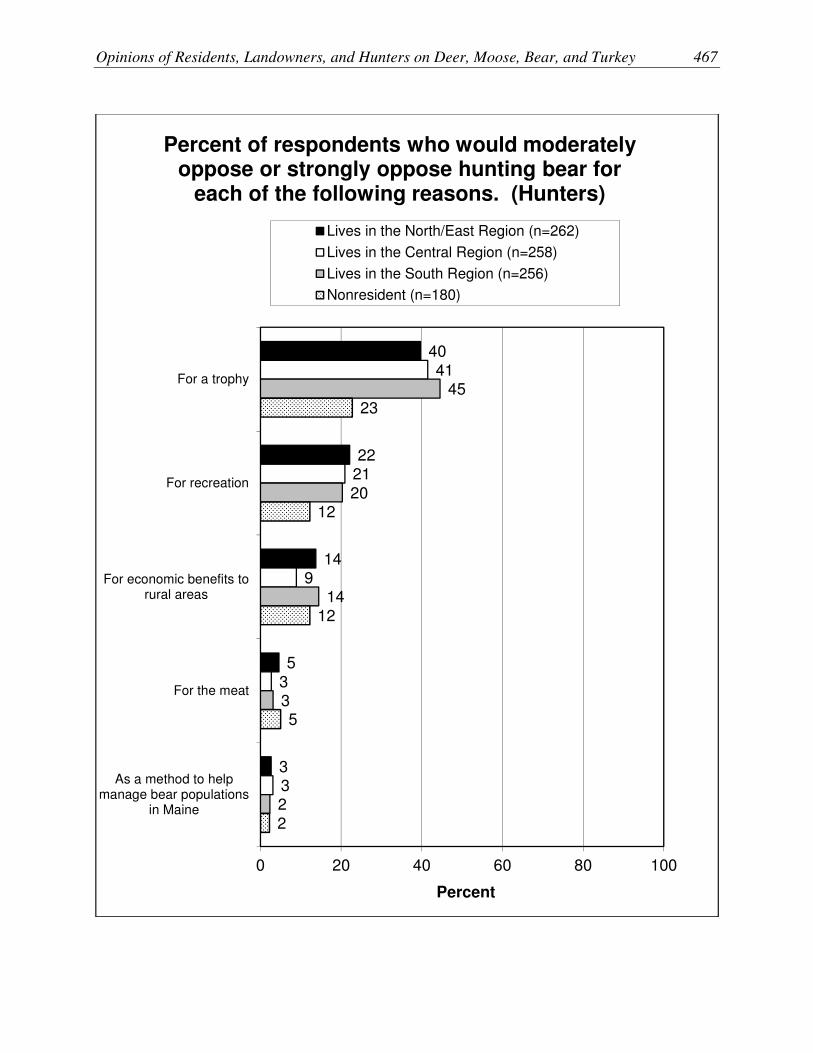
Opinions of Residents, Landowners, and Hunters on Deer, Moose, Bear, and Turkey 467
40
22
14
5
3
41
21
9
3
3
45
20
14
3
2
23
12
12
5
2
0 20 40 60 80 100
For a trophy
For recreation
For economic benefits torural areas
For the meat
As a method to helpmanage bear populations
in Maine
Percent
Percent of respondents who would moderately oppose or strongly oppose hunting bear for
each of the following reasons. (Hunters)
Lives in the North/East Region (n=262)
Lives in the Central Region (n=258)
Lives in the South Region (n=256)
Nonresident (n=180)

468 Responsive Management
24
12
5
4
2
26
11
7
2
2
28
9
5
2
0
15
7
7
3
1
0 20 40 60 80 100
For a trophy
For recreation
For economic benefitsto rural areas
For the meat
As a method to helpmanage bear
populations in Maine
Percent
Percent of respondents who would strongly oppose hunting bear for each of the following
reasons. (Hunters)
Lives in the North/East Region (n=262)
Lives in the Central Region (n=258)
Lives in the South Region (n=256)
Nonresident (n=180)

Opinions of Residents, Landowners, and Hunters on Deer, Moose, Bear, and Turkey 469
Hunting Access—Hunters Hunters: ratings of access.
Whether lack of access has been constraint to hunting participation.
20
50
22
7
0
14
39
38
9
2
15
48
27
8
1
41
42
13
2
2
0 20 40 60 80 100
Excellent
Good
Fair
Poor
Don't know
Percent
In general, how would you rate access to hunting lands in Maine? (Hunters)
Lives in the North/EastRegion (n=262)
Lives in the Central Region(n=258)
Lives in the South Region(n=256)
Nonresident (n=180)

470 Responsive Management
28
44
21
5
1
16
42
33
8
1
17
48
26
8
1
0 20 40 60 80 100
Excellent
Good
Fair
Poor
Don't know
Percent
In general, how would you rate access to hunting lands in Maine? (Hunters)
Most often hunts in theNorth/East Region (n=396)
Most often hunts in theCentral Region (n=326)
Most often hunts in the SouthRegion (n=234)
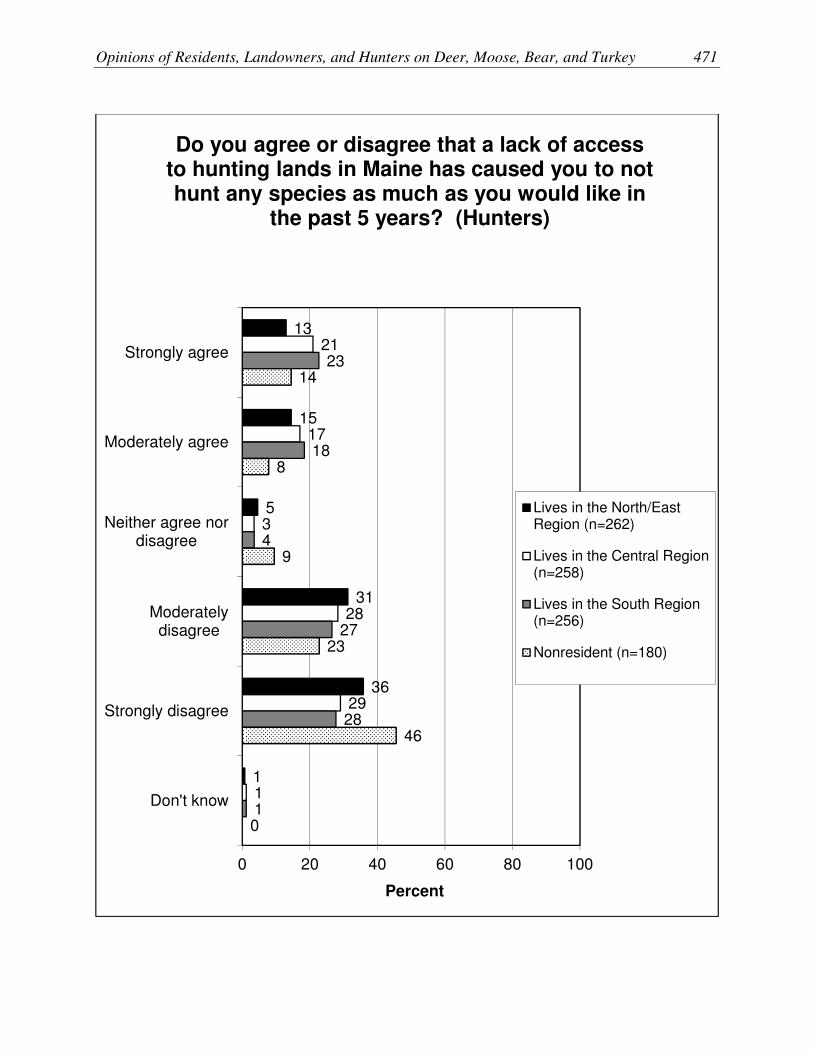
Opinions of Residents, Landowners, and Hunters on Deer, Moose, Bear, and Turkey 471
13
15
5
31
36
1
21
17
3
28
29
1
23
18
4
27
28
1
14
8
9
23
46
0
0 20 40 60 80 100
Strongly agree
Moderately agree
Neither agree nordisagree
Moderatelydisagree
Strongly disagree
Don't know
Percent
Do you agree or disagree that a lack of access to hunting lands in Maine has caused you to not hunt any species as much as you would like in
the past 5 years? (Hunters)
Lives in the North/EastRegion (n=262)
Lives in the Central Region(n=258)
Lives in the South Region(n=256)
Nonresident (n=180)

472 Responsive Management
13
12
7
30
38
0
22
15
4
27
30
1
20
19
3
23
33
1
0 20 40 60 80 100
Strongly agree
Moderately agree
Neither agree nordisagree
Moderatelydisagree
Strongly disagree
Don't know
Percent
Do you agree or disagree that a lack of access to hunting lands in Maine has caused you to not hunt any species as much as you would like in
the past 5 years? (Hunters)
Most often hunts in theNorth/East Region (n=396)
Most often hunts in theCentral Region (n=326)
Most often hunts in the SouthRegion (n=234)

Opinions of Residents, Landowners, and Hunters on Deer, Moose, Bear, and Turkey 473
Hunting Licensing and Fees—Hunters Whether cost of hunting fees is too much.
Whether separate purchase requirements inhibit hunting.
19
76
3
3
23
72
3
3
17
78
4
2
28
70
2
1
0 20 40 60 80 100
Too much
About right
Not enough
Don't know
Percent
In general, do you think current hunting license fees are too much, about right, or not enough?
(Hunters)
Lives in the North/EastRegion (n=262)
Lives in the Central Region(n=258)
Lives in the South Region(n=256)
Nonresident (n=180)

474 Responsive Management
21
16
8
28
26
1
23
15
3
28
30
1
18
12
4
28
37
1
18
13
8
25
36
1
0 20 40 60 80 100
Strongly agree
Moderately agree
Neither agree nordisagree
Moderatelydisagree
Strongly disagree
Don't know
Percent
Do you agree or disagree that the current requirement to purchase separate permits for some species, such as wild turkey and bear,
prevents you from hunting for those species as much as you would like? (Hunters)
Lives in the North/EastRegion (n=262)
Lives in the Central Region(n=258)
Lives in the South Region(n=256)
Nonresident (n=180)

Opinions of Residents, Landowners, and Hunters on Deer, Moose, Bear, and Turkey 475
Opinions on Regulations and Specific Aspects of Hunting—Hunters Opinions on the 3-point rule.
Which month preferred for moose hunting.
Why that month is preferred.
Opinion on a split moose season.
Opinions regarding tradeoff on number of permits versus chance of harvest.
38
14
4
17
26
1
29
13
3
19
36
1
26
17
4
12
40
0
0 20 40 60 80 100
Strongly support
Moderatelysupport
Neither supportnor oppose
Moderatelyoppose
Strongly oppose
Don't know
Percent
Would you support or oppose a law requiring that harvested bucks have at least 3 points on
one side? (Hunters)
Most often hunts in theNorth/East Region (n=382)
Most often hunts in theCentral Region (n=320)
Most often hunts in the SouthRegion (n=232)

476 Responsive Management
25
53
14
5
2
21
64
11
3
1
19
65
10
6
0
0 20 40 60 80 100
September
October
November
No preference
Don't know
Percent
Which month do you most prefer for the moose hunting season? (Asked of those who hunted
moose in Maine in the past 15 years or typically apply for a moose permit.) (Hunters)
Most often hunts in theNorth/East Region (n=257)
Most often hunts in theCentral Region (n=173)
Most often hunts in the SouthRegion (n=127)

Opinions of Residents, Landowners, and Hunters on Deer, Moose, Bear, and Turkey 477
59
10
14
8
12
0
61
17
17
6
3
3
58
34
4
4
0
4
0 20 40 60 80 100
Timing of rutting season / greater mooseactivity
Weather preference
Lack of conflict with other hunting seasons
Fits better with personal schedule
Other
Don't know
Percent
Mu
ltip
le R
es
po
ns
es
All
ow
ed
Why do you most prefer for the moose hunting season to be in September? (Asked of those
who hunted moose in Maine in the past 15 years or typically apply for a moose permit and prefer
for moose hunting in September.) (Hunters)
Most often hunts in theNorth/East Region (n=64)
Most often hunts in theCentral Region (n=37)
Most often hunts in theSouth Region (n=24)

478 Responsive Management
47
32
12
6
2
11
1
49
26
17
8
8
6
3
54
26
14
5
6
6
1
0 20 40 60 80 100
Weather preference
Timing of rutting season / greater mooseactivity
Lack of conflict with other hunting seasons
Overlap with other hunting seasons
Fits better with personal schedule
Other
Don't know
Percent
Mu
ltip
le R
es
po
ns
es
All
ow
ed
Why do you most prefer for the moose hunting season to be in October? (Asked of those who hunted moose in Maine in the past 15 years or
typically apply for a moose permit and prefer for moose hunting in October.) (Hunters)
Most often hunts in theNorth/East Region (n=138)
Most often hunts in the CentralRegion (n=109)
Most often hunts in the SouthRegion (n=83)

Opinions of Residents, Landowners, and Hunters on Deer, Moose, Bear, and Turkey 479
57
25
6
3
3
12
2
48
16
4
4
6
17
4
54
8
8
8
0
23
0
0 20 40 60 80 100
Weather preference
Timing of rutting season / greater moose activity
Lack of conflict with other hunting seasons
Overlap with other hunting seasons
Fits better with personal schedule
Other
Don't know
Percent
Mu
ltip
le R
es
po
ns
es
All
ow
ed
Why do you most prefer for the moose hunting season to be in November? (Asked of those
who hunted moose in Maine in the past 15 years or typically apply for a moose permit and prefer
for moose hunting in November.) (Hunters)
Most often hunts in the North/EastRegion (n=38)
Most often hunts in the CentralRegion (n=20)
Most often hunts in the SouthRegion (n=13)

480 Responsive Management
62
29
7
3
53
40
6
1
61
33
6
0
0 20 40 60 80 100
6-day season withfewer hunters
12-day seasonwith more hunters
No preference
Don't know
Percent
If you had to choose, would you prefer a 6-day season with fewer hunters, or would you prefer a 12-day season with more hunters? (Asked of
those who hunted moose in Maine in the past 15 years or typically apply for a moose permit.)
(Hunters)
Most often hunts in theNorth/East Region (n=257)
Most often hunts in theCentral Region (n=173)
Most often hunts in the SouthRegion (n=127)

Opinions of Residents, Landowners, and Hunters on Deer, Moose, Bear, and Turkey 481
40
49
10
39
53
8
34
57
9
0 20 40 60 80 100
More permitswith lower
harvest rate
Fewer permitswith higherharvest rate
Don't know
Percent
Would you prefer the Department offer more moose permits but a lower harvest success rate
or fewer moose permits with a higher harvest success rate? (Of those who hunted moose in ME in the past 15 years or typically apply for a
moose permit.) (Hunters)
Most often hunts in theNorth/East Region (n=257)
Most often hunts in theCentral Region (n=173)
Most often hunts in the SouthRegion (n=127)

482 Responsive Management
Land Management in General—Hunters Opinions on management of all four species shown together.
Support for/opposition to coyote management.
16
19
35
20
22
28
39
24
29
30
34
34
15
32
34
17
0 20 40 60 80 100
Deer
Moose
Bear
Turkey
Percent
Percent of respondents who rated the management of each of the following species as
excellent in Maine. (Hunters)
Lives in the North/East Region (n=262)Lives in the Central Region (n=258)Lives in the South Region (n=256)Nonresident (n=180)

Opinions of Residents, Landowners, and Hunters on Deer, Moose, Bear, and Turkey 483
49
63
75
56
62
68
72
57
71
72
72
70
59
66
69
48
0 20 40 60 80 100
Deer
Moose
Bear
Turkey
Percent
Percent of respondents who rated the management of each of the following species as
excellent or good in Maine. (Hunters)
Lives in the North/East Region (n=262)
Lives in the Central Region (n=258)
Lives in the South Region (n=256)
Nonresident (n=180)

484 Responsive Management
50
34
16
31
36
25
16
36
28
18
14
27
29
11
4
10
0 20 40 60 80 100
Deer
Moose
Bear
Turkey
Percent
Percent of respondents who rated the management of each of the following species as
fair or poor in Maine. (Hunters)
Lives in the North/EastRegion (n=262)
Lives in the Central Region(n=258)
Lives in the South Region(n=256)
Nonresident (n=180)

Opinions of Residents, Landowners, and Hunters on Deer, Moose, Bear, and Turkey 485
18
13
4
10
10
5
3
19
7
3
2
13
8
3
1
3
0 20 40 60 80 100
Deer
Moose
Bear
Turkey
Percent
Percent of respondents who rated the management of each of the following species as
poor in Maine. (Hunters)
Lives in the North/East Region (n=262)
Lives in the Central Region (n=258)
Lives in the South Region (n=256)
Nonresident (n=180)
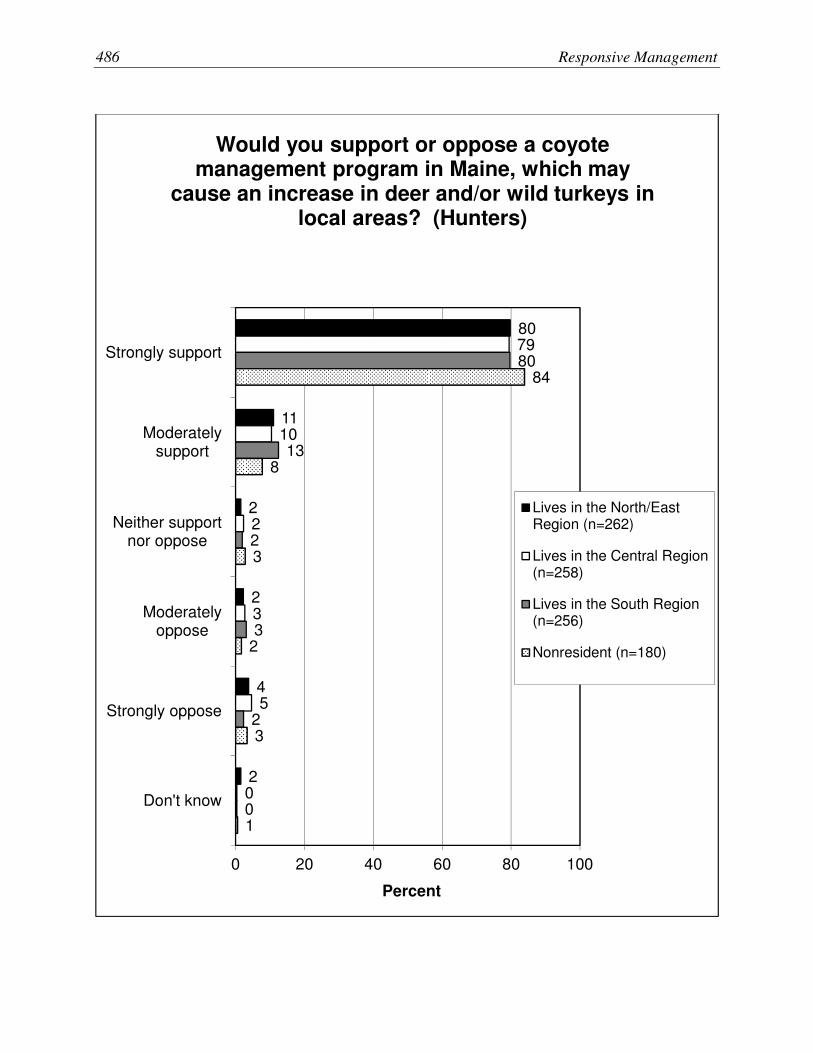
486 Responsive Management
80
11
2
2
4
2
79
10
2
3
5
0
80
13
2
3
2
0
84
8
3
2
3
1
0 20 40 60 80 100
Strongly support
Moderatelysupport
Neither supportnor oppose
Moderatelyoppose
Strongly oppose
Don't know
Percent
Would you support or oppose a coyote management program in Maine, which may
cause an increase in deer and/or wild turkeys in local areas? (Hunters)
Lives in the North/EastRegion (n=262)
Lives in the Central Region(n=258)
Lives in the South Region(n=256)
Nonresident (n=180)

Opinions of Residents, Landowners, and Hunters on Deer, Moose, Bear, and Turkey 487
Deer Management—Hunters Ratings of deer management.
Opinions on the size of the deer population.
Support for increasing deer population with various caveats.
Factors to be considered in managing deer.
Support for/opposition to hunting as a way to manage deer.
Support for/opposition to various methods to control deer.
Opinions on deer and moose tradeoffs.
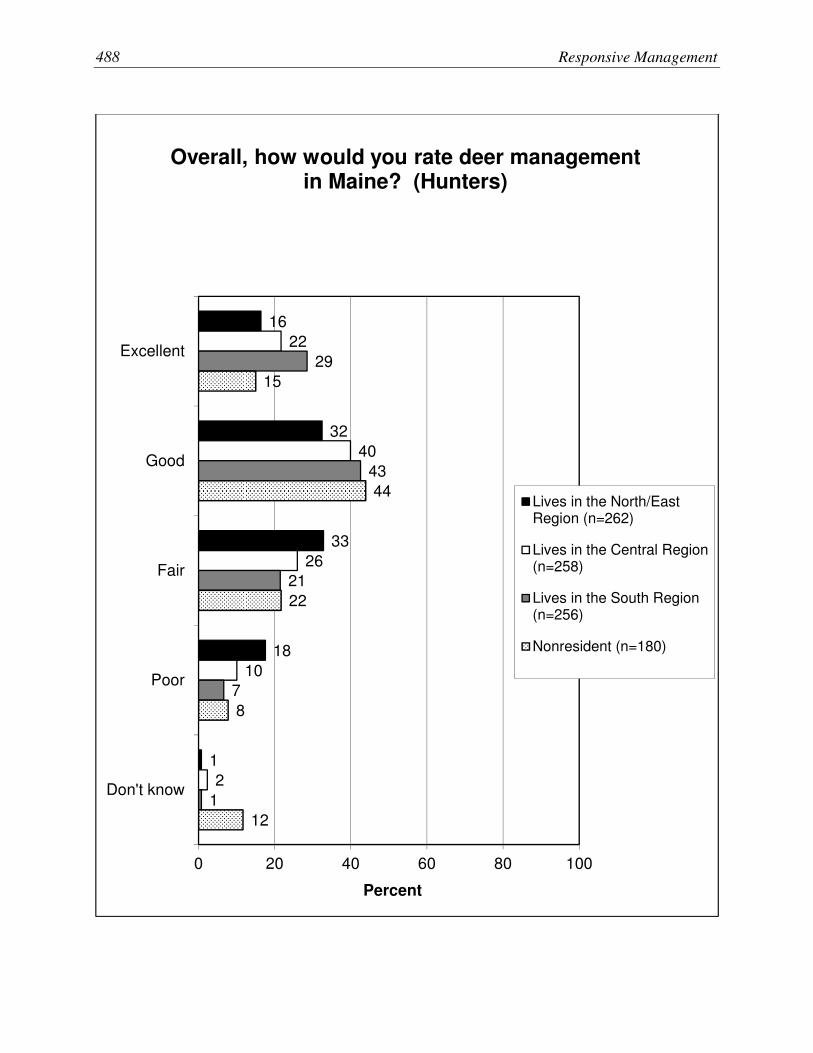
488 Responsive Management
16
32
33
18
1
22
40
26
10
2
29
43
21
7
1
15
44
22
8
12
0 20 40 60 80 100
Excellent
Good
Fair
Poor
Don't know
Percent
Overall, how would you rate deer management in Maine? (Hunters)
Lives in the North/EastRegion (n=262)
Lives in the Central Region(n=258)
Lives in the South Region(n=256)
Nonresident (n=180)

Opinions of Residents, Landowners, and Hunters on Deer, Moose, Bear, and Turkey 489
16
36
31
12
5
21
41
24
10
4
29
44
20
7
1
0 20 40 60 80 100
Excellent
Good
Fair
Poor
Don't know
Percent
Overall, how would you rate deer management in Maine? (Hunters)
Most often hunts in theNorth/East Region (n=396)
Most often hunts in theCentral Region (n=326)
Most often hunts in the SouthRegion (n=234)

490 Responsive Management
54
36
9
1
0
32
59
7
0
2
23
70
5
1
1
0 20 40 60 80 100
Increased
Remain the same
Decreased
There are no deerin the area
Don't know
Percent
In your opinion, should the deer population in the area where you live be increased, remain the same, or be decreased? Or are there no deer in
the area where you live? (Asked of Maine residents.) (Hunters)
Lives in the North/EastRegion (n=124)
Lives in the Central Region(n=121)
Lives in the South Region(n=131)
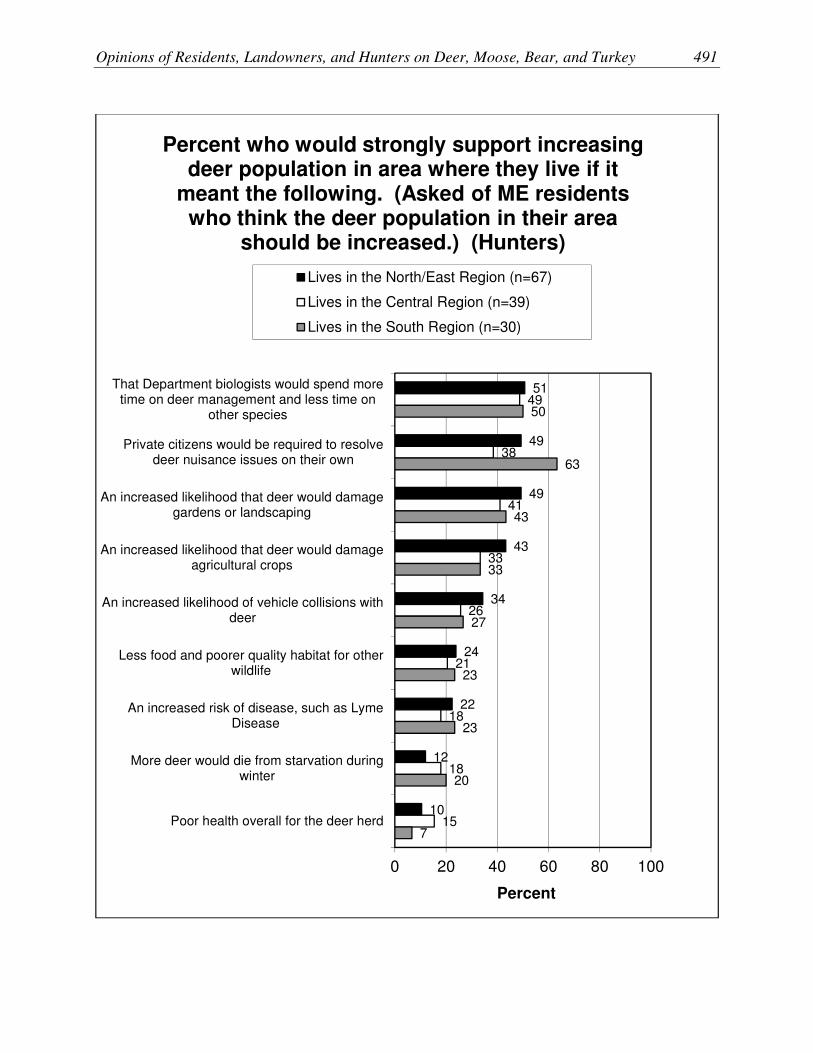
Opinions of Residents, Landowners, and Hunters on Deer, Moose, Bear, and Turkey 491
51
49
49
43
34
24
22
12
10
49
38
41
33
26
21
18
18
15
50
63
43
33
27
23
23
20
7
0 20 40 60 80 100
That Department biologists would spend moretime on deer management and less time on
other species
Private citizens would be required to resolvedeer nuisance issues on their own
An increased likelihood that deer would damagegardens or landscaping
An increased likelihood that deer would damageagricultural crops
An increased likelihood of vehicle collisions withdeer
Less food and poorer quality habitat for otherwildlife
An increased risk of disease, such as LymeDisease
More deer would die from starvation duringwinter
Poor health overall for the deer herd
Percent
Percent who would strongly support increasing deer population in area where they live if it
meant the following. (Asked of ME residents who think the deer population in their area
should be increased.) (Hunters)
Lives in the North/East Region (n=67)
Lives in the Central Region (n=39)
Lives in the South Region (n=30)
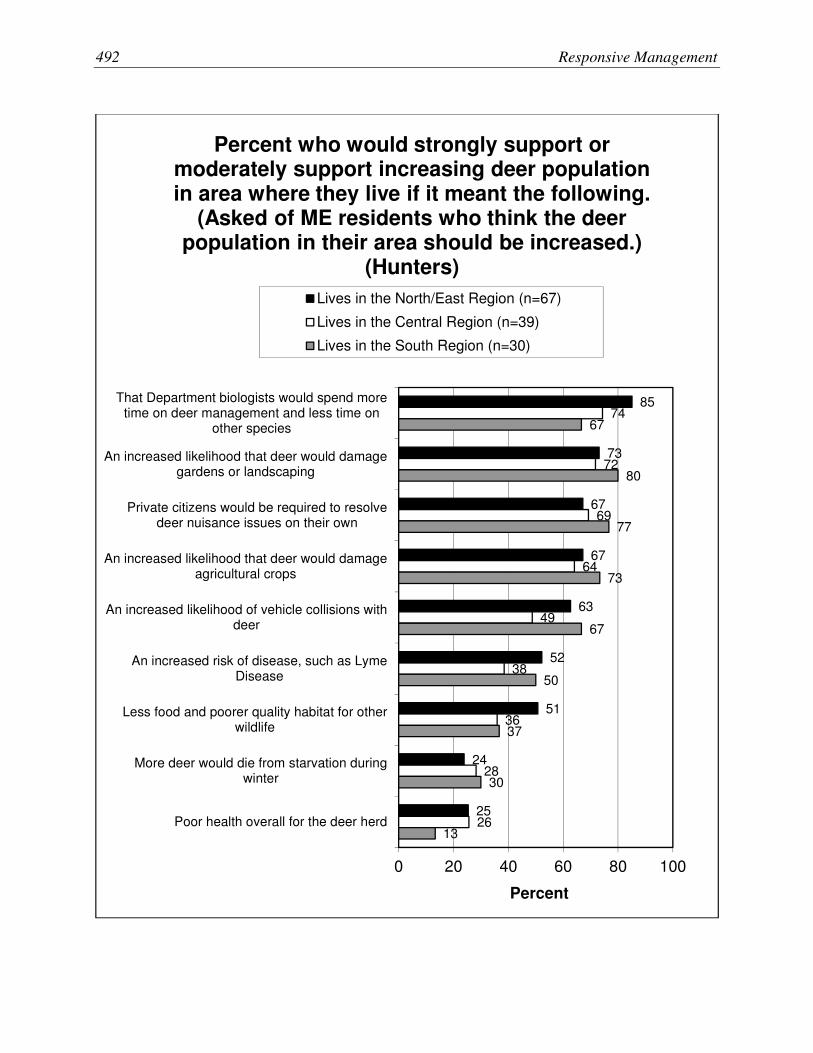
492 Responsive Management
85
73
67
67
63
52
51
24
25
74
72
69
64
49
38
36
28
26
67
80
77
73
67
50
37
30
13
0 20 40 60 80 100
That Department biologists would spend moretime on deer management and less time on
other species
An increased likelihood that deer would damagegardens or landscaping
Private citizens would be required to resolvedeer nuisance issues on their own
An increased likelihood that deer would damageagricultural crops
An increased likelihood of vehicle collisions withdeer
An increased risk of disease, such as LymeDisease
Less food and poorer quality habitat for otherwildlife
More deer would die from starvation duringwinter
Poor health overall for the deer herd
Percent
Percent who would strongly support or moderately support increasing deer population in area where they live if it meant the following.
(Asked of ME residents who think the deer population in their area should be increased.)
(Hunters)
Lives in the North/East Region (n=67)
Lives in the Central Region (n=39)
Lives in the South Region (n=30)

Opinions of Residents, Landowners, and Hunters on Deer, Moose, Bear, and Turkey 493
67
64
42
46
31
24
31
21
10
72
64
62
46
41
31
23
23
15
73
63
57
40
27
23
17
17
17
0 20 40 60 80 100
Poor health overall for the deer herd
More deer would die from starvation duringwinter
Less food and poorer quality habitat for otherwildlife
An increased risk of disease, such as LymeDisease
An increased likelihood of vehicle collisions withdeer
An increased likelihood that deer would damageagricultural crops
Private citizens would be required to resolvedeer nuisance issues on their own
An increased likelihood that deer would damagegardens or landscaping
That Department biologists would spend moretime on deer management and less time on
other species
Percent
Percent who would moderately oppose or strongly oppose increasing deer population in area where they live if it meant the following. (Asked of ME residents who think the deer
population in their area should be increased.) (Hunters)
Lives in the North/East Region (n=67)
Lives in the Central Region (n=39)
Lives in the South Region (n=30)

494 Responsive Management
46
45
30
21
16
19
9
7
6
62
51
31
33
26
13
15
13
3
50
50
27
30
20
10
3
3
10
0 20 40 60 80 100
More deer would die from starvation duringwinter
Poor health overall for the deer herd
An increased risk of disease, such as LymeDisease
Less food and poorer quality habitat for otherwildlife
An increased likelihood of vehicle collisions withdeer
Private citizens would be required to resolvedeer nuisance issues on their own
An increased likelihood that deer woulddamage agricultural crops
An increased likelihood that deer woulddamage gardens or landscaping
That Department biologists would spend moretime on deer management and less time on
other species
Percent
Percent who would strongly oppose increasing deer population in area where they live if it
meant the following. (Asked of ME residents who think the deer population in their area
should be increased.) (Hunters)
Lives in the North/East Region (n=67)
Lives in the Central Region (n=39)
Lives in the South Region (n=30)

Opinions of Residents, Landowners, and Hunters on Deer, Moose, Bear, and Turkey 495
8.8
8.5
7.7
6.8
7.3
6.6
5.2
4.5
9.1
8.8
7.8
7.0
6.5
6.8
6.5
5.1
8.6
8.8
7.5
7.1
6.9
6.9
5.9
4.9
8.7
9.0
7.9
7.4
6.2
6.1
6.6
5.0
0 2 4 6 8 10
The health of the typicaldeer in the herd
Providing deer huntingopportunities
The opportunity to see deer
Impacts on habitat
Risk of vehicle collisions withdeer
Risk of human disease, suchas Lyme Disease
Damage to agricultural crops
Damage to gardens andornamental plants
Mean
On a scale of 0 to 10, where 0 is not at all important and 10 is extremely important, how important do you think each of the following
factors should be for managing the deer population in Maine? (Hunters)
Lives in the North/East Region (74≤n≤81)
Lives in the Central Region (69≤n≤81)
Lives in the South Region (67≤n≤101)
Nonresident (47≤n≤66)
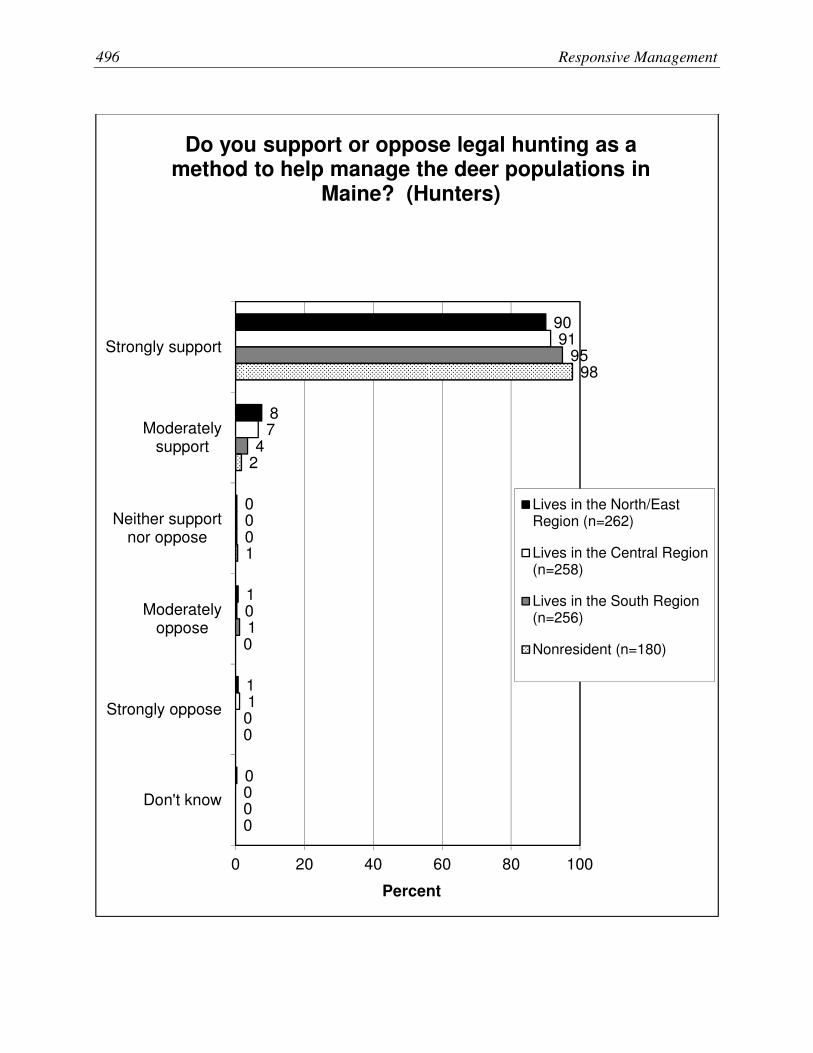
496 Responsive Management
90
8
0
1
1
0
91
7
0
0
1
0
95
4
0
1
0
0
98
2
1
0
0
0
0 20 40 60 80 100
Strongly support
Moderatelysupport
Neither supportnor oppose
Moderatelyoppose
Strongly oppose
Don't know
Percent
Do you support or oppose legal hunting as a method to help manage the deer populations in
Maine? (Hunters)
Lives in the North/EastRegion (n=262)
Lives in the Central Region(n=258)
Lives in the South Region(n=256)
Nonresident (n=180)

Opinions of Residents, Landowners, and Hunters on Deer, Moose, Bear, and Turkey 497
64
61
63
58
54
44
18
80
69
66
63
65
45
9
76
78
71
75
55
58
17
79
73
79
82
67
60
19
0 20 40 60 80 100
A special archeryseason
Allowing hunters toharvest multiple deer
Targeted doe permitsvalid only in specifictowns or locations
An additional legalhunting season
A longer firearmsseason
A controlled hunt with alimited number of
hunters
Sharpshooters
Percent
Percent of respondents who would strongly support each of the following deer management
options in areas of Maine where the deer population became overabundant. (Hunters)
Lives in the North/East Region (59≤n≤80)
Lives in the Central Region (64≤n≤77)
Lives in the South Region (69≤n≤78)
Nonresident (42≤n≤58)

498 Responsive Management
88
83
80
86
71
70
33
90
86
80
79
77
72
22
96
88
95
84
76
79
32
95
96
93
89
86
81
31
0 20 40 60 80 100
A special archery season
Targeted doe permitsvalid only in specifictowns or locations
Allowing hunters toharvest multiple deer
An additional legalhunting season
A longer firearms season
A controlled hunt with alimited number of hunters
Sharpshooters
Percent
Percent of respondents who would strongly support or moderately support each of the
following deer management options in areas of Maine where the deer population became
overabundant. (Hunters)
Lives in the North/East Region (59≤n≤80)
Lives in the Central Region (64≤n≤77)
Lives in the South Region (69≤n≤78)
Nonresident (42≤n≤58)

Opinions of Residents, Landowners, and Hunters on Deer, Moose, Bear, and Turkey 499
60
22
23
13
17
15
6
68
28
21
19
20
11
6
63
19
21
13
4
9
3
60
19
12
9
5
4
4
0 20 40 60 80 100
Sharpshooters
A controlled hunt with alimited number of
hunters
A longer firearmsseason
An additional legalhunting season
Allowing hunters toharvest multiple deer
Targeted doe permitsvalid only in specifictowns or locations
A special archeryseason
Percent
Percent of respondents who would moderately oppose or strongly oppose each of the
following deer management options in areas of Maine where the deer population became
overabundant. (Hunters)
Lives in the North/East Region (59≤n≤80)
Lives in the Central Region (64≤n≤77)
Lives in the South Region (69≤n≤78)
Nonresident (42≤n≤58)

500 Responsive Management
47
8
14
9
15
10
5
52
22
12
14
11
7
1
51
5
8
4
1
8
1
48
10
7
4
4
0
2
0 20 40 60 80 100
Sharpshooters
A controlled hunt with alimited number of
hunters
A longer firearmsseason
An additional legalhunting season
Allowing hunters toharvest multiple deer
Targeted doe permitsvalid only in specifictowns or locations
A special archeryseason
Percent
Percent of respondents who would strongly oppose each of the following deer management
options in areas of Maine where the deer population became overabundant. (Hunters)
Lives in the North/East Region (59≤n≤80)
Lives in the Central Region (64≤n≤77)
Lives in the South Region (69≤n≤78)
Nonresident (42≤n≤58)

Opinions of Residents, Landowners, and Hunters on Deer, Moose, Bear, and Turkey 501
13
32
48
7
24
34
33
9
16
34
39
10
21
29
39
11
0 20 40 60 80 100
Abundant moosepopulations with
very few deer
Moderatenumbers ofmoose with
relatively fewdeer
Relatively fewmoose withmoderate
numbers of deer
Don't know
Percent
In northern Maine, which of the following scenarios would you most prefer? (Hunters)
Lives in the North/EastRegion (n=262)
Lives in the Central Region(n=258)
Lives in the South Region(n=256)
Nonresident (n=180)

502 Responsive Management
Moose Management—Hunters Ratings of moose management.
Opinions on the size of the moose population.
Support for increasing moose population with various caveats.
Factors to be considered in managing moose.
Support for/opposition to hunting as a way to manage moose.
Opinion on adjusting moose harvest for health of the moose population.
Opinion on moose hunting in southern Maine.

Opinions of Residents, Landowners, and Hunters on Deer, Moose, Bear, and Turkey 503
19
44
21
13
3
28
40
20
5
7
30
42
14
3
11
32
34
8
3
23
0 20 40 60 80 100
Excellent
Good
Fair
Poor
Don't know
Percent
Overall, how would you rate moose management in Maine? (Hunters)
Lives in the North/EastRegion (n=262)
Lives in the Central Region(n=258)
Lives in the South Region(n=256)
Nonresident (n=180)

504 Responsive Management
25
42
19
8
7
29
38
16
5
12
30
39
13
4
14
0 20 40 60 80 100
Excellent
Good
Fair
Poor
Don't know
Percent
Overall, how would you rate moose management in Maine? (Hunters)
Most often hunts in theNorth/East Region (n=396)
Most often hunts in theCentral Region (n=326)
Most often hunts in the SouthRegion (n=234)
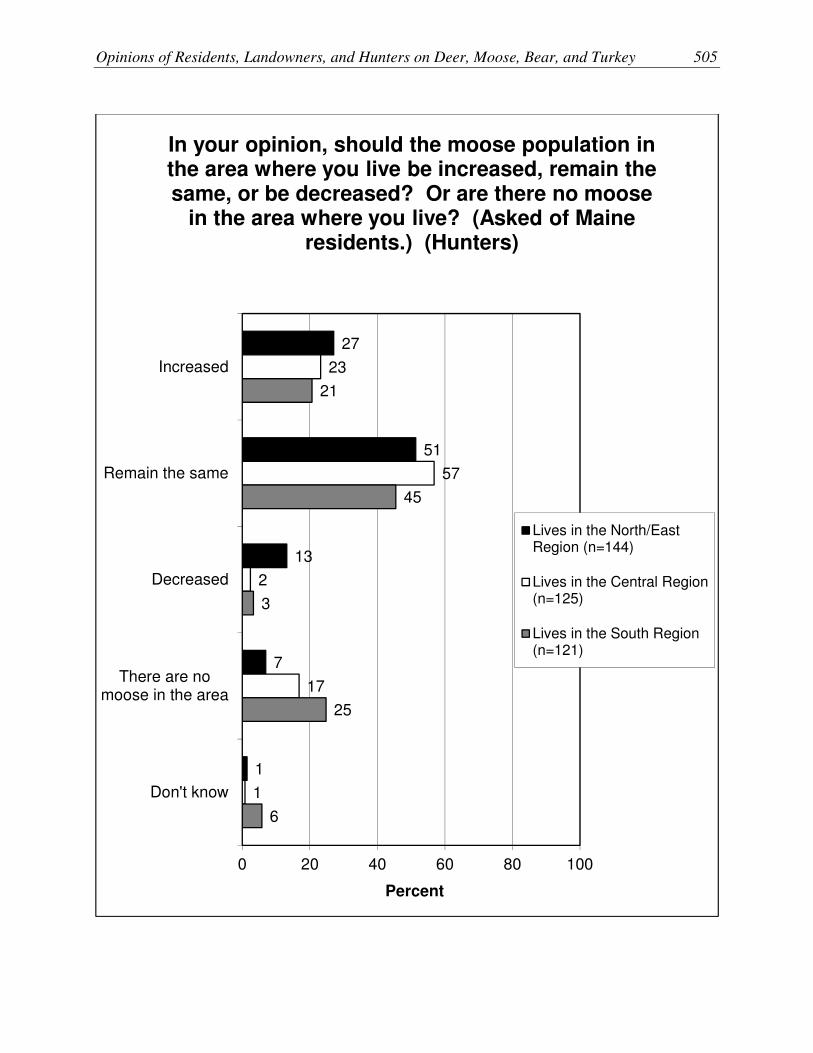
Opinions of Residents, Landowners, and Hunters on Deer, Moose, Bear, and Turkey 505
27
51
13
7
1
23
57
2
17
1
21
45
3
25
6
0 20 40 60 80 100
Increased
Remain the same
Decreased
There are nomoose in the area
Don't know
Percent
In your opinion, should the moose population in the area where you live be increased, remain the same, or be decreased? Or are there no moose
in the area where you live? (Asked of Maine residents.) (Hunters)
Lives in the North/EastRegion (n=144)
Lives in the Central Region(n=125)
Lives in the South Region(n=121)

506 Responsive Management
38
26
23
10
41
38
21
3
36
28
16
8
0 20 40 60 80 100
An increased likelihoodthat moose would
damage agriculturalcrops
An increased likelihoodof vehicle collisions with
moose
Forest regenerationwould be negatively
impacted
Poor health overall forthe moose herd
Percent
Percent who would strongly support increasing moose population in area where they live if it meant the following. (Asked of ME residents who think the moose population in their area
should be increased.) (Hunters)
Lives in the North/East Region (n=39)
Lives in the Central Region (n=29)
Lives in the South Region (n=25)
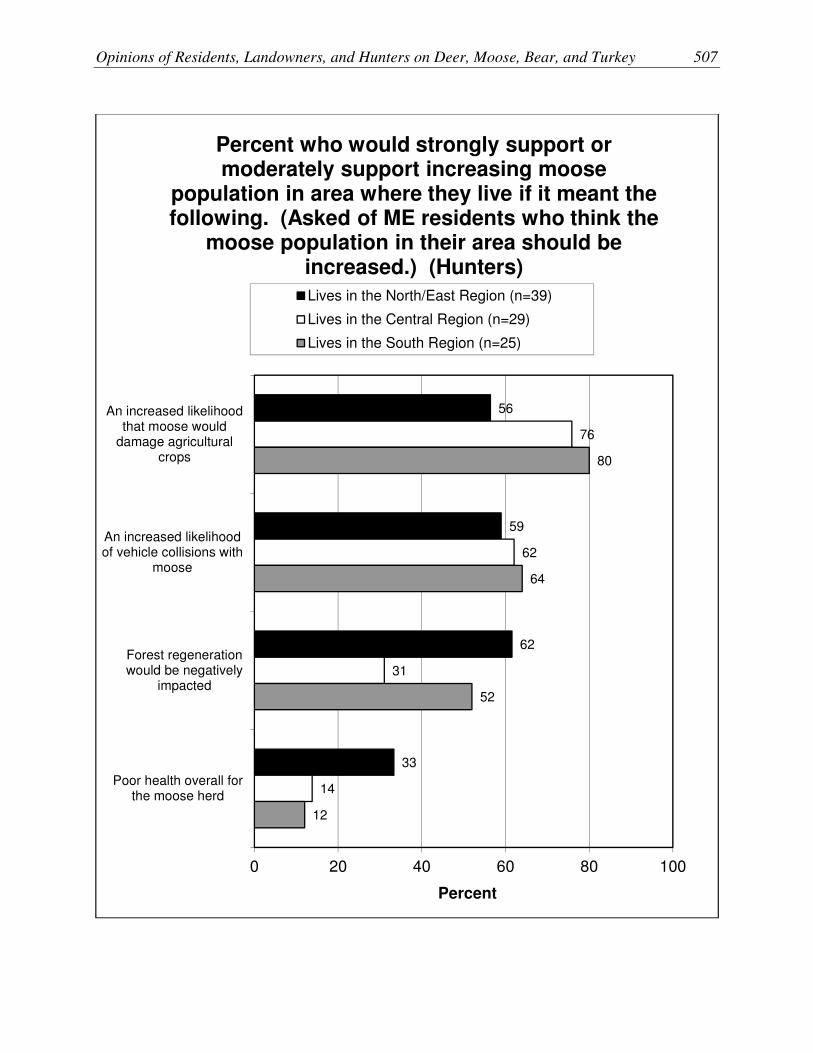
Opinions of Residents, Landowners, and Hunters on Deer, Moose, Bear, and Turkey 507
56
59
62
33
76
62
31
14
80
64
52
12
0 20 40 60 80 100
An increased likelihoodthat moose would
damage agriculturalcrops
An increased likelihoodof vehicle collisions with
moose
Forest regenerationwould be negatively
impacted
Poor health overall forthe moose herd
Percent
Percent who would strongly support or moderately support increasing moose
population in area where they live if it meant the following. (Asked of ME residents who think the
moose population in their area should be increased.) (Hunters)
Lives in the North/East Region (n=39)
Lives in the Central Region (n=29)
Lives in the South Region (n=25)

508 Responsive Management
64
31
31
28
76
52
21
14
88
36
24
12
0 20 40 60 80 100
Poor health overall forthe moose herd
Forest regenerationwould be negatively
impacted
An increased likelihoodof vehicle collisions with
moose
An increased likelihoodthat moose would
damage agriculturalcrops
Percent
Percent who would moderately oppose or strongly oppose increasing moose population in area where they live if it meant the following.
(Asked of ME residents who think the moose population in their area should be increased.)
(Hunters)
Lives in the North/East Region (n=39)
Lives in the Central Region (n=29)
Lives in the South Region (n=25)

Opinions of Residents, Landowners, and Hunters on Deer, Moose, Bear, and Turkey 509
38
10
18
10
62
28
17
3
56
12
12
8
0 20 40 60 80 100
Poor health overall forthe moose herd
Forest regenerationwould be negatively
impacted
An increased likelihoodof vehicle collisions with
moose
An increased likelihoodthat moose would
damage agriculturalcrops
Percent
Percent who would strongly oppose increasing moose population in area where they live if it meant the following. (Asked of ME residents who think the moose population in their area
should be increased.) (Hunters)
Lives in the North/East Region (n=39)
Lives in the Central Region (n=29)
Lives in the South Region (n=25)
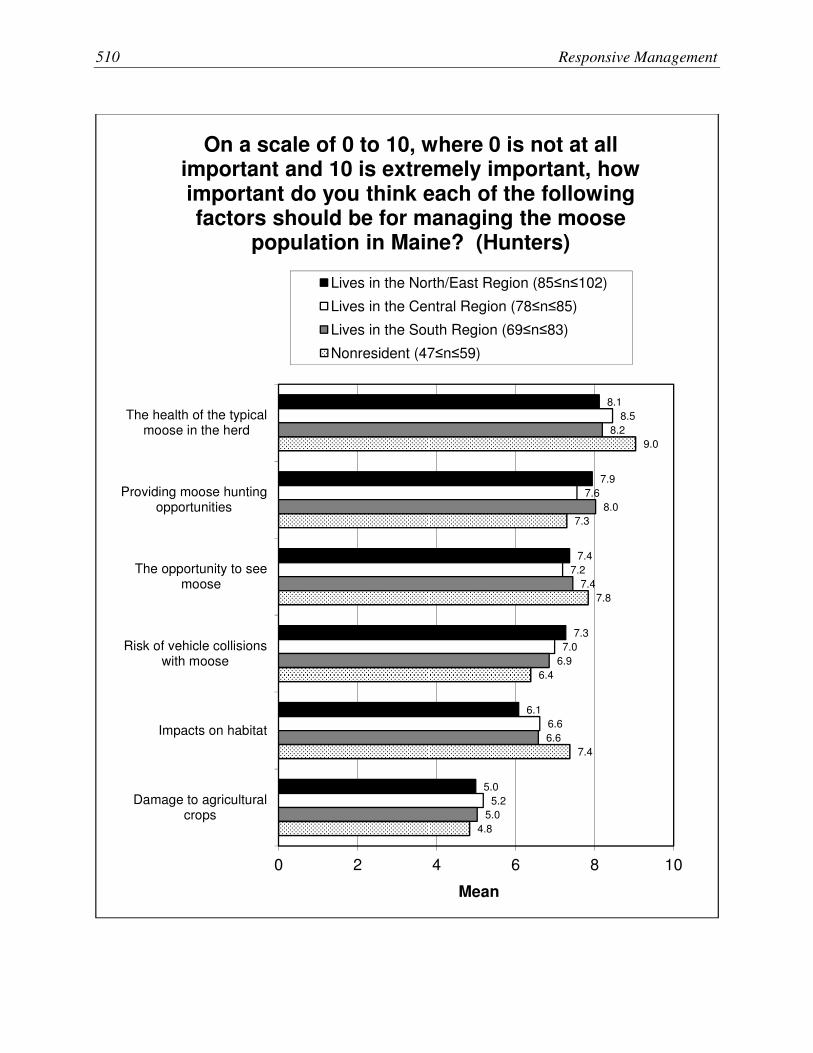
510 Responsive Management
8.1
7.9
7.4
7.3
6.1
5.0
8.5
7.6
7.2
7.0
6.6
5.2
8.2
8.0
7.4
6.9
6.6
5.0
9.0
7.3
7.8
6.4
7.4
4.8
0 2 4 6 8 10
The health of the typicalmoose in the herd
Providing moose huntingopportunities
The opportunity to seemoose
Risk of vehicle collisionswith moose
Impacts on habitat
Damage to agriculturalcrops
Mean
On a scale of 0 to 10, where 0 is not at all important and 10 is extremely important, how important do you think each of the following factors should be for managing the moose
population in Maine? (Hunters)
Lives in the North/East Region (85≤n≤102)
Lives in the Central Region (78≤n≤85)
Lives in the South Region (69≤n≤83)
Nonresident (47≤n≤59)

Opinions of Residents, Landowners, and Hunters on Deer, Moose, Bear, and Turkey 511
89
9
1
0
1
0
86
9
1
2
2
0
89
8
1
1
1
0
92
6
1
1
0
1
0 20 40 60 80 100
Strongly support
Moderatelysupport
Neither supportnor oppose
Moderatelyoppose
Strongly oppose
Don't know
Percent
Do you support or oppose legal hunting as a method to help manage the moose populations
in Maine? (Hunters)
Lives in the North/EastRegion (n=262)
Lives in the Central Region(n=258)
Lives in the South Region(n=256)
Nonresident (n=180)

512 Responsive Management
51
25
6
5
9
4
57
24
3
4
7
4
55
25
7
3
5
4
64
19
8
1
3
4
0 20 40 60 80 100
Strongly support
Moderatelysupport
Neither supportnor oppose
Moderatelyoppose
Strongly oppose
Don't know
Percent
Would you support or oppose adjusting the hunting harvest of female moose to help
minimize the impacts of parasites and improve the overall health of the moose population, even
if it meant fewer moose in Maine? (Hunters)
Lives in the North/EastRegion (n=262)
Lives in the Central Region(n=258)
Lives in the South Region(n=256)
Nonresident (n=180)

Opinions of Residents, Landowners, and Hunters on Deer, Moose, Bear, and Turkey 513
33
27
12
2
3
23
43
22
10
4
7
14
60
19
5
4
8
4
51
17
8
3
3
19
0 20 40 60 80 100
Strongly support
Moderatelysupport
Neither supportnor oppose
Moderatelyoppose
Strongly oppose
Don't know
Percent
Do you support or oppose the current moose hunting season in Southern Maine? (Hunters)
Lives in the North/EastRegion (n=262)
Lives in the Central Region(n=258)
Lives in the South Region(n=256)
Nonresident (n=180)
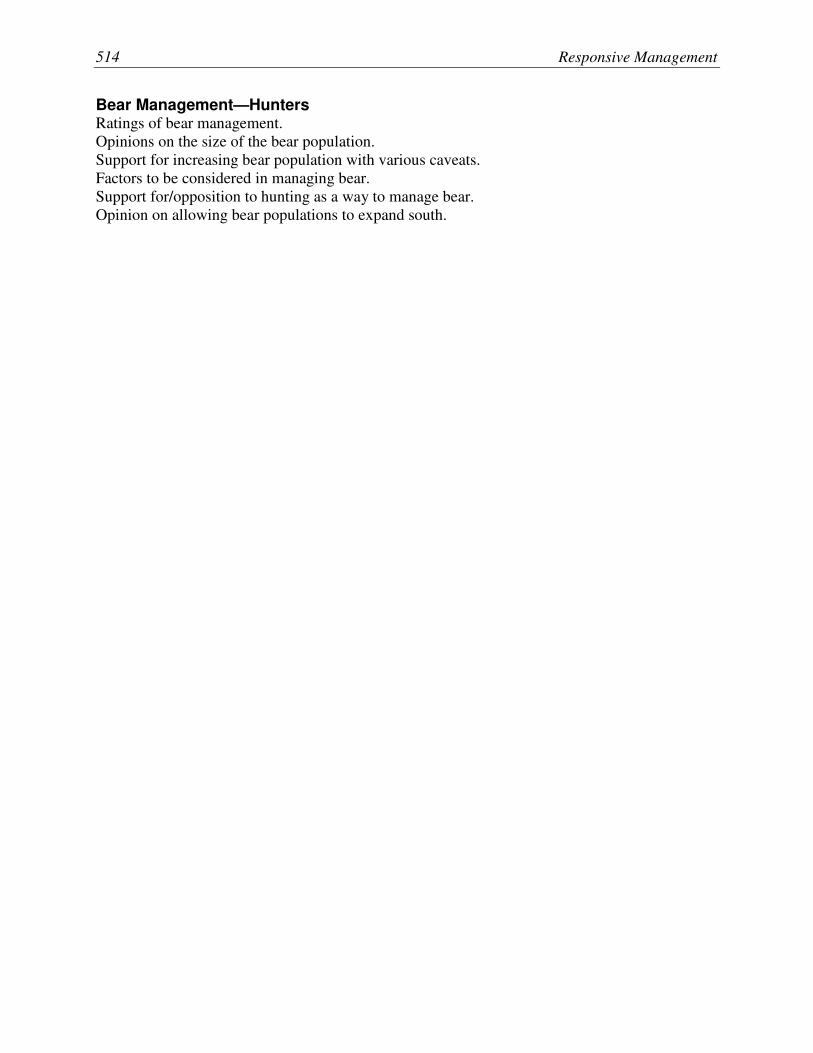
514 Responsive Management
Bear Management—Hunters Ratings of bear management.
Opinions on the size of the bear population.
Support for increasing bear population with various caveats.
Factors to be considered in managing bear.
Support for/opposition to hunting as a way to manage bear.
Opinion on allowing bear populations to expand south.
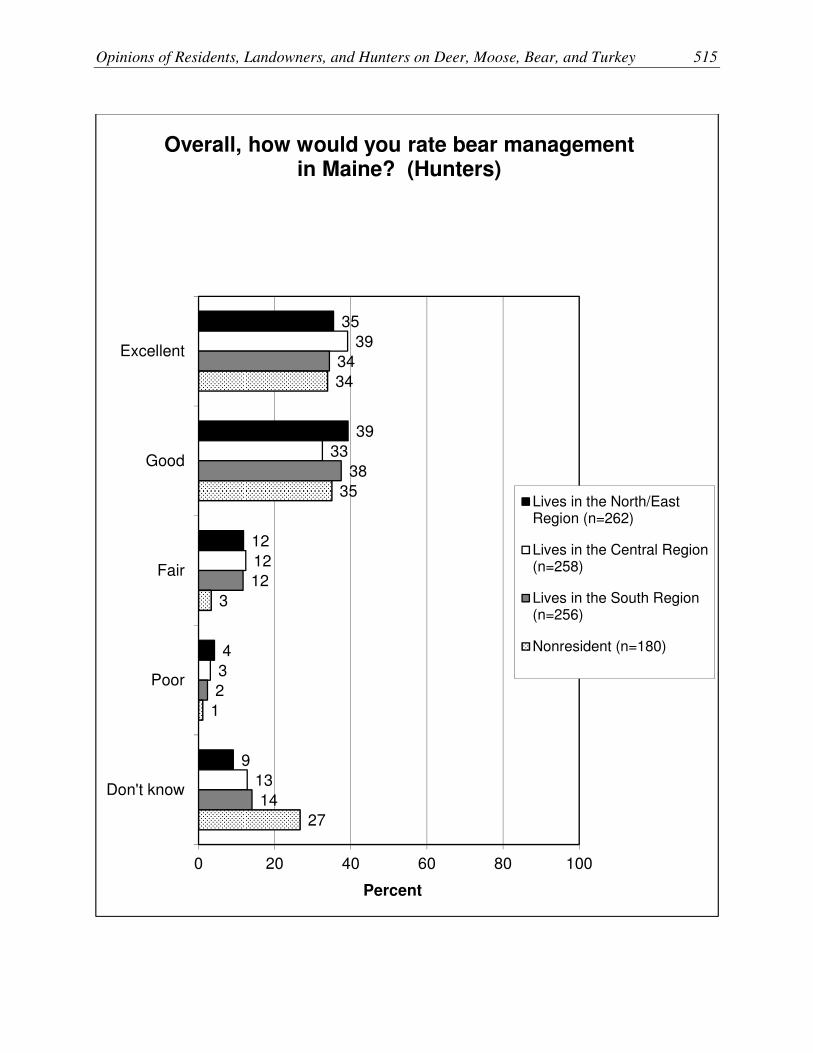
Opinions of Residents, Landowners, and Hunters on Deer, Moose, Bear, and Turkey 515
35
39
12
4
9
39
33
12
3
13
34
38
12
2
14
34
35
3
1
27
0 20 40 60 80 100
Excellent
Good
Fair
Poor
Don't know
Percent
Overall, how would you rate bear management in Maine? (Hunters)
Lives in the North/EastRegion (n=262)
Lives in the Central Region(n=258)
Lives in the South Region(n=256)
Nonresident (n=180)

516 Responsive Management
38
36
8
3
15
36
34
11
3
15
33
37
12
2
16
0 20 40 60 80 100
Excellent
Good
Fair
Poor
Don't know
Percent
Overall, how would you rate bear management in Maine? (Hunters)
Most often hunts in theNorth/East Region (n=396)
Most often hunts in theCentral Region (n=326)
Most often hunts in the SouthRegion (n=234)

Opinions of Residents, Landowners, and Hunters on Deer, Moose, Bear, and Turkey 517
8
74
14
4
1
7
70
4
18
1
10
56
2
31
2
0 20 40 60 80 100
Increased
Remain the same
Decreased
There are no bearin the area
Don't know
Percent
In your opinion, should the bear population in the area where you live be increased, remain the same, or be decreased? Or are there no bear in
the area where you live? (Asked of Maine residents.) (Hunters)
Lives in the North/EastRegion (n=138)
Lives in the Central Region(n=137)
Lives in the South Region(n=125)
518 Responsive Management
64
36
18
36
18
27
18
45
0
78
44
56
44
56
33
44
33
33
75
42
42
33
17
33
25
17
17
0 20 40 60 80 100
Additional or special bear hunting seasons hadto be opened to manage the bear population
Private citizens would be required to resolvebear nuisance issues on their own
Private citizens would be required to purchasebear-resistant garbage containers
Government staff would need to spend moretime on bear nuisance or conflict complaints
An increased risk to public safety
More bears had to be killed in response toconflicts
An increased likelihood that bear would damageagricultural crops, gardens, and beehives
Increased likelihood that bear would damageprivate property in general
Poor health overall for the bear population
Percent
Percent who would strongly support increasing bear population in area where they live if it
meant the following. (Asked of ME residents who think the bear population in their area
should be increased.) (Hunters)
Lives in the North/East Region (n=11)
Lives in the Central Region (n=9)
Lives in the South Region (n=12)

Opinions of Residents, Landowners, and Hunters on Deer, Moose, Bear, and Turkey 519
91
55
55
55
45
64
45
45
9
100
78
67
67
78
78
78
67
33
83
67
67
58
50
33
42
50
25
0 20 40 60 80 100
Additional or special bear hunting seasons had tobe opened to manage the bear population
More bears had to be killed in response toconflicts
Private citizens would be required to resolve bearnuisance issues on their own
Increased likelihood that bear would damageprivate property in general
Government staff would need to spend more timeon bear nuisance or conflict complaints
An increased risk to public safety
Private citizens would be required to purchasebear-resistant garbage containers
An increased likelihood that bear would damageagricultural crops, gardens, and beehives
Poor health overall for the bear population
Percent
Percent who would strongly support or moderately support increasing bear population in area where they live if it meant the following.
(Asked of ME residents who think the bear population in their area should be increased.)
(Hunters)
Lives in the North/East Region (n=11)
Lives in the Central Region (n=9)
Lives in the South Region (n=12)

520 Responsive Management
82
55
36
55
55
36
36
27
9
56
22
22
22
22
22
22
22
0
67
42
50
33
25
33
25
25
8
0 20 40 60 80 100
Poor health overall for the bear population
An increased likelihood that bear would damageagricultural crops, gardens, and beehives
An increased risk to public safety
Private citizens would be required to purchasebear-resistant garbage containers
Government staff would need to spend moretime on bear nuisance or conflict complaints
Increased likelihood that bear would damageprivate property in general
Private citizens would be required to resolvebear nuisance issues on their own
More bears had to be killed in response toconflicts
Additional or special bear hunting seasons hadto be opened to manage the bear population
Percent
Percent who would moderately oppose or strongly oppose increasing bear population in area where they live if it meant the following. (Asked of ME residents who think the bear
population in their area should be increased.) (Hunters)
Lives in the North/East Region (n=11)
Lives in the Central Region (n=9)
Lives in the South Region (n=12)
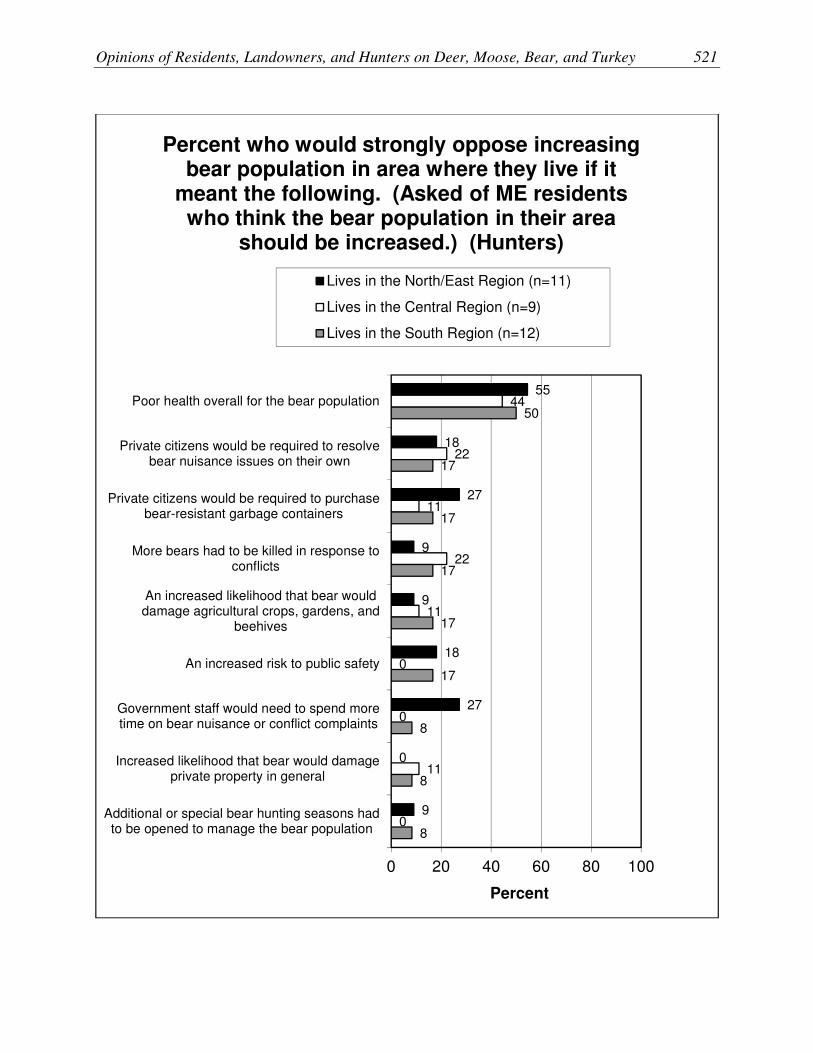
Opinions of Residents, Landowners, and Hunters on Deer, Moose, Bear, and Turkey 521
55
18
27
9
9
18
27
0
9
44
22
11
22
11
0
0
11
0
50
17
17
17
17
17
8
8
8
0 20 40 60 80 100
Poor health overall for the bear population
Private citizens would be required to resolvebear nuisance issues on their own
Private citizens would be required to purchasebear-resistant garbage containers
More bears had to be killed in response toconflicts
An increased likelihood that bear woulddamage agricultural crops, gardens, and
beehives
An increased risk to public safety
Government staff would need to spend moretime on bear nuisance or conflict complaints
Increased likelihood that bear would damageprivate property in general
Additional or special bear hunting seasons hadto be opened to manage the bear population
Percent
Percent who would strongly oppose increasing bear population in area where they live if it
meant the following. (Asked of ME residents who think the bear population in their area
should be increased.) (Hunters)
Lives in the North/East Region (n=11)
Lives in the Central Region (n=9)
Lives in the South Region (n=12)

522 Responsive Management
8.0
8.0
5.3
5.3
5.0
4.5
3.9
3.6
8.6
7.9
5.5
5.4
5.3
4.5
3.7
3.9
8.2
7.9
6.1
5.1
5.1
4.4
4.5
3.6
8.7
8.7
6.5
6.2
5.8
5.5
4.7
4.9
0 2 4 6 8 10
The health of the typicalbear
Providing bear huntingopportunities
Risks to public safety
Impacts on other wildlife
Risk to pets or livestock
Damage to agricultural crops
Risk of vehicle collisions withbear
Damage to gardens
Mean
On a scale of 0 to 10, where 0 is not at all important and 10 is extremely important, how important do you think each of the following
factors should be for managing the bear population in Maine? (Hunters)
Lives in the North/East Region (80≤n≤89)
Lives in the Central Region (68≤n≤94)
Lives in the South Region (68≤n≤84)
Nonresident (43≤n≤57)

Opinions of Residents, Landowners, and Hunters on Deer, Moose, Bear, and Turkey 523
35
24
10
13
10
8
36
24
6
17
13
4
36
28
9
10
14
2
52
21
8
6
9
4
0 20 40 60 80 100
Strongly support
Moderatelysupport
Neither supportnor oppose
Moderatelyoppose
Strongly oppose
Don't know
Percent
Do you support or oppose allowing the bear population to expand further into central and
southern Maine? (Hunters)
Lives in the North/EastRegion (n=262)
Lives in the Central Region(n=258)
Lives in the South Region(n=256)
Nonresident (n=180)

524 Responsive Management
Turkey Management—Hunters Ratings of turkey management.
Opinions on the size of the turkey population.
Support for increasing turkey population with various caveats.
Factors to be considered in managing turkey.
Support for/opposition to hunting as a way to manage turkey.
Opinion on methods to control turkey if they become overabundant.

Opinions of Residents, Landowners, and Hunters on Deer, Moose, Bear, and Turkey 525
20
36
20
10
14
24
33
18
19
7
34
36
14
13
4
17
32
7
3
42
0 20 40 60 80 100
Excellent
Good
Fair
Poor
Don't know
Percent
Overall, how would you rate turkey management in Maine? (Hunters)
Lives in the North/EastRegion (n=262)
Lives in the Central Region(n=258)
Lives in the South Region(n=256)
Nonresident (n=180)

526 Responsive Management
18
36
14
9
23
25
33
17
15
11
33
33
14
14
6
0 20 40 60 80 100
Excellent
Good
Fair
Poor
Don't know
Percent
Overall, how would you rate turkey management in Maine? (Hunters)
Most often hunts in theNorth/East Region (n=396)
Most often hunts in theCentral Region (n=326)
Most often hunts in the SouthRegion (n=234)

Opinions of Residents, Landowners, and Hunters on Deer, Moose, Bear, and Turkey 527
30
41
20
8
1
8
53
35
3
1
10
57
32
1
0
0 20 40 60 80 100
Increased
Remain the same
Decreased
There are noturkey in the area
Don't know
Percent
In your opinion, should the turkey population in the area where you live be increased, remain the same, or be decreased? Or are there no turkey
in the area where you live? (Asked of Maine residents.) (Hunters)
Lives in the North/EastRegion (n=118)
Lives in the Central Region(n=133)
Lives in the South Region(n=135)

528 Responsive Management
46
26
20
14
14
6
3
73
45
27
27
27
18
18
62
38
62
31
15
38
15
0 20 40 60 80 100
Private citizens would be required to resolveturkey nuisance issues on their own
An increase in predator populations, such asbobcat or coyotes
An increased likelihood that turkey woulddamage gardens or landscaping
An increased likelihood that turkey woulddamage agricultural crops
That Department biologists would spend moretime on turkey management and less time on
other species
Poor health overall for the turkey population
More turkey would die from starvation duringwinter
Percent
Percent who would strongly support increasing turkey population in area where they live if it meant the following. (Asked of ME residents who think the turkey population in their area
should be increased.) (Hunters)
Lives in the North/East Region (n=35)
Lives in the Central Region (n=11)
Lives in the South Region (n=13)

Opinions of Residents, Landowners, and Hunters on Deer, Moose, Bear, and Turkey 529
71
63
54
57
49
20
20
91
45
45
45
45
27
27
69
69
62
54
38
62
31
0 20 40 60 80 100
Private citizens would be required to resolveturkey nuisance issues on their own
An increased likelihood that turkey would damagegardens or landscaping
An increased likelihood that turkey would damageagricultural crops
An increase in predator populations, such asbobcat or coyotes
That Department biologists would spend moretime on turkey management and less time on
other species
Poor health overall for the turkey population
More turkey would die from starvation duringwinter
Percent
Percent who would strongly support or moderately support increasing turkey
population in area where they live if it meant the following. (Asked of ME residents who think the
turkey population in their area should be increased.) (Hunters)
Lives in the North/East Region (n=35)
Lives in the Central Region (n=11)
Lives in the South Region (n=13)

530 Responsive Management
80
80
43
34
34
31
23
64
64
27
36
45
27
9
62
38
38
38
23
38
31
0 20 40 60 80 100
More turkey would die from starvation duringwinter
Poor health overall for the turkey population
An increased likelihood that turkey would damageagricultural crops
That Department biologists would spend moretime on turkey management and less time on
other species
An increased likelihood that turkey would damagegardens or landscaping
An increase in predator populations, such asbobcat or coyotes
Private citizens would be required to resolveturkey nuisance issues on their own
Percent
Percent who would moderately oppose or strongly oppose increasing turkey population in
area where they live if it meant the following. (Asked of ME residents who think the turkey
population in their area should be increased.) (Hunters)
Lives in the North/East Region (n=35)
Lives in the Central Region (n=11)
Lives in the South Region (n=13)
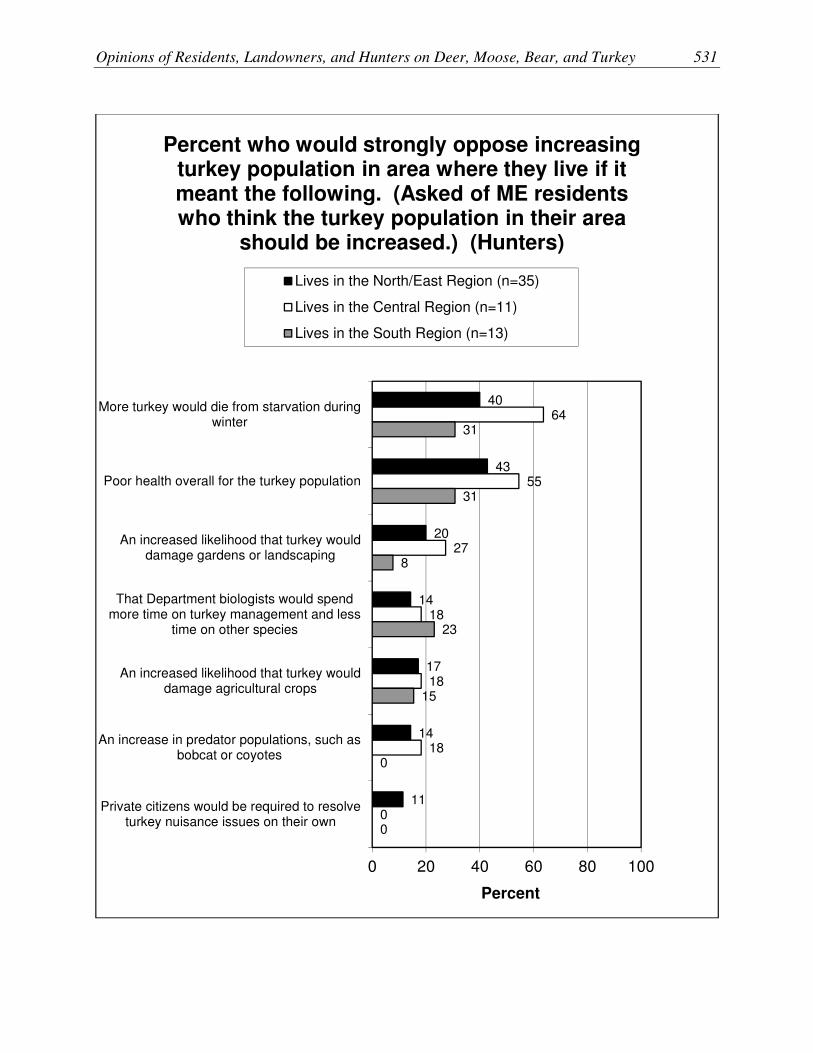
Opinions of Residents, Landowners, and Hunters on Deer, Moose, Bear, and Turkey 531
40
43
20
14
17
14
11
64
55
27
18
18
18
0
31
31
8
23
15
0
0
0 20 40 60 80 100
More turkey would die from starvation duringwinter
Poor health overall for the turkey population
An increased likelihood that turkey woulddamage gardens or landscaping
That Department biologists would spendmore time on turkey management and less
time on other species
An increased likelihood that turkey woulddamage agricultural crops
An increase in predator populations, such asbobcat or coyotes
Private citizens would be required to resolveturkey nuisance issues on their own
Percent
Percent who would strongly oppose increasing turkey population in area where they live if it meant the following. (Asked of ME residents who think the turkey population in their area
should be increased.) (Hunters)
Lives in the North/East Region (n=35)
Lives in the Central Region (n=11)
Lives in the South Region (n=13)

532 Responsive Management
7.6
7.5
7.3
6.7
5.8
5.5
8.8
7.7
6.6
7.3
6.0
5.5
8.0
8.2
7.1
6.4
6.0
5.0
8.2
8.1
7.0
5.3
4.9
3.7
0 2 4 6 8 10
Providing turkey huntingopportunities
The health of the typicalturkey in the population
The opportunity to see wildturkey
Damage to agriculturalcrops
Damage to gardens
The risk of vehicle collisionswith turkey
Mean
On a scale of 0 to 10, where 0 is not at all important and 10 is extremely important, how important do you think each of the following factors should be for managing the turkey
population in Maine? (Hunters)
Lives in the North/East Region (72≤n≤82)
Lives in the Central Region (82≤n≤94)
Lives in the South Region (77≤n≤105)
Nonresident (53≤n≤68)

Opinions of Residents, Landowners, and Hunters on Deer, Moose, Bear, and Turkey 533
85
12
1
0
1
1
94
4
0
1
1
0
94
6
0
0
0
0
91
7
1
1
0
1
0 20 40 60 80 100
Strongly support
Moderatelysupport
Neither supportnor oppose
Moderatelyoppose
Strongly oppose
Don't know
Percent
Do you support or oppose legal hunting as a method to help manage the turkey population in
Maine? (Hunters)
Lives in the North/EastRegion (n=262)
Lives in the Central Region(n=258)
Lives in the South Region(n=256)
Nonresident (n=180)
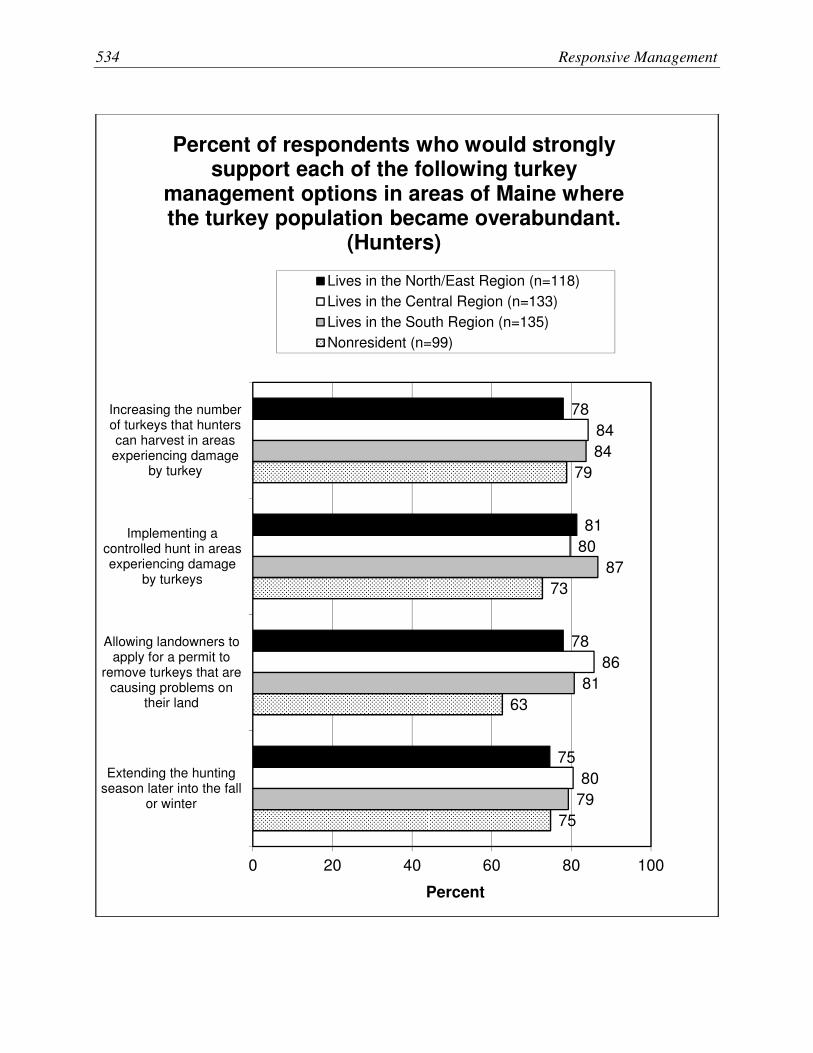
534 Responsive Management
78
81
78
75
84
80
86
80
84
87
81
79
79
73
63
75
0 20 40 60 80 100
Increasing the numberof turkeys that hunterscan harvest in areasexperiencing damage
by turkey
Implementing acontrolled hunt in areasexperiencing damage
by turkeys
Allowing landowners toapply for a permit to
remove turkeys that arecausing problems on
their land
Extending the huntingseason later into the fall
or winter
Percent
Percent of respondents who would strongly support each of the following turkey
management options in areas of Maine where the turkey population became overabundant.
(Hunters)
Lives in the North/East Region (n=118)
Lives in the Central Region (n=133)
Lives in the South Region (n=135)
Nonresident (n=99)

Opinions of Residents, Landowners, and Hunters on Deer, Moose, Bear, and Turkey 535
91
96
92
91
95
92
95
90
93
96
93
89
92
87
79
90
0 20 40 60 80 100
Increasing the number ofturkeys that hunters can
harvest in areasexperiencing damage by
turkey
Implementing a controlledhunt in areas
experiencing damage byturkeys
Allowing landowners toapply for a permit to
remove turkeys that arecausing problems on their
land
Extending the huntingseason later into the fall
or winter
Percent
Percent of respondents who would strongly support or moderately support each of the
following turkey management options in areas of Maine where the turkey population became
overabundant. (Hunters)
Lives in the North/East Region (n=118)
Lives in the Central Region (n=133)
Lives in the South Region (n=135)
Nonresident (n=99)
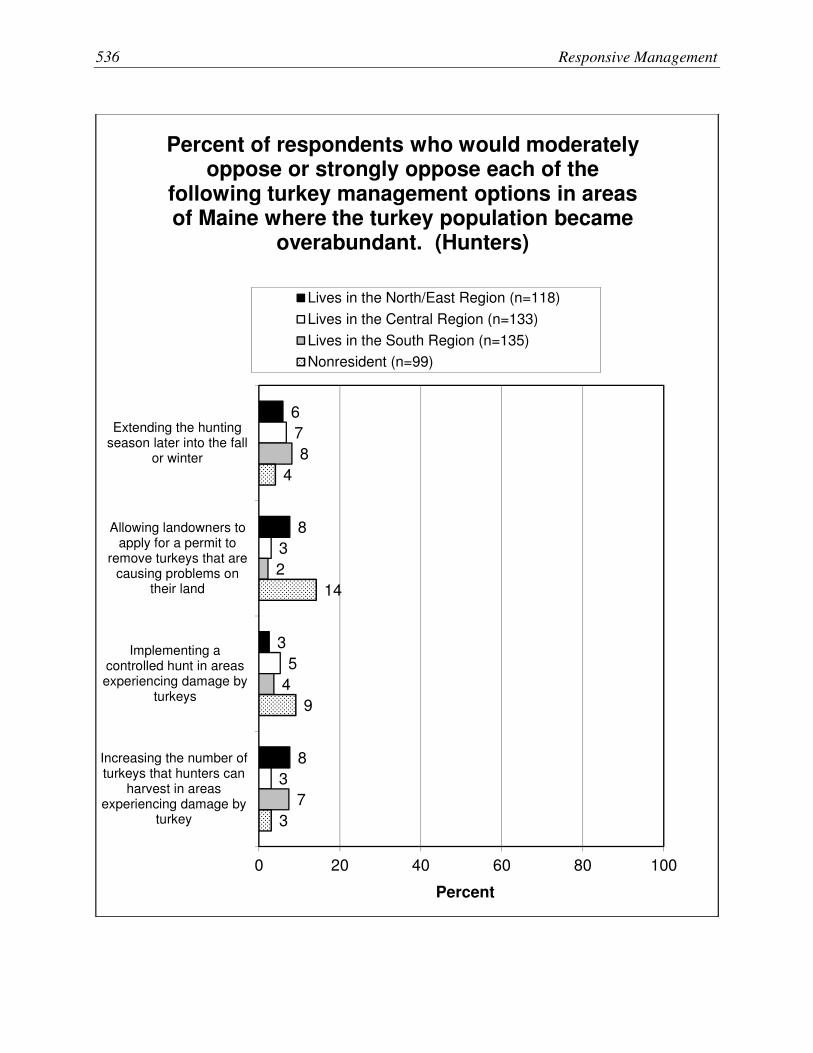
536 Responsive Management
6
8
3
8
7
3
5
3
8
2
4
7
4
14
9
3
0 20 40 60 80 100
Extending the huntingseason later into the fall
or winter
Allowing landowners toapply for a permit to
remove turkeys that arecausing problems on
their land
Implementing acontrolled hunt in areasexperiencing damage by
turkeys
Increasing the number ofturkeys that hunters can
harvest in areasexperiencing damage by
turkey
Percent
Percent of respondents who would moderately oppose or strongly oppose each of the
following turkey management options in areas of Maine where the turkey population became
overabundant. (Hunters)
Lives in the North/East Region (n=118)
Lives in the Central Region (n=133)
Lives in the South Region (n=135)
Nonresident (n=99)

Opinions of Residents, Landowners, and Hunters on Deer, Moose, Bear, and Turkey 537
4
2
3
3
2
4
3
2
1
3
4
6
10
4
2
1
0 20 40 60 80 100
Allowing landowners toapply for a permit to
remove turkeys that arecausing problems on
their land
Implementing acontrolled hunt in areasexperiencing damage
by turkeys
Extending the huntingseason later into the fall
or winter
Increasing the numberof turkeys that hunterscan harvest in areasexperiencing damage
by turkey
Percent
Percent of respondents who would strongly oppose each of the following turkey
management options in areas of Maine where the turkey population became overabundant.
(Hunters)Lives in the North/East Region (n=118)
Lives in the Central Region (n=133)
Lives in the South Region (n=135)
Nonresident (n=99)

538 Responsive Management
Demographic Data—Hunters Gender.
Age.
Education.
Residential character of where residence is located.
88
12
87
13
90
10
97
3
0 20 40 60 80 100
Male
Female
Percent
Respondent's gender (not asked; observed by interviewer). (Hunters)
Lives in the North/EastRegion (n=262)
Lives in the Central Region(n=258)
Lives in the South Region(n=256)
Nonresident (n=180)
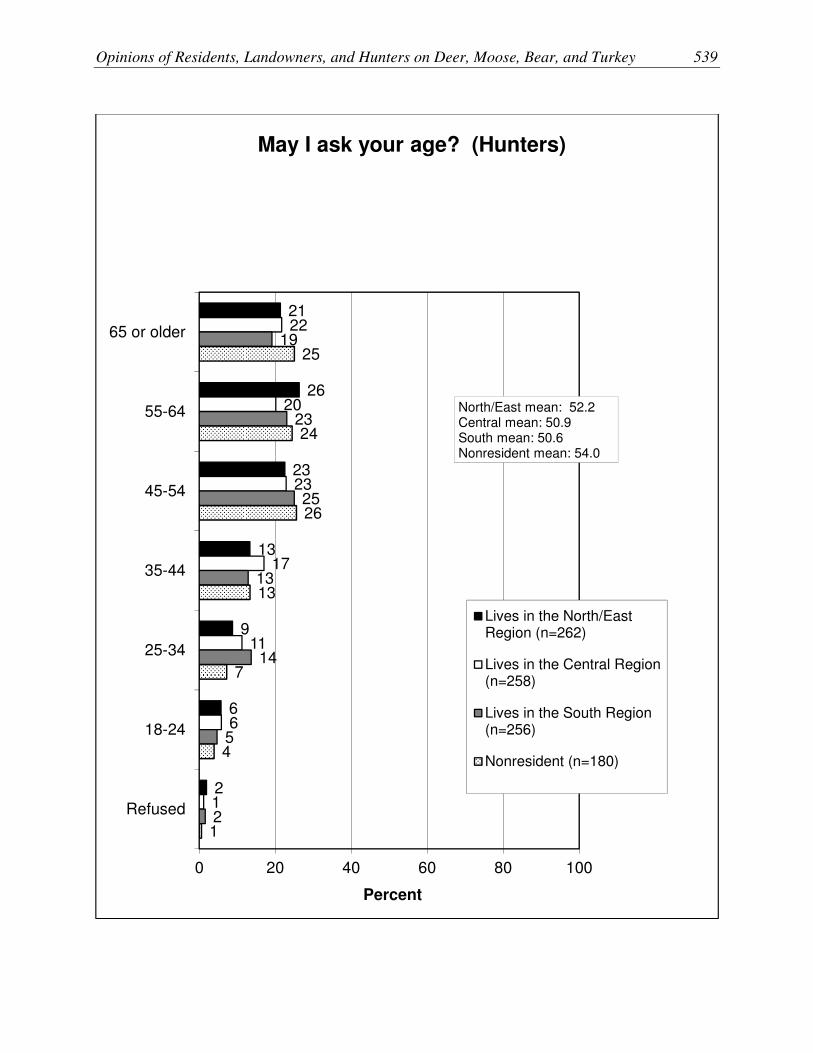
Opinions of Residents, Landowners, and Hunters on Deer, Moose, Bear, and Turkey 539
21
26
23
13
9
6
2
22
20
23
17
11
6
1
19
23
25
13
14
5
2
25
24
26
13
7
4
1
0 20 40 60 80 100
65 or older
55-64
45-54
35-44
25-34
18-24
Refused
Percent
May I ask your age? (Hunters)
Lives in the North/EastRegion (n=262)
Lives in the Central Region(n=258)
Lives in the South Region(n=256)
Nonresident (n=180)
North/East mean: 52.2Central mean: 50.9South mean: 50.6Nonresident mean: 54.0
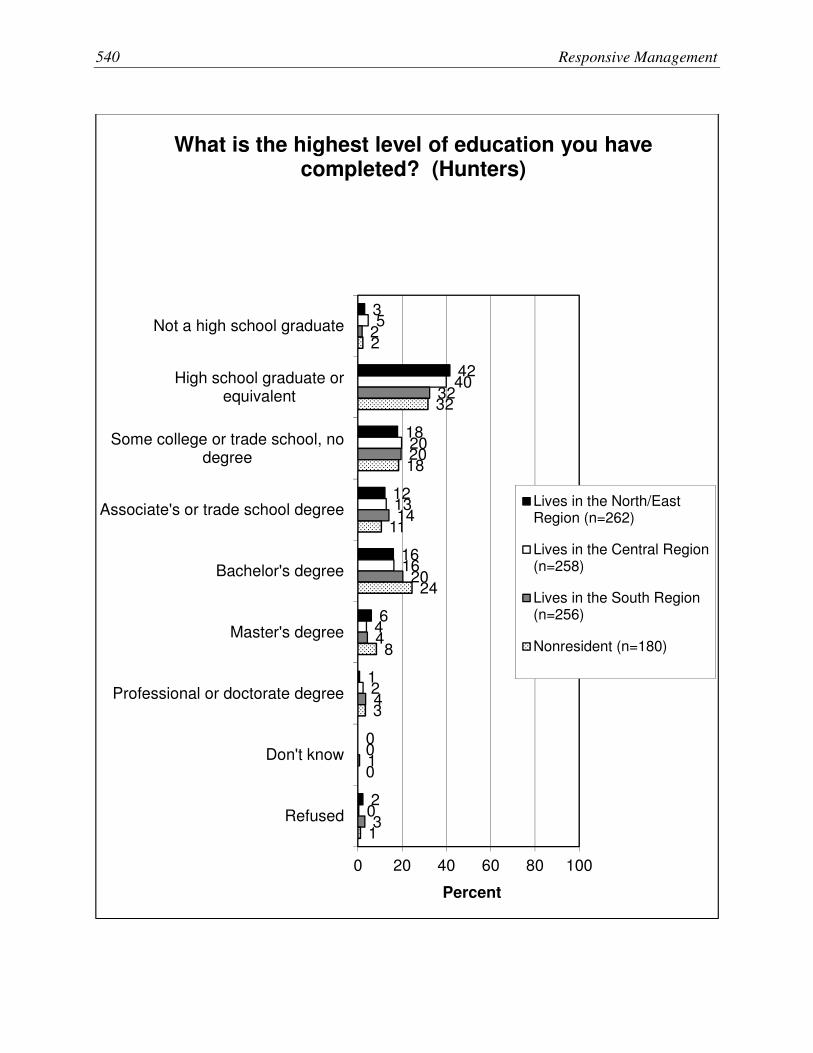
540 Responsive Management
3
42
18
12
16
6
1
0
2
5
40
20
13
16
4
2
0
0
2
32
20
14
20
4
4
1
3
2
32
18
11
24
8
3
0
1
0 20 40 60 80 100
Not a high school graduate
High school graduate orequivalent
Some college or trade school, nodegree
Associate's or trade school degree
Bachelor's degree
Master's degree
Professional or doctorate degree
Don't know
Refused
Percent
What is the highest level of education you have completed? (Hunters)
Lives in the North/EastRegion (n=262)
Lives in the Central Region(n=258)
Lives in the South Region(n=256)
Nonresident (n=180)
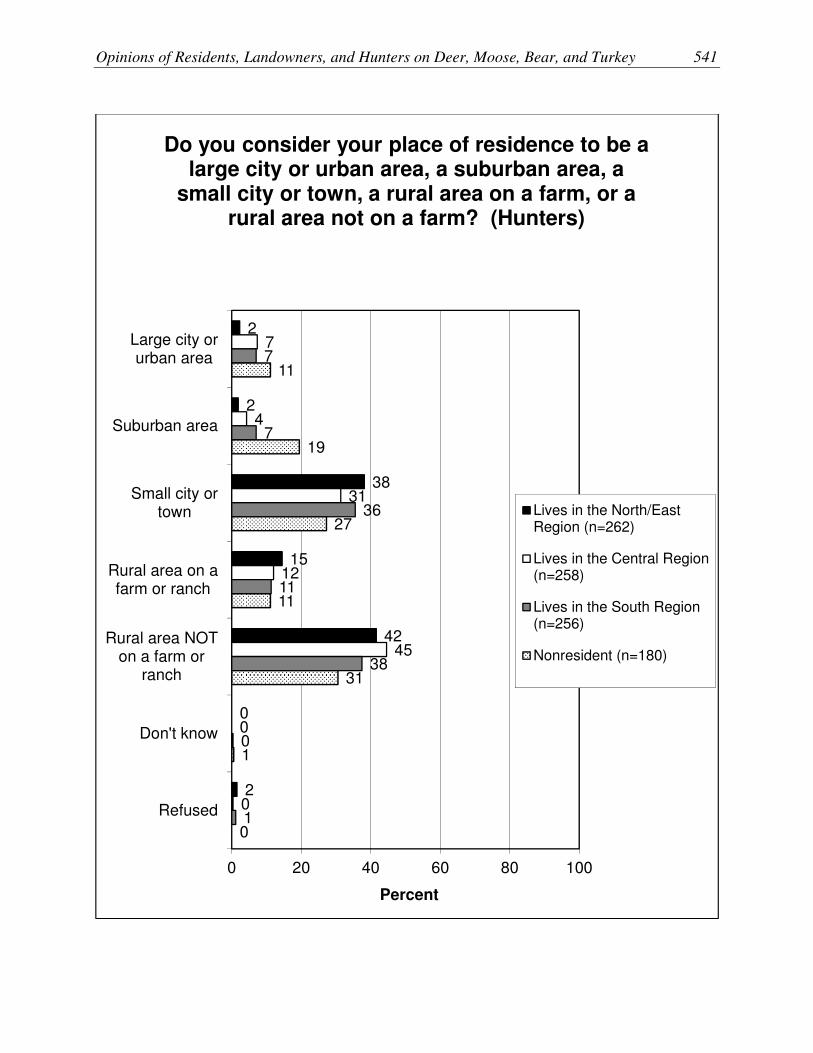
Opinions of Residents, Landowners, and Hunters on Deer, Moose, Bear, and Turkey 541
2
2
38
15
42
0
2
7
4
31
12
45
0
0
7
7
36
11
38
0
1
11
19
27
11
31
1
0
0 20 40 60 80 100
Large city orurban area
Suburban area
Small city ortown
Rural area on afarm or ranch
Rural area NOTon a farm or
ranch
Don't know
Refused
Percent
Do you consider your place of residence to be a large city or urban area, a suburban area, a
small city or town, a rural area on a farm, or a rural area not on a farm? (Hunters)
Lives in the North/EastRegion (n=262)
Lives in the Central Region(n=258)
Lives in the South Region(n=256)
Nonresident (n=180)

542 Responsive Management
ABOUT RESPONSIVE MANAGEMENT
Responsive Management is an internationally recognized public opinion and attitude survey research
firm specializing in natural resource and outdoor recreation issues. Our mission is to help natural
resource and outdoor recreation agencies and organizations better understand and work with their
constituents, customers, and the public.
Utilizing our in-house, full-service telephone, mail, and web-based survey facilities with 50
professional interviewers, we have conducted more than 1,000 telephone surveys, mail surveys,
personal interviews, and focus groups, as well as numerous marketing and communication plans,
needs assessments, and program evaluations.
Clients include the federal natural resource and land management agencies, most state fish and
wildlife agencies, state departments of natural resources, environmental protection agencies, state
park agencies, tourism boards, most of the major conservation and sportsmen’s organizations, and
numerous private businesses. Responsive Management also collects attitude and opinion data for
many of the nation’s top universities.
Specializing in research on public attitudes toward natural resource and outdoor recreation issues,
Responsive Management has completed a wide range of projects during the past 25 years, including
dozens of studies of hunters, anglers, wildlife viewers, boaters, park visitors, historic site visitors,
hikers, birdwatchers, campers, and rock climbers. Responsive Management has conducted studies
on endangered species; waterfowl and wetlands; and the reintroduction of large predators such as
wolves, grizzly bears, and the Florida panther.
Responsive Management has assisted with research on numerous natural resource ballot initiatives
and referenda and has helped agencies and organizations find alternative funding and increase their
membership and donations. Additionally, Responsive Management has conducted major
organizational and programmatic needs assessments to assist natural resource agencies and
organizations in developing more effective programs based on a solid foundation of fact.

Opinions of Residents, Landowners, and Hunters on Deer, Moose, Bear, and Turkey 543
Responsive Management has conducted research on public attitudes toward natural resources and
outdoor recreation in almost every state in the United States, as well as in Canada, Australia, the
United Kingdom, France, Germany, and Japan. Responsive Management has also conducted focus
groups and personal interviews with residents of the African countries of Algeria, Cameroon,
Mauritius, Namibia, South Africa, Tanzania, Zambia, and Zimbabwe.
Responsive Management routinely conducts surveys in Spanish and has conducted surveys in
Chinese, Korean, Japanese and Vietnamese and has completed numerous studies with specific target
audiences, including Hispanics; African-Americans; Asians; women; children; senior citizens; urban,
suburban, and rural residents; large landowners; and farmers.
Responsive Management’s research has been upheld in U.S. District Courts; used in peer-reviewed
journals; and presented at major natural resource, fish and wildlife, and outdoor recreation
conferences across the world. Company research has been featured in most of the nation’s major
media, including CNN, The New York Times, The Wall Street Journal, and on the front pages of USA
Today and The Washington Post. Responsive Management’s research has also been highlighted in
Newsweek magazine.
Visit the Responsive Management website at:
www.responsivemanagement.com