the operating room: it’s a small world (and scale free ... · connections december issue 12...
TRANSCRIPT

Connections
December | Issue 1&2 | Volume 34 | insna.org
The Operating Room: It’s a Small World (and Scale Free Network) After All
Patrick J. TigheUniversity of Florida College of Medicine
Gainesville, Florida
Stephalie Stephanie PatelUniversity of Florida College of Medicine
Gainesville, Florida
Nikolaus GravensteinUniversity of Florida College of Medicine
Gainesville, Florida
Laurie DaviesUniversity of Florida College of Medicine
Gainesville, Florida
Stephen D. LucasUniversity of Florida College of Medicine
Gainesville, Florida
H. Russell BernardUniversity of Florida College of Medicine
Gainesville, Florida
AbstractIntroduction: An operating room’s (OR) organizational behavior, including its susceptibility to certain types of failure, may partially reflect its structural features. We report the results of a structural analysis of a composite OR suite in a tertiary-care teaching hospital. Methods: We conducted a simulation study of the OR interaction network in a 900-bed teaching hospital. A composite OR network was built from a single-day operating room schedule encompassing 32 anesthetizing sites. There were two aims: (1) to compare the composite, or prototypical, OR network to three network types: random, scale-free, and small-world; (2) to calculate the total degree centrality, eigenvector centrality, and betweenness centrality for each node within the prototypical OR network, and to compare these metrics by level of physician training and by OR role. Results: The complete prototypical OR network included 146 nodes linked by 329 edges. Results indicate that the OR is a scale-free network with small-world characteristics. The chief anesthesiologist, OR charge nurse, and recovery room charge nurse had the highest total degree centralities. There were significant differences in total degree centrality scores between nurses and anesthesiologists, nurses and surgeons, and anesthesiologists and surgeons; attending physicians had greater perioperative total degree centrality than did resident physicians. Conclusion: Given the homogeneity of certain scale-free network characteristics throughout nature, such a designation has potentially critical implications for coordinating anesthesiologists and nurses, whose roles will be impacted by the continued growth of operating rooms. These implications will be tested at the next stage of the project.
AuthorsPatrick J. Tighe is an Assistant Professor of Anesthesiology at the University of Florida College of Medicine in Gainesville, Florida.
Sephalie Stephanie Patel is a Resident in Anesthesiology at the University of Florida College of Medicine in Gainesville, Florida.
Nikolaus Gravenstein is a Professor of Anesthesiology at the University of Florida College of Medicine in Gainesville, Florida.
Laurie Davies is an Associate Professor of Anesthesiology at the University of Florida College of Medicine in Gainesville, Florida.
Stephen Lucas is an Assistant Professor of Anesthesiology at the University of Florida College of Medicine in Gainesville, Florida.
H. Russell Bernard is a Professor of Anthropology, emeritus, at the University of Florida College of Liberal Arts and Sciences in Gainesville, Florida.

Connections
insna.org | Volume 34 | Issue 1&2 | December
The Operating Room: It’s a Small World
1. Introduction
“They just got into the vena cava. Can you please send someone to help hang blood?”
“Anesthesia, charge nurse stat to OR 5….Anesthesia, charge nurse stat to OR 5….”
“I have to pee. Can I get a break out?”
“The patient’s tumor is unresectable. We’ll be closing here shortly.”
“Trauma, coming up now.”
“I’m calling to post a heart-lung transplant. Should start around midnight.”
“I think my water just broke. Don’t think I’ll be able to finish this case.”
“I’m calling to post an appendectomy to OR 7…”
Complexity confounds the modern operating room theater. The above eight phone calls offer a glimpse into the incessant communiqués assailing charge nurses and chief anesthesiologists in many hospitals around the world. Responses are often necessary within seconds or minutes. Further complicating matters, these phone calls can arrive in a span of minutes. Even brief periods of unavailability by key personnel can lead to trouble as surgical staff must spend valuable seconds looking up second- and third-tier contact information. Such challenges have led many hospitals to designate specific anesthesiologists and nurses, each equipped with multiple cell phones and beepers, whose role is simply to coordinate the perioperative complexity at hand. Such complexity is frequently cited as a significant hurdle to improving perioperative patient safety (ElBardissi & Sundt, 2012). This complexity may be considered at three levels of analysis: micro (pertaining to small teams of individuals or conceptual entities), meso (pertaining to organizational scales), and macro (pertaining to large populations). Efforts to reduce the
number of perioperative harm events typically focus on actions such as antibiotic timing, temperature regulation, deep vein thrombosis prophylaxis, and more recently, aggregating these micro-level actions through the use of checklists or bundled measures (Haynes, Weiser, Berry, Lipsitz, Breizat, Dellinger, et al. 2009; Stulberg, Delaney, Neuhauser, Aron, Fu, & Koroukian, 2010). Prior work exploring operating room (OR) social networks has mainly focused on micro-level networks, as contrasted with the meso-level network scale investigated here (Chamers, Wilson, Thompson, & Harden, 2012). Anderson and Talsma (2011) demonstrated that team coreness was associated with surgical duration, with cases scheduled earlier in the day demonstrating high coreness of surgical teams. Perhaps not surprisingly, as individuals completed their shifts at disparate times, team coreness diminished throughout the day, a change that was associated with longer surgical duration. This theme was reinforced by the findings of Listyowardojo (2012), whereby more complex surgical procedures were accompanied by increasingly interrelated subgroups of OR team members. Baumgart, Denz, Bender & Schleppers (2009) studied social network analysis effects during the planning phases of an ambulatory surgical center redesign following the physical rearrangement of ORs from a dispersed to a centralized OR layout. They noted that this intervention, while reducing the risk of deviations from standard care practices, nevertheless introduced greater interdependency among staff with increasing errors during handovers. Social network analysis metrics have also been shown to be directly associated with patient outcomes such as adverse drug events and patient falls, although these findings have yet to be applied to perioperative patient populations (Effken, Carley, Gephart, Verran, Banchi, Reminga, & Brewer, 2011). Less is known about meso- and macro-level factors that affect patient safety, but evidence has been building for some time that the structure of meso-scale interactions in a group affects outcomes in epidemiology, defense, logistics, and social media (e.g., Facebook and Twitter) and that these effects can be managed to improve work efficiency (Krackhardt, 1990; Krackhardt & Hanson, 1993; Krebs, 2002; Nakano & White, 2006;
Please send all correspondence to: Patrick J. Tighe, MD, MS, Department of Anesthesiology, University of Florida College of Medicine, PO Box 100254, Gainesville, FL 32610-0254. Telephone: 352-294-5076; Fax: 352-265-8013; e-mail: [email protected]
Acknowledgements Funding provided by NIH K23 GM102697 and the Jerome H. Modell, MD, Endowed Professorship

Connections
December | Issue 1&2 | Volume 34 | insna.org
The Operating Room: It’s a Small World
Small & Chi, 2005; Xu, Hu, & Chen, 2009). The long-term goal of our project is to test whether the structural features of three major network types—random, small-world, scale-free—are associated with perioperative risks in a large, tertiary care teaching hospital. For example, are various OR roles, especially those that are most sensitive to failure, associated with particular measures of centrality? In the current phase of our project, we model the answers to these questions and establish a platform for direct observation of the OR and for analysis at both the micro- and meso-scales of organizational complexity.
2. Methods
Institutional review board approval was not required because this was a simulation study. We conducted a simulation study that involved organizational network analysis of the OR social networks within a 900 bed teaching hospital (UF Health at the University of Florida, Gainesville, Florida).
Description of Operating Room Environment
For each surgery, a patient is cared for by an OR nurse, an anesthesiologist, and a surgeon. In an academic teaching hospital, the anesthesiologist is frequently a resident (e.g, trainee) physician, supervised by a more senior and board-certified attending anesthesiologist. Each attending anesthesiologist may supervise one or two residents. Alternatively, the attending anesthesiologist may supervise up to three or four certified registered nurse anesthetists (CNRAs) or anesthesiology assistants (AAs). The number of residents, CRNAs or AAs supervised depends both upon the type of surgery and medical complexity of the patients. Similarly, the attending surgeon may supervise one or two resident surgeons, again depending upon the type of procedure and medical complexity of the patient. Such divisions of labor are frequently typified; for instance, a general surgeon may supervise two resident surgeons, one performing a straightforward appendectomy and the other a repair of a simple hernia. On the other hand, replacement of a heart valve on cardiopulmonary bypass is a procedure involving intense and continual resident supervision. The lines of communication amongst these team members can also be typified. For instance, the attending surgeon frequently discusses the progress of the surgery with the anesthesiologist and nurse in the OR. The resident anesthesiologist will update his or her attending physician at regular intervals, and the nurse will relate changes to his or her charge nurse. Continuing with this
example, the resident anesthesiologist will typically not need to initiate a discussion with a surgeon in another OR, nor will the circulating nurse need to initiate conversation with the lead anesthesiologist of the day. The phone numbers for each OR’s attending anesthesiologist, surgeon, nurse, charge nurse, and anesthesiologist of the day are made readily available by writing them on a large white board within each OR. Further, the charge nurse and anesthesiologist of the day each carry a cellular telephone dedicated to these respective roles. Most staff in an OR have memorized these two telephone numbers. The contact information for all other anesthesiologists, surgeons, and nurses is available in a large binder in the OR and through a computerized database. However, the time and effort required to isolate a given individual’s contact information from these two sources, while often incremental over that of the aforementioned whiteboard or memory, become nearly insurmountable in times of urgency or emergency when all hands within the OR may be dedicated to more critical tasks. For this study, we produced a composite OR network from data on 32 anesthetizing sites extracted from a single day of operating room schedules. The network was created by comparing direct observations, case assignments, and protocol-based hierarchical reporting lines within the OR . We also conducted multiple interviews with three attending anesthesiologists (authors NG, SL, and LD), each with over 10 years of experience at this institution and regular assignments as the coordinating anesthesiologist for the ORs. At each stage of the network’s construction, the draft network model was reviewed using a modified Delphi method (Dalkey & Helmer, 1963) until a consensus model was obtained. At each revision, interviewees were asked to constrain their design to that of an “average weekday” based upon their own personal experience and observation. The intent was for the model to capture the interpersonal interactions of an “average weekday” over a 12-hour timeframe. For this process, we first created a prototype micro-level network of an OR “team” included circulating nurses, anesthesiology residents, AAs, CRNAs, anesthesiology attendings, and surgeons. These teams were replicated and serially adjusted to reflect different surgical specialties and their daily room allocation at the hospital. The teams were then connected according to anesthesiology attending assignment, reporting to charge nurses, and reporting to the anesthesiologist of the day, according to the formal reporting structure at our institution.

Connections
insna.org | Volume 34 | Issue 1&2 | December
The Operating Room: It’s a Small World
Com
mun
icat
ions
Net
wor
k fo
r Com
posi
te P
roto
typi
cal O
pera
ting
Roo
m
Figu
re 1
: Plo
t of t
he O
pera
ting
Roo
m C
omm
unic
atio
n N
etw
ork
Com
mun
icat
ions
Net
wor
k fo
r Com
posi
te P
roto
typi
cal O
pera
ting
Roo
m
Connections
December | Issue 1&2 | Volume 34 | insna.org
The Operating Room: It’s a Small World
Description of Nodes & Edges
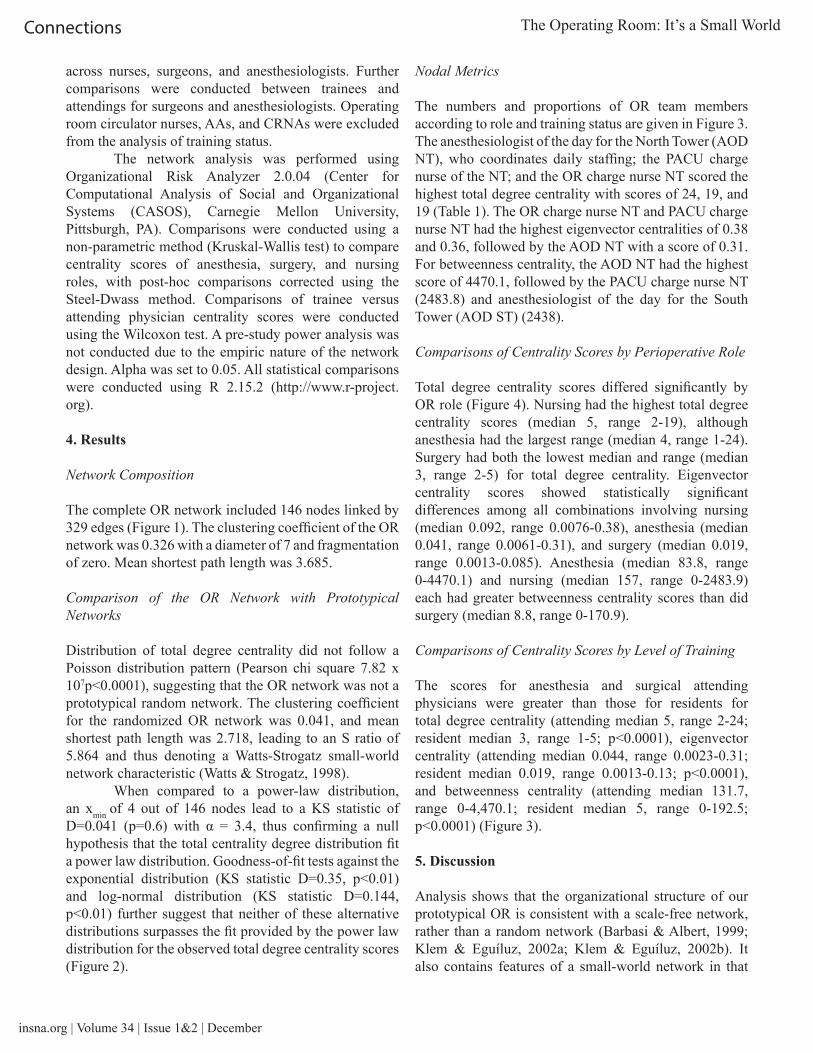
Each node in the network (Figure 1) represents an individual healthcare provider involved with direct patient care. Nodes were classified as attending anesthesiologists, attending surgeons, anesthesiology residents and fellows, CRNAs or AAs, surgical residents and fellows, OR circulating nurses, and OR charge nurses. Each node was weighted equally, although physician nodes were stratified by training status (resident/fellow versus attending physician). The edges connecting each node were weighted equally at 1 and all were considered bidirectional. Edges consisted of direct or telephone contact commonly used for perioperative communications.
Analysis
Out first goal was to compare the OR network to three major network types: random, scale-free, and small-world. The node and link count, clustering coefficient, and average path length were first calculated for the whole network. In comparing the structure of the network in Figure 1 with a random network, nodal degree
centrality distribution was tested against the Poisson distribution using the Pearson chi-square goodness-of-fit test (Barabási, 2009). For small-world network comparison, the clustering coefficient and mean shortest path length were calculated for the OR network and for a randomized version of the network. The randomized version of the OR network used the same nodes as in the native network, but the links between the nodes were randomly distributed according to the method of Erdős & Rényi (1959). Quantification of small-worldness was calculated according to the method of Humphries & Gurney (2008), relying on a quantification of strong clustering coefficients but low mean shortest path lengths. For comparison with a scale-free network, we performed a Kolmogorov-Smirnov (KS) goodness-of-fit test, modified for power-law distributions of degree centrality, according to the method of Clauset, Shalizi & Newman (2009). Further details concerning calculation of the goodness-of-fit to the power law distribution are given in Appendix A. Our second goal was to calculate total degree centrality, eigenvector centrality, and betweenness centrality (Bonacich, 1972; Freeman, 1978) for each node in the network and then compare the top 20 scores
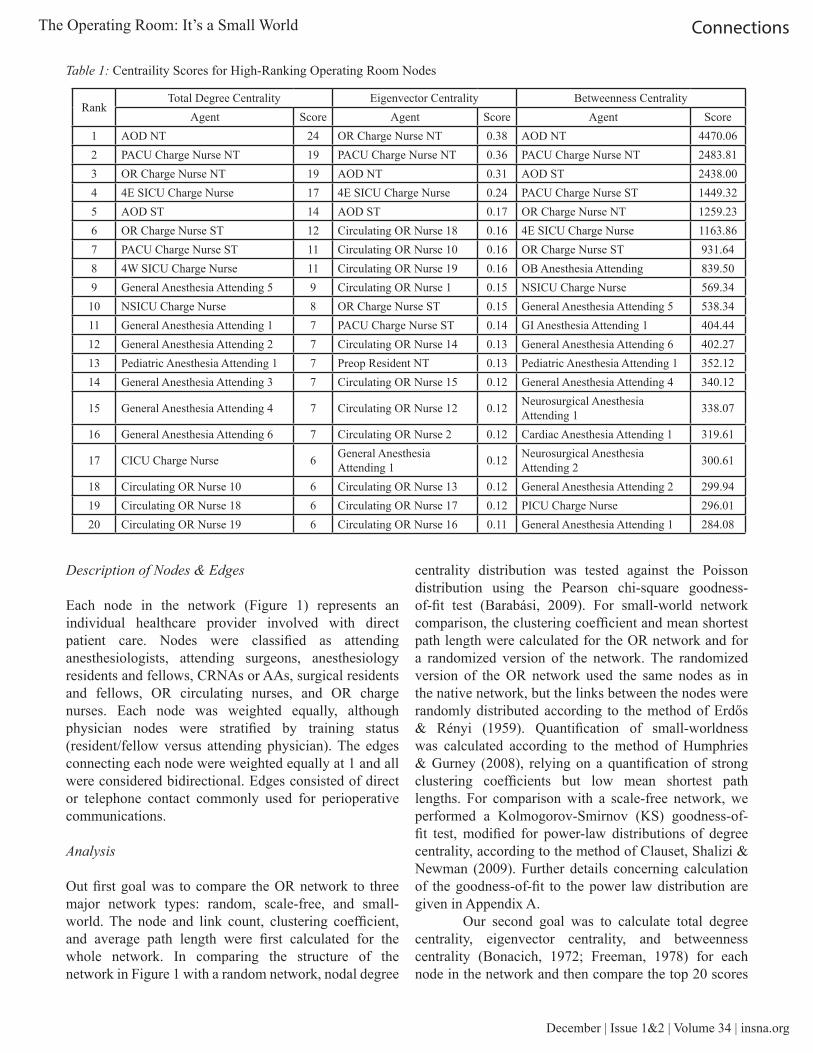
Table 1: Centraility Scores for High-Ranking Operating Room Nodes
RankTotal Degree Centrality Eigenvector Centrality Betweenness Centrality
Agent Score Agent Score Agent Score1 AOD NT 24 OR Charge Nurse NT 0.38 AOD NT 4470.062 PACU Charge Nurse NT 19 PACU Charge Nurse NT 0.36 PACU Charge Nurse NT 2483.813 OR Charge Nurse NT 19 AOD NT 0.31 AOD ST 2438.004 4E SICU Charge Nurse 17 4E SICU Charge Nurse 0.24 PACU Charge Nurse ST 1449.325 AOD ST 14 AOD ST 0.17 OR Charge Nurse NT 1259.236 OR Charge Nurse ST 12 Circulating OR Nurse 18 0.16 4E SICU Charge Nurse 1163.867 PACU Charge Nurse ST 11 Circulating OR Nurse 10 0.16 OR Charge Nurse ST 931.648 4W SICU Charge Nurse 11 Circulating OR Nurse 19 0.16 OB Anesthesia Attending 839.509 General Anesthesia Attending 5 9 Circulating OR Nurse 1 0.15 NSICU Charge Nurse 569.3410 NSICU Charge Nurse 8 OR Charge Nurse ST 0.15 General Anesthesia Attending 5 538.3411 General Anesthesia Attending 1 7 PACU Charge Nurse ST 0.14 GI Anesthesia Attending 1 404.4412 General Anesthesia Attending 2 7 Circulating OR Nurse 14 0.13 General Anesthesia Attending 6 402.2713 Pediatric Anesthesia Attending 1 7 Preop Resident NT 0.13 Pediatric Anesthesia Attending 1 352.1214 General Anesthesia Attending 3 7 Circulating OR Nurse 15 0.12 General Anesthesia Attending 4 340.12
15 General Anesthesia Attending 4 7 Circulating OR Nurse 12 0.12 Neurosurgical Anesthesia Attending 1 338.07
16 General Anesthesia Attending 6 7 Circulating OR Nurse 2 0.12 Cardiac Anesthesia Attending 1 319.61
17 CICU Charge Nurse 6 General Anesthesia Attending 1 0.12 Neurosurgical Anesthesia
Attending 2 300.61
18 Circulating OR Nurse 10 6 Circulating OR Nurse 13 0.12 General Anesthesia Attending 2 299.9419 Circulating OR Nurse 18 6 Circulating OR Nurse 17 0.12 PICU Charge Nurse 296.0120 Circulating OR Nurse 19 6 Circulating OR Nurse 16 0.11 General Anesthesia Attending 1 284.08
Connections
insna.org | Volume 34 | Issue 1&2 | December
The Operating Room: It’s a Small World
across nurses, surgeons, and anesthesiologists. Further comparisons were conducted between trainees and attendings for surgeons and anesthesiologists. Operating room circulator nurses, AAs, and CRNAs were excluded from the analysis of training status. The network analysis was performed using Organizational Risk Analyzer 2.0.04 (Center for Computational Analysis of Social and Organizational Systems (CASOS), Carnegie Mellon University, Pittsburgh, PA). Comparisons were conducted using a non-parametric method (Kruskal-Wallis test) to compare centrality scores of anesthesia, surgery, and nursing roles, with post-hoc comparisons corrected using the Steel-Dwass method. Comparisons of trainee versus attending physician centrality scores were conducted using the Wilcoxon test. A pre-study power analysis was not conducted due to the empiric nature of the network design. Alpha was set to 0.05. All statistical comparisons were conducted using R 2.15.2 (http://www.r-project.org).
4. Results
Network Composition
The complete OR network included 146 nodes linked by 329 edges (Figure 1). The clustering coefficient of the OR network was 0.326 with a diameter of 7 and fragmentation of zero. Mean shortest path length was 3.685.
Comparison of the OR Network with Prototypical Networks
Distribution of total degree centrality did not follow a Poisson distribution pattern (Pearson chi square 7.82 x 10⁷p<0.0001), suggesting that the OR network was not a prototypical random network. The clustering coefficient for the randomized OR network was 0.041, and mean shortest path length was 2.718, leading to an S ratio of 5.864 and thus denoting a Watts-Strogatz small-world network characteristic (Watts & Strogatz, 1998). When compared to a power-law distribution, an xmin of 4 out of 146 nodes lead to a KS statistic of D=0.041 (p=0.6) with α = 3.4, thus confirming a null hypothesis that the total centrality degree distribution fit a power law distribution. Goodness-of-fit tests against the exponential distribution (KS statistic D=0.35, p<0.01) and log-normal distribution (KS statistic D=0.144, p<0.01) further suggest that neither of these alternative distributions surpasses the fit provided by the power law distribution for the observed total degree centrality scores (Figure 2).
Nodal Metrics
The numbers and proportions of OR team members according to role and training status are given in Figure 3. The anesthesiologist of the day for the North Tower (AOD NT), who coordinates daily staffing; the PACU charge nurse of the NT; and the OR charge nurse NT scored the highest total degree centrality with scores of 24, 19, and 19 (Table 1). The OR charge nurse NT and PACU charge nurse NT had the highest eigenvector centralities of 0.38 and 0.36, followed by the AOD NT with a score of 0.31. For betweenness centrality, the AOD NT had the highest score of 4470.1, followed by the PACU charge nurse NT (2483.8) and anesthesiologist of the day for the South Tower (AOD ST) (2438).
Comparisons of Centrality Scores by Perioperative Role
Total degree centrality scores differed significantly by OR role (Figure 4). Nursing had the highest total degree centrality scores (median 5, range 2-19), although anesthesia had the largest range (median 4, range 1-24). Surgery had both the lowest median and range (median 3, range 2-5) for total degree centrality. Eigenvector centrality scores showed statistically significant differences among all combinations involving nursing (median 0.092, range 0.0076-0.38), anesthesia (median 0.041, range 0.0061-0.31), and surgery (median 0.019, range 0.0013-0.085). Anesthesia (median 83.8, range 0-4470.1) and nursing (median 157, range 0-2483.9) each had greater betweenness centrality scores than did surgery (median 8.8, range 0-170.9).
Comparisons of Centrality Scores by Level of Training
The scores for anesthesia and surgical attending physicians were greater than those for residents for total degree centrality (attending median 5, range 2-24; resident median 3, range 1-5; p<0.0001), eigenvector centrality (attending median 0.044, range 0.0023-0.31; resident median 0.019, range 0.0013-0.13; p<0.0001), and betweenness centrality (attending median 131.7, range 0-4,470.1; resident median 5, range 0-192.5; p<0.0001) (Figure 3).
5. Discussion
Analysis shows that the organizational structure of our prototypical OR is consistent with a scale-free network, rather than a random network (Barbasi & Albert, 1999; Klem & Eguíluz, 2002a; Klem & Eguíluz, 2002b). It also contains features of a small-world network in that
Connections
December | Issue 1&2 | Volume 34 | insna.org
The Operating Room: It’s a Small World
Sim
ulat
ed E
rdos
-Ren
yi P
roto
type
of O
pera
ting
Roo
m C
omm
unic
atio
ns N
etw
ork
Figu
re 2
a: P
ropo
rtion
s of O
R N
etw
ork
Hea
lthca
re P
rovi
ders
by
Rol
e an
d Tr
aini
ng S
tatu
s
Sim
ulat
ed E
rdos
-Ren
yi P
roto
type
of O
pera
ting
Roo
m C
omm
unic
atio
ns N
etw
ork

Connections
insna.org | Volume 34 | Issue 1&2 | December
The Operating Room: It’s a Small World
Sim
ulat
ed S
mal
l-Wor
ld P
roto
type
of O
pera
ting
Roo
m C
omm
unic
atio
ns N
etw
ork
Figu
re 2
b: E
xam
ple
Prot
otyp
es a
nd S
mal
l-Wor
ld N
etw
orks
Sim
ulat
ed S
mal
l-Wor
ld P
roto
type
of O
pera
ting
Roo
m C
omm
unic
atio
ns N
etw
ork

Connections
December | Issue 1&2 | Volume 34 | insna.org
The Operating Room: It’s a Small World
disparate nodes, located far from each other across the network, are closely related through well-connected nodes. The number of such well-connected nodes in a scale-free network remains low in proportion to the number of nodes within said network. Senior anesthesia and nursing staff (but not surgical staff in the studied hospital where the schedule is managed by a chief anesthesiologist, shown in Figure 1 as the AOD), are the most well-connected on three centrality scores, including total degree, eigenvector, and betweenness. Thus, both anesthesiology staff and nurses are connected to everyone else in the graph through a small number of extremely well-connected nodes that are also directly connected. This connectivity facilitates the small-world effect by increasing clustering and decreasing path lengths. As expected, surgical and anesthesia attending physicians consistently outranked resident physicians across all measures of centrality because attending physicians carry greater responsibility than trainees. Network behaviors are frequently influenced by the underlying network structure type, of which multiple prototypes have been identified throughout nature (Albert
& Barabasi, 2002). One of the original network structures described is the random network of Erdős, & Rényi (1959), where an edge (i.e, interpersonal interaction) can be found between any given pair of nodes with equal probability, independent of the presence of other edges in the network. Small-world networks, of which it appears the OR is an example, represent a class of networks in which: (1) most nodes are distant from one another, and (2) most can be reached by other nodes through a small number of connections to highly connected nodes. A third network prototype, of which our OR is also an example, is the Barabasi-Albert model of the scale-free network. Here, the distribution of node centrality follows a power-law distribution (Albert, Jeong, & Barabasi, 2000; Barabasi & Albert, 1999). Scale-free networks exhibit three features with important implications for OR organization:
1. Scale-free, or power-law, distributions of total degree centrality. A small number of “hub” individuals—in the case of the OR, the coordinating anesthesiologist, and charge nurses—contain a disproportionately large
Figure 3: Centraility Scores for High-Ranking Operating Room Nodes

Connections
insna.org | Volume 34 | Issue 1&2 | December
The Operating Room: It’s a Small World
share of the total number of connections within the OR network. This is in contrast to random networks, whereby each individual is likely to maintain a similar number of connections to other individuals.
2. Preferential attachment behaviors, such that the greater centrality of a given node, the greater the chance that it will receive additional connections to other nodes. Applied to an OR, this suggests that well-connected nodes such as the AOD and OR charge nurse will continue to attract connections to new nodes at a rate greater than that of other members of the OR team as the OR network expands. Most scale-free networks also exhibit consistent growth rather than static structure (Barabasi, 2009). This growth is thus expected to disproportionately affect the AODs and charge nurses who already bear a disproportionately large number of connections. Prior observational studies of communication burdens in the emergency department and operating room (Woloshynowych, Davis, Brown & Vincent, 2007; Hu, Arriaga, Peyre, Corso, Roth, & Greenberg, 2012) lead us to predict that the expansion of the OR network will place these individuals at increasing risk of communication errors due to mismatches between demand and capacity. Importantly, systems based on scale-free networks are robust to stochastic failures across the network but sensitive to focused “attacks” on a small number of critical nodes (Cohen, Erez, ben-Avraham, & Havlin, 2000). Although communication errors of most individuals within the OR may affect only local members of the network, errors by the AOD or charge nurses can lead to catastrophic failures, that reverberate throughout the entire network. Given the characteristics of preferential attachment and growth inherent to scale-free networks, this suggests that those to whom the network is most sensitive to failure, in our case the AOD and charge nurse, will continue to be excessively burdened with additional connections—and at an ever-increasing rate.
Given the costs associated with medical errors, and the fact that communication errors contribute to the vast majority of medical errors, there is a current emphasis on improving communication within the ORs (Eichorn, 2013). In a scale-free network with small-world properties, protecting a few highly-connected individuals may be more prudent. Indeed, epidemiologic models incorporating small-world and scale-free features suggest that such features place even greater importance in protecting key entities within critical, dynamic environments (Small & Chi, 2005). Another approach may consider placement of senior staff into roles based
not just on high patient acuity, but also in consideration of roles requiring critical communication volume with large numbers of OR team members. Dissemination of practice updates may also focus on those highly connected individuals because those individuals will carry not only a high level of present-tense connectivity, but are also well positioned to disseminate information to new nodes given the principle of preferential attachment within scale-free networks (Anderson & Jay, 1985; Coleman, Katz, & Menzel, 1957). Together, these proposals will require further investigation to ascertain whether their implementation is both practical and efficacious. We also examined the relationship between OR role and nodal metrics. The nursing staff had higher scores in all centrality metrics, with anesthesiology staff similar to nursing, and surgical staff significantly lower than both nursing and anesthesiology. Several nurses (specifically, the charge nurses) are tracking multiple ORs, leading them to be the most directly connected in the network. Anesthesiology had similar scores to nursing because most anesthesia attendings were running more than one operating room; the AOD NT and AOD ST had connections to the entire OR-NT and OR-ST, and the preoperative residents had multiple connections as well. This organizational connectivity, is what allowed anesthesia to have higher total degree and eigenvector centrality scores. As expected, surgeons were lower in all scores because each attending surgeon is typically focused on the events in his or her single OR. Although our work provides insight into the meso-scale organizational structure of the OR, many additional facets warrant exploration. At the micro-level, structural features of individual networks (personal networks) may impact perioperative patient outcomes. Prior clinical research has often focused on an individual’s contribution to outcome variance, perhaps most famously in reference to anesthesiologist number 7 (Slogoff & Keats, 1985). The story of anesthesiologist number 7 has attained legendary status among academic anesthesiologists. Slogoff and Keats (1985) attempted to determine whether myocardial ischemia during surgery to bypass coronary vessels was associated with myocardial infarctions following surgery. During their study, it was incidentally found that patients of one particular anesthesiologist, anesthesiologist number 7, had the highest rates of perioperative myocardial ischemia and infarction, likely due to the very fast heart rates induced by this individual. “Anesthesiologist No. 7,” the authors reiterated in a follow-up on classic papers in Anesthesiology, “dramatically demonstrated the importance of preventing and treating tachycardia (fast heart rate) in the population with coronary artery disease” (Slogoff & Keats, 2006).

Connections
December | Issue 1&2 | Volume 34 | insna.org
The Operating Room: It’s a Small World
Figu
re 4
: Box
Plo
t of C
entra
lity
Scor
es b
y O
pera
ting
Roo
m R
ole
and
Phys
icia
n Tr
aini
ng S
tatu
s
Connections
insna.org | Volume 34 | Issue 1&2 | December
The Operating Room: It’s a Small World
And yet, cardiac surgery is performed by teams of individuals. The focus on anesthesiologist No. 7, while certainly serving as a didactic point on the risks of perioperative tachycardia, fails to appreciate the potential for compensatory interventions by others participating is n No. 7’s cases. Such individually-focused approaches to medical error prevention fail to appreciate the individual as a member of a complex healthcare team with potentially offsetting strengths and weaknesses. As network-centric approaches to adverse event prevention gain traction, methods to quantify network complexity and structure at both the micro- and meso-levels will likely become critical (Reason, Carthey, & de Leval, 2001).
6. Limitations
Although this study provides insight into the relative organizational impact of certain roles in the OR, it is based on a single healthcare system and on a single, average day in the OR. This limits the generalizability of our results to other days of the week within our own institution, when other services may have block time, let alone other institutions. This approach also fails to capture information pertaining to the nature of the connections between nodes, especially the rate, volume, and nature of communications among individuals. Nevertheless, this model captures themes common to modern operating rooms, including the hierarchal approach to OR team member connectivity, the parallel roles of surgeons, anesthesiologists and nurses, and relative intraoperative connectivity of attending versus resident physicians. Future work will need to quantify the communiqué-vectors within the network, how much information is transmitted with each communiqué, communiqué duration, and the importance of the included information. In conclusion, our analysis suggests that an OR at a tertiary-care academic medical center is a scale-free network exhibiting small-world characteristics. Given the homogeneity of certain scale-free network characteristics throughout nature, such a designation may have implications for coordinating anesthesiologists and charge nurses and for understanding the disproportionate impact of OR growth on these roles. In the next phase of this project, we will explore how meso-level organizational network complexity impacts perioperative patient outcomes.
References
Albert, R., & Barabasi, A. (2002). Statistical mechanics of complex networks. Reviews of Modern Physics 74, January 2002. doi:10.1103/
RevModPhys.74.47 Albert, R. Jeong, H., & Barabasi, A. (2000). Error and
attack tolerance of complex networks. Nature, 406(6794), 378-382. doi:10.1038/35019019
Anderson, C., & Talsma, A. (2011). Characterizing the structure of operating room staffing using social network analysis. Nursing Research, 60(6), 378-385. doi:10.1097/NNR.0b013e3182337d97
Anderson, J. G., & Jay, S. J. (1985). The diffusion of medical technology: social network analysis and policy research. The Sociological Quarterly, 26(1), 49-64. doi:10.1111/j.1533-8525.1985.tb00215.x
Barabsi, A.L, & Albert, R. (1999). Emergence of scaling in random networks. Science, 286(5439), 509-512.
Barabási, A. L. (2009). Scale-free networks: a decade and beyond. Science, 325(5939), 412-413. doi:10.1126/science.1173299
Baumgart, A., Denz, C., Bender, H., & Schleppers, A. (2009). How work context affects operating room processes: using data mining and computer simulation to analyze facility and process design. Quality Management in Health Care, 18(4), 305-314. doi:10.1097/QMH.0b013e3181bee2c6
Bonacich, P. (2007). Some unique properties of eigenvector centrality. Social Networks, 29, 555-564.
Bonacich, P. (1972). Factoring and weighting approaches to status scores and clique identification. The Journal of Mathematical Sociology, 2(1), 113-120. doi:10.1080/0022250X.1972.9989806
Chambers, D., Wilson, P., Thompson, C., & Harden, M. (2012). Social network analysis in healthcare settings: a systematic scoping review. PloS one, 7(8), e41911. doi:10.1371/journal.pone.0041911
Clauset, A, Shalizi, C. R., & Newman, M. (2009). Power-law distributions in empirical data. SIAM Review 51, 661-703. DOI: 10.1137/070710111
Cohen, R., Erez, K., be-Avraham, D., & Havlin, S. (2000). Resilience of the Internet to random breakdowns. Physical Review Letters, 85(21), 4626-4628. doi:10.1103/PhysRevLett.85.4626
Coleman, J., Katz, E., & Menzel, H. (1957). The diffusion of an innovation among physicians. Sociometry, 20, 253-270.
Dalkey, N., & Helmer, O. (1963). An experimental application of the DELPHI method to the use of experts. Management Science, 9(3), 458-467. doi:10.1287/mnsc.9.3.458
Effken, J. A., Carley, K. M., Gephart, S., Verran, J. A., Bianchi, D., Reminga, J., & Brewer, B. B. (2011).

Connections
December | Issue 1&2 | Volume 34 | insna.org
The Operating Room: It’s a Small World
Using ORA to explore the relationship of nursing unit communication to patient safety and quality outcomes. International Journal of Medical Informatics, 80(7), 507-517. doi:10.1016/j.ijmedinf.2011.03.015
Eichhorn, J. (2013). Practical current issues in perioperative patient safety. Canadian Journal of Anesthesia, 60, 111-8. doi:10.1007/s12630-012-9852-z.
ElBardissi, A. W., & Sundt, T. M. (2012). Human factors and operating room safety. Surgical Clinics of North America, 92(1), 21-35. doi:10.1016/j.suc.2011.11.007
Erdős, P., & Rényi, A. (1959). On random graphs. Publicationes Mathematicae Debrecen, 6, 290-297.
Freeman, L. C. (1978). Centrality in social networks conceptual clarification. Social Networks, 1(3), 215-239. doi:10.1016/0378-8733(78)90021-7
Haynes, A. B., Weiser, T. G., Berry, W. R., Lipsitz, S. R., Breizat, A. S., Dellinger, E. P., et al. (2009). A surgical safety checklist to reduce morbidity and mortality in a global population. The New England Journal of Medicine, 360(5), 491-499. doi:10.1056/NEJMsa0810119
Hu, Y. Y., Arriaga, A. F., Peyre, S. E., Corso, K. A., Roth, E. M., Greenberg, C. C. (2012). Deconstructing intraoperative communication failures. Journal of Surgical Research, 177, 37-42. doi:10.1016/j.jss.2012.04.029.
Humphries, M. D., & Gurney, K. (2008). Network “small-world-ness”: a quantitative method for determining canonical network equivalence PloS One, 3(4), e0002051. doi:10.1371/journal.pone.0002051
Klemm, K., & Eguíluz, V. (2002a). Highly clustered scale-free networks. Phys Rev, E65, 036123
Klemm, K., & Eguíluz, V. (2002b) Growing scale-free networks with small-world behavior. Phys Rev, E65, 057102
Krackhardt, D. (1990). Assessing the political landscape: structure, cognition, and power in organizations. Administrative Science Quarterly, 35, 342-369.
Krackhardt, D., & Hanson, J. R. (1993). Informal networks: the company behind the chart. Harvard Business Review, 71(4), 104-111.
Krebs, V. E.(2002). Uncloaking terrorist networks. First Monday 7, Number 4-1, at http://journals.uic.edu/ojs/index.php/fm/article/view/941/863
Listyowardojo, T. A.(2012). Improving safety culture in health care: implications of individual and institutional variability, at http://dissertations.
u b . r u g . n l / F I L E S / f a c u l t i e s / g m w / 2 0 1 2 /t.a.listyowardojo/thesis.pdf#page=71
Nakano, T., & White, D. R. (2006). The large-scale network of a Tokyo industrial district: small-world, scale-free, or depth hierarchy Citeseer, 1100, 3355.
Reason, J. T., Carthey, J., & de Leval, M. R. (2001). Diagnosing “vulnerable system syndrome”: an essential prerequisite to effective risk management Quality in Health Care: QHC, 10 Suppl 2, ii21-25.
Slogoff, S, & Keats, A. S. (1985). Does perioperative myocardial ischemia lead to postoperative myocardial infarction Anesthesiology, 62(2), 107-114.
Slogoff, S., & Keats, A. S. (2006). Myocardial ischemia revisited. Anesthesiology, 105(1), 214-216.
Small, M., & Chi, K. (2005). Small world and scale free model of transmission of SARS. International Journal of Bifurcation and Chaos, 15(05), 1745-1755. http://www.worldscientific.com/doi/abs/10.1142/S0218127405012776
Stulberg, J. J., Delaney, C. P., Neuhauser, D. V., Aron, D. C., Fu, P., & Koroukian, S. M. (2010). Adherence to surgical care improvement project measures and the association with postoperative infections JAMA: The Journal of the American Medical Association, 303(24), 2479-2485. doi:10.1001/jama.2010.841
Watts, D. J., & Strogatz, S. H. (1998). Collective dynamics of “small-world” networks Nature, 393(6684), 440-442. doi:10.1038/30918
Woloshynowych, M., Davis, R., Brown, R., Vincent, C. (2007). Communication patterns in a UK emergency department. Annals of Emergency Medicine, 50, 407-413. doi:10.1016/j.annemergmed.2007.08.001.
Xu, J., Hu, D., & Chen, H. (2009). The dynamics of terrorist networks: understanding the survival mechanisms of global Salafi Jihad. Journal of Homeland Security and Emergency Management, 6(1). doi:10.2202/1547-7355.1477
Appendix A
The power law distribution is defined as:
such that x_min defines a lower bound and the scaling parameter α is typically in the range of two to three.
Connections
insna.org | Volume 34 | Issue 1&2 | December
The Operating Room: It’s a Small World
Because power law distributions often pertain only to the tail of a distribution, Kolmogorov-Smirnov testing for goodness of fit was performed for those nodes that, when ranked from greatest to least un-scaled total degree centralities, held a rank greater than that of x_min. The x_minvalues were obtained using the methods of Clauset, Shalizi, & Newman (2007) using the R package implementation offered by Dubroca. Further testing of the distribution of total degree centrality against the log, lognormal, and exponential distributions was conducted in order to ascertain with greater certainty the power law distribution of the observed total degree centralities.1
Reference
1. Clauset A, Shalizi CR, Newman MEJ: Power-law distributions in empirical data. SIAM Rev 2009;51:661-703
Appendix B
Figure Legends
Figure 1. Plot of the Operating Room Communication Network. The OR network which was modeled is comprised of two hospital buildings connected by an underground tunnel. Each hospital has one floor of operating rooms. One of the hospitals (North Tower) also contains obstetric, MRI, endoscopy, and interventional radiology suites in separate remote locations. For the purposes of this model, perioperative staffing included surgeons, surgical residents, anesthesiologist, anesthesiology residents, midlevel anesthetic providers, and charge nurses within the post-anesthesia care units (PACU), intensive care units (ICU) and operating rooms. All staff are able to work in either hospital, however there is no intra-case movement between the two hospitals. Each facility maintains its own preoperative holding area and PACU. Surgical services and subspecialty surgical ICUs are divided among the 2 hospitals (North and South Towers). The North Tower (NT) consists of Cardiothoracic, Vascular, Otolaryngology, Pediatrics, Neurosurgery, and Pediatric Cardiac cases. The South Tower (ST) consists of General Surgery, Transplant, Urology, and Orthopedic cases. The NT houses the Neurosurgical, Pediatric, and Cardiac Intensive Care Units. The ST houses the Surgical Intensive Care Unit which takes care of Trauma, General Surgery, Orthopedics, Vascular, Otolaryngology, Transplant, and Urology patients.
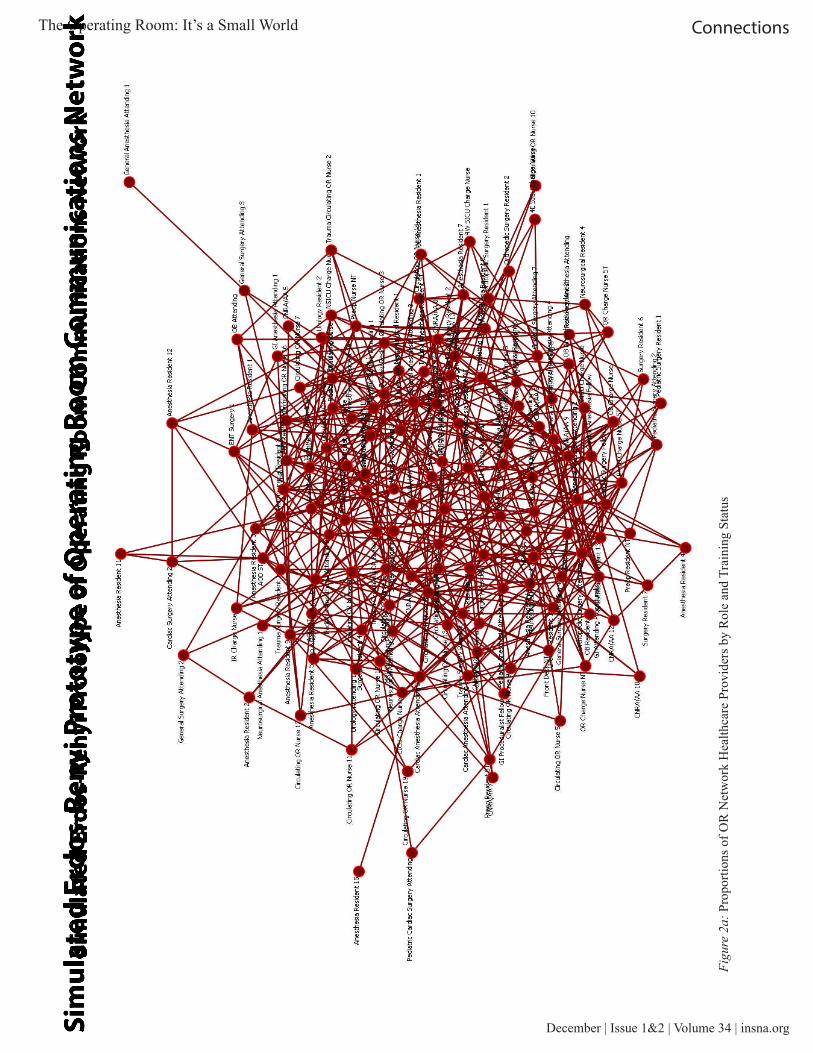
Figure 2. Example Prototypes of Random and Small-World Networks. Erdos-Renyi (Panel A) network created
using the same set of 146 nodes from the observed OR network, configured according to an Erdos-Renyi network structure with a density of 0.05. The small-world network (Panel B) was also created using the 146 nodes from the observed OR network, with the number of neighbors set to 10, probability of neighbor removal 0.05, probability of adding far neighbor 0.01, and power law exponent 0.01.
Figure 3. Proportions of OR Network Healthcare Providers by Role and Training Status. Ninety-one nodes (62%) were physicians, 42 (29%) nodes were nurses, and 13 (9%) nodes were CRNA/AAs. Of the physicians, 42 (46% of physicians, 29% of all nodes) were anesthesiologists and 49 (54% of physicians, 34% of all nodes) were surgeons. Twenty-three (55%) of the anesthesiologists, and 25 (51%) of the surgeons, were trainee physicians. The anesthesia team included 13 CRNAs or AAs representing 24% of the anesthesia workforce.
Figure 4. Box Plot of Centrality Scores by Operating Room Role and Physician Training Status. For Total Degree Centrality there were statistically significant differences between Anesthesia and Nursing (p=0.005), Anesthesia and Surgery (p<0.0001), and Nursing and Surgery (p<0.0001). For Eigenvector Centrality, there were statistically significant differences between Anesthesia and Nursing (p<0.0001), Anesthesia and Surgery (p=0.0002), and Nursing and Surgery (p<0.0001). Betweenness Centrality scores differed between Anesthesia and Surgery (p=0.0004), between Nursing and Surgery (p<0.0001), but not between Nursing and Anesthesia (p=0.09). Differences between Attendings and Resident physicians were statistically significant (p<0.0001) for Total Degree Centrality, Eigenvector Centrality, and Betweenness Centrality.