the open university of tanzaniarepository.out.ac.tz/646/1/dissertation_-andrew,_m_final... · web...
TRANSCRIPT

MASTER OF HUMAN RESOURCE MANAGEMENT (MHRM) “IMPACTS
OF LABOUR TURNOVER ON ORGANIZATIONAL PERFOMANCE”:
A CASE OF MTWARA REGIONAL ADMINISTRATIVE OFFICE
ANDREW MSAFIRI
A DISSERTATION SUBMITTED IN PARTIAL FULFILLMENT OF THE
REQUIREMENTS FOR THE DEGREE OF MASTER OF HUMAN
RESOURCE MANAGEMENT OF THE OPEN UNIVERSITY OF TANZANIA
2013
CERTIFICATION
The undersigned certifies that he has read and hereby recommends for an acceptance
by the Open University of Tanzania a dissertation titled “Impacts of Labour
Turnover on Organizational Performance, A Case of Mtwara Regional
Administrative Office - Mtwara Region”, in partial fulfillment of the requirements
for the Degree of Master of Human Resource Management of the Open University of
Tanzania.
………………………………………..
Dr. Chacha Matoka
(Supervisor)
…………………………………………….
Date
ii

COPYRIGHT
No part in this dissertation may be reproduced stored in any retrieval system or
transmitted in any form or any means, be it electronic mechanical, photocopied
recorded or otherwise without the prior permission of the author or The Open
University of Tanzania in that behalf.
iii

DECLARATION
I, Andrew Msafiri, declare that this Dissertation is my own original work and has not
been previously submitted in full or partial requirements for an equivalent or higher
qualification at any other recognized Learning Institution.
………………………………………..
Signature
…………………………………………….
Date
iv

DEDICATION
I dedicate this work to Almighty God, who gave me the strength, knowledge and
wisdom, my parents of Kilimanjaro Region who are the groundwork of my
education, my Fiancée, my Brother Samson Kilango & his wife Mwanaidi Athuman
of Dar es Salaam, and lastly Uncle Ibrahim Dickson of Mtwara Region.
v

ACKNOWLEDGEMENTS
I wish to thank the following: The almighty God for giving me the health, strength
and ability to successfully undertake this study. Dr. Chacha Alfred Matoka, my
research supervisor, for his kindness, considerate and professional guidance and
encouragement, my Fiancee, for support and encouragement to break boundaries of
knowledge.
My parents, for showing me the importance of education, and for the support they
have given me right through my life, Dr. Haule of The Open University for his
continuous support and encouragement throughout this study.
All staff members at Mtwara Regional Administrative Office especially Mrs. Gonga
and Mr. Ibrahim Dickson for assisting me during data collection, my colleagues in
the Faculty of Business Management, for their interest, support and encouragement,
all my friends and those important people that I might have forgotten to mention.
vi

ABSTRACT
In the recent years impact of labour turnover has received considerable attention by
senior management, human resource professionals, and industrial psychologists. It
has been proven to be one of the most seemingly intractable human resource
challenges confronting organizations. Labour plays a significant role for the
performance of any business firm. The efficiency, productivity and effectiveness of
the Organization are highly influenced by a competent and well-experienced
workforce. This research was carried out to examine the impacts of labour turnover
on Organization performance in Mtwara Regional Administrative Office. The main
purpose of the study was to determine the impact of employee turnover on the
performance of an organization. The research study supports the argument of Derek
(2006) that the employees’ turnover positively associated with the organization
inefficiency. In the sample study comprised one hundred and thirty (130)
respondents, both qualitative and quantitative data have been used and the
questionnaires were individually administered. It is clearly evidenced that there is
negatively relationship between organizational performance and the employees’
turnover. The general objective of this study was to assess the impacts of labour
turnover on Organizational performance at Mtwara Regional Administrative Office.
The study recommended that the Management continue employing people who are
well trained and who perceive their jobs as a calling. Organizations should not only
employ to fill a job but also consider a fit between the person and the organisation. It is
highly recommended that management should give attention to those factors that
they can easily manage. Management has to understand that people are different and
appreciates those differences.
vii

TABLE OF CONTENTS
CERTIFICATION.....................................................................................................ii
COPYRIGHT............................................................................................................iii
DECLARATION.......................................................................................................iv
DEDICATION............................................................................................................v
ACKNOWLEDGEMENTS......................................................................................vi
ABSTRACT..............................................................................................................vii
LIST OF TABLES....................................................................................................vii
LIST OF FIGURES..................................................................................................vii
LIST OF APPENDICES..........................................................................................vii
LIST OF ABBREVIATIONS AND ACRONYMS................................................vii
CHAPTER ONE.........................................................................................................7
1.0 INTRODUCTION...............................................................................................7
1.1 Background of the Problem................................................................................7
1.2 Statement of the Problem.....................................................................................7
1.3 General Objective................................................................................................7
1.4 Specific Objectives..............................................................................................7
1.5 Research Questions.............................................................................................7
1.6 Significance of the Study....................................................................................7
1.7 Limitation of the Study.......................................................................................7
1.8 Delimitation of the Study....................................................................................7
1.9 Scope of the Study..............................................................................................7
CHAPTER TWO........................................................................................................7
2.0 LITERATURE REVIEW....................................................................................7
viii
2.1 Introduction.......................................................................................................7
2.2 Definitions of the Key Terms...........................................................................7
2.2.1 Labour Turnover...............................................................................................7
2.2.2 Organization Performance................................................................................7
2.3 Critical Theoretical Review................................................................................7
2.3.1 Demand Forecasting Theory.............................................................................7
2.3.2 Supply Forecasting Theory.................................................................................7
2.3.3 Economic Theories Explaining Pay Levels......................................................7
2.3.4 The Effort Bargain Theory...............................................................................7
2.3.5 Abraham Maslow’s Theory of Need Hierarchy...............................................7
2.3.6 Physiological Needs..........................................................................................7
2.3.7 Safety Needs or Security Needs........................................................................7
2.3.8 Social Needs.....................................................................................................7
2.3.9 Esteem Need or Ego Need................................................................................7
2.3.10 Self-actualization Need.....................................................................................7
2.3.11 Application of Maslow’s Hierarchy of Needs Theory.....................................7
2.4 General Discussion of the Topic.......................................................................7
2.4.1 Classification of Labour Turnover....................................................................7
2.4.2 The Measurements of Labour Turnover...........................................................7
2.4.3 Median Length of Service (MLOS)..................................................................7
2.5 Empirical Study................................................................................................7
2.6 Research Gap....................................................................................................7
2.7 Conceptual Framework for Labour Turnover...................................................7
CHAPTER THREE....................................................................................................7
ix

3.0 RESEARCH METHODOLOGY......................................................................7
3.1 Research Paradigm...........................................................................................7
3.2 Research Design...............................................................................................7
3.2.1 Area of the Study..............................................................................................7
3.2.2 Population of the Study.....................................................................................7
3.2.3 Sample and Sampling Techniques.....................................................................7
3.3 Data Collection.................................................................................................7
3.3.1 Types of Data.....................................................................................................7
3.3.1.1 Primary Data....................................................................................................7
3.3.1.2 Secondary Data................................................................................................7
3.3.2 Data Collection Method...................................................................................7
3.3.2.1 Questionnaire...................................................................................................7
3.4 Data Analysis....................................................................................................7
3.5 Validity of Data................................................................................................7
3.6 Reliability of Data.............................................................................................7
3.7 Research Ethics and Standards.........................................................................7
CHAPTER FOUR......................................................................................................7
4.0 DATA ANALYSIS AND PRESENTATION OF FINDINGS.......................7
4.1 Introduction.........................................................................................................7
4.2 Data Processing and Analysis..............................................................................7
4.3 Summary of Findings..........................................................................................7
4.4 Discussion of Findings........................................................................................7
CHAPTER FIVE........................................................................................................7
5.0 CONCLUSION AND RECOMMENSDATION...............................................7
x

5.1 Introduction.........................................................................................................7
5.2 Conclusion...........................................................................................................7
5.3 Recommendations...............................................................................................7
5.3.1 Recommendations Pertaining to Human Resource Strategies............................7
5.3.2 Orientation and Socialization..............................................................................7
5.3.3 Training and Development..................................................................................7
5.3.4 Recognition.........................................................................................................7
5.3.5 Flexible Benefits.................................................................................................7
5.3.6 Climate of Participation In Decision-Making.....................................................7
5.3.7 Regular Survey....................................................................................................7
5.3.8 Promotion............................................................................................................7
5.3.9 Conditions of Service..........................................................................................7
5.4 Limitation of the Study.......................................................................................7
5.5 Areas for Further Research..................................................................................7
REFERENCES...........................................................................................................7
APPENDICES.............................................................................................................7
xi

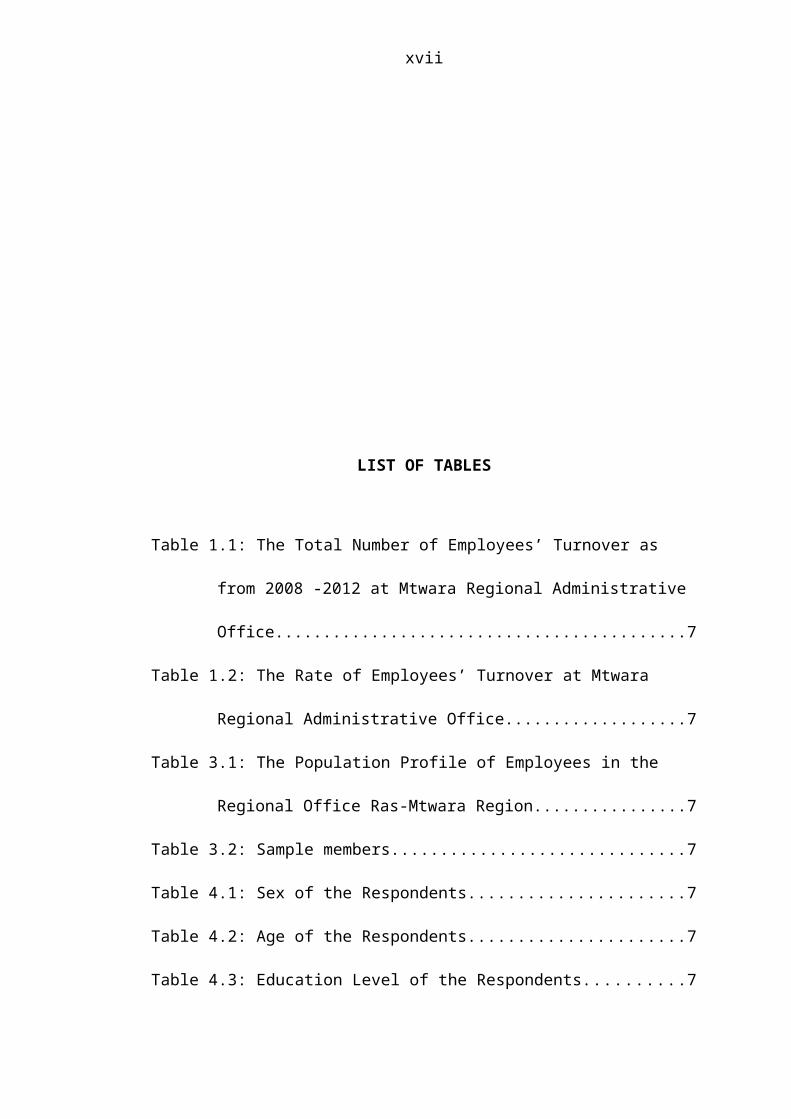
LIST OF TABLES
Table 1.1: The Total Number of Employees’ Turnover as from 2008 -2012 at
Mtwara Regional Administrative Office......................................................7
Table 1.2: The Rate of Employees’ Turnover at Mtwara Regional Administrative
Office...........................................................................................................7
Table 3.1: The Population Profile of Employees in the Regional Office Ras-Mtwara
Region..........................................................................................................7
Table 3.2: Sample members.........................................................................................7
Table 4.1: Sex of the Respondents...............................................................................7
Table 4.2: Age of the Respondents...............................................................................7
Table 4.3: Education Level of the Respondents...........................................................7
Table 4.4: Position of the Respondents........................................................................7
Table 4.5: Functional Areas at which the Respondents’ Belong..................................7
Table 4.6: Employees’ Length of Service....................................................................7
Table 4.7: Individual Factors Pertaining to Labour Turnover......................................7
Table 4.8: Job Related Factors Pertaining to Labour Turnover...................................7
Table 4.9: Organization Factors Pertaining to Labour Turnover.................................7
Table 4.10: Environmental Factors Pertaining to Labour Turnover............................7
Table 4. 11: Retention Strategies in the Organization..................................................7
xii
LIST OF FIGURES
Figure 2.1: Maslow Hierarchy of Needs......................................................................7
Figure 2.2: Conceptual Framework..............................................................................7
xiii

LIST OF APPENDICES
Appendix I: Time Schedule.........................................................................................7
Appendix II: Interview Questions...............................................................................7
xiv

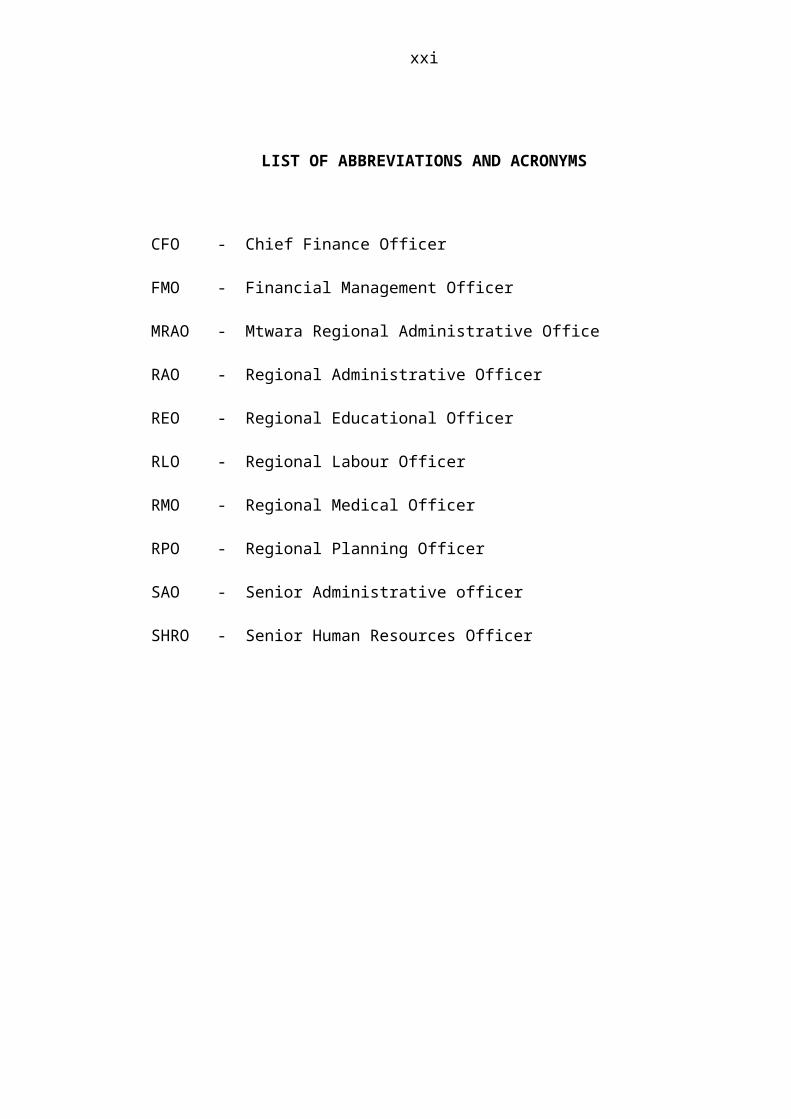
LIST OF ABBREVIATIONS AND ACRONYMS
CFO - Chief Finance Officer
FMO - Financial Management Officer
MRAO - Mtwara Regional Administrative Office
RAO - Regional Administrative Officer
REO - Regional Educational Officer
RLO - Regional Labour Officer
RMO - Regional Medical Officer
RPO - Regional Planning Officer
SAO - Senior Administrative officer
SHRO - Senior Human Resources Officer
xv
CHAPTER ONE
1.0 INTRODUCTION
1.1 Background of the Problem
For any business to function and prosper, it needs a reliable and consistent source of
labour. A critical shortage of experienced personnel is still a problem in Tanzanian
organizations. Every trained personnel becomes an asset of considerable value and
presents Management with the challenge of retaining him or her satisfied and well
settled. Excessive turnover is costly, disruptive and self-perpetuating, Cotzer (2006).
It has been found that the impacts of labour turnover is very challenging and it is one
of the emerging phenomenon in contemporary Human Resource Management which
has prompted Human Resource Managers to think further on labour market issues
and technological advancement in most organizations.
The analysis of the numbers of people leaving the organization (labour turnover or
wastage) provides data for use in supply forecasting, so that calculations can be made
on the number of people lost who may have to be replaced M Armstrong (2006).
More importantly, however, the analysis of the number of leavers and the reasons
why they leave provides information that will indicate whether any action is required
to improve retention rates. It can prompt further investigations to establish
underlying causes and identify remedies.
The phenomenon of labour turnover is of interest to organizations and theorists
because it is significant (Price, 1977) and potentially costly (Mobley, 1982). Thus no
employer can ignore the issue of labour turnover within organizations since the costs
1
of labour turnover make up the largest proportion of operation costs of businesses
and organization. This makes manpower planning in an organization imperative.
This is because there is great cost if highly qualified, experienced and trained
employees leave. In reviewing and monitoring turnover rates and the factors
influencing labour turnover, the management can be in a position to improve on
these factors hence managing labour turnover.
Regardless of good planning, organizations cannot retain all their employees since in
reality; staff wastage has to occur through retirement, transfers, dismissals, natural
deaths and resignations Clowe, (1972). Every time an employee leaves his or her
employer, there are either negative or positive consequences to the organization.
Mungumi, (2002) in her study outline the following as the consequences of labour
turnover. Hiring costs involving time and facilities for recruitment, interviewing and
examining a replacement, secondly, the scrap and waste rates climb when new
employees are involved, thirdly, over time pay may result from excessive number of
separations, causing trouble in meeting contract delivery dates. Fourthly, training
cost involving the time of supervisor’s, personnel department and trainees.
Other reasons include; higher accident rates for new employees, loss of production in
the interval between separation of the old employees and replacement, lack of
utilizing the production equipment during the hiring interval and the training period,
administrative costs of removing from and adding to payroll, loss of highly qualified
employees, decreased commitment to those employees remaining in the organization
and loss of employees who have the potential for advancement deprives the
organization of future opportunities for promotion from within.
2

The positive consequences of labour turnover are; less stress and better use of skills
and renewed interest in work for those who leave, financial advantage; increased
innovation, cross breeding between old and new employees, separation creates
opportunities to hire from diverse background and to redistribute the cultural and
gender composition of the workforce, career opportunities elsewhere for those who
leave, reduced labour costs, replacement of poor performance, infusion of new
knowledge by new employees, stimulates change in bad policies and increased
satisfaction for those who stay.
Labour turnover within an organization is a normal part of organizational functioning
and while a certain level of turnover is to be expected and be beneficial to the
organization, excessively high turnover may be dysfunctional to the organization
Armstrong, (2004). Yoder and Staudohar (1982) argued that when an employee
leaves an organization, it has a variety of effects that not only impact on the
organization but also the individual employee and the wider society.
Table 1.1: The Total Number of Employees’ Turnover as from 2008 -2012 at
Mtwara Regional Administrative Office
Male Female Total
Actual turnover 35 34 69
Number of deaths 5 3 8
Retirement 10 7 17
Transfer 28 37 65
Source: Regional Records Office, (2013)
3

The effects of labour turnover are the driving forces that compel managers to look at
this issue in depth. It is because of these effects that managers are starting to see staff
turnover as a problem that needs attention. The table below provides a clear picture
on the magnitude of the problem for Mtwara Regional Office as from 2008 through
2012.
1.2 Statement of the Problem
The question of labour turnover is very challenging since most people are not aware
of the real factors that bring about labour turnover. For instance Managers beliefs
that labour turnover takes place because employees are after green pasture, yet
employees themselves believes that leaving their current job meaning to seek a good
job with more pay.
The logical question in mind is that, do employees leave their current job only
because of green pastures? Also what about Laws, Regulation and various policies
say concerning labour movement? Public service Act N0 8 0f 2002 allows free
employees movement. That’s why the researcher came up with an information gap,
making some findings so that we can do the best to educate employers, employees
and the society on what to do so that the problem is tacked.
The report from Mtwara regional Administrative Office reveals that there are a
substantial number of employees leaving out of the organization. It is over five years
now that the magnitude of the problem increases year after year. The table below
provides an actual data obtained from Mtwara Regional Administrative Office
4

through survey. It is clearly indicating the actual number of people employed in each
year, the rate of employees left (labour turnover), percentage rate of turnover,
transfer, Natural death, Retirement and those retained in the Office. These data were
drawn from functional areas of Human Resource & Administration, Planning
section, Education section, Health section and Finance section. In most cases it
covers senior staff, junior staff as well as Operators (doers).
Table 1.2: The Rate of Employees’ Turnover at Mtwara Regional
Administrative OfficeYears Overall
employees
Employees
turnover
Male Female Percentage
rate%
Transfer Natura
l deaths
Retirement Retained
employees
2008 82 6 3 3 7.3% 40 3 6 27
2009 52 10 8 2 19.2% 16 3 4 19
2010 46 11 5 8 23.9% 4 1 2 28
2011 24 13 4 9 54.2% 2 1 2 8
2012 30 13 7 6 54.2% 1 13
2013 27 16 8 9 59.3% 2 1 8
Total 261 69 35 34 65 8 17 103
Source: Regional Record’s Office, (2013)
From the analysis above it has been found that the rates of employees’ turnover have
been increasing from year to year and it can be evidenced by the fact that the public
service recruitment is recruiting and engaging employees for the Office every year
without expansion of the Regional infrastructure. This tendency now, becomes a
serious problem because the Office is likely to incur a lot of expenses for
5
recruitment, selection, placement, orientation, induction, and training in steady of
retaining and developing competent and well experienced workforce.
The CIPD (2000) has commented that, labour turnover may be a function of negative
job attitudes, low job satisfaction, combined with an ability to secure employment
elsewhere, i.e. the state of the labour market. In today’s competitive business world,
it is considered to be an important task to manage labour turnover for any
organization. Naturally people want diversities in their everyday life; seeks for new,
challenging jobs and good working environment in job place. To provide these things
to the employees in an economic way is very difficult and cumbersome. But it is also
crucial for any organization to retain its talented employees. Every organization
wishes to have high performance fewer turnovers and to be profitable. Managing
turnover successfully is a must to achieve the above goals.
In Tanzania, it is very important to manage turnover for both government and non-
government sectors. In government sectors, although some fringe benefits are given
to the employees regularly do not satisfy them sufficiently. In private sectors, though
salary and benefits are high but security of job is less. Due to these reasons turnover
rate in private sectors are higher than public sectors.
Very few researches have been conducted related to labour turnover in Tanzania so
far. The owners of the business organizations do not concentrate on this important
issue because of less awareness. They have little idea about how detrimental the
effect of turnover is into the performance of their organizations.
6

1.3 General Objective
The general objective of this study is to assess the impacts of labour turnover on
Organizational performance.
1.4 Specific Objectives
(i) To examine the factors that influence labour turnover.
(ii) To determine how the impacts of labour turnover affect organizational
performance in the Regional Administrative Office.
(iii) To suggest the best way to curtail labour turnover and facilitate retention
1.5 Research Questions
(i) What are the causes of Labour turnover in Mtwara Regional Administrative
office?
(ii) How does the impact of labour turnover affect organizational performance?
(iii) What are the measures / strategies that can be addressed to retain employees?
1.6 Significance of the Study
The study will help the Management to forecast for demand and supply of labour and
therefore establish strategies for the retention of employees. Through this study the
Management will recognize various methods through which employees remain well
settled, retained and satisfied. Through this study Mtwara Regional Office will have
a clear picture of scheduling concerning planning, job analysis, recruitment,
selection, placement, training, induction, promotion, demotion and categorization.
The study also will help the Management to understand employee’s morale,
commitment, engagement and how to reward them appropriately.
7

The Management will learn and understand that turnover is a function of negative job
attitudes, low job satisfaction, combined with an ability to secure employment
elsewhere, i.e. the state of labour market. On the other hand, to the researcher, apart
from being a compulsory research paper for fulfillment of Master Degree of Human
Resources Management is also vital to extend knowledge on finding solutions to
various social, business, and public problems. Thus the study will certainly
contribute much on the organization’s performance and eventually development of
stakeholders on the business respective
1.7 Limitation of the Study
The methodology of this study seems to be very challenging. In this case it includes
approaches of data collection such as interview, questionnaires and direct
observation. It is a challenging issue because the sample job leavers lacks uniformity
with regard to the situation they experience at Workplace. Thus the approaches of
data collection will not be consistent.
1.8 Delimitation of the Study
The researcher has been delimitated to Mtwara Regional Administrative Office and
all findings which will be obtained regarding the impacts of labour turnover on
organizational performance will not be used as a model of other Business
organizations in Tanzania and across the World.
8
1.9 Scope of the Study
The aim of this research is to describe the impact of labour turnover on
organizational performance. Generally the study focuses on the theoretical aspect of
labour turnover covering content, classification and methods of measuring it. The
special emphases were given on the strategies that can be addressed to retain
employees at Mtwara Regional Office.
CHAPTER TWO
2.0 LITERATURE REVIEW
2.1 Introduction
This chapter presents a through literature conducted by the researcher so as to review
different arguments given by other writers on the same study on the impact of labour
turnover to the organization performance in Tanzanian public organizations, a case
of Mtwara Regional Office. The chapter starts with the general concepts of labour
turnover by giving definitions of the key terms, strategies which are used by various
public organizations to retain their employees, classifications of labour turnover,
methods of measuring it, and different theories explaining labour turnover and their
impact to the organization performance.
2.2 Definitions of the Key Terms
2.2.1 Labour Turnover
Labour turnover refers to the rate of change in the workforce of an enterprise during
a given period. It has been defined as the time-to-time changes in the composition of
the workforce that result from hiring, release and replacement of employees M,
9
Armstrong (2006). C.B Gupta (2003) defined Labour turnover as a measure of the
extent to which employees leave and new employees enter the service of concern
Muntaner et al. (2006) offer more detailed explanation of labour turnover:
“Employee turnover occurs when workers leave their positions in organizations.
Their reasons for leaving jobs are a measure of employee morale. The rate of
employee turnover is one measure of the commitment of employees to organizational
goals. Turnover is determined partly by organizational policy and management
through factors such as salary, benefits, promotions, training and work schedules,
and partly by personal factors that are largely beyond employer’s control – for
example, an employee’s desire to relocate”.
Torrington D., (2005) have pointed out that, there is little that an organization can do
to manage turnover unless there is an understanding of the reasons for it. Information
about these reasons is notoriously difficult to collect. Most commentators
recommend exit interviews (that is, interviews with leavers about their reasons for
resigning), but the problem here is whether the individual will feel able to tell the
truth, and this will depend on the culture of organization, the specific reasons for
leaving and support that the individual will need from the organization in the future
in the form of references. The same author suggested that Labour turnover can be
grouped into two major factors as described hereunder:
(i) Push factors
With push factors the problem is dissatisfaction with work or the organization,
leading to unwanted turnover. A wide range of issues can be cited to explain such
10

resignations. Insufficient development opportunities, boredom, ineffective
supervision, poor levels of employee involvement and straightforward personality
clashes are most common precipitating factors.
(ii) Pull factors
The opposite side of the coin is the attraction of rival employers. Salary levels are
often a factor here; employees are leaving in order to improve their living standards.
In addition there are broader notions of career development, the wish to move into
new areas of work for which there are better opportunities elsewhere, the chance to
work with particular people, and more practical questions such as commuting time.
2.2.2 Organization Performance
Organizational performance comprises the actual output or results of an organization
as measured against its intended outputs (or goals and objectives). Richard et al.
(2009). It involves the recurring activities to establish organizational goals, monitor
progress toward the goals, and make adjustments to achieve those goals more
effectively and efficiently. Organizational performance comprises the actual output
or results of an organization as measured against its intended outputs (or goals and
objectives, Richard et al. (2009).
Organizational performance is simply influenced by the skills, ability, knowledge,
competencies, and experiences of the available workforce in the organization.
However additional attributes such as favorable environment and motivation can be
used as a complement, Researcher (2013).
11

The key to win turnover is valuing all people’s contributions to the organization,
recognizing their strength and respecting their ideas Berta, (2002). Lack of
recognition of contributions from employees and rewards for such contributions may
also influence the rate of turnover. Employees need to feel that someone cares and
that they are an important part of the team. This recognition need not to be in the
form of money. It can be either tangible or intangible. Calling the worker into the
office and mentioning the good work done is enough (Nene, 2002). Tangible
recognition comes in many forms such as employee of the month and perfect
attendance certificates.
2.3 Critical Theoretical Review
The impact of labour turnover has received considerable attention by senior
management, human resource professionals, and industrial psychologists. It has been
proven to be one of the most seemingly intractable human resource challenges
confronting organizations SIGMA, (2007). Labour turnover is a readily measurable,
objective behavior that can have critical consequences for the worker and the
organization.
2.3.1 Demand Forecasting Theory
M Armstrong, (2006) overstated that demand forecasting is the process of estimating
the future numbers of people required and the likely skills and competences they will
need. The ideal basis of the forecast is an annual budget and longer term business
plan, translated into activity levels for each function and department, or decisions on
12

‘downsizing’. From this information the number of hours to be worked by each skill
category to make the quota for each period would be computed. Details are required
of any plans or projects that would result.
2.3.2 Supply Forecasting Theory
Supply forecasting measures the number of people likely to be available from within
and outside the organization, having allowed for attrition (labour wastage and
retirements), absenteeism, internal movements and promotions, and changes in hours
and other conditions of work.
The theory of demand and supply of labour shows the projection which depicts the
right number of the right employees in right place at the right time, D, Torrington
(2005). The demand for manpower is influenced by corporate strategies and
objectives, the environment and the way that staffs are utilized within the business.
The supply of manpower is projected from current employees (via calculations about
expected leavers, retirements, promotions etc) and from the availability of the
required skills in the labour market.
One of the greatest objections of these forecasting theories is that they are
hypothetical in nature and therefore they cannot provide an actual data or clear
picture concerning future projections of labour. The demand and supply forecasts can
then be analyzed to determine whether there are any deficits or surpluses. This
provides the basis for recruitment, retention, and if unavoidable downsizing, plans.
With this idea therefore demand and supply forecasting theories are relevant in the
13

study of impacts of labour turnover on organizational performance as it gives a
roadmap for anticipating the requirement of manpower within the organization.
2.3.3 Economic Theories Explaining Pay Levels
Armstrong, M (2006) has pointed out various theories related to pay levels as
described hereunder:
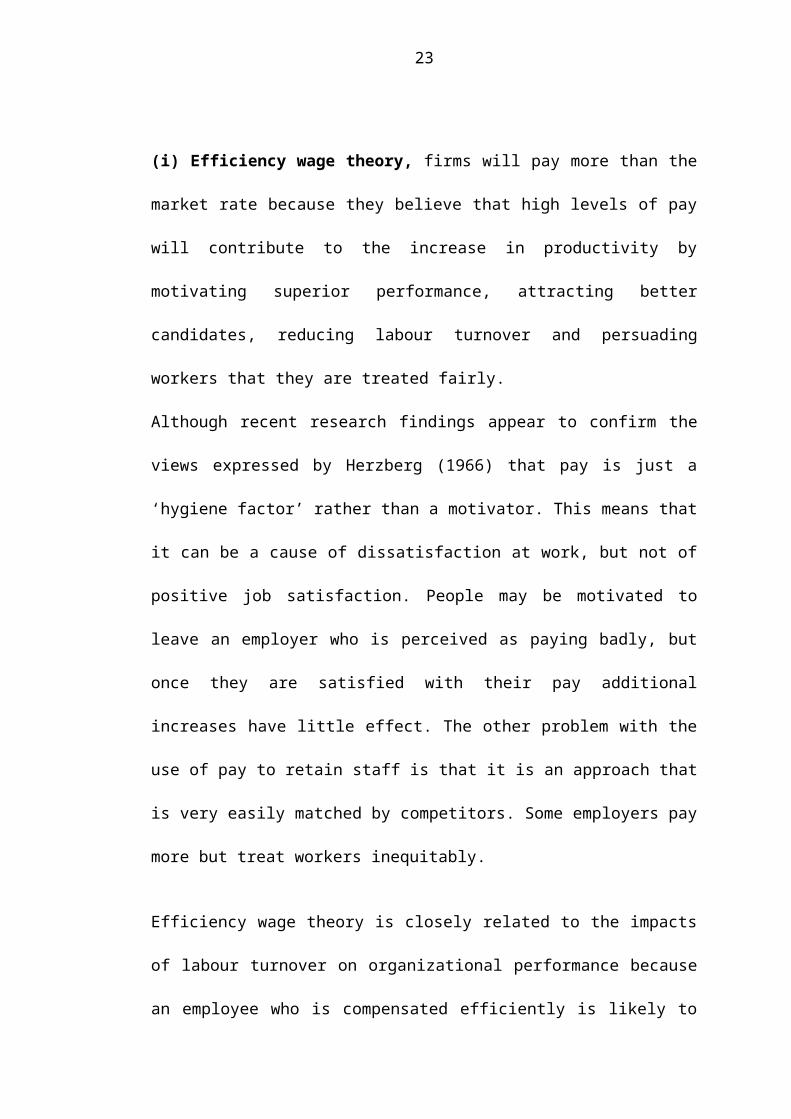
(i) Efficiency wage theory, firms will pay more than the market rate because they
believe that high levels of pay will contribute to the increase in productivity by
motivating superior performance, attracting better candidates, reducing labour
turnover and persuading workers that they are treated fairly.
Although recent research findings appear to confirm the views expressed by
Herzberg (1966) that pay is just a ‘hygiene factor’ rather than a motivator. This
means that it can be a cause of dissatisfaction at work, but not of positive job
satisfaction. People may be motivated to leave an employer who is perceived as
paying badly, but once they are satisfied with their pay additional increases have
little effect. The other problem with the use of pay to retain staff is that it is an
approach that is very easily matched by competitors. Some employers pay more but
treat workers inequitably.
Efficiency wage theory is closely related to the impacts of labour turnover on
organizational performance because an employee who is compensated efficiently is
likely to have high performance compared to the one who is not well remunerated.
Furthermore, if workers are paid a higher wage than they would get at other firms
14

they are less inclined to quit their job thus decreasing the firms’ turnover. The firms
thus save itself the cost of hiring and training new workers
2.3.4 The Effort Bargain Theory
Workers aim to strike a bargain about the relationship between what they regard as a
reasonable contribution and what their employer is prepared to offer to elicit that
contribution. In applicability the Management has to assess what level and type of
inducements it has to offer in return for the contribution it requires from its
workforce.
The major critique of this theory is that the actual wage rate which is ultimately
embodied in collective bargaining agreement depends upon the relative bargaining
strength of the employer and employee.
This theory has a direct link to the study of impacts of labour turnover on
Organizational performance in that a sound relationship between employers and
employee tends to retain employee and thereby increasing organizational
performance unlike poor relations among them.
2.3.5 Abraham Maslow’s Theory of Need Hierarchy
Abraham, Maslow (1940-1950) suggested that every individual has complex set of
needs at any particular moment and his behavior is determined by the existence of
strongest need. He stated that human beings have five types of needs and
physiological need is the strongest hence the individual behaves in a particular
manner to satisfy that need.
15

Figure 2.1: Maslow Hierarchy of NeedsSource: Researcher (2013)
Needs are hierarchal in nature and only one need dominates at any one point of time.
Once the strongest need is satisfied then the second need emerges as being the
strongest need and human behavior is regulated in process of achieving satisfaction
in series of need requirements. Maslow further, stated that there is only one need
satisfying process is under way at any one time. They do not disappear once they are
satisfied but their intensity is reduced (relegated) below the subsequent needs.
Maslow’s Hierarchy of Needs is shown above. The pyramid illustrates the five levels
of Human Needs. The most basic are physiological and safety/security, shown at the
base of the pyramid. As one moves to the higher levels of the pyramid, the needs
16

become more complex. Needs which are commonly used in the theory and its
meaning is given below.
(a) Physiological Needs – Decoration, Vibration, Temperature, Space, Noise, Gas,
exercise, sleep and Canteen facilities.
(b) Security Needs – Job description, regularity, role clarity, structure,
communication, safety report meetings, agreements, economic security,
freedom from threat and contracts.
(c) Social Needs – Joint Tasks, appreciation, sharing offices, recognition and team
membership.
(e) Self – esteem – Being consulted, rank (prestige), success, achievement,
encouragement, recognition from others, pre-requisites, and status.
(f) Self-actualization, Professional growth, autonomy, worthwhile job,
opportunities for innovation and creativity, learning and creating at high level.
2.3.6 Physiological Needs
As per Maslow physiological need is strongest in human being and hence it has
highest strength as compared to the other needs. Individual behaves in a particular
manner to satisfy basic bodily needs like hunger; thirst, shelter and clothing. These
needs keep dominating unless they are reasonably satisfied. Human being is
therefore motivated to work in that direction.
17
2.3.7 Safety Needs or Security Needs
Once the physiological need of an individual is satisfied, the safety need /security
need arises and is dominant at that point of time. This need is related to the
following:
(a) Every worker is concerned about his personal safety and wants to be free of
Physical danger.
(b) There are various dangerous processes in the work setting. Individual desires to
be free and work toward self-preservation.
(c) Safety need is also related to employee/employer relationship, which should be
cordial and free from any threat to job security.
(d) There should be certainty in the job and non-existence of arbitrary action on
the part of management/employer.
(e) Administration policy of any organization must cover various points that are
related to safety of an individual like pay, pension, insurance, and gratuity.
Individual should be given opportunities for choice of job so that he derives
satisfaction. He must also be given adequate security against being fired, laid
off or demotion.
2.3.8 Social Needs
Once the safety need is satisfied, third need i.e. social need arises. People want to
belong to some social group where their emotional need of love, affection, warmth
and friendship are satisfied. Being member of sports club, social organizations or
being the company of friends and relatives needs can satisfy Social. In the work
18

setting individuals want to be member of work group and contribute towards it so
that the social need of the individual is fulfilled.
2.3.9 Esteem Need or Ego Need
Fourth need in the hierarchy of needs as suggested by Maslow is Esteem need or Ego
need. Individual wants self-recognition, appreciation for the work done. It is related
to self-respect, self-confidence, praise, power and control. If these needs are satisfied
it gives an individual a sense self-worth and ego satisfaction.
2.3.10 Self-actualization Need
Self-actualization is the last need in the need hierarchy. Once esteem need is
satisfied, there appears the self-actualization need of human being. It is related to an
intense carving for something supreme one wants to achieve in life. It is transcended
and related to achieving the very best that may be possible of human endeavor.
People set high goals, achieve them and set a higher goals again and to achieve the
same by utilizing fullest potential. It is related to development of intrinsic
capabilities. An individual seeking to satisfy self-actualization need seek situations or
jobs that are challenging in nature -achievement of highest value out of the work.
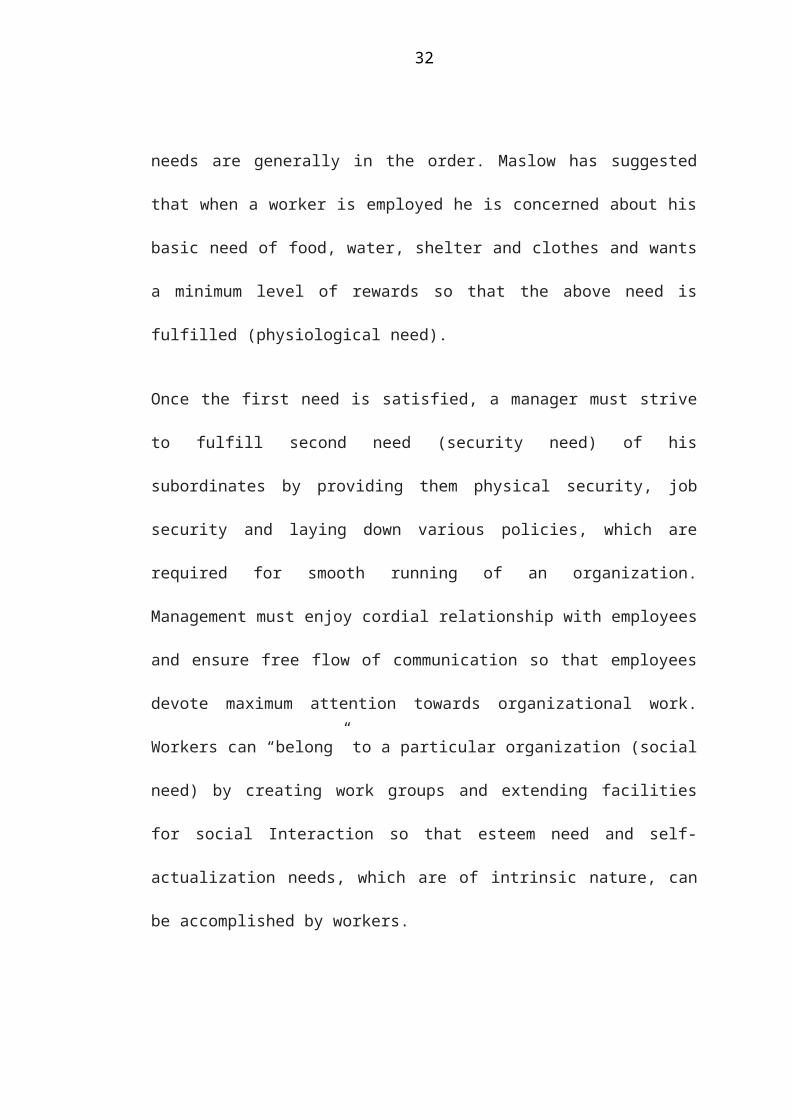
2.3.11 Application of Maslow’s Hierarchy of Needs Theory
Maslow’s Theory of motivation and its nature of hierarchy of needs lays down a
systematic approach a manager can apply to motivate his subordinates. It will be
seen that needs are generally in the order. Maslow has suggested that when a worker
is employed he is concerned about his basic need of food, water, shelter and clothes
19

and wants a minimum level of rewards so that the above need is fulfilled
(physiological need).
Once the first need is satisfied, a manager must strive to fulfill second need (security
need) of his subordinates by providing them physical security, job security and
laying down various policies, which are required for smooth running of an
organization. Management must enjoy cordial relationship with employees and
ensure free flow of communication so that employees devote maximum attention
towards organizational work. Workers can “belong” to a particular organization
(social need) by creating work groups and extending facilities for social Interaction
so that esteem need and self-actualization needs, which are of intrinsic nature, can be
accomplished by workers.
Maslow Hierarchy of Needs Theory is relevant in the study of impacts of labour
turnover on organisation performance since, if an employee is provided with all these
needs he is likely to stay for a long time and remain well settled and satisfied,
contrary to the one who is lacking these needs, however Maslow has been criticized
for laying down needs in particular order. But in reality it may not be so.
For Example a person may like to ‘belong’ to a particular organization or a social
group and his social need may be dominant as compared to the physical need or the
safety needs. On the other hand a worker who is a sole income earner for the whole
family may feel job security as his most dominant need. It is therefore fair to state
that we may not find the needs in the given order and that the strength of particular
need is situation-based. It is therefore necessary that the contingency approach
20

should be adopted by various managers while applying the model to real life
situations in the organization.
2.4 General Discussion of the Topic
Schultz et al. (2008,) define labour turnover as the movement of employees in and
out of the boundaries of the organization. Considering this definition, transfers to a
different branch or plant would not be considered as staff turnover. Staff turnover is
perceived as a final and permanent act. These authors also distinguish between
controllable and uncontrollable turnover.
2.4.1 Classification of Labour Turnover
(i) Controllable turnover includes both voluntary resignations and dismissals.
Voluntary resignations are controllable because management can offer better wages,
working conditions and opportunities to retain employees, while dismissals are
controllable because management can use more constructive strategies, such as
training, unambiguous policies on discipline and coaching, to shape an employee’s
behavior to a desired level rather than dismissing the employee.
Dismissal can also be avoided if due attention is given to the selection of suitable
persons and encouragement of stable groups through careful induction procedures
and proper socialization.
(ii) Uncontrollable staff turnover refers to turnover which is outside the control of
management, such as turnover as a result of death, retrenchments and incapacity.
Price (1997) also states that a distinction has to be made between avoidable and
21

unavoidable turnover. Avoidable turnover is considered as controllable in the sense
that management could have minimized or prevented such loss.
Schultz and Schultz (2006) state that retrenchments due to cost-cutting measures can
be regarded as involuntary turnover. Though they do not make an explicit
comparison between involuntary and voluntary turnover, the implication is that when
an employee makes the decision to leave the organization, it is considered as
voluntary turnover.
Nel et al. (2008, p.584), as stated above, distinguish between voluntary resignations
and dismissals, but consider both as controllable staff turnover. Schenk et al. (2003)
also distinguish between voluntary (resignations) and involuntary (dismissals) staff
turnover and mention that both of these types of staff turnover should be measured.
Grobler et al. (2006) define turnover in the same way as Nel et al. (2008). Grobler
states that turnover is the movement of employees out of the organization. High
labour turnover can impact negatively or positively on an organization’s capacity to
meet its organizational objectives and needs. The effects of labour turnover are the
driving forces that compel managers to look at this issue in depth. It is because of
these effects that managers are starting to see staff turnover as a problem that needs
attention.
2.4.2 The Measurements of Labour Turnover
As previously mentioned, recruitment, hiring and induction are costly exercises to
any organisation, especially to those experiencing high staff turnover. When
22
measuring the rate of turnover, the organisation wants to know how many people are
leaving, who are leaving, and for what reasons. Various measures can be used to
determine the extent and nature of staff turnover.
The most important measures, which must be read together to get a more
comprehensive picture of staff turnover in the organisation, are the staff turnover rate
(LTR), median length of service (MLOS) and percentage voluntary turnover (%V). It
was stated earlier that only voluntary resignations and dismissals are included in the
measurement of staff turnover, as these forms of turnover are considered as
controllable.
(a) The staff turnover rate (LTR)
According to Nel et al. (2003, p.586), the most commonly used measure for staff
turnover is the staff turnover rate (LTR). The LTR gives an indication of the
percentage of employees that leave the organisation over a period of time. The LTR
is calculated by the means of the following formula:
Number of leavers during a period (V + D)
----------------------------------------------------------- x 100
Average of number in employment during period
It should be noted that the monthly LTR may fluctuate considerably and therefore the
calculation of quarterly or yearly rates are recommended as being more reliable. For
comparative purpose, rates should always be expressed on a per annum basis,
irrespective of the period over which they are calculated. In other words, if a monthly
23

LTR is calculated, it should be multiplied by 12 (months), if a quarterly LTR is
calculated, it should be multiplied by four (terms).
Staff turnover of 25 percent per year is considered respectable in a moderately large
organisation. A turnover rate of between 30 to 35 per cent indicates that the
company is most likely incurring huge costs in the hiring and recruitment of
employees who will probably leave the organisation after some time (Beard well &
Holden, 1994). Some industries experience more staff turnover than others due to the
nature of the business.
For example, a high staff turnover is experienced among part-time employees in the
retail industry. Furthermore, the economic situation and availability of alternative
jobs also impact on staff turnover. Furthermore, the economic situation and
availability of alternative jobs also impact on staff turnover. It therefore makes sense
to compare the staff turnover rate with those of similar organizations.
2.4.3 Median Length of Service (MLOS)
According to Nel et al. (2008), the MLOS indicates at what stage of employment
employees leave. The MLOS is calculated by ranking the length of service,
expressed in months, at which each individual has left the company and then to find
the middle figure.
Should the length of service of employees who left be 1, 2, 3, 4, 5, 6 and 7 months
respectively, the MLOS will be 3 months since a median is simple, a middle term. A
short MLOS indicates problems with employment, induction, training, socialization
24

and also a lack of mentoring. A long MLOS indicates problems with advancement
opportunities or resistance to changes that have taken place in the organisation.
2.5 Empirical Study
Victoria M (2009) in her study “Staff turnover in selected Government Hospitals” in
south Africa used interview method through survey and found that factors related to
staff turnover are categorized into four namely individual factors, job related factors,
organizational as well as environmental factors. She has recommended that the
management should employ people who are well trained and who perceive their
work as a calling. Organizations should not only employ to fill a job but also
consider a fit between a person and the organization. The management also should
give attention to both hygienic factors and motivators.
In addition the management should give attention to those factors that they can
control including communication with the staffs, fair treatment, and recognition for
effort and performance. To the large extent the study is closely related to my research
as it point out similar factors for labour turnover.
Zheng W. (2010) on his research paper entitled “employee turnover model and
development in perspective of performance “used a survey study to identify factors
for employee’s turnover such as person –job fit (p-j) fit, matching employee skills
knowledge and abilities with the job related tasks, (p-g fit) matching employee
knowledge, skills and abilities with the work group, (p-o fit) matching employees
25
interests, values, and needs of the organizational culture, group-innovation based
competencies, and organization-culturally based competencies.
Derek et al. (2007) from interdisplinary journal of contemporary business research,
suggested job satisfaction and affective commitment as the basic variables with
turnover intentions. He further argues that no support was found in the results for
continuance dedication as a variable with turnover intentions. The results also
concluded that significant positive correlations were found for the distal variables
workload, work stress, employee salary, job satisfaction, and work to family conflict.
Damaris J (2007) on his study “labour turnover in private security firms in Kenya”
found that the factors that influence labour turnover are; low pay, sickness, long
working hours, misconduct, change of careers, and lack of career prospects. He then
recommended that private guards be paid a salary at least within the minimum
government requirement.
The working conditions of the private security guards need to be improved. Thirdly,
the management should be able to create job satisfaction to the employee. This can
be done by doing job redesign which involves identifying the elements in a job that
create satisfaction and dissatisfaction. Fourthly, since most people are opportunity
seekers, employees should be aware of the opportunities that exist inside the
organization. Finally the general public should be sensitized on the important role the
private security guards play in our society and therefore should not be looked down
upon.
26
Namasaka D, (2003) carried out a study on the “effect of staff turnover on the
employee’s performance of work” and found that staff turnover negatively affects
customer satisfaction. Whenever staffs leave an organization, services rendered to
customers are interfered with. Customers are not attended to in time due to shortage
of staff. Tyson and Fell (1986) observe that in the event that one staff leaves the
organization, customers are among the first to know that work is not being done well.
In some cases, those who take the jobs of those who have exited are not so efficient,
or not so familiar with the procedures. The slow rate of service to customers lowers
customer satisfaction levels and thus spoils the reputation of the organization.
He thus recommended that Staff turnover has negative administrative effects on the
organization; in addition, staff turnover has negative financial effects on the
organization; and Staff turnover negatively affects the social set up of an
organization. The study recommends that: The management should proactively and
always hasten the replacement of those staff who the organization to reduce the
negative effect brought about by the staff who leave; Management should improve
the terms and conditions of services to improve on the staff retention rate so as to
avoid liabilities caused by staff turnover.
2.6 Research Gap
Labour plays a significant role for organizational performance. Mtwara Regional
Administrative office has been providing several strategies to ensure that their
employees are well settled and satisfied. Employees are an asset of any organization
and therefore Managers must lay down high performance standards coupled with
27

high monetary and non-monetary rewards. Training & development programs should
be regularly organized to improve employee skills, attractive incentives should be
offered not only to the top Management and seniors but also junior staffs ensuring
effective communication, improving carrier opportunities and to give people as much
autonomy as they can handle.
The most important thing to cover is the so called psychological contract which
refers to the expectation that employees have about the role that they play and what
the employer is prepared to give them in return D Torrington (2005). The
psychological contact manifest in terms of conditions of employment, remuneration
arrangements and the basic rules that govern employment relationship. It covers a
wide range of expectation about what each part think it will gain from the
relationship. By nature psychological contract is not a written contract rather it exists
entirely within people’s mind.
For instance the old psychological contract assumes that “I will work hard and act
with loyalty towards my employer, in return I expect to be retained as employee
provided I do not act against the interest of the organization, also I expect to be given
opportunities for the development and promotion, should the circumstances makes
this possible”.
By contrast the new psychological contract holds that “I will bring to my work effort
and creativity in return I expect salary that is appropriate to my contribution and
market worthwhile our relationship may shorten, I will remain for as long as I
receive the development opportunities, I need to build my carrier”.
28
The researcher will try to check up the weaknesses of the Regional Administrative
Office in provision of retention strategies to their employees for better performance.
He will also cover the gap by pointing the exact strategies through questionnaires
filled by the employees and the approaches used in determination of the best
organization.
2.7 Conceptual Framework for Labour Turnover
Figure 2.2: Conceptual Framework
Source Researcher, (2013)
The Figure 2.2 provides a summary of conceptual framework, where by the arrows
indicates two variables i.e. Independent variable-Labour turnover with its impacts,
and dependent variable that is organizational performance with its criteria’s. Thus the
end result of independent variable (labour turnover) has a direct negative impact on
dependent variable (organizational performance). Each performance criteria is
directly linked to a certain impact of labour turnover as shown by the arrow in the
sketch above. Labour turnover is commonly measured by staff turnover rate (LTR).
IMPACTS OF LABOUR TURNOVER
Slow down the performance
Affect social set up of organization
Increases the cost of hiring
PERFORMANCE CRITERIAS
Goal attainment
Succession planning in place
Stable manning level
ORGANIZATIONAL PERFOMANCE LABOUR TURNOVER
29

The LTR gives an indication of the percentage of employees that leave the
organisation over a period of time.
The LTR is calculated by the means of the following formula:
Number of leavers during a period (V + D)
----------------------------------------------------------- X 100
Average of number in employment during period
30

CHAPTER THREE
3.0 RESEARCH METHODOLOGY
3.1 Research Paradigm
Research methodology involves various tactics and approaches that are used to
conduct the study. The research approaches and techniques help the researcher to
achieve the research objectives. One of the most important things in research study is
to understand the nature of the study and generalizing it as qualitative or quantitative.
Kothari, (2004).
The study will be qualitative research as it had been overstated in chapter one for the
reason that, the nature of the organization under which the study is going to be
conducted and the kind of the information to be extracted, assessed and described by
the researcher.
According to Barnes, (2002), there are two research paradigms, namely; positivist
and phenomenology. The positivist claims that the source of knowledge is
observable and has measured variable. Phenomenology tends to draw upon the
methods that develop meaning from the participants’ point of view and generally
favor a qualitative approach to data collection and interpretation (Stiles, 2003).
The researcher will ensure that the information gathered from the staff are first
handed and reflecting the title of the study, as have been explained in chapter one. In
additional will ensure that the information support the study as qualitative or
descriptive.
31

3.2 Research Design
Qualitative research is concerned with qualitative phenomenon that is issues relating
to or involving quality or kind. For stance when the research is intended at
investigating individual, job, organizational and environmental factors that impact on
labour turnover. Quantitative research methods will be adopted primarily by the
researcher because it involves low number of respondents. Qualitative research on
the other hand is very important for exploring more practical issues and is high
entertained by many researchers in findings.
For exploring issues in any organization, qualitative research is more accurate and
important than quantitative research approach because cannot enable the researcher
to get a complete picture of what is needed in the study (Kothari, 2004). The study
will enable the researcher to gain the full knowledge, ideas, and demands of the
employees in the organization by gathering information through distributing
questionnaires to obtain information.
3.2.1 Area of the Study
The target population is the complete group of specific population elements relevant
to the research project, Kothari, (2004). The study is dedicated to Mtwara Regional
Administrative Office, and will be regarded as single research approach.
3.2.2 Population of the Study
The population to be interviewed has been selected from among the staffs of Mtwara
Regional Administrative Office. The researcher used one hundred and thirty (130)
employees as selected samples in collecting data out of 554 total staffs. These staffs
32

were picked up from Administration section, Planning section, Economics and
production section, Education section, Health section, and Local Government
Administration section. The sample comprised of top management/seniors and junior
staffs .The population profile is tabulated hereunder.
Table 3.1: The Population Profile of Employees in the Regional Office Ras-
Mtwara Region
RAS MTWARA
Capacity Female Female
Top Management/Senior 93 74
Junior (Operators) 253 134
Sub – total 346 208
Grand Total 554
Source: Regional Record’s Office, (2013)
3.2.3 Sample and Sampling Techniques
Colin and Fisher (2010) found that a sample is a representative of the whole
population. The purpose of taking a sample is to obtain a result that is representative
of the whole population being sampled without going to the trouble of asking
everyone. The problem is that no sample can be guaranteed to be representative. If
you could take a large number of different samples from the same population, some
would overestimate and some underestimate the true figure. The margin or limit of
error is a measure of this uncertainty in the representativeness of the sample.
Sampling technique is a definite plan for obtaining a sample from a given population
Kothari (2004). It refers to the sample design or the procedure the researcher would
33

adopt in selecting items for the sample. Sample design may as well lay down the
number of items to be included in the sample i.e., the size of the sample. Sample
design is determined before data are collected. There are many sample designs from
which a researcher can choose. Some designs are relatively more precise and easier
to apply than others. Researcher must select/prepare a sample design which should
be reliable and appropriate for his research study
The purpose of the sampling is to enable researcher to estimate some unknown
features of a population or organization, Kothari, (2004). In this study, one hundred
thirty (130) members of staffs from Mtwara Regional Administrative Office will be
interviewed to explore the fact and the reason for labour turnover and the impacts it
has to the organizational performance.
In this case probability sampling will be appropriate in the selection of members who
will act as respondents. This is because it is simple, and has no biasness as each
member gets equal chance of being selected to be included in the sample.
Table 3.2: Sample members
Capacity Male Female
Top Management/Senior 23 8
Junior (Operators) 48 51
Sub – total 71 59
Grand Total 130
Source: Mtwara Regional Secretariat Section, (2013)
34

This situation is true because every member of Staff has equal chance to provide the
information needed by the researcher. Thus Kothari, (2000), had assisted the
researcher to make decision on how samples will be obtained to complete the study.
3.3 Data Collection
Kothari (2004) pointed out that for the descriptive study, the survey data method of
collecting data will be needed. A survey is a research techniques in which
information are gathered from a sample of people using a questionnaire. In this study
the questionnaire will be used to seek responses from subjects. The questionnaire
will include both close and open ended questions.
The data to be collected are classified into primary and secondary data. Primary data
are those information obtained from the original source while secondary data are
those obtained as second hand data like from books and any other sources which is
not original (Kothari, 2004). The researcher will obtain the primary data in this study
because all the information will be obtained directly from the staff themselves. For
that reason the information will extract the truth about the problem, and make it to be
meaningful and useful.
3.3.1 Types of Data
3.3.1.1 Primary Data
Primary data are those collected from the source and for the first time, and thus
happen to be the original in nature Kothari (2004). In primary data, data collection
are done by the researcher himself through conducting interviews, focus group
interviews, observations, case studies, diaries, and or questionnaires.
35

The key issue here is that, the data collected are new, unique and are related to the
research only under which the researcher is dealing with until is published. For this
study the researcher will focus much on Primary information.
3.3.1.2 Secondary Data
Sometimes secondary data may be collected from libraries where other researchers
have collected without having direct use of the data. The study will involve
secondary data sometimes to get views from other researcher, particularly for those
did the same study. Kothari, (2004).
Secondary data are the ones which are already collected by other researchers for
different purposes or use. Usually secondary data are written documents and are used
as references. The sources of secondary data are mostly from publications, diaries,
journals, researches, surveys, newspapers, project write ups, census and other records
like Company or organizational records.
3.3.2 Data Collection Method
Data collection method refers to the tools or techniques used to collect data. Kothari,
(2004). The same author recommended that data-collection methods to be used are
also dependent at times upon economic factors. Convenience test suggests that the
measuring instrument should be easy to administer. For this purpose one should give
due attention to the proper layout of the measuring instrument. For instance, a
questionnaire, with clear instructions (illustrated by examples), is certainly more
effective and easier to complete than one which lacks these features.
36

Questionnaires will be sent to a large number of people to save the researcher’s time
and money .In addition questionnaires are free from the bias of the interviewer;
answers are in respondents’ own words and also large samples can be made use of
and thus the results can be made more dependable and reliable Kothari, (2004).
However the major objection of this method is that it is selective in the sense that it
can be used only when respondents are educated and cooperating. People are more
truthful while responding to the questionnaires regarding controversial issues in
particular due to the fact that their responses are anonymous. But they also have
drawbacks. Majority of the people who receive questionnaires do not return them and
those who do might not be representative of the originally selected sample Leedy and
Ormrod, (2001). Interview approach of data collection will also be applied by the
researcher to obtain some information directly to the employees from the Regional
Administrative Office - Mtwara Region. It will be orally and direct conversation
between the researcher and the respondents.
3.3.2.1 Questionnaire
A questionnaire consists of a number of questions printed or typed in a definite order
on a form or set of forms Kothari (2004). This method of data collection is quite
popular, particularly in case of big enquiries. The researcher will use questionnaires
in data collection because it often makes use of checklist and rating scales. These
devices will help to simplify and quantify employees’ behaviors and attitudes. A
checklist is a list of behaviors, characteristics, or other entities that the researcher is
looking for. Either the researcher or survey participant simply checks whether each
37
item on the list is observed, present, true and or vice versa. A rating scale is more
useful and the researcher is going to use it on completing the study.
Qualitative data collection methods play an important role in the impact evaluation
by providing information useful to understand the processes behind observed results
and assess changes in people’s perceptions of their well-being. Furthermore
qualitative methods can be used to improve the quality of survey-based quantitative
evaluations by helping to generate evaluation hypothesis; strengthening the design of
survey questionnaires and expanding or clarifying quantitative evaluation findings.
Regardless of the kinds of data involved, data collection in a qualitative study takes a
great deal of time. The researcher going to record any potentially useful data
thoroughly, accurately, and systematically, using field notes, sketches, audiotapes,
photographs and other suitable means. The data collection methods will observe the
ethical principles of research.
3.4 Data Analysis
Analysis is the application of reasoning to understand and interpret the collected
data, Kothari, (2004). Data analysis implies that the collected data should be
condensed to the best manageable level of group for further analysis. Data analysis
is a practice in which raw data is ordered and organized so that useful information
can be extracted from it. The process of organizing and thinking about data is a key
to understand what the data does and does not contain. There are a variety of ways
in which people can approach data analysis, and it is notoriously easy to manipulate
38

data during the analysis phase to push certain conclusions or agendas. For this
reason, it is important to pay attention when data analysis is presented, and to think
critically about the data and the conclusions which are drawn.
Raw data can take a variety of forms, including measurements, survey responses, and
observations. In its raw form, this information can be incredibly useful, but also
overwhelming. Over the course of the data analysis process, the raw data is ordered
in a way which will be useful. For example, survey results may be tallied, so that
people can see at a glance how many people answered the survey, and how people
responded to specific questions.
Charts, graphs, and textual write-ups of data are all forms of data analysis and will be
used by the researcher. These methods are designed to refine and distill the data so
that readers can glean interesting information without needing to sort through all of
the data on their own.
Summarizing data is often critical to supporting arguments made with that data, as is
presenting the data in a clear and understandable way. The raw data may also be
included in the form of an appendix so that people can look up specifics for
themselves.
When people encounter summarized data and conclusions, they should view them
critically. Asking where the data is from is important, as is asking about the sampling
method used to collect the data, and the size of the sample. If the source of the data
39

appears to have a conflict of interest with the type of data being gathered, this can
call the results into question. Kothari, (2004).
Likewise, data gathered from a small sample or a sample which is not truly random
may be of questionable utility. Reputable researchers will always provide
information about the data gathering techniques used, the source of funding, and the
point of the data collection in the beginning of the analysis so that readers can think
about this information while they review the analysis. Here the researcher will
require grouping the raw data and processing them into usable category. Sometimes
the researcher will require statistical computation steps to verify the relationship or
differences existing between the variables.
3.5 Validity of Data
Kothari, (2004) asserts that, data validity is the correctness and reasonableness of the
information extracted from the source. The researcher is going to obtain the valid
data, with the assumption that will be found from the primary source. The primary
data will be correct and meaningful for the study to be completed
3.6 Reliability of Data
There are many forms or reliability, all of which will have an effect on the overall
reliability of the instrument and therefore the data collected. Reliability is an
essential pre-requisite for validity. It is possible to have a reliable measure that is not
valid; however a valid measure must also be reliable. Kothari, (2004). The researcher
will assess the degree to which employees agree when measuring the variables
through filling questionnaires containing the same phenomenon.
40

The researcher will compare results from an initial test which repeated measures later
on, the assumption being that, if the instrument is reliable there will be close
agreement over repeated tests if the variables being measured remain unchanged.
Individual items in an instrument measuring a single construct will provide highly
correlated results which would reflect the homogeneity of the items. This can be
tested using the split-half form, whereby the items are divided into two halves and
are correlated with the Spearman-Brown formula.
3.7 Research Ethics and Standards
Ethics are norms or standards of behavior of which guide moral choices about our
behavior and our relationship with others, with main goal in research to make sure
that no one suffers adverse consequences from research in one way or another,
Cooper, (2006). To ensure about internal viability as well as accuracy of the results,
research will be guided by the so called ethics and standards of research until the
study is completed successfully.
41

CHAPTER FOUR
4.0 DATA ANALYSIS AND PRESENTATION OF FINDINGS
4.1 Introduction
This chapter gives the findings of the study on the specific issues that were raised
earlier in the objectives of the study. The results have been presented by the use of
percentages frequency tables, pie charts and bar graph. This is the way of presenting
the data so as to make them readable and comprehensible.
4.2 Data Processing and Analysis
At this level the researcher first compiled statistics in tables from the coded answers.
This was intended to assist in making the analysis and interpretation of the Data
easier. By using tables and response frequencies were calculated, tabulated and cross
–tabulated to enable the researcher come out with specific analysis to be made and be
able to compare and contrast various propositions and percentage and then make
conclusion.
The sum of one hundred and thirty (130) questionnaires was distributed to the
employees of Mtwara Regional Administrative Office in different sections which are
Human Resource & Administration, Planning, Education, Health, as well as Finance
section. And the following information about Sex, Age and Education were obtained
as tabulated hereunder.
42

From the findings, male occupy 53.8% out of 130 as the total respondents while
female occupy a sum of 46.2% out of the total respondents. This implies that the
number of male exceed the number of female by 7.6%.
Table 4.1: Sex of the Respondents
SEX
Frequency Percent Valid Percent Cumulative Percent
Valid Male 70 53.8 53.8 53.8
Female 60 46.2 46.2 100.0
Total 130 100.0 100.0
Source: Human Resource and Administration Section (2013)
Table 4.2: Age of the Respondents
AGE
Frequency Percent Valid Percent Cumulative Percent
Valid 18 - 25 9 6.9 6.9 6.9
26 - 35 43 33.1 33.1 40.0
36 - 45 47 36.2 36.2 76.2
46 + 31 23.8 23.8 100.0
Total 130 100.0 100.0
Source: Human Resource and Administration Section (2013)
The analysis from the Table 4.2 indicates that the number of age bearing 18-25 age is
6.9%, 26-35 is 33.1%, 36-45 is 36.2%, while 46+ comprises of 23.8%. The
manifestation here is that, young people are likely to quiet their employment than the
older people because their seeking for green pastures.
43

It was cited that the more educated employees were more likely to leave employment
than the less educated employees. The researcher found out that, it was easier for
them to find other jobs due to their training than those who were less educated.
Table 4.3: Education Level of the Respondents
EDUCATION
Frequency PercentValid
Percent Cumulative Percent
Valid Ordinary level 7 5.4 5.4 5.4
Diploma 37 28.5 28.5 33.8
First Degree level
85 65.4 65.4 99.2
Master Degree 1 .8 .8 100.0
Total 130 100.0 100.0Source: Human Resource and Administration Section (2013)
The Table 4.3 shows that Ordinary level has a small percent of 5.4% whereas at the
level of Diploma the percentage is moderate about 28.5%, coming to the Degree
level the number goes high to about 64% yet at Masters level the number of
employees goes down i.e. 8%. This is a justification that the total respondents
comprises a reasonable number of employees possessing Degree level than any other
Educational category.
Table 4.4: Position of the Respondents
44

RANK
Frequency PercentValid
PercentCumulative
Percent
Valid Professional Administrator 3 2.3 2.3 2.3
Senior Administrator 73 56.2 56.2 58.5Chief Professional Administrator 42 32.3 32.3 90.8
Assistant Administrator 12 9.2 9.2 100.0
Total 130 100.0 100.0
Source: Human Resource and Administration Section (2013)
Basing on professionalism, The Professional Administrator occupy 2.3% of the total
respondents, Senior Administrator was found to have a wide range of 56.2%, Chief
Professional has 32.3 moderate, where as Assistant Administrators comprises of
9.2% of the total respondents.
Table 4.5: Functional Areas at which the Respondents’ Belong
SECTION
Frequency PercentValid
PercentCumulative
Percent
Valid Human Resources & Administration
40 30.8 30.8 30.8
Planning 40 30.8 30.8 61.5
Education 23 17.7 17.7 79.2
Health 27 20.8 20.8 100.0
Total 130 100.0 100.0
Source: Human Resource and Administration Section (2013)
45

The Table 4.5 depicts the Section/ functional areas from which the total respondents
were drawn. Each section comprises of percentage rates as described hereunder:
Human Resources& Administration weighs 30.8%, similarly Planning Section
contain 30.8%, Health section holds 20% of the total respondents and Education
section 17.7% respectively.
The Table 4.6 presents analysis concerning employees’ length of service; it begins
with the specific range of years showing the length of service of an employee
followed by its percentage rate. For instance employees whose length of service is
less than 5years have 39.2%, 5-9years weighs 27.7 %, and 15-19 years contain
13.1% while 20+ weighs 20.0%. This is to justify that the large the percentage rate
the longer the period of employees service in the same Organization.
Table 4.6: Employees’ Length of Service
LENGTH OF SERVICE IN YEARS
Frequency Percent Valid PercentCumulative
Percent
Valid less than 5 years 51 39.2 39.2 39.2
5-9years 36 27.7 27.7 66.9
15-19years 17 13.1 13.1 80.0
20+ 26 20.0 20.0 100.0
Total 130 100.0 100.0
Source: Human Resource and Administration Section (2013)
Table 4.7: Individual Factors Pertaining to Labour Turnover
INDIVIDIUAL FACTORS
46

Frequency Percent Valid Percent Cumulative Percent
Valid Strongly Disagree
28 21.5 21.5 21.5
Disagree 52 40.0 40.0 61.5
Agree 25 19.2 19.2 80.8
Strongly Agree 25 19.2 19.2 100.0
Total 130 100.0 100.0
Source: Respondents, (2013)
The Table 4.7 was used to illustrate Individual factors, simply respondents were
provided with the responses with its Degree of freedom/ confidence level and
respondents were required to check an appropriate answer basing on the given
options. The observation was that 40.0% of the total respondents appear to Disagree,
21.5% strongly Agree, 19.2% Strongly Agree and 19.2% Agree respectively.
Table 4.8: Job Related Factors Pertaining to Labour Turnover
JOB FACTORS
Frequency Percent Valid Percent Cumulative Percent
Valid Strongly Disagree
20 15.4 15.4 15.4
Disagree 54 41.5 41.5 56.9
Unsure 12 9.2 9.2 66.2
Agree 20 15.4 15.4 81.5
Strongly Agree
24 18.5 18.5 100.0
Total 130 100.0 100.0
Source: Respondents, (2013)
47
Similarly, the Table 4.8 was used to demonstrate Job factors; the same technique was
applied whereas respondents were provided with the responses with its Degree of
freedom/ confidence level and were required to check an appropriate answer basing
on the given options. The observation was as follows: 41.5% of the total respondents
appear to Disagree, 18.5% strongly Agree, 15.4% Strongly Disagree, 15.4% Agree
where as 9.2% appear to be Unsure.
The Table 4.9 describes Organizational factors as the driving force for labour
turnover. The analysis revealed that 21.5% of the total respondents were Strongly
Agreeing, 43.8% Disagree, 18.5%, Agree 15.4% Strongly Agree while 8% were
Unsure. From such analysis it is evident that most respondents were not motivated by
the climate of the Organization.
Table 4.9: Organization Factors Pertaining to Labour Turnover
ORGANOZATIONAL FACTORS
Frequency Percent Valid Percent Cumulative Percent
Valid Strongly Disagree
20 15.4 15.4 15.4
Disagree 57 43.8 43.8 59.2
Unsure 1 .8 .8 60.0
Agree 24 18.5 18.5 78.5
Strongly Agree
28 21.5 21.5 100.0
Total 130 100.0 100.0
Source: Respondents, (2013)
Table 4.10: Environmental Factors Pertaining to Labour Turnover
48
ENVIRONMENTAL FACTORS
Frequency Percent Valid Percent Cumulative Percent
Valid Strongly Disagree
27 20.8 20.8 20.8
Disagree 50 38.5 38.5 59.2
Agree 33 25.4 25.4 84.6
Strongly Agree 20 15.4 15.4 100.0
Total 130 100.0 100.0
Source: Respondents, (2013)
Likewise the Table 4.10 provided analysis on environmental factors. The observation
was that, out of (130) total respondents, 20.8%% strongly agree, 38.5% Disagree
25.4% Agree, and 15.4% strongly agree. Therefore the justification here is that, the
higher the percentage rate the large the number of employees who are dissatisfied
with the working conditions at work place, and the vice versa is true.
Table 4. 11: Retention Strategies in the Organization
RETENTION STRATEGIESFrequency Percent Valid Percent Cumulative Percent
Valid Strongly
Disagree28 21.5 21.5 21.5
Disagree 43 33.1 33.1 54.6
Unsure 30 23.1 23.1 77.7
Agree 29 22.3 22.3 100.0
Total 130 100.0 100.0
Source: Respondents, (2013)
49
The Table 4.11 presents the analysis of the retention strategies which were used in
Mtwara Regional Administrative Office. From the observation respondents came up
with the results as follows: Out of the 130 sample, 33.1% Disagree, 23.1% were
Unsure, 22.1% agree, while 21.5% strongly agree with the retention strategies
provided by the Management. Thus it is obvious that most employees were not
appreciated the retention strategies offered by the Management.
4.3 Summary of Findings
From the study, it was found that most of the employees leave their employment due
to low salaries, change of career, long working hours, lack of career prospects,
further studies, family related issues, poor working conditions, and lack of job
satisfaction. From the study, it was also found that most of the employees who quit
their employment were young with years ranging from 26- 45 years, this is because
changing occupations becomes more difficult and threatening with age. The typical
worker, who is thirty five years of age or above has become involved in an
occupation that will engage him or her until retirement and despite occasional signs
of discontent, few of such workers entertain serious thoughts of changing occupation.
Most researchers (Lane, 1955; Young, 1970; Clowns, 1970; Fowler, 1996) have
observed that labour turnover is highly related to the employees’ length of service.
This means that new employees have higher rates of labour wastage due to induction
crisis, among other factors, than employees who have stayed longer with the
organization. This can be associated with the fact that workers move less often as
50
they get older and as they get used to their work and the organization and most of
them have established relationship with those around them.
These findings are in agreement with what was found out in this study, that
employees who had more employment experience were less likely to leave
employment as compared to those who had little experience. The Educational level
of the respondents was found to have a reasonable number of first Degree level,
moderate Diploma level and very few Ordinary levels. It has been found out that the
more educated employees especially Degree graduates were more likely to quit their
jobs than the non graduates. This is attributed by the fact that more educated persons
have more job opportunities.
In this study it was found that labour turnover is higher among male than females.
This is because males are job seekers and they are always searching for green
pastures.
4.4 Discussion of Findings
A review of relevant literature led to the identification of individual, job,
organizational, and environmental factors that impact on staff turnover. Individual
factors included personality, age and length of service. Job factors include
relationship with the supervisor, content of the job, working conditions, remuneration
and developmental opportunities. Organizational factors included organizational
culture, cultural diversity, organizational climate and organizational communication.
Environmental factors included are geographical location, environmental turbulence,
and metropolitan area size, competition in the market place, economic conditions and
51
support organizations. An interview was also conducted with the senior officers from
Mtwara Regional Administrative Office to gain additional insight into the factors that
could contribute the staff turnover among the senior Officers.
Capelli (2000) suggests that organizations that want to reduce the level of employee
turnover should make use of the following retention strategies; Compensation plan.
Even though compensation in not a reliable motivator, it acts as an indicator of the
organization’s appreciation of the employees‟ contribution and abilities. Secondly,
job redesign which involves identifying the elements in a job that create satisfaction
and dissatisfaction.
Therefore, enabling the manager to split off the dissatisfying tasks entirely and
giving them to another individual who will appreciate the work. Thirdly is job
customization whereby the employee is viewed as the “customer‟ therefore efforts
are made to recognize and satisfy his \her needs. It breaks away from the traditional
itemization of tasks and performance expectations, where the employee feels dictated
on where, when, and how the job will be done to what, where and how of the job.
Fourthly, is “tapping your internal labour market”. Since most people are opportunity
seekers, be sure that employees are aware of the opportunities that exist inside the
organization.
Internal postings should be readily available and easy to access. Fifthly, is the hiring
the less employment mobile people. Finally, strengthening social ties in the
organization. Loyalty to companies may be disappearing but loyalty to colleagues is
52

not‟. By encouraging the development of social ties among key employees,
companies can often significantly reduce turnover among workers whose skills are in
high demand. Reconfiguring linear work processes into team-based processes can
also create social ties. Cappeli (2000), concludes by pointing out that, it may be
difficult to counter the pull of the market and therefore efforts should be made not to
minimize the overall employee turnover but to influence who leaves and when.
CHAPTER FIVE
5.0 CONCLUSION AND RECOMMENSDATION
5.1 Introduction
This chapter gives the conclusions in relation to the objectives of the study. It also
gives the implication of the study. The recommendations and suggestion for further
research is also given.
5.2 Conclusion
In conclusion, it can be said that labour turnover in Mtwara Regional Administrative
Office is influenced by the following factors; Low payment was cited by most
53

respondents as a major factor that contributed to increased labour turnover in the
Office, therefore employees work with the knowledge that they are underpaid hence
are demotivated. Poor working condition was also a factor which was cited as the
reason for labour turnover, the relationship with immediate supervisors has also been
mentioned by most respondents as a factor for employee turnover. Involvement in
decision-making and lack of autonomy were all cited as the challenge that triggers
employees turnover. Therefore it is suggested that employees’ recognition and
motivation towards organizational performance have a positive relationship in
between them. Of further importance, the Management is advised to provide
employees with autonomy in such a way that they feel ownership of their
organization.
5.3 Recommendations
The study would not be complete without making recommendations. It is
recommended that the Management continue employing people who are well trained
and who perceive their jobs as a calling. This will ensure a fit between the person and
the job, which is the first requirement for the retention of personnel. Organizations
should not only employ to fill a job but also consider a fit between the person and the
organisation.
In terms of job factors, it is recommended that the management of Mtwara Regional
Administrative Office give attention to both hygiene factors and motivators. Where
the management does not have more leverage to affect the remuneration of
Administrative personnel they should continue to lobby with the government to
improve the working conditions of employees.
54

Management should give attention to those factors that they can control, including
communication with staff, fair treatment, recognition for effort and performance,
participation in decision making, providing support and encouragement, and training
and developing staff to prepare them for promotion and enhanced responsibility.
In addition, it is recommended that a continuous performance management
programme be instituted so that employees will have clarity on what is expected of
them, that their performance is monitored and recognized and that they get
opportunities to develop themselves. Such a programme will require well-trained
supervisors.
In terms of organizational factors, it is recommended that management should give
attention to those factors that they can control. For example, management has to
understand that people are different and appreciates those differences. They differ in
terms of nature, time orientation and relationship to nature.
Management should support staff members by providing appropriate training on
cultural diversity. They should send staff to programs such as cultural diversity
workshops to create awareness of the ways in which biases are related to race,
ethnicity, country of origin, age and gender and how this can affect working with
others. Management should assign exemplary individuals who are culturally
sensitive to mentor new employees especially those who are culturally different.
Management should support staff members by providing appropriate training on
cultural diversity. They should send staff to programs such as cultural diversity
workshops to create awareness of the ways in which biases are related to race,
55
ethnicity, country of origin, age and gender and how this can affect working with
others.
In terms of environmental factors, it is recommended that the management do an
analysis of the environment to avail themselves of the factors that pull people
towards and push people away from the area. Based on the results, strategies should
be developed to overcome limitations. This could include requesting the local
municipalities and the education department to improve facilities and schools in the
environment. An organizational culture of acceptance and encouragement could also
compensate for limitations in the environment.
5.3.1 Recommendations Pertaining to Human Resource Strategies
In the light of this study the researcher has the following recommendations
pertaining to Human Resource strategies. The Management needs to have strategic
human resources recruitment and a retention plan. The Principal Administrator of
Mtwara Regional Administrative Office indicated that the Office did not have a
retention plan in place. According to Jooste (2003) and Forrier and Sels (2003), the
following retention strategies are recommended.
5.3.2 Orientation and Socialization
A human resources department has to make it a point that a new comer is oriented
during the early stages of employment so as to encourage socialization among other
56

employees. The early stages of employment are most critical because these are the
stages where most employees feel that they are neglected and alone.
5.3.3 Training and Development
Employees should be given training to improve their skills as most respondents
indicated that they did not receive adequate training on the job. It is through training
that public Administrative Officers will be able to create a motivating climate in
public Organizations that will enable employees to maximize their potential.
5.3.4 Recognition
Employees should be recognized for the contribution they make to the organisation.
Most respondents indicated that they are not given recognition for the work they are
performing. Management has to establish or set up a recognition program for its
employees. Recognition can take any form, not only in monetary terms. When an
employee has achieved something, a supervisor can call him or her to an office to
congratulate the person. Meetings can also be utilized to make others aware of their
colleague’s achievements. Publications on in-house notice boards, news letters and
journals may also help. Employees who obtain higher qualifications should be given
more challenging work. This would ensure that the acquired skills are utilized to the
benefit of organisation.
Management should have a succession plan such as a pool of suitable candidates.
These people should be interviewed for a post that might exist in the near future but
57
those candidates must not be placed in the organisation, they will be called when the
need exists.
5.3.5 Flexible Benefits
Flexible benefits that are available to help employees to balance work and life
demands should be provided and communicated to the employees.
5.3.6 Climate of Participation In Decision-Making
Management should involve their employees when they make decisions. Once you
involve people in decision-making they will be willing to exert more effort because
they were part and parcel of the decision that has been taken and that will increase
their level of commitment in the organisation.
5.3.7 Regular Survey
Regular surveys should be conducted to established employee –needs as well as to
measure their perceptions regarding their jobs.
5.3.8 Promotion
Opportunities for promotion should be provided. This might include, if there are no
posts available to promote valuable employees to, giving an employee a new title
that reflects the level of work he or she has achieved.
5.3.9 Conditions of Service
This involves moving a step further from basic conditions of employment to a more
personal level which involves the environment in which people work. This means
providing work equipment and facilities so that employees can do their work more
58
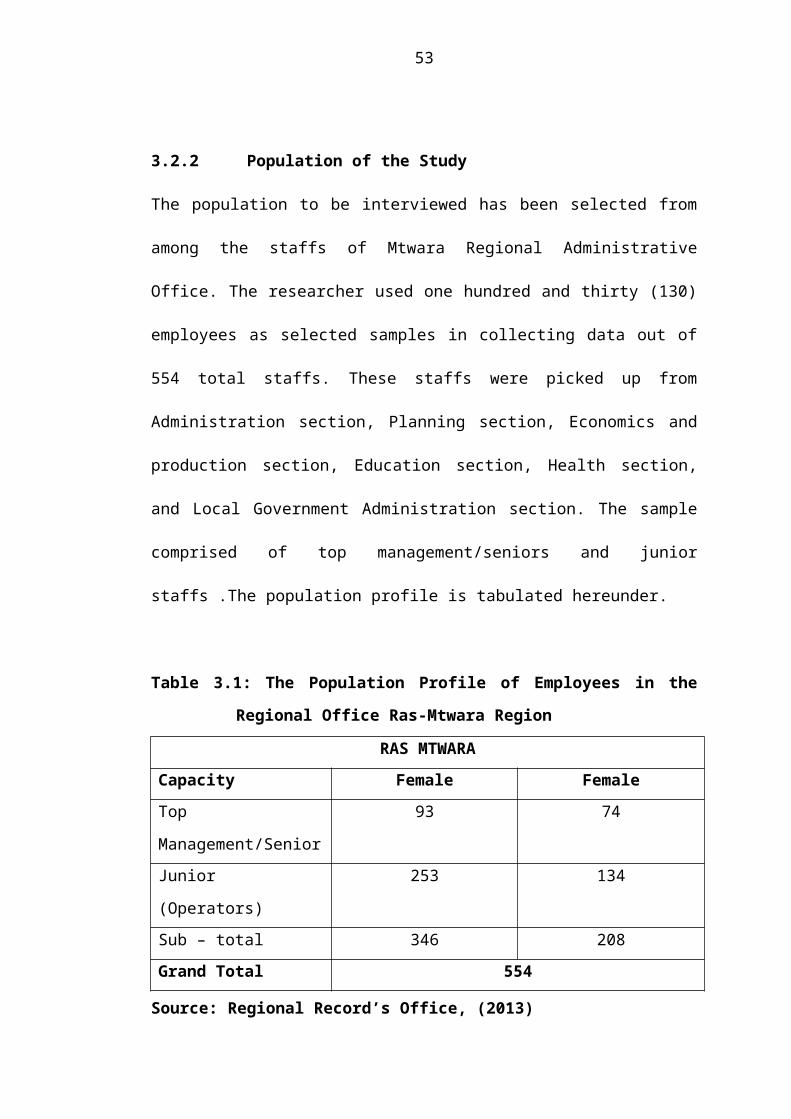
easily. A favorable condition of service has a tremendous effect on the level of pride
of employees and the work they are doing.
Another vital recommendation is manpower planning. Manpower planning has
become of necessity to many organizations, given the fact that organizations are
becoming larger with each day and thus planning for their labour force has become
more complicated. There is a need for careful forecasting of manpower, by knowing
the right number of employees that will be required in the future and the likely
numbers that will leave the Organization. All these are only possible if the
organization carries proper manpower planning
5.4 Limitation of the Study
The main problem experienced by the researcher was the refusal by some
respondents to complete the questionnaire. Some respondents were not willing to
cooperate even after they were shown a letter that gave permission to the researcher
to conduct the study at the respective Administrative Section. The process of
collecting the questionnaire proved to be challenging because some respondents
failed to complete the questionnaire on time and the researcher spent a considerable
amount of time visiting the Office to follow up on the collection of the
questionnaires. Despite this, an adequate number of questionnaires were returned to
make the study valid.
5.5 Areas for Further Research
This study only targeted permanently employed Public Officers. To provide a better
understanding of labour turnover within the public Organization, it is recommended
that all employees whether on contract, casual or permanent basis be studied.
59

Secondly, it is also recommended that employees who already left their employment
be considered since they would be objective in giving information without fear of
being victimized by the employer.
More importantly however, I would like to advise other researchers to have a
thorough examination of psychological contract that exist among employers and
employees in order to come up with proper suggestions on how to improve terms and
conditions of employment. Furthermore, policy makers, Decision makers and
planners are highly advised to review policies, regulations as well as laws governing
employees’ movement and come up with clear policies concerning manpower
planning strategies.
REFERENCES
Armstrong M, (2007). A Hand Book of Human Resource Management Practice. 10th
Edition. Mc-Graw Hill; New Delhi.
60

Armstrong, M (2010). A Handbook of Human Resource Management, eleventh
Edition London kogan
Beardwell, (2001). Human Resource Management (Third Ed). Edinburg Gate:
Prentice-Hall.
Bergh,z , (2006). Psychology in the workplace, (Third Ed). Cape Town: Oxford.
Bruce A, (1999). Motivating employees. San Francisco: McGraw-Hill.
Bureau of Labor Statistics, (2001). The Employment Situation: News Release.
United States Department of Labor.
Bureau of Labor Statistics, (2001). The Employment Situation: News Release. United
States Department of Labor.
Burns, J, (2007). The Significance of the Conducted Research: Employee
Empowerment, [On-line]
Cart ledge, S, (2001). Factors influencing the turnover of intensive care nurses.
Intensive and Critical Care Nursing, 17(6), pp. 348-
Casio, W.F (2001) Costing Human Resources: Financial Impact of Behavior in
Organizations Pws publication
Chepkilort, R.K., (2005). The Development of National Strategies for Public Sector
Workers in Kenya. Port Elizabeth: University of Port Elizabeth.
CIPD, (2004). Employee turnover and retention. Available online www.cipd.co.uk/
subjects/hrpract/turnover/empturnretent.htm? Accessed on 14 September
2008.
Coetze, E.R, (2006). Plugging the brain drain. Achiever. Issue 19.Cape Media
Colin, F (2010). Researching and Writing a Dissertation, An essential guide for
Business students (Third Edition) Prentice hall
61

Cumming, M.W. (1994). The Theory and Practice of Management. (Seventh Ed)
Butterworth: Heinemann.
Eckerman, E.R, (2005). Nursing Update. Pretoria. Van Schalk.
Erasmus, B, (2000). South African Human Resource Management: Theory and
practice. Cape Town: Juta
Evers,w,(2002). Aggressive Behavior and Burnout Among Staff of Homes for the
Elderly. International Journal of Mental Health Nursing, 11(1), p.2-9.
Fielding, N, (2001) Effective Communication in Organizations and Preparing
Messages that Communicates. (Second ed). Kenwyn: Juta.
Forrier, A, 2003. Flexibility Turnover and Training. International Journal of
Manpower, 24, p. 148-
Gorden, J.R, (1991). A Diagnostic Approach to Organizational Behavior (Third Ed).
USA: Allyn and Bacon154
Gray, A.M., (1996). Labour Turnover in the British National Health Services: A
local labour market analysis. Health Policy, 36 (3), p. 273-289.
Greenberg, (2000) Behaviour in Organization: Understanding and Managing the
Human Side of Work, (7th Ed). Upper Saddle River, NJ: Prentice Hall.
Griffith, R.w, (2000). A Meta-Analysis of Antecedents and Correlates of Employee
Turnover: Update, moderator test and research implications for the next
millennium. Journal of Management, 26(3), pp. 463- 488.
Grobler, (2006). Human Resource Management in South Africa, (second Ed). UK
London: Cornwall Institute of Management.
Grobler, P.A, (2006). Human Resource Management in South Africa, (second Ed).
UK London: Cornwall Institute of Management.
Gupta CB, (2003). Human Resource Management Six Edition New Delhi
62

Heath, E. (2008). Chief Executive Officer, Hewu Hospital. Personal communication.
Herald, (2007) Serious Staff Shortages in Eastern Cape Hospitals. Page 4.
Herrin, A, (2002). Hiring and Keeping the Best People. Essentials publishing Press.
Havard Business School.
Hom, P.W, (2001). Towards a Greater Understanding of How Dissatisfaction Drives
Employee Turnover. Academy of Management Journal.
Impelman, K, (2007). How does personality relate to contextual performance,
turnover and customer service? Unpublished doctoral dissertation: University
of North Texas. International (p) Ltd, Delhi, India.
Iverson, R.D, (1999). An event history analysis of employee turnover: The case of
hospital employees in Australia. Human Resource Management Review, 9(4),
p. 397-418.155.
Johnson, J, (2003). Providing Staff Feedback to Nurse Managers Using Internal
Resources. Journal of Nursing Administration, 33(7-8), p. 391-396.
Jones, C.B, (1990). Staff Nurse Turnover Cost: Part 1a, Conceptual Model. Journal
of Nursing Administration, 20(40), pp. 19-23.
Jooste, K, (2003). Leadership in Health Services Management. Lansdowne: Juta.
6th Edition. Tata Mc-Graw Hill; New Delhi
Kane, D, Kartha, A (1992). Job Sharing: Impact on the well-being of Female Nurses.
Canadian Journal of Nursing Administration 5 (1) p. 6-10.
Kinicki, A.J. (2001). Towards a greater understanding of how dissatisfaction drives
Employee turnover. Academy of Management Journal
Kondalkar, V.G. (2006). Organizational Behavior Six Edition New Age International
(P) Ltd Publisher
Koontz, H. (2004. Essentials of Management: An International Perspective.
63
Korte, R.F, (2007). Learning and socialization in the workplace. Summary of a
Colloquium presented to faculty and students of the College of Business and
Technology at the University of Texas, Tyler.
Kothari, C. R. (1999). Research Methodology: Methods and Techniques, 2nd edition.
New International (p) Ltd, Delhi, India.
Kothari, C. R. (2004). Research Methodology: Methods and Techniques, 2nd edition.
Wishwa. Prakashan, New Delhi.
Kothari, C.R. (2002). “Research methodology methods and techniques”(Third Ed).
New age International ltd, New Delhi.
Kreitner, R (2004). Organizational Behavior. Six Edition New York: McGraw Hill
Publishers.
Kreitner, R (2004). Organizational Behaviour. Sixth Edition. New York: McGraw
Hill PublishersHom,
Larnabee, (2003). Predicting Registered Nurse, Job Satisfaction and Intent to Leave.
Journal of Nursing Administration, 33(5), p. 271-283.
Leedy, P.D, (2001). Practical Research: Planning and design. Seventh Ed). New
Jersey: Prentice Hall
Nene, G, (2002). Worker satisfaction: HR Future, 2(1), p. 17
Schenk, H. (2003). Human Resource Management. Theory and Practice. Third
Edition. Lansdowne: Juta Co. Ltd
Schultz, (2003). Human Resource Management. Fifth Edition. Cape Town: Oxford
University Press.
Schultz, H.B. (2008). Human Resource Management. Eighth edition. Oxford
University Press: Cape Town.
Schulz H, (2003). Organizational Behavior. Pretoria: Van Schaik
64

Torrington, D. (2005). Human Resources Management 6th edition
APPENDICES
65

Appendix I: Time Schedule
This study is expected to be covered within six months, which will require visiting
Mtwara Regional Office searching for the data relating to labour turnover and its
impacts on organizational performance. The plan will be as follows:
Table 1 Source researcher 2013
Number of Weeks Tasks Setting
1st week Familiarization Mtwara Regional Office
2nd to 6th week Revising various Literature
review in the Library
The Regional Library
7th to 8th week Preparation and Distribution of
Questionnaire
Mtwara Regional Office
9th to 12th week Data collection through
questionnaire and Interview
Mtwara Regional Office
13th week Preliminary data analysis and
arrangement
Mtwara Regional Office
13th to 16thweek Editing Mtwara while
Communicating with my
supervisor
16th to 17th week Data evaluation and
preparation for presentation
Mtwara while
communicating with my
supervisor
18th week Submission of the research
work
The Open University of
Tanzania
BUDGET
66
The researcher will require substantial amount of financial resources in order to
complete the study successfully. The cost of which will be incurred by the researcher
himself.
Table: 2; Source Researcher 2013
S/No Cost item No of items Cost break down Total
amounts
1. Modem 1 Tshs 50,000 50,000
2. Paper 4 rims @ Tshs 8,000 32,000
3. Pens 8 @ Tshs 500 4,000
4. Typing 4 times @ Tshs 16,000 64,000
5. Printing and
photocopying
Approx 5 times @ Tshs 16,000 80,000
6. Binding Approx 2 times @ Tshs 7,500 15,000
7. Transport Approx 10 days @ Tshs 10,000 100,000
8. Break fast 204days @ Tshs 1,000 204,000
9. Lunch 204 days @ Tshs 1,500 306,000
10. Communication 15 weeks @ Tshs 2,000 30,000
11. OTHERS COSTS …………. …………. 13,000
12. Grand Total 898,000
THE OPEN UNIVERSITY OF TANZANIA
67
Appendix II: Interview Questions
Declaration;
I have honor to send to you this questionnaire for your kind completion. This
questionnaire is intended to collect information concerning Impacts of labour
turnover on organization performance in Mtwara Regional Administrative Office.
Your name shall not be recorded anywhere and anything that you tell shall be treated
as highly confidential. It is my hope that your will complete this questionnaire
without any fear or favour.
Your kind attention to this matter is highly appreciated.
Thanks!
PERSONAL PARTICULARS
i. Sex: Male Female
ii. Age: (a) 18 – 25 (b) 26 – 35 (c) 36 – 45 (d) 46 +
iii. Occupation……………………………………………………………………
iv. Ministry………………………………………………………………………
v. Department……………………………………………………………………
vi. Salary scale……………………………………………………………………
68
What is your highest level of your education? Put √ for the appropriate answer
provided
1. Primary
2. Ordinary level
3. A’ level
4. Diploma level
5. First degree level
6. Master degree
7. Doctorate
PART I
SPECIFIC QUESTIONS
Please supply the following information by making a √ in the appropriate box where
the option are provided
1. What is your rank?
Professional Administrator
Senior Administrator
Chief Professional Administrator
Assistant Administrator
Other, please specify
69

2. In which functional area do you work?
Human Resource &Administration
Planning
Education
Health
Other, please specify
3. How long have you been working for at this organization?
Less than 5 years
5-9 years
10-14 years
15-19 years
20+
PART II
Individual factors
Please specify the extent to which you agree or disagree with the following phrases
by putting an appropriate letter provided in the box.
i. I see my job as a calling (a). Yes (b) No
70
ii. I consider my personality as suitable for the public organization (a). Yes (b)
No
iii. It is important for me personally that I do my job very well (a). Yes (b) No
Stro
ngly
Agr
ee
Agr
ee
Uns
ure
Dis
agre
e
Stro
ngly
Dis
agre
e
S
no
Individu
al factors
5 4 3 2 1
1 I feel I am making a
valuable contribution to my
organization
2 I am known as an employee
who is organized, on time
and reliable
PART III
Job factors
Please indicate the extent to which you agree with each statement by putting an “x”
in the appropriate box
71

Stro
ngly
Agr
ee
Agr
ee
Uns
ure
Dis
agre
e
Stro
ngly
Dis
agre
e
S no Job factors 5 4 3 2 1
1 I am paid fairly for the
work I perform
2 My Manager discusses
my performance with me
3 My job provides me with
the opportunity to
develop my talent
4 I am clear of what is
expected of me
5 My Manager motivates
me to do a good job
6 I cope well with my
workload
7 I understand how my job
contribute to the
achievement of the
organization’s goal
72

8 My needs are taken into
consideration at work
9 The physical working
conditions are
conducive to
achievement
10 I am provided with the
necessary resources to
complete my task
successfully
11 I get recognition for my
performance
12 My job entails a variety
of tasks and are therefore
interesting
13 I am responsible for
making important
decisions in my job
14 I have job security
15 My colleges are
supportive
73

16 My job allows me to
grow professionally
17 Organizational policies
related to my job are
adequately
communicated to me
18 Organizations’ are doing
a good job of ensuring
that its employees are
members of a relevant
Association
19 Employees attend
conferences and
meetings(local, regional
and National organized
by members of
Association
PART IV: Organizational factors
Please indicate the extent to which you agree with each statement by putting an “x”
in the appropriate box
74

Stro
ngly
Agr
ee
Agr
ee
Uns
ure
Dis
agre
e
Stro
ngly
Dis
agre
e
S
no
Organizational factors 5 4 3 2 1
1 My Manager encourages
team work
2 There is open
communication in the
organization
3 There is a feeling of trust
among organization
members
4 I feel committed to the
organization where I am
working
5 I find that my personal
values and of the
organization are very
similar
6 I feel proud to work in
this department
75

7 I give positive view of the
organization to outsiders
8 There is high morale
among members of the
organization
9 I believe that the
organization is doing their
best to manage its
workforce
PART V: Environmental factors
Please indicate the extent to which you agree with each statement by putting an “x”
in the appropriate box
Stro
ngly
Agr
ee
Agr
ee
Uns
ure
Dis
agre
e
Stro
ngly
Dis
agre
e
S no Environmental factor 5 4 3 2 1
1 The brain drain is
affecting labour turnover
among public officers
76

2 I enjoy working in this
area
3 I am considering applying
for a job at another
company in Mtwara
4 Employees stay in their
job because it is hard time
to find another job
5 I would prefer working in
a bigger city rather than
here
6 I am well settled in this
area
7 I am willing to put in an
above normal effort to
help this organization
8 Some Administrative
personnel leave to go to a
place where there are
better Educational
opportunities for their
77

children
9 I am not considering
leaving my job
PART VI: RETENTION STRATEGIES:
Please indicate the extent to which you agree with each statement by putting an “x”
in the appropriate boxSt
rong
ly
Agr
ee
Agr
ee
Uns
ure
Dis
agre
e
Stro
ngly
disa
gree
S no Retention strategies 5 4 3 2 1
1 Management is making
plans to ensure that there
are enough Administrative
Personnel in this
organization
2 Management tries their
best to ensure that
employees will not leave
the organization
3 Management carefully
select and employ people
78
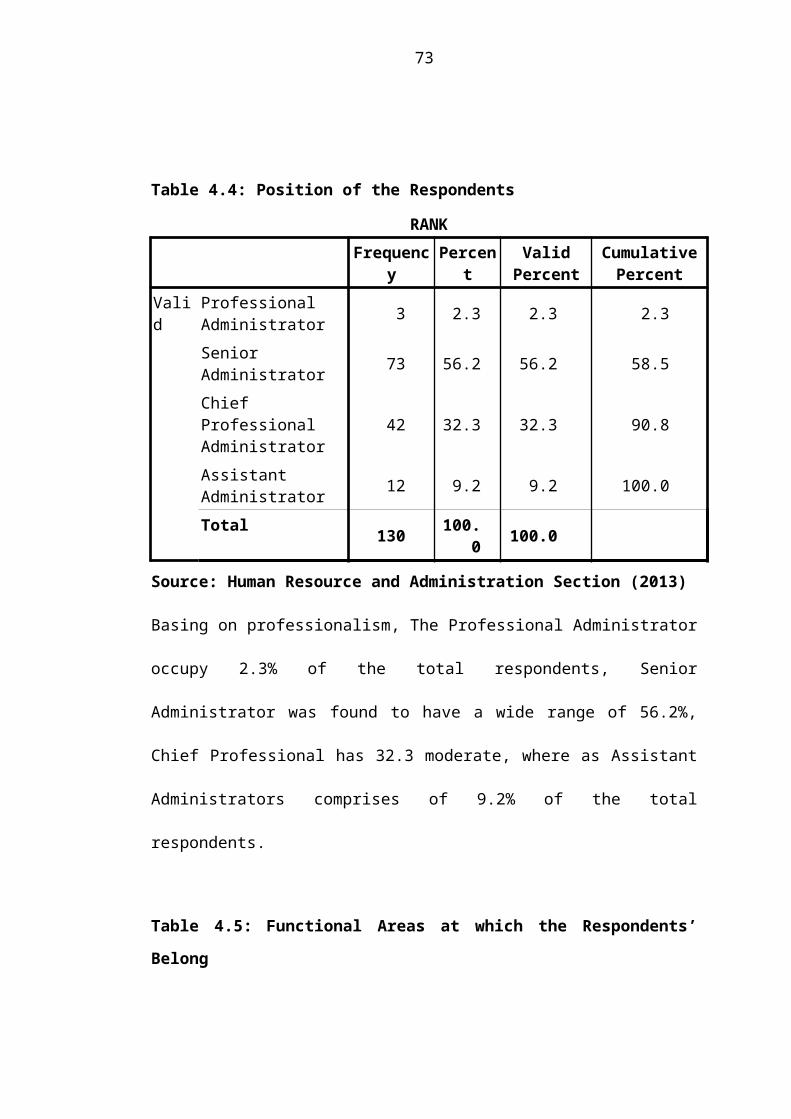
who are well suited for the
job
4 Only Administrative
personnel who have the
necessary skills are
employed
PART VII
OPEN ENDED QUESTIONS
Please answer the following open ended questions
1. In your view what are the reasons for the public officers leaving at your
organization?
i………………………………………………………………………………………
ii………………………………………………………………………………………
iii………………………………………………………………………………………
2. In your view what can be done to retain employees at your organization?
a)………………………………………………………………………………………
b)………………………………………………………………………………………
c)………………………………………………………………………………………
79

d)………………………………………………………………………………………
e)………………………………………………………………………………………
Thank you for your kind attention!
TIME FRAME
80

This study is expected to be covered within six months, which will require visiting
Mtwara Regional Office searching for the data relating to labour turnover and its
impacts on organizational performance. The plan will be as follows:
Table 1 Source researcher 2013
NUMBER OF WEEKS TASKS SETTING
1st week Familiarization Mtwara Regional Office
2nd to 6th week Revising various
Literature review in the
Library
The Regional Library
7th to 8th week Preparation and
Distribution of
Questionnaire
Mtwara Regional Office
9th to 12th week Data collection through
questionnaire and
Interview
Mtwara Regional Office
13th week Preliminary data analysis
and arrangement
Mtwara Regional Office
13th to 16thweek Editing Mtwara while
Communicating with my
supervisor
16th to 17th week Data evaluation and
preparation for
presentation
Mtwara while
communicating with my
supervisor
18th week Submission of the research
work
The Open University of
Tanzania
81

7.0. BUDGET
The researcher will require substantial amount of financial resources in order to
complete the study successfully. The cost of which will be incurred by the researcher
himself.
Table: 2; Source Researcher 2013
S/No Cost item No of items Cost break down Total
amounts
1. Modem 1 Tshs 50,000 50,000
2. Paper 4 rims @ Tshs 8,000 32,000
3. Pens 8 @ Tshs 500 4,000
4. Typing 4 times @ Tshs 16,000 64,000
5. Printing and photocopying Approx 5 times @ Tshs 16,000 80,000
6. Binding Approx 2 times @ Tshs 7,500 15,000
7. Transport Approx 10 days @ Tshs 10,000 100,000
8. Break fast 204days @ Tshs 1,000 204,000
9. Lunch 204 days @ Tshs 1,500 306,000
10. Communication 15 weeks @ Tshs 2,000 30,000
11. OTHERS COSTS …………. …………. 13,000
12. Grand Total
898,000
82

THE OPEN UNIVERSITY OF TANZANIA
INTERVIEW QUESTIONS
Declaration;
I have honor to send to you this questionnaire for your kind completion. This
questionnaire is intended to collect information concerning Impacts of labour
turnover on organization performance in Mtwara Regional Administrative Office.
Your name shall not be recorded anywhere and anything that you tell shall be treated
as highly confidential. It is my hope that your will complete this questionnaire
without any fear or favour.
Your kind attention to this matter is highly appreciated.
Thanks!
PERSONAL PARTICULARS
(i) Sex: Male Female
(ii) Age: (a) 18 – 25 (b) 26 – 35 (c) 36 – 45 (d) 46 +
(iii) Occupation……………………………………………………………………
(iv) Ministry………………………………………………………………………
(v) Department……………………………………………………………………
(vi) Salary scale……………………………………………………………………
83
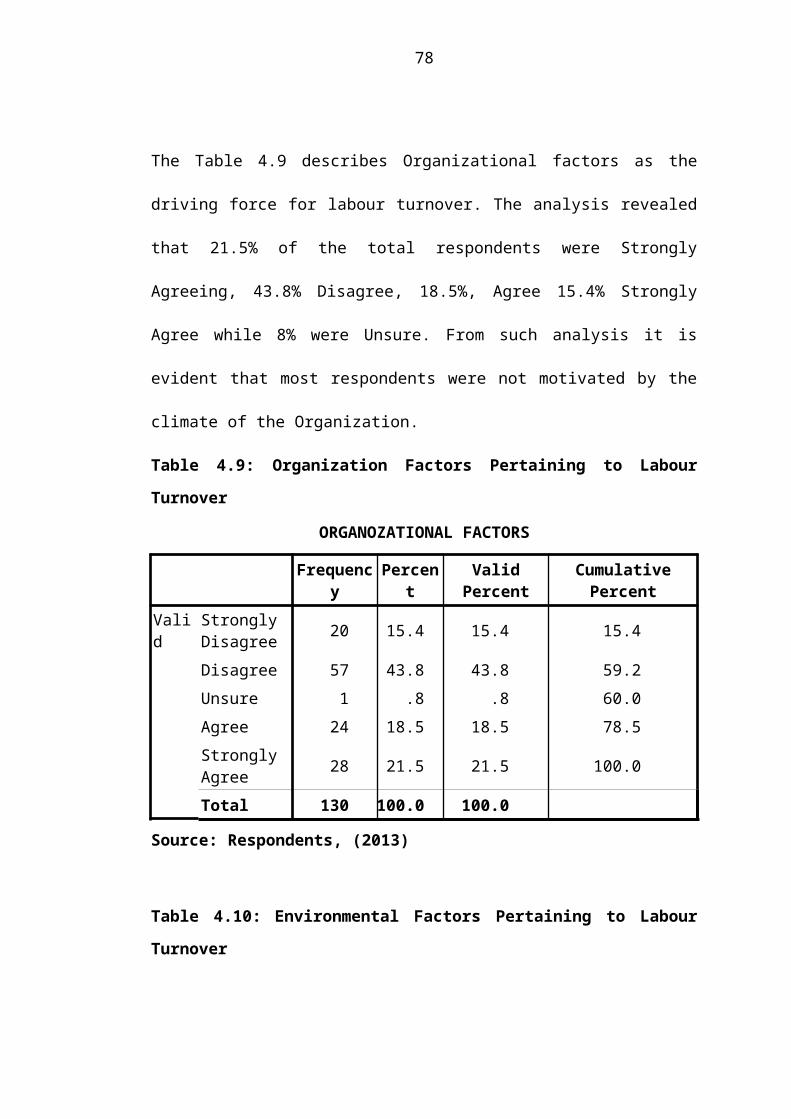
What is your highest level of your education? Put √ for the appropriate answer
provided
8. Primary
9. Ordinary level
10. A’ level
11. Diploma level
12. First degree level
13. Master degree
14. Doctorate
PART I
SPECIFIC QUESTIONS
Please supply the following information by making a √ in the appropriate box where
the option are provided
1. What is your rank?
Professional Administrator
Senior Administrator
Chief Professional Administrator
Assistant Administrator
Other, please specify
84
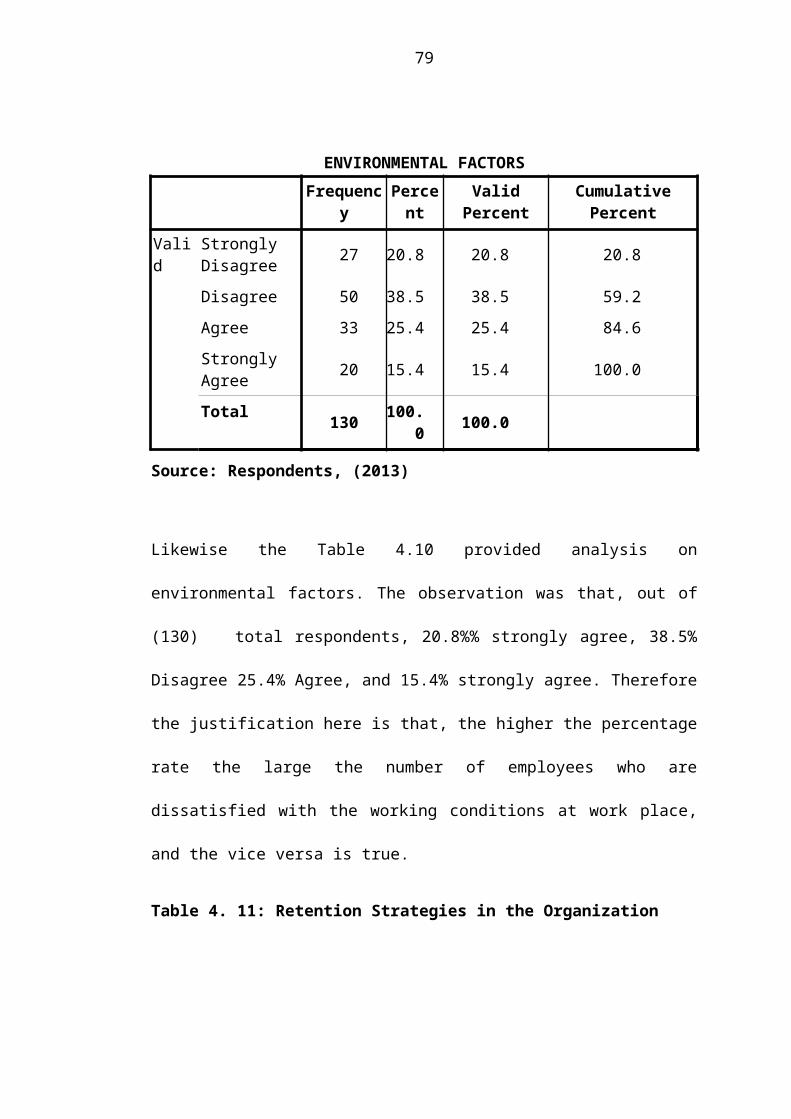
2. In which functional area do you work?
Human Resource &Administration
Planning
Education
Health
Other, please specify
3. How long have you been working for at this organization?
Less than 5 years
5-9 years
10-14 years
15-19 years
20+
PART II
Individual factors
Please specify the extent to which you agree or disagree with the following phrases
by putting an appropriate letter provided in the box.
iv. I see my job as a calling (a). Yes (b) No
v. I consider my personality as suitable for the public organization (a). Yes (b)
No
85
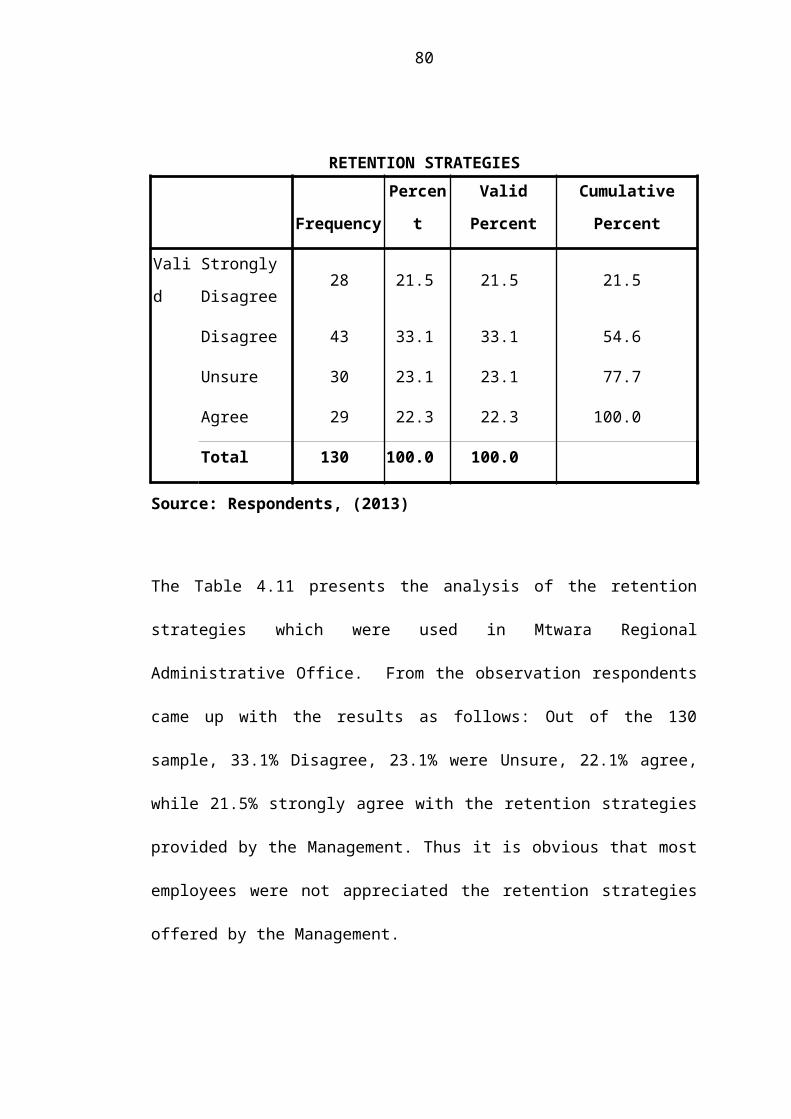
vi. It is important for me personally that I do my job very well (a). Yes (b) No
Stro
ngly
Agr
ee
Uns
ure
Dis
agre
e
Stro
ngly
Dis
agre
e
S no Individual factors 5 4 3 2 1
1 I feel I am making a valuable
contribution to my organization
2 I am known as an employee who is
organized, on time and reliable
PART III
Job factors
Please indicate the extent to which you agree with each statement by putting an “x”
in the appropriate box
Stro
ngly
Agr
ee
Agr
ee
Uns
ure
Dis
agre
e
Stro
ngly
Dis
agre
e
S no Job factors 5 4 3 2 1
1 I am paid fairly for the work I
perform
2 My Manager discusses my
performance with me
86

3 My job provides me with the
opportunity to develop my
talent
4 I am clear of what is expected
of me
5 My Manager motivates me to
do a good job
6 I cope well with my workload
7 I understand how my job
contribute to the achievement
of the organization’s goal
8 My needs are taken into
consideration at work
9 The physical working
conditions are conducive to
achievement
10 I am provided with the
necessary resources to
complete my task successfully
11 I get recognition for my
performance
12 My job entails a variety of
tasks and are therefore
interesting
87
13 I am responsible for making
important decisions in my job
14 I have job security
15 My colleges are supportive
16 My job allows me to grow
professionally
17 Organizational policies related
to my job are adequately
communicated to me
18 Organizations’ are doing a
good job of ensuring that its
employees are members of a
relevant Association
19 Employees attend conferences
and meetings(local, regional
and National organized by
members of Association
PART IV: Organizational factors
Please indicate the extent to which you agree with each statement by putting an “x”
in the appropriate box
Stro
ngly
Agr
ee
Agr
ee
Uns
ure
Dis
agre
e
Stro
ngly
Dis
agre
e
88

S no Organizational factors 5 4 3 2 1
1 My Manager encourages
team work
2 There is open
communication in the
organization
3 There is a feeling of trust
among organization
members
4 I feel committed to the
organization where I am
working
5 I find that my personal
values and of the
organization are very
similar
6 I feel proud to work in
this department
7 I give positive view of
the organization to
outsiders
8 There is high morale
among members of the
89

organization
9 I believe that the
organization is doing
their best to manage its
workforce
PART V: Environmental factors
Please indicate the extent to which you agree with each statement by putting an “x”
in the appropriate box
Stro
ngly
Agr
ee
Agr
ee
Uns
ure
Dis
agre
e
Stro
ngly
Dis
agre
e
S
no
Environmental factor 5 4 3 2 1
1 The brain drain is affecting
labour turnover among
public officers
2 I enjoy working in this area
3 I am considering applying
for a job at another
company in Mtwara
4 Employees stay in their job
because it is hard time to
90
find another job
5 I would prefer working in a
bigger city rather than here
6 I am well settled in this
area
7 I am willing to put in an
above normal effort to help
this organization
8 Some Administrative
personnel leave to go to a
place where there are better
Educational opportunities
for their children
9 I am not considering
leaving my job
PART VI: RETENTION STRATEGIES:
Please indicate the extent to which you agree with each statement by putting an “x”
in the appropriate box
91
Stro
ngly
Agr
ee
Agr
ee
Uns
ure
Dis
agre
e
Stro
ngly
disa
gree
S no Retention strategies 5 4 3 2 1
1 Management is making
plans to ensure that there
are enough Administrative
Personnel in this
organization
2 Management tries their
best to ensure that
employees will not leave
the organization
3 Management carefully
select and employ people
who are well suited for the
job
4 Only Administrative
personnel who have the
necessary skills are
employed
92

PART VII
OPEN ENDED QUESTIONS
Please answer the following open ended questions
1. In your view what are the reasons for the public officers leaving at your
organization?
i………………………………………………………………………………………
ii………………………………………………………………………………………
iii………………………………………………………………………………………
2. In your view what can be done to retain employees at your organization?
a)………………………………………………………………………………………
b)………………………………………………………………………………………
c)………………………………………………………………………………………
d)………………………………………………………………………………………
e)………………………………………………………………………………………
Thank you for your kind attention!
Be blessed.
93