the opec monthly oil market report for february - opec : · pdf filemonthly oil market report...
TRANSCRIPT
Monthly Oil Market ReportO P E C
13 February 2017
Feature article:Review of global oil demand trend
Oil market highlights
Feature article
Crude oil price movements
Commodity markets
World economy
World oil demand
World oil supply
Product markets and refinery operations
Tanker market
Oil trade
Stock movements
Balance of supply and demand
Monthly endnotes
1
3
5
11
15
31
42
58
65
69
77
84
92

Organization of the Petroleum Exporting Countries
Helferstorferstrasse 17, A-1010 Vienna, AustriaE-mail: prid(at)opec.orgWebsite: www.opec.org
OPEC Monthly Oil Market Report – February 2017 1
Oil Market Highlights
Crude Oil Price Movements The OPEC Reference Basket averaged $52.40/b in January, representing a gain of 73¢ over the previous month. NYMEX WTI and ICE Brent also saw gains, increasing by 44¢ and 53¢ to average $52.61/b and $55.45/b, respectively. Production adjustments by OPEC and some non-OPEC producers supported the market, although gains were capped by increased drilling activity in the US. The Brent-WTI spread widened slightly to average $2.84/b in January.
World Economy Global economic growth expectations remain at 3.0% in 2016 and 3.2% in 2017. OECD growth in 2017 was revised up to 1.9%, following upward adjustments in the Euro-zone and UK. US economic growth remains unchanged at 2.2%. Forecasts for China and India in 2017 also remain unchanged at 6.2% and 7.1%, respectively. Russia’s 2017 growth was revised up to 1.0%, while Brazil’s growth forecast remains unchanged at 0.4%.
World Oil Demand World oil demand growth in 2016 is expected to increase by 1.32 mb/d, following an upward adjustment of 70 tb/d to reflect continued better-than-expected consumption in OECD Europe and Asia Pacific. Total oil demand is now estimated to average 94.62 mb/d, taking into account base line adjustments to China of around 0.12 mb/d. In 2017, world oil demand growth is seen to reach 1.19 mb/d, representing an upward revision of 35 tb/d to now average 95.81 mb/d.
World Oil Supply Non-OPEC oil supply growth in 2016 has been revised up by 50 tb/d to now show a contraction of 0.66 mb/d on higher-than-expected output in 4Q16. In 2017, non-OPEC supply growth has been revised up by 120 tb/d to now show an increase of 240 tb/d, due to a pick up in drilling activities and investment in the US. OPEC NGL production is forecast to grow by 0.15 mb/d in 2017, following growth of 0.15 mb/d in 2016. In January, OPEC production decreased by 890 tb/d, according to secondary sources, to average 32.14 mb/d.
Product Markets and Refining Operations Product markets in the Atlantic Basin received support in January from the top of the barrel on the back of higher export opportunities in gasoline and naphtha. This, along with the positive performance at the bottom of the barrel, allowed refinery margins to remain healthy. Meanwhile, margins in Asia strengthened on the back of firm regional demand.
Tanker Market Spot freight rates continued to recover in January, showing general m-o-m improvements across all tanker sectors. Gains were mainly driven by a firmer market in West Africa, the Middle East and the Mediterranean, along with delays due to congestion in the Turkish Straits and severe weather conditions. Freight rates rose in January, despite a general decline in chartering activity.
Stock Movements Total OECD commercial oil stocks fell in December 2016 to stand at 2,999 mb. At this level, OECD commercial oil stocks are 299 mb above the five-year average. Crude and products showed surpluses of around 216 mb and 83 mb, respectively. In terms of forward cover, OECD commercial stocks stood at 63.9 days, some 5.5 days higher than the five-year average.
Balance of Supply and Demand Demand for OPEC crude in 2016 averaged 31.3 mb/d, an increase of 1.8 mb/d over the previous year. In 2017, demand for OPEC crude is projected to average 32.1 mb/d, around 0.8 mb/d higher than last year.

2 OPEC Monthly Oil Market Report – February 2017
OPEC Monthly Oil Market Report – February 2017 3
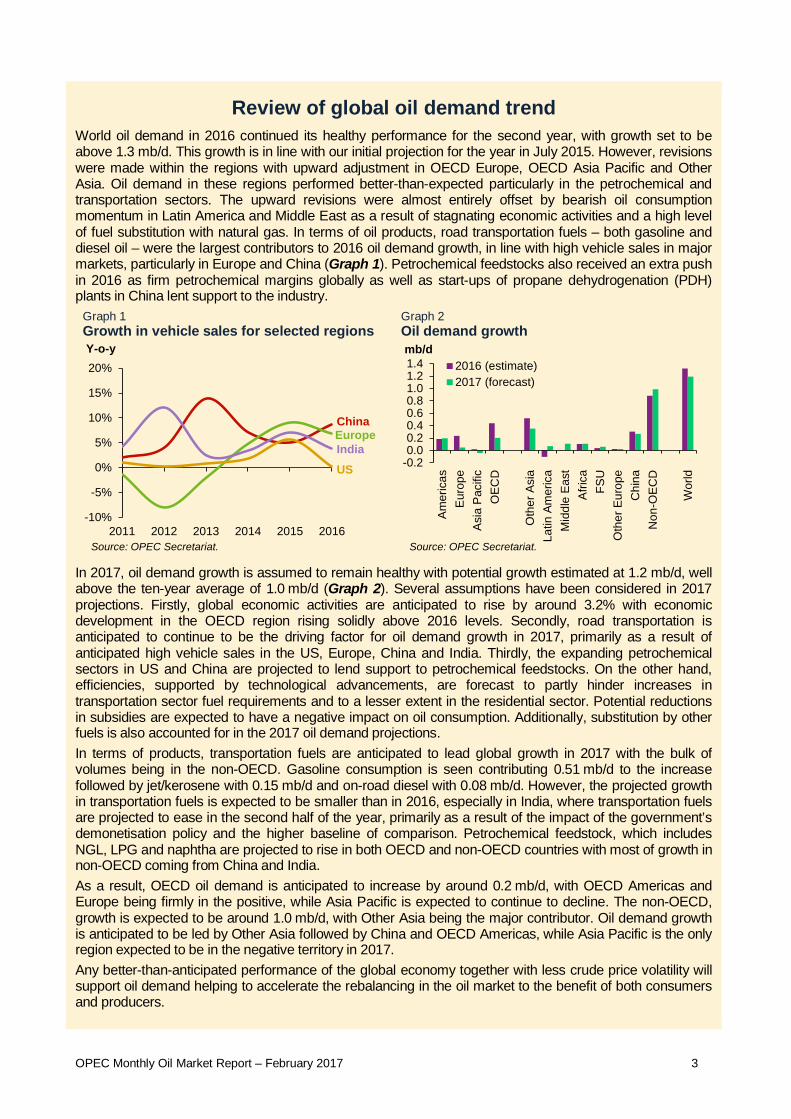
Review of global oil demand trend World oil demand in 2016 continued its healthy performance for the second year, with growth set to be above 1.3 mb/d. This growth is in line with our initial projection for the year in July 2015. However, revisions were made within the regions with upward adjustment in OECD Europe, OECD Asia Pacific and Other Asia. Oil demand in these regions performed better-than-expected particularly in the petrochemical and transportation sectors. The upward revisions were almost entirely offset by bearish oil consumption momentum in Latin America and Middle East as a result of stagnating economic activities and a high level of fuel substitution with natural gas. In terms of oil products, road transportation fuels – both gasoline and diesel oil – were the largest contributors to 2016 oil demand growth, in line with high vehicle sales in major markets, particularly in Europe and China (Graph 1). Petrochemical feedstocks also received an extra push in 2016 as firm petrochemical margins globally as well as start-ups of propane dehydrogenation (PDH) plants in China lent support to the industry.
Graph 1 Growth in vehicle sales for selected regions
Graph 2 Oil demand growth
In 2017, oil demand growth is assumed to remain healthy with potential growth estimated at 1.2 mb/d, well above the ten-year average of 1.0 mb/d (Graph 2). Several assumptions have been considered in 2017 projections. Firstly, global economic activities are anticipated to rise by around 3.2% with economic development in the OECD region rising solidly above 2016 levels. Secondly, road transportation is anticipated to continue to be the driving factor for oil demand growth in 2017, primarily as a result of anticipated high vehicle sales in the US, Europe, China and India. Thirdly, the expanding petrochemical sectors in US and China are projected to lend support to petrochemical feedstocks. On the other hand, efficiencies, supported by technological advancements, are forecast to partly hinder increases in transportation sector fuel requirements and to a lesser extent in the residential sector. Potential reductions in subsidies are expected to have a negative impact on oil consumption. Additionally, substitution by other fuels is also accounted for in the 2017 oil demand projections. In terms of products, transportation fuels are anticipated to lead global growth in 2017 with the bulk of volumes being in the non-OECD. Gasoline consumption is seen contributing 0.51 mb/d to the increase followed by jet/kerosene with 0.15 mb/d and on-road diesel with 0.08 mb/d. However, the projected growth in transportation fuels is expected to be smaller than in 2016, especially in India, where transportation fuels are projected to ease in the second half of the year, primarily as a result of the impact of the government’s demonetisation policy and the higher baseline of comparison. Petrochemical feedstock, which includes NGL, LPG and naphtha are projected to rise in both OECD and non-OECD countries with most of growth in non-OECD coming from China and India. As a result, OECD oil demand is anticipated to increase by around 0.2 mb/d, with OECD Americas and Europe being firmly in the positive, while Asia Pacific is expected to continue to decline. The non-OECD, growth is expected to be around 1.0 mb/d, with Other Asia being the major contributor. Oil demand growth is anticipated to be led by Other Asia followed by China and OECD Americas, while Asia Pacific is the only region expected to be in the negative territory in 2017. Any better-than-anticipated performance of the global economy together with less crude price volatility will support oil demand helping to accelerate the rebalancing in the oil market to the benefit of both consumers and producers.
-10%
-5%
0%
5%
10%
15%
20%
2011 2012 2013 2014 2015 2016
Y-o-y
ChinaEuropeIndia
Source: OPEC Secretariat.
US -0.20.00.20.40.60.81.01.21.4
Am
eric
asE
urop
eA
sia
Pac
ific
OEC
D
Oth
er A
sia
Latin
Am
eric
aM
iddl
e Ea
stA
frica
FSU
Oth
er E
urop
eC
hina
Non
-OEC
D
Wor
ld
mb/d2016 (estimate)2017 (forecast)
Source: OPEC Secretariat.

4 OPEC Monthly Oil Market Report – February 2017
Crude Oil Price Movements
OPEC Monthly Oil Market Report – February 2017 5
Crude Oil Price Movements
The OPEC Reference Basket (ORB) averaged $52.40/b in January, representing of 1.4% and its highest level in more than a year and a half. This compares with a monthly average of $25/b seen in the same month last year. Crude oil futures prices edged up in January to mark their highest levels since July 2015. A mixture of diverse factors kept oil prices range-bound. Crude futures drew some support from a weaker US dollar and early signs of tightening supplies. In January, ICE Brent averaged 59¢ or 1.1% higher at $55.51/b, while NYMEX WTI increased by 44¢ or 0.8% to average $52.61/b. Compared to the same month last year ICE Brent was a hefty $23.58 or 74% higher at $55.51/b, while NYMEX WTI was $20.83 or 66% higher at $52.61/b. The ICE Brent/NYMEX WTI spread widened again in January, as further oil stock builds and pipeline disruptions weighed on the US benchmark. Also, increasing US shale oil production had a negative impact on the WTI. The spread widened to average $2.85/b in January. Net long positions held by hedge funds and other institutional investors hit fresh all-time highs for the second month in a row in January, providing additional fuel to the ongoing steady gains in prices. Speculators increased net long positions significantly in January as indicated by the traders’ commitment data from both the ICE and NYMEX exchanges. All three marker crudes – Brent, WTI and Dubai – reduced their contango structure in January. Further down the curve, the backwardation remained noticeable from 2017 summer onward on expectations for a balanced market. Although sweet/sour differentials were relatively stable in January, sour crudes continued to gain ground. The spread narrowed in Europe and Asia, but remained unchanged in the US Gulf Coast.
OPEC Reference Basket The ORB started the year twofold higher than in the same month last year, averaging more than $52/b compared to a little above $25/b in January 2016. M-o-m, the ORB ended January less than 1% higher following a significant gain in December. For most of January, global oil prices were range-bound, buoyed by expected OPEC production adjustments, while pressured by US output growth and crude oil stock builds. Prices throughout the month were supported by production adjustments as well as positive US economic data, a rally in equities, speculative activities, and a softening US dollar. Nevertheless, weak Chinese trade data, concerns about rising US crude production, and ample supply availability in the Atlantic Basin capped the ongoing rebound in oil prices.
Crude Oil Price Movements
6 OPEC Monthly Oil Market Report – February 2017
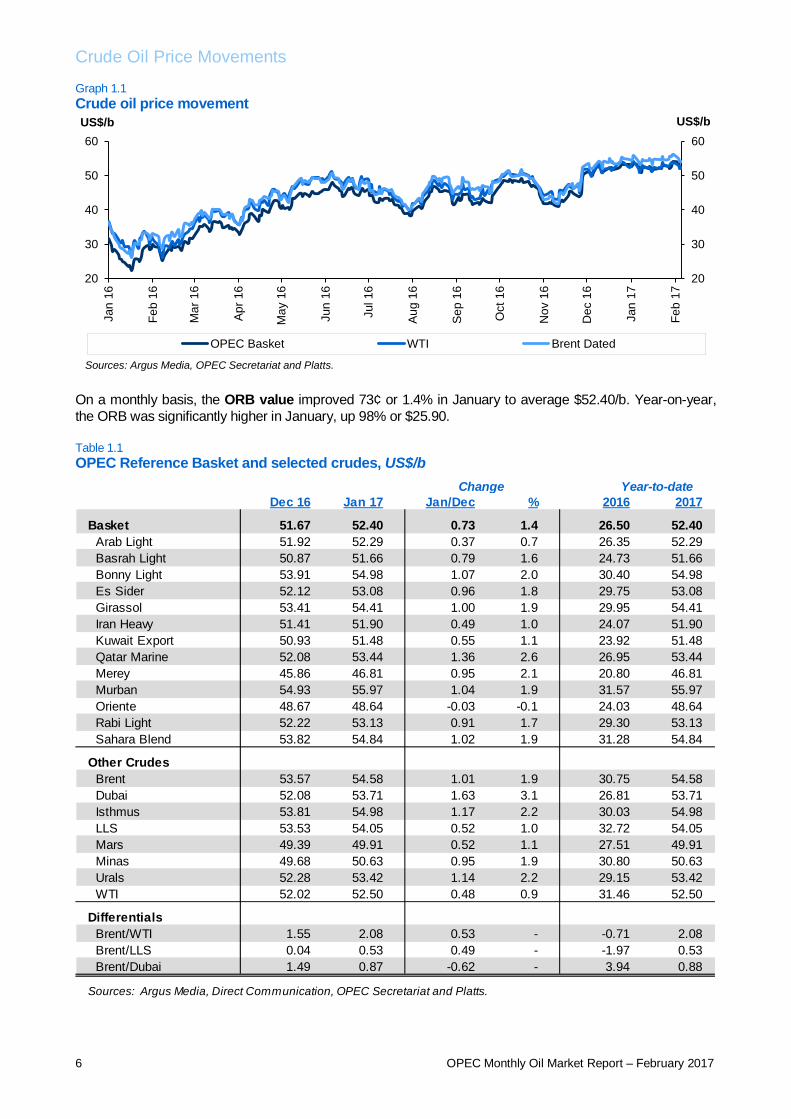
Graph 1.1 Crude oil price movement
On a monthly basis, the ORB value improved 73¢ or 1.4% in January to average $52.40/b. Year-on-year, the ORB was significantly higher in January, up 98% or $25.90. Table 1.1 OPEC Reference Basket and selected crudes, US$/b
20
30
40
50
60
20
30
40
50
60
Jan
16
Feb
16
Mar
16
Apr
16
May
16
Jun
16
Jul 1
6
Aug
16
Sep
16
Oct
16
Nov
16
Dec
16
Jan
17
Feb
17
US$/bUS$/b
OPEC Basket WTI Brent Dated
Sources: Argus Media, OPEC Secretariat and Platts.
Dec 16 Jan 17 Jan/Dec % 2016 2017
Basket 51.67 52.40 0.73 1.4 26.50 52.40 Arab Light 51.92 52.29 0.37 0.7 26.35 52.29 Basrah Light 50.87 51.66 0.79 1.6 24.73 51.66 Bonny Light 53.91 54.98 1.07 2.0 30.40 54.98 Es Sider 52.12 53.08 0.96 1.8 29.75 53.08 Girassol 53.41 54.41 1.00 1.9 29.95 54.41 Iran Heavy 51.41 51.90 0.49 1.0 24.07 51.90 Kuwait Export 50.93 51.48 0.55 1.1 23.92 51.48 Qatar Marine 52.08 53.44 1.36 2.6 26.95 53.44 Merey 45.86 46.81 0.95 2.1 20.80 46.81 Murban 54.93 55.97 1.04 1.9 31.57 55.97 Oriente 48.67 48.64 -0.03 -0.1 24.03 48.64 Rabi Light 52.22 53.13 0.91 1.7 29.30 53.13 Sahara Blend 53.82 54.84 1.02 1.9 31.28 54.84
Other Crudes Brent 53.57 54.58 1.01 1.9 30.75 54.58 Dubai 52.08 53.71 1.63 3.1 26.81 53.71 Isthmus 53.81 54.98 1.17 2.2 30.03 54.98 LLS 53.53 54.05 0.52 1.0 32.72 54.05 Mars 49.39 49.91 0.52 1.1 27.51 49.91 Minas 49.68 50.63 0.95 1.9 30.80 50.63 Urals 52.28 53.42 1.14 2.2 29.15 53.42 WTI 52.02 52.50 0.48 0.9 31.46 52.50
Differentials Brent/WTI 1.55 2.08 0.53 - -0.71 2.08 Brent/LLS 0.04 0.53 0.49 - -1.97 0.53 Brent/Dubai 1.49 0.87 -0.62 - 3.94 0.88
Year-to-date
Sources: Argus Media, Direct Communication, OPEC Secretariat and Platts.
Change

Crude Oil Price Movements
OPEC Monthly Oil Market Report – February 2017 7
All ORB component values, except Ecuador’s Oriente, improved slightly over the month, in line with their related marker grades. Spot prices for Dated Brent, WTI and Dubai increased in January by $1.01, 48¢ and $1.63, respectively. Values for the multiple region destination grades – Arab Light, Basrah Light, Iran Heavy and Kuwait Export – increased 55¢ or 1.1% to average $51.83/b in January. The Middle Eastern spot components – Murban and Qatar Marine – saw their values lifted by $1.20/b or 2.3% to $54.71/b. These grades continued to be supported further by the healthy sour crude oil market in Asia and Europe. As for the Latin American ORB components, Venezuelan Merey increased by 95¢ or 2.1% to average $46.81/b, while Ecuador’s Oriente was almost unchanged at $48.64/b, down just 3¢ or 0.1%. Combined, the light sweet crudes from West and North Africa – Saharan Blend, Es Sider, Girassol, Bonny Light and Gabon’s Rabi – gained 99¢ or 1.9% to $54.09/b. On 10 February, the ORB stood at $53.23/b, 83¢ above the January average.
The oil futures market Crude oil futures edged up in January to their highest levels since July 2015. A mixture of diverse factors kept oil prices range-bound in January. Crude futures drew some support from a weaker US dollar and early signs of tightening supplies, supported by the latest OPEC production data which showed a sizable decline in output in December and early January. Yet, gains remained capped on worries over continued excess supply due to a potential rebound in US shale drilling in response to higher prices. The EIA forecasted that US tight oil output in February from major shale basins will rise to 4.75 mb/d, up 41 tb/d from January. ICE Brent rose by 53¢ or 1.0% in January to average $55.45/b, while NYMEX WTI increased 44¢ or 0.8% to average $52.61/b. Compared to January 2016, ICE Brent was a hefty $23.52, or 74%, higher at $55.45/b for the year 2017, while NYMEX WTI surged by $20.83 or 66% to $52.61/b. These are the highest starts of the year since January 2014. Crude oil futures prices improved in the second week of February. On 10 February, ICE Brent stood at $56.70/b and NYMEX WTI at $53.86/b. Table 1.2 Crude oil futures, US$/b
Hedge funds and other institutional investors’ bets on crude oil prices rising have hit fresh all-time highs for the second month in a row, providing additional fuel to ongoing steady gains in prices. Speculators net long positions increased significantly in January as indicated by traders’ commitment data from both the ICE and NYMEX exchanges. Money managers’ net length in NYMEX WTI futures and options crude surged by 72,018 contracts or 23% to 379,927 contracts in the period from end of December to the end of January. In ICE Brent futures and options, speculators increased net long positions by 18,282 contracts, or 4%, to 472,867 lots. The total futures and options open interest volume in the two exchanges also increased by 5.3%, or about 290,000 contracts, to 5.75 million contracts.
Dec 16 Jan 17 Jan/Dec % 2016 2017
NYMEX WTI 52.17 52.61 0.44 0.85 31.78 52.61ICE Brent 54.92 55.45 0.53 0.97 31.93 55.45
Transatlantic spread 2.75 2.84 0.09 0.12 0.15 2.84
Note: Totals may not add up due to independent rounding.
Change Year-to-date
Sources: CME Group, Intercontinental Exchange and OPEC Secretariat.
Crude Oil Price Movements
8 OPEC Monthly Oil Market Report – February 2017
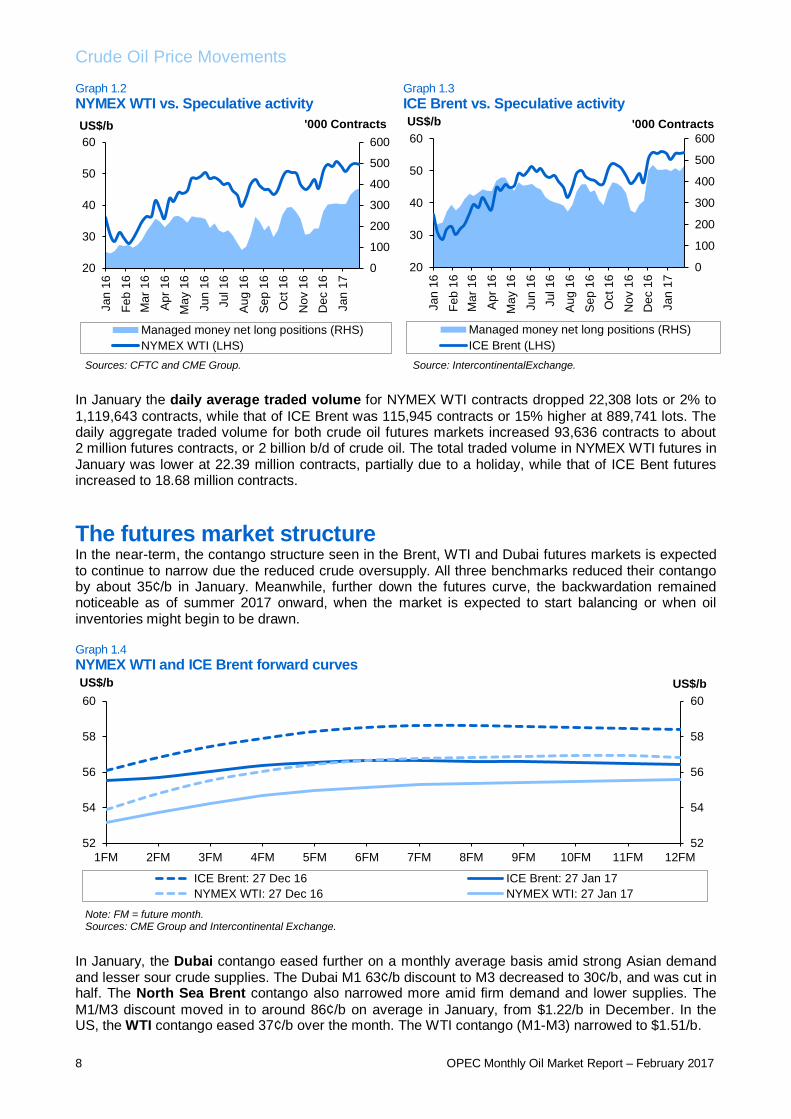
Graph 1.2 NYMEX WTI vs. Speculative activity
Graph 1.3 ICE Brent vs. Speculative activity
In January the daily average traded volume for NYMEX WTI contracts dropped 22,308 lots or 2% to 1,119,643 contracts, while that of ICE Brent was 115,945 contracts or 15% higher at 889,741 lots. The daily aggregate traded volume for both crude oil futures markets increased 93,636 contracts to about 2 million futures contracts, or 2 billion b/d of crude oil. The total traded volume in NYMEX WTI futures in January was lower at 22.39 million contracts, partially due to a holiday, while that of ICE Bent futures increased to 18.68 million contracts.
The futures market structure In the near-term, the contango structure seen in the Brent, WTI and Dubai futures markets is expected to continue to narrow due the reduced crude oversupply. All three benchmarks reduced their contango by about 35¢/b in January. Meanwhile, further down the futures curve, the backwardation remained noticeable as of summer 2017 onward, when the market is expected to start balancing or when oil inventories might begin to be drawn. Graph 1.4 NYMEX WTI and ICE Brent forward curves
In January, the Dubai contango eased further on a monthly average basis amid strong Asian demand and lesser sour crude supplies. The Dubai M1 63¢/b discount to M3 decreased to 30¢/b, and was cut in half. The North Sea Brent contango also narrowed more amid firm demand and lower supplies. The M1/M3 discount moved in to around 86¢/b on average in January, from $1.22/b in December. In the US, the WTI contango eased 37¢/b over the month. The WTI contango (M1-M3) narrowed to $1.51/b.
0
100
200
300
400
500
600
20
30
40
50
60
Jan
16
Feb
16M
ar 1
6
Apr
16
May
16
Jun
16Ju
l 16
Aug
16
Sep
16O
ct 1
6
Nov
16
Dec
16
Jan
17
US$/b
Managed money net long positions (RHS)NYMEX WTI (LHS)
'000 Contracts
Sources: CFTC and CME Group.
0
100
200
300
400
500
600
20
30
40
50
60
Jan
16Fe
b 16
Mar
16
Apr
16
May
16
Jun
16Ju
l 16
Aug
16
Sep
16
Oct
16
Nov
16
Dec
16
Jan
17
US$/b
Managed money net long positions (RHS)ICE Brent (LHS)
'000 Contracts
Source: IntercontinentalExchange.
52
54
56
58
60
52
54
56
58
60
1FM 2FM 3FM 4FM 5FM 6FM 7FM 8FM 9FM 10FM 11FM 12FM
US$/bUS$/b
ICE Brent: 27 Dec 16 ICE Brent: 27 Jan 17NYMEX WTI: 27 Dec 16 NYMEX WTI: 27 Jan 17
Note: FM = future month.Sources: CME Group and Intercontinental Exchange.

Crude Oil Price Movements
OPEC Monthly Oil Market Report – February 2017 9
The ICE Brent/NYMEX WTI spread widened again in January as further oil stock builds and pipeline disruptions weighed on the US benchmark. Also, increasing US shale oil production had a negative impact on WTI. In contrast, ICE Brent was affected positively by the expected decline in excess oil supply. The first-month ICE Brent/NYMEX WTI spread widened to $2.85/b in January, up 10¢. This is theoretically in favour of US crude exports, and crude-by-rail in the US could move higher, while it would be against the arbitrage economics of Brent-related crudes such as WAF crudes. Table 1.3 NYMEX WTI and ICE Brent forward curves, US$/b
The light sweet/medium sour crude spread Although the sweet/sour differentials were relatively stable in January, sour crudes continued to gain ground. In Europe and Asia, the spread narrowed, while in the USGC, it was unchanged. In Europe, the Urals medium sour crude discount to light sweet North Sea Brent narrowed 15¢ at $1.15/b in January. Sour grades in Europe gained support from the decline in availability of light to medium sour grades. Graph 1.5 Brent Dated vs. sour grades (Urals and Dubai) spread
In Asia, the previous month’s widening trend of Tapis/Dubai spread reversed course amid healthy demand for sour crudes. The light sweet crudes are being pressured by the narrowing Brent-Dubai spread, which encourages the arbitrage flow of Bent-related light sweet crudes to the Asia Pacific region. This is despite support for light sweet crudes from healthy regional gasoline and naphtha margins. The Tapis/Dubai spread eased by 65¢ to average $3/b in January. The Dated Brent/Dubai spread also narrowed 62¢ to 87¢/b.
1FM 2FM 3FM 6FM 12FM 12FM-1FM
NYMEX WTI 27 Dec 16 53.90 54.79 55.51 56.66 56.85 2.9527 Jan 17 53.17 53.75 54.25 55.15 55.56 2.39
Change -0.73 -1.04 -1.26 -1.51 -1.29 -0.56
ICE Brent 27 Dec 16 56.09 56.83 57.43 58.51 58.39 2.3027 Jan 17 55.52 55.70 56.05 56.64 56.41 0.89
Change -0.57 -1.13 -1.38 -1.87 -1.98 -1.41
Note: FM = future month.Sources: CME Group and Intercontinental Exchange.
-4
-2
0
2
4
6
8
-4
-2
0
2
4
6
8
Jan
16
Feb
16
Mar
16
Apr 1
6
May
16
Jun
16
Jul 1
6
Aug
16
Sep
16
Oct
16
Nov
16
Dec
16
Jan
17
Feb
17
US$/bUS$/b
Dubai Urals
Sources: Argus Media, OPEC Secretariat and Platts.

Crude Oil Price Movements
10 OPEC Monthly Oil Market Report – February 2017
In the USGC, the Light Louisiana Sweet (LLS) premium over medium sour Mars was flat in January at $4.15/b. Furthermore, both grades were supported by the widening of WTI/Brent over the month as it made local crude more attractive compared to imported volumes.

Commodity Markets
OPEC Monthly Oil Market Report – February 2017 11
Commodity Markets
Energy commodity prices advanced in January, as oil prices rose while coal and natural gas prices generally declined. In the category of non-energy commodities, agriculture commodities showed a broad-based advance, while base metal increases were led by increases in aluminum and copper. Precious metals prices advanced on lower real interest rates.
Trends in selected commodity markets Global manufacturing as shown by the JPM global manufacturing PMI, expanded, remaining at a 34-month high of 52.7, supporting the metals group. Meanwhile, real interest rate expectations in the US declined over the month, as market participants waited for further clarity regarding the plans of the new US administration on infrastructure spending and tax reform. The decline in real interest rates weakened the US dollar and supported precious metal and commodity prices in general. Agricultural prices saw their best performance in the past seven months, with average price increases among the groups of food, beverages and raw materials. The increase in food prices was led by higher grain prices. The US Department of Agriculture assessment of wheat planted for the current crop was around 10% below the previous year’s figures – “the second lowest acreage on record” according to the USDA, which together with dry conditions in the main producing areas at the beginning of the month translated into higher prices. Sugar prices jumped, supported by lower estimations of India’s sugar output by the country’s industry body, India Sugar Mills Association, which were due to effects of the previous year’s drought. Natural rubber increased by 12.3% and has advanced to around 40% over the last three months due to increasing demand for tire production in China as well as flooding in some regions of country which is world largest producer. Base metal price increases were led by aluminium and copper. On the demand side, metals were supported by continuing strength in global manufacturing. China’s manufacturing PMI reading of 51.0 also pointed to expansion, although at a lower rate than in the previous month. On the supply side, aluminium prices were supported by reports of potential output restrictions in China. At the same time, copper prices were also supported at the end of the month due to a potential strike at the world’s largest mine in Chile. However, a slowdown in Chinese real estate prices is likely to limit the upside potential of metal prices. The price of newly constructed residential buildings advanced in 46 of the 70 largest cities over a m-o-m basis in December, versus 55 of 70 the previous month. Meanwhile, nickel prices declined steeply as Indonesia signalled some relaxation of the ore’s export ban. Energy prices were mixed, with advances in crude oil supported by production adjustments and the lower US dollar. Meanwhile, natural gas declined in the US, as temperatures were warmer than average in the second half of the month, which translated in smaller-than-average withdrawals from underground storage. In Europe, prices declined due to much lower-than-average temperatures. Inventories declined to 41.2% at the end of January versus 64.9% at the end of December. Last year’s inventories were at 54.8% of capacity at the end of January. Coal prices declined, as December output in China was the highest for the year following government relaxation of working restrictions for mining operations.
Commodity Markets
12 OPEC Monthly Oil Market Report – February 2017
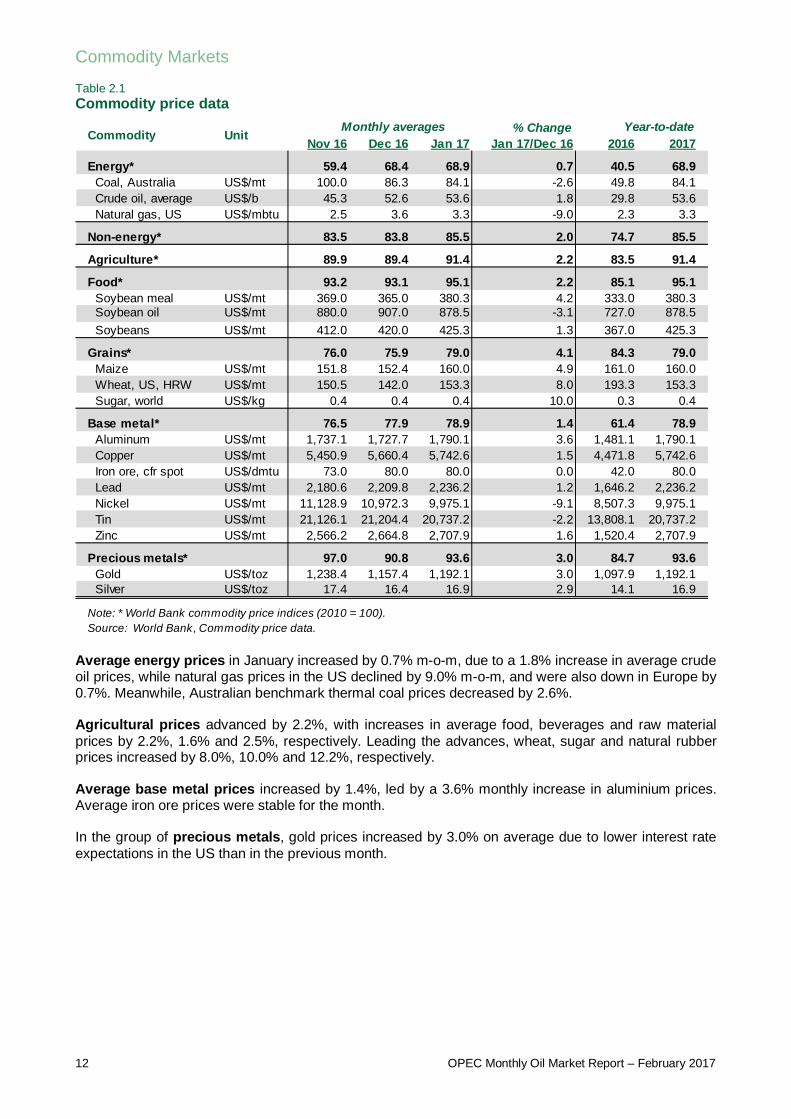
Table 2.1 Commodity price data
Average energy prices in January increased by 0.7% m-o-m, due to a 1.8% increase in average crude oil prices, while natural gas prices in the US declined by 9.0% m-o-m, and were also down in Europe by 0.7%. Meanwhile, Australian benchmark thermal coal prices decreased by 2.6%. Agricultural prices advanced by 2.2%, with increases in average food, beverages and raw material prices by 2.2%, 1.6% and 2.5%, respectively. Leading the advances, wheat, sugar and natural rubber prices increased by 8.0%, 10.0% and 12.2%, respectively. Average base metal prices increased by 1.4%, led by a 3.6% monthly increase in aluminium prices. Average iron ore prices were stable for the month. In the group of precious metals, gold prices increased by 3.0% on average due to lower interest rate expectations in the US than in the previous month.
% ChangeNov 16 Dec 16 Jan 17 Jan 17/Dec 16 2016 2017
Energy* 59.4 68.4 68.9 0.7 40.5 68.9 Coal, Australia US$/mt 100.0 86.3 84.1 -2.6 49.8 84.1 Crude oil, average US$/b 45.3 52.6 53.6 1.8 29.8 53.6 Natural gas, US US$/mbtu 2.5 3.6 3.3 -9.0 2.3 3.3
Non-energy* 83.5 83.8 85.5 2.0 74.7 85.5
Agriculture* 89.9 89.4 91.4 2.2 83.5 91.4
Food* 93.2 93.1 95.1 2.2 85.1 95.1 Soybean meal US$/mt 369.0 365.0 380.3 4.2 333.0 380.3 Soybean oil US$/mt 880.0 907.0 878.5 -3.1 727.0 878.5 Soybeans US$/mt 412.0 420.0 425.3 1.3 367.0 425.3
Grains* 76.0 75.9 79.0 4.1 84.3 79.0 Maize US$/mt 151.8 152.4 160.0 4.9 161.0 160.0 Wheat, US, HRW US$/mt 150.5 142.0 153.3 8.0 193.3 153.3 Sugar, world US$/kg 0.4 0.4 0.4 10.0 0.3 0.4
Base metal* 76.5 77.9 78.9 1.4 61.4 78.9 Aluminum US$/mt 1,737.1 1,727.7 1,790.1 3.6 1,481.1 1,790.1 Copper US$/mt 5,450.9 5,660.4 5,742.6 1.5 4,471.8 5,742.6 Iron ore, cfr spot US$/dmtu 73.0 80.0 80.0 0.0 42.0 80.0 Lead US$/mt 2,180.6 2,209.8 2,236.2 1.2 1,646.2 2,236.2 Nickel US$/mt 11,128.9 10,972.3 9,975.1 -9.1 8,507.3 9,975.1 Tin US$/mt 21,126.1 21,204.4 20,737.2 -2.2 13,808.1 20,737.2 Zinc US$/mt 2,566.2 2,664.8 2,707.9 1.6 1,520.4 2,707.9
Precious metals* 97.0 90.8 93.6 3.0 84.7 93.6 Gold US$/toz 1,238.4 1,157.4 1,192.1 3.0 1,097.9 1,192.1 Silver US$/toz 17.4 16.4 16.9 2.9 14.1 16.9
Note: * World Bank commodity price indices (2010 = 100).Source: World Bank, Commodity price data.
UnitCommodity Monthly averages Year-to-date

Commodity Markets
OPEC Monthly Oil Market Report – February 2017 13
Graph 2.1 Major commodity price indices
Graph 2.2 Inventories at the LME
In January, the Henry Hub natural gas index declined. The average price was down by 32¢ or 9.0% to $3.26 per million British thermal units (mmbtu) after trading at an average of $3.58/mmbtu in the previous month. According to the US Energy Information Administration (EIA), utilities withdrew 87 billion cubic feet (bcf) of working gas in underground storage during the week ending 27 January. Total working gas in underground storage stood at 2,711 bcf, or 8.9% lower than at the same time in the previous year and 2.2% higher than the previous five-year average. The agency notes that temperatures were warmer than normal during the reported week.
Investment flows into commodities Open interest volume (OIV) increased in January for selected US commodity markets such as agriculture, crude oil, copper, precious metals, agriculture and livestock, while it decreased for natural gas. Meanwhile, in monthly terms, speculative net length positions increased for agriculture, crude oil, copper and livestock, but declined for natural gas and precious metals. Table 2.2 CFTC data on non-commercial positions, ‘000 contracts
Agriculture’s OIV increased by 1.6% to 4,984,012 contracts in January. Meanwhile, money managers increased net long positions by 30.1% to 379,341 lots, largely because of increasing net length in corn, wheat and the soy complex. Henry Hub’s natural gas OIV decreased by 2.0% m-o-m to 1,193,838 contracts in January. Money managers decreased their net length positions slightly by 1.1% to 147,497 on the impact of warmer-than-average weather.
20
40
60
80
100
120
20
40
60
80
100
120
Jan
15
Mar
15
May
15
Jul 1
5
Sep
15
Nov
15
Jan
16
Mar
16
May
16
Jul 1
6
Sep
16
Nov
16
Jan
17
IndexIndex
Energy Non-energyAgriculture FoodBase metals HH natural gasGold
Source: World Bank, Commodity price data.
Base year 2010 = 10005001,0001,5002,0002,5003,000
0100200300400500600
Jan
16
Feb
16
Mar
16
Apr
16
May
16
Jun
16
Jul 1
6
Aug
16
Sep
16
Oct
16
Nov
16
Dec
16
Jan
17
'000 Tonnes'000 Tonnes
Copper LeadNickel TinZinc Pr. Aluminium (RHS)
Sources: London Metal Exchange and Thomson Reuters.
Dec 16 Jan 17 Dec 16 % OIV Jan 17 % OIV
Crude oil 2,068 2,143 272 13 329 15Natural gas 1,218 1,194 149 12 147 12Agriculture 4,905 4,984 292 6 379 8Precious metals 559 617 104 19 108 18Copper 233 255 80 34 82 32Livestock 544 597 128 23 161 27
Total 9,527 9,789 1,024 108 1,208 112
Source: US Commodity Futures Trading Commission.
Open interest Net length
Commodity Markets
14 OPEC Monthly Oil Market Report – February 2017
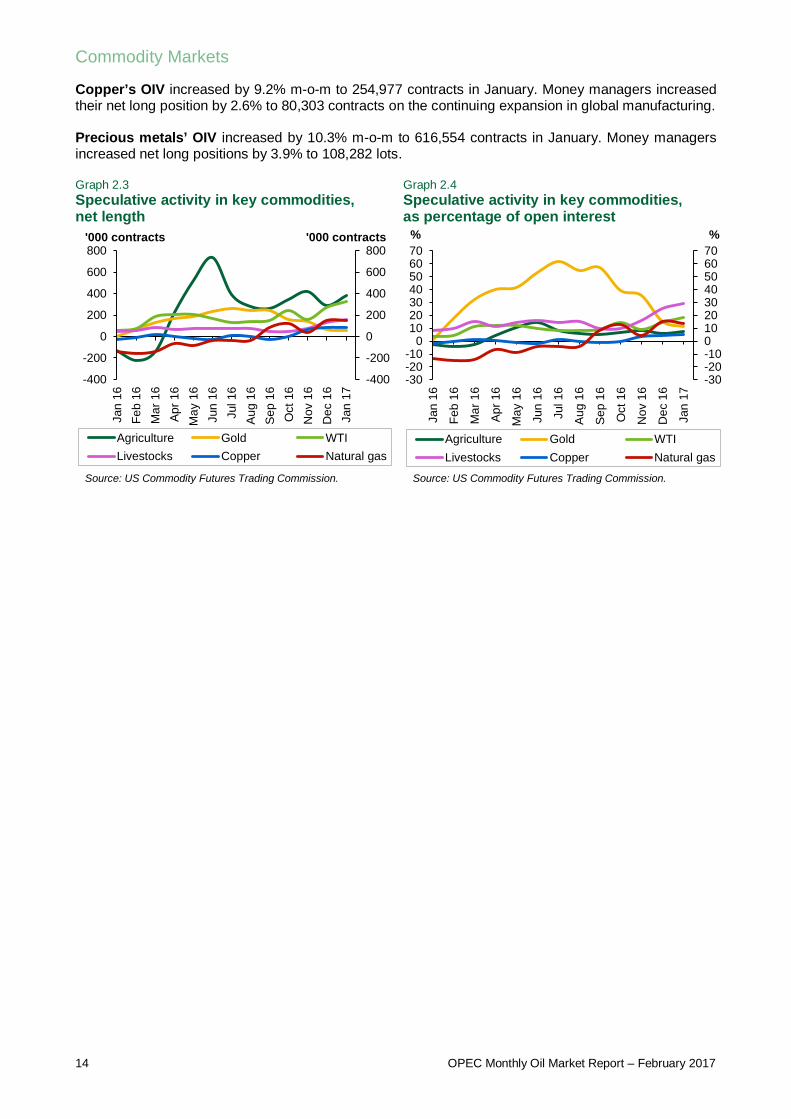
Copper’s OIV increased by 9.2% m-o-m to 254,977 contracts in January. Money managers increased their net long position by 2.6% to 80,303 contracts on the continuing expansion in global manufacturing. Precious metals’ OIV increased by 10.3% m-o-m to 616,554 contracts in January. Money managers increased net long positions by 3.9% to 108,282 lots. Graph 2.3 Speculative activity in key commodities, net length
Graph 2.4 Speculative activity in key commodities, as percentage of open interest
-400
-200
0
200
400
600
800
-400
-200
0
200
400
600
800
Jan
16Fe
b 16
Mar
16
Apr
16
May
16
Jun
16Ju
l 16
Aug
16
Sep
16
Oct
16
Nov
16
Dec
16
Jan
17
Agriculture Gold WTILivestocks Copper Natural gas
Source: US Commodity Futures Trading Commission.
'000 contracts '000 contracts
-30-20-10010203040506070
-30-20-10
010203040506070
Jan
16
Feb
16
Mar
16
Apr
16
May
16
Jun
16
Jul 1
6
Aug
16
Sep
16
Oct
16
Nov
16
Dec
16
Jan
17
%%
Agriculture Gold WTILivestocks Copper Natural gas
Source: US Commodity Futures Trading Commission.
World Economy
OPEC Monthly Oil Market Report – February 2017 15
World Economy
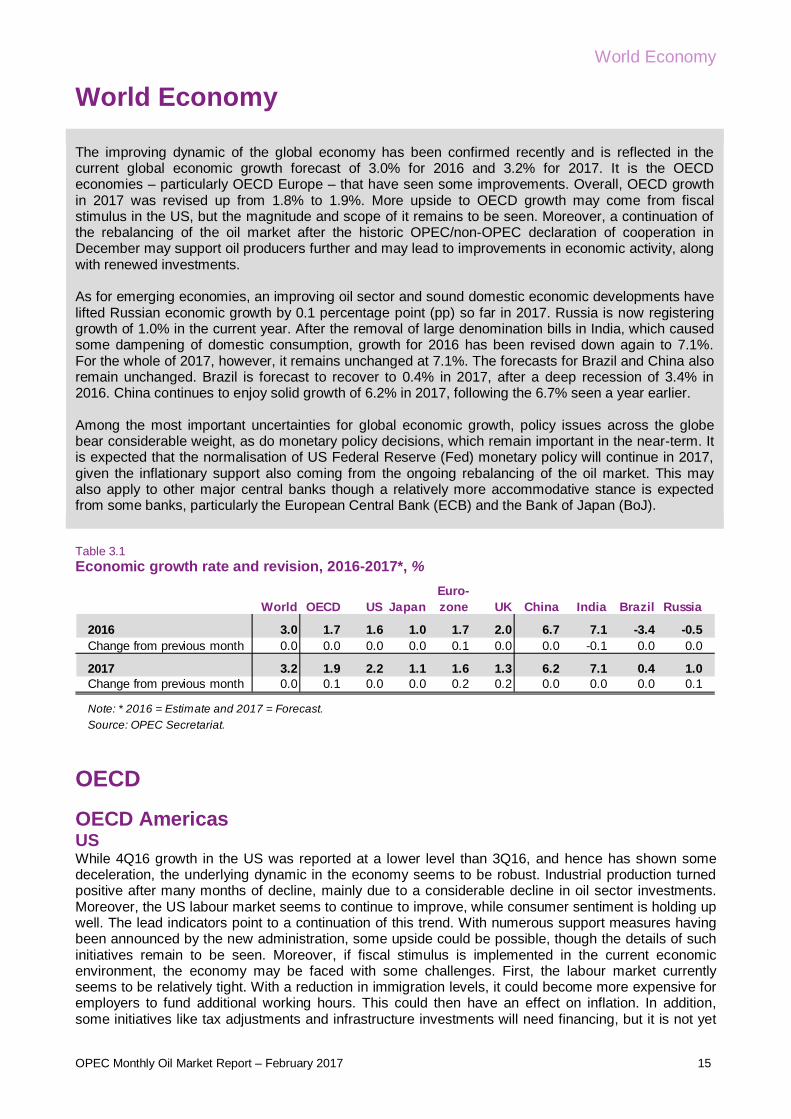
The improving dynamic of the global economy has been confirmed recently and is reflected in the current global economic growth forecast of 3.0% for 2016 and 3.2% for 2017. It is the OECD economies – particularly OECD Europe – that have seen some improvements. Overall, OECD growth in 2017 was revised up from 1.8% to 1.9%. More upside to OECD growth may come from fiscal stimulus in the US, but the magnitude and scope of it remains to be seen. Moreover, a continuation of the rebalancing of the oil market after the historic OPEC/non-OPEC declaration of cooperation in December may support oil producers further and may lead to improvements in economic activity, along with renewed investments. As for emerging economies, an improving oil sector and sound domestic economic developments have lifted Russian economic growth by 0.1 percentage point (pp) so far in 2017. Russia is now registering growth of 1.0% in the current year. After the removal of large denomination bills in India, which caused some dampening of domestic consumption, growth for 2016 has been revised down again to 7.1%. For the whole of 2017, however, it remains unchanged at 7.1%. The forecasts for Brazil and China also remain unchanged. Brazil is forecast to recover to 0.4% in 2017, after a deep recession of 3.4% in 2016. China continues to enjoy solid growth of 6.2% in 2017, following the 6.7% seen a year earlier. Among the most important uncertainties for global economic growth, policy issues across the globe bear considerable weight, as do monetary policy decisions, which remain important in the near-term. It is expected that the normalisation of US Federal Reserve (Fed) monetary policy will continue in 2017, given the inflationary support also coming from the ongoing rebalancing of the oil market. This may also apply to other major central banks though a relatively more accommodative stance is expected from some banks, particularly the European Central Bank (ECB) and the Bank of Japan (BoJ).
Table 3.1 Economic growth rate and revision, 2016-2017*, %
OECD OECD Americas US While 4Q16 growth in the US was reported at a lower level than 3Q16, and hence has shown some deceleration, the underlying dynamic in the economy seems to be robust. Industrial production turned positive after many months of decline, mainly due to a considerable decline in oil sector investments. Moreover, the US labour market seems to continue to improve, while consumer sentiment is holding up well. The lead indicators point to a continuation of this trend. With numerous support measures having been announced by the new administration, some upside could be possible, though the details of such initiatives remain to be seen. Moreover, if fiscal stimulus is implemented in the current economic environment, the economy may be faced with some challenges. First, the labour market currently seems to be relatively tight. With a reduction in immigration levels, it could become more expensive for employers to fund additional working hours. This could then have an effect on inflation. In addition, some initiatives like tax adjustments and infrastructure investments will need financing, but it is not yet
World OECD US JapanEuro-zone UK China India Brazil Russia
2016 3.0 1.7 1.6 1.0 1.7 2.0 6.7 7.1 -3.4 -0.5Change from previous month 0.0 0.0 0.0 0.0 0.1 0.0 0.0 -0.1 0.0 0.0
2017 3.2 1.9 2.2 1.1 1.6 1.3 6.2 7.1 0.4 1.0Change from previous month 0.0 0.1 0.0 0.0 0.2 0.2 0.0 0.0 0.0 0.1
Note: * 2016 = Estimate and 2017 = Forecast.Source: OPEC Secretariat.

World Economy
16 OPEC Monthly Oil Market Report – February 2017
entirely clear how this will be achieved. Given the current situation of the economy, it could be likely that such measures lift inflation via various channels. In the end, this may put the Fed under pressure to raise interest rates probably quicker than currently anticipated. At its latest meeting, the Fed pointed out that the path of normalising monetary policies is continuing, though it did not raise interest rates at the meeting. Also, inflation expectations in the meantime have come down somewhat, as it seems that the envisaged implementation of reforms will take longer than expected. This could, in turn, give the Fed more time to raise interest rates in a more gradual manner. GDP growth in 4Q16 was reported to be slightly lower than 3Q16 GDP. In the first of three estimates, it stood at 1.9% q-o-q on a seasonally adjusted annualised rate (SAAR). While this is lower than in 3Q16, private household consumption held up well, rising by 2.5% in 4Q16, compared to 3.0% q-o-q SAAR in 3Q16. Moreover, private investment also grew by 10.7% q-o-q SAAR. Exports have weakened after significantly expanding by 10.0% q-o-q SAAR in 3Q16, while the 4Q16 number has shown a decline of 4.3% q-o-q SAAR, impacted by the strength of the US dollar. So far, as long productivity does not pick up significantly or structural changes in the economy materialise, this pattern of around 2% growth on an annualised base is not expected to change considerably and it provides a guideline for future growth – particularly when considering an already relatively tight labour market. The positive momentum of the labour market continued in the latest January readings, though improvements materialised at a slightly slower pace. This somewhat slowing pace was also an important reason for the Fed not to raise interest rates in its last meeting. The unemployment rate increased slightly to 4.8% in December, while non-farm payroll additions rose by 227,000 in January, after 157,000 in December. Average hourly earnings did not improve or reach the same level as in previous months, falling back to a lower rise of 2.2% in January, after a significant increase of 2.9% y-o-y in December. Industrial production improved, supported by a better situation in the energy sector, rising by 0.5% y-o-y in December after contracting for more than a year and compared to a decline of 0.7% y-o-y in October. Mining, which includes oil sector related output, fell by the lowest rate since mid-2016, declining by 2.7% y-o-y, which translates into a monthly increase of 0.1%. The positive trend in private household consumption was supported considerably by the latest retail sales numbers. Retail sales growth in December stood at 4.1% y-o-y, even higher than the already strong November level of 3.9% y-o-y. This positive trend was also visible in the Conference Board’s Consumer Confidence Index, which retraced slightly in January to a level of 111.8 but remained at a considerable level. It was slightly lower than the December level of 113.7, which was the highest level since 2007, giving a strong indication that economic conditions have been improving. Graph 3.1 Manufacturing and non-manufacturing ISM indices
56.056.5
45
50
55
60
Jan
16
Feb
16
Mar
16
Apr
16
May
16
Jun
16
Jul 1
6
Aug
16
Sep
16
Oct
16
Nov
16
Dec
16
Jan
17
Index
ISM manufacturing index ISM non-manufacturing index
Sources: Institute for Supply Management and Haver Analytics.

World Economy
OPEC Monthly Oil Market Report – February 2017 17
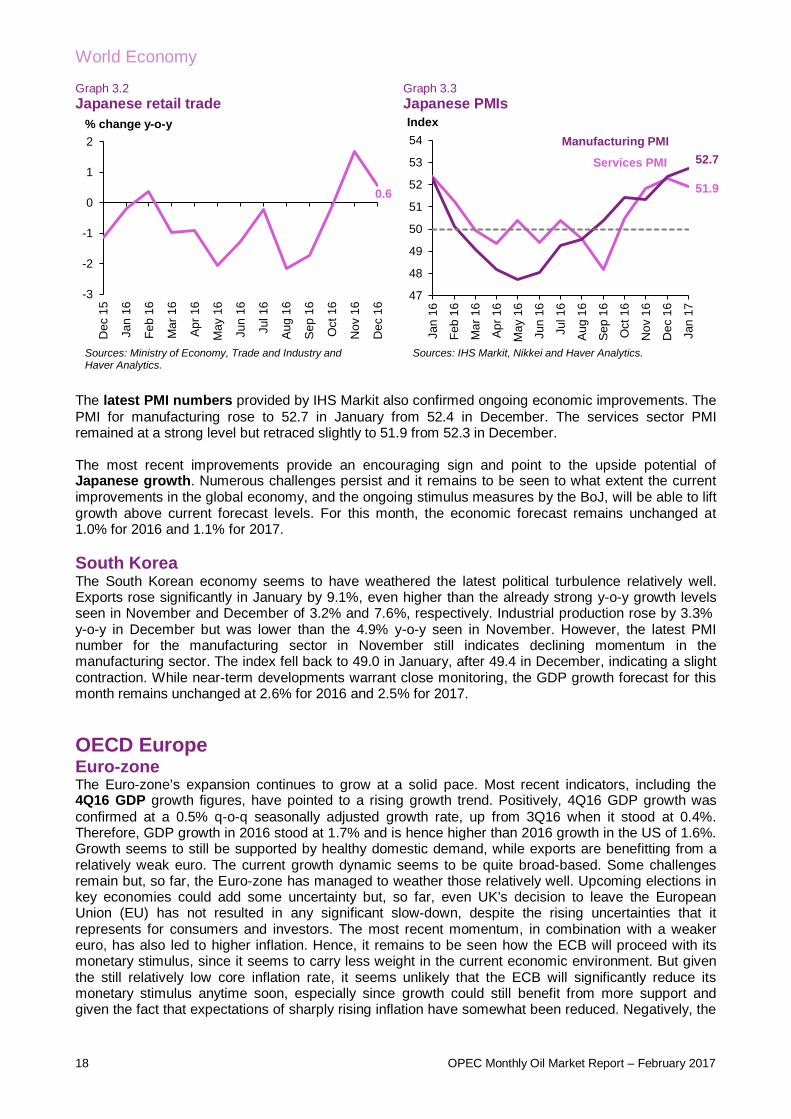
July’s Purchasing Manager’s Index (PMI) for the manufacturing sector as provided by the Institute of Supply Management (ISM) also indicated improvements in the underlying economy. The manufacturing PMI moved higher to reach 56.0 in January, compared to 54.5 in December. The important services sector index remained almost unchanged at an elevated level of 56.5 compared to 56.6 in December. After GDP growth of 1.6% in 2016, which was significantly impacted by low growth in 1Q16, the positive growth dynamic of the past months is expected to carry over into 2017. Signs have appeared that the momentum will lead to higher growth in the current year. This was already anticipated in the previous month, so the GDP growth forecast remains unchanged at 2.2%. More data over the coming months, as well as better insights into the fiscal stimulus plans of the incoming administration, will provide a sounder overview for a more detailed assessment of the situation of the US economy. Canada The economy of Canada continues to improve slightly, supported by improvements in the oil sector and a better situation in the US, its most important trading partner. Industrial production increased by 1.6% y-o-y in November, slightly lower than the October growth of 2.2% y-o-y. Output from the mining, oil and gas sector remained an important driver, with overall sector growth of 3.4% y-o-y, compared to also considerable growth of 4.1% in October. Importantly, the PMI for manufacturing improved, rising rose to 53.5 in January, compared to a December number of 51.9. The GDP growth forecasts for both 2016 and 2017 remain unchanged at 1.3% and 1.7%, respectively. OECD Asia Pacific Japan The Japanese economy continues to experience good growth momentum after a period of declining indicators in past months. It remains to be seen if the momentum continues and is sustainable. But the combination of a low yen and improving OECD-supported exports, as well as monetary and fiscal stimulus, has lifted the country’s domestic consumption. It seems the economy has gained some momentum and the coming months will show if this will be a sustainable trend. Inflation is still low but is likely to increase in the coming months, not only due to rising commodity prices but also supported by a considerable tightness in the labour market, which should lead to rising wages. With the still low inflation rate, the BoJ will also be in a position to continue providing monetary support. Inflation rose only slightly in December by 0.3%, falling back from its November level when it stood at 0.5%. Given the strengthening of commodity prices in previous months, this trend may continue. However, when excluding the two volatile groups of energy and food, the country’s core inflation figure stood at 0% in December compared to 0.1% in November. Positively, real income continued to rise with pay increases in December of 0.8% y-o-y, the same level as in November. The rising income pattern is also the outcome of a very low unemployment rate, which stood at only 3.1% in December, the same level as in November. Japanese exports rose in December by 5.4% y-o-y, after more than a year of decline. This dynamic has been supported by the fall in the value of the yen and by improvements in the economies of the OECD. The export of industrial goods and capital equipment recovered sharply. Also, industrial production continued its recovery and rose for the fifth consecutive month, up by 4.7% y-o-y in November, the strongest rise in almost three years. This was also supported by a strong trend in manufacturing orders, which rose by 16.4% y-o-y in November and 11.3% y-o-y in December, pointing to the likelihood of continued rising industrial output. The improving environment has also been reflected in domestic demand levels. Retail trade had already recovered in November, when it rose by 1.7%, and continued to rise in December at a rate of 0.6% y-o-y after almost a year of decline.
World Economy
18 OPEC Monthly Oil Market Report – February 2017
Graph 3.2 Japanese retail trade
Graph 3.3 Japanese PMIs
The latest PMI numbers provided by IHS Markit also confirmed ongoing economic improvements. The PMI for manufacturing rose to 52.7 in January from 52.4 in December. The services sector PMI remained at a strong level but retraced slightly to 51.9 from 52.3 in December. The most recent improvements provide an encouraging sign and point to the upside potential of Japanese growth. Numerous challenges persist and it remains to be seen to what extent the current improvements in the global economy, and the ongoing stimulus measures by the BoJ, will be able to lift growth above current forecast levels. For this month, the economic forecast remains unchanged at 1.0% for 2016 and 1.1% for 2017. South Korea The South Korean economy seems to have weathered the latest political turbulence relatively well. Exports rose significantly in January by 9.1%, even higher than the already strong y-o-y growth levels seen in November and December of 3.2% and 7.6%, respectively. Industrial production rose by 3.3% y-o-y in December but was lower than the 4.9% y-o-y seen in November. However, the latest PMI number for the manufacturing sector in November still indicates declining momentum in the manufacturing sector. The index fell back to 49.0 in January, after 49.4 in December, indicating a slight contraction. While near-term developments warrant close monitoring, the GDP growth forecast for this month remains unchanged at 2.6% for 2016 and 2.5% for 2017. OECD Europe Euro-zone The Euro-zone’s expansion continues to grow at a solid pace. Most recent indicators, including the 4Q16 GDP growth figures, have pointed to a rising growth trend. Positively, 4Q16 GDP growth was confirmed at a 0.5% q-o-q seasonally adjusted growth rate, up from 3Q16 when it stood at 0.4%. Therefore, GDP growth in 2016 stood at 1.7% and is hence higher than 2016 growth in the US of 1.6%. Growth seems to still be supported by healthy domestic demand, while exports are benefitting from a relatively weak euro. The current growth dynamic seems to be quite broad-based. Some challenges remain but, so far, the Euro-zone has managed to weather those relatively well. Upcoming elections in key economies could add some uncertainty but, so far, even UK’s decision to leave the European Union (EU) has not resulted in any significant slow-down, despite the rising uncertainties that it represents for consumers and investors. The most recent momentum, in combination with a weaker euro, has also led to higher inflation. Hence, it remains to be seen how the ECB will proceed with its monetary stimulus, since it seems to carry less weight in the current economic environment. But given the still relatively low core inflation rate, it seems unlikely that the ECB will significantly reduce its monetary stimulus anytime soon, especially since growth could still benefit from more support and given the fact that expectations of sharply rising inflation have somewhat been reduced. Negatively, the
0.6
-3
-2
-1
0
1
2
Dec
15
Jan
16
Feb
16
Mar
16
Apr
16
May
16
Jun
16
Jul 1
6
Aug
16
Sep
16
Oct
16
Nov
16
Dec
16
Sources: Ministry of Economy, Trade and Industry and Haver Analytics.
% change y-o-y
51.9
52.7
47
48
49
50
51
52
53
54
Jan
16
Feb
16
Mar
16
Apr
16
May
16
Jun
16
Jul 1
6
Aug
16
Sep
16
Oct
16
Nov
16
Dec
16
Jan
17
Index
Sources: IHS Markit, Nikkei and Haver Analytics.
Services PMI
Manufacturing PMI

World Economy
OPEC Monthly Oil Market Report – February 2017 19
sovereign debt situation of Greece seems to have gained complexity again with differing views between the IMF, the EU and Greece itself about how to proceed. The unemployment rate declined again to 9.6% in December and has now remained below 10% for three consecutive months. Additionally, banking sector-related weakness seems to have abated to some extent, while in Italy challenges remain, with capital needs for some of the large institutions. Also, the looming exit of the UK from the EU is again adding some concern. With upcoming elections in the Netherlands, Italy, France and Germany, the overall economic situation will continue to be potentially influenced by political developments. The latest industrial production figures have confirmed that the business environment remains in expansionary territory. After a growth of only 0.8% y-o-y in October, November’s appreciation stood at a considerable 3.0% y-o-y. Manufacturing growth stood at a firm 2.7%. Retail sales growth in value terms increased as well, rising by 2.2% y-o-y in December after seeing 2.7% in November. This has signalled ongoing improvements in the underlying economy. Some support may still come from slight improvements in the labour market. Following the latest rounds of ECB stimulus, and supported by an adjustment in oil prices, inflation increased to a healthier level of 1.8% y-o-y in January, after reaching 1.1% y-o-y in the previous month. Core inflation – that is, the consumer price index (CPI), excluding energy, tobacco and food − stood at 0.9% y-o-y, the same level as a month earlier. This inflationary dynamic will remain an area that the ECB will consider closely during its upcoming monetary policy decision-making meeting. But given a still muted core inflation rate, its current stimulus measures are expected to continue for a while. The effectiveness of monetary stimulus – not only in terms of inflation but also in terms of credit supply – has increased lately. In December, credit supply increased by 1.6% y-o-y, the fourth consecutive month with growth higher than 1%, after recovering from levels below 1% for all of 2016 prior to September. The latest PMI indicators point to a continuation in Euro-zone improvements as well. The manufacturing PMI rose to 55.2 in January, compared to 54.9 in December. The important services PMI was unchanged and remained at the high level of 53.7 in January. Graph 3.4 Euro-zone CPI and lending activity
Graph 3.5 Euro-zone PMIs
Supported by ongoing improvements, the 2017 GDP growth forecast for the Euro-zone was revised up slightly to 1.6% from 1.4% last month. This growth level is slightly below 2016 growth, which has now been confirmed at 1.7%, which is higher than last month’s estimate of 1.6%. The lower level of growth in the current year anticipates the potential challenges posed by political developments in 2017, given key elections in France and Germany, and probably Italy, as well as the vagueness about Brexit procedures, which may all lead to rising uncertainty. This is to be seen in combination with the likelihood of rising inflation and, hence, a potential reduction in monetary stimulus.
-4
-3
-2
-1
0
1
2
-1
0
1
2
3
Jan
12M
ay 1
2S
ep 1
2Ja
n 13
May
13
Sep
13
Jan
14M
ay 1
4S
ep 1
4Ja
n 15
May
15
Sep
15
Jan
16M
ay 1
6S
ep 1
6Ja
n 17
CPI (LHS) MFI lending (RHS)
Sources: Statistical Office of the European Communities, European Central Bank and Haver Analytics.
% change y-o-y % change y-o-y
53.7
55.2
50
51
52
53
54
55
56
Jan
16
Feb
16
Mar
16
Apr
16
May
16
Jun
16
Jul 1
6
Aug
16
Sep
16
Oct
16
Nov
16
Dec
16
Jan
17
Index
Sources: IHS Markit and Haver Analytics.
Services PMI
Manufacturing PMI
World Economy
20 OPEC Monthly Oil Market Report – February 2017
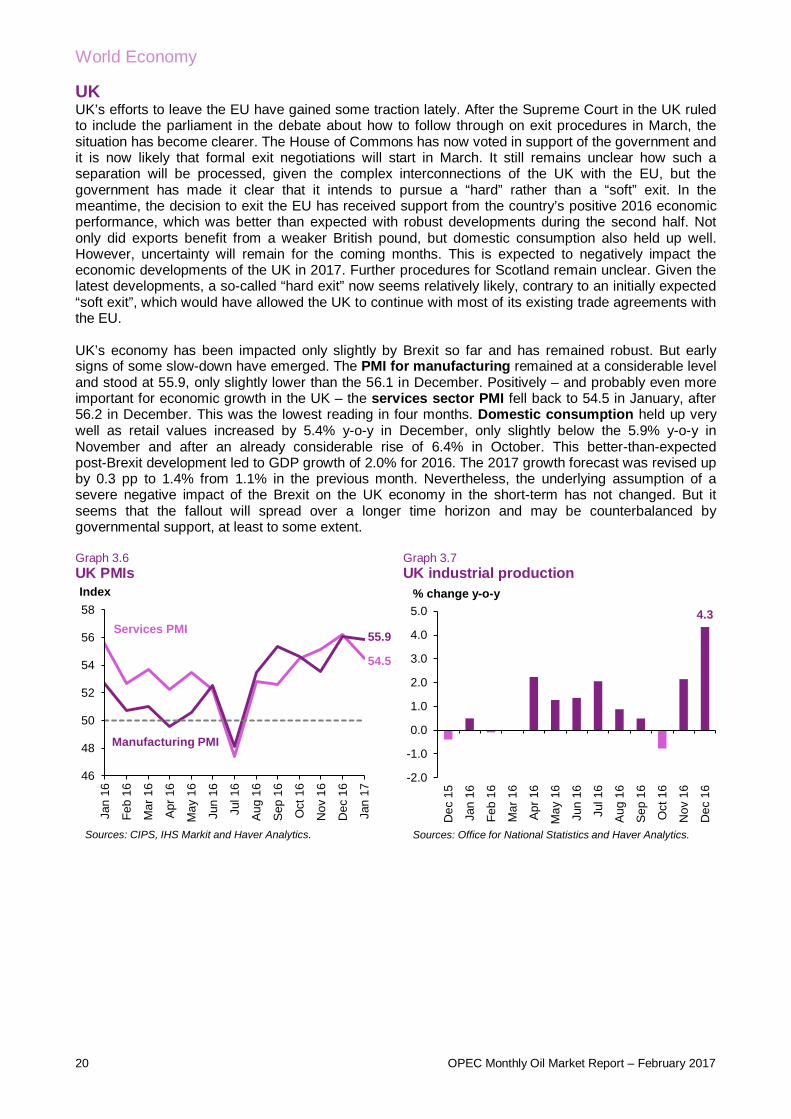
UK UK’s efforts to leave the EU have gained some traction lately. After the Supreme Court in the UK ruled to include the parliament in the debate about how to follow through on exit procedures in March, the situation has become clearer. The House of Commons has now voted in support of the government and it is now likely that formal exit negotiations will start in March. It still remains unclear how such a separation will be processed, given the complex interconnections of the UK with the EU, but the government has made it clear that it intends to pursue a “hard” rather than a “soft” exit. In the meantime, the decision to exit the EU has received support from the country’s positive 2016 economic performance, which was better than expected with robust developments during the second half. Not only did exports benefit from a weaker British pound, but domestic consumption also held up well. However, uncertainty will remain for the coming months. This is expected to negatively impact the economic developments of the UK in 2017. Further procedures for Scotland remain unclear. Given the latest developments, a so-called “hard exit” now seems relatively likely, contrary to an initially expected “soft exit”, which would have allowed the UK to continue with most of its existing trade agreements with the EU. UK’s economy has been impacted only slightly by Brexit so far and has remained robust. But early signs of some slow-down have emerged. The PMI for manufacturing remained at a considerable level and stood at 55.9, only slightly lower than the 56.1 in December. Positively – and probably even more important for economic growth in the UK – the services sector PMI fell back to 54.5 in January, after 56.2 in December. This was the lowest reading in four months. Domestic consumption held up very well as retail values increased by 5.4% y-o-y in December, only slightly below the 5.9% y-o-y in November and after an already considerable rise of 6.4% in October. This better-than-expected post-Brexit development led to GDP growth of 2.0% for 2016. The 2017 growth forecast was revised up by 0.3 pp to 1.4% from 1.1% in the previous month. Nevertheless, the underlying assumption of a severe negative impact of the Brexit on the UK economy in the short-term has not changed. But it seems that the fallout will spread over a longer time horizon and may be counterbalanced by governmental support, at least to some extent. Graph 3.6 UK PMIs
Graph 3.7 UK industrial production
54.5
55.9
46
48
50
52
54
56
58
Jan
16
Feb
16
Mar
16
Apr
16
May
16
Jun
16
Jul 1
6
Aug
16
Sep
16
Oct
16
Nov
16
Dec
16
Jan
17
Index
Sources: CIPS, IHS Markit and Haver Analytics.
Services PMI
Manufacturing PMI
4.3
-2.0
-1.0
0.0
1.0
2.0
3.0
4.0
5.0
Dec
15
Jan
16
Feb
16
Mar
16
Apr
16
May
16
Jun
16
Jul 1
6
Aug
16
Sep
16
Oct
16
Nov
16
Dec
16
Sources: Office for National Statistics and Haver Analytics.
% change y-o-y
World Economy
OPEC Monthly Oil Market Report – February 2017 21
Non-OECD BRICs Table 3.2 Summary of macroeconomic performance of BRIC countries, 2016-2017*
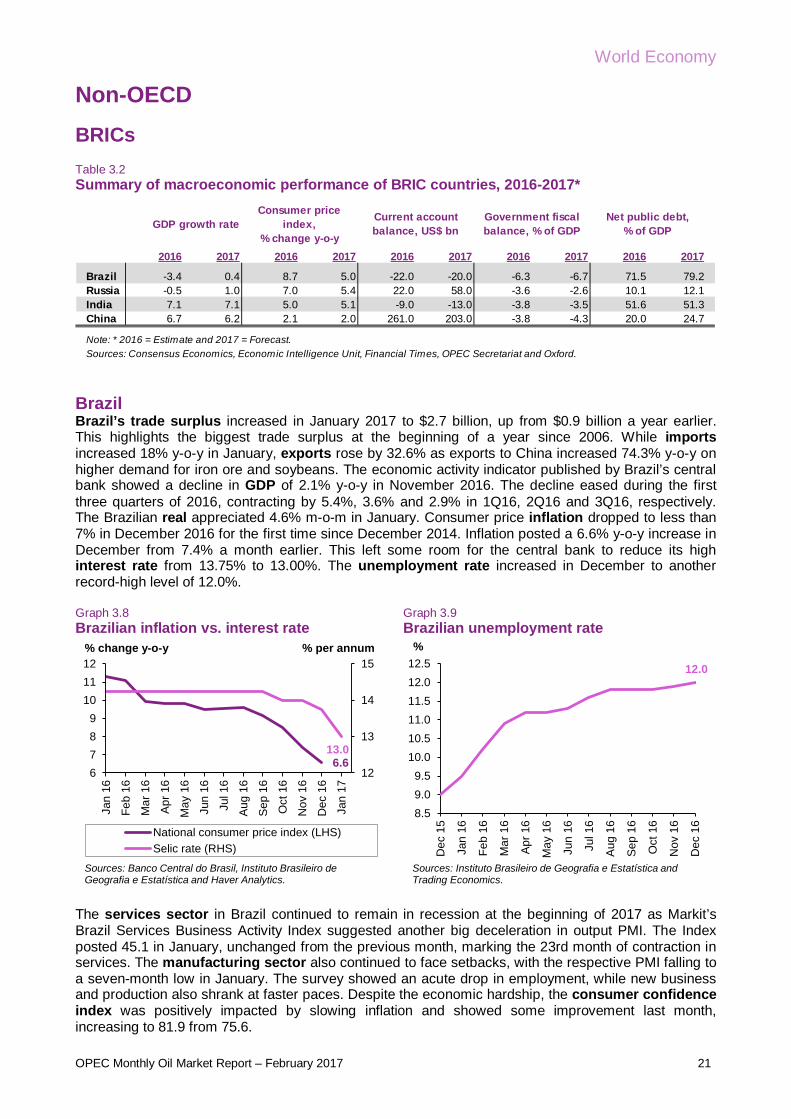
Brazil Brazil’s trade surplus increased in January 2017 to $2.7 billion, up from $0.9 billion a year earlier. This highlights the biggest trade surplus at the beginning of a year since 2006. While imports increased 18% y-o-y in January, exports rose by 32.6% as exports to China increased 74.3% y-o-y on higher demand for iron ore and soybeans. The economic activity indicator published by Brazil’s central bank showed a decline in GDP of 2.1% y-o-y in November 2016. The decline eased during the first three quarters of 2016, contracting by 5.4%, 3.6% and 2.9% in 1Q16, 2Q16 and 3Q16, respectively. The Brazilian real appreciated 4.6% m-o-m in January. Consumer price inflation dropped to less than 7% in December 2016 for the first time since December 2014. Inflation posted a 6.6% y-o-y increase in December from 7.4% a month earlier. This left some room for the central bank to reduce its high interest rate from 13.75% to 13.00%. The unemployment rate increased in December to another record-high level of 12.0%. Graph 3.8 Brazilian inflation vs. interest rate
Graph 3.9 Brazilian unemployment rate
The services sector in Brazil continued to remain in recession at the beginning of 2017 as Markit’s Brazil Services Business Activity Index suggested another big deceleration in output PMI. The Index posted 45.1 in January, unchanged from the previous month, marking the 23rd month of contraction in services. The manufacturing sector also continued to face setbacks, with the respective PMI falling to a seven-month low in January. The survey showed an acute drop in employment, while new business and production also shrank at faster paces. Despite the economic hardship, the consumer confidence index was positively impacted by slowing inflation and showed some improvement last month, increasing to 81.9 from 75.6.
2016 2017 2016 2017 2016 2017 2016 2017 2016 2017
Brazil -3.4 0.4 8.7 5.0 -22.0 -20.0 -6.3 -6.7 71.5 79.2Russia -0.5 1.0 7.0 5.4 22.0 58.0 -3.6 -2.6 10.1 12.1India 7.1 7.1 5.0 5.1 -9.0 -13.0 -3.8 -3.5 51.6 51.3China 6.7 6.2 2.1 2.0 261.0 203.0 -3.8 -4.3 20.0 24.7
Sources: Consensus Economics, Economic Intelligence Unit, Financial Times, OPEC Secretariat and Oxford.Note: * 2016 = Estimate and 2017 = Forecast.
GDP growth rateConsumer price
index, % change y-o-y
Current account balance, US$ bn
Government fiscal balance, % of GDP
Net public debt, % of GDP
6.613.0
12
13
14
15
6789
101112
Jan
16
Feb
16
Mar
16
Apr
16
May
16
Jun
16
Jul 1
6
Aug
16
Sep
16
Oct
16
Nov
16
Dec
16
Jan
17
National consumer price index (LHS)Selic rate (RHS)
Sources: Banco Central do Brasil, Instituto Brasileiro de Geografia e Estatística and Haver Analytics.
% change y-o-y % per annum
12.0
8.59.09.5
10.010.511.011.512.012.5
Dec
15
Jan
16
Feb
16
Mar
16
Apr
16
May
16
Jun
16
Jul 1
6
Aug
16
Sep
16
Oct
16
Nov
16
Dec
16
%
Sources: Instituto Brasileiro de Geografia e Estatística and Trading Economics.

World Economy
22 OPEC Monthly Oil Market Report – February 2017
Graph 3.10 Brazilian manufacturing and services PMIs
Graph 3.11 Brazilian consumer confidence index
The contraction in GDP during 3Q16 largely confirmed expectations of a deceleration of around 3.4% y-o-y in 2016, while the continued weak performance in services and manufacturing suggest a sluggish return to growth in 2017. GDP is currently anticipated to show cyclical but minor growth of around 0.4% y-o-y in 2017. Russia Russia’s Ministry of Economic Development announced it is forecasting the country’s GDP to grow by a rate between 1.5% and 2.0% compared to the previous forecast of 0.6%. GDP contracted by 0.4% y-o-y in 3Q16, the slowest pace since the onset of economic deceleration in 1Q15. A downward inflationary trend continued in January posting 5.0%, its slowest rate of increase since June 2012. The Russian ruble appreciated 4.0% m-o-m in January and the central bank kept its benchmark interest rate unchanged at 10%. Graph 3.12 Russian inflation vs. Interest rate
Graph 3.13 Russian PMIs
The services sector started 2017 like it ended 2016: on a positive note. Its PMI saw the highest reading since July 2008, posting 58.4 in January, up from 56.5 a month earlier. The survey showed employment increasing to its highest level in 44 months and demonstrating further accumulation in outstanding orders. Despite this sizable expansion, retail sales continued to contract in December. The manufacturing sector also showed encouraging signs of improving. The sector’s PMI increased in January to a 70-month high of 54.7, up from 53.7 in the previous month, due to quick rates of increase
44.0
45.1
35
40
45
50
Jan
16
Feb
16
Mar
16
Apr
16
May
16
Jun
16
Jul 1
6
Aug
16
Sep
16
Oct
16
Nov
16
Dec
16
Jan
17
Index
Sources: IHS Markit and Haver Analytics.
Services PMI
Manufacturing PMI
81.9
62
66
70
74
78
82
86
Jan
16
Feb
16
Mar
16
Apr
16
May
16
Jun
16
Jul 1
6
Aug
16
Sep
16
Oct
16
Nov
16
Dec
16
Jan
17
Index
Sources: Fundação Getúlio Vargas and Haver Analytics.
5.0
10.0
4
6
8
10
12
Jan
16
Feb
16
Mar
16
Apr
16
May
16
Jun
16
Jul 1
6
Aug
16
Sep
16
Oct
16
Nov
16
Dec
16
Jan
17
%
Sources: Federal State Statistics Service, Central Bank of Russia and Haver Analytics.
Inflation rate
Interest rate
54.7
58.4
46
48
50
52
54
56
58
60
Jan
16
Feb
16
Mar
16
Apr
16
May
16
Jun
16
Jul 1
6
Aug
16
Sep
16
Oct
16
Nov
16
Dec
16
Jan
17
Index
Sources: IHS Markit and Haver Analytics.
Services PMI
Manufacturing PMI

World Economy
OPEC Monthly Oil Market Report – February 2017 23
in production, new orders and job creation. Industrial production increased for the second month in a row in December 2016, rising by 3.2% y-o-y, its highest rate since December 2014. Graph 3.14 Russian industrial production
Graph 3.15 Russian retail sales
Indications from the past few months have provided reasonable evidence to raise the GDP forecast for 2017. The forecast this month is revised up slightly for the second month in a row. The GDP of Russia is anticipated to grow by 1.0% y-o-y in 2017, up from an estimated contraction of 0.5% in 2016. Further upward revisions are likely in the coming months, given a continuation of the current trend. India India’s short-term GDP growth outlook continues to be weighed down by its unprecedented cash swap exercise (or demonetisation). However, it seems that in both the mid-term and the long-term, such a monetary policy will support India’s economy in terms of foreign investment. This underscores India’s intent to tackle corruption, which has been a significant concern for foreign investors in recent years. It is also likely to widen the tax base by enabling the government to track more of the country’s money. India currently has one of the lowest tax bases in Asia, which increases the chance of easing further monetary policies to support growth. Given the deflationary pressures which have been generated by demonetisation, the Reserve Bank of India (RBI) may adjust the repo rate in March 2017. In addition, the recent US election remains a source of concern adding to downward risks. Much uncertainty persists due to actual US policies and the new US president’s campaign proposals (such as ending the offshoring act), which may not be good signals for India’s economy. Moreover, it seems US’s policy towards trade relations, particularly with China, is likely to turn more restrictive. This may lead to a more evident long-term decline in global trade growth than currently anticipated. At worst, the mentioned effect could decrease India’s GDP growth by about 0.4 pp in 2017, though its GDP growth in 4Q16 was just below 7.0%. The CPI softened further to 3.4% in December, primarily driven by a continued decline in food prices. Core inflation slowed further to 4.86% from 4.89% in the previous month and core CPI, excluding petrol and diesel, moderated to 4.7% from 4.9%. This is the lowest inflation rate since November of 2014. The slowdown in inflation intensified in the last two months of 2016 after the demonetisation campaign drove a slump in the Indian currency, thus hurting consumption, while the wholesale price index (WPI) increased to 3.4% y-o-y in December of 2016, following a 3.15% gain in November. This was the ninth straight month of increase, which was mainly due to the rising cost of manufactured products and petrol, while food prices fell.
3.2
-6
-4
-2
0
2
4
Dec
15
Jan
16
Feb
16
Mar
16
Apr
16
May
16
Jun
16
Jul 1
6
Aug
16
Sep
16
Oct
16
Nov
16
Dec
16
% change y-o-y
Sources: Federal State Statistics Service and Haver Analytics.
-5.9
-16
-12
-8
-4
0
Dec
15
Jan
16
Feb
16
Mar
16
Apr
16
May
16
Jun
16
Jul 1
6
Aug
16
Sep
16
Oct
16
Nov
16
Dec
16
% change y-o-y
Sources: Federal State Statistics Service and Haver Analytics.

World Economy
24 OPEC Monthly Oil Market Report – February 2017
Graph 3.16 Indian GDP growth
Graph 3.17 Indian inflation vs. Repo rate
India’s trade deficit narrowed to $10.37 billion in December 2016 from $11.5 billion a year earlier. Exports jumped 5.7% y-o-y to $23.9 billion, reaching their highest value since March 2015 as non-petroleum sales went up 5.4%. Imports increased marginally by 0.5% to $34.3 billion, the highest figure since July 2015. Oil imports rose 14.6% y-o-y mainly due to the expectation of rising oil prices while gold imports fell 48.5% y-o-y. The recovery in global oil prices seems to be providing growing support to both exports and imports, given petroleum's relatively high share in external trade. With non-oil imports likely to remain curbed for some time (given the slowdown in domestic demand following demonetisation), overall imports growth should be sustained, while exports may get additional help from a weakening rupee. All in all, the trade deficit is expected to widen only modestly in 2017 (disregarding any externality factors), keeping India's current account balance about 0.8% of GDP. Graph 3.18 Indian trade balance
Graph 3.19 Indian gold imports
India's goods and services (GST) "dual control" agreement – which envisages a division of control over tax assessments between the states and the central government – reflects the growing complexity of the regime, yet it is still likely to be implemented in 2017. The latest compromise on dual control is particularly significant. The tax authorities of each Indian state vary widely in their professionalism and competency. Thus, the state administration of the GST for 90% of small- and medium-sized businesses is likely to result in an uneven application of the GST regime, and could force many businesses to deal with both state and central authorities. For large businesses, a more transparent and rigorous assessment by the central government will generally be preferable to assessments conducted by many state governments.
7.9
7.17.3
7.07.3
4
5
6
7
8
1Q 1
4
2Q 1
4
3Q 1
4
4Q 1
4
1Q 1
5
2Q 1
5
3Q 1
5
4Q 1
5
1Q 1
6
2Q 1
6
3Q 1
6
Sources: National Informatics Centre (NIC) and Haver Analytics.
% change y-o-y6.25
-202468
Jan
16
Feb
16
Mar
16
Apr 1
6
May
16
Jun
16
Jul 1
6
Aug
16
Sep
16
Oct
16
Nov
16
Dec
16
Jan
17
%
Repo rateConsumer price index (CPI)CPI lower target bondCPI higher target bondWholesale price index (WPI)WPI confort zone
Sources: Ministry of Commerce and Industry, Reserve Bank of India and Haver Analytics.
23.9
-34.3
-10.4
-40-30-20-10
0102030
Dec
15
Jan
16Fe
b 16
Mar
16
Apr 1
6M
ay 1
6Ju
n 16
Jul 1
6Au
g 16
Sep
16O
ct 1
6N
ov 1
6D
ec 1
6
Exports Imports Trade balance
US$ bn
Sources: Ministry of Commerce and Industry and Haver Analytics.
-100
-50
0
50
100
150
200
-2
0
2
4
6
8
Dec
14
Feb
15
Apr 1
5
Jun
15
Aug
15
Oct
15
Dec
15
Feb
16
Apr 1
6
Jun
16
Aug
16
Oct
16
Dec
16
US$ bn
Gold imports (LHS) Change y-o-y (RHS)
Sources: Ministry of Commerce and Industry and Haver Analytics.
Percentage
World Economy
OPEC Monthly Oil Market Report – February 2017 25
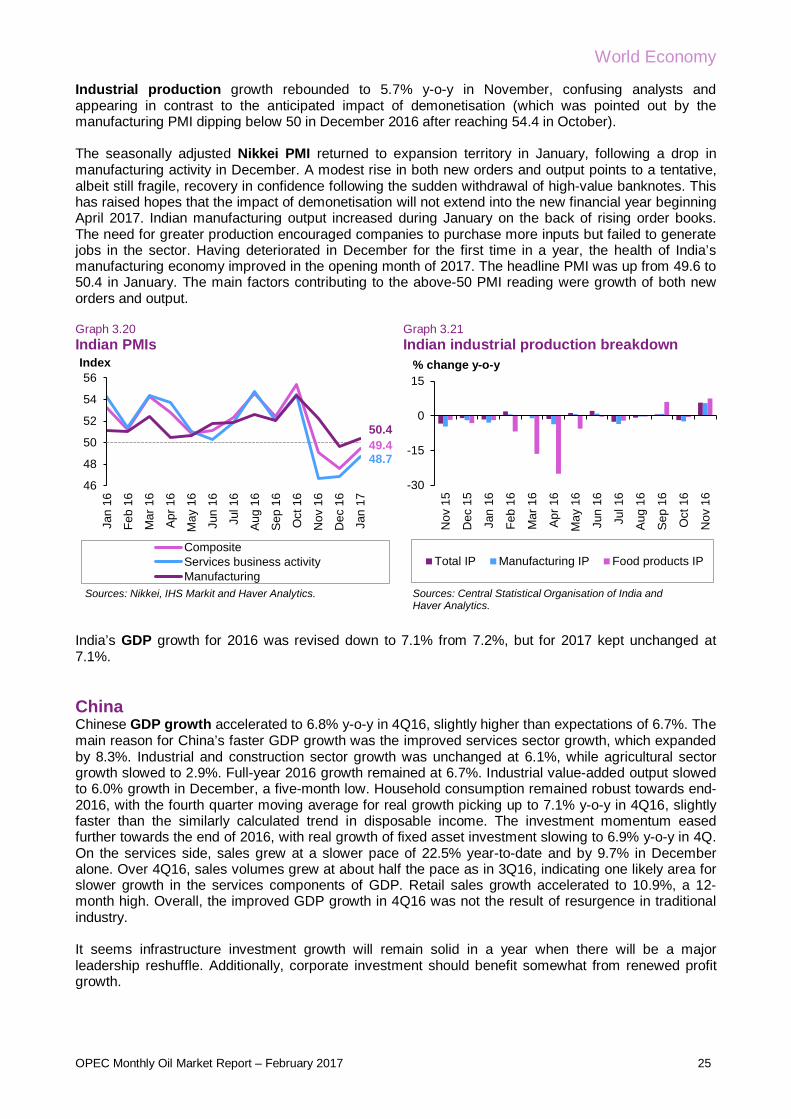
Industrial production growth rebounded to 5.7% y-o-y in November, confusing analysts and appearing in contrast to the anticipated impact of demonetisation (which was pointed out by the manufacturing PMI dipping below 50 in December 2016 after reaching 54.4 in October). The seasonally adjusted Nikkei PMI returned to expansion territory in January, following a drop in manufacturing activity in December. A modest rise in both new orders and output points to a tentative, albeit still fragile, recovery in confidence following the sudden withdrawal of high-value banknotes. This has raised hopes that the impact of demonetisation will not extend into the new financial year beginning April 2017. Indian manufacturing output increased during January on the back of rising order books. The need for greater production encouraged companies to purchase more inputs but failed to generate jobs in the sector. Having deteriorated in December for the first time in a year, the health of India’s manufacturing economy improved in the opening month of 2017. The headline PMI was up from 49.6 to 50.4 in January. The main factors contributing to the above-50 PMI reading were growth of both new orders and output. Graph 3.20 Indian PMIs
Graph 3.21 Indian industrial production breakdown
India’s GDP growth for 2016 was revised down to 7.1% from 7.2%, but for 2017 kept unchanged at 7.1%. China Chinese GDP growth accelerated to 6.8% y-o-y in 4Q16, slightly higher than expectations of 6.7%. The main reason for China’s faster GDP growth was the improved services sector growth, which expanded by 8.3%. Industrial and construction sector growth was unchanged at 6.1%, while agricultural sector growth slowed to 2.9%. Full-year 2016 growth remained at 6.7%. Industrial value-added output slowed to 6.0% growth in December, a five-month low. Household consumption remained robust towards end-2016, with the fourth quarter moving average for real growth picking up to 7.1% y-o-y in 4Q16, slightly faster than the similarly calculated trend in disposable income. The investment momentum eased further towards the end of 2016, with real growth of fixed asset investment slowing to 6.9% y-o-y in 4Q. On the services side, sales grew at a slower pace of 22.5% year-to-date and by 9.7% in December alone. Over 4Q16, sales volumes grew at about half the pace as in 3Q16, indicating one likely area for slower growth in the services components of GDP. Retail sales growth accelerated to 10.9%, a 12-month high. Overall, the improved GDP growth in 4Q16 was not the result of resurgence in traditional industry. It seems infrastructure investment growth will remain solid in a year when there will be a major leadership reshuffle. Additionally, corporate investment should benefit somewhat from renewed profit growth.
49.448.7
50.4
46
48
50
52
54
56
Jan
16
Feb
16
Mar
16
Apr 1
6
May
16
Jun
16
Jul 1
6
Aug
16
Sep
16
Oct
16
Nov
16
Dec
16
Jan
17Index
CompositeServices business activityManufacturing
Sources: Nikkei, IHS Markit and Haver Analytics.
-30
-15
0
15
Nov
15
Dec
15
Jan
16
Feb
16
Mar
16
Apr 1
6
May
16
Jun
16
Jul 1
6
Aug
16
Sep
16
Oct
16
Nov
16
Total IP Manufacturing IP Food products IP
Sources: Central Statistical Organisation of India and Haver Analytics.
% change y-o-y

World Economy
26 OPEC Monthly Oil Market Report – February 2017
Graph 3.22 Chinese GDP growth rate
Graph 3.23 Chinese GDP breakdown
The People's Bank of China (PBoC) adjusted the reserve requirement ratio (RRR) to 16%, indicating a possible policy adjustment favouring economic growth. While it seems the RRR reduction would be reversed after the Chinese New Year, the small reduction is unlikely to cause a large-scale credit expansion but would lower the cost of credit extension for banks. If retained, this should prove positive for aggregate credit provision. The PBoC’s recent policy focus has been expansionary but in a targeted manner, so that Chinese authorities have issued a number of bank licenses in the last few months with the specific aim of increasing lending to small- and medium-sized enterprises. A lasting reduction in RRR would indicate that priority is being given to increasing credit provision in order to boost the real economy, rather than seeking to reduce debt levels on corporate balance sheets and improve banks' asset quality. Graph 3.24 Chinese RRR vs. Money supply (M2)
Graph 3.25 Chinese approved FDI
Policy rates are the most important rates within China’s monetary policy. Changing them influences economic growth, inflation, exchange rates and unemployment. Following the RRR adjustments, the PBoC raised interest rates by 10 basis points on 7-day, 14-day and 28-day reverse repurchase agreements to 2.35%, 2.50% and 2.65%, respectively. It is the first such hike since 2013. The PBoC published a separate notice stating that its standing lending facility rates for overnight, 7-day and one-month instruments would rise from 2.75%, 3.25% and 3.6% to 3.1%, 3.35% and 3.7%, respectively. It seems monetary policy tightening over the past two weeks has come as a surprise to the market, which expected no major rate changes in the coming year owing to continued downward pressure on overall growth.
6.7 6.7 6.76.8
7.3
6.9
6.0
6.4
6.8
7.2
7.6
1Q 2Q 3Q 4Q 1Q 2Q 3Q 4Q 1Q 2Q 3Q 4Q
2014 2015 2016Sources: China's National Bureau of Statistics and Haver Analytics.
% change y-o-y
4.8
2.8
-0.5-202468
10
1Q 1
4
2Q 1
4
3Q 1
4
4Q 1
4
1Q 1
5
2Q 1
5
3Q 1
5
4Q 1
5
1Q 1
6
2Q 1
6
3Q 1
6
4Q 1
6
Net exports of goods and servicesGross capital formationFinal consumption expenditure
Sources: China National Bureau of Statistics andHaver Analytics.
% change y-o-y
91011121314151617
10121416182022
Jan
14
Apr 1
4
Jul 1
4
Oct
14
Jan
15
Apr 1
5
Jul 1
5
Oct
15
Jan
16
Apr 1
6
Jul 1
6
Oct
16
Jan
17
RRR small/medium depository institutionsRRR large depository institutionsRRR rural creditChinese money supply - M2 (RHS)
% % change y-o-y
Sources: People's Bank of China and Haver Analytics.
-50
-25
0
25
50
0
1,000
2,000
3,000
4,000
Dec
15
Jan
16Fe
b 16
Mar
16
Apr 1
6M
ay 1
6Ju
n 16
Jul 1
6Au
g 16
Sep
16O
ct 1
6N
ov 1
6D
ec 1
6
Approved FDI, units (RHS)
% change y-o-y (LHS)
Sources: China National Bureau of Statistics and Haver Analytics.
Units % change y-o-y

World Economy
OPEC Monthly Oil Market Report – February 2017 27
China reported a $40.8 billion trade surplus in December of 2016, compared to a $59.6 billion surplus a year earlier. It was the smallest surplus since April, as exports fell while imports rose. In November 2016, the country’s trade surplus came in at $44.23 billion. Considering all of 2016, total trade in US dollars decreased by 6.8% from a year earlier. Exports dropped by 7.7%, the second straight year of declines, while imports fell by 5.5%. For the year, the trade surplus was recorded at $509.96 billion, lower than the surplus of $594.5 billion in 2015. For 2017, trade faces more challenges from rising protectionism and uncertainties in US trade policy. The PPI rose 5.5% y-o-y in December, driven by rising prices in coal mining and heavy industry. This spurt is expected to run out of steam in 1H17 and the forecast CPI inflation is expected to remain below the likely target of 3% in 2017, suggesting no major monetary policy implications. Graph 3.26 Chinese CPI and PPI
Graph 3.27 Chinese trade balance
The latest data signalled a further improvement in the health of China’s manufacturing sector at the start of 2017. However, the rate of improvement slowed since December, as output and new orders increased at weaker rates amid a further reduction in employment. In contrast, new export rose at its fastest pace since September 2014. At the same time, inflationary pressures remained sharp, with both input costs and output charges increasing at rates scarcely seen throughout the past five years. China's official manufacturing PMI expanded at a slower pace of 51.3 in January, according to data from the National Bureau of Statistics. China's official non-manufacturing PMI accelerated marginally to 54.6 in January, a two-month high. The acceleration in business activity occurred in spite of slower growth in total new orders and a faster contraction in export orders. Expectations for future activity were at a seven-month low and employment slipped back into contraction.
-10-505
101520
Jan
15
Mar
15
May
15
Jul 1
5
Sep
15
Nov
15
Jan
16
Mar
16
May
16
Jul 1
6
Sep
16
Nov
16
Jan
17
CPIPPIOfficial interest rateAverage house price in 100 cities
Sources: China Index Academy, China National Bureau of Statistics, Soufan and Haver Analytics.
% change y-o-y209
-169
41
-200-150-100
-500
50100150200250
Dec
15
Jan
16Fe
b 16
Mar
16
Apr 1
6M
ay 1
6Ju
n 16
Jul 1
6Au
g 16
Sep
16O
ct 1
6N
ov 1
6D
ec 1
6
US$ bn
Exports Imports Trade balance
Sources: China Customs and Haver Analytics.

World Economy
28 OPEC Monthly Oil Market Report – February 2017
Graph 3.28 Chinese PMI
Graph 3.29 Chinese industrial production
China’s GDP growth expectations have been kept unchanged at 6.7% in 2016 and 6.2% in 2017. OPEC Member Countries In Saudi Arabia, inflation posted a 1.7% y-o-y increase in the last month of 2016. The non-oil private sector showed strong signs of growth in January as the Emirates NBD Saudi Arabia PMI jumped to a 17-month high. The index posted 56.7 last month, up from 55.5 in December on the highest rate of increase in output since August 2015, alongside an increase in new business to a 14-month high. Employment in the sector also somewhat increased. Graph 3.30 PMIs of Nigeria, Saudi Arabia and UAE
In Nigeria, operating conditions in the country’s private sector improved in January for the first time in a year, as suggested by the Stanbic IBTC Bank Nigeria PMI. The index was supported by renewed accelerations in output, as well as new orders received that also supported input-buying activities. The index’s headline figure posted 51.9 in January, up from 48.1 in December. In the United Arab Emirates, inflation registered 2.6% y-o-y in November 2016, up from 1.9% in the previous month. The non-oil private sector signalled a robust advancement in January, with the respective PMI increasing to its highest level in six months. The Emirates NBD UAE PMI registered 55.3 in January, up from 55.0 a month earlier. Growth in both output and new orders were the main
52.2
51.0
53.1
47
48
49
50
51
52
53
54
Jan
16
Feb
16
Mar
16
Apr 1
6
May
16
Jun
16
Jul 1
6
Aug
16
Sep
16
Oct
16
Nov
16
Dec
16
Jan
17
Index
Sources: Caixin, IHS Markit and Haver Analytics.
Composite PMI
Manufacturing PMI
Services PMI
6.0
5.0
5.5
6.0
6.5
7.0
Dec
15
Jan
16
Feb
16
Mar
16
Apr
16
May
16
Jun
16
Jul 1
6
Aug
16
Sep
16
Oct
16
Nov
16
Dec
16
% change y-o-y
Sources: China National Bureau of Statistics and Haver Analytics.
51.9
56.755.3
45
50
55
60
65
Jan
15
Feb
15
Mar
15
Apr
15
May
15
Jun
15
Jul 1
5
Aug
15
Sep
15
Oct
15
Nov
15
Dec
15
Jan
16
Feb
16
Mar
16
Apr
16
May
16
Jun
16
Jul 1
6
Aug
16
Sep
16
Oct
16
Nov
16
Dec
16
Jan
17
Index
Nigeria Saudi Arabia UAE
Sources: Emirates NBD, IHS Markit, Stanbic IBTC Bank and Haver Analytics.

World Economy
OPEC Monthly Oil Market Report – February 2017 29
drivers behind this recent improvement. Employment also increased as a result of an increase in new business. Other Asia The GDP of Indonesia grew 4.9% y-o-y in 4Q16, down slightly from 5.0% in the previous quarter. Private consumption increased 5.0% y-o-y, while general government consumption expenditure was lower by 4.1% y-o-y in 4Q16. Gross fixed capital formation (GFCF) rose 4.8% y-o-y in 4Q16 vs 4.2% in the previous quarter. Exports of goods and services increased by 4.2% y-o-y in 4Q16 compared to a 5.7% contraction in 3Q16. Imports also reversed direction in 4Q16, dropping by 2.8% vs a 3.7% decline in the previous quarter. For the entire 2016, GDP grew by 5.0% y-o-y, higher than the growth of 4.9% seen in 2015. The Philippines’ GDP registered growth of 6.6% y-o-y in 4Q16, which brings growth for the entire year to 6.8% y-o-y. This is the fastest growth rate since 2013. Growth in private consumption, on the other hand, slowed from 7.1% y-o-y in 3Q16 to 6.3% in 4Q16, while government consumption accelerated to 4.0% y-o-y in 4Q16 from 3.1% in 3Q16. GFCF had strong advancement last year, rising by a record 23.8% y-o-y. Imports also increased by a faster pace than exports in 4Q16, rising by 15.0% vs. 10.4% y-o-y. Africa In Egypt, the pound slightly depreciated by 1.2% m-o-m, after depreciating more than 85% in the previous two months. As a result of the currency depreciation, inflation posted a 24.3% y-o-y increase in December 2016. Operating conditions in the non-oil private sector remained weak in January as suggested by the respective PMI survey. The index stood at 43.3 in January, slightly up from 42.8 a month earlier due to falling output and new orders. In South Africa, the rand appreciated 2% m-o-m in January and consumer price inflation increased 7.0% y-o-y in the last month of 2016. For all of 2016, inflation posted 6.6% y-o-y growth vs 4.5% in 2015. Business conditions in the country’s private sector improved in January according to the Standard Bank South Africa PMI which registered 51.3. The survey highlighted a modest rise in output, as well as in new orders received and employment. Latin America In Chile, the central bank’s benchmark interest rate was lowered from 3.5% to 3.25% in January, which aimed at lending some support to spending and investment amid an inflation slowdown. Inflation grew by only 2.7% in 2016. GDP advanced 1.6% in 3Q16, similar to the previous quarter and slower than the 2.3% y-o-y growth in 1Q16. Real retail sales advanced by 4.1% y-o-y in December 2016, slower than November’s 5.0%. Industrial sales, however, declined 2.2% y-o-y in December 2016 vs 2.6% a month earlier. Transition region The manufacturing sector in the Czech Republic started 2017 on a positive note. The Markit Czech Republic manufacturing PMI survey signalled the fastest growth in production since the beginning of 2016 and the index rose to a 12-month high of 55.7, up from December’s 53.8. The survey also showed that employment in the manufacturing sector rose in January, with the rate improving as firms reported a need to increase production capacities. The January issue of the survey showed the first public release of a new component question about production expectations. Surveyed firms reported optimistic expectations about the production increase in the next 12 months.

World Economy
30 OPEC Monthly Oil Market Report – February 2017
Oil prices, US dollar and inflation The US dollar generally declined in January against major currencies with the exception of the British pound sterling. On average, the US dollar declined by 1.0% against the Japanese yen, its first decline since August. The dollar lost 0.8% against the Euro and 1.1% against the Swiss franc. In contrast, the dollar advanced by an average of 1.3% against the pound sterling but declined significantly against the pound after the UK prime minister suggested that the Brexit deal would be put to vote in parliament. Compared with the Chinese yuan, the US dollar dropped by 0.4% m-o-m on average in January, its first decline since August. It increased by 0.3% m-o-m against the Indian rupee. Compared with the currencies of commodity exporters, the US dollar generally fell. It decreased by 4.6% m-o-m against the Brazilian real and by 4.0% against the Russian ruble. Against the currencies of NAFTA trading partners, on average the US dollar rose by 4.2% against the Mexican peso and has been up by 12.3% since October. The peso has been volatile since the US presidential election due to the uncertainty about trade relations between the two countries. Most recently, the peso strengthened against the US dollar on the anticipation of a 0.5% rate hike by Mexico’s central bank that materialised on 9 February. This was the third rate hike since the US election. Meanwhile, the US dollar decreased by 1.2% against the Canadian dollar. The decline in the value of the US dollar mainly reflects a minor decline in market expectations of the path of interest rate increases by the Fed during the month, as market participants expect further clarification of the policies to be enacted by the new administration. Meanwhile, the central banks of major currency counterparts are expected to remain relatively more accommodative. At the time, concerns expressed by the new US administration about its major trading partners gaining unfair trade advantages from having weaker currencies would require close monitoring, especially in light of the upcoming G20 meeting in March. In nominal terms, the price of the OPEC Reference Basket (ORB) increased by 73¢, or 1.4%, from $51.67/b in December to $52.40/b in January. In real terms, after accounting for inflation and currency fluctuations, the ORB increased to $36.92/b from $36.47/b (base June 2001=100). Over the same period, the US dollar declined by 0.3% against the import-weighted modified Geneva I + US dollar basket*, while inflation declined by 0.1%. Graph 3.31 Impact of inflation and currency fluctuations on the spot OPEC Reference Basket price*
* The ‘modified Geneva I+US$ basket’ includes the euro, the Japanese yen, the US dollar, the pound sterling and the Swiss franc, weighted according to the merchandise imports of OPEC Member Countries from the countries in the basket.
0
20
40
60
80
100
120
Jan
13
Mar
13
May
13
Jul 1
3
Sep
13
Nov
13
Jan
14
Mar
14
May
14
Jul 1
4
Sep
14
Nov
14
Jan
15
Mar
15
May
15
Jul 1
5
Sep
15
Nov
15
Jan
16
Mar
16
May
16
Jul 1
6
Sep
16
Nov
16
Jan
17US$/b
Nominal Reference Basket price Real Reference Basket price
Source: OPEC Secretariat.
Base: June 2001 = 100
$52.40/b
$36.92/b
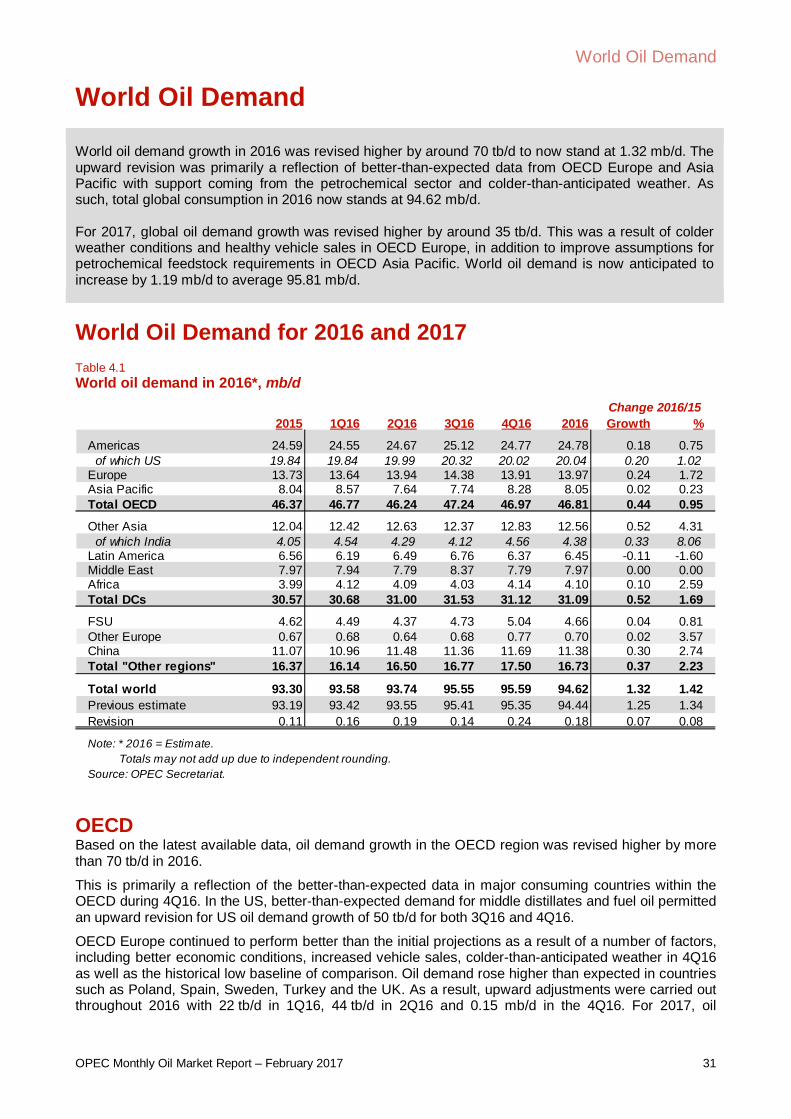
World Oil Demand
OPEC Monthly Oil Market Report – February 2017 31
World Oil Demand
World oil demand growth in 2016 was revised higher by around 70 tb/d to now stand at 1.32 mb/d. The upward revision was primarily a reflection of better-than-expected data from OECD Europe and Asia Pacific with support coming from the petrochemical sector and colder-than-anticipated weather. As such, total global consumption in 2016 now stands at 94.62 mb/d. For 2017, global oil demand growth was revised higher by around 35 tb/d. This was a result of colder weather conditions and healthy vehicle sales in OECD Europe, in addition to improve assumptions for petrochemical feedstock requirements in OECD Asia Pacific. World oil demand is now anticipated to increase by 1.19 mb/d to average 95.81 mb/d.
World Oil Demand for 2016 and 2017 Table 4.1 World oil demand in 2016*, mb/d
OECD Based on the latest available data, oil demand growth in the OECD region was revised higher by more than 70 tb/d in 2016.
This is primarily a reflection of the better-than-expected data in major consuming countries within the OECD during 4Q16. In the US, better-than-expected demand for middle distillates and fuel oil permitted an upward revision for US oil demand growth of 50 tb/d for both 3Q16 and 4Q16.
OECD Europe continued to perform better than the initial projections as a result of a number of factors, including better economic conditions, increased vehicle sales, colder-than-anticipated weather in 4Q16 as well as the historical low baseline of comparison. Oil demand rose higher than expected in countries such as Poland, Spain, Sweden, Turkey and the UK. As a result, upward adjustments were carried out throughout 2016 with 22 tb/d in 1Q16, 44 tb/d in 2Q16 and 0.15 mb/d in the 4Q16. For 2017, oil
2015 1Q16 2Q16 3Q16 4Q16 2016 Growth %
Americas 24.59 24.55 24.67 25.12 24.77 24.78 0.18 0.75 of which US 19.84 19.84 19.99 20.32 20.02 20.04 0.20 1.02Europe 13.73 13.64 13.94 14.38 13.91 13.97 0.24 1.72Asia Pacific 8.04 8.57 7.64 7.74 8.28 8.05 0.02 0.23Total OECD 46.37 46.77 46.24 47.24 46.97 46.81 0.44 0.95
Other Asia 12.04 12.42 12.63 12.37 12.83 12.56 0.52 4.31 of which India 4.05 4.54 4.29 4.12 4.56 4.38 0.33 8.06Latin America 6.56 6.19 6.49 6.76 6.37 6.45 -0.11 -1.60Middle East 7.97 7.94 7.79 8.37 7.79 7.97 0.00 0.00Africa 3.99 4.12 4.09 4.03 4.14 4.10 0.10 2.59Total DCs 30.57 30.68 31.00 31.53 31.12 31.09 0.52 1.69
FSU 4.62 4.49 4.37 4.73 5.04 4.66 0.04 0.81Other Europe 0.67 0.68 0.64 0.68 0.77 0.70 0.02 3.57China 11.07 10.96 11.48 11.36 11.69 11.38 0.30 2.74Total "Other regions" 16.37 16.14 16.50 16.77 17.50 16.73 0.37 2.23
Total world 93.30 93.58 93.74 95.55 95.59 94.62 1.32 1.42Previous estimate 93.19 93.42 93.55 95.41 95.35 94.44 1.25 1.34Revision 0.11 0.16 0.19 0.14 0.24 0.18 0.07 0.08
Source: OPEC Secretariat. Totals may not add up due to independent rounding.Note: * 2016 = Estimate.
Change 2016/15

World Oil Demand
32 OPEC Monthly Oil Market Report – February 2017
demand growth was adjusted upward by 50 tb/d in 1Q17 and 30 tb/d in 2Q17, mainly as a result of colder weather conditions.
Similar to the previous report, positive oil demand data continued to be seen in South Korea. Oil demand grew in November 2016 at a staggering 0.18 mb/d y-o-y. As a result, oil demand growth levels were adjusted higher in 4Q16 by 0.1 mb/d, driven by firm petrochemical feedstock demand and cold weather snaps. For 2017, an upward revision was seen in OECD Asia Pacific (40 tb/d in 1Q17 and 20 tb/d in 2Q17), reflecting positive expectations from the petrochemical sector.
Table 4.2 World oil demand in 2017*, mb/d
OECD Americas November 2016 data for the US implied an increase in oil requirements of around 0.53 mb/d or 2.7% y-o-y. This monthly gain, which was partially supported by healthy economic growth, colder weather and the existing low oil price environment, was essentially determined by increasing diesel, residual fuel oil, as well as jet fuel and gasoline demand. These increases, however, have been partly offset by slightly shrinking propane/propylene requirements as a result of fuel substitution. With monthly data available for 11 months in 2016, US oil demand seems to be growing solidly by around 0.2 mb/d y-o-y with road transportation fuels taking the largest bulk of the growth. Preliminary weekly data for December 2016 and January 2017 appears to favour the existing positive overall picture, however, with diverse developments in the main petroleum product categories. Gasoline’s performance is declining, mainly as a result of cold weather. In contrast, colder temperatures have supported gains in residual fuel oil usage. Furthermore, in line with a number of holidays during the months of December and January, jet/kerosene marked significant growth, y-o-y.
2016 1Q17 2Q17 3Q17 4Q17 2017 Growth %
Americas 24.78 24.77 24.82 25.37 24.93 24.98 0.20 0.79 of which US 20.04 19.98 20.09 20.54 20.17 20.19 0.15 0.75Europe 13.97 13.72 14.00 14.40 13.95 14.02 0.05 0.35Asia Pacific 8.05 8.55 7.58 7.71 8.22 8.01 -0.04 -0.52Total OECD 46.81 47.04 46.40 47.49 47.10 47.01 0.20 0.43
Other Asia 12.56 12.73 13.00 12.73 13.20 12.92 0.35 2.80 of which India 4.38 4.67 4.42 4.30 4.69 4.52 0.14 3.25Latin America 6.45 6.28 6.53 6.81 6.46 6.52 0.07 1.07Middle East 7.97 8.07 7.91 8.46 7.90 8.08 0.11 1.36Africa 4.10 4.23 4.19 4.14 4.26 4.20 0.11 2.64Total DCs 31.09 31.30 31.63 32.14 31.83 31.72 0.64 2.05
FSU 4.66 4.56 4.42 4.79 5.10 4.72 0.06 1.30Other Europe 0.70 0.71 0.66 0.70 0.80 0.72 0.02 3.15China 11.38 11.24 11.74 11.65 11.93 11.64 0.27 2.35Total "Other regions" 16.73 16.51 16.83 17.14 17.83 17.08 0.35 2.09
Total world 94.62 94.84 94.85 96.77 96.76 95.81 1.19 1.26Previous estimate 94.44 94.59 94.61 96.63 96.52 95.60 1.16 1.22Revision 0.18 0.25 0.24 0.14 0.24 0.22 0.03 0.03
Source: OPEC Secretariat.
Change 2017/16
Totals may not add up due to independent rounding.Note: * 2017 = Forecast.
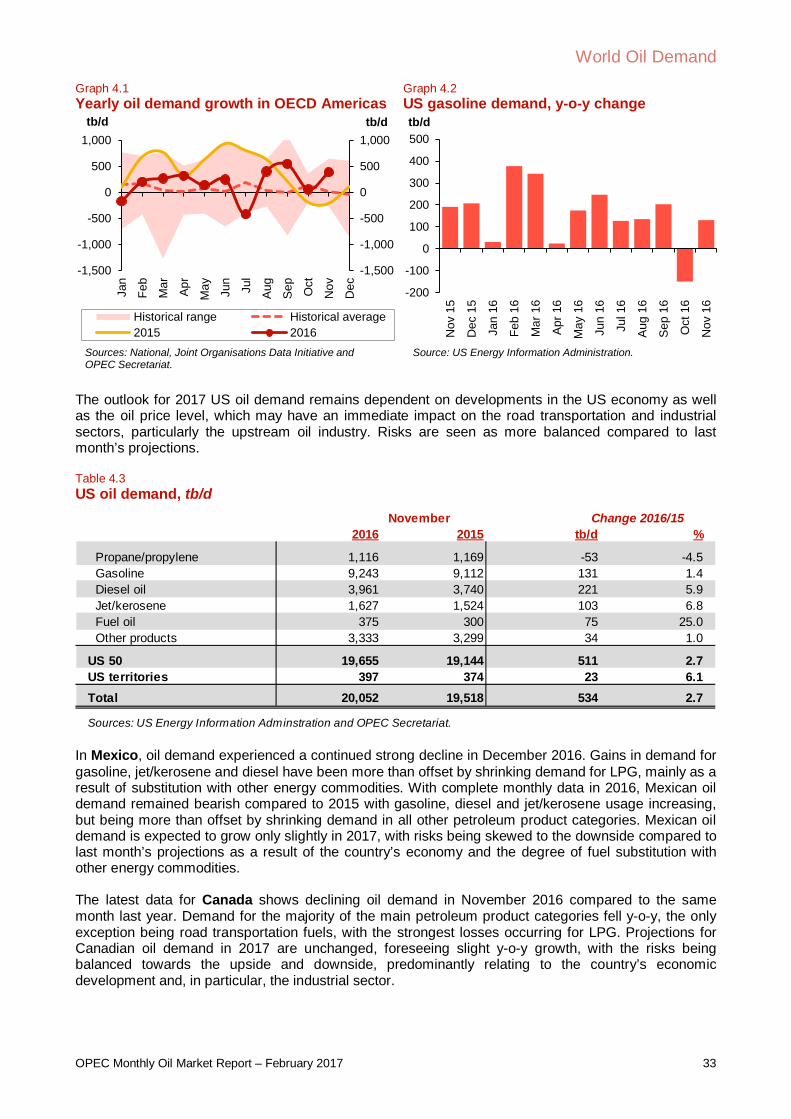
World Oil Demand
OPEC Monthly Oil Market Report – February 2017 33
Graph 4.1 Yearly oil demand growth in OECD Americas
Graph 4.2 US gasoline demand, y-o-y change
The outlook for 2017 US oil demand remains dependent on developments in the US economy as well as the oil price level, which may have an immediate impact on the road transportation and industrial sectors, particularly the upstream oil industry. Risks are seen as more balanced compared to last month’s projections. Table 4.3 US oil demand, tb/d
In Mexico, oil demand experienced a continued strong decline in December 2016. Gains in demand for gasoline, jet/kerosene and diesel have been more than offset by shrinking demand for LPG, mainly as a result of substitution with other energy commodities. With complete monthly data in 2016, Mexican oil demand remained bearish compared to 2015 with gasoline, diesel and jet/kerosene usage increasing, but being more than offset by shrinking demand in all other petroleum product categories. Mexican oil demand is expected to grow only slightly in 2017, with risks being skewed to the downside compared to last month’s projections as a result of the country’s economy and the degree of fuel substitution with other energy commodities. The latest data for Canada shows declining oil demand in November 2016 compared to the same month last year. Demand for the majority of the main petroleum product categories fell y-o-y, the only exception being road transportation fuels, with the strongest losses occurring for LPG. Projections for Canadian oil demand in 2017 are unchanged, foreseeing slight y-o-y growth, with the risks being balanced towards the upside and downside, predominantly relating to the country’s economic development and, in particular, the industrial sector.
-1,500
-1,000
-500
0
500
1,000
-1,500
-1,000
-500
0
500
1,000Ja
n
Feb
Mar Ap
r
May Jun
Jul
Aug
Sep
Oct
Nov
Dec
tb/dtb/d
Historical range Historical average2015 2016
Sources: National, Joint Organisations Data Initiative and OPEC Secretariat.
-200
-100
0
100
200
300
400
500
Nov
15
Dec
15
Jan
16
Feb
16
Mar
16
Apr 1
6
May
16
Jun
16
Jul 1
6
Aug
16
Sep
16
Oct
16
Nov
16
tb/d
Source: US Energy Information Administration.
2016 2015 tb/d %
Propane/propylene 1,116 1,169 -53 -4.5 Gasoline 9,243 9,112 131 1.4 Diesel oil 3,961 3,740 221 5.9 Jet/kerosene 1,627 1,524 103 6.8 Fuel oil 375 300 75 25.0 Other products 3,333 3,299 34 1.0
US 50 19,655 19,144 511 2.7US territories 397 374 23 6.1Total 20,052 19,518 534 2.7
Sources: US Energy Information Adminstration and OPEC Secretariat.
November Change 2016/15

World Oil Demand
34 OPEC Monthly Oil Market Report – February 2017
In 2016, OECD Americas oil demand grew by 0.18 mb/d compared to the previous year. For 2017, OECD Americas oil demand is projected to increase by 0.20 mb/d. OECD Europe European oil demand is undoubtedly the biggest unexpected positive development during 2016 and caught the majority of oil demand forecasters by surprise. Available data for 11 months in 2016 implies overall growth of 0.24 mb/d, the largest yearly increase seen over the last 20 years. The reasons behind this growth are manifold: The combination of the low oil price environment and the long lasting low baseline, in addition to healthy economic growth in big parts of the region as well as colder weather during the first and fourth quarters of 2016 seem to have stimulated oil demand in the road transportation, residential and industrial sectors. European oil demand growth was particularly strong during November and December 2016 supported by colder weather compared to November 2015 and the historical normal throughout the continent. Oil demand continued to grow in a number of countries such as Poland, Spain, Sweden, Turkey and the UK, particularly in the road transportation sector, with an increase specifically in automotive diesel demand. This was in line with growing auto sales in December 2016 (3.8%, y-o-y) and for the entire year (5.8%, y-o-y). Graph 4.3 Yearly oil demand growth in OECD Europe
Graph 4.4 UK diesel oil demand, y-o-y change
The outlook for the region’s oil demand in 2017, however, is not expected to be as strong as in 2016, with risks predominantly relate to the structure of oil demand in the region and the uncertainties associated with it continuing to point towards the downside. Table 4.4 Europe Big 4* oil demand, tb/d
-1,200
-800
-400
0
400
800
-1,200
-800
-400
0
400
800
Jan
Feb
Mar Ap
r
May Jun
Jul
Aug
Sep
Oct
Nov
Dec
tb/dtb/d
Historical range Historical average2015 2016
Sources: National, Joint Organisations Data Initiative and OPEC Secretariat.
-40-30-20-10
010203040
Nov
15
Dec
15
Jan
16
Feb
16
Mar
16
Apr
16
May
16
Jun
16
Jul 1
6
Aug
16
Sep
16
Oct
16
Nov
16
tb/d
Sources: Joint Organizations Data Initiave, UK Department of Energy Climate and Change and OPEC Secretariat.
Dec 16 Dec 15 tb/d %
LPG 491 474 17 3.6Naphtha 660 689 -29 -4.3Gasoline 1,066 1,101 -35 -3.2Jet/kerosene 724 711 13 1.8Diesel oil 3,283 3,319 -36 -1.1Fuel oil 267 287 -20 -6.9Other products 599 560 39 7.0
Total 7,090 7,141 -51 -0.7
Note: * Germany, France, Italy and the UK.Sources: JODI, OPEC Secretariat, UK Department of Energy and Climate Change and Unione Petrolifera.
Change
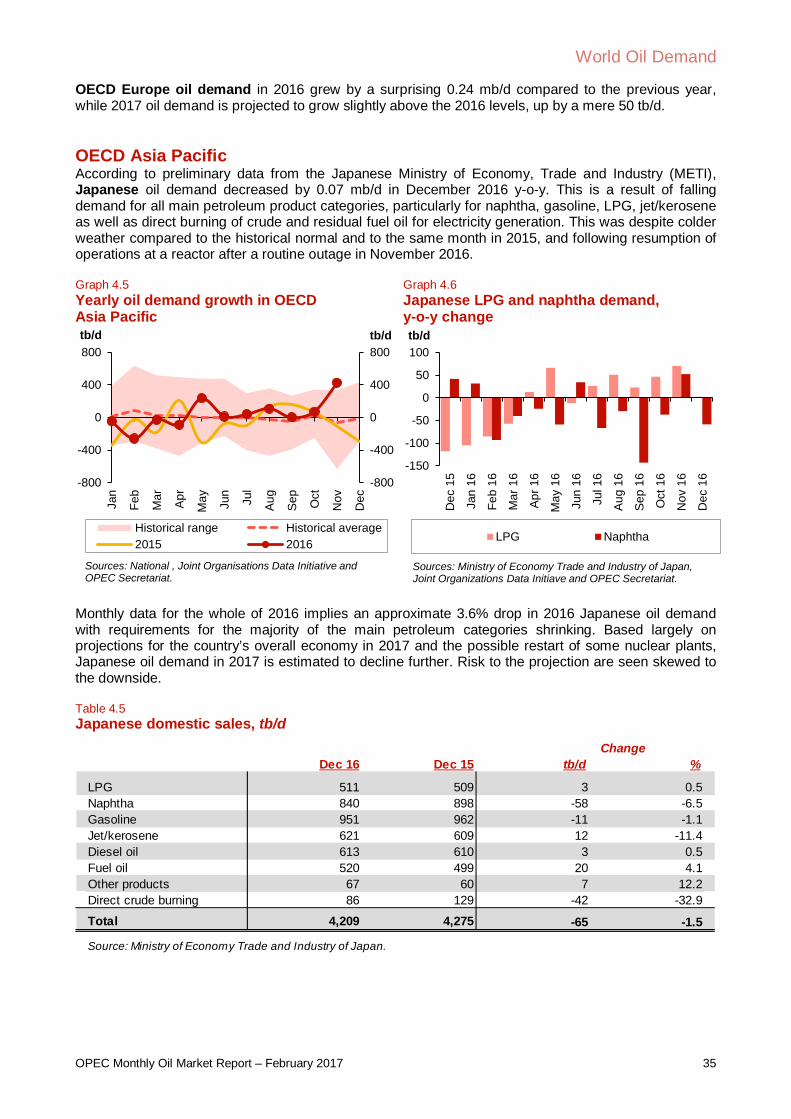
World Oil Demand
OPEC Monthly Oil Market Report – February 2017 35
OECD Europe oil demand in 2016 grew by a surprising 0.24 mb/d compared to the previous year, while 2017 oil demand is projected to grow slightly above the 2016 levels, up by a mere 50 tb/d. OECD Asia Pacific According to preliminary data from the Japanese Ministry of Economy, Trade and Industry (METI), Japanese oil demand decreased by 0.07 mb/d in December 2016 y-o-y. This is a result of falling demand for all main petroleum product categories, particularly for naphtha, gasoline, LPG, jet/kerosene as well as direct burning of crude and residual fuel oil for electricity generation. This was despite colder weather compared to the historical normal and to the same month in 2015, and following resumption of operations at a reactor after a routine outage in November 2016. Graph 4.5 Yearly oil demand growth in OECD Asia Pacific
Graph 4.6 Japanese LPG and naphtha demand, y-o-y change
Monthly data for the whole of 2016 implies an approximate 3.6% drop in 2016 Japanese oil demand with requirements for the majority of the main petroleum categories shrinking. Based largely on projections for the country’s overall economy in 2017 and the possible restart of some nuclear plants, Japanese oil demand in 2017 is estimated to decline further. Risk to the projection are seen skewed to the downside. Table 4.5 Japanese domestic sales, tb/d
-800
-400
0
400
800
-800
-400
0
400
800
Jan
Feb
Mar Ap
r
May Jun
Jul
Aug
Sep
Oct
Nov
Dec
tb/dtb/d
Historical range Historical average2015 2016
Sources: National , Joint Organisations Data Initiative and OPEC Secretariat.
-150
-100
-50
0
50
100
Dec
15
Jan
16
Feb
16
Mar
16
Apr
16
May
16
Jun
16
Jul 1
6
Aug
16
Sep
16
Oct
16
Nov
16
Dec
16
tb/d
LPG Naphtha
Sources: Ministry of Economy Trade and Industry of Japan, Joint Organizations Data Initiave and OPEC Secretariat.
Dec 16 Dec 15 tb/d %
LPG 511 509 3 0.5Naphtha 840 898 -58 -6.5Gasoline 951 962 -11 -1.1Jet/kerosene 621 609 12 -11.4Diesel oil 613 610 3 0.5Fuel oil 520 499 20 4.1Other products 67 60 7 12.2Direct crude burning 86 129 -42 -32.9
Total 4,209 4,275 -65 -1.5
Source: Ministry of Economy Trade and Industry of Japan.
Change
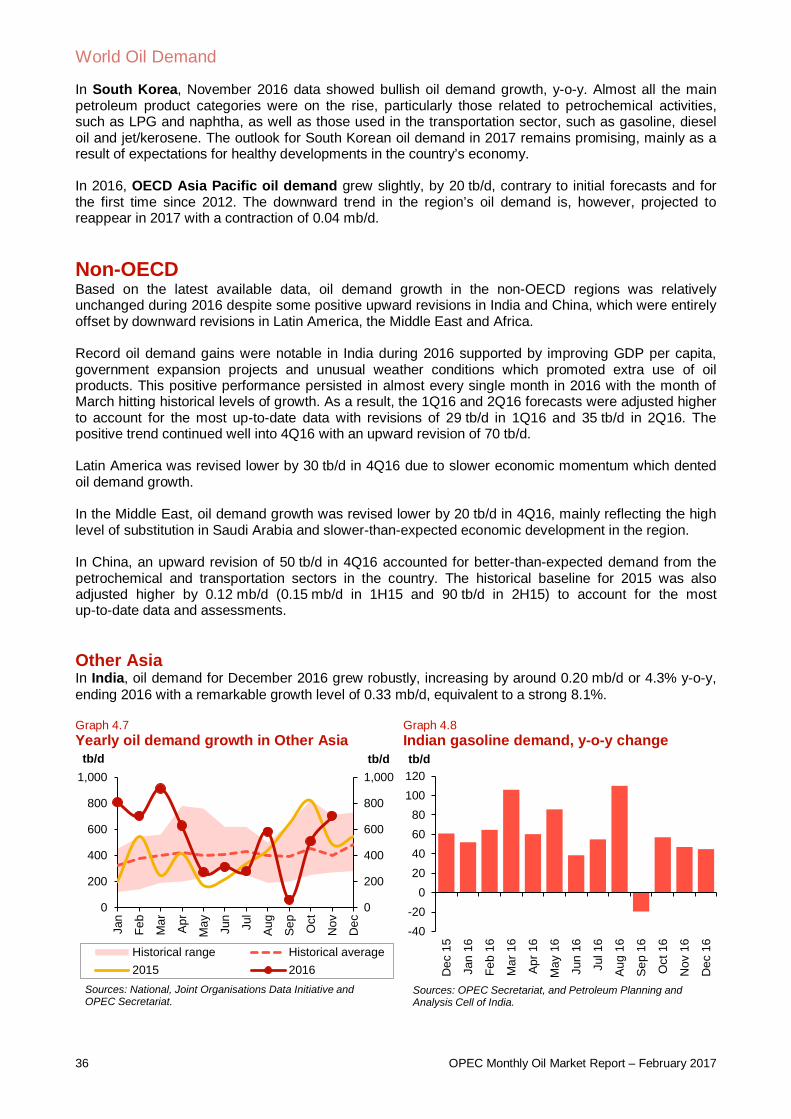
World Oil Demand
36 OPEC Monthly Oil Market Report – February 2017
In South Korea, November 2016 data showed bullish oil demand growth, y-o-y. Almost all the main petroleum product categories were on the rise, particularly those related to petrochemical activities, such as LPG and naphtha, as well as those used in the transportation sector, such as gasoline, diesel oil and jet/kerosene. The outlook for South Korean oil demand in 2017 remains promising, mainly as a result of expectations for healthy developments in the country’s economy. In 2016, OECD Asia Pacific oil demand grew slightly, by 20 tb/d, contrary to initial forecasts and for the first time since 2012. The downward trend in the region’s oil demand is, however, projected to reappear in 2017 with a contraction of 0.04 mb/d. Non-OECD Based on the latest available data, oil demand growth in the non-OECD regions was relatively unchanged during 2016 despite some positive upward revisions in India and China, which were entirely offset by downward revisions in Latin America, the Middle East and Africa. Record oil demand gains were notable in India during 2016 supported by improving GDP per capita, government expansion projects and unusual weather conditions which promoted extra use of oil products. This positive performance persisted in almost every single month in 2016 with the month of March hitting historical levels of growth. As a result, the 1Q16 and 2Q16 forecasts were adjusted higher to account for the most up-to-date data with revisions of 29 tb/d in 1Q16 and 35 tb/d in 2Q16. The positive trend continued well into 4Q16 with an upward revision of 70 tb/d. Latin America was revised lower by 30 tb/d in 4Q16 due to slower economic momentum which dented oil demand growth. In the Middle East, oil demand growth was revised lower by 20 tb/d in 4Q16, mainly reflecting the high level of substitution in Saudi Arabia and slower-than-expected economic development in the region. In China, an upward revision of 50 tb/d in 4Q16 accounted for better-than-expected demand from the petrochemical and transportation sectors in the country. The historical baseline for 2015 was also adjusted higher by 0.12 mb/d (0.15 mb/d in 1H15 and 90 tb/d in 2H15) to account for the most up-to-date data and assessments. Other Asia In India, oil demand for December 2016 grew robustly, increasing by around 0.20 mb/d or 4.3% y-o-y, ending 2016 with a remarkable growth level of 0.33 mb/d, equivalent to a strong 8.1%. Graph 4.7 Yearly oil demand growth in Other Asia
Graph 4.8 Indian gasoline demand, y-o-y change
0
200
400
600
800
1,000
0
200
400
600
800
1,000
Jan
Feb
Mar Ap
r
May Jun
Jul
Aug
Sep
Oct
Nov
Dec
tb/dtb/d
Historical range Historical average2015 2016
Sources: National, Joint Organisations Data Initiative and OPEC Secretariat.
-40-20
020406080
100120
Dec
15
Jan
16
Feb
16
Mar
16
Apr
16
May
16
Jun
16
Jul 1
6
Aug
16
Sep
16
Oct
16
Nov
16
Dec
16
tb/d
Sources: OPEC Secretariat, and Petroleum Planning and Analysis Cell of India.

World Oil Demand
OPEC Monthly Oil Market Report – February 2017 37
From a products points of view, all the main product categories showed solid gains apart from jet/kerosene, which declined for the second straight month. Oil demand gains were particularly evident for LPG, gasoline and fuel oil, despite the existence of economic uncertainty resulting from the demonisation policy being implemented in the country. Fuel oil demand growth was markedly positive as a result of higher-than-anticipated consumption in the power, steel and petrochemical sectors. The product grew by around 37 tb/d, or 14.1%, y-o-y. Indian LPG, which increased by 55 tb/d or around 7.9% compared with the same period in 2015, remains solidly above 0.75 mb/d. Support was mainly led by a pick-up in the residential sector, which consumes more than 85% of Indian LPG. Another development observed was the continuation of growth in Indian gasoline demand, which rose by 45 tb/d or 7.8% y-o-y, with total consumption reaching a historical level of 0.62 mb/d, according to data dating back to early last decade. Support continued to come from the low oil price environment, cheap credits and income per capita, as well as customers’ preference to consume gasoline rather than diesel oil due to a price advantage, especially in the small vehicle market. The rise in gasoline consumption came in spite of the sharp decline in two-wheel vehicle sales during the month of December, according to the Ministry of Petroleum and Natural Gas of India. Two-wheeler sales declined by more than 20% y-o-y, selling around 910,000 units, primarily as a result of the cash crunch following the demonetisation of large currency notes. Overall passenger vehicle sales recorded a dip of 1.8% during December 2016, of which passenger cars declined by around 8.7% y-o-y. Sales of utility vehicles and vans dropped by 29.9% and 18.8% y-o-y, respectively. Finally, December 2016 diesel oil requirements were broadly flat y-o-y as the agriculture and construction sectors were impacted by the government’s demonetisation policy which slowed trucking activities in India by around 80%, according to the Delhi Transporters' Association. Table 4.6 Indian oil demand by main products, tb/d
For the remaining countries in the region and with most data available up to November 2016, oil consumption grew solidly in Hong Kong, Indonesia, Taiwan, Thailand, and Singapore. The transportation sector led gains followed by consumption in industrial fuels, distillates and residual fuel. Looking ahead, the risks for 2017 in Other Asian oil demand growth are expected to be balanced towards 2H17 with a projection of slightly negative trend in 1H17 due to the demonetisation policy. For other countries in the region, the picture remained as described in last month’s MOMR, with assumptions being driven by healthy economic growth coupled with steady retail prices. Indonesia, Thailand, Singapore and the Philippines are projected to contribute positively to oil demand growth in 2017. Light distillates, which include LPG, naphtha and gasoline, will be the products leading oil demand next year. Other Asia’s oil demand grew by 0.52 mb/d in 2016. For 2017, oil demand is forecast to increase by 0.35 mb/d.
Dec 16 Dec 15 tb/d %
LPG 753 698 55 7.9Gasoline 623 578 45 7.8Jet/kerosene 255 281 -27 -9.5Diesel oil 1,667 1,651 17 1.0Fuel oil 298 261 37 14.1Other products 1,150 1,080 70 6.5
Total 4,746 4,549 197 4.3
Sources: OPEC Secretariat and Petroleum Planning and Analysis Cell of India.
Change
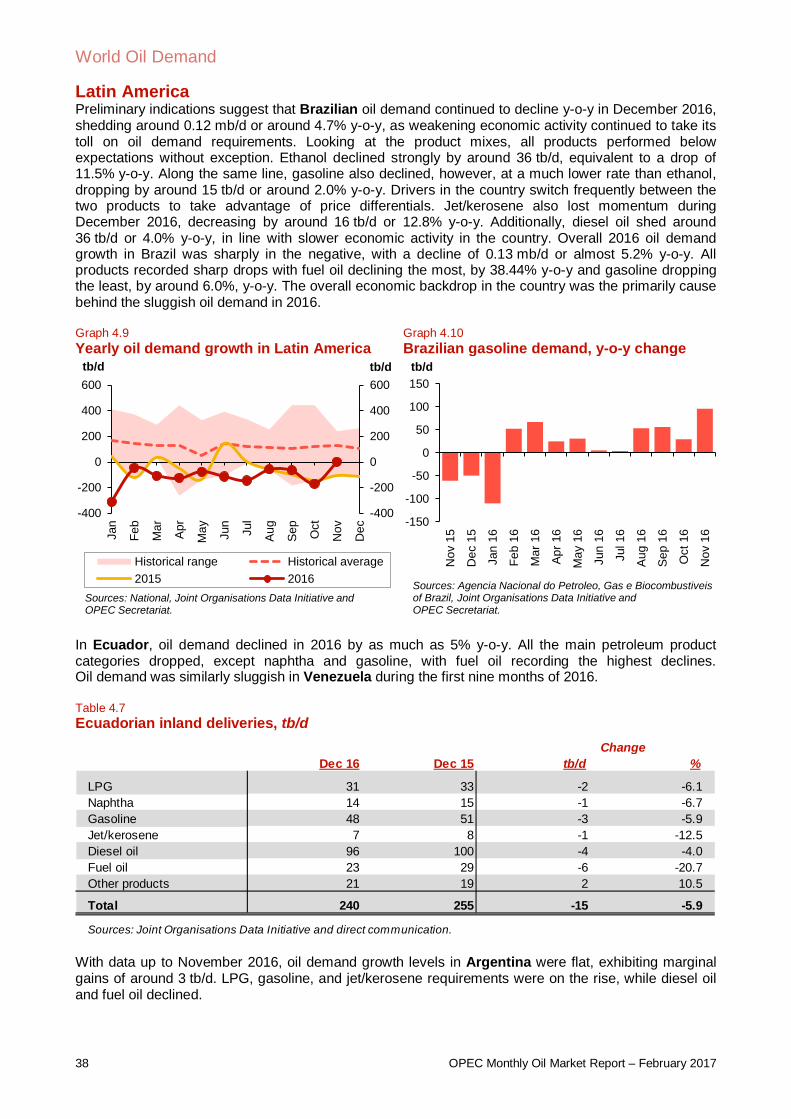
World Oil Demand
38 OPEC Monthly Oil Market Report – February 2017
Latin America Preliminary indications suggest that Brazilian oil demand continued to decline y-o-y in December 2016, shedding around 0.12 mb/d or around 4.7% y-o-y, as weakening economic activity continued to take its toll on oil demand requirements. Looking at the product mixes, all products performed below expectations without exception. Ethanol declined strongly by around 36 tb/d, equivalent to a drop of 11.5% y-o-y. Along the same line, gasoline also declined, however, at a much lower rate than ethanol, dropping by around 15 tb/d or around 2.0% y-o-y. Drivers in the country switch frequently between the two products to take advantage of price differentials. Jet/kerosene also lost momentum during December 2016, decreasing by around 16 tb/d or 12.8% y-o-y. Additionally, diesel oil shed around 36 tb/d or 4.0% y-o-y, in line with slower economic activity in the country. Overall 2016 oil demand growth in Brazil was sharply in the negative, with a decline of 0.13 mb/d or almost 5.2% y-o-y. All products recorded sharp drops with fuel oil declining the most, by 38.44% y-o-y and gasoline dropping the least, by around 6.0%, y-o-y. The overall economic backdrop in the country was the primarily cause behind the sluggish oil demand in 2016. Graph 4.9 Yearly oil demand growth in Latin America
Graph 4.10 Brazilian gasoline demand, y-o-y change
In Ecuador, oil demand declined in 2016 by as much as 5% y-o-y. All the main petroleum product categories dropped, except naphtha and gasoline, with fuel oil recording the highest declines. Oil demand was similarly sluggish in Venezuela during the first nine months of 2016. Table 4.7 Ecuadorian inland deliveries, tb/d
With data up to November 2016, oil demand growth levels in Argentina were flat, exhibiting marginal gains of around 3 tb/d. LPG, gasoline, and jet/kerosene requirements were on the rise, while diesel oil and fuel oil declined.
-400
-200
0
200
400
600
-400
-200
0
200
400
600
Jan
Feb
Mar Apr
May Jun
Jul
Aug
Sep Oct
Nov
Dec
tb/dtb/d
Historical range Historical average2015 2016
Sources: National, Joint Organisations Data Initiative and OPEC Secretariat.
-150
-100
-50
0
50
100
150
Nov
15
Dec
15
Jan
16
Feb
16
Mar
16
Apr
16
May
16
Jun
16
Jul 1
6
Aug
16
Sep
16
Oct
16
Nov
16
tb/d
Sources: Agencia Nacional do Petroleo, Gas e Biocombustiveis of Brazil, Joint Organisations Data Initiative and OPEC Secretariat.
Dec 16 Dec 15 tb/d %
LPG 31 33 -2 -6.1Naphtha 14 15 -1 -6.7Gasoline 48 51 -3 -5.9Jet/kerosene 7 8 -1 -12.5Diesel oil 96 100 -4 -4.0Fuel oil 23 29 -6 -20.7Other products 21 19 2 10.5
Total 240 255 -15 -5.9
Sources: Joint Organisations Data Initiative and direct communication.
Change
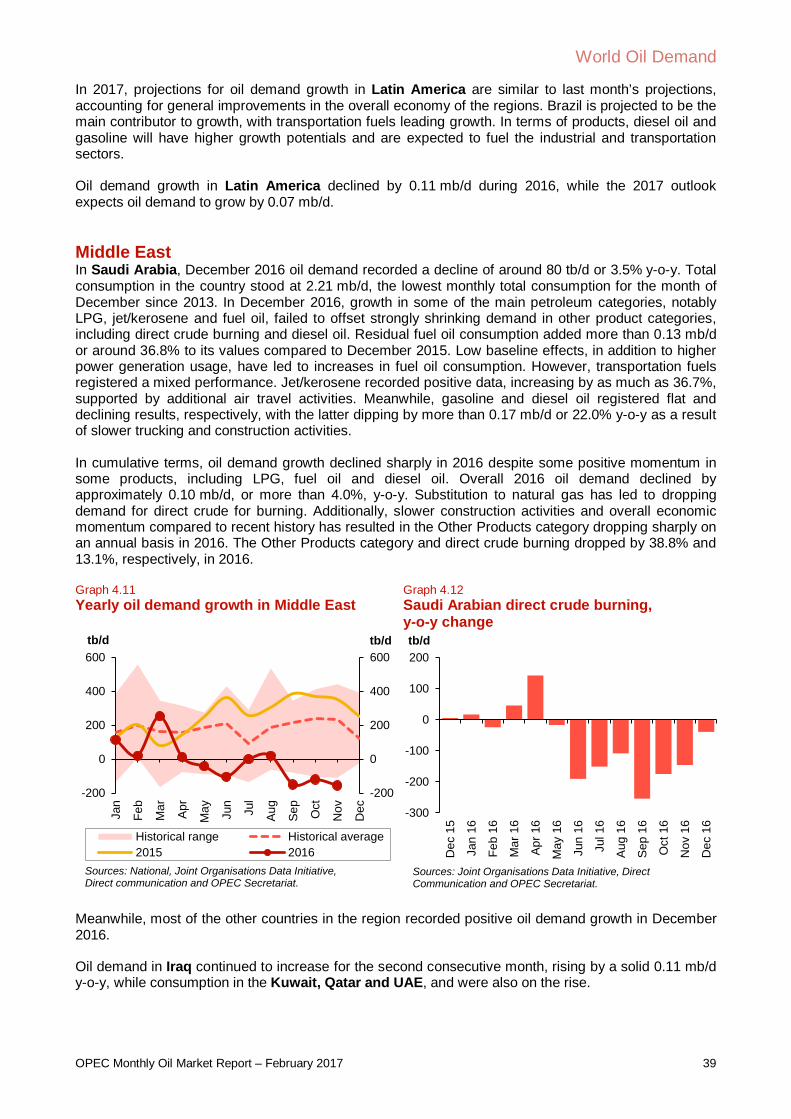
World Oil Demand
OPEC Monthly Oil Market Report – February 2017 39
In 2017, projections for oil demand growth in Latin America are similar to last month’s projections, accounting for general improvements in the overall economy of the regions. Brazil is projected to be the main contributor to growth, with transportation fuels leading growth. In terms of products, diesel oil and gasoline will have higher growth potentials and are expected to fuel the industrial and transportation sectors. Oil demand growth in Latin America declined by 0.11 mb/d during 2016, while the 2017 outlook expects oil demand to grow by 0.07 mb/d. Middle East In Saudi Arabia, December 2016 oil demand recorded a decline of around 80 tb/d or 3.5% y-o-y. Total consumption in the country stood at 2.21 mb/d, the lowest monthly total consumption for the month of December since 2013. In December 2016, growth in some of the main petroleum categories, notably LPG, jet/kerosene and fuel oil, failed to offset strongly shrinking demand in other product categories, including direct crude burning and diesel oil. Residual fuel oil consumption added more than 0.13 mb/d or around 36.8% to its values compared to December 2015. Low baseline effects, in addition to higher power generation usage, have led to increases in fuel oil consumption. However, transportation fuels registered a mixed performance. Jet/kerosene recorded positive data, increasing by as much as 36.7%, supported by additional air travel activities. Meanwhile, gasoline and diesel oil registered flat and declining results, respectively, with the latter dipping by more than 0.17 mb/d or 22.0% y-o-y as a result of slower trucking and construction activities. In cumulative terms, oil demand growth declined sharply in 2016 despite some positive momentum in some products, including LPG, fuel oil and diesel oil. Overall 2016 oil demand declined by approximately 0.10 mb/d, or more than 4.0%, y-o-y. Substitution to natural gas has led to dropping demand for direct crude for burning. Additionally, slower construction activities and overall economic momentum compared to recent history has resulted in the Other Products category dropping sharply on an annual basis in 2016. The Other Products category and direct crude burning dropped by 38.8% and 13.1%, respectively, in 2016. Graph 4.11 Yearly oil demand growth in Middle East
Graph 4.12 Saudi Arabian direct crude burning, y-o-y change
Meanwhile, most of the other countries in the region recorded positive oil demand growth in December 2016. Oil demand in Iraq continued to increase for the second consecutive month, rising by a solid 0.11 mb/d y-o-y, while consumption in the Kuwait, Qatar and UAE, and were also on the rise.
-200
0
200
400
600
-200
0
200
400
600
Jan
Feb
Mar Ap
r
May Jun
Jul
Aug
Sep
Oct
Nov
Dec
tb/dtb/d
Historical range Historical average2015 2016
Sources: National, Joint Organisations Data Initiative, Direct communication and OPEC Secretariat.
-300
-200
-100
0
100
200
Dec
15
Jan
16
Feb
16
Mar
16
Apr
16
May
16
Jun
16
Jul 1
6
Aug
16
Sep
16
Oct
16
Nov
16
Dec
16
tb/d
Sources: Joint Organisations Data Initiative, Direct Communication and OPEC Secretariat.

World Oil Demand
40 OPEC Monthly Oil Market Report – February 2017
Going forward, oil demand growth is foreseen gaining momentum over the levels experienced in 2016. This will mainly be the result of assumed improvements in the economy. In terms of countries within the region, Saudi Arabia is projected to be the largest contributor to growth. In contrast, geopolitical concerns as well as subsidy reduction policies are assumed to contribute negatively to demand growth in 2017. In terms of products, transportation fuels – particularly gasoline and diesel oil – are expected to lead oil demand growth. For 2016, Middle East oil demand growth hovered around the zero level, while oil demand in 2017 is projected to increase by 0.11 mb/d. China Chinese oil demand continued to rise in December 2016, with an increase of more than 50 mb/d or 4.8% y-o-y. The overall 2016 average growth for China is forecast to stand at around 0.30 mb/d or roughly 3.0% y-o-y. In December 2016, oil demand was determined by rising LPG, jet/kerosene and gasoline usage, while diesel oil demand shrunk marginally, offsetting some of the gains during the month. For LPG, the increase in demand can be attributed to the country’s expanding petrochemical industry as LPG grew for another month by around 0.28 mb/d or more than 19% y-o-y. Gasoline demand growth during December 2016 was substantially higher in volume terms, in line with growing vehicle sales. Graph 4.13 Chinese apparent oil demand, y-o-y change
Graph 4.14 Chinese diesel oil and gasoline demand, y-o-y change
The initial purchase tax cut and the expectation of a reversal of the policy late in 2016 have obviously supported vehicle sales in the country in 2016. Moreover, stable economic activity in China coupled with a steady stock market were additional elements that caused sales of trucks, buses and passenger cars to increase by close to 14% y-o-y 2016, with the total number of units sold during the year close to 28 million. Sales of individual passenger cars have form the largest share of total vehicle sales in China. In 2016, sales of passenger cars accounted for more than 24 million of the 28 million vehicles sold, once again in double-digit growth, with an increase of more than 15% y-o-y. Within the passenger car category, sport utility vehicles (SUV) continued their strong performance, rising by as much as 45% y-o-y, after an already very solid year in 2015, with a more than 53% increase. After years of sales difficulties, China’s truck market exhibited positive signs in 2016, rising by close to 9% y-o-y. Only light truck sales fell, declining by 1%. Sales of heavy duty trucks, the most profitable and highest priced segment of the truck industry, showed solid increases during 2016, rising by more than 33% y-o-y, with more than 730,000 units sold. In line with increasing air traffic statistics, jet/kerosene demand grew by 82 tb/d or approximately 14% y-o-y.
-500-25002505007501,000
-500-250
0250500750
1,000
Jan
Feb
Mar Ap
r
May Jun
Jul
Aug
Sep
Oct
Nov
Dec
tb/dtb/d
Historical range Historical average2015 2016
Sources: Argus Global Markets, China OGP (Xinhua News Agency), Facts Global Energy, JODI, National Bureau of Statistics of China and OPEC Secretariat.
-600
-400
-200
0
200
400
Dec
15
Jan
16
Feb
16
Mar
16
Apr
16
May
16
Jun
16
Jul 1
6
Aug
16
Sep
16
Oct
16
Nov
16
Dec
16
tb/d
Gasoline Diesel oil
Sources: Facts Global Energy, China OGP (Xinhua News Agency), Argus Global Markets, JODI, National Bureau of Statistics, China, OPEC Secretariat calculations.

World Oil Demand
OPEC Monthly Oil Market Report – February 2017 41
Going forward, as economic growth in China is assumed to be at slightly lower levels than in 2016, oil demand growth is expected to record marginally lower levels in 2017. On the other hand, the continuation of the fuel quality programs targeting fewer emissions, as well as ongoing fuel substitution with natural gas and coal, are assumed in the projections for 2017. In terms of products, gasoline and LPG are assumed to lead product growth in 2017 to fulfill the demands arising from ever-growing vehicle sales and ongoing improvements in the petrochemical sector. For 2016, Chinese oil demand grew by 0.30 mb/d, while oil demand in 2017 is projected to increase by 0.27 mb/d.

World Oil Supply
42 OPEC Monthly Oil Market Report – February 2017
World Oil Supply
Preliminary data indicates that world oil supply in January 2017 fell by 1.29 mb/d m-o-m to average 95.82 mb/d. The decline was due to lower OPEC and non-OPEC oil production. Year-on-year, world oil supply declined by 0.46 mb/d.
The non-OPEC oil supply estimation for 2016 was revised up by 50 tb/d to average 57.20 mb/d, representing a contraction of 0.66 mb/d. The revision was mainly driven by higher-than-expected growth in 4Q16 in the US, Canada, Norway, Russia and China, which was partially offset by downward revisions in Kazakhstan, Australia and Malaysia. For 2017, the forecast for non-OPEC supply growth was revised up by 120 tb/d to average 57.44 mb/d, representing growth of 0.24 mb/d. The upward adjustments are due to increased drilling activity and investment in the US, leading to higher onshore crude oil and NGLs production.
OPEC NGLs production is forecast to grow by 0.15 mb/d in 2017 to average 6.24 mb/d, following growth of 0.15 mb/d in 2016. In January, OPEC crude oil production decreased by 890 tb/d, according to secondary sources, to average 32.14 mb/d.
Non-OPEC supply Non-OPEC oil supply in 2016 is estimated to have averaged 57.20 mb/d in 2016, a decline of 0.66 mb/d from the previous year and an upward revision of 0.05 mb/d since the last report. Within the quarters, non-OPEC oil supply revisions were carried out mainly in 4Q16.
Table 5.1 Non-OPEC oil supply in 2016*, mb/d
2015 1Q16 2Q16 3Q16 4Q16 2016 Growth %
Americas 21.07 21.00 20.08 20.49 20.73 20.57 -0.49 -2.33 of which US 14.04 13.81 13.68 13.42 13.68 13.65 -0.39 -2.81Europe 3.76 3.91 3.73 3.63 3.92 3.80 0.04 0.99Asia Pacific 0.46 0.44 0.42 0.45 0.43 0.43 -0.03 -6.34Total OECD 25.29 25.35 24.22 24.56 25.07 24.80 -0.48 -1.91
Other Asia** 3.60 3.68 3.60 3.58 3.60 3.62 0.02 0.55Latin America 5.19 4.98 5.06 5.19 5.23 5.12 -0.07 -1.41Middle East 1.27 1.27 1.28 1.29 1.29 1.28 0.01 0.78Africa 2.13 2.10 2.05 2.13 2.16 2.11 -0.02 -0.79Total DCs 12.19 12.03 11.99 12.19 12.28 12.13 -0.06 -0.49
FSU 13.69 13.95 13.73 13.67 14.16 13.88 0.18 1.33 of which Russia 10.85 11.07 10.98 11.03 11.29 11.09 0.25 2.29Other Europe 0.14 0.13 0.13 0.13 0.13 0.13 0.00 -3.51China 4.38 4.22 4.11 4.00 3.98 4.08 -0.31 -6.99Total "Other regions" 18.21 18.31 17.97 17.79 18.26 18.08 -0.13 -0.71
Total non-OPEC production 55.68 55.69 54.19 54.54 55.62 55.01 -0.67 -1.21Processing gains 2.17 2.19 2.19 2.19 2.19 2.19 0.01 0.60
Total non-OPEC supply 57.85 57.87 56.37 56.73 57.81 57.20 -0.66 -1.14
Previous estimate 57.85 57.86 56.37 56.72 57.61 57.14 -0.71 -1.23Revision 0.00 0.01 0.00 0.01 0.20 0.05 0.05 0.09
Note: * 2016 = Estimate. ** Data includes Indonesia.Source: OPEC Secretariat.
Change 2016/15

World Oil Supply
OPEC Monthly Oil Market Report – February 2017 43
Updated production data for 4Q16 led to this adjustment, resulting in upward revisions of 131 tb/d in the OECD, 54 tb/d in the FSU and 29 tb/d in China. A downward revision of 14 tb/d was seen in DCs. According to preliminary and estimated data, total non-OPEC supply in 4Q16 increased by 1.08 mb/d q-o-q while it declined by 0.36 mb/d over the same quarter a year earlier. In 2H16, non-OPEC supply increased by 0.15 mb/d over 1H16 but declined by 0.72 mb/d compared with the same period in the previous year. Non-OPEC supply in 2016 saw strong declines in the OECD and China, and, to a lesser extent, in DCs, while growth was seen in the FSU, driven by robust output from Russia. On a regional basis, OECD Americas’ oil supply declined by 0.49 mb/d in 2016, following growth of 0.93 mb/d in 2015. This drop relates mostly to declines in US onshore crude oil output rather than annual declines in Mexico and outages in Canadian oil sands. The second region was China, with weaker crude oil output than expected according to various sources, due to low production performance in mature oil fields and low investment on behalf of the main domestic companies. In Latin America, total oil supply was disappointing, following a remarkable drop in Brazilian yearly growth compared with that of a year earlier, as well as a higher annual decline in Colombia. Contraction of 30 tb/d in OECD Asia Pacific and also 20 tb/d in Africa were registered in 2016. The only regions with minor growth were OECD Europe, Other Asia and the Middle East, while FSU had robust growth of 0.18 mb/d. For 2017, non-OPEC oil supply is now projected to grow by 0.24 mb/d, up by 0.12 mb/d from the previous MOMR due mainly to higher expectations for the US on the increase in prices. Table 5.2 Non-OPEC oil supply in 2017*, mb/d
The expected higher prices are good support for producers with marginal supply, particularly in US tight plays. Hence, the revision to the forecast for 2017 supply was made mainly based on US onshore drilling activities and more announced spending by operators on production for this year.
2016 1Q17 2Q17 3Q17 4Q17 2017 Growth %
Americas 20.57 20.92 20.57 20.81 20.97 20.82 0.25 1.20 of which US 13.65 13.88 13.78 13.88 13.99 13.88 0.24 1.74Europe 3.80 3.84 3.73 3.54 3.82 3.73 -0.07 -1.72Asia Pacific 0.43 0.45 0.46 0.45 0.42 0.44 0.01 2.50Total OECD 24.80 25.21 24.76 24.80 25.21 24.99 0.19 0.78
Other Asia 3.62 3.64 3.59 3.56 3.53 3.58 -0.04 -1.00Latin America 5.12 5.23 5.25 5.29 5.38 5.29 0.17 3.37Middle East 1.28 1.24 1.23 1.24 1.24 1.24 -0.05 -3.65Africa 2.11 2.13 2.15 2.22 2.24 2.18 0.07 3.44Total DCs 12.13 12.23 12.22 12.31 12.39 12.29 0.16 1.34
FSU 13.88 13.87 13.83 13.94 14.02 13.92 0.04 0.29 of which Russia 11.09 10.98 10.97 11.08 11.11 11.03 -0.06 -0.54Other Europe 0.13 0.14 0.14 0.14 0.15 0.14 0.01 8.54China 4.08 3.95 3.89 3.87 3.88 3.90 -0.18 -4.33Total "Other regions" 18.08 17.96 17.87 17.95 18.05 17.96 -0.13 -0.69
Total non-OPEC production 55.01 55.40 54.85 55.07 55.65 55.24 0.23 0.42Processing gains 2.19 2.20 2.20 2.20 2.20 2.20 0.01 0.50
Total non-OPEC supply 57.20 57.59 57.04 57.26 57.84 57.44 0.24 0.42
Previous estimate 57.14 57.34 56.92 57.09 57.67 57.26 0.12 0.20Revision 0.05 0.25 0.12 0.17 0.17 0.18 0.12 0.22
Note: * 2017 = Forecast. ** Data includes Indonesia.Source: OPEC Secretariat.
Change 2017/16

World Oil Supply
44 OPEC Monthly Oil Market Report – February 2017
On a country-by-country basis, the main contributors to growth in 2017 are expected to be Brazil with 0.25 mb/d, the US with 0.24 mb/d, Canada with 0.18 mb/d, Kazakhstan with 0.14 mb/d, Africa Others with 0.04 mb/d and Congo with 0.03 mb/d. China, Mexico, Russia, Colombia, Oman, Azerbaijan, Norway and Indonesia are expected to show the strongest declines. Graph 5.1 Non-OPEC quarterly oil supply, 2015-2017
Regarding regional non-OPEC supply changes, the following graph shows that the main rebound in annual growth will be in OECD Americas and, to some extent, in DCs, particularly Latin America. Graph 5.2 Regional non-OPEC supply growth, 2015-2017, y-o-y change
57.9
0
57.5
4
57.8
0 58.1
7
57.8
7
56.3
7
56.7
3
57.8
1
57.5
9
57.0
4
57.2
6 57.8
4
55
56
57
58
59
1Q 2Q 3Q 4Q 1Q 2Q 3Q 4Q 1Q 2Q 3Q 4Q
2015 2016 (Estimate) 2017 (Forecast)
mb/d
Source: OPEC Secretariat.
-0.6
-0.4
-0.2
0.0
0.2
0.4
0.6
0.8
1.0
OECDAmericas
OECDEurope
OECD AsiaPacific
Other Asia LatinAmerica
Middle East Africa FSU China
mb/d
15/14 16/15 17/16
Note: 2016 = Estimate and 2017 = Forecast.Source: OPEC Secretariat.

World Oil Supply
OPEC Monthly Oil Market Report – February 2017 45
Graph 5.3 Non-OPEC quarterly supply change, 2016-2017, y-o-y change
Global oil and gas companies are expected to raise exploration and production (E&P) spending in 2017, marking the first increase in three years. Thus, in addition to the expected increase in prices, spending on new projects and field development are helping stimulate production in North America. In particular, projects with good economic performance and productivity will have the potential to bring more oil online in 2017. Table 5.3 Non-OPEC supply forecast comparison in 2016* and 2017*, mb/d
-0.66
0.24
-2
-1
0
1
-2
-1
0
1
1Q 2Q 3Q 4Q 1Q 2Q 3Q 4Q
2016 (Estimate) 2017 (Forecast)
mb/dmb/d
OECD Americas OECD Europe OECD Asia PacificTotal DCs FSU ex. Russia RussiaChina Non-OPEC supply (RHS) 2016 annual avg. (RHS)2017 annual avg. (RHS)
Source: OPEC Secretariat.
Change Change2016 2016/15 2017 2017/16
OECD Americas 20.57 -0.49 20.82 0.25OECD Europe 3.80 0.04 3.73 -0.07OECD Asia Pacific 0.43 -0.03 0.44 0.01Total OECD 24.80 -0.48 24.99 0.19
Other Asia ** 3.62 0.02 3.58 -0.04Latin America 5.12 -0.07 5.29 0.17Middle East 1.28 0.01 1.24 -0.05Africa 2.11 -0.02 2.18 0.07Total DCs 12.13 -0.06 12.29 0.16
FSU 13.88 0.18 13.92 0.04Other Europe 0.13 0.00 0.14 0.01China 4.08 -0.31 3.90 -0.18
Non-OPEC production 55.01 -0.67 55.24 0.23Processing gains 2.19 0.01 2.20 0.01Non-OPEC supply 57.20 -0.66 57.44 0.24
Note: * 2016 = Estimate and 2017 = Forecast. ** Data includes Indonesia.Source: OPEC Secretariat.
Region
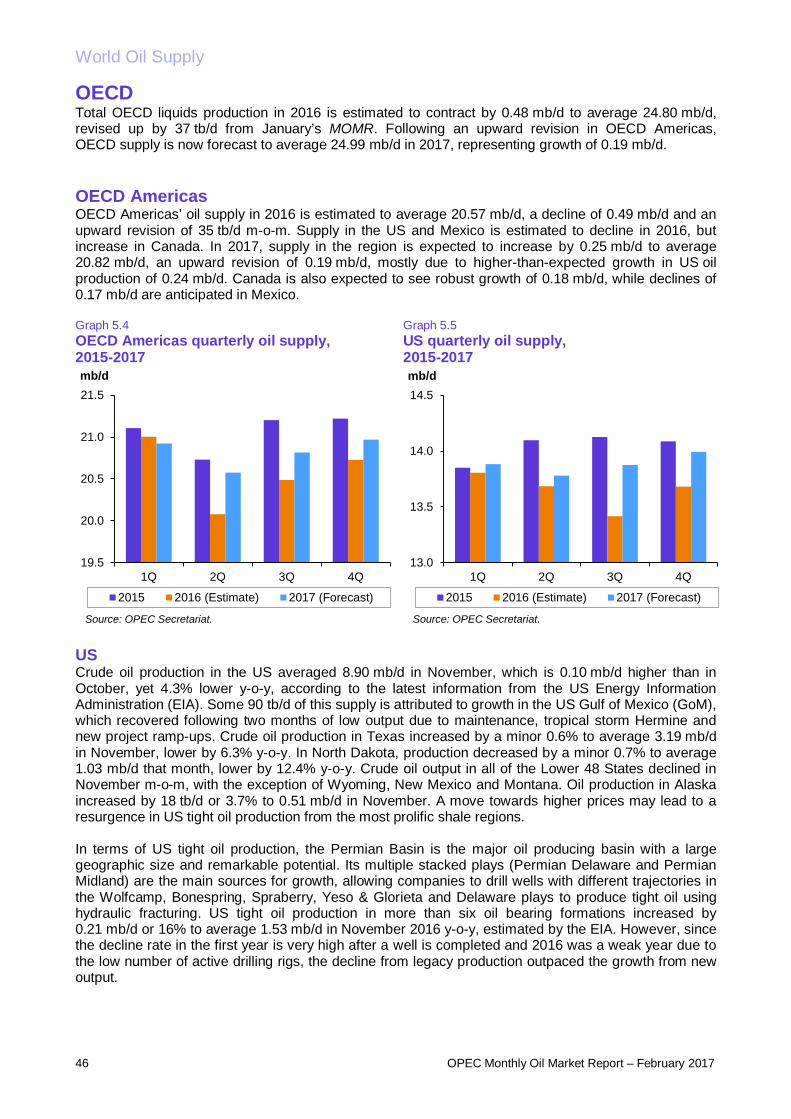
World Oil Supply
46 OPEC Monthly Oil Market Report – February 2017
OECD Total OECD liquids production in 2016 is estimated to contract by 0.48 mb/d to average 24.80 mb/d, revised up by 37 tb/d from January’s MOMR. Following an upward revision in OECD Americas, OECD supply is now forecast to average 24.99 mb/d in 2017, representing growth of 0.19 mb/d. OECD Americas OECD Americas’ oil supply in 2016 is estimated to average 20.57 mb/d, a decline of 0.49 mb/d and an upward revision of 35 tb/d m-o-m. Supply in the US and Mexico is estimated to decline in 2016, but increase in Canada. In 2017, supply in the region is expected to increase by 0.25 mb/d to average 20.82 mb/d, an upward revision of 0.19 mb/d, mostly due to higher-than-expected growth in US oil production of 0.24 mb/d. Canada is also expected to see robust growth of 0.18 mb/d, while declines of 0.17 mb/d are anticipated in Mexico. Graph 5.4 OECD Americas quarterly oil supply, 2015-2017
Graph 5.5 US quarterly oil supply, 2015-2017
US Crude oil production in the US averaged 8.90 mb/d in November, which is 0.10 mb/d higher than in October, yet 4.3% lower y-o-y, according to the latest information from the US Energy Information Administration (EIA). Some 90 tb/d of this supply is attributed to growth in the US Gulf of Mexico (GoM), which recovered following two months of low output due to maintenance, tropical storm Hermine and new project ramp-ups. Crude oil production in Texas increased by a minor 0.6% to average 3.19 mb/d in November, lower by 6.3% y-o-y. In North Dakota, production decreased by a minor 0.7% to average 1.03 mb/d that month, lower by 12.4% y-o-y. Crude oil output in all of the Lower 48 States declined in November m-o-m, with the exception of Wyoming, New Mexico and Montana. Oil production in Alaska increased by 18 tb/d or 3.7% to 0.51 mb/d in November. A move towards higher prices may lead to a resurgence in US tight oil production from the most prolific shale regions. In terms of US tight oil production, the Permian Basin is the major oil producing basin with a large geographic size and remarkable potential. Its multiple stacked plays (Permian Delaware and Permian Midland) are the main sources for growth, allowing companies to drill wells with different trajectories in the Wolfcamp, Bonespring, Spraberry, Yeso & Glorieta and Delaware plays to produce tight oil using hydraulic fracturing. US tight oil production in more than six oil bearing formations increased by 0.21 mb/d or 16% to average 1.53 mb/d in November 2016 y-o-y, estimated by the EIA. However, since the decline rate in the first year is very high after a well is completed and 2016 was a weak year due to the low number of active drilling rigs, the decline from legacy production outpaced the growth from new output.
19.5
20.0
20.5
21.0
21.5
1Q 2Q 3Q 4Q
mb/d
2015 2016 (Estimate) 2017 (Forecast)
Source: OPEC Secretariat.
13.0
13.5
14.0
14.5
1Q 2Q 3Q 4Q
mb/d
2015 2016 (Estimate) 2017 (Forecast)
Source: OPEC Secretariat.
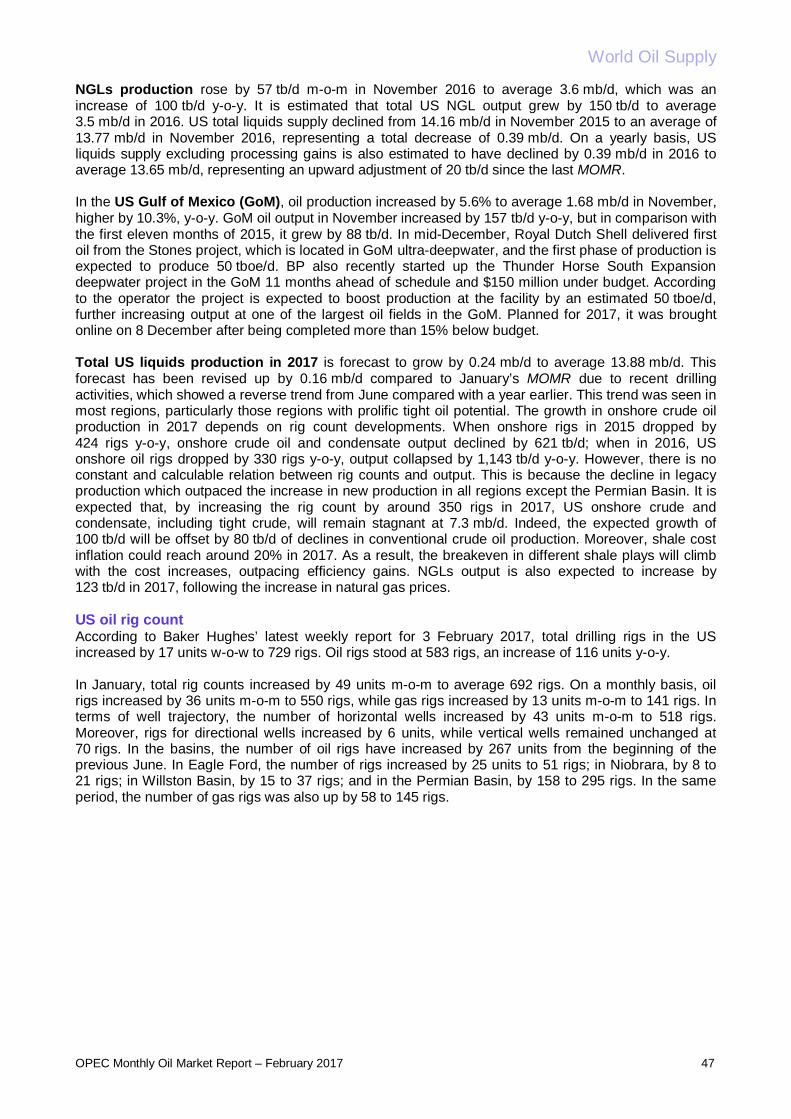
World Oil Supply
OPEC Monthly Oil Market Report – February 2017 47
NGLs production rose by 57 tb/d m-o-m in November 2016 to average 3.6 mb/d, which was an increase of 100 tb/d y-o-y. It is estimated that total US NGL output grew by 150 tb/d to average 3.5 mb/d in 2016. US total liquids supply declined from 14.16 mb/d in November 2015 to an average of 13.77 mb/d in November 2016, representing a total decrease of 0.39 mb/d. On a yearly basis, US liquids supply excluding processing gains is also estimated to have declined by 0.39 mb/d in 2016 to average 13.65 mb/d, representing an upward adjustment of 20 tb/d since the last MOMR. In the US Gulf of Mexico (GoM), oil production increased by 5.6% to average 1.68 mb/d in November, higher by 10.3%, y-o-y. GoM oil output in November increased by 157 tb/d y-o-y, but in comparison with the first eleven months of 2015, it grew by 88 tb/d. In mid-December, Royal Dutch Shell delivered first oil from the Stones project, which is located in GoM ultra-deepwater, and the first phase of production is expected to produce 50 tboe/d. BP also recently started up the Thunder Horse South Expansion deepwater project in the GoM 11 months ahead of schedule and $150 million under budget. According to the operator the project is expected to boost production at the facility by an estimated 50 tboe/d, further increasing output at one of the largest oil fields in the GoM. Planned for 2017, it was brought online on 8 December after being completed more than 15% below budget. Total US liquids production in 2017 is forecast to grow by 0.24 mb/d to average 13.88 mb/d. This forecast has been revised up by 0.16 mb/d compared to January’s MOMR due to recent drilling activities, which showed a reverse trend from June compared with a year earlier. This trend was seen in most regions, particularly those regions with prolific tight oil potential. The growth in onshore crude oil production in 2017 depends on rig count developments. When onshore rigs in 2015 dropped by 424 rigs y-o-y, onshore crude oil and condensate output declined by 621 tb/d; when in 2016, US onshore oil rigs dropped by 330 rigs y-o-y, output collapsed by 1,143 tb/d y-o-y. However, there is no constant and calculable relation between rig counts and output. This is because the decline in legacy production which outpaced the increase in new production in all regions except the Permian Basin. It is expected that, by increasing the rig count by around 350 rigs in 2017, US onshore crude and condensate, including tight crude, will remain stagnant at 7.3 mb/d. Indeed, the expected growth of 100 tb/d will be offset by 80 tb/d of declines in conventional crude oil production. Moreover, shale cost inflation could reach around 20% in 2017. As a result, the breakeven in different shale plays will climb with the cost increases, outpacing efficiency gains. NGLs output is also expected to increase by 123 tb/d in 2017, following the increase in natural gas prices. US oil rig count According to Baker Hughes’ latest weekly report for 3 February 2017, total drilling rigs in the US increased by 17 units w-o-w to 729 rigs. Oil rigs stood at 583 rigs, an increase of 116 units y-o-y. In January, total rig counts increased by 49 units m-o-m to average 692 rigs. On a monthly basis, oil rigs increased by 36 units m-o-m to 550 rigs, while gas rigs increased by 13 units m-o-m to 141 rigs. In terms of well trajectory, the number of horizontal wells increased by 43 units m-o-m to 518 rigs. Moreover, rigs for directional wells increased by 6 units, while vertical wells remained unchanged at 70 rigs. In the basins, the number of oil rigs have increased by 267 units from the beginning of the previous June. In Eagle Ford, the number of rigs increased by 25 units to 51 rigs; in Niobrara, by 8 to 21 rigs; in Willston Basin, by 15 to 37 rigs; and in the Permian Basin, by 158 to 295 rigs. In the same period, the number of gas rigs was also up by 58 to 145 rigs.
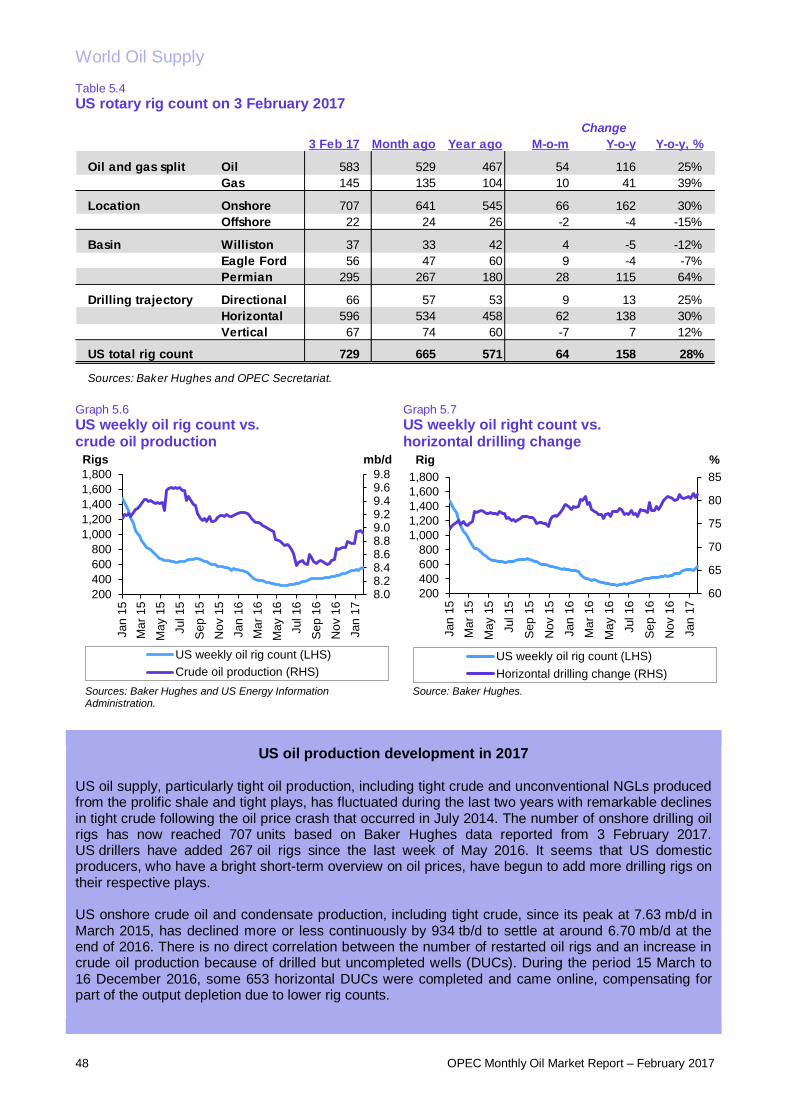
World Oil Supply
48 OPEC Monthly Oil Market Report – February 2017
Table 5.4 US rotary rig count on 3 February 2017
Graph 5.6 US weekly oil rig count vs. crude oil production
Graph 5.7 US weekly oil right count vs. horizontal drilling change
US oil production development in 2017 US oil supply, particularly tight oil production, including tight crude and unconventional NGLs produced from the prolific shale and tight plays, has fluctuated during the last two years with remarkable declines in tight crude following the oil price crash that occurred in July 2014. The number of onshore drilling oil rigs has now reached 707 units based on Baker Hughes data reported from 3 February 2017. US drillers have added 267 oil rigs since the last week of May 2016. It seems that US domestic producers, who have a bright short-term overview on oil prices, have begun to add more drilling rigs on their respective plays. US onshore crude oil and condensate production, including tight crude, since its peak at 7.63 mb/d in March 2015, has declined more or less continuously by 934 tb/d to settle at around 6.70 mb/d at the end of 2016. There is no direct correlation between the number of restarted oil rigs and an increase in crude oil production because of drilled but uncompleted wells (DUCs). During the period 15 March to 16 December 2016, some 653 horizontal DUCs were completed and came online, compensating for part of the output depletion due to lower rig counts.
3 Feb 17 Month ago Year ago M-o-m Y-o-y Y-o-y, %
Oil and gas split Oil 583 529 467 54 116 25%Gas 145 135 104 10 41 39%
Location Onshore 707 641 545 66 162 30%Offshore 22 24 26 -2 -4 -15%
Basin Williston 37 33 42 4 -5 -12%Eagle Ford 56 47 60 9 -4 -7%Permian 295 267 180 28 115 64%
Drilling trajectory Directional 66 57 53 9 13 25%Horizontal 596 534 458 62 138 30%Vertical 67 74 60 -7 7 12%
US total rig count 729 665 571 64 158 28%
Sources: Baker Hughes and OPEC Secretariat.
Change
8.08.28.48.68.89.09.29.49.69.8
200400600800
1,0001,2001,4001,6001,800
Jan
15M
ar 1
5M
ay 1
5Ju
l 15
Sep
15
Nov
15
Jan
16M
ar 1
6M
ay 1
6Ju
l 16
Sep
16
Nov
16
Jan
17
mb/dRigs
US weekly oil rig count (LHS)Crude oil production (RHS)
Sources: Baker Hughes and US Energy Information Administration.
60
65
70
75
80
85
200400600800
1,0001,2001,4001,6001,800
Jan
15M
ar 1
5
May
15
Jul 1
5
Sep
15
Nov
15
Jan
16M
ar 1
6
May
16
Jul 1
6
Sep
16
Nov
16
Jan
17
%Rig
US weekly oil rig count (LHS)Horizontal drilling change (RHS)
Source: Baker Hughes.

World Oil Supply
OPEC Monthly Oil Market Report – February 2017 49
To predict how much crude oil will be produced in the US and how fast it will be produced is challenging. Physically, rig counts and producing well counts are the main factors for output, while access to the most productive regions where their breakeven matches with the current WTI prices are essential for growth. The decline in onshore oil rigs in the lower 48 states bottomed out at 320 rigs in average in May 2016. In 4Q16, the number of active onshore oil rigs had increased by around 20% q-o-q to 450 rigs on average. The average rig count in 2017 is expected to reach 675 rigs, higher by 73% over the average of 390 rigs in 2016. Some 86% of the total oil rigs are expected to drill horizontal wells. According to the base scenario for rig counts in 2017, the US Lower 48 states’ onshore crude and condensate production, including tight crude, is forecast to reach 6.9 mb/d by the end of the year, but on a yearly basis, it will grow by only 24 tb/d to average 6.80 mb/d compared with a year earlier when it was at 6.78 mb/d. The maximum and minimum production, assuming the rig count with +20% and -20%, will be at 7.3 mb/d and 6.8 mb/d, respectively.
Graph 5.8 US lower 48 states onshore oil rig counts vs. Crude oil production
Graph 5.9 US lower 48 states rig counts forecast vs. Crude oil output
Different survey results on global upstream spending show the recovery in different segments from oilfield services and equipment to drilling and well completions in 2017. According to Barclay, North American upstream spending will increase ~27% based on WTI being at $50/b. According to this survey, upstream spending is forecast to increase as a result of greater activity and oilfield service cost inflation. It seems that based on the assumption of a more stable oil price outlook, increased drilling activity and production is expected. Rystad Energy expects global E&P investments will start to grow for some segments, while other segments are expected to continue declining. Investments in shale are expected to come back in 2017, with projected growth of more than 35%. Production of US natural gas liquids (NGLs) increased by 0.14 mb/d to average 3.48 mb/d in 2016, following growth of 0.33 mb/d in 2015. The highest monthly output of 3.62 mb/d was recorded in June. Improved US natural gas prices have resulted in more rigs coming back online. The number of active gas rigs was at the low point of 81 rigs in August 2016, but the count increased back up to 132 rigs by the end of the year. Hence, US NGLs are expected to grow by 123 tb/d in 2016. However, unconventional NGLs growth in 2017 will be partially offset by conventional NGL declines.
817
492
7,634
6,700
6,0006,3006,6006,9007,2007,5007,800
0
300
600
900
Mar
15
May
15
Jul 1
5
Sep
15
Nov
15
Jan
16
Mar
16
May
16
Jul 1
6
Sep
16
Nov
16
Jan
17
tb/dUnits
Onshore oil rig count (LHS)US lower-48 onshore crude prodction (RHS)
Sources: Baker Hughes, US Energy Information Administration and OPEC Secretariat.
6,930
7,312
6,700
6,797
6,200
6,400
6,600
6,800
7,000
7,200
7,400
0
200
400
600
800
1,000
1,200
4Q16 1Q17 2Q17 3Q17 4Q17
tb/dUnits
Oil rig count (LHS)Lower 48 states onshore production (RHS)
Sources: OPEC Secretariat.
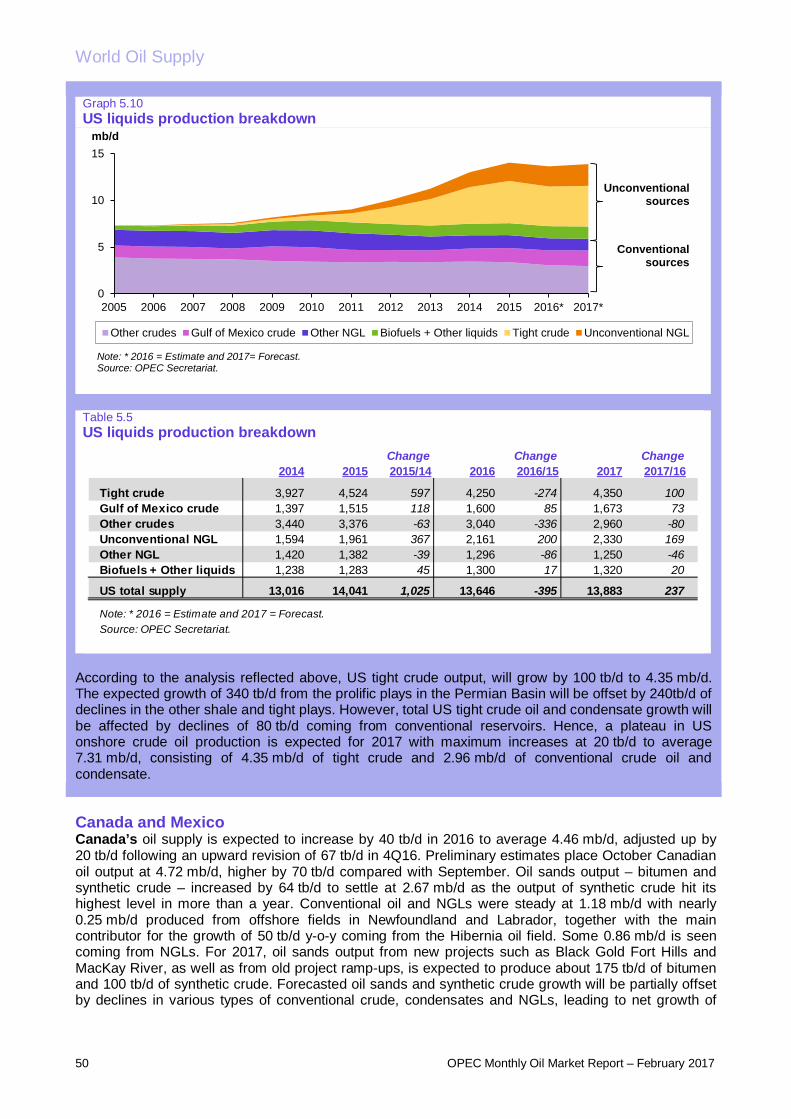
World Oil Supply
50 OPEC Monthly Oil Market Report – February 2017
Graph 5.10 US liquids production breakdown
Table 5.5 US liquids production breakdown
According to the analysis reflected above, US tight crude output, will grow by 100 tb/d to 4.35 mb/d. The expected growth of 340 tb/d from the prolific plays in the Permian Basin will be offset by 240tb/d of declines in the other shale and tight plays. However, total US tight crude oil and condensate growth will be affected by declines of 80 tb/d coming from conventional reservoirs. Hence, a plateau in US onshore crude oil production is expected for 2017 with maximum increases at 20 tb/d to average 7.31 mb/d, consisting of 4.35 mb/d of tight crude and 2.96 mb/d of conventional crude oil and condensate.
Canada and Mexico Canada’s oil supply is expected to increase by 40 tb/d in 2016 to average 4.46 mb/d, adjusted up by 20 tb/d following an upward revision of 67 tb/d in 4Q16. Preliminary estimates place October Canadian oil output at 4.72 mb/d, higher by 70 tb/d compared with September. Oil sands output – bitumen and synthetic crude – increased by 64 tb/d to settle at 2.67 mb/d as the output of synthetic crude hit its highest level in more than a year. Conventional oil and NGLs were steady at 1.18 mb/d with nearly 0.25 mb/d produced from offshore fields in Newfoundland and Labrador, together with the main contributor for the growth of 50 tb/d y-o-y coming from the Hibernia oil field. Some 0.86 mb/d is seen coming from NGLs. For 2017, oil sands output from new projects such as Black Gold Fort Hills and MacKay River, as well as from old project ramp-ups, is expected to produce about 175 tb/d of bitumen and 100 tb/d of synthetic crude. Forecasted oil sands and synthetic crude growth will be partially offset by declines in various types of conventional crude, condensates and NGLs, leading to net growth of
0
5
10
15
2005 2006 2007 2008 2009 2010 2011 2012 2013 2014 2015 2016* 2017*
mb/d
Other crudes Gulf of Mexico crude Other NGL Biofuels + Other liquids Tight crude Unconventional NGL
Note: * 2016 = Estimate and 2017= Forecast.Source: OPEC Secretariat.
Conventionalsources
Unconventionalsources
Change Change Change2014 2015 2015/14 2016 2016/15 2017 2017/16
Tight crude 3,927 4,524 597 4,250 -274 4,350 100Gulf of Mexico crude 1,397 1,515 118 1,600 85 1,673 73Other crudes 3,440 3,376 -63 3,040 -336 2,960 -80Unconventional NGL 1,594 1,961 367 2,161 200 2,330 169Other NGL 1,420 1,382 -39 1,296 -86 1,250 -46Biofuels + Other liquids 1,238 1,283 45 1,300 17 1,320 20
US total supply 13,016 14,041 1,025 13,646 -395 13,883 237
Note: * 2016 = Estimate and 2017 = Forecast.Source: OPEC Secretariat.

World Oil Supply
OPEC Monthly Oil Market Report – February 2017 51
0.18 mb/d in 2017, following an upward revision of 10 tb/d compared to January’s MOMR, to now average 4.63 mb/d. Graph 5.11 Canada production by crude type
Graph 5.12 Canada production by crude type, y-o-y change
Canada’s overall rig count for the week ending 3 February 2017 saw two less units w-o-w to total 343 units. On a monthly basis, they increased by 99 rigs – of which 70 rigs are from oil – to average 310 rigs. Y-o-y, the rig count in Canada showed an increase of 101 rigs. After decreasing to a minimum of 26 rigs during the wildfires in Fort McMurray last May, the number of active rigs in Alberta – the main state for oil sands production – reached an average of 247 rigs. The other main producing provinces are Saskatchewan and British Colombia which registered 54 rigs and 30 rigs, respectively. Graph 5.13 Canada quarterly oil supply, 2015-2017
Graph 5.14 Mexico quarterly oil supply, 2015-2017
Mexican liquids production in 2016 is estimated to decline by 0.13 mb/d to average 2.46 mb/d, unchanged from the previous MOMR. Oil output in December declined by 30 tb/d. Crude oil and condensate declined by 37 tb/d compared to November while NGL output was steady averaging 2.34 mb/d m-o-m. Preliminary oil supply data for 4Q16 shows another 90 tb/d of decline, q-o-q. According to this annual decline rate trend, oil production will fall by 0.17 mb/d – revised up by 10 tb/d compared to January’s MOMR − to average 2.30 mb/d in 2017.
0.9
1.2
1.5
1.8
2.1
2.4
2.7
Jan
11
Jul 1
1
Jan
12
Jul 1
2
Jan
13
Jul 1
3
Jan
14
Jul 1
4
Jan
15
Jul 1
5
Jan
16
Jul 1
6
Jan
17
mb/d
Synthetic crude + Crude bitumenConventional
Source: OPEC Secretariat.
-0.50
-0.25
0.00
0.25
0.50
Jan
11
Jul 1
1
Jan
12
Jul 1
2
Jan
13
Jul 1
3
Jan
14
Jul 1
4
Jan
15
Jul 1
5
Jan
16
Jul 1
6
Jan
17
mb/d
Conventional Synthetic crude + Crude bitumen
Source: OPEC Secretariat.
0.00.51.01.52.02.53.03.54.04.55.0
1Q 2Q 3Q 4Q
mb/d
2015 2016 (Estimate) 2017 (Forecast)
Source: OPEC Secretariat.
2.0
2.1
2.2
2.3
2.4
2.5
2.6
2.7
1Q 2Q 3Q 4Q
mb/d
2015 2016 (Estimate) 2017 (Forecast)
Source: OPEC Secretariat.
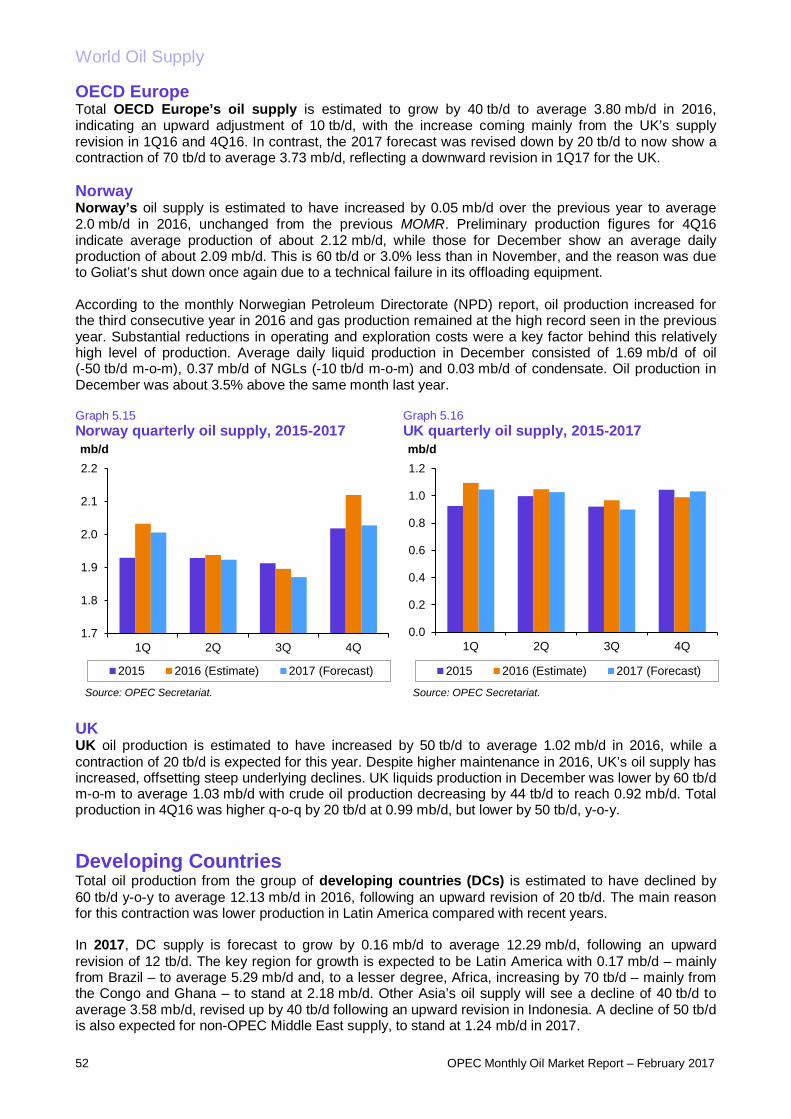
World Oil Supply
52 OPEC Monthly Oil Market Report – February 2017
OECD Europe Total OECD Europe’s oil supply is estimated to grow by 40 tb/d to average 3.80 mb/d in 2016, indicating an upward adjustment of 10 tb/d, with the increase coming mainly from the UK’s supply revision in 1Q16 and 4Q16. In contrast, the 2017 forecast was revised down by 20 tb/d to now show a contraction of 70 tb/d to average 3.73 mb/d, reflecting a downward revision in 1Q17 for the UK. Norway Norway’s oil supply is estimated to have increased by 0.05 mb/d over the previous year to average 2.0 mb/d in 2016, unchanged from the previous MOMR. Preliminary production figures for 4Q16 indicate average production of about 2.12 mb/d, while those for December show an average daily production of about 2.09 mb/d. This is 60 tb/d or 3.0% less than in November, and the reason was due to Goliat’s shut down once again due to a technical failure in its offloading equipment. According to the monthly Norwegian Petroleum Directorate (NPD) report, oil production increased for the third consecutive year in 2016 and gas production remained at the high record seen in the previous year. Substantial reductions in operating and exploration costs were a key factor behind this relatively high level of production. Average daily liquid production in December consisted of 1.69 mb/d of oil (-50 tb/d m-o-m), 0.37 mb/d of NGLs (-10 tb/d m-o-m) and 0.03 mb/d of condensate. Oil production in December was about 3.5% above the same month last year. Graph 5.15 Norway quarterly oil supply, 2015-2017
Graph 5.16 UK quarterly oil supply, 2015-2017
UK UK oil production is estimated to have increased by 50 tb/d to average 1.02 mb/d in 2016, while a contraction of 20 tb/d is expected for this year. Despite higher maintenance in 2016, UK’s oil supply has increased, offsetting steep underlying declines. UK liquids production in December was lower by 60 tb/d m-o-m to average 1.03 mb/d with crude oil production decreasing by 44 tb/d to reach 0.92 mb/d. Total production in 4Q16 was higher q-o-q by 20 tb/d at 0.99 mb/d, but lower by 50 tb/d, y-o-y. Developing Countries Total oil production from the group of developing countries (DCs) is estimated to have declined by 60 tb/d y-o-y to average 12.13 mb/d in 2016, following an upward revision of 20 tb/d. The main reason for this contraction was lower production in Latin America compared with recent years. In 2017, DC supply is forecast to grow by 0.16 mb/d to average 12.29 mb/d, following an upward revision of 12 tb/d. The key region for growth is expected to be Latin America with 0.17 mb/d – mainly from Brazil – to average 5.29 mb/d and, to a lesser degree, Africa, increasing by 70 tb/d – mainly from the Congo and Ghana – to stand at 2.18 mb/d. Other Asia’s oil supply will see a decline of 40 tb/d to average 3.58 mb/d, revised up by 40 tb/d following an upward revision in Indonesia. A decline of 50 tb/d is also expected for non-OPEC Middle East supply, to stand at 1.24 mb/d in 2017.
1.7
1.8
1.9
2.0
2.1
2.2
1Q 2Q 3Q 4Q
mb/d
2015 2016 (Estimate) 2017 (Forecast)
Source: OPEC Secretariat.
0.0
0.2
0.4
0.6
0.8
1.0
1.2
1Q 2Q 3Q 4Q
mb/d
2015 2016 (Estimate) 2017 (Forecast)
Source: OPEC Secretariat.
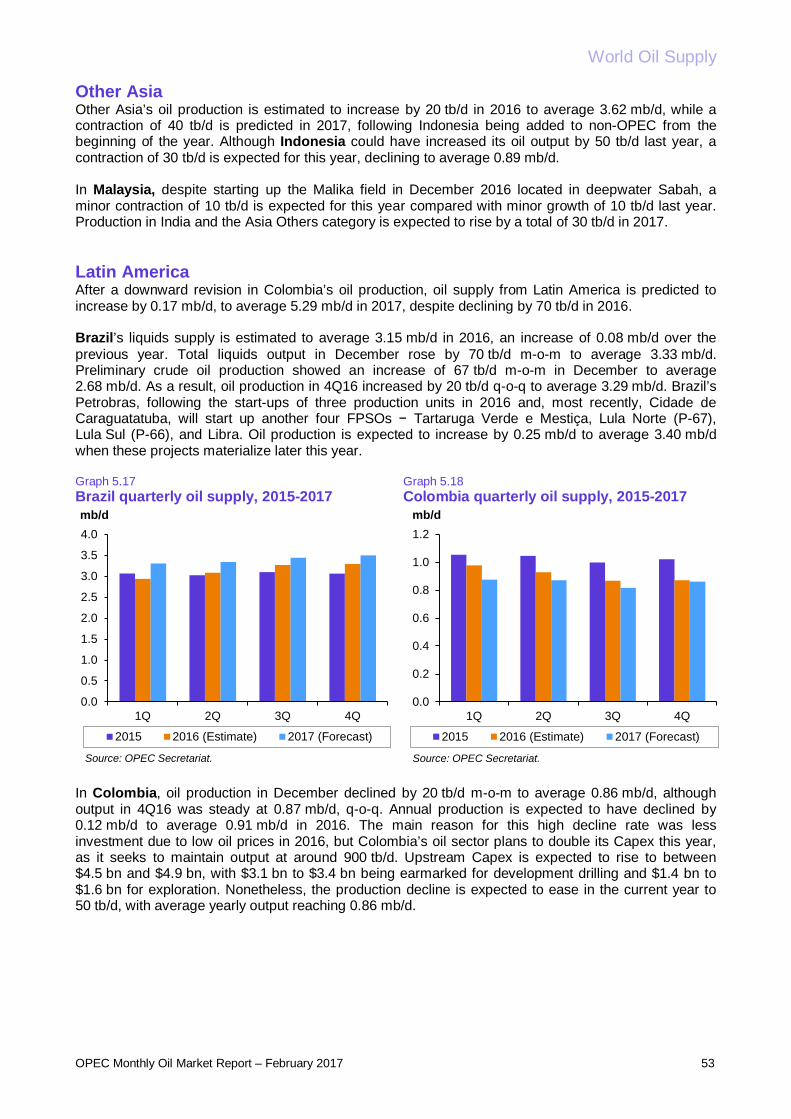
World Oil Supply
OPEC Monthly Oil Market Report – February 2017 53
Other Asia Other Asia’s oil production is estimated to increase by 20 tb/d in 2016 to average 3.62 mb/d, while a contraction of 40 tb/d is predicted in 2017, following Indonesia being added to non-OPEC from the beginning of the year. Although Indonesia could have increased its oil output by 50 tb/d last year, a contraction of 30 tb/d is expected for this year, declining to average 0.89 mb/d. In Malaysia, despite starting up the Malika field in December 2016 located in deepwater Sabah, a minor contraction of 10 tb/d is expected for this year compared with minor growth of 10 tb/d last year. Production in India and the Asia Others category is expected to rise by a total of 30 tb/d in 2017. Latin America After a downward revision in Colombia’s oil production, oil supply from Latin America is predicted to increase by 0.17 mb/d, to average 5.29 mb/d in 2017, despite declining by 70 tb/d in 2016. Brazil’s liquids supply is estimated to average 3.15 mb/d in 2016, an increase of 0.08 mb/d over the previous year. Total liquids output in December rose by 70 tb/d m-o-m to average 3.33 mb/d. Preliminary crude oil production showed an increase of 67 tb/d m-o-m in December to average 2.68 mb/d. As a result, oil production in 4Q16 increased by 20 tb/d q-o-q to average 3.29 mb/d. Brazil’s Petrobras, following the start-ups of three production units in 2016 and, most recently, Cidade de Caraguatatuba, will start up another four FPSOs − Tartaruga Verde e Mestiça, Lula Norte (P-67), Lula Sul (P-66), and Libra. Oil production is expected to increase by 0.25 mb/d to average 3.40 mb/d when these projects materialize later this year. Graph 5.17 Brazil quarterly oil supply, 2015-2017
Graph 5.18 Colombia quarterly oil supply, 2015-2017
In Colombia, oil production in December declined by 20 tb/d m-o-m to average 0.86 mb/d, although output in 4Q16 was steady at 0.87 mb/d, q-o-q. Annual production is expected to have declined by 0.12 mb/d to average 0.91 mb/d in 2016. The main reason for this high decline rate was less investment due to low oil prices in 2016, but Colombia’s oil sector plans to double its Capex this year, as it seeks to maintain output at around 900 tb/d. Upstream Capex is expected to rise to between $4.5 bn and $4.9 bn, with $3.1 bn to $3.4 bn being earmarked for development drilling and $1.4 bn to $1.6 bn for exploration. Nonetheless, the production decline is expected to ease in the current year to 50 tb/d, with average yearly output reaching 0.86 mb/d.
0.0
0.5
1.0
1.5
2.0
2.5
3.0
3.5
4.0
1Q 2Q 3Q 4Q
mb/d
2015 2016 (Estimate) 2017 (Forecast)
Source: OPEC Secretariat.
0.0
0.2
0.4
0.6
0.8
1.0
1.2
1Q 2Q 3Q 4Q
mb/d
2015 2016 (Estimate) 2017 (Forecast)
Source: OPEC Secretariat.

World Oil Supply
54 OPEC Monthly Oil Market Report – February 2017
Middle East In 2017, oil output from Oman is expected to decline by 40 tb/d to average 0.96 mb/d following the announced production adjustments, with half of this coming from annual decline. Bahrain has also decided to adjust its oil production this year by 20 tb/d. Middle East oil production will decline in 2017 by 50 tb/d to average 1.24 mb/d, remaining unchanged from January’s MOMR. The main non-OPEC oil producers in the Middle East – Oman, Bahrain, Syria and Yemen – produced 1.28 mb/d in 2016, indicating growth of 10 tb/d. Africa Oil output in Africa is estimated to decline by 20 tb/d in 2016, remaining unchanged from last month’s report to average 2.11 mb/d. Most African countries saw an oil production decline or stagnant output y–o-y in 2016 except Congo, which had growth from its new Moho Marine Nord project. In 2017, oil production will continue to grow by 30 tb/d in Congo as well as in South Africa, Ghana and Chad. Declines are seen coming from Sudan, South Sudan and Equatorial Guinea. For the region, growth is expected at 70 tb/d, to average 2.18 mb/d. FSU, other regions FSU’s oil supply is expected to grow by 0.18 mb/d in 2016 to average 13.88 mb/d, following an upward revision of 10 tb/d. In 2016, oil production increased in Russia, while declining in Kazakhstan, Azerbaijan and FSU Others. The oil production forecast for 2017 was revised down this month by 30 tb/d to now show growth of 0.04 mb/d for a total of 13.92 mb/d. Downward revisions were seen in Russia’s production in line with its announced production adjustments. Graph 5.19 FSU quarterly oil supply, 2015-2017
Graph 5.20 Russia quarterly oil supply, 2015-2017
Russia Russia’s oil production declined by 120 tb/d in January 2017 to average 11.19 mb/d. Output in 4Q16 was 0.4 mb/d higher y-o-y. Russian oil output is estimated to have increased by 0.25 mb/d to average 11.08 mb/d in 2016, following an upward revision of 20 tb/d. Russia’s oil supply for 2017 was revised down by 30 tb/d this month to now show a contraction of 60 tb/d to average 11.03 mb/d. Following the completion of three horizontal side tracked wells in the Vladimir Filanovsky field in the Russian sector of the Caspian Sea, cumulative production has reached 7.15 million barrels, and construction of a fourth well is under way. In another project, Gazpromneft Shelf has started two new production wells at the Prirazlomnoye field offshore northern Russia. Six production wells, two injection wells and one absorption well are currently in operation at the Prirazlomnaya platform. The total length of the two wells is more than 8 kilometres (5 miles), and one is equipped with a domestically-produced electronic submersible pump.
13.313.413.513.613.713.813.914.014.114.2
1Q 2Q 3Q 4Q
mb/d
2015 2016 (Estimate) 2017 (Forecast)
Source: OPEC Secretariat.
10.510.610.710.810.911.011.111.211.311.4
1Q 2Q 3Q 4Q
mb/d
2015 2016 (Estimate) 2017 (Forecast)
Source: OPEC Secretariat.
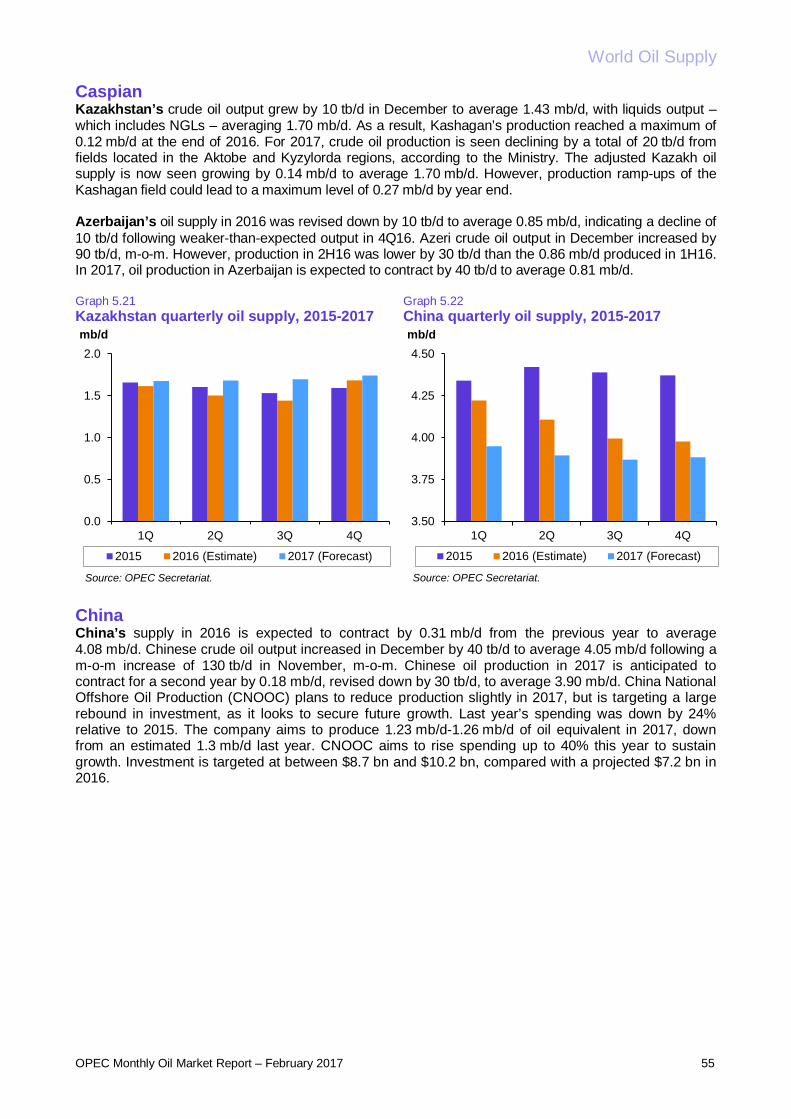
World Oil Supply
OPEC Monthly Oil Market Report – February 2017 55
Caspian Kazakhstan’s crude oil output grew by 10 tb/d in December to average 1.43 mb/d, with liquids output – which includes NGLs – averaging 1.70 mb/d. As a result, Kashagan’s production reached a maximum of 0.12 mb/d at the end of 2016. For 2017, crude oil production is seen declining by a total of 20 tb/d from fields located in the Aktobe and Kyzylorda regions, according to the Ministry. The adjusted Kazakh oil supply is now seen growing by 0.14 mb/d to average 1.70 mb/d. However, production ramp-ups of the Kashagan field could lead to a maximum level of 0.27 mb/d by year end. Azerbaijan’s oil supply in 2016 was revised down by 10 tb/d to average 0.85 mb/d, indicating a decline of 10 tb/d following weaker-than-expected output in 4Q16. Azeri crude oil output in December increased by 90 tb/d, m-o-m. However, production in 2H16 was lower by 30 tb/d than the 0.86 mb/d produced in 1H16. In 2017, oil production in Azerbaijan is expected to contract by 40 tb/d to average 0.81 mb/d. Graph 5.21 Kazakhstan quarterly oil supply, 2015-2017
Graph 5.22 China quarterly oil supply, 2015-2017
China China’s supply in 2016 is expected to contract by 0.31 mb/d from the previous year to average 4.08 mb/d. Chinese crude oil output increased in December by 40 tb/d to average 4.05 mb/d following a m-o-m increase of 130 tb/d in November, m-o-m. Chinese oil production in 2017 is anticipated to contract for a second year by 0.18 mb/d, revised down by 30 tb/d, to average 3.90 mb/d. China National Offshore Oil Production (CNOOC) plans to reduce production slightly in 2017, but is targeting a large rebound in investment, as it looks to secure future growth. Last year’s spending was down by 24% relative to 2015. The company aims to produce 1.23 mb/d-1.26 mb/d of oil equivalent in 2017, down from an estimated 1.3 mb/d last year. CNOOC aims to rise spending up to 40% this year to sustain growth. Investment is targeted at between $8.7 bn and $10.2 bn, compared with a projected $7.2 bn in 2016.
0.0
0.5
1.0
1.5
2.0
1Q 2Q 3Q 4Q
mb/d
2015 2016 (Estimate) 2017 (Forecast)
Source: OPEC Secretariat.
3.50
3.75
4.00
4.25
4.50
1Q 2Q 3Q 4Q
mb/d
2015 2016 (Estimate) 2017 (Forecast)
Source: OPEC Secretariat.
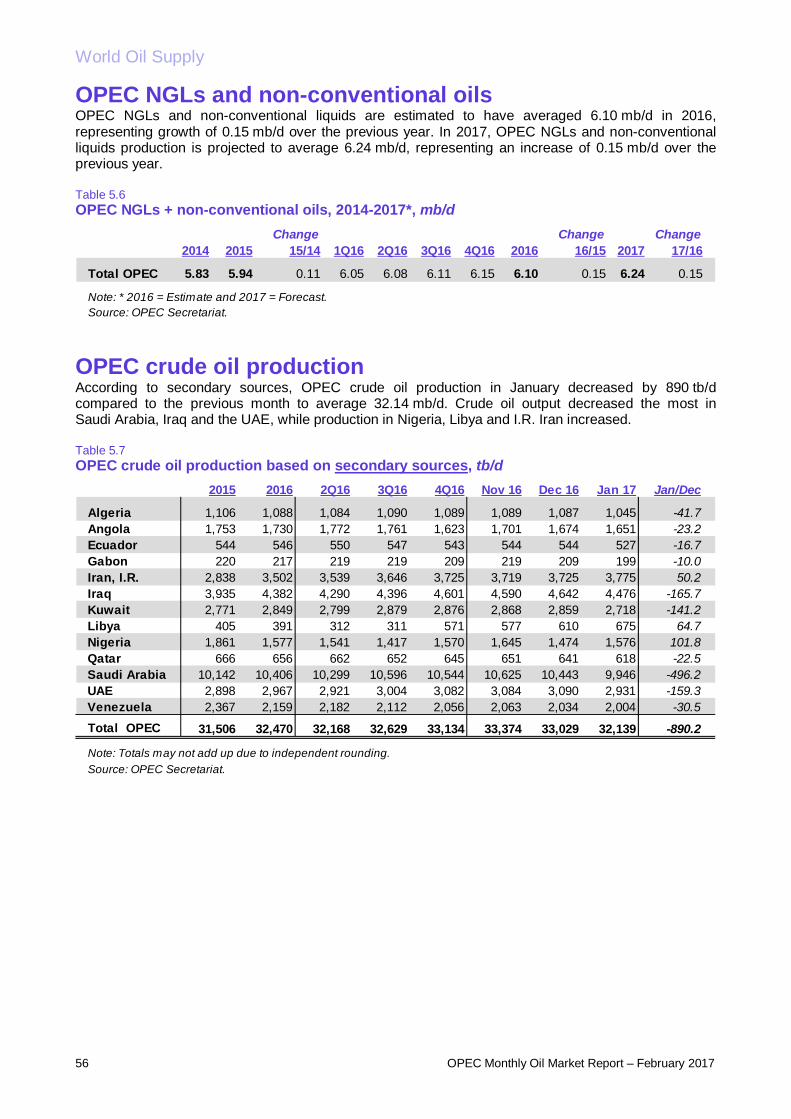
World Oil Supply
56 OPEC Monthly Oil Market Report – February 2017
OPEC NGLs and non-conventional oils OPEC NGLs and non-conventional liquids are estimated to have averaged 6.10 mb/d in 2016, representing growth of 0.15 mb/d over the previous year. In 2017, OPEC NGLs and non-conventional liquids production is projected to average 6.24 mb/d, representing an increase of 0.15 mb/d over the previous year. Table 5.6 OPEC NGLs + non-conventional oils, 2014-2017*, mb/d
OPEC crude oil production According to secondary sources, OPEC crude oil production in January decreased by 890 tb/d compared to the previous month to average 32.14 mb/d. Crude oil output decreased the most in Saudi Arabia, Iraq and the UAE, while production in Nigeria, Libya and I.R. Iran increased. Table 5.7 OPEC crude oil production based on secondary sources, tb/d
Change Change Change2014 2015 15/14 1Q16 2Q16 3Q16 4Q16 2016 16/15 2017 17/16
Total OPEC 5.83 5.94 0.11 6.05 6.08 6.11 6.15 6.10 0.15 6.24 0.15
Note: * 2016 = Estimate and 2017 = Forecast.Source: OPEC Secretariat.
2015 2016 2Q16 3Q16 4Q16 Nov 16 Dec 16 Jan 17 Jan/Dec
Algeria 1,106 1,088 1,084 1,090 1,089 1,089 1,087 1,045 -41.7Angola 1,753 1,730 1,772 1,761 1,623 1,701 1,674 1,651 -23.2Ecuador 544 546 550 547 543 544 544 527 -16.7Gabon 220 217 219 219 209 219 209 199 -10.0Iran, I.R. 2,838 3,502 3,539 3,646 3,725 3,719 3,725 3,775 50.2Iraq 3,935 4,382 4,290 4,396 4,601 4,590 4,642 4,476 -165.7Kuwait 2,771 2,849 2,799 2,879 2,876 2,868 2,859 2,718 -141.2Libya 405 391 312 311 571 577 610 675 64.7Nigeria 1,861 1,577 1,541 1,417 1,570 1,645 1,474 1,576 101.8Qatar 666 656 662 652 645 651 641 618 -22.5Saudi Arabia 10,142 10,406 10,299 10,596 10,544 10,625 10,443 9,946 -496.2UAE 2,898 2,967 2,921 3,004 3,082 3,084 3,090 2,931 -159.3Venezuela 2,367 2,159 2,182 2,112 2,056 2,063 2,034 2,004 -30.5
Total OPEC 31,506 32,470 32,168 32,629 33,134 33,374 33,029 32,139 -890.2
Note: Totals may not add up due to independent rounding.Source: OPEC Secretariat.
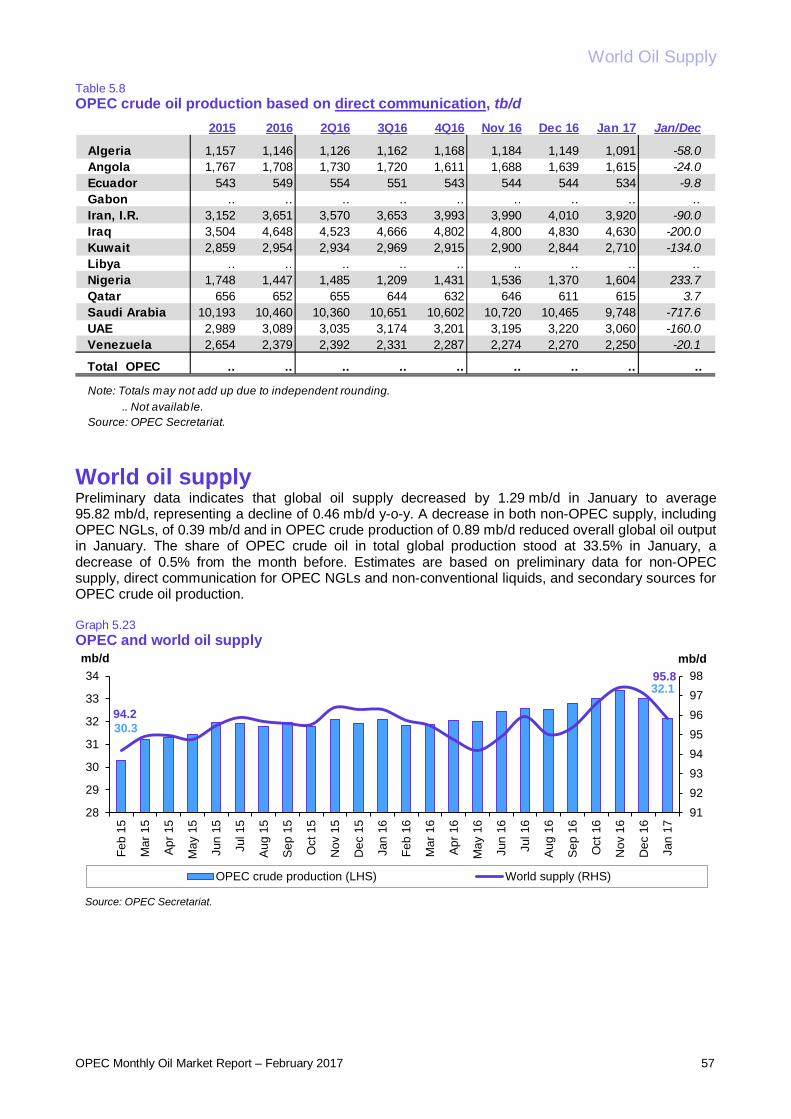
World Oil Supply
OPEC Monthly Oil Market Report – February 2017 57
Table 5.8 OPEC crude oil production based on direct communication, tb/d
World oil supply Preliminary data indicates that global oil supply decreased by 1.29 mb/d in January to average 95.82 mb/d, representing a decline of 0.46 mb/d y-o-y. A decrease in both non-OPEC supply, including OPEC NGLs, of 0.39 mb/d and in OPEC crude production of 0.89 mb/d reduced overall global oil output in January. The share of OPEC crude oil in total global production stood at 33.5% in January, a decrease of 0.5% from the month before. Estimates are based on preliminary data for non-OPEC supply, direct communication for OPEC NGLs and non-conventional liquids, and secondary sources for OPEC crude oil production. Graph 5.23 OPEC and world oil supply
2015 2016 2Q16 3Q16 4Q16 Nov 16 Dec 16 Jan 17 Jan/Dec
Algeria 1,157 1,146 1,126 1,162 1,168 1,184 1,149 1,091 -58.0Angola 1,767 1,708 1,730 1,720 1,611 1,688 1,639 1,615 -24.0Ecuador 543 549 554 551 543 544 544 534 -9.8Gabon .. .. .. .. .. .. .. .. ..Iran, I.R. 3,152 3,651 3,570 3,653 3,993 3,990 4,010 3,920 -90.0Iraq 3,504 4,648 4,523 4,666 4,802 4,800 4,830 4,630 -200.0Kuwait 2,859 2,954 2,934 2,969 2,915 2,900 2,844 2,710 -134.0Libya .. .. .. .. .. .. .. .. ..Nigeria 1,748 1,447 1,485 1,209 1,431 1,536 1,370 1,604 233.7Qatar 656 652 655 644 632 646 611 615 3.7Saudi Arabia 10,193 10,460 10,360 10,651 10,602 10,720 10,465 9,748 -717.6UAE 2,989 3,089 3,035 3,174 3,201 3,195 3,220 3,060 -160.0Venezuela 2,654 2,379 2,392 2,331 2,287 2,274 2,270 2,250 -20.1
Total OPEC .. .. .. .. .. .. .. .. ..
Note: Totals may not add up due to independent rounding. .. Not availab le.Source: OPEC Secretariat.
30.3
32.1
94.2
95.8
9192939495969798
28
29
30
31
32
33
34
Feb
15
Mar
15
Apr
15
May
15
Jun
15
Jul 1
5
Aug
15
Sep
15
Oct
15
Nov
15
Dec
15
Jan
16
Feb
16
Mar
16
Apr
16
May
16
Jun
16
Jul 1
6
Aug
16
Sep
16
Oct
16
Nov
16
Dec
16
Jan
17mb/dmb/d
OPEC crude production (LHS) World supply (RHS)
Source: OPEC Secretariat.

Product Markets and Refinery Operations
58 OPEC Monthly Oil Market Report – February 2017
Product Markets and Refinery Operations
Product markets in the Atlantic Basin received support in January from the top of the barrel on the back of higher export opportunities in gasoline and naphtha. This, along with the positive performance at the bottom of the barrel, allowed refinery margins to remain healthy. Meanwhile, margins in Asia strengthened on the back of firm regional demand.
Table 6.1 Refinery margins
Higher export opportunities at the top of the barrel continued to lend support to the US products market, despite weak seasonal domestic gasoline demand and the continued rise in inventories. In addition, colder weather in the Northeast boosted heating fuel demand. This positive performance, along with the tightening seen at the bottom of the barrel, allowed US Gulf Coast (USGC) refinery margins for WTI crude to continue at the healthy levels gained in the previous month, remaining around $8/b during January. The European products market recovered in January supported by stronger domestic demand amid export opportunities for gasoline to West Africa, and higher arbitrage volumes of naphtha and fuel oil to Asia. Meanwhile, at the middle of the barrel, despite the colder weather, gasoil crack spreads remained under pressure by increasing inventories in the Amsterdam-Rotterdam-Antwerp (ARA) region and expectations of higher inflows into the region. The refinery margin for Brent crude in Northwest Europe (NWE) showed a recovery of almost $1 versus the previous month to average $6.50/b during January. Asian product markets continued to be supported by strong seasonal demand in January, which, along with some tightening sentiment fuelled by some refinery outages, allowed margins to strengthen. The best performance was exhibited by the top of the barrel on the back of stronger gasoline and naphtha demand. Refinery margins in Singapore averaged around $9/b in January, gaining more than $1 versus the previous month’s level.
02468101214
02468
101214
Jan
16
Feb
16
Mar
16
Apr
16
May
16
Jun
16
Jul 1
6
Aug
16
Sep
16
Oct
16
Nov
16
Dec
16
Jan
17
US$/bUS$/b
WTI (US Gulf) Brent (Rotterdam) Oman (Singapore)
Sources: Argus Media and OPEC Secretariat.
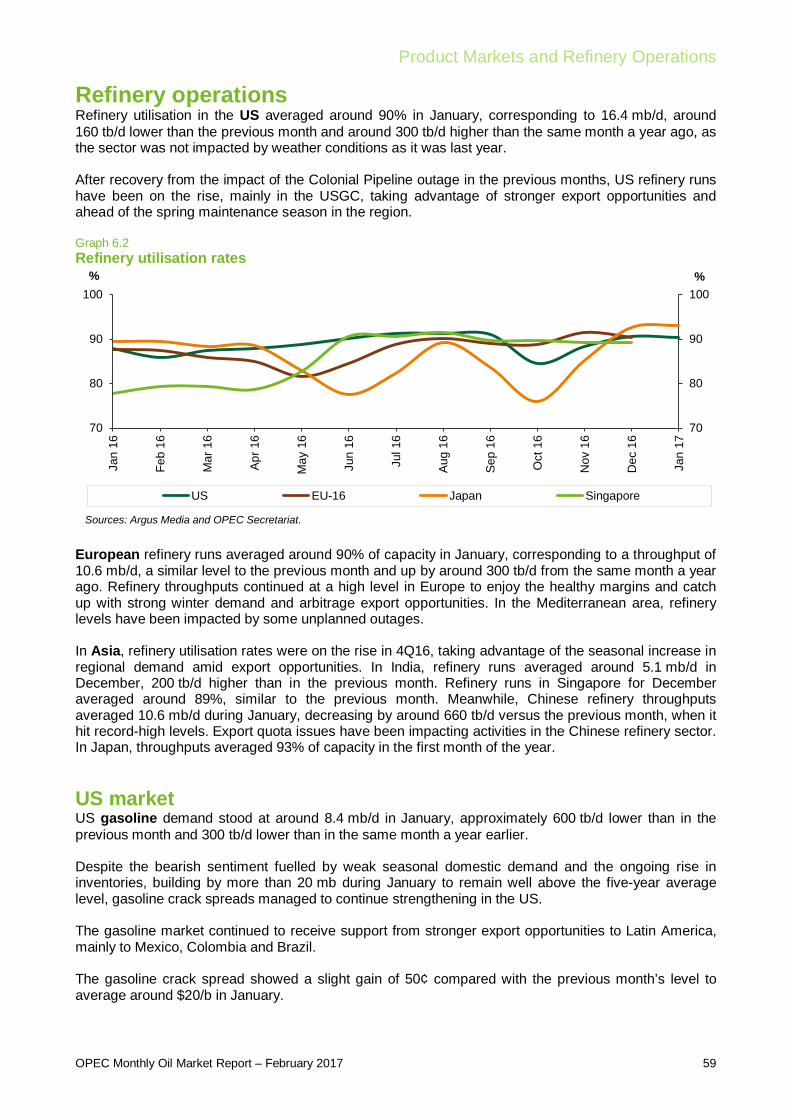
Product Markets and Refinery Operations
OPEC Monthly Oil Market Report – February 2017 59
Refinery operations Refinery utilisation in the US averaged around 90% in January, corresponding to 16.4 mb/d, around 160 tb/d lower than the previous month and around 300 tb/d higher than the same month a year ago, as the sector was not impacted by weather conditions as it was last year. After recovery from the impact of the Colonial Pipeline outage in the previous months, US refinery runs have been on the rise, mainly in the USGC, taking advantage of stronger export opportunities and ahead of the spring maintenance season in the region. Graph 6.2 Refinery utilisation rates
European refinery runs averaged around 90% of capacity in January, corresponding to a throughput of 10.6 mb/d, a similar level to the previous month and up by around 300 tb/d from the same month a year ago. Refinery throughputs continued at a high level in Europe to enjoy the healthy margins and catch up with strong winter demand and arbitrage export opportunities. In the Mediterranean area, refinery levels have been impacted by some unplanned outages. In Asia, refinery utilisation rates were on the rise in 4Q16, taking advantage of the seasonal increase in regional demand amid export opportunities. In India, refinery runs averaged around 5.1 mb/d in December, 200 tb/d higher than in the previous month. Refinery runs in Singapore for December averaged around 89%, similar to the previous month. Meanwhile, Chinese refinery throughputs averaged 10.6 mb/d during January, decreasing by around 660 tb/d versus the previous month, when it hit record-high levels. Export quota issues have been impacting activities in the Chinese refinery sector. In Japan, throughputs averaged 93% of capacity in the first month of the year. US market US gasoline demand stood at around 8.4 mb/d in January, approximately 600 tb/d lower than in the previous month and 300 tb/d lower than in the same month a year earlier. Despite the bearish sentiment fuelled by weak seasonal domestic demand and the ongoing rise in inventories, building by more than 20 mb during January to remain well above the five-year average level, gasoline crack spreads managed to continue strengthening in the US. The gasoline market continued to receive support from stronger export opportunities to Latin America, mainly to Mexico, Colombia and Brazil. The gasoline crack spread showed a slight gain of 50¢ compared with the previous month’s level to average around $20/b in January.
70
80
90
100
70
80
90
100
Jan
16
Feb
16
Mar
16
Apr
16
May
16
Jun
16
Jul 1
6
Aug
16
Sep
16
Oct
16
Nov
16
Dec
16
Jan
17
%%
US EU-16 Japan Singapore
Sources: Argus Media and OPEC Secretariat.

Product Markets and Refinery Operations
60 OPEC Monthly Oil Market Report – February 2017
Graph 6.3 US Gulf crack spread vs. WTI
Middle distillate demand stood at around 3.7 mb/d in January, which is 100 tb/d lower than in the previous month and around 80 tb/d lower than the same month a year earlier. The middle distillate market continued to see support from higher export opportunities to Europe, as well as to Latin American countries such as Brazil and Mexico. Additional support came from news of a temporary shortage of high sulphur heating oil in the northeast region as colder weather boosted demand for heating fuel, which has also caused a narrowing of sulphur spreads worldwide. The USGC gasoil crack spread averaged around $10/b in January, gaining more than $1 from the previous month’s level. Further gains were limited, due to the fact that middle distillate inventories continued to rise during January. At the bottom of the barrel, fuel oil margins continued strengthening as the market continued to be supported by healthy demand in the USGC amid tightening regional market. Higher arbitrage volumes to Singapore were reported, thus lending support to the US fuel oil market. The USGC high sulphur fuel oil (HSFO) crack spread gained slightly, rising by 30¢ to average minus $6/b in January. European market Product markets in Europe recovered during January, supported by export opportunities for gasoline to West Africa, and arbitrage volumes of naphtha and fuel oil to Asia. The gasoline market strengthened in Europe on the back of stronger regional demand amid higher export opportunities to the West African market. The gasoline market was also supported by some blending components being exported to Singapore and China, taking advantage of new stringent specifications in that region. The gasoline crack spread against Brent gained more than $1 over the previous month’s level to average around $19/b during January. Additional gains were capped by water levels in the lower Rhine, which limited barge activities amid ARA gasoline inventories increasing almost 10% in January.
-20
-10
0
10
20
30
-20
-10
0
10
20
30
Jan
16
Feb
16
Mar
16
Apr
16
May
16
Jun
16
Jul 1
6
Aug
16
Sep
16
Oct
16
Nov
16
Dec
16
Jan
17
Feb
17
US$/bUS$/b
Premium gasoline Jet/Kerosene Diesel Fuel oil
Sources: Argus Media and OPEC Secretariat.
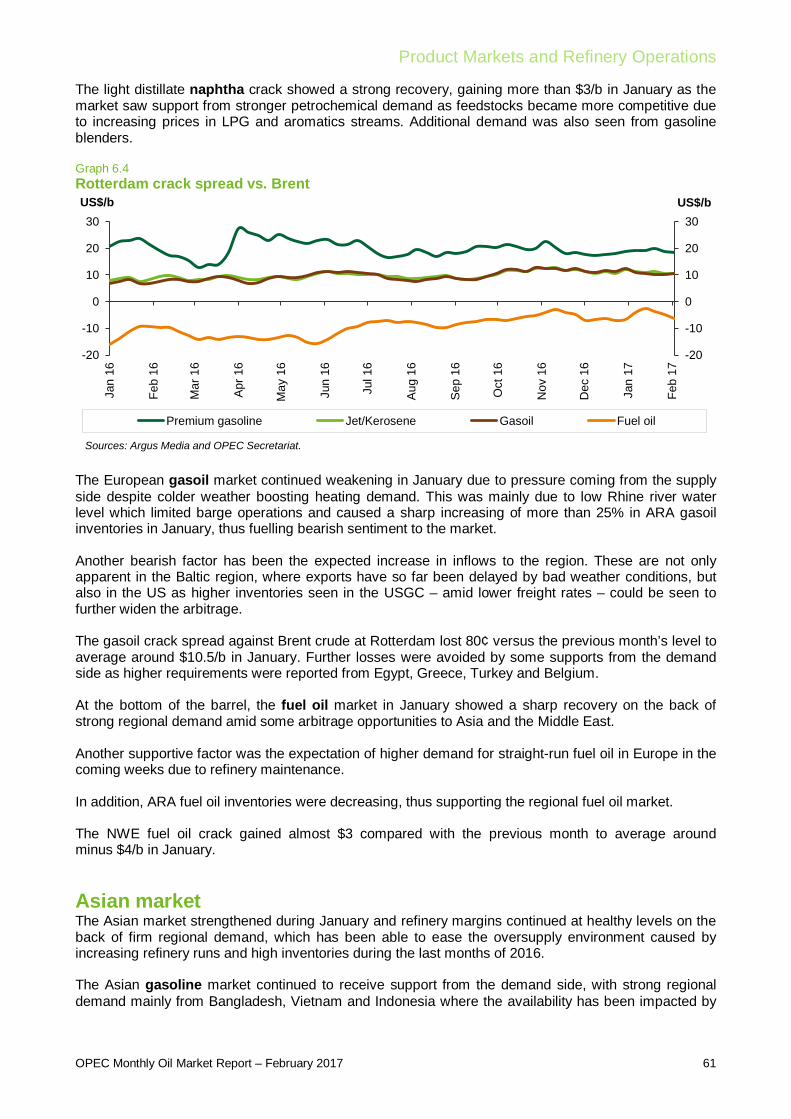
Product Markets and Refinery Operations
OPEC Monthly Oil Market Report – February 2017 61
The light distillate naphtha crack showed a strong recovery, gaining more than $3/b in January as the market saw support from stronger petrochemical demand as feedstocks became more competitive due to increasing prices in LPG and aromatics streams. Additional demand was also seen from gasoline blenders. Graph 6.4 Rotterdam crack spread vs. Brent
The European gasoil market continued weakening in January due to pressure coming from the supply side despite colder weather boosting heating demand. This was mainly due to low Rhine river water level which limited barge operations and caused a sharp increasing of more than 25% in ARA gasoil inventories in January, thus fuelling bearish sentiment to the market. Another bearish factor has been the expected increase in inflows to the region. These are not only apparent in the Baltic region, where exports have so far been delayed by bad weather conditions, but also in the US as higher inventories seen in the USGC – amid lower freight rates – could be seen to further widen the arbitrage. The gasoil crack spread against Brent crude at Rotterdam lost 80¢ versus the previous month’s level to average around $10.5/b in January. Further losses were avoided by some supports from the demand side as higher requirements were reported from Egypt, Greece, Turkey and Belgium. At the bottom of the barrel, the fuel oil market in January showed a sharp recovery on the back of strong regional demand amid some arbitrage opportunities to Asia and the Middle East. Another supportive factor was the expectation of higher demand for straight-run fuel oil in Europe in the coming weeks due to refinery maintenance. In addition, ARA fuel oil inventories were decreasing, thus supporting the regional fuel oil market. The NWE fuel oil crack gained almost $3 compared with the previous month to average around minus $4/b in January. Asian market The Asian market strengthened during January and refinery margins continued at healthy levels on the back of firm regional demand, which has been able to ease the oversupply environment caused by increasing refinery runs and high inventories during the last months of 2016.
The Asian gasoline market continued to receive support from the demand side, with strong regional demand mainly from Bangladesh, Vietnam and Indonesia where the availability has been impacted by
-20
-10
0
10
20
30
-20
-10
0
10
20
30
Jan
16
Feb
16
Mar
16
Apr
16
May
16
Jun
16
Jul 1
6
Aug
16
Sep
16
Oct
16
Nov
16
Dec
16
Jan
17
Feb
17
US$/bUS$/b
Premium gasoline Jet/Kerosene Gasoil Fuel oil
Sources: Argus Media and OPEC Secretariat.
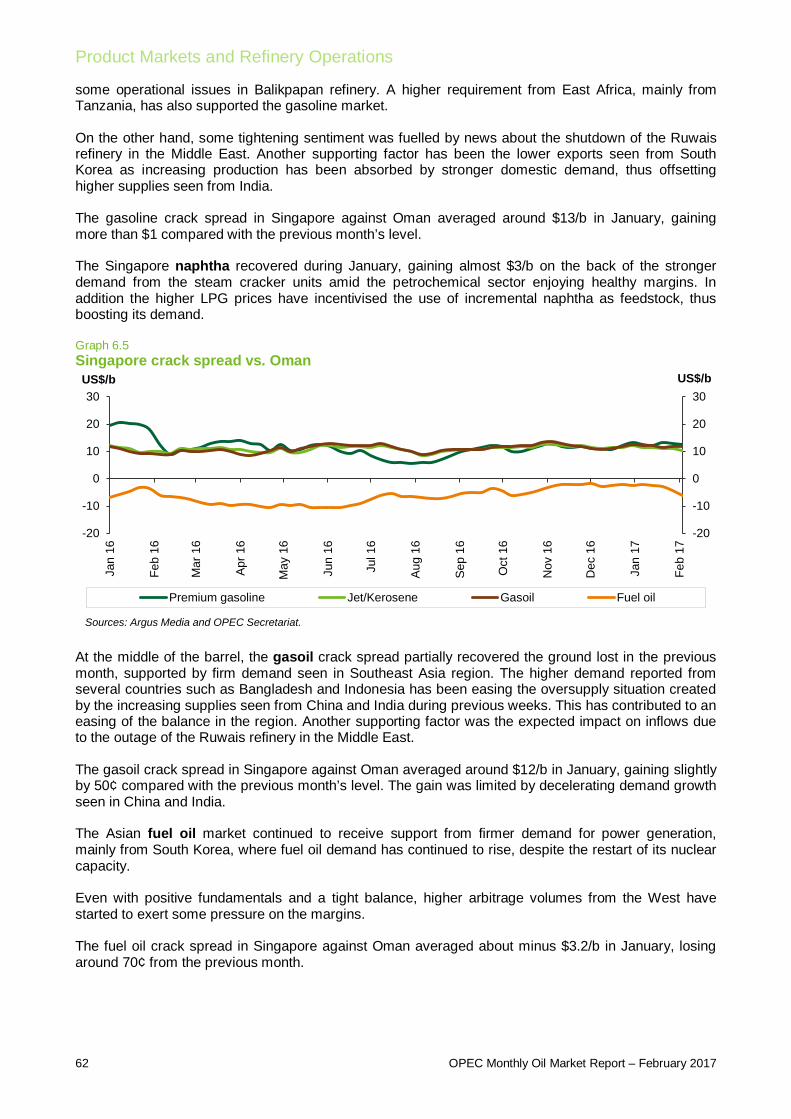
Product Markets and Refinery Operations
62 OPEC Monthly Oil Market Report – February 2017
some operational issues in Balikpapan refinery. A higher requirement from East Africa, mainly from Tanzania, has also supported the gasoline market. On the other hand, some tightening sentiment was fuelled by news about the shutdown of the Ruwais refinery in the Middle East. Another supporting factor has been the lower exports seen from South Korea as increasing production has been absorbed by stronger domestic demand, thus offsetting higher supplies seen from India. The gasoline crack spread in Singapore against Oman averaged around $13/b in January, gaining more than $1 compared with the previous month’s level. The Singapore naphtha recovered during January, gaining almost $3/b on the back of the stronger demand from the steam cracker units amid the petrochemical sector enjoying healthy margins. In addition the higher LPG prices have incentivised the use of incremental naphtha as feedstock, thus boosting its demand. Graph 6.5 Singapore crack spread vs. Oman
At the middle of the barrel, the gasoil crack spread partially recovered the ground lost in the previous month, supported by firm demand seen in Southeast Asia region. The higher demand reported from several countries such as Bangladesh and Indonesia has been easing the oversupply situation created by the increasing supplies seen from China and India during previous weeks. This has contributed to an easing of the balance in the region. Another supporting factor was the expected impact on inflows due to the outage of the Ruwais refinery in the Middle East. The gasoil crack spread in Singapore against Oman averaged around $12/b in January, gaining slightly by 50¢ compared with the previous month’s level. The gain was limited by decelerating demand growth seen in China and India. The Asian fuel oil market continued to receive support from firmer demand for power generation, mainly from South Korea, where fuel oil demand has continued to rise, despite the restart of its nuclear capacity. Even with positive fundamentals and a tight balance, higher arbitrage volumes from the West have started to exert some pressure on the margins. The fuel oil crack spread in Singapore against Oman averaged about minus $3.2/b in January, losing around 70¢ from the previous month.
-20
-10
0
10
20
30
-20
-10
0
10
20
30
Jan
16
Feb
16
Mar
16
Apr
16
May
16
Jun
16
Jul 1
6
Aug
16
Sep
16
Oct
16
Nov
16
Dec
16
Jan
17
Feb
17
US$/bUS$/b
Premium gasoline Jet/Kerosene Gasoil Fuel oil
Sources: Argus Media and OPEC Secretariat.
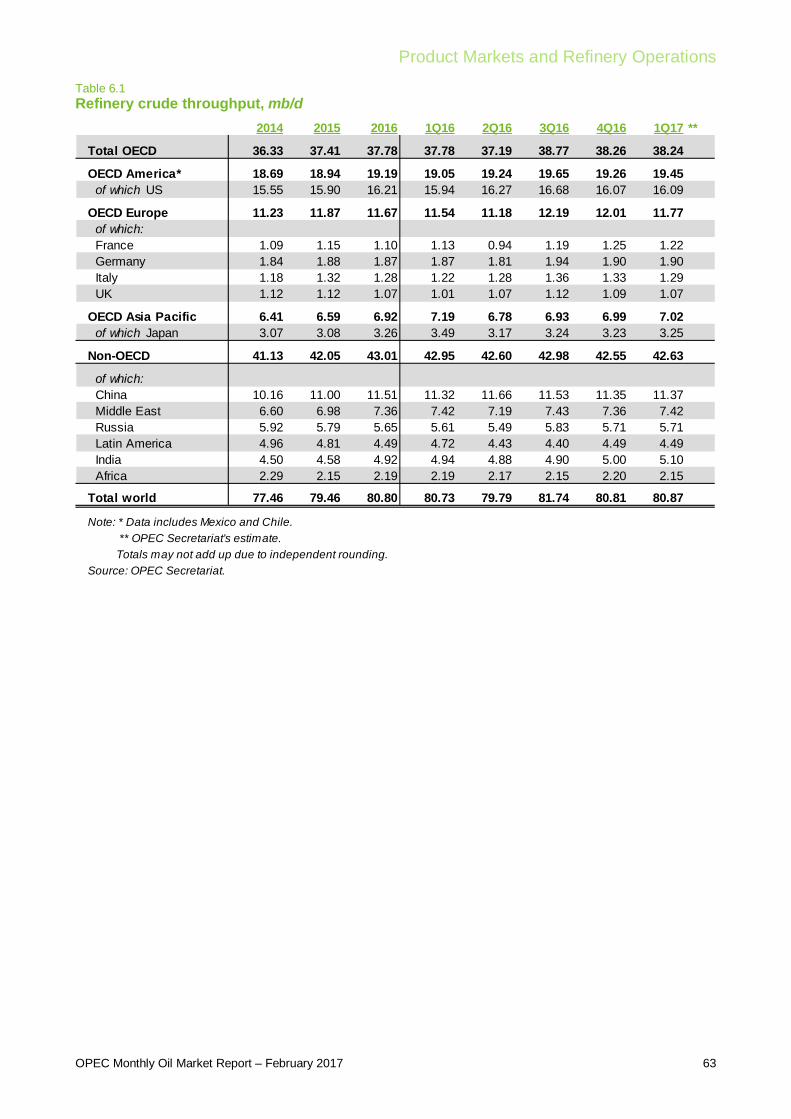
Product Markets and Refinery Operations
OPEC Monthly Oil Market Report – February 2017 63
Table 6.1 Refinery crude throughput, mb/d
2014 2015 2016 1Q16 2Q16 3Q16 4Q16 1Q17 **
Total OECD 36.33 37.41 37.78 37.78 37.19 38.77 38.26 38.24
OECD America* 18.69 18.94 19.19 19.05 19.24 19.65 19.26 19.45 of which US 15.55 15.90 16.21 15.94 16.27 16.68 16.07 16.09
OECD Europe 11.23 11.87 11.67 11.54 11.18 12.19 12.01 11.77 of which: France 1.09 1.15 1.10 1.13 0.94 1.19 1.25 1.22 Germany 1.84 1.88 1.87 1.87 1.81 1.94 1.90 1.90 Italy 1.18 1.32 1.28 1.22 1.28 1.36 1.33 1.29 UK 1.12 1.12 1.07 1.01 1.07 1.12 1.09 1.07
OECD Asia Pacific 6.41 6.59 6.92 7.19 6.78 6.93 6.99 7.02 of which Japan 3.07 3.08 3.26 3.49 3.17 3.24 3.23 3.25
Non-OECD 41.13 42.05 43.01 42.95 42.60 42.98 42.55 42.63
of which: China 10.16 11.00 11.51 11.32 11.66 11.53 11.35 11.37 Middle East 6.60 6.98 7.36 7.42 7.19 7.43 7.36 7.42 Russia 5.92 5.79 5.65 5.61 5.49 5.83 5.71 5.71 Latin America 4.96 4.81 4.49 4.72 4.43 4.40 4.49 4.49 India 4.50 4.58 4.92 4.94 4.88 4.90 5.00 5.10 Africa 2.29 2.15 2.19 2.19 2.17 2.15 2.20 2.15
Total world 77.46 79.46 80.80 80.73 79.79 81.74 80.81 80.87
Note: * Data includes Mexico and Chile. ** OPEC Secretariat's estimate. Totals may not add up due to independent rounding.Source: OPEC Secretariat.

Product Markets and Refinery Operations
64 OPEC Monthly Oil Market Report – February 2017
Table 6.2 Refined product prices, US$/b
ChangeDec 16 Jan 17 Jan/Dec 2016 2017
Naphtha* 53.74 56.90 3.16 36.87 56.90Premium gasoline (unleaded 93) 71.77 72.76 0.99 51.15 72.76Regular gasoline (unleaded 87) 66.19 67.04 0.85 43.42 67.04Jet/Kerosene 63.33 64.23 0.90 39.49 64.23Gasoil (0.2% S) 60.95 62.50 1.55 37.07 62.50Fuel oil (3.0% S) 45.46 46.76 1.30 19.12 46.76
Naphtha 50.90 55.06 4.16 35.13 55.06Premium gasoline (unleaded 98) 71.37 73.82 2.45 53.41 73.82Jet/Kerosene 64.50 65.60 1.10 39.21 65.60Gasoil/Diesel (10 ppm) 64.89 65.05 0.16 38.11 65.05Fuel oil (1.0% S) 46.70 50.60 3.90 19.85 50.60Fuel oil (3.5% S) 42.28 43.03 0.75 15.08 43.03
Naphtha 49.70 54.21 4.51 33.42 54.21Premium gasoline** 64.86 66.95 2.09 47.01 66.95Jet/Kerosene 62.61 63.81 1.20 37.27 63.81Diesel 65.41 66.54 1.12 39.48 66.54Fuel oil (1.0% S) 48.84 52.19 3.35 21.22 52.19Fuel oil (3.5% S) 44.01 45.77 1.76 18.35 45.77
Naphtha 51.51 55.71 4.20 36.78 55.71Premium gasoline (unleaded 95) 66.68 69.47 2.79 50.33 69.47Regular gasoline (unleaded 92) 64.25 66.77 2.52 47.04 66.77Jet/Kerosene 64.10 65.17 1.07 37.93 65.17Gasoil/Diesel (50 ppm) 64.09 65.90 1.81 37.37 65.90Fuel oil (180 cst 2.0% S) 51.68 55.05 3.37 26.77 55.05Fuel oil (380 cst 3.5% S) 49.47 50.47 1.00 22.77 50.47
Sources: Argus Media and OPEC Secretariat.
Year-to-date
Note: * Barges. ** Cost, insurance and freight (CIF).
US Gulf (Cargoes FOB):
Rotterdam (Barges FoB):
Mediterranean (Cargoes FOB):
Singapore (Cargoes FOB):
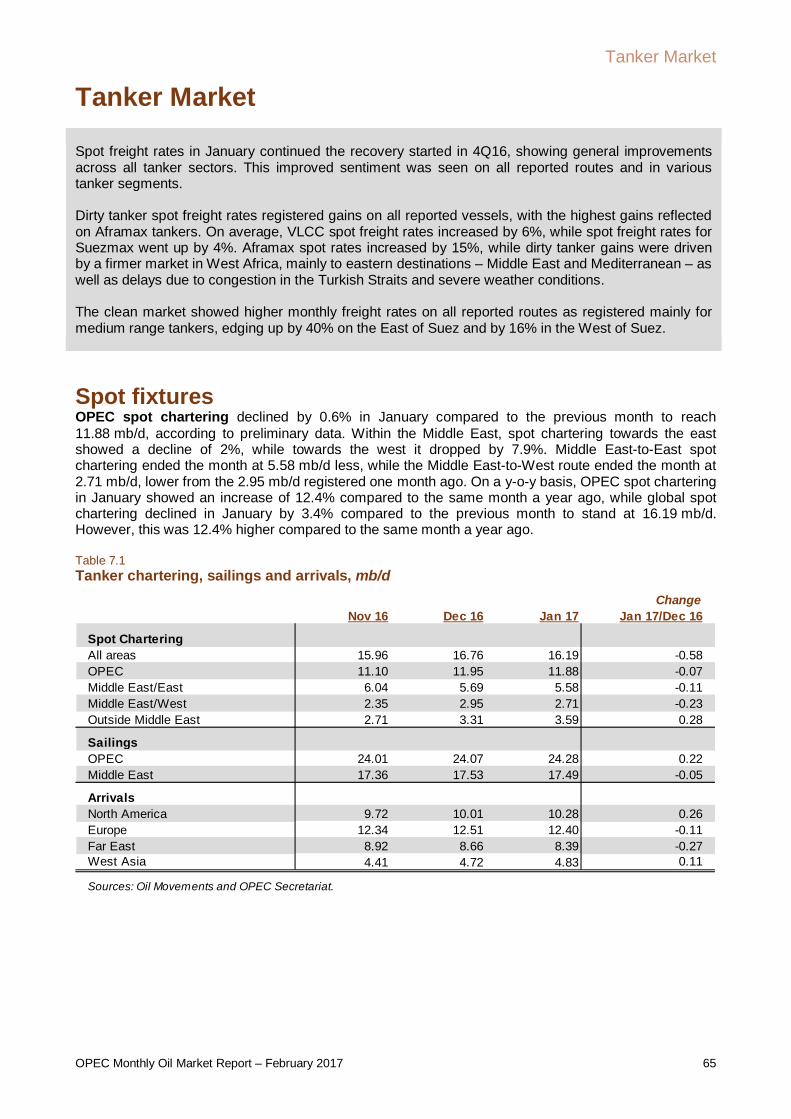
Tanker Market
OPEC Monthly Oil Market Report – February 2017 65
Tanker Market
Spot freight rates in January continued the recovery started in 4Q16, showing general improvements across all tanker sectors. This improved sentiment was seen on all reported routes and in various tanker segments. Dirty tanker spot freight rates registered gains on all reported vessels, with the highest gains reflected on Aframax tankers. On average, VLCC spot freight rates increased by 6%, while spot freight rates for Suezmax went up by 4%. Aframax spot rates increased by 15%, while dirty tanker gains were driven by a firmer market in West Africa, mainly to eastern destinations – Middle East and Mediterranean – as well as delays due to congestion in the Turkish Straits and severe weather conditions. The clean market showed higher monthly freight rates on all reported routes as registered mainly for medium range tankers, edging up by 40% on the East of Suez and by 16% in the West of Suez.
Spot fixtures OPEC spot chartering declined by 0.6% in January compared to the previous month to reach 11.88 mb/d, according to preliminary data. Within the Middle East, spot chartering towards the east showed a decline of 2%, while towards the west it dropped by 7.9%. Middle East-to-East spot chartering ended the month at 5.58 mb/d less, while the Middle East-to-West route ended the month at 2.71 mb/d, lower from the 2.95 mb/d registered one month ago. On a y-o-y basis, OPEC spot chartering in January showed an increase of 12.4% compared to the same month a year ago, while global spot chartering declined in January by 3.4% compared to the previous month to stand at 16.19 mb/d. However, this was 12.4% higher compared to the same month a year ago. Table 7.1 Tanker chartering, sailings and arrivals, mb/d
ChangeNov 16 Dec 16 Jan 17 Jan 17/Dec 16
Spot CharteringAll areas 15.96 16.76 16.19 -0.58OPEC 11.10 11.95 11.88 -0.07Middle East/East 6.04 5.69 5.58 -0.11Middle East/West 2.35 2.95 2.71 -0.23Outside Middle East 2.71 3.31 3.59 0.28
SailingsOPEC 24.01 24.07 24.28 0.22Middle East 17.36 17.53 17.49 -0.05
ArrivalsNorth America 9.72 10.01 10.28 0.26Europe 12.34 12.51 12.40 -0.11Far East 8.92 8.66 8.39 -0.27West Asia 4.41 4.72 4.83 0.11
Sources: Oil Movements and OPEC Secretariat.
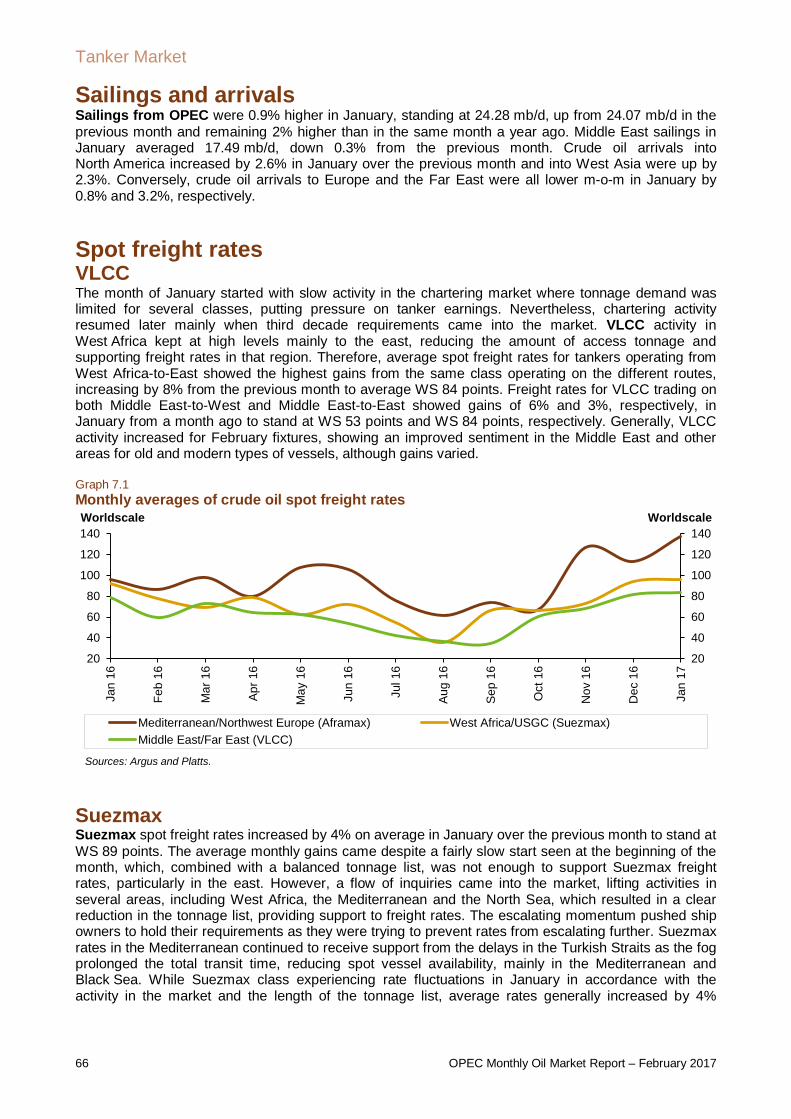
Tanker Market
66 OPEC Monthly Oil Market Report – February 2017
Sailings and arrivals Sailings from OPEC were 0.9% higher in January, standing at 24.28 mb/d, up from 24.07 mb/d in the previous month and remaining 2% higher than in the same month a year ago. Middle East sailings in January averaged 17.49 mb/d, down 0.3% from the previous month. Crude oil arrivals into North America increased by 2.6% in January over the previous month and into West Asia were up by 2.3%. Conversely, crude oil arrivals to Europe and the Far East were all lower m-o-m in January by 0.8% and 3.2%, respectively.
Spot freight rates VLCC The month of January started with slow activity in the chartering market where tonnage demand was limited for several classes, putting pressure on tanker earnings. Nevertheless, chartering activity resumed later mainly when third decade requirements came into the market. VLCC activity in West Africa kept at high levels mainly to the east, reducing the amount of access tonnage and supporting freight rates in that region. Therefore, average spot freight rates for tankers operating from West Africa-to-East showed the highest gains from the same class operating on the different routes, increasing by 8% from the previous month to average WS 84 points. Freight rates for VLCC trading on both Middle East-to-West and Middle East-to-East showed gains of 6% and 3%, respectively, in January from a month ago to stand at WS 53 points and WS 84 points, respectively. Generally, VLCC activity increased for February fixtures, showing an improved sentiment in the Middle East and other areas for old and modern types of vessels, although gains varied. Graph 7.1 Monthly averages of crude oil spot freight rates
Suezmax Suezmax spot freight rates increased by 4% on average in January over the previous month to stand at WS 89 points. The average monthly gains came despite a fairly slow start seen at the beginning of the month, which, combined with a balanced tonnage list, was not enough to support Suezmax freight rates, particularly in the east. However, a flow of inquiries came into the market, lifting activities in several areas, including West Africa, the Mediterranean and the North Sea, which resulted in a clear reduction in the tonnage list, providing support to freight rates. The escalating momentum pushed ship owners to hold their requirements as they were trying to prevent rates from escalating further. Suezmax rates in the Mediterranean continued to receive support from the delays in the Turkish Straits as the fog prolonged the total transit time, reducing spot vessel availability, mainly in the Mediterranean and Black Sea. While Suezmax class experiencing rate fluctuations in January in accordance with the activity in the market and the length of the tonnage list, average rates generally increased by 4%
20
40
60
80
100
120
140
20
40
60
80
100
120
140
Jan
16
Feb
16
Mar
16
Apr
16
May
16
Jun
16
Jul 1
6
Aug
16
Sep
16
Oct
16
Nov
16
Dec
16
Jan
17
WorldscaleWorldscale
Mediterranean/Northwest Europe (Aframax) West Africa/USGC (Suezmax)Middle East/Far East (VLCC)
Sources: Argus and Platts.

Tanker Market
OPEC Monthly Oil Market Report – February 2017 67
compared with the previous month as the rate for Suezmax operating on the West Africa-to-US route and NWE-to-US routes both increased by 2% and 7%, respectively, from a month earlier. Table 7.2 Spot tanker crude freight rates, Worldscale
Aframax Aframax spot freight rates increased in January, up by 15% from a month before, benefiting from the cold weather as higher fixtures on the ice class ships became a main requirement for loading in some ports in the Baltic Sea. Difficult weather conditions caused further delays in the Turkish Straits and in several ports, leading to a sudden jump in Aframax freight rates in the Mediterranean and Black Sea. Freight rates in the Mediterranean declined afterwards, despite continued severe weather conditions and the closure of the Turkish Straits; however, lower volumes of cargoes in the market combined with tonnage build-up, along with competition from larger vessels, to push down freight rates from the high level they reached earlier. Thus, on average, spot freight rates for tanker trading on the Mediterranean-to-Mediterranean and Mediterranean-to-NWE increased by 23% and 21%, respectively, from a month ago. In the Caribbean, Aframax spot freight rates registered a bounce of 14% from a month before for tankers operating on the Caribbean-to-US route to stand at WS 156 points. Those gains were driven by delays caused by foggy weather, as well as lighterage requirements. On the other hand, average freight rate on the Indonesia-to-East route exhibited the smallest increase amid other routes, growing by WS 1 point from a month ago.
Clean spot freight rates As seen in the dirty segment of the market, clean tanker spot freight rates shared the tanker market’s upward momentum, showing a generally improved sentiment in January from the previous month, supported mainly by winter demand and severe weather conditions. The gains in the clean tanker segment were mostly registered for medium range classes while other vessels in the product market did not share the same fortune. In the East of Suez, clean tanker spot freight rates experienced an increase of 40% compared with the previous month. Clean spot freight rates for tankers moving between the Middle East-to-East and Singapore-to-East routes increased by 40% each to stand at WS 124 points and WS 174 points, respectively. Spot freight rates for tankers operating on the NWE-to-US East Coast (USEC) route increased by 41% to average WS 171 points in January.
Size ChangeCrude 1,000 DWT Nov 16 Dec 16 Jan 17 Jan 17/Dec 16
Middle East/East 230-280 69 81 84 3Middle East/West 270-285 39 49 53 3West Africa/East 260 68 77 84 7West Africa/US Gulf Coast 130-135 73 94 96 2Northwest Europe/US Gulf Coast 130-135 64 76 81 5Indonesia/East 80-85 88 114 115 1Caribbean/US East Coast 80-85 126 137 156 19Mediterranean/Mediterranean 80-85 134 115 142 27Mediterranean/Northwest Europe 80-85 127 114 138 24
Sources: Argus Media and OPEC Secretariat.
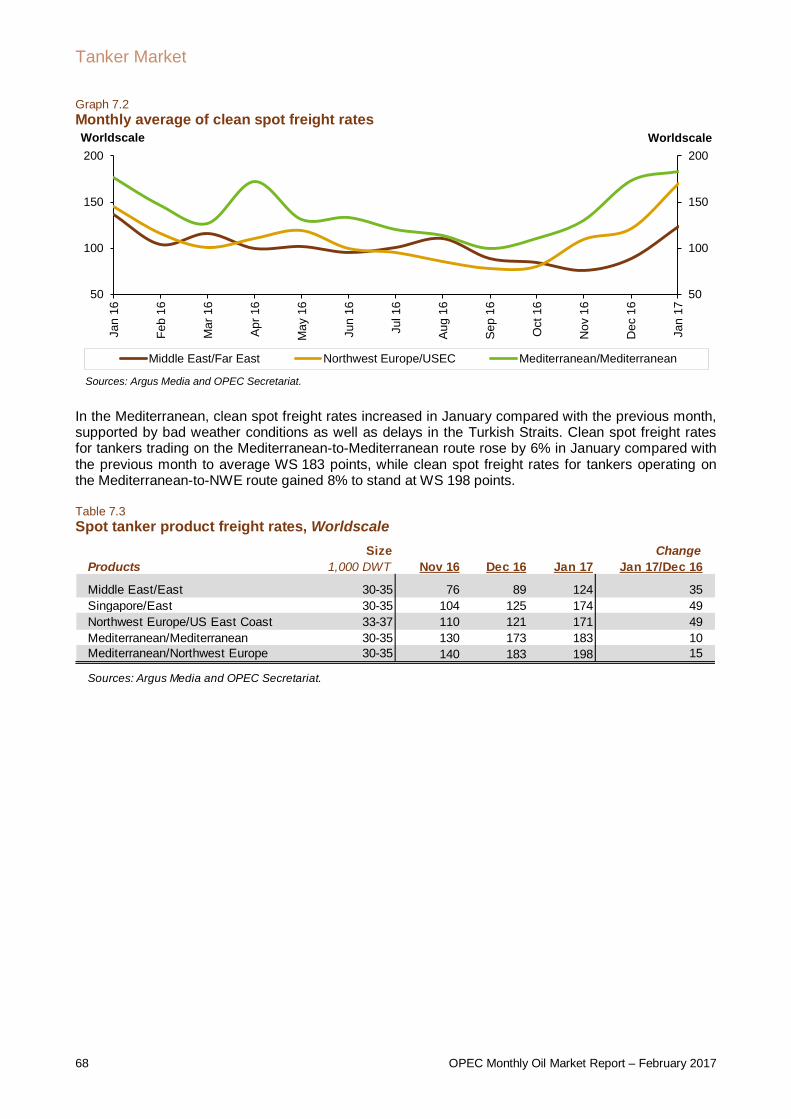
Tanker Market
68 OPEC Monthly Oil Market Report – February 2017
Graph 7.2 Monthly average of clean spot freight rates
In the Mediterranean, clean spot freight rates increased in January compared with the previous month, supported by bad weather conditions as well as delays in the Turkish Straits. Clean spot freight rates for tankers trading on the Mediterranean-to-Mediterranean route rose by 6% in January compared with the previous month to average WS 183 points, while clean spot freight rates for tankers operating on the Mediterranean-to-NWE route gained 8% to stand at WS 198 points. Table 7.3 Spot tanker product freight rates, Worldscale
50
100
150
200
50
100
150
200
Jan
16
Feb
16
Mar
16
Apr
16
May
16
Jun
16
Jul 1
6
Aug
16
Sep
16
Oct
16
Nov
16
Dec
16
Jan
17
WorldscaleWorldscale
Middle East/Far East Northwest Europe/USEC Mediterranean/Mediterranean
Sources: Argus Media and OPEC Secretariat.
Size ChangeProducts 1,000 DWT Nov 16 Dec 16 Jan 17 Jan 17/Dec 16
Middle East/East 30-35 76 89 124 35Singapore/East 30-35 104 125 174 49Northwest Europe/US East Coast 33-37 110 121 171 49Mediterranean/Mediterranean 30-35 130 173 183 10Mediterranean/Northwest Europe 30-35 140 183 198 15
Sources: Argus Media and OPEC Secretariat.

Oil Trade
OPEC Monthly Oil Market Report – February 2017 69
Oil Trade
Preliminary data for January shows that US crude oil imports increased to average 8.4 mb/d, up by 489 tb/d from the previous month and by 683 tb/d or 9% from the previous year. Similarly, US monthly product imports rose from a month ago by 268 tb/d and by 155 tb/d or 8% from the same month in the previous year. Japan’s crude imports increased by 473 tb/d or 15% y-o-y to average 3.6 mb/d. Crude imports increased from last year by 105 tb/d or 3%, while Japan’s product imports increased in December by 62 tb/d or 11% m-o-m to average 622 tb/d, although down by a slight 56 tb/d from the previous year. In December, China’s crude imports increased by 697 tb/d or 9% from the previous month to reach a peak record of 8.6 mb/d. At the same time, crude imports increased by 754 tb/d or 10% y-o-y. China’s product imports dropped in December to average 1.2 mb/d, showing a fall of just 20 tb/d from November and 190 tb/d from the same month in 2015. In December, India’s crude imports dropped by 357 tb/d or 8% from the previous month to reach 4.2 mb/d, the lowest level seen since July 2016, while annually crude imports reflected a gain of 34 tb/d or 1%. Indian product imports in December increased both on a monthly and an annual basis by 18 tb/d and 243 tb/d, respectively, to average 685 tb/d in December.
US January preliminary data shows that US crude oil imports increased to average 8.4 mb/d, up by 489 tb/d from the previous month and 683 tb/d or 9% over the previous year. Graph 8.1 US imports of crude and petroleum products
US monthly product imports also increased from a month ago by 268 tb/d and by 155 tb/d or 8% from the same month last year. In January, US product exports were 350 tb/d less than a month ago to average 4.9 mb/d. In annual terms, they were higher than a year ago by 351 tb/d or 4%.
4.5
5.5
6.5
7.5
8.5
0.00.51.01.52.02.53.0
Dec
15
Jan
16
Feb
16
Mar
16
Apr
16
May
16
Jun
16
Jul 1
6
Aug
16
Sep
16
Oct
16
Nov
16
Dec
16
mb/dmb/d
Others* Propane/propylene Gasoline Jet fuel/kerosene Fuel oil Crude (RHS)
Note: *Others: Contains natural gas liquids, liquefied refinery gases (LRG's), other liquids and all finished petroleum products exceptgasoline, jet fuel/kerosene, fuel oil and propane/propylene.Sources: US Energy Information Administration and OPEC Secretatiat.

Oil Trade
70 OPEC Monthly Oil Market Report – February 2017
Graph 8.2 US exports of crude and petroleum products
As a result, US total net imports rose in January by 450 tb/d or 9% to average 5.7 mb/d, showing an increase of 1.1 mb/d or 26% from the same month last year. Table 8.1 US crude and product net imports, tb/d
In November, the top first and second suppliers to the US maintained the same order as seen last month. Canada remained the premier crude supplier, accounting for 44% of total US crude imports, up from a month ago by 320 tb/d or 10%. Saudi Arabia maintained its position as second-largest supplier to the US in November, although with exports down from the previous month by 23 tb/d. Venezuela came in as third-top supplier, accounting for 10% of total US crude imports, as it increased its exports to the country by 73 tb/d or 10% from the previous month. Total crude imports from OPEC Member Countries were higher in November from the previous month, up by 153 tb/d or 5%, accounting for 40% of total US crude imports. US product imports from OPEC Member Countries were higher by 100 tb/d or 50% from the previous month and 31 tb/d or 11% from the previous year. Looking to product supplier share, Canada and Russia maintained their position as the first and second suppliers to the US, accounting for 22% and 19%, respectively. In November, Canada’s product exports to the US rose from the previous month by 116 tb/d, while Russia’s imports went down by 19 tb/d from a month before. Algeria came in as third supplier to the US, holding a share of 8% as it increased its exports to the country by 30 tb/d from the previous month. Looking into import regions, the largest US crude imports continued to be sourced from North America, averaging 3.6 mb/d in November. Latin America was in second place with average imports of 2.2 mb/d in November. The Middle East came in third, with an average of 1.7 mb/d, while imports from Africa increased from the previous month to average 589 tb/d. As to crude imports by PADDs, in East Coast PADD 1, the highest crude imports came from Africa and North America, averaging 4,100 tb/d and 261 tb/d, respectively. Imports from PADD 2 remained mostly sourced from North America and averaged 2.3 mb/d, showing slight imports from the Middle East.
0100200300400500600700
01,0002,0003,0004,0005,0006,000
Dec
15
Jan
16
Feb
16
Mar
16
Apr
16
May
16
Jun
16
Jul 1
6
Aug
16
Sep
16
Oct
16
Nov
16
Dec
16
tb/dtb/d
Others* Propane/propylene Gasoline Jet fuel/kerosene Fuel oil Crude (RHS)
Note: *Others: Contains natural gas liquids, liquefied refinery gases (LRG's), other liquids and all finished petroleum products exceptgasoline, jet fuel/kerosene, fuel oil and propane/propylene.Sources: US Energy Information Administration and OPEC Secretatiat.
ChangeNov 16 Dec 16 Jan 17 Jan 17/Dec 16
Crude oil 7,457 7,281 7,716 435Total products -2,537 -3,268 -2,650 618
Total crude and products 4,920 4,013 5,066 1,053
Sources: US Energy Information Administration and OPEC Secretatiat.

Oil Trade
OPEC Monthly Oil Market Report – February 2017 71
PADD 3 showed higher imports in November, as volumes increased from all sources. However, Latin America and the Middle East remained the main crude oil suppliers to the PADD, averaging 1.7 mb/d and 1.3 mb/d, respectively. As seen earlier, PADD 4 only imported from North America and averaged 322 tb/d in November, up by 16 tb/d from a month ago. Main imports to the West Coast came from Latin America, North America and the Middle East and stood at 370 tb/d, 284 tb/d and 256 tb/d, respectively.
Japan Japanese crude oil imports increased in December continuing the gains seen in the previous month, and were up by 473 tb/d or 15% to average 3.6 mb/d. In a y-o-y comparison, crude imports increased from last year by 105 tb/d or 3%. At the same time, Japan’s refinery runs increased by 180 tb/d in December from a month ago. Graph 8.3 Japan’s imports of crude and petroleum products
Looking at crude supplier share, Saudi Arabia maintained its position as first crude supplier to Japan, with a share of 40% of total crude exports to the country, up by 195 tb/d from a month before. The UAE came in second with a share of 23% of total crude exports, showing an increase in volume by 71 tb/d compared with the previous month. Qatar was third supplier in December with a share of 10%. Volumes imported from Qatar increased by 115 tb/d over last month. Japan’s product imports increased in December by 62 tb/d to average 622 tb/d, up by 11% m-o-m and by a slight 56 tb/d from last year. The country’s oil product sales rose for the second consecutive month in December, up by 0.6% from a year earlier. Japan’s product exports rose in December by 18 tb/d to average 557 tb/d, above last year’s level by 29 tb/d or 6%.
0
1
2
3
4
5
0
200
400
600
800
1,000
1,200
Nov
15
Dec
15
Jan
16
Feb
16
Mar
16
Apr 1
6
May
16
Jun
16
Jul 1
6
Aug
16
Sep
16
Oct
16
Nov
16
mb/dtb/d
Others* LPG Naphtha Fuel oil Crude oil
Note: *Others: Contains gasoline, jet fuel, kerosene, gasoil, asphalt and paraffin wax.Sources: Ministry of Economy, Trade and Industry of Japan and OPEC Secretariat.
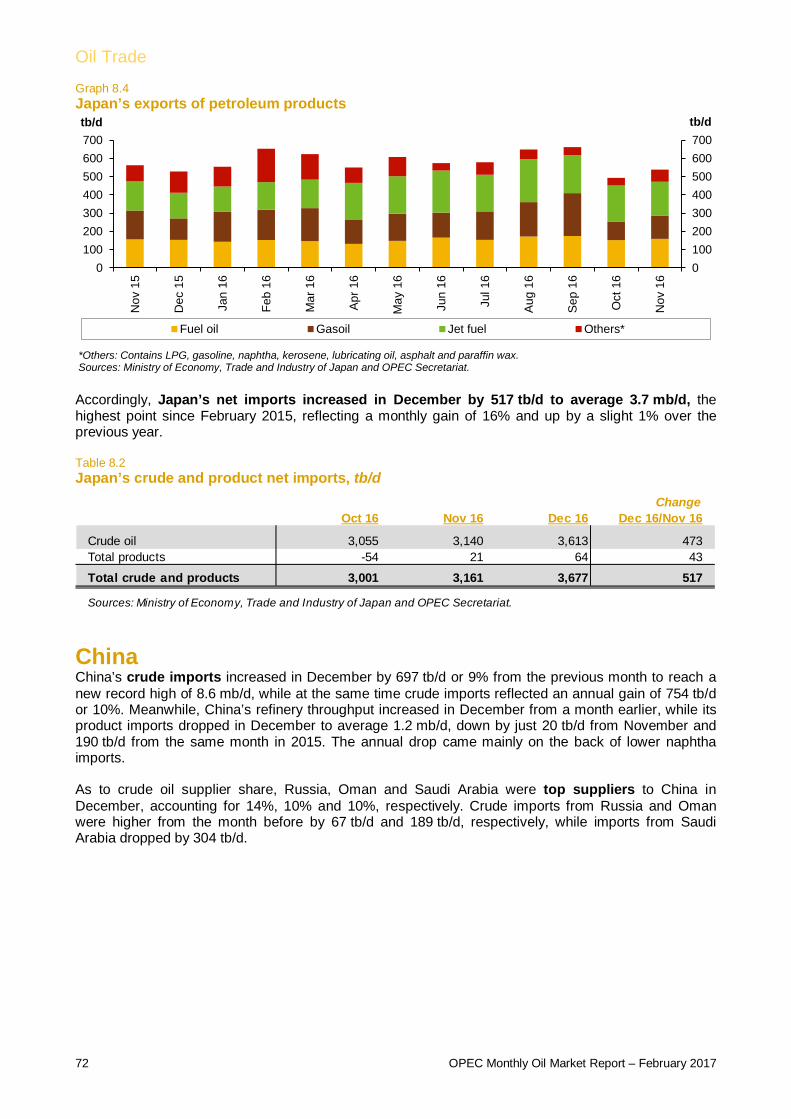
Oil Trade
72 OPEC Monthly Oil Market Report – February 2017
Graph 8.4 Japan’s exports of petroleum products
Accordingly, Japan’s net imports increased in December by 517 tb/d to average 3.7 mb/d, the highest point since February 2015, reflecting a monthly gain of 16% and up by a slight 1% over the previous year. Table 8.2 Japan’s crude and product net imports, tb/d
China China’s crude imports increased in December by 697 tb/d or 9% from the previous month to reach a new record high of 8.6 mb/d, while at the same time crude imports reflected an annual gain of 754 tb/d or 10%. Meanwhile, China’s refinery throughput increased in December from a month earlier, while its product imports dropped in December to average 1.2 mb/d, down by just 20 tb/d from November and 190 tb/d from the same month in 2015. The annual drop came mainly on the back of lower naphtha imports. As to crude oil supplier share, Russia, Oman and Saudi Arabia were top suppliers to China in December, accounting for 14%, 10% and 10%, respectively. Crude imports from Russia and Oman were higher from the month before by 67 tb/d and 189 tb/d, respectively, while imports from Saudi Arabia dropped by 304 tb/d.
0100200300400500600700
0100200300400500600700
Nov
15
Dec
15
Jan
16
Feb
16
Mar
16
Apr
16
May
16
Jun
16
Jul 1
6
Aug
16
Sep
16
Oct
16
Nov
16
tb/dtb/d
Fuel oil Gasoil Jet fuel Others*
*Others: Contains LPG, gasoline, naphtha, kerosene, lubricating oil, asphalt and paraffin wax.Sources: Ministry of Economy, Trade and Industry of Japan and OPEC Secretariat.
ChangeOct 16 Nov 16 Dec 16 Dec 16/Nov 16
Crude oil 3,055 3,140 3,613 473Total products -54 21 64 43
Total crude and products 3,001 3,161 3,677 517
Sources: Ministry of Economy, Trade and Industry of Japan and OPEC Secretariat.

Oil Trade
OPEC Monthly Oil Market Report – February 2017 73
Graph 8.5 China’s imports of crude and petroleum products
In December, China exported 81 tb/d of crude, up by 36 tb/d from the month before. Chinese product exports rose by 140 tb/d m-o-m to average 1.4 mb/d in December. Graph 8.6 China’s exports of crude and petroleum products
As a result, China’s net oil imports increased by 502 tb/d over the previous month and by 259 mb/d from a year before. Table 8.3 China’s crude and product net imports, tb/d
0
2,000
4,000
6,000
8,000
10,000
0
400
800
1,200
1,600N
ov 1
5
Dec
15
Jan
16
Feb
16
Mar
16
Apr 1
6
May
16
Jun
16
Jul 1
6
Aug
16
Sep
16
Oct
16
Nov
16
tb/dtb/d
Others LPG Naphtha Gasoline Jet fuelDiesel Fuel oil Asphalt Crude (RHS)
Sources: Argus China Petroleum and China, Oil and Gas Petrochemicals and OPEC Secretariat.
-20
20
60
100
140
180
0200400600800
1,0001,2001,400
Nov
15
Dec
15
Jan
16
Feb
16
Mar
16
Apr 1
6
May
16
Jun
16
Jul 1
6
Aug
16
Sep
16
Oct
16
Nov
16
tb/dtb/d
Others LPG Naphtha Gasoline Jet fuelDiesel Fuel oil Asphalt Crude (RHS)
Sources: Argus China Petroleum and China, Oil and Gas Petrochemicals and OPEC Secretariat.
ChangeOct 16 Nov 16 Dec 16 Dec 16/Nov 16
Crude oil 6,728 7,848 8,509 661Total products -83 -93 -252 -160
Total crude and products 6,645 7,756 8,257 502
Sources: Argus China Petroleum and China, Oil and Gas Petrochemicals and OPEC Secretariat.

Oil Trade
74 OPEC Monthly Oil Market Report – February 2017
India In December, Indian crude imports dropped by 357 tb/d or 8% from the previous month to reach 4.2 mb/d, the lowest level seen since July 2016, while annually crude imports reflected a gain of 34 tb/d or 1%. India’s refinery runs increased by 200 tb/d in December from the previous month. The country’s December product imports increased on both a monthly and annual basis by 18 tb/d and 243 tb/d, respectively, to average 685 tb/d in December. Annual product import increases came on the back of higher LPG and diesel imports in December, which rose by 123 tb/d and 17 tb/d, respectively, from a month ago. Graph 8.7 India’s imports of crude and petroleum products
India’s product exports were up in December by 96 tb/d or 8% from a year earlier to average 1.3 mb/d, primarily due to higher volumes of diesel going out. Graph 8.8 India’s exports of petroleum products
Consequently, India’s net imports dropped by 330 tb/d to average 3.8 mb/d, reflecting a decline of 8% m-o-m, though remaining higher than a year ago by 180 tb/d.
0
1,000
2,000
3,000
4,000
5,000
0
200
400
600
800
1000
Nov
15
Dec
15
Jan
16
Feb
16
Mar
16
Apr
16
May
16
Jun
16
Jul 1
6
Aug
16
Sep
16
Oct
16
Nov
16
tb/dtb/d
Others LPG Naphtha Gasoline Kerosene Gasoil Fuel oil Crude (RHS)
Sources: Petroleum Planning & Analysis Cell of India and OPEC Secretariat.
0
400
800
1,200
1,600
0
400
800
1,200
1,600
Nov
15
Dec
15
Jan
16
Feb
16
Mar
16
Apr 1
6
May
16
Jun
16
Jul 1
6
Aug
16
Sep
16
Oct
16
Nov
16
tb/dtb/d
Others Naphtha Gasoline Kerosene Gasoil Fuel oil
Sources: Petroleum Planning & Analysis Cell of India and OPEC Secretariat.

Oil Trade
OPEC Monthly Oil Market Report – February 2017 75
Table 8.4 India’s crude and product net imports, tb/d
FSU In December, total crude oil exports from the former Soviet Union (FSU) dropped by 131 tb/d or 2% to average 6.8 mb/d. Crude exports through Russian pipelines declined as well by 130 tb/d or 3% to average 4.2 mb/d. Total shipments from the Black Sea dropped by 143 tb/d or 23% to average 480 tb/d, as exports through the Novorossiysk port declined. Total Baltic Sea exports went up by 21 tb/d in December, mainly as shipments from Primorsk port terminal increased by 64 tb/d, while Ust Luga port terminal exports dropped by 43 tb/d. Druzhba pipeline total shipments declined by 10 tb/d to average 1.1 mb/d, while shipments from Kozmino showed no significant changes from the previous month, averaging 676 tb/d. Exports through the Lukoil system dropped by a slight 6 tb/d in the Barents Sea, while rising by 6 tb/d in the Baltic Sea. Asia Russia Fareast total exports were down by 29 tb/d or 8% from the previous month. Black Sea total exports rose by 85 tb/d, mainly as supplies from Supsa and Batumi ports were up from the previous month. In the Mediterranean Sea, the Baku–Tbilisi–Ceyhan (BTC) pipeline kept stable from the previous month to average 581 tb/d. FSU total product exports were higher in December than over the previous month by 85 tb/d or 3% to average 3.2 mb/d. This increase in product exports came as a result of higher exports of gasoline, VGO, fuel oil and gasoil.
ChangeOct 16 Nov 16 Dec 16 Dec 16/Nov 16
Crude oil 4,286 4,576 4,220 -357Total products -707 -492 -465 27
Total crude and products 3,580 4,085 3,755 -330
Note: India data tab le does not include information for crude import and product export by Reliance Industries.Sources: Petroleum Planning & Analysis Cell of India and OPEC Secretariat.

Oil Trade
76 OPEC Monthly Oil Market Report – February 2017
Table 8.5
2016 3Q16 4Q16 Nov 16 Dec 16
Transneft systemEurope Black sea total 600 580 545 624 480
Novorossiysk port terminal - total 600 580 545 624 480 of which: Russian oil 443 425 386 484 326 Others 157 156 159 140 154Baltic sea total 1,593 1,561 1,668 1,585 1,605 Primorsk port terminal - total 1,000 1,005 1,010 913 977 of which: Russian oil 1,000 1,005 1,010 913 977 Others 0 0 0 0 0 Ust-Luga port terminal - total 593 556 658 671 628 of which: Russian oil 388 360 446 456 418 Others 205 196 212 216 210Druzhba pipeline total 1,072 1,097 1,098 1,092 1,082 of which: Russian oil 1,040 1,066 1,066 1,060 1,051 Others 32 31 32 32 32
Asia Pacific ocean total 646 658 666 674 676 Kozmino port terminal - total 646 658 666 674 676China (via ESPO pipeline) total 335 311 332 336 336 China Amur 335 311 332 336 336
Total Russian crude exports 4,246 4,207 4,309 4,310 4,180
Lukoil systemEurope & Barents sea total 159 163 154 163 157North America Varandey offshore platform 159 163 154 163 157Europe Baltic sea total 15 14 13 8 15
Kalinigrad port terminal 15 14 13 8 15
Other routesAsia Russian Far East total 360 274 372 376 348
Aniva bay port terminal 119 95 135 144 121 De Kastri port terminal 241 179 236 232 226Central Asia total 194 200 195 190 184 Kenkiyak-Alashankou 194 200 195 190 184
Europe Black sea total 1,078 948 1,226 1,255 1,290 Novorossiysk port terminal (CPC) 957 822 1,113 1,172 1,154 Supsa port terminal 79 77 64 44 82 Batumi port terminal 42 49 49 39 54 Kulevi port terminal 0 0 0 0 0Mediterranean sea total 668 663 615 583 581 BTC 668 663 615 583 581
Russian railRussian rail 34 35 37 38 37 of which: Russian oil 30 33 36 37 36 Others 4 2 2 1 1
Total FSU crude exports 6,754 6,505 6,921 6,924 6,792
ProductsGasoline 186 139 173 152 177Naphtha 511 536 510 553 489Jet 37 54 30 27 23Gasoil 962 859 877 933 945Fuel oil 1,044 1,013 1,023 1,093 1,157VGO 297 324 333 320 372
Total FSU product exports 3,036 2,925 2,945 3,078 3,163
Total FSU oil exports 9,791 9,430 9,866 10,002 9,955
Sources: Argus Nefte Transport and Argus Global Markets.
Recent FSU exports of crude and petroleum products by sources, tb/d

Stock Movements
OPEC Monthly Oil Market Report – February 2017 77
Stock Movements
OECD commercial oil stocks fell in December to stand at 2,999 mb. At this level, OECD commercial oil stocks are around 299 mb above the latest five-year average. Crude and products indicate a surplus of around 216 mb and 83 mb above the seasonal norm, respectively. In terms of days of forward cover, OECD commercial stocks stood at 63.8 days, some 5.5 days higher than the latest five-year average. Preliminary data for January shows that total commercial oil stocks in the US rose by 20.3 mb to stand at 1,342.2 mb. At this level, they are around 28.1 mb above the same month a year ago and 198.5 mb higher than the latest five-year average. Within components, crude and products rose by 9.3 mb and 11 mb, respectively.
OECD Preliminary data for December shows that total OECD commercial oil stocks fell by 33.8 mb for the fifth consecutive month to stand at 2,999 mb, which is around 13.0 mb higher than the same time one year ago and 299 mb above the latest five-year average. From January to December this year, OECD commercial stock builds have shown considerable signs of slowing, as they increased by only 13 mb compared with a build of 281 mb 2015. Within components, crude and products fell by 13.5 mb and 20.3 mb, respectively. Graph 9.1 OECD’s commercial oil stocks
OECD commercial crude stocks fell in December to stand at 1,504 mb, which is 23 mb above the same time one year earlier and around 216 mb higher than the latest five-year average. OECD America and OECD Europe experienced a stock draw, while OECD Asia Pacific stocks witnessed a build. OECD product inventories also fell by 20.3 mb in December to stand at 1,504 mb, which is 9.5 mb below a year ago at the same time and 83 mb above the seasonal norm. Within the regions, OECD America and OECD Asia Pacific experienced a stock draw, while OECD Europe stocks witnessed a build. In terms of days of forward cover, OECD commercial stocks fell by 0.7 mb in December to stand at 63.9 days, which is in line with the previous year in the same period and 5.5 days higher than the latest five-year average. Within the regions, OECD Americas had 6.9 days more of forward cover than the historical average to stand at 64.1 days in December. OECD Asia Pacific stood 5.0 days above the seasonal average to finish the month at 51.1 days. At the same time, OECD Europe indicated a surplus of 3.0 days above the seasonal norm, averaging 71.3 days in December.
2,500
2,600
2,700
2,800
2,900
3,000
3,100
3,200
2,500
2,600
2,700
2,800
2,900
3,000
3,100
3,200
Jan Feb Mar Apr May Jun Jul Aug Sep Oct Nov Dec
mbmb
2014 2015 2016 Average 2011-2015
Max/Min2011-2015
Sources: Argus Media, Euroilstock, IEA, METI, OPEC Secretariat and US Energy Information Administration.

Stock Movements
78 OPEC Monthly Oil Market Report – February 2017
Commercial stocks in OECD Americas fell by 36.7 mb in December to stand at 1,588 mb. At this level, they are 27 mb above a year ago and 211 mb higher than the seasonal norm. Within the components, crude and products fell by 13.5 mb and 20.3 mb, respectively. At the end of December, commercial crude oil stocks in OECD Americas fell, ending the month at 828 mb, which is 4.0 mb below the same time one year ago and 166 mb above the latest five-year average. Higher US crude runs, which increased by about 280,000 b/d to average 16.6 mb, were behind the drop in US crude oil stocks. Lower US crude imports also contributed to this drop. Product stocks in OECD Americas also fell by 27.1 mb in December, reversing the November build. At 760 mb, they are 4.9 mb bellow the same time one year ago and 45.5 mb higher than the seasonal norm. Higher consumption, especially from gasoline, could be behind the drop. OECD Europe’s commercial stocks rose by 4.3 mb in December, ending the month at 975 mb, which was 15 mb lower than the same time a year ago, but 58.6 mb above the latest five-year average. Crude fell by 5.3 mb, while product stocks rose by 9.6 mb. OECD Europe’s commercial crude stocks fell in December, ending the month at 411 mb, which is 15.7 mb lower than a year earlier, but 23.9 mb higher than the latest five-year average. The fall in crude oil stocks could be attributed to lower domestic production as crude throughput deceased in December. In contrast, OECD Europe’s commercial product stocks rose by 9.6 mb to end December at 564 mb, which is 0.5 mb higher than a year ago at the same time and 34.7 mb higher than the seasonal norm. This build could be attributed to lower demand in the region. OECD Asia Pacific commercial oil stocks fell by 1.4 mb in December following a drop of 10.4 mb in November. At 436 mb, they are 0.9 mb higher than a year ago and 29 mb above the five-year average. Within components, crude rose by 1.4 mb, while product stocks fell by 2.9 mb. In December, crude inventories ended the month at 265 mb, which is 4.0 mb below a year ago, yet 26.2 mb above the seasonal norm. OECD Asia Pacific’s total product inventories ended December at 171 mb, standing 4.9 mb higher than the same month a year ago and 2.9 mb above the seasonal norm. Table 9.1 OECD’s commercial stocks, mb
EU plus Norway Preliminary data for December shows total European stocks rose by 15.3 mb reversing the fall of 11.6 mb in November. At 1,142.3 mb, European stocks are 3.7 mb, or 0.3%, lower than the same time a year ago, but remained 65.3 mb or 6.1%, higher than the latest five-year average. Crude stocks fell by 5.3 mb, while product stocks rose by 20.6 mb. European crude inventories fell in December to stand at 471.4 mb, which is 19.0 mb, or 3.9%, lower than the same period a year ago, but 9.5 mb, or 2.0%, higher than the seasonal norm. The fall in crude oil stocks could come from lower domestic production as crude throughput deceased by 157 tb/d to average 10.7 mb/d in December.
ChangeOct 16 Nov 16 Dec 16 Dec 16/Nov 16 Dec 15
Crude oil 1,523 1,518 1,504 -13.5 1,482Products 1,521 1,515 1,495 -20.3 1,504
Total 3,044 3,033 2,999 -33.8 2,986Days of forward cover 65.5 64.6 63.9 -0.7 63.8
Sources: Argus Media, Euroilstock, IEA, METI, OPEC Secretariat and US Energy Information Administration.Note: Totals may not add up due to independent rounding.
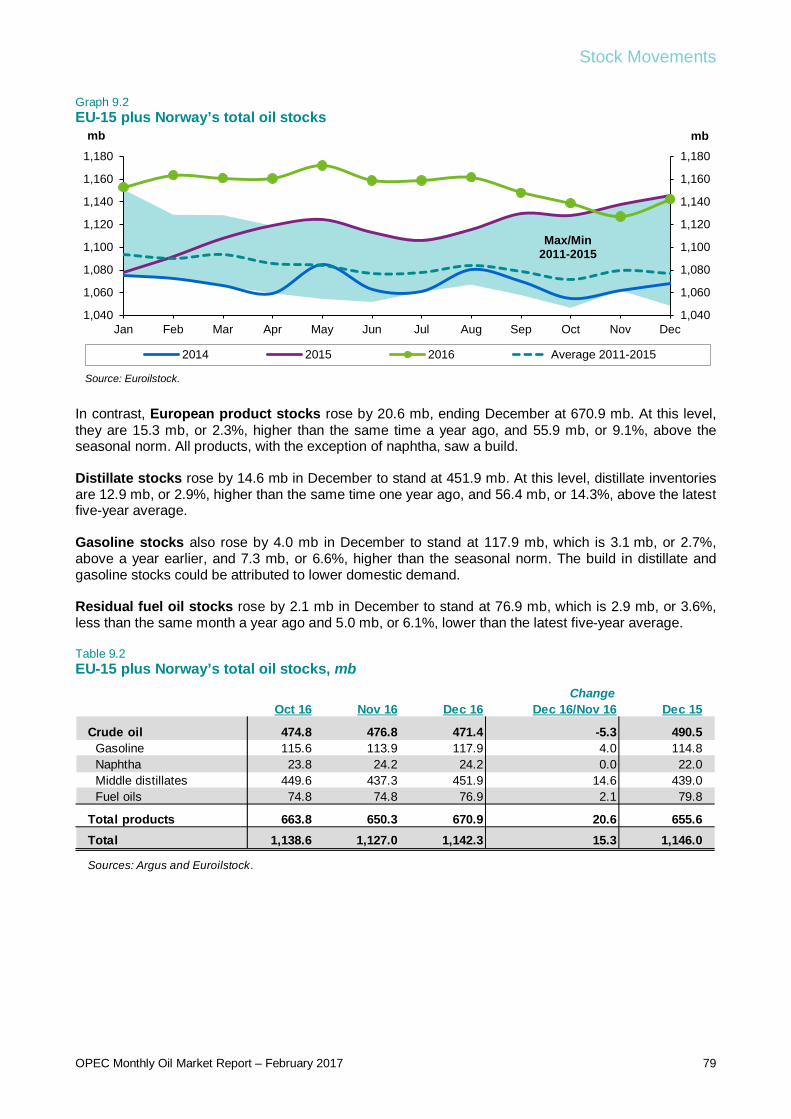
Stock Movements
OPEC Monthly Oil Market Report – February 2017 79
Graph 9.2 EU-15 plus Norway’s total oil stocks
In contrast, European product stocks rose by 20.6 mb, ending December at 670.9 mb. At this level, they are 15.3 mb, or 2.3%, higher than the same time a year ago, and 55.9 mb, or 9.1%, above the seasonal norm. All products, with the exception of naphtha, saw a build. Distillate stocks rose by 14.6 mb in December to stand at 451.9 mb. At this level, distillate inventories are 12.9 mb, or 2.9%, higher than the same time one year ago, and 56.4 mb, or 14.3%, above the latest five-year average. Gasoline stocks also rose by 4.0 mb in December to stand at 117.9 mb, which is 3.1 mb, or 2.7%, above a year earlier, and 7.3 mb, or 6.6%, higher than the seasonal norm. The build in distillate and gasoline stocks could be attributed to lower domestic demand. Residual fuel oil stocks rose by 2.1 mb in December to stand at 76.9 mb, which is 2.9 mb, or 3.6%, less than the same month a year ago and 5.0 mb, or 6.1%, lower than the latest five-year average. Table 9.2 EU-15 plus Norway’s total oil stocks, mb
1,040
1,060
1,080
1,100
1,120
1,140
1,160
1,180
1,040
1,060
1,080
1,100
1,120
1,140
1,160
1,180
Jan Feb Mar Apr May Jun Jul Aug Sep Oct Nov Dec
mbmb
2014 2015 2016 Average 2011-2015
Max/Min2011-2015
Source: Euroilstock.
ChangeOct 16 Nov 16 Dec 16 Dec 16/Nov 16 Dec 15
Crude oil 474.8 476.8 471.4 -5.3 490.5 Gasoline 115.6 113.9 117.9 4.0 114.8 Naphtha 23.8 24.2 24.2 0.0 22.0 Middle distillates 449.6 437.3 451.9 14.6 439.0 Fuel oils 74.8 74.8 76.9 2.1 79.8
Total products 663.8 650.3 670.9 20.6 655.6Total 1,138.6 1,127.0 1,142.3 15.3 1,146.0
Sources: Argus and Euroilstock.
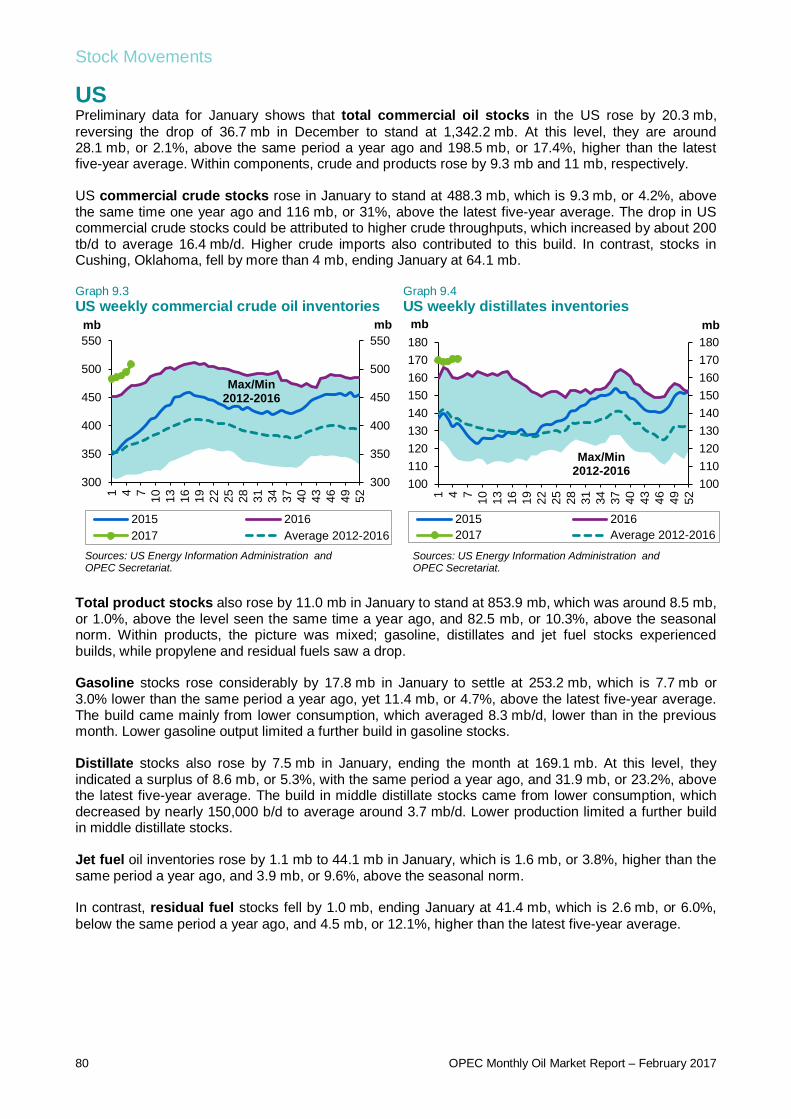
Stock Movements
80 OPEC Monthly Oil Market Report – February 2017
US Preliminary data for January shows that total commercial oil stocks in the US rose by 20.3 mb, reversing the drop of 36.7 mb in December to stand at 1,342.2 mb. At this level, they are around 28.1 mb, or 2.1%, above the same period a year ago and 198.5 mb, or 17.4%, higher than the latest five-year average. Within components, crude and products rose by 9.3 mb and 11 mb, respectively. US commercial crude stocks rose in January to stand at 488.3 mb, which is 9.3 mb, or 4.2%, above the same time one year ago and 116 mb, or 31%, above the latest five-year average. The drop in US commercial crude stocks could be attributed to higher crude throughputs, which increased by about 200 tb/d to average 16.4 mb/d. Higher crude imports also contributed to this build. In contrast, stocks in Cushing, Oklahoma, fell by more than 4 mb, ending January at 64.1 mb. Graph 9.3 US weekly commercial crude oil inventories
Graph 9.4 US weekly distillates inventories
Total product stocks also rose by 11.0 mb in January to stand at 853.9 mb, which was around 8.5 mb, or 1.0%, above the level seen the same time a year ago, and 82.5 mb, or 10.3%, above the seasonal norm. Within products, the picture was mixed; gasoline, distillates and jet fuel stocks experienced builds, while propylene and residual fuels saw a drop. Gasoline stocks rose considerably by 17.8 mb in January to settle at 253.2 mb, which is 7.7 mb or 3.0% lower than the same period a year ago, yet 11.4 mb, or 4.7%, above the latest five-year average. The build came mainly from lower consumption, which averaged 8.3 mb/d, lower than in the previous month. Lower gasoline output limited a further build in gasoline stocks. Distillate stocks also rose by 7.5 mb in January, ending the month at 169.1 mb. At this level, they indicated a surplus of 8.6 mb, or 5.3%, with the same period a year ago, and 31.9 mb, or 23.2%, above the latest five-year average. The build in middle distillate stocks came from lower consumption, which decreased by nearly 150,000 b/d to average around 3.7 mb/d. Lower production limited a further build in middle distillate stocks. Jet fuel oil inventories rose by 1.1 mb to 44.1 mb in January, which is 1.6 mb, or 3.8%, higher than the same period a year ago, and 3.9 mb, or 9.6%, above the seasonal norm. In contrast, residual fuel stocks fell by 1.0 mb, ending January at 41.4 mb, which is 2.6 mb, or 6.0%, below the same period a year ago, and 4.5 mb, or 12.1%, higher than the latest five-year average.
300
350
400
450
500
550
300
350
400
450
500
550
1 4 7 10 13 16 19 22 25 28 31 34 37 40 43 46 49 52
mbmb
2015 20162017 Average 2012-2016
Max/Min2012-2016
Sources: US Energy Information Administration and OPEC Secretariat.
100110120130140150160170180
100110120130140150160170180
1 4 7 10 13 16 19 22 25 28 31 34 37 40 43 46 49 52
mbmb
2015 20162017 Average 2012-2016
Max/Min2012-2016
Sources: US Energy Information Administration and OPEC Secretariat.

Stock Movements
OPEC Monthly Oil Market Report – February 2017 81
Table 9.3 US onland commercial petroleum stocks, mb
Japan In Japan, total commercial oil stocks fell by 1.4 mb in December for the second consecutive month. At 147.5 mb, Japanese total commercial stocks are 17.0 mb, or 10.3%, less than the same time a year ago and 15.0 mb, or 9.2%, below the five-year average. Within components, crude rose by 1.4 mb, while product stocks fell by 2.9 mb. Japanese commercial crude oil stocks rose in December to stand at 88.7 mb, which is 9.8 mb, or 10.0%, below the same period a year ago and 6.2 mb, or 6.5%, below the seasonal norm. The build was driven by higher crude imports, which increased by around 470,000 b/d, or 15.0%, to average 3.61 mb/d. Higher crude throughput limited a further build in crude commercial inventories. Japan’s total product inventories also fell by 2.9 mb in December to stand at 58.8 mb. At this level, they stood at 7.2 mb or 10.9% lower than last year in the same month and 8.8 mb, or 13.0%, less than the seasonal norm. This drop came on the back of higher domestic product sales, which increased by nearly 280,000 b/d to average 3.55 mb/d. It should be noted that Japan’s total oil sales in December hit their lowest level in more than 40 years as Japan continued to seek alternative sources of energy, resulting in continued slowing oil consumption. Graph 9.5 Japan’s commercial oil stocks
Distillate stocks fell by 2.1 mb in December to stand at 27.8 mb. At this level, they stood at 4.4 mb, or 13.7%, lower than the same period a year ago and 3.8 mb, or 12.1%, below the seasonal average. Within distillate components, jet fuel, kerosene and gasoil fell by 7.1%, 9.6% and 9.1%, respectively. The fall in gasoil and kerosene came mainly from higher domestic sales, which increased by 5.2% and
ChangeNov 16 Dec 16 Jan 17 Jan 17/Dec 16 Jan 16
Crude oil 488.6 479.0 488.3 9.3 468.7 Gasoline 233.4 235.5 253.2 17.8 261.0 Distillate fuel 160.2 161.7 169.1 7.5 160.6 Residual fuel oil 40.6 42.5 41.4 -1.0 44.1 Jet fuel 44.8 43.0 44.1 1.1 42.5
Total 1,358.6 1,321.9 1,342.2 20.3 1,314.1SPR 695.1 695.1 695.1 0.0 695.1
Sources: US Energy Information Administration and OPEC Secretariat.
140
150
160
170
180
190
140
150
160
170
180
190
Jan Feb Mar Apr May Jun Jul Aug Sep Oct Nov Dec
mbmb
2014 2015 2016 Average 2011-2015
Max/Min2011-2015
Source: Ministry of Economic, Trade and Industry of Japan.
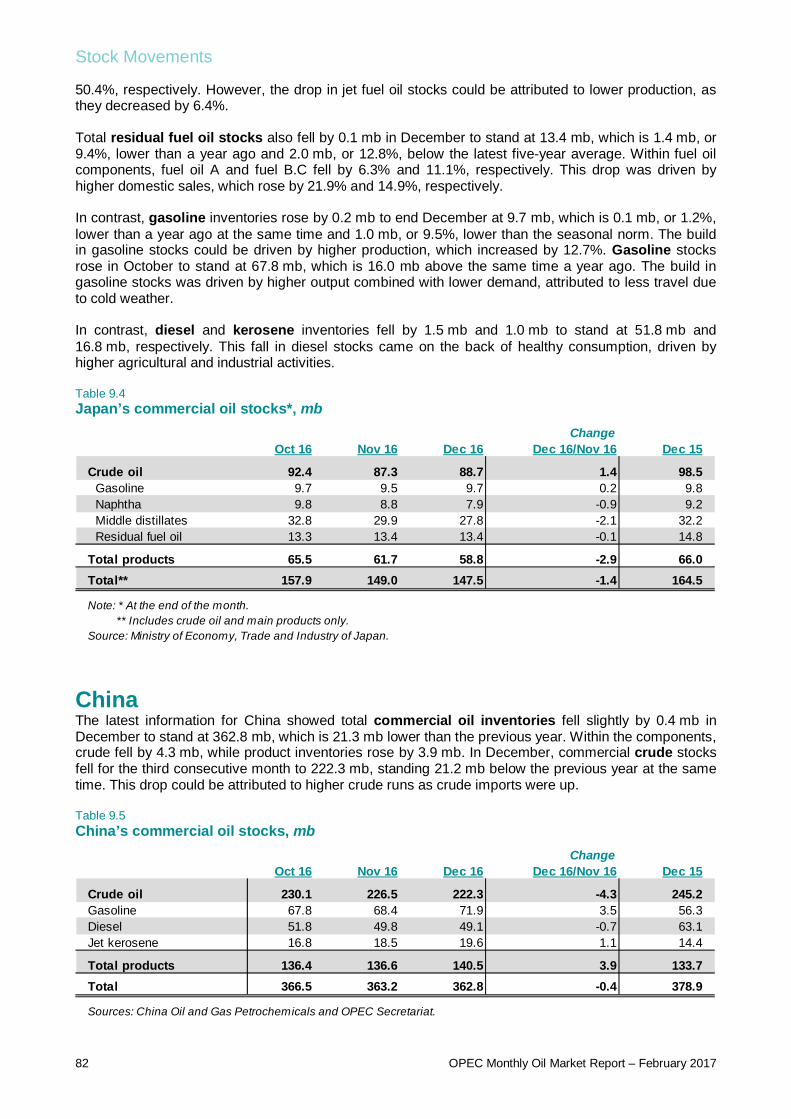
Stock Movements
82 OPEC Monthly Oil Market Report – February 2017
50.4%, respectively. However, the drop in jet fuel oil stocks could be attributed to lower production, as they decreased by 6.4%. Total residual fuel oil stocks also fell by 0.1 mb in December to stand at 13.4 mb, which is 1.4 mb, or 9.4%, lower than a year ago and 2.0 mb, or 12.8%, below the latest five-year average. Within fuel oil components, fuel oil A and fuel B.C fell by 6.3% and 11.1%, respectively. This drop was driven by higher domestic sales, which rose by 21.9% and 14.9%, respectively. In contrast, gasoline inventories rose by 0.2 mb to end December at 9.7 mb, which is 0.1 mb, or 1.2%, lower than a year ago at the same time and 1.0 mb, or 9.5%, lower than the seasonal norm. The build in gasoline stocks could be driven by higher production, which increased by 12.7%. Gasoline stocks rose in October to stand at 67.8 mb, which is 16.0 mb above the same time a year ago. The build in gasoline stocks was driven by higher output combined with lower demand, attributed to less travel due to cold weather. In contrast, diesel and kerosene inventories fell by 1.5 mb and 1.0 mb to stand at 51.8 mb and 16.8 mb, respectively. This fall in diesel stocks came on the back of healthy consumption, driven by higher agricultural and industrial activities. Table 9.4 Japan’s commercial oil stocks*, mb
China The latest information for China showed total commercial oil inventories fell slightly by 0.4 mb in December to stand at 362.8 mb, which is 21.3 mb lower than the previous year. Within the components, crude fell by 4.3 mb, while product inventories rose by 3.9 mb. In December, commercial crude stocks fell for the third consecutive month to 222.3 mb, standing 21.2 mb below the previous year at the same time. This drop could be attributed to higher crude runs as crude imports were up. Table 9.5 China’s commercial oil stocks, mb
ChangeOct 16 Nov 16 Dec 16 Dec 16/Nov 16 Dec 15
Crude oil 92.4 87.3 88.7 1.4 98.5 Gasoline 9.7 9.5 9.7 0.2 9.8 Naphtha 9.8 8.8 7.9 -0.9 9.2 Middle distillates 32.8 29.9 27.8 -2.1 32.2 Residual fuel oil 13.3 13.4 13.4 -0.1 14.8
Total products 65.5 61.7 58.8 -2.9 66.0Total** 157.9 149.0 147.5 -1.4 164.5
Note: * At the end of the month. ** Includes crude oil and main products only.Source: Ministry of Economy, Trade and Industry of Japan.
ChangeOct 16 Nov 16 Dec 16 Dec 16/Nov 16 Dec 15
Crude oil 230.1 226.5 222.3 -4.3 245.2Gasoline 67.8 68.4 71.9 3.5 56.3Diesel 51.8 49.8 49.1 -0.7 63.1Jet kerosene 16.8 18.5 19.6 1.1 14.4
Total products 136.4 136.6 140.5 3.9 133.7Total 366.5 363.2 362.8 -0.4 378.9
Sources: China Oil and Gas Petrochemicals and OPEC Secretariat.
Stock Movements
OPEC Monthly Oil Market Report – February 2017 83
On the other hand, total product stocks in China rose by 3.9 mb in December to stand at 140.5 mb. Total product stocks were 0.2 mb below the same time a year ago. Gasoline and kerosene inventories saw builds of 3.5 mb and 1.1 mb, respectively, while diesel experienced a fall of 0.7 mb. Singapore and Amsterdam-Rotterdam-Antwerp (ARA) At the end of December, product stocks in Singapore fell by 5.2 mb to stand at 44.9 mb. At this level, they are 5.0 mb, or 9.9%, below the same period a year ago. All products witnessed draws. Light and middle distillate stocks fell in December by 0.6 mb and 4.5 mb, respectively. At 12.3 mb, light distillates stood at 0.2 mb, or 1.9%, lower than last year at the same time, while middle distillates ended December at 10.4 mb, which is 2.0 mb, or 16.1%, lower than a year ago in the same period. The drop in both products was driven by higher exports combined with higher demand in the region. Residual fuel oil stocks fell slightly by 0.1 mb in December, ending the month at 22.2 mb. At this level, they are 2.7 mb, or 10.9%, lower than the same time a year ago. The fall could be attributed to higher marine bunkers in the region. Product stocks in Amsterdam-Rotterdam-Antwerp (ARA) rose by 0.6 mb in December to stand at 39.9 mb. At this level, they are 7.2 mb, or 15.3%, lower than at the same time a year ago. Within products, gasoline, naphtha and fuel oil saw a build, while gasoil and jet oil experienced a stock draw. Gasoline inventories rose by 0.9 mb, ending December at 8.9 mb, which is 2.1 mb, or around 30.7 %, higher than the same month of the previous year. This build could be attributed to lower demand in the region. Fuel oil stocks also rose by 0.5 mb in December to stand at 4.7 mb, which is 3.1 mb, or nearly 40%, lower than at the same period a year ago. This build was mainly driven by higher imports to the ARA hub. In contrast, gasoil fell by 1.2 mb in December to stand at 19.5 mb. At this level, it stood at 6.4 mb, or 23.7%, below a year ago at the same time.
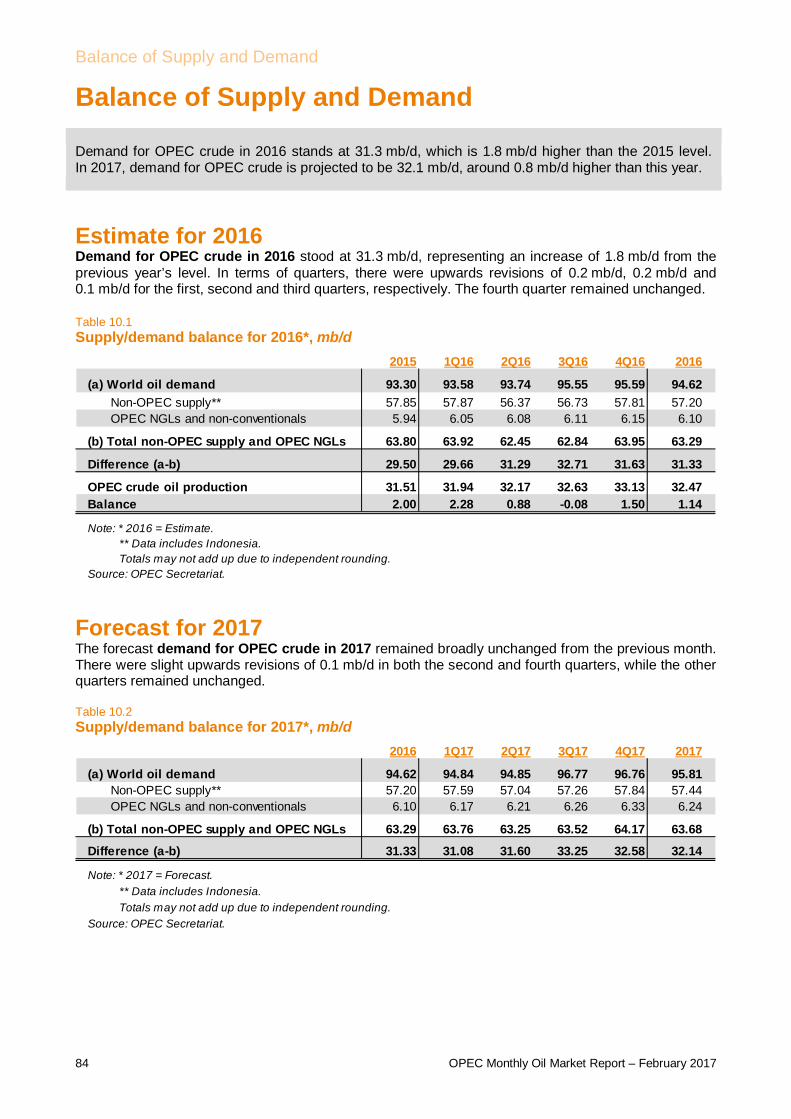
Balance of Supply and Demand
84 OPEC Monthly Oil Market Report – February 2017
Balance of Supply and Demand
Demand for OPEC crude in 2016 stands at 31.3 mb/d, which is 1.8 mb/d higher than the 2015 level. In 2017, demand for OPEC crude is projected to be 32.1 mb/d, around 0.8 mb/d higher than this year.
Estimate for 2016 Demand for OPEC crude in 2016 stood at 31.3 mb/d, representing an increase of 1.8 mb/d from the previous year’s level. In terms of quarters, there were upwards revisions of 0.2 mb/d, 0.2 mb/d and 0.1 mb/d for the first, second and third quarters, respectively. The fourth quarter remained unchanged. Table 10.1 Supply/demand balance for 2016*, mb/d
Forecast for 2017 The forecast demand for OPEC crude in 2017 remained broadly unchanged from the previous month. There were slight upwards revisions of 0.1 mb/d in both the second and fourth quarters, while the other quarters remained unchanged. Table 10.2 Supply/demand balance for 2017*, mb/d
2015 1Q16 2Q16 3Q16 4Q16 2016
(a) World oil demand 93.30 93.58 93.74 95.55 95.59 94.62 Non-OPEC supply** 57.85 57.87 56.37 56.73 57.81 57.20 OPEC NGLs and non-conventionals 5.94 6.05 6.08 6.11 6.15 6.10
(b) Total non-OPEC supply and OPEC NGLs 63.80 63.92 62.45 62.84 63.95 63.29
Difference (a-b) 29.50 29.66 31.29 32.71 31.63 31.33
OPEC crude oil production 31.51 31.94 32.17 32.63 33.13 32.47Balance 2.00 2.28 0.88 -0.08 1.50 1.14
Note: * 2016 = Estimate. ** Data includes Indonesia. Totals may not add up due to independent rounding.Source: OPEC Secretariat.
2016 1Q17 2Q17 3Q17 4Q17 2017
(a) World oil demand 94.62 94.84 94.85 96.77 96.76 95.81 Non-OPEC supply** 57.20 57.59 57.04 57.26 57.84 57.44 OPEC NGLs and non-conventionals 6.10 6.17 6.21 6.26 6.33 6.24
(b) Total non-OPEC supply and OPEC NGLs 63.29 63.76 63.25 63.52 64.17 63.68
Difference (a-b) 31.33 31.08 31.60 33.25 32.58 32.14
Note: * 2017 = Forecast. ** Data includes Indonesia. Totals may not add up due to independent rounding.Source: OPEC Secretariat.

Balance of Supply and Demand
OPEC Monthly Oil Market Report – February 2017 85
Graph 10.1 Balance of supply and demand, 2016-2017*
28
29
30
31
32
33
34
35
28
29
30
31
32
33
34
35
1Q16 2Q16 3Q16 4Q16 1Q17 2Q17 3Q17 4Q17
mb/dmb/d
OPEC crude production Required OPEC crude
Note: * 2016 = Estimate and 2017 = Forecast.Source: OPEC Secretariat.
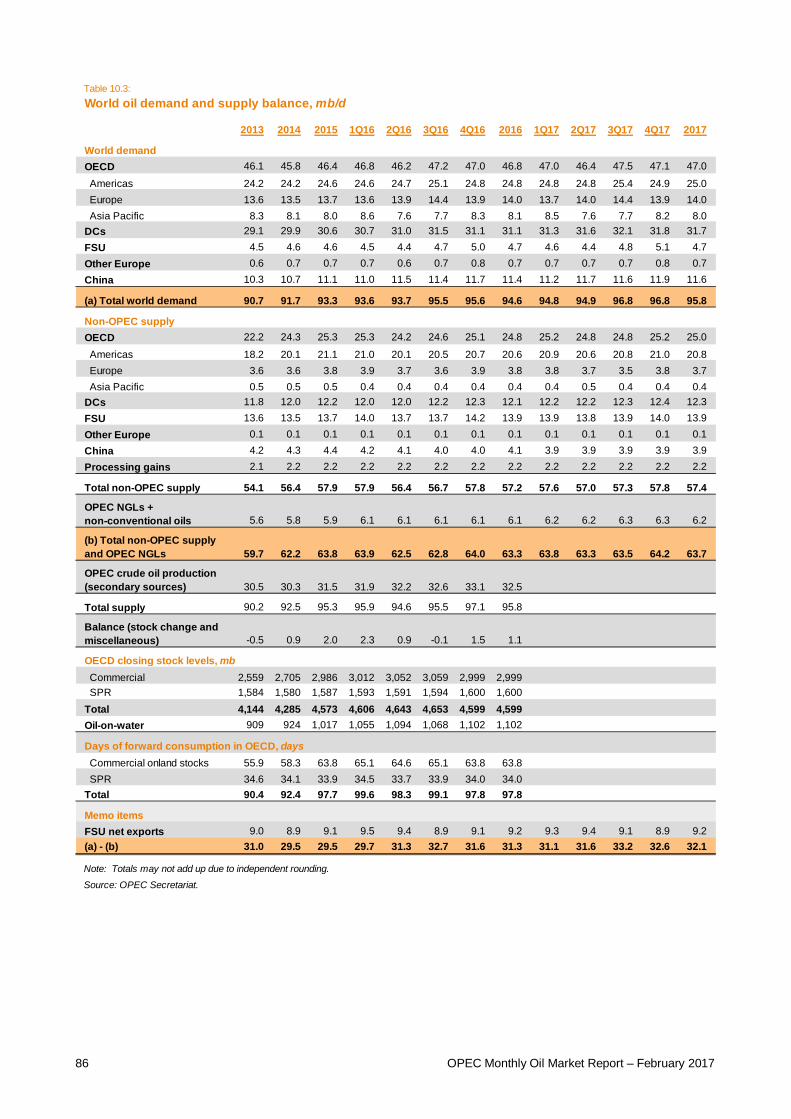
86 OPEC Monthly Oil Market Report – February 2017
Table 10.3:World oil demand and supply balance, mb/d
2013 2014 2015 1Q16 2Q16 3Q16 4Q16 2016 1Q17 2Q17 3Q17 4Q17 2017
World demandOECD 46.1 45.8 46.4 46.8 46.2 47.2 47.0 46.8 47.0 46.4 47.5 47.1 47.0
Americas 24.2 24.2 24.6 24.6 24.7 25.1 24.8 24.8 24.8 24.8 25.4 24.9 25.0 Europe 13.6 13.5 13.7 13.6 13.9 14.4 13.9 14.0 13.7 14.0 14.4 13.9 14.0 Asia Pacific 8.3 8.1 8.0 8.6 7.6 7.7 8.3 8.1 8.5 7.6 7.7 8.2 8.0DCs 29.1 29.9 30.6 30.7 31.0 31.5 31.1 31.1 31.3 31.6 32.1 31.8 31.7FSU 4.5 4.6 4.6 4.5 4.4 4.7 5.0 4.7 4.6 4.4 4.8 5.1 4.7Other Europe 0.6 0.7 0.7 0.7 0.6 0.7 0.8 0.7 0.7 0.7 0.7 0.8 0.7China 10.3 10.7 11.1 11.0 11.5 11.4 11.7 11.4 11.2 11.7 11.6 11.9 11.6
(a) Total world demand 90.7 91.7 93.3 93.6 93.7 95.5 95.6 94.6 94.8 94.9 96.8 96.8 95.8
Non-OPEC supplyOECD 22.2 24.3 25.3 25.3 24.2 24.6 25.1 24.8 25.2 24.8 24.8 25.2 25.0
Americas 18.2 20.1 21.1 21.0 20.1 20.5 20.7 20.6 20.9 20.6 20.8 21.0 20.8 Europe 3.6 3.6 3.8 3.9 3.7 3.6 3.9 3.8 3.8 3.7 3.5 3.8 3.7 Asia Pacific 0.5 0.5 0.5 0.4 0.4 0.4 0.4 0.4 0.4 0.5 0.4 0.4 0.4DCs 11.8 12.0 12.2 12.0 12.0 12.2 12.3 12.1 12.2 12.2 12.3 12.4 12.3FSU 13.6 13.5 13.7 14.0 13.7 13.7 14.2 13.9 13.9 13.8 13.9 14.0 13.9Other Europe 0.1 0.1 0.1 0.1 0.1 0.1 0.1 0.1 0.1 0.1 0.1 0.1 0.1China 4.2 4.3 4.4 4.2 4.1 4.0 4.0 4.1 3.9 3.9 3.9 3.9 3.9Processing gains 2.1 2.2 2.2 2.2 2.2 2.2 2.2 2.2 2.2 2.2 2.2 2.2 2.2
Total non-OPEC supply 54.1 56.4 57.9 57.9 56.4 56.7 57.8 57.2 57.6 57.0 57.3 57.8 57.4
OPEC NGLs + non-conventional oils 5.6 5.8 5.9 6.1 6.1 6.1 6.1 6.1 6.2 6.2 6.3 6.3 6.2
(b) Total non-OPEC supply and OPEC NGLs 59.7 62.2 63.8 63.9 62.5 62.8 64.0 63.3 63.8 63.3 63.5 64.2 63.7
OPEC crude oil production (secondary sources) 30.5 30.3 31.5 31.9 32.2 32.6 33.1 32.5
Total supply 90.2 92.5 95.3 95.9 94.6 95.5 97.1 95.8
Balance (stock change and miscellaneous) -0.5 0.9 2.0 2.3 0.9 -0.1 1.5 1.1
OECD closing stock levels, mb Commercial 2,559 2,705 2,986 3,012 3,052 3,059 2,999 2,999 SPR 1,584 1,580 1,587 1,593 1,591 1,594 1,600 1,600Total 4,144 4,285 4,573 4,606 4,643 4,653 4,599 4,599Oil-on-water 909 924 1,017 1,055 1,094 1,068 1,102 1,102
Days of forward consumption in OECD, days Commercial onland stocks 55.9 58.3 63.8 65.1 64.6 65.1 63.8 63.8 SPR 34.6 34.1 33.9 34.5 33.7 33.9 34.0 34.0Total 90.4 92.4 97.7 99.6 98.3 99.1 97.8 97.8
Memo itemsFSU net exports 9.0 8.9 9.1 9.5 9.4 8.9 9.1 9.2 9.3 9.4 9.1 8.9 9.2(a) - (b) 31.0 29.5 29.5 29.7 31.3 32.7 31.6 31.3 31.1 31.6 33.2 32.6 32.1
Note: Totals may not add up due to independent rounding.
Source: OPEC Secretariat.
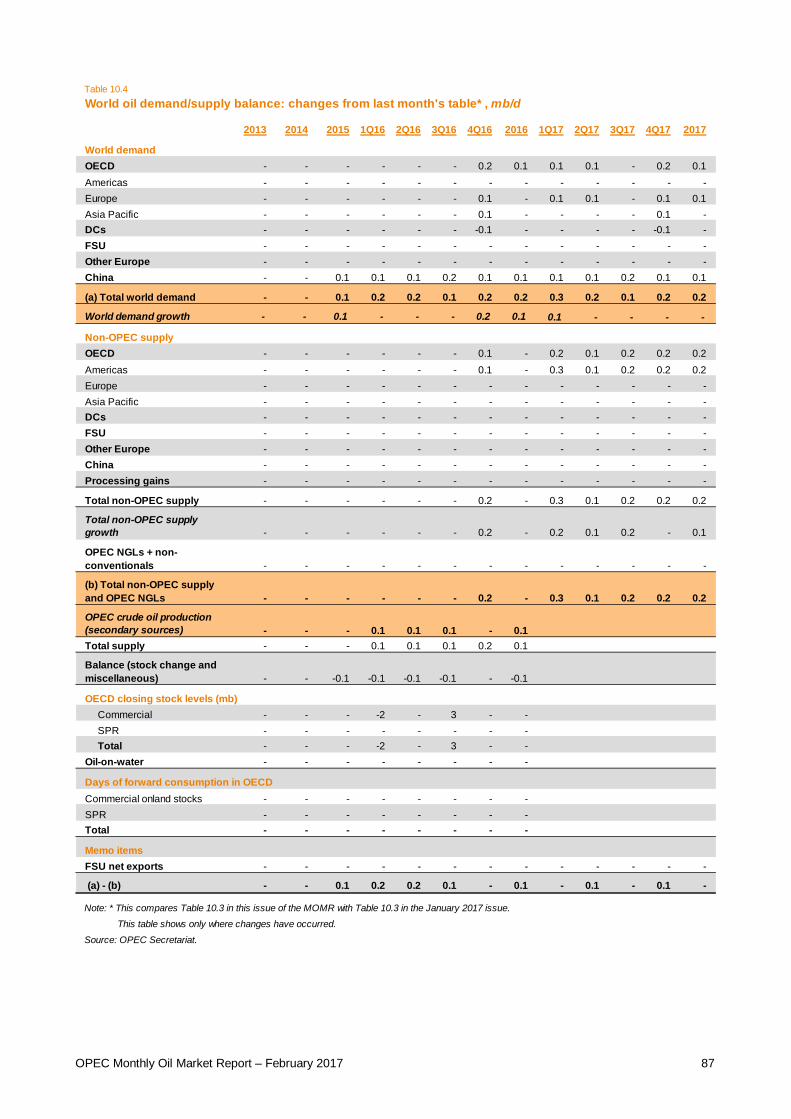
OPEC Monthly Oil Market Report – February 2017 87
Table 10.4World oil demand/supply balance: changes from last month's table* , mb/d
2013 2014 2015 1Q16 2Q16 3Q16 4Q16 2016 1Q17 2Q17 3Q17 4Q17 2017
World demandOECD - - - - - - 0.2 0.1 0.1 0.1 - 0.2 0.1Americas - - - - - - - - - - - - -Europe - - - - - - 0.1 - 0.1 0.1 - 0.1 0.1Asia Pacific - - - - - - 0.1 - - - - 0.1 -DCs - - - - - - -0.1 - - - - -0.1 -FSU - - - - - - - - - - - - -Other Europe - - - - - - - - - - - - -China - - 0.1 0.1 0.1 0.2 0.1 0.1 0.1 0.1 0.2 0.1 0.1
(a) Total world demand - - 0.1 0.2 0.2 0.1 0.2 0.2 0.3 0.2 0.1 0.2 0.2
World demand growth - - 0.1 - - - 0.2 0.1 0.1 - - - -
Non-OPEC supplyOECD - - - - - - 0.1 - 0.2 0.1 0.2 0.2 0.2Americas - - - - - - 0.1 - 0.3 0.1 0.2 0.2 0.2Europe - - - - - - - - - - - - -Asia Pacific - - - - - - - - - - - - -DCs - - - - - - - - - - - - -FSU - - - - - - - - - - - - -Other Europe - - - - - - - - - - - - -China - - - - - - - - - - - - -Processing gains - - - - - - - - - - - - -
Total non-OPEC supply - - - - - - 0.2 - 0.3 0.1 0.2 0.2 0.2
Total non-OPEC supply growth - - - - - - 0.2 - 0.2 0.1 0.2 - 0.1
OPEC NGLs + non-conventionals - - - - - - - - - - - - -
(b) Total non-OPEC supply and OPEC NGLs - - - - - - 0.2 - 0.3 0.1 0.2 0.2 0.2
OPEC crude oil production (secondary sources) - - - 0.1 0.1 0.1 - 0.1Total supply - - - 0.1 0.1 0.1 0.2 0.1
Balance (stock change and miscellaneous) - - -0.1 -0.1 -0.1 -0.1 - -0.1
OECD closing stock levels (mb) Commercial - - - -2 - 3 - - SPR - - - - - - - - Total - - - -2 - 3 - -Oil-on-water - - - - - - - -
Days of forward consumption in OECDCommercial onland stocks - - - - - - - -SPR - - - - - - - -Total - - - - - - - -
Memo itemsFSU net exports - - - - - - - - - - - - -
(a) - (b) - - 0.1 0.2 0.2 0.1 - 0.1 - 0.1 - 0.1 -
Note: * This compares Table 10.3 in this issue of the MOMR with Table 10.3 in the January 2017 issue.
This table shows only where changes have occurred.
Source: OPEC Secretariat.

88 OPEC Monthly Oil Market Report – February 2017
Table 10.5
OECD oil stocks and oil on water at the end of period
2014 2015 2016 4Q14 1Q15 2Q15 3Q15 4Q15 1Q16 2Q16 3Q16 4Q16
Closing stock levels, mb
OECD onland commercial 2,705 2,986 2,999 2,705 2,789 2,878 2,954 2,986 3,012 3,052 3,059 2,999Americas 1,414 1,561 1,588 1,414 1,458 1,508 1,542 1,561 1,589 1,609 1,617 1,588Europe 886 990 975 886 939 940 967 990 1,002 1,006 991 975Asia Pacific 405 435 436 405 392 430 445 435 421 438 450 436
OECD SPR 1,580 1,587 1,600 1,580 1,583 1,585 1,579 1,587 1,593 1,591 1,594 1,600Americas 693 697 697 693 693 696 697 697 697 697 697 697Europe 470 473 481 470 470 471 467 473 477 473 476 481Asia Pacific 417 416 422 417 420 418 415 416 419 421 421 422
OECD total 4,285 4,573 4,599 4,285 4,372 4,463 4,533 4,573 4,606 4,643 4,653 4,599
Oil-on-water 924 1,017 1,102 924 864 916 924 1,017 1,055 1,094 1,068 1,102
Days of forward consumption in OECD, days
OECD onland commercial 58 56 64 58 61 61 64 64 65 65 65 64Americas 55 53 64 58 60 60 63 64 64 64 65 64Europe 67 65 71 66 69 66 70 73 72 70 72 71Asia Pacific 49 48 51 47 52 56 54 51 55 57 55 51
OECD SPR 34 35 34 34 35 34 34 34 34 34 34 34Americas 29 29 28 28 28 28 28 28 28 28 28 28Europe 32 35 35 35 35 33 34 35 34 33 35 35Asia Pacific 50 51 50 48 55 54 51 49 55 54 51 50
OECD total 91 90 98 92 96 95 98 98 100 98 100 98
Sources: Argus Media, Euroilstock, IEA, JODI, METI, OPEC Secretariat and US Energy Information Administration.

OPEC Monthly Oil Market Report – February 2017 89
Table 10.6
Non-OPEC supply and OPEC natural gas liquids, mb/dChange Change
2013 2014 2015 3Q16 4Q16 2016 16/15 1Q17 2Q17 3Q17 4Q17 2017 17/16
US 11.2 13.0 14.0 13.4 13.7 13.6 -0.4 13.9 13.8 13.9 14.0 13.9 0.2 Canada 4.0 4.3 4.4 4.6 4.7 4.5 0.0 4.7 4.5 4.6 4.7 4.6 0.2 Mexico 2.9 2.8 2.6 2.5 2.4 2.5 -0.1 2.4 2.3 2.3 2.3 2.3 -0.2OECD Americas* 18.2 20.1 21.1 20.5 20.7 20.6 -0.5 20.9 20.6 20.8 21.0 20.8 0.2 Norway 1.8 1.9 1.9 1.9 2.1 2.0 0.0 2.0 1.9 1.9 2.0 2.0 0.0 UK 0.9 0.9 1.0 1.0 1.0 1.0 0.1 1.0 1.0 0.9 1.0 1.0 0.0 Denmark 0.2 0.2 0.2 0.1 0.2 0.1 0.0 0.1 0.1 0.1 0.1 0.1 0.0 Other OECD Europe 0.7 0.7 0.7 0.6 0.7 0.6 0.0 0.6 0.6 0.6 0.6 0.6 0.0OECD Europe 3.6 3.6 3.8 3.6 3.9 3.8 0.0 3.8 3.7 3.5 3.8 3.7 -0.1 Australia 0.4 0.4 0.4 0.4 0.4 0.4 0.0 0.4 0.4 0.4 0.4 0.4 0.0 Other Asia Pacific 0.1 0.1 0.1 0.1 0.1 0.1 0.0 0.1 0.1 0.1 0.1 0.1 0.0OECD Asia Pacific 0.5 0.5 0.5 0.4 0.4 0.4 0.0 0.4 0.5 0.4 0.4 0.4 0.0Total OECD 22.2 24.3 25.3 24.6 25.1 24.8 -0.5 25.2 24.8 24.8 25.2 25.0 0.2 Brunei 0.1 0.1 0.1 0.1 0.1 0.1 0.0 0.1 0.1 0.1 0.1 0.1 0.0 India 0.9 0.9 0.9 0.9 0.8 0.9 0.0 0.9 0.9 0.9 0.9 0.9 0.0 Indonesia 0.9 0.9 0.9 0.9 0.9 0.9 0.0 0.9 0.9 0.9 0.9 0.9 0.0 Malaysia 0.6 0.7 0.7 0.7 0.7 0.7 0.0 0.7 0.7 0.7 0.7 0.7 0.0 Thailand 0.4 0.4 0.4 0.4 0.4 0.4 0.0 0.4 0.4 0.4 0.4 0.4 0.0 Vietnam 0.3 0.3 0.4 0.3 0.3 0.3 0.0 0.3 0.3 0.3 0.3 0.3 0.0 Asia others 0.2 0.2 0.2 0.2 0.2 0.2 0.0 0.3 0.3 0.3 0.3 0.3 0.0Other Asia* 3.5 3.5 3.6 3.6 3.6 3.6 0.0 3.6 3.6 3.6 3.5 3.6 0.0 Argentina 0.7 0.7 0.7 0.7 0.7 0.7 0.0 0.7 0.7 0.7 0.7 0.7 0.0 Brazil 2.6 2.9 3.1 3.3 3.3 3.1 0.1 3.3 3.3 3.4 3.5 3.4 0.3 Colombia 1.0 1.0 1.0 0.9 0.9 0.9 -0.1 0.9 0.9 0.8 0.9 0.9 -0.1 Trinidad & Tobago 0.1 0.1 0.1 0.1 0.1 0.1 0.0 0.1 0.1 0.1 0.1 0.1 0.0 Latin America others 0.3 0.3 0.3 0.3 0.3 0.3 0.0 0.3 0.3 0.3 0.3 0.3 0.0Latin America 4.8 5.0 5.2 5.2 5.2 5.1 -0.1 5.2 5.2 5.3 5.4 5.3 0.2 Bahrain 0.2 0.2 0.2 0.2 0.2 0.2 0.0 0.2 0.2 0.2 0.2 0.2 0.0 Oman 0.9 0.9 1.0 1.0 1.0 1.0 0.0 1.0 1.0 1.0 1.0 1.0 0.0 Syria 0.1 0.0 0.0 0.0 0.0 0.0 0.0 0.0 0.0 0.0 0.0 0.0 0.0 Yemen 0.1 0.1 0.0 0.0 0.0 0.0 0.0 0.0 0.0 0.0 0.0 0.0 0.0Middle East 1.4 1.3 1.3 1.3 1.3 1.3 0.0 1.2 1.2 1.2 1.2 1.2 0.0 Chad 0.1 0.1 0.1 0.1 0.1 0.1 0.0 0.1 0.1 0.1 0.1 0.1 0.0 Congo 0.3 0.3 0.3 0.3 0.3 0.3 0.0 0.3 0.3 0.4 0.4 0.3 0.0 Egypt 0.7 0.7 0.7 0.7 0.7 0.7 0.0 0.7 0.7 0.7 0.7 0.7 0.0 Equatorial Guinea 0.3 0.3 0.3 0.3 0.3 0.3 0.0 0.3 0.3 0.3 0.3 0.3 0.0 South Africa 0.2 0.1 0.1 0.1 0.1 0.1 0.0 0.2 0.2 0.2 0.2 0.2 0.0 Sudans 0.2 0.3 0.3 0.3 0.3 0.3 0.0 0.3 0.3 0.3 0.3 0.3 0.0 Africa other 0.3 0.3 0.3 0.3 0.4 0.3 0.0 0.3 0.3 0.3 0.4 0.3 0.0Africa 2.1 2.1 2.1 2.1 2.2 2.1 0.0 2.1 2.2 2.2 2.2 2.2 0.1Total DCs 11.8 12.0 12.2 12.2 12.3 12.1 -0.1 12.2 12.2 12.3 12.4 12.3 0.2FSU 13.6 13.5 13.7 13.7 14.2 13.9 0.2 13.9 13.8 13.9 14.0 13.9 0.0 Russia 10.6 10.7 10.8 11.0 11.3 11.1 0.2 11.0 11.0 11.1 11.1 11.0 -0.1 Kazakhstan 1.6 1.6 1.6 1.4 1.7 1.6 0.0 1.7 1.7 1.7 1.7 1.7 0.1 Azerbaijan 0.9 0.9 0.9 0.8 0.8 0.9 0.0 0.8 0.8 0.8 0.8 0.8 0.0 FSU others 0.4 0.4 0.4 0.4 0.4 0.4 0.0 0.4 0.4 0.4 0.4 0.4 0.0
Other Europe 0.1 0.1 0.1 0.1 0.1 0.1 0.0 0.1 0.1 0.1 0.1 0.1 0.0China 4.2 4.3 4.4 4.0 4.0 4.1 -0.3 3.9 3.9 3.9 3.9 3.9 -0.2Non-OPEC production 52.0 54.2 55.7 54.5 55.6 55.0 -0.7 55.4 54.8 55.1 55.6 55.2 0.2Processing gains 2.1 2.2 2.2 2.2 2.2 2.2 0.0 2.2 2.2 2.2 2.2 2.2 0.0
Non-OPEC supply 54.1 56.4 57.9 56.7 57.8 57.2 -0.7 57.6 57.0 57.3 57.8 57.4 0.2 OPEC NGL 5.4 5.6 5.7 5.8 5.9 5.8 0.1 5.9 5.9 6.0 6.1 6.0 0.1 OPEC non-conventional 0.2 0.3 0.3 0.3 0.3 0.3 0.0 0.3 0.3 0.3 0.3 0.3 0.0OPEC (NGL+NCF) 5.6 5.8 5.9 6.1 6.1 6.1 0.2 6.2 6.2 6.3 6.3 6.2 0.1Non-OPEC & OPEC (NGL+NCF) 59.7 62.2 63.8 62.8 64.0 63.3 -0.5 63.8 63.3 63.5 64.2 63.7 0.4
Source: OPEC Secretariat. Totals may not add up due to independent rounding.Note: * OECD Americas includes Chile. Other Asia includes Indonesia.
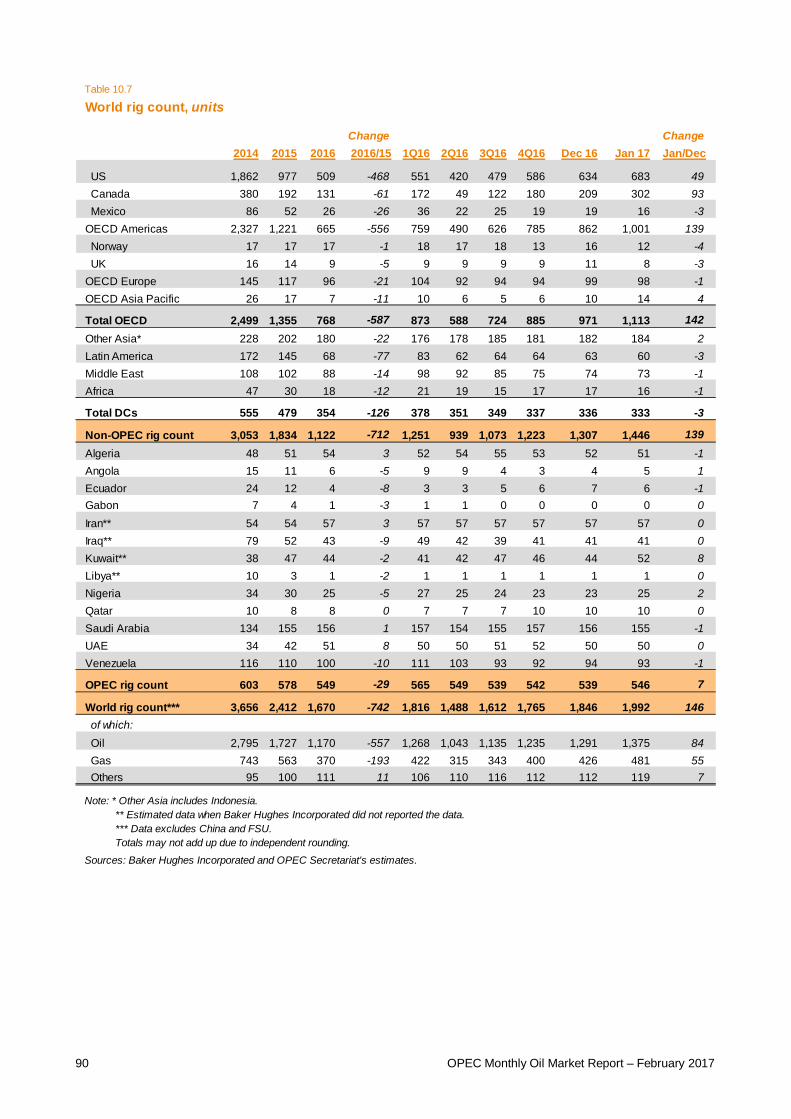
90 OPEC Monthly Oil Market Report – February 2017
Table 10.7
World rig count, units
Change Change2014 2015 2016 2016/15 1Q16 2Q16 3Q16 4Q16 Dec 16 Jan 17 Jan/Dec
US 1,862 977 509 -468 551 420 479 586 634 683 49 Canada 380 192 131 -61 172 49 122 180 209 302 93 Mexico 86 52 26 -26 36 22 25 19 19 16 -3OECD Americas 2,327 1,221 665 -556 759 490 626 785 862 1,001 139 Norway 17 17 17 -1 18 17 18 13 16 12 -4 UK 16 14 9 -5 9 9 9 9 11 8 -3OECD Europe 145 117 96 -21 104 92 94 94 99 98 -1OECD Asia Pacific 26 17 7 -11 10 6 5 6 10 14 4
Total OECD 2,499 1,355 768 -587 873 588 724 885 971 1,113 142Other Asia* 228 202 180 -22 176 178 185 181 182 184 2Latin America 172 145 68 -77 83 62 64 64 63 60 -3Middle East 108 102 88 -14 98 92 85 75 74 73 -1Africa 47 30 18 -12 21 19 15 17 17 16 -1
Total DCs 555 479 354 -126 378 351 349 337 336 333 -3
Non-OPEC rig count 3,053 1,834 1,122 -712 1,251 939 1,073 1,223 1,307 1,446 139Algeria 48 51 54 3 52 54 55 53 52 51 -1Angola 15 11 6 -5 9 9 4 3 4 5 1Ecuador 24 12 4 -8 3 3 5 6 7 6 -1Gabon 7 4 1 -3 1 1 0 0 0 0 0Iran** 54 54 57 3 57 57 57 57 57 57 0Iraq** 79 52 43 -9 49 42 39 41 41 41 0Kuwait** 38 47 44 -2 41 42 47 46 44 52 8Libya** 10 3 1 -2 1 1 1 1 1 1 0Nigeria 34 30 25 -5 27 25 24 23 23 25 2Qatar 10 8 8 0 7 7 7 10 10 10 0Saudi Arabia 134 155 156 1 157 154 155 157 156 155 -1UAE 34 42 51 8 50 50 51 52 50 50 0Venezuela 116 110 100 -10 111 103 93 92 94 93 -1
OPEC rig count 603 578 549 -29 565 549 539 542 539 546 7
World rig count*** 3,656 2,412 1,670 -742 1,816 1,488 1,612 1,765 1,846 1,992 146 of which: Oil 2,795 1,727 1,170 -557 1,268 1,043 1,135 1,235 1,291 1,375 84 Gas 743 563 370 -193 422 315 343 400 426 481 55 Others 95 100 111 11 106 110 116 112 112 119 7
Note: * Other Asia includes Indonesia. ** Estimated data when Baker Hughes Incorporated did not reported the data. *** Data excludes China and FSU. Totals may not add up due to independent rounding.
Sources: Baker Hughes Incorporated and OPEC Secretariat's estimates.

OPEC Monthly Oil Market Report – February 2017 91

Monthly Endnotes
92 OPEC Monthly Oil Market Report – February 2017
Monthly Endnotes OPEC-non-OPEC producers reaffirm commitment on cooperation at inaugural meeting of JMMC The Joint OPEC-Non-OPEC Ministerial Monitoring Committee (JMMC) held its inaugural meeting on 22 January 2017 at the OPEC Secretariat in Vienna, Austria.
The JMMC was established following OPEC’s 171st Ministerial Conference Decision of 30 November 2016 and the subsequent Declaration of Cooperation made at the joint OPEC-non-OPEC ministerial meeting held on 10 December 2016. The JMMC is tasked with ensuring that the objectives of OPEC’s 171st Ministerial Conference Decision and the Declaration of Cooperation are achieved through successful implementation of voluntary adjustments in production. The JMMC will also facilitate the exchange of joint analyses and outlooks, which will provide valuable input to the evaluation of the conformity process.
At the December meeting, 11 non-OPEC oil producers cooperated with the 13 OPEC Member Countries in a concerted effort to accelerate the rebalancing of the global oil market through an adjustment in combined production of 1.8 mb/d. The resulting Declaration, which came into effect on 1 January 2017, is for six months, and is extendable for an additional six months pending the status of supply and demand, as well as global inventories.
The JMMC is composed of three OPEC Member Countries – Algeria, Kuwait and Venezuela, and two non-OPEC countries – the Russian Federation and Oman.
At the meeting, the members of the JMMC reaffirmed their commitment to joint cooperation for the achievement of a lasting stability in the oil market in the interest of oil producers and consumers. The Committee agreed to full and timely conformity to the agreement with the following stipulations:
The OPEC Secretariat will present a monthly production data report on OPEC Member Countries’ crude oil and of the participating non-OPEC oil liquid production to the JMMC by the 17th of each upcoming month.
Evaluation of conformity to the respective country production adjustment will be based on production data only.
Each of the five member countries of the JMMC will nominate one technical contact person, to form a Joint Technical Committee (JTC), which shall include the Presidency of the OPEC Conference and shall assist the respective Ministers. The JTC will regularly cooperate with the OPEC Secretariat in preparing the monthly report for the JMMC and meet on a monthly basis before submitting their report to the JMMC.
The JMMC will communicate monthly, after the 17th of each upcoming month, to consider the reports presented by the JTC and the OPEC Secretariat, as well as meet after the 17th of March 2017 and before the OPEC Conference in May 2017.
The JMMC will issue a monthly press release on the progress towards the implementation of the OPEC 171st Ministerial Conference Decision and the Declaration of Cooperation.
The JMMC will report to the Conference on the effect of the implementation of the OPEC 171st Ministerial Conference Decision and the Declaration of Cooperation on the market.
In its review of the market, the JMMC expressed its satisfaction regarding the strong level of commitment to the agreed framework.
Glossary of terms
OPEC Monthly Oil Market Report – February 2017 93
Glossary of Terms Abbreviations b barrels b/d barrels per day bp basis points bb billion barrels bcf billion cubic feet
cu m cubic metres
mb million barrels mb/d million barrels per day mmbtu million British thermal units mn million m-o-m month-on-month
q-o-q quarter-on-quarter
pp percentage points
tb/d thousand barrels per day tcf trillion cubic feet
y-o-y year-on-year y-t-d year-to-date Acronyms ARA Amsterdam-Rotterdam-Antwerp
BoE Bank of England BoJ Bank of Japan BOP Balance of payments BRIC Brazil, Russia, India and China
CAPEX capital expenditures CFTC Commodity Futures Trading Commission CIF cost, insurance and freight CPI consumer price index
DCs developing countries DUC drilled, but uncompleted (oil well)
ECB European Central Bank EIA US Energy Information Administration Emirates NBD Emirates National Bank of Dubai EMs emerging markets EV electric vehicle
FAI fixed asset investment FCC fluid catalytic cracking FDI foreign direct investment Fed US Federal Reserve FID final investment decision FOB free on board FPSO floating production storage and offloading FSU Former Soviet Union FX Foreign Exchange FY fiscal year
GDP gross domestic product GFCF gross fixed capital formation GoM Gulf of Mexico GTLs gas-to-liquids

Glossary of terms
94 OPEC Monthly Oil Market Report – February 2017
HH Henry Hub HSFO high-sulphur fuel oil SRFO straight-run fuel oil
ICE Intercontinental Exchange IEA International Energy Agency IMF International Monetary Fund IOCs international oil companies ISM Institute of Supply Management
LIBOR London inter-bank offered rate LLS Light Louisiana Sweet LNG liquefied natural gas LPG liquefied petroleum gas LR long-range (vessel) LSFO low-sulphur fuel oil
MCs (OPEC) Member Countries MED Mediterranean MENA Middle East/North Africa MOMR (OPEC) Monthly Oil Market Report MPV multi-purpose vehicle MR medium-range or mid-range (vessel)
NBS National Bureau of Statistics NGLs natural gas liquids NPC National People’s Congress (China) NWE Northwest Europe NYMEX New York Mercantile Exchange
OECD Organisation for Economic Co-operation and Development OPEX operational expenditures OIV total open interest volume ORB OPEC Reference Basket
PADD Petroleum Administration for Defense Districts PBoC People’s Bank of China PMI purchasing managers’ index PPI producer price index
RBI Reserve Bank of India REER real effective exchange rate ROI return on investment
SAAR seasonally-adjusted annualized rate SIAM Society of Indian Automobile Manufacturers SUV sports utility vehicle
ULCC ultra-large crude carrier ULSD ultra-low sulphur diesel USEC US East Coast USGC US Gulf Coast USWC US West Coast
VGO vacuum gasoil VLCC very large crude carriers
WPI wholesale price index WS Worldscale WTI West Texas Intermediate WTS West Texas Sour
OPEC Monthly Oil Market Report – February 2017 95
Contributors to the OPEC Monthly Oil Market Report Editor-in-Chief Oswaldo Tapia, Head, Energy Studies Department, In Charge of Research Division email: otapia(at)opec.org Editor Hojatollah Ghanimi Fard, Head, Petroleum Studies Department email: h.ghanimifard(at)opec.org Analysts Crude Oil Price Movements Eissa Alzerma
email: ealzerma(at)opec.org
Commodity Markets Hector Hurtado email: hhurtado(at)opec.org
World Economy Afshin Javan email: ajavan(at)opec.org Imad Al-Khayyat email: ial-khayyat(at)opec.org Joerg Spitzy
email: jspitzy(at)opec.org
World Oil Demand Hassan Balfakeih email: hbalfakeih(at)opec.org
World Oil Supply Mohammad Ali Danesh email: mdanesh(at)opec.org
Product Markets and Refinery Operations Elio Rodriguez email: erodriguez(at)opec.org
Tanker Market and Oil Trade Anisah Almadhayyan email: aalmadhayyan(at)opec.org
Stock Movements Aziz Yahyai email: ayahyai(at)opec.org
Monthly Endnotes Douglas Linton email: dlinton(at)opec.org Technical and editorial team Aziz Yahyai
email: ayahyai(at)opec.org Douglas Linton email: dlinton(at)opec.org
Statistical services Adedapo Odulaja, Head, Data Services Department (aodulaja(at)opec.org), Hossein Hassani, Statistical Systems Coordinator (hhassani(at)opec.org), Pantelis Christodoulides (World Oil Demand), Klaus Stoeger (World Oil Supply), Mouhamad Moudassir (Product Markets and Refinery Operations), Mohammad Sattar (Crude Oil Price Movements, Commodity Markets, Tanker Market, Oil Trade), Ryszard Pospiech (World Economy, Stock Movements) Editing, production, design and circulation Alvino-Mario Fantini, Maureen MacNeill, Scott Laury, Viveca Hameder, Hataichanok Leimlehner, Liane-Sophie Hamamciyan, Andrea Birnbach

96 OPEC Monthly Oil Market Report – February 2017
Disclaimer
The data, analysis and any other information contained in the Monthly Oil Market Report (the “MOMR”) is for informational purposes only and is not intended as a substitute for advice from your business, finance, investment consultant or other professional. The views expressed in the MOMR are those of the OPEC Secretariat and do not necessarily reflect the views of its Governing Bodies and/or individual OPEC Member Countries.
Whilst reasonable efforts have been made to ensure the accuracy of the MOMR’s content, the OPEC Secretariat makes no warranties or representations as to its accuracy, currency reference or comprehensiveness, and assumes no liability or responsibility for any inaccuracy, error or omission, or for any loss or damage arising in connection with or attributable to any action or decision taken as a result of using or relying on the information in the MOMR.
The MOMR may contain references to material(s) from third parties whose copyright must be acknowledged by obtaining necessary authorization from the copyright owner(s). The OPEC Secretariat shall not be liable or responsible for any unauthorized use of third party material(s). All rights of the Publication shall be reserved to the OPEC Secretariat, including every exclusive economic right, in full or per excerpts, with special reference but without limitation, to the right to publish it by press and/or by any communications medium whatsoever, including Internet; translate, include in a data base, make changes, transform and process for any kind of use, including radio, television or cinema adaptations, as well as sound-video recording, audio-visual screenplays and electronic processing of any kind and nature whatsoever.
Full reproduction, copying or transmission of the MOMR is not permitted in any form or by any means by third parties without the OPEC Secretariat’s written permission, however the information contained therein may be used and/or reproduced for educational and other non-commercial purposes without the OPEC Secretariat’s prior written permission, provided that OPEC is fully acknowledged as the copyright holder.
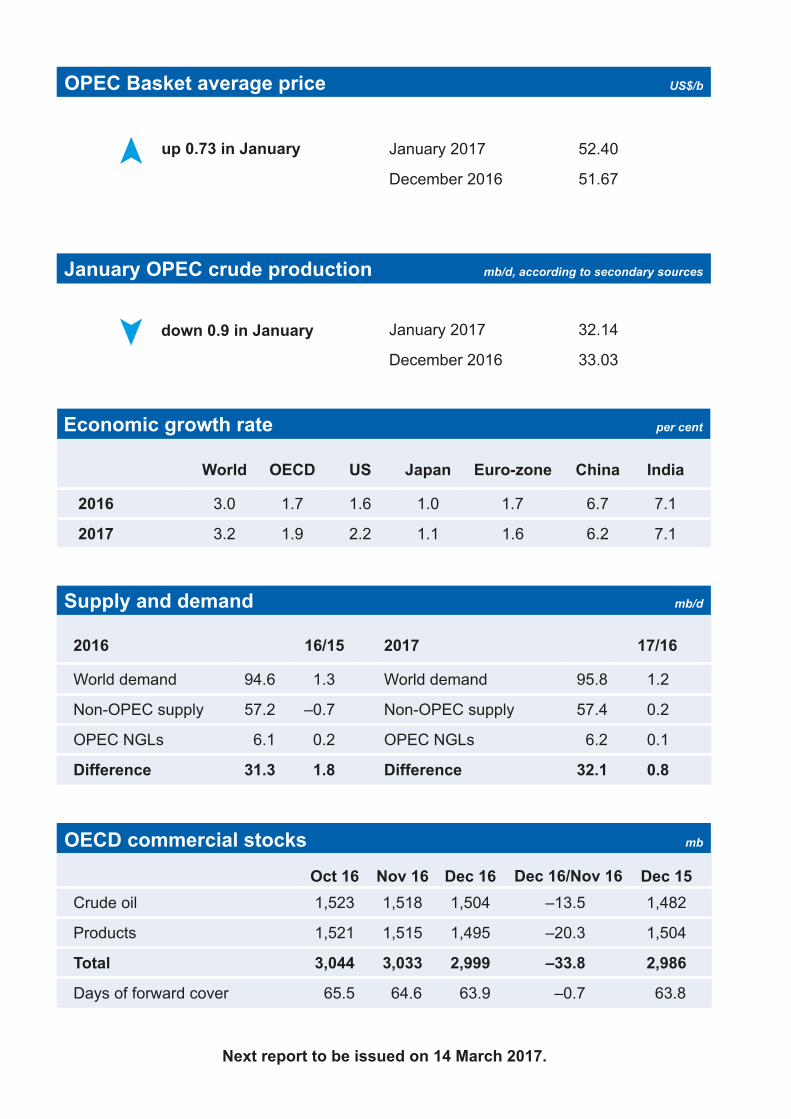
Next report to be issued on 14 March 2017.
OPEC Basket average price US$/b
January OPEC crude production mb/d, according to secondary sources
Economic growth rate per cent
up 0.73 in January
down 0.9 in January
January 2017 52.40
December 2016 51.67
January 2017 32.14
December 2016 33.03
World OECD US Japan Euro-zone China India
2016 3.0 1.7 1.6 1.0 1.7 6.7 7.1
2017 3.2 1.9 2.2 1.1 1.6 6.2 7.1
Supply and demand mb/d
OECD commercial stocks mb
2016 16/15 2017 17/16
World demand 94.6 1.3 World demand 95.8 1.2
Non-OPEC supply 57.2 –0.7 Non-OPEC supply 57.4 0.2
OPEC NGLs 6.1 0.2 OPEC NGLs 6.2 0.1
Difference 31.3 1.8 Difference 32.1 0.8
Oct 16 Nov 16 Dec 16 Dec 16/Nov 16 Dec 15Crude oil 1,523 1,518 1,504 –13.5 1,482
Products 1,521 1,515 1,495 –20.3 1,504
Total 3,044 3,033 2,999 –33.8 2,986
Days of forward cover 65.5 64.6 63.9 –0.7 63.8