opec · 2020-02-11 · opec monthly oil market report – october 2019 i contributors to the opec...
TRANSCRIPT
Monthly Oil Market ReportO P E C
10 October 2019
Feature article:Winter oil market outlook
Oil market highlights
Feature article
Crude oil price movements
Commodity markets
World economy
World oil demand
World oil supply
Product markets and refinery operations
Tanker market
Oil trade
Stock movements
Balance of supply and demand
i
iii
1
9
12
32
42
60
67
71
79
85
Organization of the Petroleum Exporting Countries
Helferstorferstrasse 17, A-1010 Vienna, AustriaE-mail: prid(at)opec.orgWebsite: www.opec.org
Disclaimer
The data, analysis and any other information (the “information”) contained in the Monthly Oil Market Report (the “MOMR”) is for informational purposes only and is neither intended as a substitute for advice from business, finance, investment consultant or other professional; nor is it meant to be a benchmark or input data to a benchmark of any kind. Whilst reasonable efforts have been made to ensure the accuracy of the information contained in the MOMR, the OPEC Secretariat makes no warranties or representations as to its accuracy, relevance or comprehensiveness, and assumes no liability or responsibility for any inaccuracy, error or omission, or for any loss or damage arising in connection with or attributable to any action or decision taken as a result of using or relying on the information in the MOMR. The views expressed in the MOMR are those of the OPEC Secretariat and do not necessarily reflect the views of its governing bodies or Member Countries. The designation of geographical entities in the MOMR, and the use and presentation of data and other materials, do not imply the expression of any opinion whatsoever on the part of OPEC and/or its Member Countries concerning the legal status of any country, territory or area, or of its authorities, or concerning the exploration, exploitation, refining, marketing and utilization of its petroleum or other energy resources.
Full reproduction, copying or transmission of the MOMR is not permitted in any form or by any means by third parties without the OPEC Secretariat’s written permission, however, the information contained therein may be used and/or reproduced for educational and other non-commercial purposes without the OPEC Secretariat’s prior written permission, provided that it is fully acknowledged as the copyright holder. The MOMR may contain references to material(s) from third parties, whose copyright must be acknowledged by obtaining necessary authorization from the copyright owner(s). The OPEC Secretariat or its governing bodies shall not be liable or responsible for any unauthorized use of any third party material(s). All rights of the MOMR shall be reserved to the OPEC Secretariat, as applicable, including every exclusive economic right, in full or per excerpts, with special reference but without limitation, to the right to publish it by press and/or by any communications medium whatsoever; translate, include in a data base, make changes, transform and process for any kind of use, including radio, television or cinema adaptations, as well as a sound-video recording, audio-visual screenplays and electronic processing of any kind and nature whatsoever.

OPEC Monthly Oil Market Report – October 2019 i
Contributors to the OPEC Monthly Oil Market Report
Chairman of the Editorial Board HE Mohammad Sanusi Barkindo, Secretary General
Editor-in-Chief Dr. Ayed S. Al-Qahtani, Director, Research Division email: aalqahtani(at)opec.org
Editor Behrooz Baikalizadeh, Head, Petroleum Studies Department email: bbaikalizadeh(at)opec.org
Analysts Crude Oil Price Movements Yacine Sariahmed email: ysariahmed(at)opec.org
Commodity Markets Hector Hurtado email: hhurtado(at)opec.org
World Economy Afshin Javan email: ajavan(at)opec.org Imad Al-Khayyat email: ial-khayyat(at)opec.org Joerg Spitzy
email: jspitzy(at)opec.org
World Oil Demand Hassan Balfakeih email: hbalfakeih(at)opec.org
World Oil Supply Mohammad Ali Danesh email: mdanesh(at)opec.org
Product Markets and Refinery Operations Tona Ndamba email: tndamba(at)opec.org
Tanker Market and Oil Trade Douglas Linton email: dlinton(at)opec.org
Stock Movements Aziz Yahyai email: ayahyai(at)opec.org
Technical team Nadir Guerer email: nguerer(at)opec.org Aziz Yahyai email: ayahyai(at)opec.org Douglas Linton email: dlinton(at)opec.org Viveca Hameder email: vhameder(at)opec.org
Statistical services Adedapo Odulaja, Head, Data Services Department (aodulaja(at)opec.org), Hossein Hassani, Statistical Systems Coordinator (hhassani(at)opec.org), Pantelis Christodoulides (World Oil Demand, Stock Movements), Klaus Stoeger (World Oil Supply), Mohammad Sattar (Crude Oil Price Movements, Commodity Markets, Tanker Market, Oil Trade), Mihni Mihnev (Product Markets and Refinery Operations), Justinas Pelenis (World Economy)
Editing, production, design and circulation James Griffin, Maureen MacNeill, Scott Laury, Matthew Quinn, Timothy Spence, Hataichanok Leimlehner, Liane-Sophie Hamamciyan, Andrea Birnbach

ii OPEC Monthly Oil Market Report – October 2019
Oil Market Highlights
OPEC Monthly Oil Market Report – October 2019 iii
Oil Market Highlights Crude Oil Price Movements
The OPEC Reference Basket (ORB) rose $2.74, or 4.6%, month-on-month (m-o-m) in September to settle at $62.36/b, supported by concerns about supply disruptions and geopolitical risks. In September, ICE Brent averaged $2.79, or 4.7%, m-o-m higher at $62.29/b, while NYMEX WTI rose m-o-m by $2.12, or 3.9%, to average $56.97/b. Year-to-date (y-t-d), ICE Brent was $7.98, or 11.0%, y-o-y lower at $64.75/b, while NYMEX WTI declined by $9.69, or 14.5%, y-o-y to $57.10/b. Brent and Dubai crude oil forward price structures were in steep backwardation in September, while the WTI backwardation curve flattened slightly in the front end. Hedge funds and other money managers turned slightly positive on the outlook for crude oil prices compared to a month earlier.
World Economy
The global economic growth forecast remains at 3.0% for 2019. All regions remain unchanged in terms of growth estimates for the year, with the exception of Russia, which was revised down by 0.1 pp to 1.0%, following low 1H19 growth. For 2020, the global GDP forecast was revised down to 3.0% from 3.1%. Among other issues, it seems increasingly likely that the slowing growth momentum in the US will carry over into 2020, while ongoing uncertainties surrounding the EU, including Brexit, will remain. Moreover, rising US tariffs on EU imports and ongoing US-China trade issues are dampening growth momentum. US growth was revised down by 0.1 pp to 1.8% for 2020, while Euro-zone growth remains at 1.1% and Japan at 0.3%. China’s and India’s growth forecast for next year is also unchanged at 5.9%, and 6.7%, respectively. Similarly, Brazil’s 2020 growth forecast remains unchanged at 1.4%, while Russia remains at 1.2%.
World Oil Demand
In 2019, world oil demand growth was revised down marginally by 0.04 mb/d to 0.98 mb/d, reflecting the latest available data in OECD Americas and Asia Pacific which necessitated the downward adjustment. In 2020, world oil demand is forecast to grow by 1.08 mb/d, in line with last month’s projections. OECD countries are anticipated to add 0.07 mb/d to global oil requirements in 2020, while non-OECD countries are projected to be the largest contributor to world oil demand growth by adding an estimated 1.01 mb/d, both unchanged from the last month’s projections. As a result, total world oil demand is anticipated to average 99.8 mb/d in 2019 and 100.88 mb/d in 2020.
World Oil Supply The non-OPEC oil supply growth forecast for 2019 was revised down by 0.16 mb/d from the previous assessment to a level of 1.82 mb/d. This is due to downward revisions mainly in the US, as well as in Norway and the UK, which outpaced upward revisions in Kazakhstan and China, among others. US oil supply growth has now been revised down to 1.67 mb/d y-o-y. The non-OPEC oil supply growth forecast for 2020 was revised down by 0.05 mb/d from last month’s assessment to 2.20 mb/d y-o-y due to downward revisions to Kazakhstan and Russia, which outpaced upward revisions, mainly to China. The 2020 non-OPEC supply forecast remains subject to many uncertainties including oil price levels, capital spending, infrastructure constraints, as well as drilling and completion activities, particularly in the US. OPEC NGLs were revised down by 0.02 mb/d and are now expected to grow by 0.05 mb/d to average 4.81 mb/d in 2019, while growth will slow to 0.03 mb/d in 2020, reaching 4.84 mb/d. In September, OPEC crude oil production decreased by 1,318 tb/d to average 28.49 mb/d, according to secondary sources.
Oil Market Highlights
iv OPEC Monthly Oil Market Report – October 2019
Product Markets and Refining Operations
Globally, product markets saw mixed performances last month. In the US, product markets saw gains mainly supported by positive developments at the middle and bottom of the barrel, as refinery intake cuts from both scheduled maintenance and unplanned weather-related outages affected product prices, providing a lift in cracks. In Europe, the top of the barrel weakened, mainly due to lacklustre regional demand amid slower gasoline exports to the US. Asian product markets showed the strongest positive performance compared with the other main regions, benefiting from solid gains recorded across the barrel. Strong gasoline spot deliveries to India as well as lower naphtha availability in the region, which led to higher prices for the same product, were the main contributors to the upside momentum.
Tanker Market
Average dirty tanker spot freight rates rose 25% m-o-m in September, with gains experienced across all classes. The seasonal upward trend was amplified by unplanned disruptions, allowing rates to recover from the relatively sluggish performance seen for most of this year, which has been due in part to a high level of new deliveries in the first half of 2019. Compared to a year ago, only VLCCs exhibited positive performances, which were offset by the cumulative declines in Suezmax and Aframax. In the clean tanker market, spot freight rates remained at low levels in September, weighed down by ample availability lists, particularly West of Suez.
Stock Movements
Preliminary data for August showed that total OECD commercial oil stocks rose by 10.0 mb m-o-m to stand at 2,937 mb, which is 85 mb higher than the same time one year ago, and 11 mb above the latest five-year average. Within the components, crude stocks fell by 21.9 mb m-o-m to stand at 28 mb below the latest five-year average, while product stocks rose by 32 mb m-o-m to remain 39 mb above the latest five-year average. In terms of days of forward cover, OECD commercial stocks rose by 0.4 days m-o-m in August to stand at 60.9 days, which is 1.6 days above the same period in 2018, but 1.2 days below the latest five-year average.
Balance of Supply and Demand
Demand for OPEC crude in 2019 was revised up by 0.1 mb/d from the previous report to stand at 30.7 mb/d, which is 0.9 mb/d lower than the 2018 level. Demand for OPEC crude in 2020 was also revised up by 0.2 mb/d from the previous report to stand at 29.6 mb/d, which is around 1.2 mb/d lower than the 2019 level.
Feature Article
OPEC Monthly Oil Market Report – October 2019 v
Feature Article
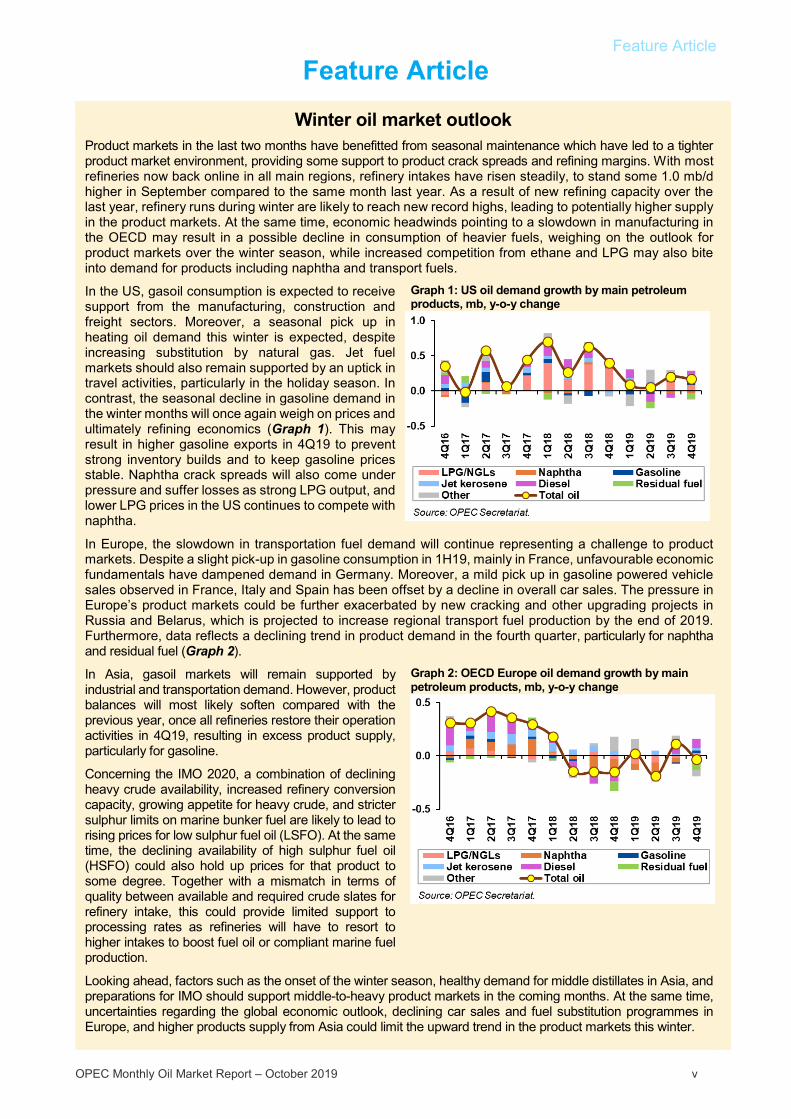
Winter oil market outlook Product markets in the last two months have benefitted from seasonal maintenance which have led to a tighter product market environment, providing some support to product crack spreads and refining margins. With most refineries now back online in all main regions, refinery intakes have risen steadily, to stand some 1.0 mb/d higher in September compared to the same month last year. As a result of new refining capacity over the last year, refinery runs during winter are likely to reach new record highs, leading to potentially higher supply in the product markets. At the same time, economic headwinds pointing to a slowdown in manufacturing in the OECD may result in a possible decline in consumption of heavier fuels, weighing on the outlook for product markets over the winter season, while increased competition from ethane and LPG may also bite into demand for products including naphtha and transport fuels.
In the US, gasoil consumption is expected to receive support from the manufacturing, construction and freight sectors. Moreover, a seasonal pick up in heating oil demand this winter is expected, despite increasing substitution by natural gas. Jet fuel markets should also remain supported by an uptick in travel activities, particularly in the holiday season. In contrast, the seasonal decline in gasoline demand in the winter months will once again weigh on prices and ultimately refining economics (Graph 1). This may result in higher gasoline exports in 4Q19 to prevent strong inventory builds and to keep gasoline prices stable. Naphtha crack spreads will also come under pressure and suffer losses as strong LPG output, and lower LPG prices in the US continues to compete with naphtha.
Graph 1: US oil demand growth by main petroleum products, mb, y-o-y change
In Europe, the slowdown in transportation fuel demand will continue representing a challenge to product markets. Despite a slight pick-up in gasoline consumption in 1H19, mainly in France, unfavourable economic fundamentals have dampened demand in Germany. Moreover, a mild pick up in gasoline powered vehicle sales observed in France, Italy and Spain has been offset by a decline in overall car sales. The pressure in Europe’s product markets could be further exacerbated by new cracking and other upgrading projects in Russia and Belarus, which is projected to increase regional transport fuel production by the end of 2019. Furthermore, data reflects a declining trend in product demand in the fourth quarter, particularly for naphtha and residual fuel (Graph 2).
In Asia, gasoil markets will remain supported by industrial and transportation demand. However, product balances will most likely soften compared with the previous year, once all refineries restore their operation activities in 4Q19, resulting in excess product supply, particularly for gasoline.
Concerning the IMO 2020, a combination of declining heavy crude availability, increased refinery conversion capacity, growing appetite for heavy crude, and stricter sulphur limits on marine bunker fuel are likely to lead to rising prices for low sulphur fuel oil (LSFO). At the same time, the declining availability of high sulphur fuel oil (HSFO) could also hold up prices for that product to some degree. Together with a mismatch in terms of quality between available and required crude slates for refinery intake, this could provide limited support to processing rates as refineries will have to resort to higher intakes to boost fuel oil or compliant marine fuel production.
Graph 2: OECD Europe oil demand growth by main petroleum products, mb, y-o-y change
Looking ahead, factors such as the onset of the winter season, healthy demand for middle distillates in Asia, and preparations for IMO should support middle-to-heavy product markets in the coming months. At the same time, uncertainties regarding the global economic outlook, declining car sales and fuel substitution programmes in Europe, and higher products supply from Asia could limit the upward trend in the product markets this winter.

Feature Article
vi OPEC Monthly Oil Market Report – October 2019
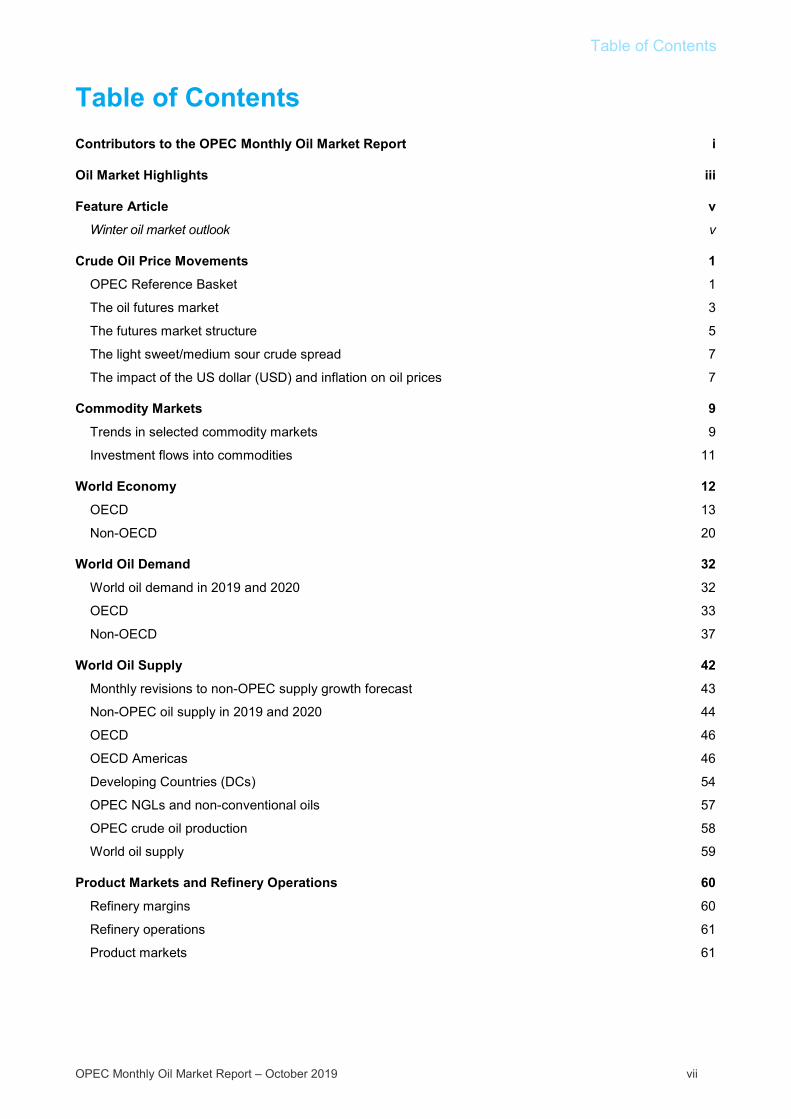
Table of Contents
OPEC Monthly Oil Market Report – October 2019 vii
Table of Contents Contributors to the OPEC Monthly Oil Market Report i
Oil Market Highlights iii
Feature Article v Winter oil market outlook v
Crude Oil Price Movements 1 OPEC Reference Basket 1 The oil futures market 3 The futures market structure 5 The light sweet/medium sour crude spread 7 The impact of the US dollar (USD) and inflation on oil prices 7
Commodity Markets 9 Trends in selected commodity markets 9 Investment flows into commodities 11
World Economy 12 OECD 13 Non-OECD 20
World Oil Demand 32 World oil demand in 2019 and 2020 32 OECD 33 Non-OECD 37
World Oil Supply 42 Monthly revisions to non-OPEC supply growth forecast 43 Non-OPEC oil supply in 2019 and 2020 44 OECD 46 OECD Americas 46 Developing Countries (DCs) 54 OPEC NGLs and non-conventional oils 57 OPEC crude oil production 58 World oil supply 59
Product Markets and Refinery Operations 60 Refinery margins 60 Refinery operations 61 Product markets 61
Table of Contents
viii OPEC Monthly Oil Market Report – October 2019
Tanker Market 67 Spot fixtures 67 Sailings and arrivals 67 Dirty tanker freight rates 68 Clean tanker freight rates 70
Oil Trade 71 US 71 China 72 India 73 Japan 74 OECD Europe 75 FSU 77
Stock Movements 79 OECD 79 US 81 Japan 82 EU plus Norway 83 Singapore, Amsterdam-Rotterdam-Antwerp (ARA) and Fujairah 84
Balance of Supply and Demand 85 Balance of supply and demand in 2019 85
Appendix 87
Glossary of Terms 93 Abbreviations 93 Acronyms 94
Crude Oil Price Movements
OPEC Monthly Oil Market Report – October 2019 1
Crude Oil Price Movements
The OPEC Reference Basket (ORB) rebounded in September from the low level registered last month, mainly supported by supply disruptions and heightened geopolitical tensions in the Middle East. The ORB value rose by $2.74, or 4.6% in September to settle at $62.36/b.
Crude oil futures prices recovered in September with ICE Brent on average $2.79, or 4.7%, m-o-m higher at $62.29/b, and NYMEX WTI up m-o-m by $2.12, or 3.9%, to average $56.97/b. However, y-t-d, ICE Brent was $7.98, or 11.0%, lower at $64.75/b, while NYMEX WTI declined by $9.69, or 14.5%, to $57.10/b, compared with the same period a year earlier. DME Oman crude oil futures also increased m-o-m by $2.58 in September, or 4.4%, to settle at $61.86/b. Y-t-d, DME Oman was down by $6.13, or 8.7%, at $64.35/b, compared with the same period a year earlier.
Hedge funds and other money managers turned slightly positive on crude oil price outlooks compared with the end of last month, raising their net long positions in both Brent and WTI. High uncertainty about the global economy and the ongoing trade disputes limited the increase.
ICE Brent and DME Oman crude oil forward price structures were in steep backwardation in September. Prompt month contracts rose the most, as concerns about a supply shortage raised demand for prompt cargoes. However, the backwardation curve structure of NYMEX WTI flattened slightly in the front end.
Sweet/sour differentials widened in all markets, particularly in Europe and Asia, as international benchmark Brent was supported by geopolitical tensions and growing demand for sweeter crudes ahead of the International Maritime Organization’s (IMO) 2020 low sulphur fuel oil requirements.
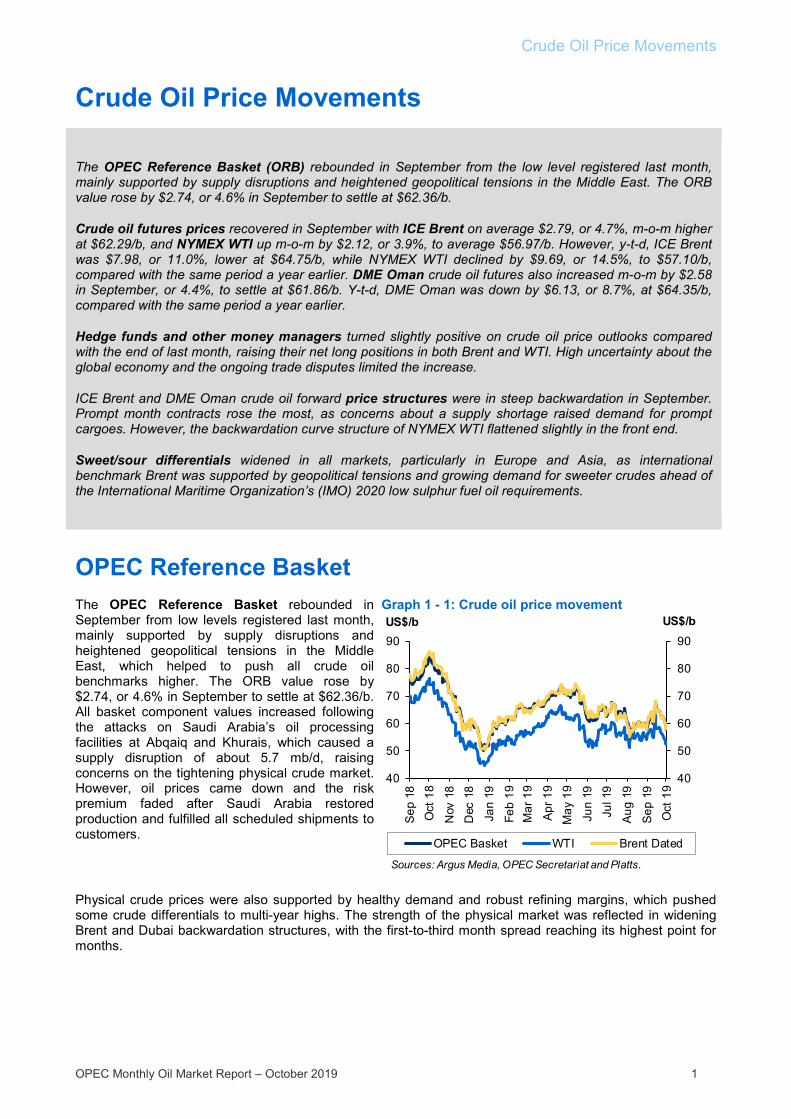
OPEC Reference Basket The OPEC Reference Basket rebounded in September from low levels registered last month, mainly supported by supply disruptions and heightened geopolitical tensions in the Middle East, which helped to push all crude oil benchmarks higher. The ORB value rose by $2.74, or 4.6% in September to settle at $62.36/b. All basket component values increased following the attacks on Saudi Arabia’s oil processing facilities at Abqaiq and Khurais, which caused a supply disruption of about 5.7 mb/d, raising concerns on the tightening physical crude market. However, oil prices came down and the risk premium faded after Saudi Arabia restored production and fulfilled all scheduled shipments to customers.
Graph 1 - 1: Crude oil price movement
Physical crude prices were also supported by healthy demand and robust refining margins, which pushed some crude differentials to multi-year highs. The strength of the physical market was reflected in widening Brent and Dubai backwardation structures, with the first-to-third month spread reaching its highest point for months.
40
50
60
70
80
90
40
50
60
70
80
90
Sep
18
Oct
18
Nov
18
Dec
18
Jan
19
Feb
19M
ar 1
9
Apr
19
May
19
Jun
19Ju
l 19
Aug
19
Sep
19
Oct
19
US$/bUS$/b
OPEC Basket WTI Brent Dated
Sources: Argus Media, OPEC Secretariat and Platts.

Crude Oil Price Movements
2 OPEC Monthly Oil Market Report – October 2019
Oil prices also found support from declining US crude oil stocks, which continued to fall for four consecutive weeks to the week of 6 September, declining by about 24 mb. US crude oil stocks were about 66 mb lower, in the week to 20 September, compared with early June levels, according to US Energy Information Administration (EIA) weekly data.
However, the ORB value declined in late September on the faster-than-expected recovery of Saudi Arabian production and concerns about the slowing global economy and oil demand growth, amid the ongoing trade dispute between the US and China.
M-o-m, the ORB value rose by $2.74, or 4.6%, to settle at $62.36/b on a monthly average. Y-t-d, the ORB value was $5.96, or 8.5%, lower at $64.38/b.
Table 1 - 1: OPEC Reference Basket and selected crudes, US$/b
All ORB component values increased in September, along with their respective crude benchmarks, particularly lighter and sweeter components linked to the Brent benchmark. Heavier components also increased but at a slower pace, except for Venezuela’s Merey, which jumped by about 26% m-o-m. Crude oil physical benchmarks also increased m-o-m. North Sea Dated was up by $3.74 to $62.57/b, while Dubai and WTI values rose respectively, by $2.23 and $2.02 to settle at $61.11/b and $56.86/b.
Light sweet crude ORB components from West and North Africa – including Bonny Light, Djeno, Es Sider, Girassol, Rabi Light, Sahara Blend and Zafiro – rose firmly in September, growing by $3.80 on average, or 6.4%, m-o-m to $62.92/b, supported by robust demand and strong refining margins. Light and medium sweet crude differentials rose further last month, supported by strong Asian demand as some refiners preemptively increased their purchases to secure alternatives to Middle East light crude. The premium of some West African crude differentials to North Sea Dated reached their highest point in years.
Aug 19 Sep 19 Sep/Aug % 2018 2019
Basket 59.62 62.36 2.74 4.6 70.34 64.38 Arab Light 60.84 62.74 1.90 3.1 71.10 65.26 Basrah Light 59.20 61.85 2.65 4.5 69.14 64.01 Bonny Light 60.46 64.02 3.56 5.9 72.96 66.07 Djeno 56.23 59.97 3.74 6.7 69.48 61.94 Es Sider 58.38 62.32 3.94 6.7 70.68 63.91 Girassol 61.64 65.36 3.72 6.0 72.48 66.34 Iran Heavy 57.77 60.32 2.55 4.4 68.70 62.23 Kuwait Export 60.35 62.16 1.81 3.0 69.28 64.54 Merey 49.17 61.79 12.62 25.7 64.38 56.63 Murban 60.19 62.39 2.20 3.7 72.79 65.10 Oriente 56.09 57.47 1.38 2.5 67.09 60.68 Rabi Light 58.08 61.82 3.74 6.4 71.15 63.79 Sahara Blend 58.23 62.47 4.24 7.3 72.43 64.64 Zafiro 60.81 64.47 3.66 6.0 72.07 65.93
Other Crudes Dated Brent 58.83 62.57 3.74 6.4 72.11 64.54 Dubai 58.88 61.11 2.23 3.8 70.12 63.98 Isthmus 58.71 62.07 3.36 5.7 69.01 63.90 LLS 58.61 60.39 1.78 3.0 71.09 63.35 Mars 57.10 58.37 1.27 2.2 67.61 61.82 Minas 57.40 60.18 2.78 4.8 66.59 60.32 Urals 59.95 61.65 1.70 2.8 70.79 64.69 WTI 54.84 56.86 2.02 3.7 66.92 57.06
Differentials Brent/WTI 3.99 5.71 1.72 - 5.20 7.49 Brent/LLS 0.22 2.18 1.96 - 1.02 1.19 Brent/Dubai -0.05 1.46 1.51 - 2.00 0.56
Sources: Argus Media, Direct Communication, OPEC Secretariat and Platts.
Change Year-to-date
Crude Oil Price Movements
OPEC Monthly Oil Market Report – October 2019 3
Nonetheless, the steep backwardation in Brent and the significant increase in freight rates in the second part of the month weighed on crude values in the Atlantic Basin.
Latin American ORB component Venezuela’s Merey jumped by $12.62, or 25.7% m-o-m, to $61.79/b on demand recovery from China and the higher value of high sulphur fuel oil (HSFO) in September. Ecuador’s Oriente also rose in September to $57.47/b, an increase of $1.38, or 2.5%.
The value of multiple-region destination grades, including Arab Light, Basrah Light, Iran Heavy and Kuwait Export, rose by $2.23, or 3.7%, for the month to $61.77/b, supported by supply disruptions and fears about lower supply from the Middle East, as well as healthy demand from Asian refiners and some recovery in HSFO values in September. The higher official selling price of most Middle East crudes for October loading to Asian markets also contributed to the increase in heavy component values.
Middle Eastern spot component Murban settled higher in September, rising by $2.20 m-o-m, or 3.7%, to $62.39/b, supported by robust refining margins for light and middle distillates in Asia, as well as a higher front-month Brent/Dubai Exchange for Swaps (EFS Dubai) which made Dubai-linked crudes more attractive to Asian refiners, compared with Brent-linked crudes from the Atlantic Basin. Murban spot values traded in September at high premium levels to the official selling price.
On 9 October, the ORB stood at $58.65/b, $3.71 below the September average.
The oil futures market Crude oil futures prices recovered in September following a large disruption in two key oil facilities in Saudi Arabia which caused a temporary outage of about 5.7 mb/d of the country’s oil production. ICE Brent prices jumped by $8.8, or about 15% in one session on 16 September as traders tried to assess the impact of the disruption on the global oil supply and balance, amid risks of heightening tension in the Middle East. Nonetheless, concerns about a slowdown in the global economy – fueled by weak macroeconomic data and an ongoing trade dispute between the US and China – dampened the global demand outlook and put downward pressure on oil prices.
Oil prices rose slightly in the first part of September, underpinned by supportive signals from OPEC+ Ministers during the 24th World Energy Congress and the JMMC in Abu Dhabi, on the need for continued commitment to the Declaration of Cooperation in support of oil market stability on a sustainable basis. Oil prices were also supported by positive economic data from China showing that the services sector expanded in August, and comments by the head of the US Federal Reserve saying that the central bank would act appropriately to support continuing growth in the US economy. An ongoing decline in US crude oil stocks for four consecutive weeks – which fell by about 24 mb – further added support.
During the first week after attacks on oil facilities in Saudi Arabia, oil prices rose significantly, as the market was mainly driven by concerns about a supply shortage and the risk of escalating tensions in the region. However, oil prices softened in the days following, after Saudi Arabia has successfully restored production to normal levels by the end of September, while all scheduled shipments to customers were fulfilled.
Oil prices declined further in late September on a fading risk premium and a faster-than-expected recovery in Saudi Arabia’s oil production, as well as signs of easing geopolitical tensions in the Middle East, while investors turned their focus to a weakening global economy and wavering oil demand amid the unsolved trade dispute between the US and China.
On a quarterly basis, ICE Brent recorded its biggest decline this year to reach its lowest quarterly average since 4Q17.
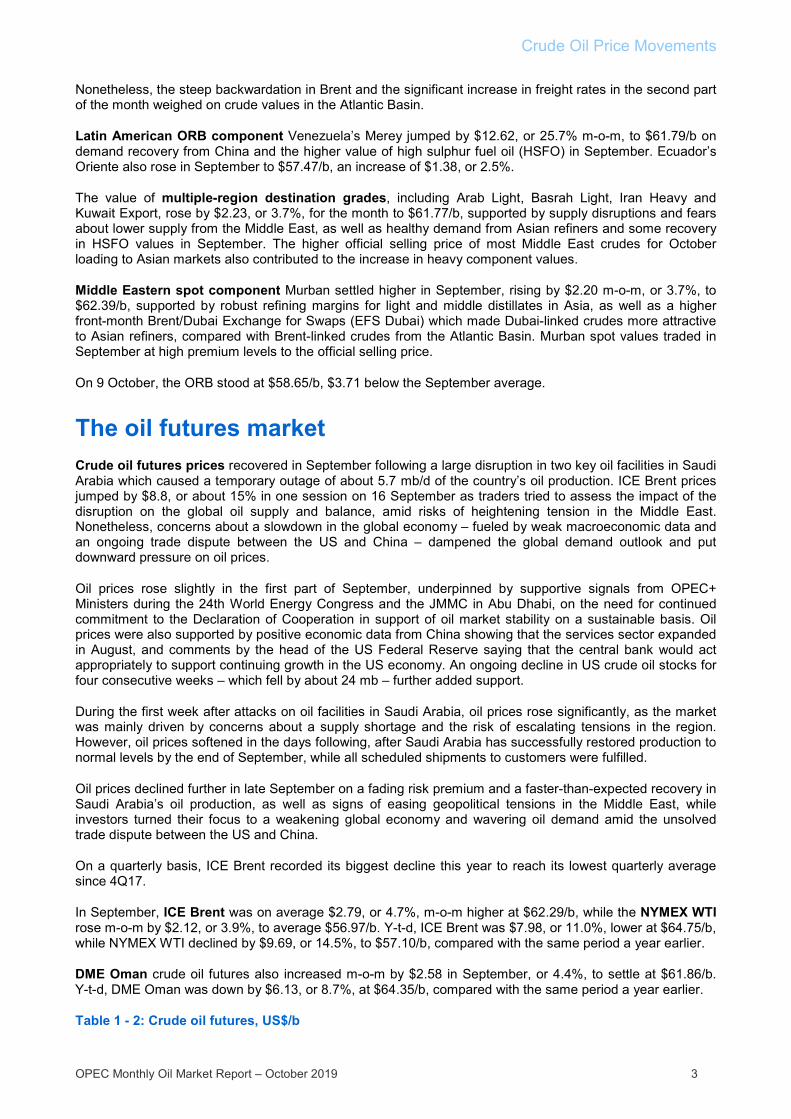
In September, ICE Brent was on average $2.79, or 4.7%, m-o-m higher at $62.29/b, while the NYMEX WTI rose m-o-m by $2.12, or 3.9%, to average $56.97/b. Y-t-d, ICE Brent was $7.98, or 11.0%, lower at $64.75/b, while NYMEX WTI declined by $9.69, or 14.5%, to $57.10/b, compared with the same period a year earlier.
DME Oman crude oil futures also increased m-o-m by $2.58 in September, or 4.4%, to settle at $61.86/b. Y-t-d, DME Oman was down by $6.13, or 8.7%, at $64.35/b, compared with the same period a year earlier.
Table 1 - 2: Crude oil futures, US$/b
Crude Oil Price Movements
4 OPEC Monthly Oil Market Report – October 2019
On 9 October, ICE Brent stood at $58.32/b and NYMEX WTI at $52.59/b.
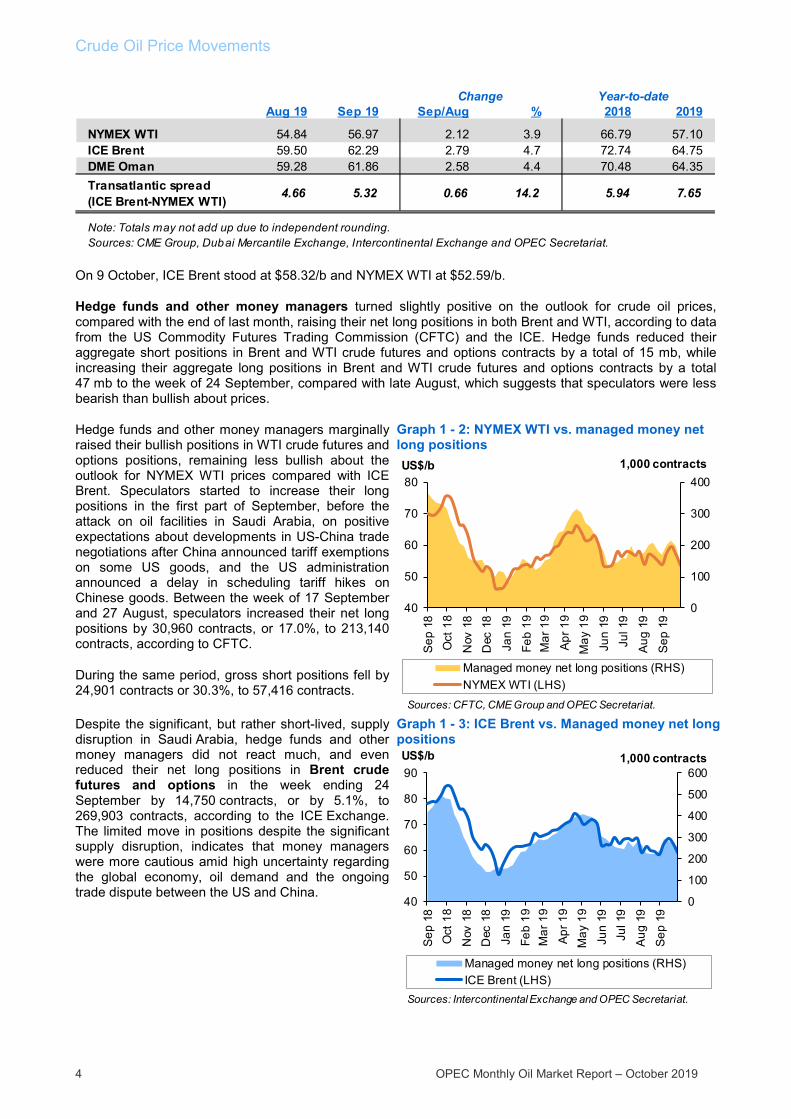
Hedge funds and other money managers turned slightly positive on the outlook for crude oil prices, compared with the end of last month, raising their net long positions in both Brent and WTI, according to data from the US Commodity Futures Trading Commission (CFTC) and the ICE. Hedge funds reduced their aggregate short positions in Brent and WTI crude futures and options contracts by a total of 15 mb, while increasing their aggregate long positions in Brent and WTI crude futures and options contracts by a total 47 mb to the week of 24 September, compared with late August, which suggests that speculators were less bearish than bullish about prices.
Hedge funds and other money managers marginally raised their bullish positions in WTI crude futures and options positions, remaining less bullish about the outlook for NYMEX WTI prices compared with ICE Brent. Speculators started to increase their long positions in the first part of September, before the attack on oil facilities in Saudi Arabia, on positive expectations about developments in US-China trade negotiations after China announced tariff exemptions on some US goods, and the US administration announced a delay in scheduling tariff hikes on Chinese goods. Between the week of 17 September and 27 August, speculators increased their net long positions by 30,960 contracts, or 17.0%, to 213,140 contracts, according to CFTC.
During the same period, gross short positions fell by 24,901 contracts or 30.3%, to 57,416 contracts.
Graph 1 - 2: NYMEX WTI vs. managed money net long positions
Despite the significant, but rather short-lived, supply disruption in Saudi Arabia, hedge funds and other money managers did not react much, and even reduced their net long positions in Brent crude futures and options in the week ending 24 September by 14,750 contracts, or by 5.1%, to 269,903 contracts, according to the ICE Exchange. The limited move in positions despite the significant supply disruption, indicates that money managers were more cautious amid high uncertainty regarding the global economy, oil demand and the ongoing trade dispute between the US and China.
Graph 1 - 3: ICE Brent vs. Managed money net long positions
Aug 19 Sep 19 Sep/Aug % 2018 2019
NYMEX WTI 54.84 56.97 2.12 3.9 66.79 57.10ICE Brent 59.50 62.29 2.79 4.7 72.74 64.75DME Oman 59.28 61.86 2.58 4.4 70.48 64.35Transatlantic spread (ICE Brent-NYMEX WTI) 4.66 5.32 0.66 14.2 5.94 7.65
Note: Totals may not add up due to independent rounding.
Change
Sources: CME Group, Dubai Mercantile Exchange, Intercontinental Exchange and OPEC Secretariat.
Year-to-date
0
100
200
300
400
40
50
60
70
80
Sep
18
Oct
18
Nov
18
Dec
18
Jan
19
Feb
19M
ar 1
9
Apr
19
May
19
Jun
19Ju
l 19
Aug
19
Sep
19
US$/b
Managed money net long positions (RHS)NYMEX WTI (LHS)
1,000 contracts
Sources: CFTC, CME Group and OPEC Secretariat.
0
100
200
300
400
500
600
40
50
60
70
80
90
Sep
18
Oct
18
Nov
18
Dec
18
Jan
19Fe
b 19
Mar
19
Apr
19
May
19
Jun
19Ju
l 19
Aug
19
Sep
19
US$/b
Managed money net long positions (RHS)ICE Brent (LHS)
1,000 contracts
Sources: Intercontinental Exchange and OPEC Secretariat.

Crude Oil Price Movements
OPEC Monthly Oil Market Report – October 2019 5
The long-to-short ratio in ICE Brent speculative positions remained almost unchanged between late August and the end of the week of 24 September at 4:1. The NYMEX WTI long-to-short ratio rose slightly to 5:1 for the week ending 24 September from around 4:1 at the beginning of the month.
Total futures and options open interest volume in the two exchanges rose by 320,617 contracts from the beginning of the month to stand at 5.8 million contracts in the week ending 24 September.
The daily average traded volume for NYMEX WTI contracts rose again in September by 77,959 lots, or 6.1%, to 1,346,214 contracts. Daily average traded volume for ICE Brent also increased by 86,825 contracts, or 9.6%, to 990,874 lots.
The daily aggregate traded volume for both crude oil futures markets rose by 164,785 contracts m-o-m to stand at 2.3 million futures contracts, or about 2.3 billion b/d of crude oil.
The total traded volume for NYMEX WTI was lower in September at 26.9 million contracts, or 3.5%, while that of ICE Brent was 4.6% higher at 20.8 million contracts. Total traded volume was lower in NYMEX WTI in September, mainly due to fewer trading days compared with August.
Graph 1 - 4: NYMEX WTI and ICE Brent daily trading volumes
The futures market structure ICE Brent and DME Oman crude oil forward price structures were in steep backwardation in September, widening sharply after the attack on Saudi Arabia’s oil facilities. Prompt month contracts rose the most, as concerns about a supply shortage raised demand for prompt cargoes. However, the NYMEX WTI backwardation curve structure flattened slightly in the front.
The NYMEX WTI forward structure remained in backwardation in September on easing congestion at the Cushing, Oklahoma, delivery point for the US oil futures contract, after an increase in crude oil transportation takeaway capacity from the Permian region to the US Gulf Coast. Nonetheless, WTI backwardation structure flattened slightly on lower US refinery runs due to seasonal maintenance and a disruption in crude transportation and refinery infrastructure in Texas due to Tropical Storm Imelda. Meanwhile, lower demand for US crude oil from China due to a 5% tariff on US crude imports from 1 September also weighed.
NYMEX WTI first-to-third month spread was at a backwardation of 51¢/b on 26 September, compared to a backwardation of 88¢/b on 16 September.
Graph 1 - 5: NYMEX WTI forward curves
Backwardation in the Brent market structure remained elevated in September and steepened further on 16 September following the attack on Saudi Arabia’s oil facilities, raising concerns about a shortage in oil supply. ICE Brent's first-to-third month spread rose to a backwardation of $2.47/b and ICE Brent's first-to-six month spread surged to a backwardation of $4.95/b on 16 September. Prompt Brent prices were supported by a more balanced crude market and strong demand for Brent-like cargoes in the Atlantic Basin, particularly from Asia.
0
1,000
2,000
3,000
4,000
Sep
17
Nov
17
Jan
18
Mar
18
May
18
Jul 1
8
Sep
18
Nov
18
Jan
19
Mar
19
May
19
Jul 1
9
Sep
19
NYMEX WTI ICE Brent
Sources: CME Group, Intercontinental Exchange and OPEC Secretariat.
1,000 contracts
50
52
54
56
58
1FM 3FM 5FM 7FM 9FM 11FM
US$/b
NYMEX WTI: 26 Aug 19NYMEX WTI: 26 Sep 19
Note: FM = future month.Sources: CME Group and OPEC Secretariat.
Crude Oil Price Movements
6 OPEC Monthly Oil Market Report – October 2019
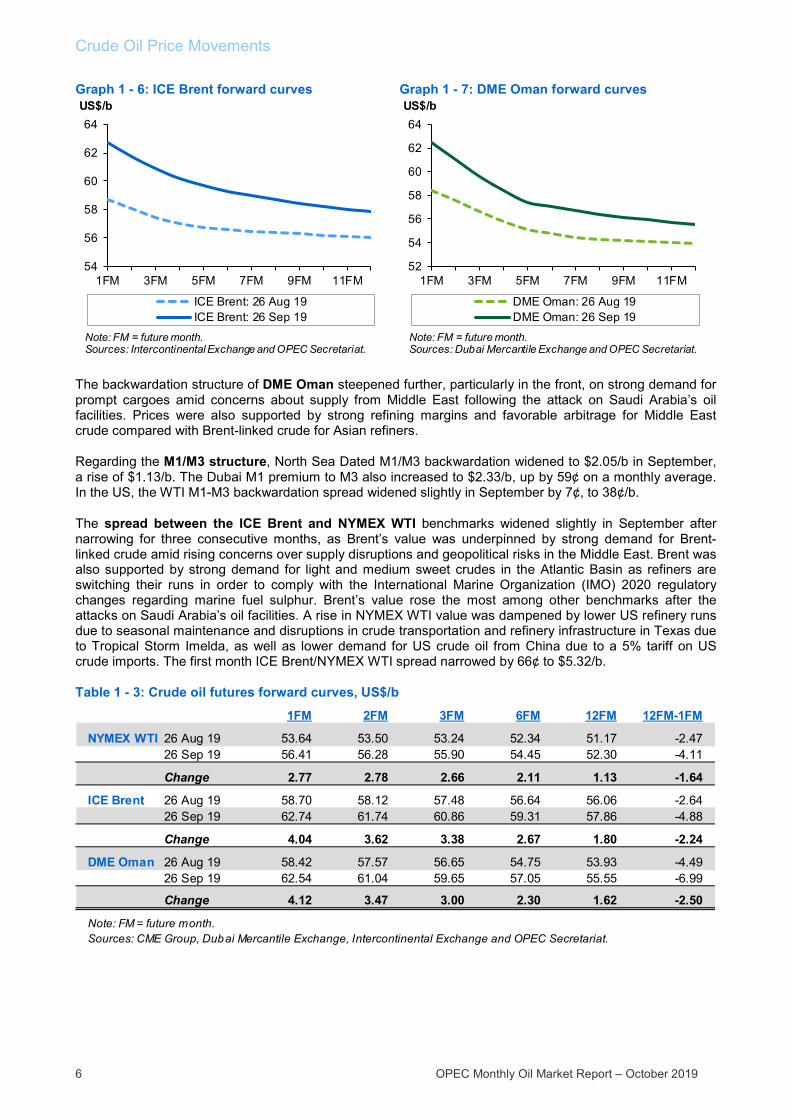
Graph 1 - 6: ICE Brent forward curves Graph 1 - 7: DME Oman forward curves
The backwardation structure of DME Oman steepened further, particularly in the front, on strong demand for prompt cargoes amid concerns about supply from Middle East following the attack on Saudi Arabia’s oil facilities. Prices were also supported by strong refining margins and favorable arbitrage for Middle East crude compared with Brent-linked crude for Asian refiners.
Regarding the M1/M3 structure, North Sea Dated M1/M3 backwardation widened to $2.05/b in September, a rise of $1.13/b. The Dubai M1 premium to M3 also increased to $2.33/b, up by 59¢ on a monthly average. In the US, the WTI M1-M3 backwardation spread widened slightly in September by 7¢, to 38¢/b.
The spread between the ICE Brent and NYMEX WTI benchmarks widened slightly in September after narrowing for three consecutive months, as Brent’s value was underpinned by strong demand for Brent-linked crude amid rising concerns over supply disruptions and geopolitical risks in the Middle East. Brent was also supported by strong demand for light and medium sweet crudes in the Atlantic Basin as refiners are switching their runs in order to comply with the International Marine Organization (IMO) 2020 regulatory changes regarding marine fuel sulphur. Brent’s value rose the most among other benchmarks after the attacks on Saudi Arabia’s oil facilities. A rise in NYMEX WTI value was dampened by lower US refinery runs due to seasonal maintenance and disruptions in crude transportation and refinery infrastructure in Texas due to Tropical Storm Imelda, as well as lower demand for US crude oil from China due to a 5% tariff on US crude imports. The first month ICE Brent/NYMEX WTI spread narrowed by 66¢ to $5.32/b.
Table 1 - 3: Crude oil futures forward curves, US$/b
54
56
58
60
62
64
1FM 3FM 5FM 7FM 9FM 11FM
US$/b
ICE Brent: 26 Aug 19ICE Brent: 26 Sep 19
Note: FM = future month.Sources: Intercontinental Exchange and OPEC Secretariat.
52
54
56
58
60
62
64
1FM 3FM 5FM 7FM 9FM 11FM
US$/b
DME Oman: 26 Aug 19DME Oman: 26 Sep 19
Note: FM = future month.Sources: Dubai Mercantile Exchange and OPEC Secretariat.
1FM 2FM 3FM 6FM 12FM 12FM-1FM
NYMEX WTI 26 Aug 19 53.64 53.50 53.24 52.34 51.17 -2.4726 Sep 19 56.41 56.28 55.90 54.45 52.30 -4.11
Change 2.77 2.78 2.66 2.11 1.13 -1.64
ICE Brent 26 Aug 19 58.70 58.12 57.48 56.64 56.06 -2.6426 Sep 19 62.74 61.74 60.86 59.31 57.86 -4.88
Change 4.04 3.62 3.38 2.67 1.80 -2.24
DME Oman 26 Aug 19 58.42 57.57 56.65 54.75 53.93 -4.4926 Sep 19 62.54 61.04 59.65 57.05 55.55 -6.99
Change 4.12 3.47 3.00 2.30 1.62 -2.50
Note: FM = future month.Sources: CME Group, Dubai Mercantile Exchange, Intercontinental Exchange and OPEC Secretariat.

Crude Oil Price Movements
OPEC Monthly Oil Market Report – October 2019 7
The light sweet/medium sour crude spread Differentials between light sweet and heavy sour crudes widened in all markets, particularly in Europe and Asia, as Brent was supported by geopolitical tensions and growing demand for sweeter crudes ahead of IMO 2020 low sulphur requirements.
In Europe, the light-sweet North Sea Brent premium to Urals medium-sour crude widened to its second-highest level this year for the September monthly average, growing by $2.04 to 92¢/b due to strengthening international benchmark Brent on growing geopolitical tensions and risks of a supply shortage. Light and medium sour crudes linked to Brent were supported by strong demand after the supply disruption in Saudi Arabia and as refiners raise their demand for lower sulphur grades to meet the coming IMO 2020 sulphur regulations. Furthermore, Urals crude differentials to North Sea Dated weakened in September to the deepest discount in several months due to higher loading programmes and subdued demand. Some Urals cargoes for October-loading in Northwest Europe were traded below minus $2.50/b to Dated Brent.
Graph 1 - 8: Brent Dated vs. sour grades (Urals and Dubai) spread
In Asia, the Tapis premium over Dubai widened the most in September on average since January 2018 as domestic light sweet crudes were supported by strong regional demand and became more competitive with similar crudes in the Atlantic Basin due to a widening Brent-Dubai spread. EFS Dubai reached $4.26/b on 16 September after the attack on Saudi Arabia’s oil facilities, and remained high most of the month. The Tapis premium over Dubai rose by $2.04 to $6.68/b.
On the US Gulf Coast (USGC), the premium of Light Louisiana Sweet (LLS) over medium sour Mars also widened but at a slower pace, as lower imports of sour crudes from Latin America and the Middle East to the USGC supported the value of Mars. Lower US crude exports to China, due to a 5% tariff on US crude imports, weighed on light sweet values in the USGC. The LLS premium over medium-sour Mars increased by 51¢ to $2.02/b.
The impact of the US dollar (USD) and inflation on oil prices The USD advanced again in September against most major and emerging market currencies. In spite of a looser monetary policy by the US Federal Reserve (Fed) — after an interest rate cut at the beginning of the month — the relative outperformance of the US economy compared with its main developed-economy peers kept the dollar well supported.
Against major currencies, the USD advanced against the Euro on average by 1.1% m-o-m. The European Central Bank (ECB) cut interest rates in its deposit facility and announced the re-start of its quantitative easing programme to stem the current declining inflation trend amid an economic slowdown. The dollar advanced against the Swiss franc by 1.2% m-o-m, against the Japanese yen by 1.1% m-o-m, mainly due to reduced safe haven demand after some de-escalation in the trade dispute between China and the US. It declined by 1.7% against the pound sterling following political developments in the UK that increased the odds of securing an extension of the Brexit negotiation period past the end of October.
-4
-2
0
2
4
6
-4
-2
0
2
4
6
Sep
18
Oct
18
Nov
18
Dec
18
Jan
19
Feb
19M
ar 1
9
Apr
19
May
19
Jun
19
Jul 1
9
Aug
19
Sep
19
Oct
19
US$/bUS$/b
Dubai Urals
Sources: Argus Media, OPEC Secretariat and Platts.
Crude Oil Price Movements
8 OPEC Monthly Oil Market Report – October 2019
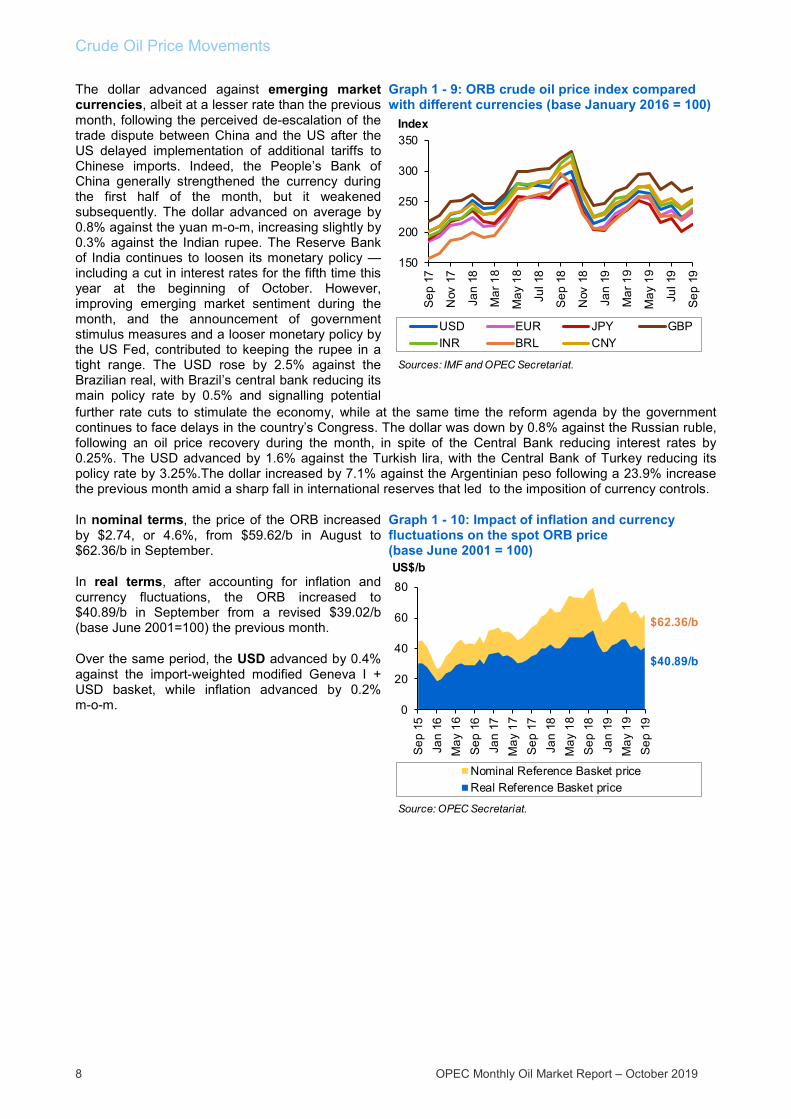
The dollar advanced against emerging market currencies, albeit at a lesser rate than the previous month, following the perceived de-escalation of the trade dispute between China and the US after the US delayed implementation of additional tariffs to Chinese imports. Indeed, the People’s Bank of China generally strengthened the currency during the first half of the month, but it weakened subsequently. The dollar advanced on average by 0.8% against the yuan m-o-m, increasing slightly by 0.3% against the Indian rupee. The Reserve Bank of India continues to loosen its monetary policy — including a cut in interest rates for the fifth time this year at the beginning of October. However, improving emerging market sentiment during the month, and the announcement of government stimulus measures and a looser monetary policy by the US Fed, contributed to keeping the rupee in a tight range. The USD rose by 2.5% against the Brazilian real, with Brazil’s central bank reducing its main policy rate by 0.5% and signalling potential
Graph 1 - 9: ORB crude oil price index compared with different currencies (base January 2016 = 100)
further rate cuts to stimulate the economy, while at the same time the reform agenda by the government continues to face delays in the country’s Congress. The dollar was down by 0.8% against the Russian ruble, following an oil price recovery during the month, in spite of the Central Bank reducing interest rates by 0.25%. The USD advanced by 1.6% against the Turkish lira, with the Central Bank of Turkey reducing its policy rate by 3.25%.The dollar increased by 7.1% against the Argentinian peso following a 23.9% increase the previous month amid a sharp fall in international reserves that led to the imposition of currency controls.
In nominal terms, the price of the ORB increased by $2.74, or 4.6%, from $59.62/b in August to $62.36/b in September.
In real terms, after accounting for inflation and currency fluctuations, the ORB increased to $40.89/b in September from a revised $39.02/b (base June 2001=100) the previous month.
Over the same period, the USD advanced by 0.4% against the import-weighted modified Geneva I + USD basket, while inflation advanced by 0.2% m-o-m.
Graph 1 - 10: Impact of inflation and currency fluctuations on the spot ORB price (base June 2001 = 100)
150
200
250
300
350
Sep
17
Nov
17
Jan
18
Mar
18
May
18
Jul 1
8
Sep
18
Nov
18
Jan
19
Mar
19
May
19
Jul 1
9
Sep
19
USD EUR JPY GBPINR BRL CNY
Index
Sources: IMF and OPEC Secretariat.
0
20
40
60
80
Sep
15
Jan
16M
ay 1
6S
ep 1
6Ja
n 17
May
17
Sep
17
Jan
18M
ay 1
8S
ep 1
8Ja
n 19
May
19
Sep
19
US$/b
Nominal Reference Basket priceReal Reference Basket price
Source: OPEC Secretariat.
$62.36/b
$40.89/b
Commodity Markets
OPEC Monthly Oil Market Report – October 2019 9
Commodity Markets
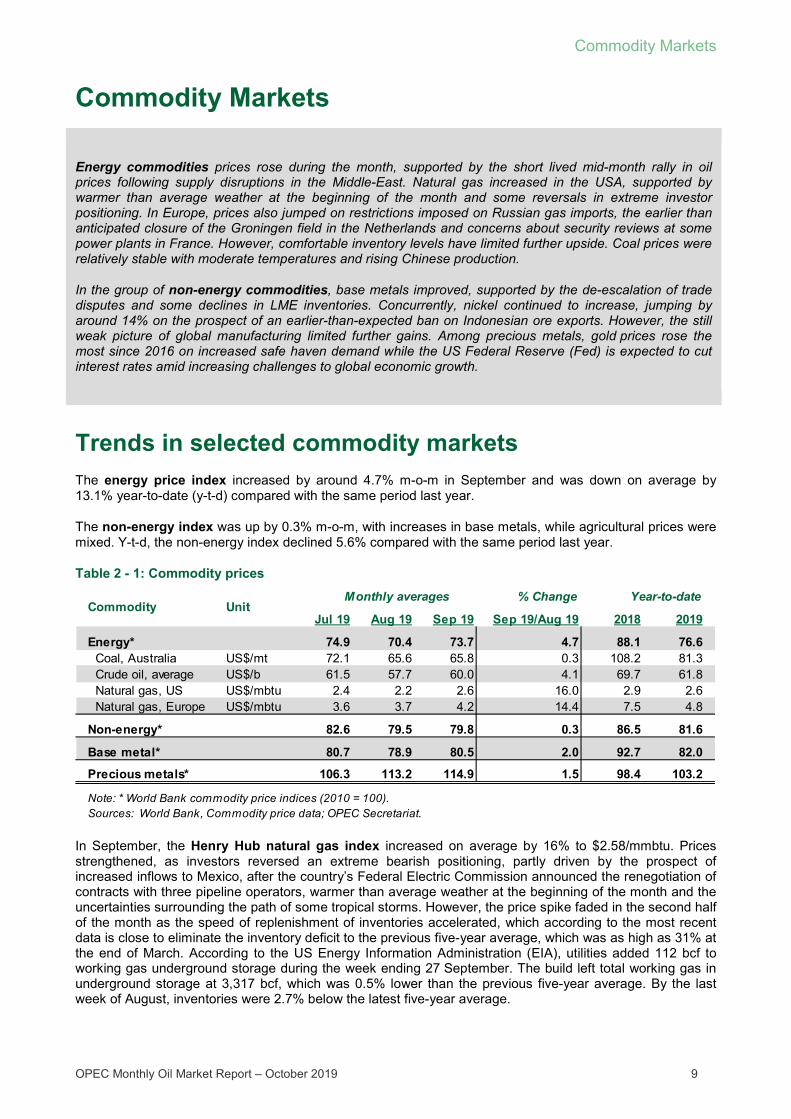
Energy commodities prices rose during the month, supported by the short lived mid-month rally in oil prices following supply disruptions in the Middle-East. Natural gas increased in the USA, supported by warmer than average weather at the beginning of the month and some reversals in extreme investor positioning. In Europe, prices also jumped on restrictions imposed on Russian gas imports, the earlier than anticipated closure of the Groningen field in the Netherlands and concerns about security reviews at some power plants in France. However, comfortable inventory levels have limited further upside. Coal prices were relatively stable with moderate temperatures and rising Chinese production.
In the group of non-energy commodities, base metals improved, supported by the de-escalation of trade disputes and some declines in LME inventories. Concurrently, nickel continued to increase, jumping by around 14% on the prospect of an earlier-than-expected ban on Indonesian ore exports. However, the still weak picture of global manufacturing limited further gains. Among precious metals, gold prices rose the most since 2016 on increased safe haven demand while the US Federal Reserve (Fed) is expected to cut interest rates amid increasing challenges to global economic growth.
Trends in selected commodity markets The energy price index increased by around 4.7% m-o-m in September and was down on average by 13.1% year-to-date (y-t-d) compared with the same period last year.
The non-energy index was up by 0.3% m-o-m, with increases in base metals, while agricultural prices were mixed. Y-t-d, the non-energy index declined 5.6% compared with the same period last year.
Table 2 - 1: Commodity prices
In September, the Henry Hub natural gas index increased on average by 16% to $2.58/mmbtu. Prices strengthened, as investors reversed an extreme bearish positioning, partly driven by the prospect of increased inflows to Mexico, after the country’s Federal Electric Commission announced the renegotiation of contracts with three pipeline operators, warmer than average weather at the beginning of the month and the uncertainties surrounding the path of some tropical storms. However, the price spike faded in the second half of the month as the speed of replenishment of inventories accelerated, which according to the most recent data is close to eliminate the inventory deficit to the previous five-year average, which was as high as 31% at the end of March. According to the US Energy Information Administration (EIA), utilities added 112 bcf to working gas underground storage during the week ending 27 September. The build left total working gas in underground storage at 3,317 bcf, which was 0.5% lower than the previous five-year average. By the last week of August, inventories were 2.7% below the latest five-year average.
% Change
Jul 19 Aug 19 Sep 19 Sep 19/Aug 19 2018 2019
Energy* 74.9 70.4 73.7 4.7 88.1 76.6 Coal, Australia US$/mt 72.1 65.6 65.8 0.3 108.2 81.3 Crude oil, average US$/b 61.5 57.7 60.0 4.1 69.7 61.8 Natural gas, US US$/mbtu 2.4 2.2 2.6 16.0 2.9 2.6 Natural gas, Europe US$/mbtu 3.6 3.7 4.2 14.4 7.5 4.8
Non-energy* 82.6 79.5 79.8 0.3 86.5 81.6
Base metal* 80.7 78.9 80.5 2.0 92.7 82.0
Precious metals* 106.3 113.2 114.9 1.5 98.4 103.2
Note: * World Bank commodity price indices (2010 = 100).Sources: World Bank, Commodity price data; OPEC Secretariat.
UnitCommodity Monthly averages Year-to-date
Commodity Markets
10 OPEC Monthly Oil Market Report – October 2019
Natural gas prices in Europe also jumped with the Title Transfer Facility price increasing by 14.4% to $4.2/mmbtu in September. Prices jumped on the convergence of several events. First, the European Court of Justice re-established a limitation to Gazprom for its usage of the OPAL pipeline to just 50% of capacity, thereby limiting one of the routes for Russian gas exports to Europe. Secondly, French electricity company, EDF, announced reviews at some of its nuclear power facilities due to identified “deviation of technical standard” of some equipment. While the results of the review are still to be announced, any closure would potentially result in additional output requirements from natural gas powered plants. Third, the Netherlands announced an earlier-than-anticipated closure of the Groningen field in 2022, and a lower production limit for the next 12 months, due to seismic concerns. Additionally, the attack on Saudi Arabian oil facilities added some geopolitical premium, but this effect quickly receded as output was quickly restored. Any further upside has been limited as natural gas inventories are near full across EU Member States. At the end of September, inventories were around 97% of capacity compared to 82% at the same date last year, according to Gas Infrastructure Europe.
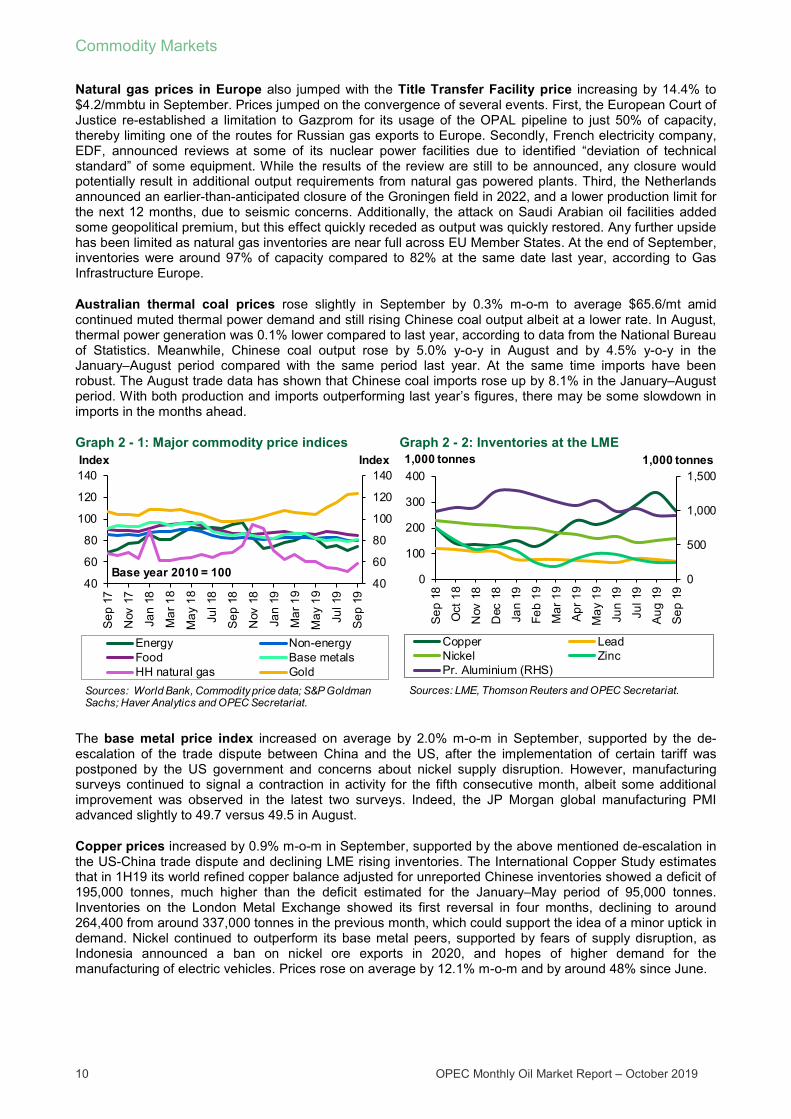
Australian thermal coal prices rose slightly in September by 0.3% m-o-m to average $65.6/mt amid continued muted thermal power demand and still rising Chinese coal output albeit at a lower rate. In August, thermal power generation was 0.1% lower compared to last year, according to data from the National Bureau of Statistics. Meanwhile, Chinese coal output rose by 5.0% y-o-y in August and by 4.5% y-o-y in the January–August period compared with the same period last year. At the same time imports have been robust. The August trade data has shown that Chinese coal imports rose up by 8.1% in the January–August period. With both production and imports outperforming last year’s figures, there may be some slowdown in imports in the months ahead.
Graph 2 - 1: Major commodity price indices Graph 2 - 2: Inventories at the LME
The base metal price index increased on average by 2.0% m-o-m in September, supported by the de-escalation of the trade dispute between China and the US, after the implementation of certain tariff was postponed by the US government and concerns about nickel supply disruption. However, manufacturing surveys continued to signal a contraction in activity for the fifth consecutive month, albeit some additional improvement was observed in the latest two surveys. Indeed, the JP Morgan global manufacturing PMI advanced slightly to 49.7 versus 49.5 in August.
Copper prices increased by 0.9% m-o-m in September, supported by the above mentioned de-escalation in the US-China trade dispute and declining LME rising inventories. The International Copper Study estimates that in 1H19 its world refined copper balance adjusted for unreported Chinese inventories showed a deficit of 195,000 tonnes, much higher than the deficit estimated for the January–May period of 95,000 tonnes. Inventories on the London Metal Exchange showed its first reversal in four months, declining to around 264,400 from around 337,000 tonnes in the previous month, which could support the idea of a minor uptick in demand. Nickel continued to outperform its base metal peers, supported by fears of supply disruption, as Indonesia announced a ban on nickel ore exports in 2020, and hopes of higher demand for the manufacturing of electric vehicles. Prices rose on average by 12.1% m-o-m and by around 48% since June.
40
60
80
100
120
140
40
60
80
100
120
140
Sep
17
Nov
17
Jan
18
Mar
18
May
18
Jul 1
8
Sep
18
Nov
18
Jan
19
Mar
19
May
19
Jul 1
9
Sep
19
IndexIndex
Energy Non-energyFood Base metalsHH natural gas Gold
Sources: World Bank, Commodity price data; S&P Goldman Sachs; Haver Analytics and OPEC Secretariat.
Base year 2010 = 100 0
500
1,000
1,500
0
100
200
300
400
Sep
18
Oct
18
Nov
18
Dec
18
Jan
19
Feb
19
Mar
19
Apr
19
May
19
Jun
19
Jul 1
9
Aug
19
Sep
19
1,000 tonnes1,000 tonnes
Copper LeadNickel ZincPr. Aluminium (RHS)
Sources: LME, Thomson Reuters and OPEC Secretariat.

Commodity Markets
OPEC Monthly Oil Market Report – October 2019 11
Iron ore prices were relatively stable in September after steep falls in the previous two months following recovering in exports from Brazil in the third quarter. Chinese import data shows that iron ore imports remain down by 3.5% in the Jan-Aug period, despite a surge in imports in July and August.
In the group of precious metals, the index advanced by 1.5%, with gold, silver and platinum up by 0.7%, 10% and 5.4%, respectively. Gold prices were supported by the expectation of additional monetary policy accommodation by the US Federal Reserve.
Investment flows into commodities Open interest (OI) increased on average in September for selected US commodity futures such as crude oil and precious metals but decreased for crude oil and copper. On average, speculative net long positions increased for crude oil, precious metals, copper and natural gas.
Table 2 - 2: CFTC data on non-commercial positions, 1,000 contracts
Henry Hub’s natural gas OI decreased by 8.7% m-o-m in September, while money managers cut their net short position by around half to reach an average of 101,225 from 218,803 contracts, spurring a short lived rally.
Copper’s OI declined by 15.4% m-o-m in September. Money managers cut their net short position by around 20% to 56,171 from 69,746 contracts the previous month, amid some de-escalation in the US-China trade dispute.
Precious metals’ OI increased by 1.0% m-o-m in September. Money managers’ net long position rose by 2.2% to 277,889 contracts from 271,878 contracts in the previous month, on expectations of lower interest rates in the US, amid signs of economic deceleration.
Graph 2 - 3: Money managers’ activity in key commodities, net length
Graph 2 - 4: Money managers’ activity in key commodities, as % of open interest
Aug 19 Sep 19 Aug 19 % OI Sep 19 % OI
Crude oil 2,034 2,071 201 10 209 10Natural gas 1,349 1,232 -219 -16 -101 -8Precious metals 844 852 272 32 278 33Copper 286 242 -70 -24 -56 -23
Total 4,513 4,397 -208 -1 -293 1
Sources: CFTC and OPEC Secretariat.
Open interest Net length
Note: Data on this tab le is based on monthly average.
-300-200-1000100200300400
-300-200-100
0100200300400
Sep
18
Oct
18
Nov
18
Dec
18
Jan
19Fe
b 19
Mar
19
Apr
19
May
19
Jun
19Ju
l 19
Aug
19
Sep
19
Gold WTI Copper Natural gas
Note: Data on this graph is based on monthly average.Sources: CFTC and OPEC Secretariat.
1,000 contracts 1,000 contracts
-30
0
30
60
-30
0
30
60
Sep
18
Oct
18
Nov
18
Dec
18
Jan
19
Feb
19
Mar
19
Apr
19
May
19
Jun
19
Jul 1
9
Aug
19
Sep
19
%%
Gold WTI Copper Natural gas
Note: Data on this graph is based on monthly average.Sources: CFTC and OPEC Secretariat.
World Economy
12 OPEC Monthly Oil Market Report – October 2019
World Economy
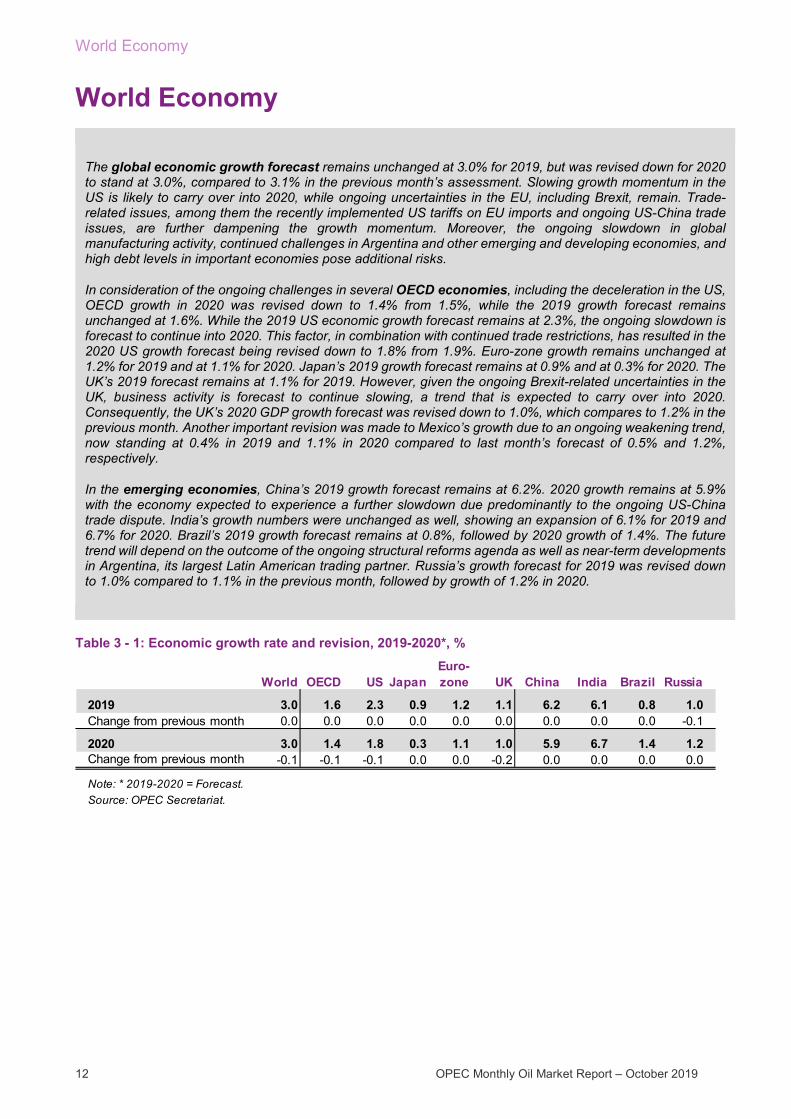
The global economic growth forecast remains unchanged at 3.0% for 2019, but was revised down for 2020 to stand at 3.0%, compared to 3.1% in the previous month’s assessment. Slowing growth momentum in the US is likely to carry over into 2020, while ongoing uncertainties in the EU, including Brexit, remain. Trade-related issues, among them the recently implemented US tariffs on EU imports and ongoing US-China trade issues, are further dampening the growth momentum. Moreover, the ongoing slowdown in global manufacturing activity, continued challenges in Argentina and other emerging and developing economies, and high debt levels in important economies pose additional risks.
In consideration of the ongoing challenges in several OECD economies, including the deceleration in the US, OECD growth in 2020 was revised down to 1.4% from 1.5%, while the 2019 growth forecast remains unchanged at 1.6%. While the 2019 US economic growth forecast remains at 2.3%, the ongoing slowdown is forecast to continue into 2020. This factor, in combination with continued trade restrictions, has resulted in the 2020 US growth forecast being revised down to 1.8% from 1.9%. Euro-zone growth remains unchanged at 1.2% for 2019 and at 1.1% for 2020. Japan’s 2019 growth forecast remains at 0.9% and at 0.3% for 2020. The UK’s 2019 forecast remains at 1.1% for 2019. However, given the ongoing Brexit-related uncertainties in the UK, business activity is forecast to continue slowing, a trend that is expected to carry over into 2020. Consequently, the UK’s 2020 GDP growth forecast was revised down to 1.0%, which compares to 1.2% in the previous month. Another important revision was made to Mexico’s growth due to an ongoing weakening trend, now standing at 0.4% in 2019 and 1.1% in 2020 compared to last month’s forecast of 0.5% and 1.2%, respectively.
In the emerging economies, China’s 2019 growth forecast remains at 6.2%. 2020 growth remains at 5.9% with the economy expected to experience a further slowdown due predominantly to the ongoing US-China trade dispute. India’s growth numbers were unchanged as well, showing an expansion of 6.1% for 2019 and 6.7% for 2020. Brazil’s 2019 growth forecast remains at 0.8%, followed by 2020 growth of 1.4%. The future trend will depend on the outcome of the ongoing structural reforms agenda as well as near-term developments in Argentina, its largest Latin American trading partner. Russia’s growth forecast for 2019 was revised down to 1.0% compared to 1.1% in the previous month, followed by growth of 1.2% in 2020.
Table 3 - 1: Economic growth rate and revision, 2019-2020*, %
World OECD US JapanEuro-zone UK China India Brazil Russia
2019 3.0 1.6 2.3 0.9 1.2 1.1 6.2 6.1 0.8 1.0Change from previous month 0.0 0.0 0.0 0.0 0.0 0.0 0.0 0.0 0.0 -0.1
2020 3.0 1.4 1.8 0.3 1.1 1.0 5.9 6.7 1.4 1.2Change from previous month -0.1 -0.1 -0.1 0.0 0.0 -0.2 0.0 0.0 0.0 0.0
Note: * 2019-2020 = Forecast.Source: OPEC Secretariat.
World Economy
OPEC Monthly Oil Market Report – October 2019 13
OECD OECD Americas
US US GDP growth is forecast to slow down in 2H19, a trend that is expected to continue in 2020. After growth of 3.1% q-o-q SAAR in 1Q19, 2Q19 GDP growth was confirmed at 2.0% in the third and final release of the growth level. This slowing momentum is forecast to materialize in a growth level of below 2.0% in 2H19. While the more backward-looking indicators confirm ongoing solid growth in the past months, the more forward-looking measures indicate that the current slowdown in likely to continue. Not only are the ISM numbers indicating a slowdown in the services sector and an ongoing contraction in the manufacturing sector, but also manufacturing orders are hovering around the zero growth level and political uncertainties, both domestic and external, have increased in the past weeks. This also translates into falling consumer and business sentiment and declining investments. Already in 2Q19, gross private investment declined by 6.3% q-o-q SAAR. Ongoing support, albeit at a slowing pace, is coming from private consumption. Consumption grew by 4.6% q-o-q SAAR and is expected to sustain economic growth in the US. Monetary policies of the US Federal Reserve (Fed) are also expected to remain accommodative, as the Fed is expected to cut interest rates at least one more time in the current year, possibly at its upcoming October meeting. However, even with this support, there is limited capacity for improvement in the labour market, given a multi-decade low unemployment rate, which is also providing little room to the upside, particularly as productivity growth remains relatively low.
Trade negotiations between the US and China are ongoing, but the outcome remains relatively uncertain. Trade-related issues will continue to constitute a very important aspect of the US growth forecast going forward. The US recently introduced tariffs on products from the EU in the amount of $7.5 billion, following a ruling from the WTO. While these are relatively small, they affect important sectors, ranging from a 10% tariff on Airbus planes to 25% on olive oil, French cheese and wine, and Scotch whiskey, among other items. Moreover, there is still the possibility that the US continues to escalate trade-related issues with the EU and other economies by imposing further tariffs on cars and auto parts. This would drag down short-term economic growth in the US. The tariffs that have already been announced or implemented are expected to have a limited negative impact of around 0.1 pp on US GDP growth in 2019, however, in 2020, they are forecast to have a negative impact of up to 0.4 pp.
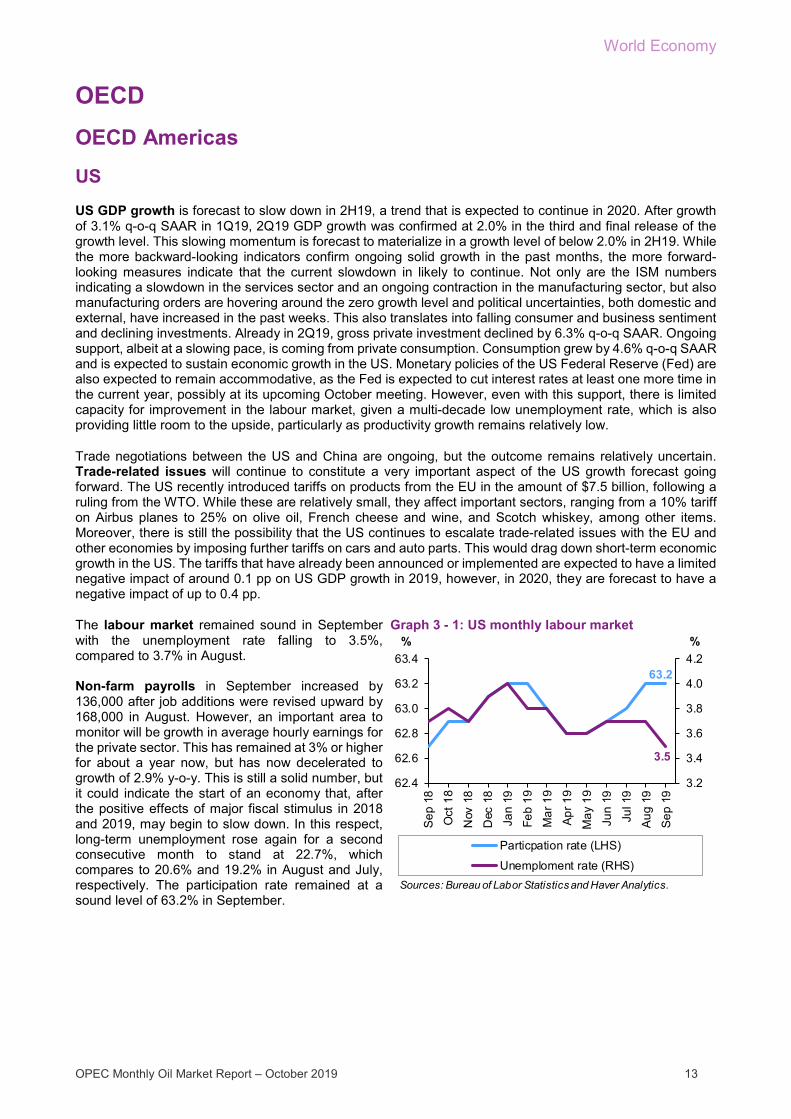
The labour market remained sound in September with the unemployment rate falling to 3.5%, compared to 3.7% in August. Non-farm payrolls in September increased by 136,000 after job additions were revised upward by 168,000 in August. However, an important area to monitor will be growth in average hourly earnings for the private sector. This has remained at 3% or higher for about a year now, but has now decelerated to growth of 2.9% y-o-y. This is still a solid number, but it could indicate the start of an economy that, after the positive effects of major fiscal stimulus in 2018 and 2019, may begin to slow down. In this respect, long-term unemployment rose again for a second consecutive month to stand at 22.7%, which compares to 20.6% and 19.2% in August and July, respectively. The participation rate remained at a sound level of 63.2% in September.
Graph 3 - 1: US monthly labour market
63.2
3.5
3.2
3.4
3.6
3.8
4.0
4.2
62.4
62.6
62.8
63.0
63.2
63.4
Sep
18
Oct
18
Nov
18
Dec
18
Jan
19Fe
b 19
Mar
19
Apr
19
May
19
Jun
19Ju
l 19
Aug
19
Sep
19
%%
Particpation rate (LHS)
Unemploment rate (RHS)Sources: Bureau of Labor Statistics and Haver Analytics.

World Economy
14 OPEC Monthly Oil Market Report – October 2019
Total inflation remained almost unchanged in August, standing at 1.8% y-o-y. Core inflation – excluding volatile items such as food and energy – stood at 2.4% y-o-y in August, rising from 2.2% y-o-y in July and 2.1% in June. This also reflects the healthy trend in the labour market with solid wage growth. This trend, however, may soon be coming to an end. The Fed’s favoured inflation index, the personal consumption expenditure price index (PCE index), stood at 1.4% in August for the third consecutive month. The critically important housing sector exhibited mixed developments in the sense that while price growth continued decelerating, home sales held up well. The yearly change in the house pricing index of the Federal Housing Finance Agency (FHFA) rose slightly to stand at 5% y-o-y in July, compared to 4.9% y-o-y in June.
Graph 3 - 2: US house prices
Existing home sales remained relatively strong in August, compared to an annualized level of 5.42 million in July. Also, new home sales increased to 713,000 in August, after 666,000 in July. The S&P CoreLogic Case-Shiller Home Price Index Composite 20 for metropolitan areas retracted again, now reaching 2.0% y-o-y in July, the lowest level since 2012.
After some ups and downs in the past months, consumer sentiment retracted again. The lead indicator, published by the Conference Board, fell to 125.1 in September, compared to 134.2 in August, 135.8 in July and 124.3 in June.
Graph 3 - 3: US consumer confidence index
The trend in consumer sentiment was less positive than was visible in retail sales growth, which improved in August, rising by 4.1% y-o-y, compared to 3.6% y-o-y in July and 3.3% y-o-y in June. However, the 2019 levels are significantly lower than last year’s high-growth environment, when annual growth of retail sales stood at 4.9% y-o-y.
Industrial production (IP) decelerated further, continuing a trend that started a year ago. IP rose by 0.4% y-o-y in August, compared to 0.5% y-o-y in July. This trend shows a clear deceleration from 1Q19 numbers, when quarterly average growth stood at 2.9%.
Graph 3 - 4: US retail sales
5.0
4
5
6
7
Jul 1
8
Aug
18
Sep
18
Oct
18
Nov
18
Dec
18
Jan
19
Feb
19
Mar
19
Apr
19
May
19
Jun
19
Jul 1
9
% change y-o-y
Sources: Federal Housing Finance Agency and Haver Analytics.
125.1
120
125
130
135
140S
ep 1
8
Oct
18
Nov
18
Dec
18
Jan
19
Feb
19
Mar
19
Apr
19
May
19
Jun
19
Jul 1
9
Aug
19
Sep
19
Index
Sources: The Conference Board and Haver Analytics.
4.1
0
1
2
3
4
5
6
7
Aug
18
Sep
18
Oct
18
Nov
18
Dec
18
Jan
19
Feb
19
Mar
19
Apr
19
May
19
Jun
19
Jul 1
9
Aug
19
% change y-o-y
Sources: Census Bureau and Haver Analytics.
World Economy
OPEC Monthly Oil Market Report – October 2019 15
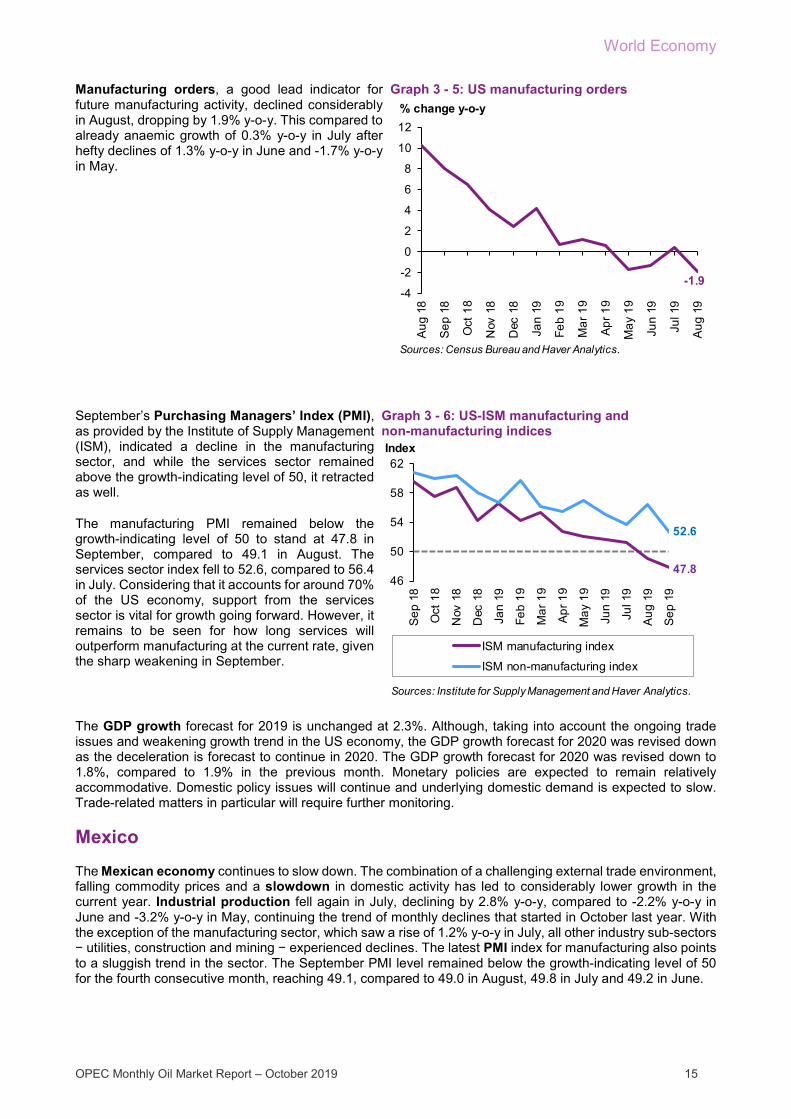
Manufacturing orders, a good lead indicator for future manufacturing activity, declined considerably in August, dropping by 1.9% y-o-y. This compared to already anaemic growth of 0.3% y-o-y in July after hefty declines of 1.3% y-o-y in June and -1.7% y-o-y in May.
Graph 3 - 5: US manufacturing orders
September’s Purchasing Managers’ Index (PMI), as provided by the Institute of Supply Management (ISM), indicated a decline in the manufacturing sector, and while the services sector remained above the growth-indicating level of 50, it retracted as well.
The manufacturing PMI remained below the growth-indicating level of 50 to stand at 47.8 in September, compared to 49.1 in August. The services sector index fell to 52.6, compared to 56.4 in July. Considering that it accounts for around 70% of the US economy, support from the services sector is vital for growth going forward. However, it remains to be seen for how long services will outperform manufacturing at the current rate, given the sharp weakening in September.
Graph 3 - 6: US-ISM manufacturing and non-manufacturing indices
The GDP growth forecast for 2019 is unchanged at 2.3%. Although, taking into account the ongoing trade issues and weakening growth trend in the US economy, the GDP growth forecast for 2020 was revised down as the deceleration is forecast to continue in 2020. The GDP growth forecast for 2020 was revised down to 1.8%, compared to 1.9% in the previous month. Monetary policies are expected to remain relatively accommodative. Domestic policy issues will continue and underlying domestic demand is expected to slow. Trade-related matters in particular will require further monitoring.
Mexico The Mexican economy continues to slow down. The combination of a challenging external trade environment, falling commodity prices and a slowdown in domestic activity has led to considerably lower growth in the current year. Industrial production fell again in July, declining by 2.8% y-o-y, compared to -2.2% y-o-y in June and -3.2% y-o-y in May, continuing the trend of monthly declines that started in October last year. With the exception of the manufacturing sector, which saw a rise of 1.2% y-o-y in July, all other industry sub-sectors − utilities, construction and mining − experienced declines. The latest PMI index for manufacturing also points to a sluggish trend in the sector. The September PMI level remained below the growth-indicating level of 50 for the fourth consecutive month, reaching 49.1, compared to 49.0 in August, 49.8 in July and 49.2 in June.
-1.9-4
-2
0
2
4
6
8
10
12
Aug
18
Sep
18
Oct
18
Nov
18
Dec
18
Jan
19
Feb
19
Mar
19
Apr
19
May
19
Jun
19
Jul 1
9
Aug
19
% change y-o-y
Sources: Census Bureau and Haver Analytics.
47.8
52.6
46
50
54
58
62
Sep
18
Oct
18
Nov
18
Dec
18
Jan
19
Feb
19
Mar
19
Apr
19
May
19
Jun
19
Jul 1
9
Aug
19
Sep
19
Index
ISM manufacturing index
ISM non-manufacturing index
Sources: Institute for Supply Management and Haver Analytics.

World Economy
16 OPEC Monthly Oil Market Report – October 2019
Taking into consideration the weak 1H19 GDP numbers and an ongoing challenging environment in 2019 for the Mexican economy, the GDP growth forecast for 2019 was revised down to 0.4%, compared to 0.5% in the previous month. The growth forecast for 2020 was revised down as well to 1.1% compared to 1.2% a month earlier.
OECD Asia Pacific
Japan After relatively strong growth numbers in 1H19, economic activity seems to have slowed down again. Growth in 1Q19 and 2Q19 was surprisingly good. Higher domestic consumption ahead of the anticipated sales tax increase combined with external trade-related distortions have led to very strong 1H19 GDP growth. However, more recent data highlights that the Japanese economy seems to be less buoyant than is reflected in the 1H19 GDP numbers. The sales tax has now increased from 8% to 10% in October. Past sales tax rises have had a significantly negative impact in the quarter of implementation and, to some extent, in the following quarters. Hence, GDP growth is forecast to move into negative territory in 4Q19. While it is too early to say for certain, the government may introduce a fiscal stimulus package to counterbalance the negative short-term effects of the sales tax increase, particularly as a variety of sentiment indices are pointing to a considerable slowdown, which is the result of the sales tax increase as well as slowing global trade and a general slowdown in activity.
Importantly, total inflation decelerated again considerably, standing at 0.2% y-o-y in August, which compares to already low levels of 0.6% y-o-y in July and 0.7% y-o-y in June. In the first half of the year, inflation seems to have been well supported by a rise in earnings. However, this trend turned negative in July and August, with earnings falling by 2.2% y-o-y and 0.1% y-o-y, respectively. Core inflation fell slightly to 0.5% y-o-y in August compared to 0.6% in July. The labour market remains tight as the unemployment rate continued at a rate of 2.2% in August, the lowest since the financial crisis in 2009. This should provide at least some support for wage growth and inflation. The Bank of Japan (BoJ) is expected to continue its accommodative monetary policies given the economic growth trend and low inflation. There is again some possibility that the BoJ will increase its monetary support.
Graph 3 - 7: Japan’s CPI vs earnings
Given ongoing trade disputes and the rising fragility of the global economy, export growth slowed again in August, declining by 8.2% y-o-y. This compares to a decline of 1.6% y-o-y in July and -6.6% y-o-y in June. Correspondingly, industrial production declined as well in August, falling by 1.9% y-o-y compared to -1.5% y-o-y in July and -2.3% y-o-y in June. Manufacturing orders fell by 8.3% y-o-y in July, pointing at a further slowdown in the manufacturing sector, in line with declining business sentiment.
Graph 3 - 8: Japan’s exports
0.80.6
-1.0
-0.5
0.0
0.5
1.0
1.5
2.0
2Q 1
6
3Q 1
6
4Q 1
6
1Q 1
7
2Q 1
7
3Q 1
7
4Q 1
7
1Q 1
8
2Q 1
8
3Q 1
8
4Q 1
8
1Q 1
9
2Q 1
9CPI Quarterly earnings
Sources: Ministry of Internal Affairs and Communications; Ministry of Health, Labour and Welfare; Haver Analytics.
% change y-o-y
-8.2-10
-5
0
5
10
Aug
18
Sep
18
Oct
18
Nov
18
Dec
18
Jan
19
Feb
19
Mar
19
Apr
19
May
19
Jun
19
Jul 1
9
Aug
19
Sources: Ministry of Finance, Japan Tariff Association and Haver Analytics.
% change y-o-y

World Economy
OPEC Monthly Oil Market Report – October 2019 17
Domestic retail demand rebounded considerably in August, rising by 2.0% y-o-y, compared to a decline of 2.0% y-o-y in July. This strong growth was in anticipation of the sales tax increase. This is also reflected by the strong decline in consumer confidence, which shows that the underlying sentiment was not the reason for the recovery in retails sales, and it also shows that this strong trend is not likely to continue.
Consumer confidence fell further and now stands at 35.8 in September, compared to 37.1 in August. This is now the lowest level since 2011.
Graph 3 - 9: Japan’s retail trade Graph 3 - 10: Japan’s consumer confidence index
The latest September PMI numbers confirm the low growth trend for manufacturing and while the non-manufacturing sector performed relatively better, it also retracted. The manufacturing PMI stood at 48.9 in September after reaching 49.3 in August. Hence, seven out of nine months of the year showed an index level of below 50, which amounts to a contraction in the sector. The services sector PMI – the sector that constitutes around two-thirds of the Japanese economy – declined to 52.8 in September, compared with 53.3 in August.
Japan’s 2019 GDP growth forecast remains at 0.9%. The underlying sluggish growth trend is expected to continue. Given the sales tax increase, 4Q19 growth is forecast to be significantly negative. This low growth momentum is forecast to carry over into 2020. Consequently, GDP growth for 2020 is forecast at 0.3%, unchanged from the previous month.
Graph 3 - 11: Japan’s PMIs
South Korea The South Korean economy continues to be impacted by a decline in external trade, while so far this trend was counterbalanced by solid domestic demand. Exports fell considerably again in September, down by 6.1% y-o-y, after declining by 7.5% y-o-y in August and 6.8% y-o-y in July. Consequently, industrial production (IP) remained sluggish, but increased slightly by 0.3% y-o-y. This compares to previous months of declines. The September PMI number for the manufacturing sector, 48.0, reflected the ongoing challenging environment. This compares to 49.0 in August and the July level of 47.3. The index was below 50 for eight out of nine months so far this year, indicating a contraction in the sector.
It remains to be seen how the ongoing trade challenges will affect the economy. For the time being, the 2019 GDP growth figure remains unchanged at 1.9%, while in 2020, GDP growth is forecast at 2.1%.
2.0
-3
-2
-1
0
1
2
3
4
Aug
18
Sep
18
Oct
18
Nov
18
Dec
18
Jan
19
Feb
19
Mar
19
Apr
19
May
19
Jun
19
Jul 1
9
Aug
19
Sources: Ministry of Economy, Trade and Industry and Haver Analytics.
% change y-o-y
35.834
36
38
40
42
44
Sep
18
Oct
18
Nov
18
Dec
18
Jan
19
Feb
19
Mar
19
Apr
19
May
19
Jun
19
Jul 1
9
Aug
19
Sep
19
Index
Sources: Cabinet Office of Japan and Haver Analytics.
52.8
48.948
50
52
54
Sep
18
Oct
18
Nov
18
Dec
18
Jan
19
Feb
19
Mar
19
Apr
19
May
19
Jun
19
Jul 1
9
Aug
19
Sep
19
Index
Services Manufacturing
Sources: IHS Markit, Nikkei and Haver Analytics.

World Economy
18 OPEC Monthly Oil Market Report – October 2019
OECD Europe
Euro-zone The downward slope in the Euro-zone appears to have stabilised. Lending activity to the non-banking private sector is rising and domestic demand remains solid, while international trade remains challenging, particularly for those economies that are export-oriented, namely Germany, and to some extent France. The support by the European Central Bank (ECB) with its ongoing accommodative monetary policy is one important factor to stabilise the current economic environment in the region. The German economy remains relatively soft, according to the latest data releases, however, it may recover from the currently low growth levels supported by ongoing solid domestic demand. Importantly, it remains to be seen how the global automotive sector will develop, as this is an important backbone for the German economy. At the same time, political developments in Italy have stabilised to some extent and Spain’s growth is holding up well. France’s economy has somewhat counterbalanced the downward slide in the Euro-zone economy.
In the labour market, the Euro-zone’s unemployment rate fell slightly in August, as it stood at 7.4%, the lowest rate since 2008. Unemployment in Germany stood unchanged at 3.1% in August and France’s unemployment rate stood at 8.5% for the fifth consecutive month. Spain’s labour market improved further as its jobless rate declined to 13.8% in August, compared to 13.9% in July and 14.0% in June. Unemployment in Italy remained below 10% for a fourth consecutive month, declining to a level of 9.5%, compared to 9.8% in July and 9.7% in June. This also marks the lowest level since 2011.
Graph 3 - 12: Euro-zone unemployment rate
Retail trade held up relatively well with growth in the sector remaining an important support factor for the Euro-zone economy. In value terms it stood at 2.2% y-o-y in August, compared to 2.6% y-o-y in both July and June and 2.0% y-o-y in May.
Industrial production (IP) in the Euro-zone contracted again in July, the latest available month, when it fell by 1.8% y-o-y. This comes after a decline of 2.2% y-o-y in June. This is still very much influenced by the downward trend in Germany, where IP fell by a significant 5.1% y-o-y in July and 4.9% y-o-y in August. In Italy, IP declined by 0.5% y-o-y in July, after falling 1.3% in June. France performed relatively better with IP growth declining by 0.1% y-o-y in June and 0.2% y-o-y in July.
Graph 3 - 13: Euro-zone retail sales
The most recent manufacturing orders for the Euro-zone point at a continuation of the downward trend. Manufacturing orders declined by 4.8% y-o-y in July and 3.5% y-o-y in June. That means that all available months in 2019 have seen negative or only flat growth in both IP and manufacturing orders in the Euro-zone.
7.4
7.2
7.4
7.6
7.8
8.0
8.2
Aug
18
Sep
18
Oct
18
Nov
18
Dec
18
Jan
19
Feb
19
Mar
19
Apr
19
May
19
Jun
19
Jul 1
9
Aug
19
%
Sources: Statistical Office of the European Communities and Haver Analytics.
2.2
0
1
2
3
4
5
Aug
18
Sep
18
Oct
18
Nov
18
Dec
18
Jan
19
Feb
19
Mar
19
Apr
19
May
19
Jun
19
Jul 1
9
Aug
19
% change y-o-y
Sources: Statistical Office of the European Communities and Haver Analytics.
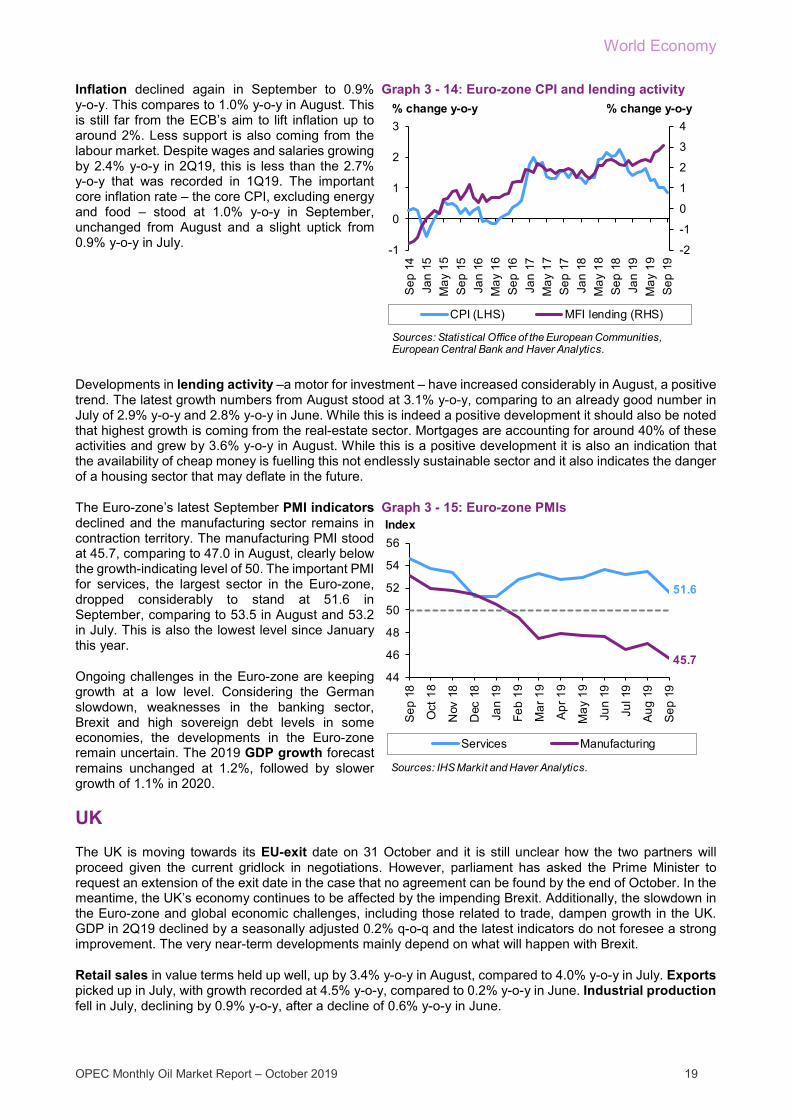
World Economy
OPEC Monthly Oil Market Report – October 2019 19
Inflation declined again in September to 0.9% y-o-y. This compares to 1.0% y-o-y in August. This is still far from the ECB’s aim to lift inflation up to around 2%. Less support is also coming from the labour market. Despite wages and salaries growing by 2.4% y-o-y in 2Q19, this is less than the 2.7% y-o-y that was recorded in 1Q19. The important core inflation rate – the core CPI, excluding energy and food – stood at 1.0% y-o-y in September, unchanged from August and a slight uptick from 0.9% y-o-y in July.
Graph 3 - 14: Euro-zone CPI and lending activity
Developments in lending activity –a motor for investment – have increased considerably in August, a positive trend. The latest growth numbers from August stood at 3.1% y-o-y, comparing to an already good number in July of 2.9% y-o-y and 2.8% y-o-y in June. While this is indeed a positive development it should also be noted that highest growth is coming from the real-estate sector. Mortgages are accounting for around 40% of these activities and grew by 3.6% y-o-y in August. While this is a positive development it is also an indication that the availability of cheap money is fuelling this not endlessly sustainable sector and it also indicates the danger of a housing sector that may deflate in the future.
The Euro-zone’s latest September PMI indicators declined and the manufacturing sector remains in contraction territory. The manufacturing PMI stood at 45.7, comparing to 47.0 in August, clearly below the growth-indicating level of 50. The important PMI for services, the largest sector in the Euro-zone, dropped considerably to stand at 51.6 in September, comparing to 53.5 in August and 53.2 in July. This is also the lowest level since January this year.
Ongoing challenges in the Euro-zone are keeping growth at a low level. Considering the German slowdown, weaknesses in the banking sector, Brexit and high sovereign debt levels in some economies, the developments in the Euro-zone remain uncertain. The 2019 GDP growth forecast remains unchanged at 1.2%, followed by slower growth of 1.1% in 2020.
Graph 3 - 15: Euro-zone PMIs
UK The UK is moving towards its EU-exit date on 31 October and it is still unclear how the two partners will proceed given the current gridlock in negotiations. However, parliament has asked the Prime Minister to request an extension of the exit date in the case that no agreement can be found by the end of October. In the meantime, the UK’s economy continues to be affected by the impending Brexit. Additionally, the slowdown in the Euro-zone and global economic challenges, including those related to trade, dampen growth in the UK. GDP in 2Q19 declined by a seasonally adjusted 0.2% q-o-q and the latest indicators do not foresee a strong improvement. The very near-term developments mainly depend on what will happen with Brexit.
Retail sales in value terms held up well, up by 3.4% y-o-y in August, compared to 4.0% y-o-y in July. Exports picked up in July, with growth recorded at 4.5% y-o-y, compared to 0.2% y-o-y in June. Industrial production fell in July, declining by 0.9% y-o-y, after a decline of 0.6% y-o-y in June.
-2
-1
0
1
2
3
4
-1
0
1
2
3
Sep
14
Jan
15M
ay 1
5S
ep 1
5Ja
n 16
May
16
Sep
16
Jan
17M
ay 1
7S
ep 1
7Ja
n 18
May
18
Sep
18
Jan
19M
ay 1
9S
ep 1
9
CPI (LHS) MFI lending (RHS)
Sources: Statistical Office of the European Communities, European Central Bank and Haver Analytics.
% change y-o-y % change y-o-y
51.6
45.744
46
48
50
52
54
56
Sep
18
Oct
18
Nov
18
Dec
18
Jan
19
Feb
19
Mar
19
Apr
19
May
19
Jun
19
Jul 1
9
Aug
19
Sep
19
Index
Services Manufacturing
Sources: IHS Markit and Haver Analytics.

World Economy
20 OPEC Monthly Oil Market Report – October 2019
Graph 3 - 16: UK industrial production Graph 3 - 17: UK PMIs
September PMI lead indicators showed a slightly improving trend in manufacturing. The PMI for manufacturing stood at 48.3, comparing to 47.4 in August and to 48.0 in July, indicating an ongoing contraction in the sector. However, the very important PMI of the services sector, which constitutes the majority of the UK’s economy, fell below the growth-indicating level of 50. It declined to 49.5, comparing to 50.6 in August and 51.4 in July.
2019 GDP growth remains at 1.1%. Given the ongoing Brexit uncertainties and the slowdown in the economy, 2020 growth was revised down to 1.0% from 1.2% in the previous month’s assessment. This 2020 forecast assumes a non-disruptive and soft Brexit, which given the ongoing uncertainties remains to be seen. Depending on Brexit developments, further downside risk remains considerable, but more so for 2020.
Non-OECD
BRICs
Table 3 - 2: Summary of macroeconomic performance of BRIC countries, 2019-2020*
-0.9
-2
-1
0
1
2Ju
l 18
Aug
18
Sep
18
Oct
18
Nov
18
Dec
18
Jan
19
Feb
19
Mar
19
Apr
19
May
19
Jun
19
Jul 1
9
Sources: Office for National Statistics and Haver Analytics.
% change y-o-y
49.5
48.3
46
48
50
52
54
56
Sep
18
Oct
18
Nov
18
Dec
18
Jan
19
Feb
19
Mar
19
Apr
19
May
19
Jun
19
Jul 1
9
Aug
19
Sep
19
Index
Services Manufacturing
Sources: CIPS, IHS Markit and Haver Analytics.
2019 2020 2019 2020 2019 2020 2019 2020 2019 2020
Brazil 0.8 1.4 3.8 3.6 -20.8 -27.1 -5.8 -4.9 82.0 83.2Russia 1.0 1.2 4.5 4.2 121.7 113.7 2.1 1.5 9.5 9.4India 6.1 6.7 3.6 4.2 -45.0 -41.2 -3.5 -3.4 47.2 46.6China 6.2 5.9 2.8 3.1 92.8 36.4 -4.5 -4.5 18.7 21.9
Note: * 2019-2020 = Forecast.Sources: Consensus Economics, Economic Intelligence Unit, Financial Times, Oxford Economics andOPEC Secretariat.
GDP growth rate,%
Consumer price index,
% change y-o-y
Current account balance, US$ bn
Government fiscal balance,
% of GDP
Net public debt, % of GDP
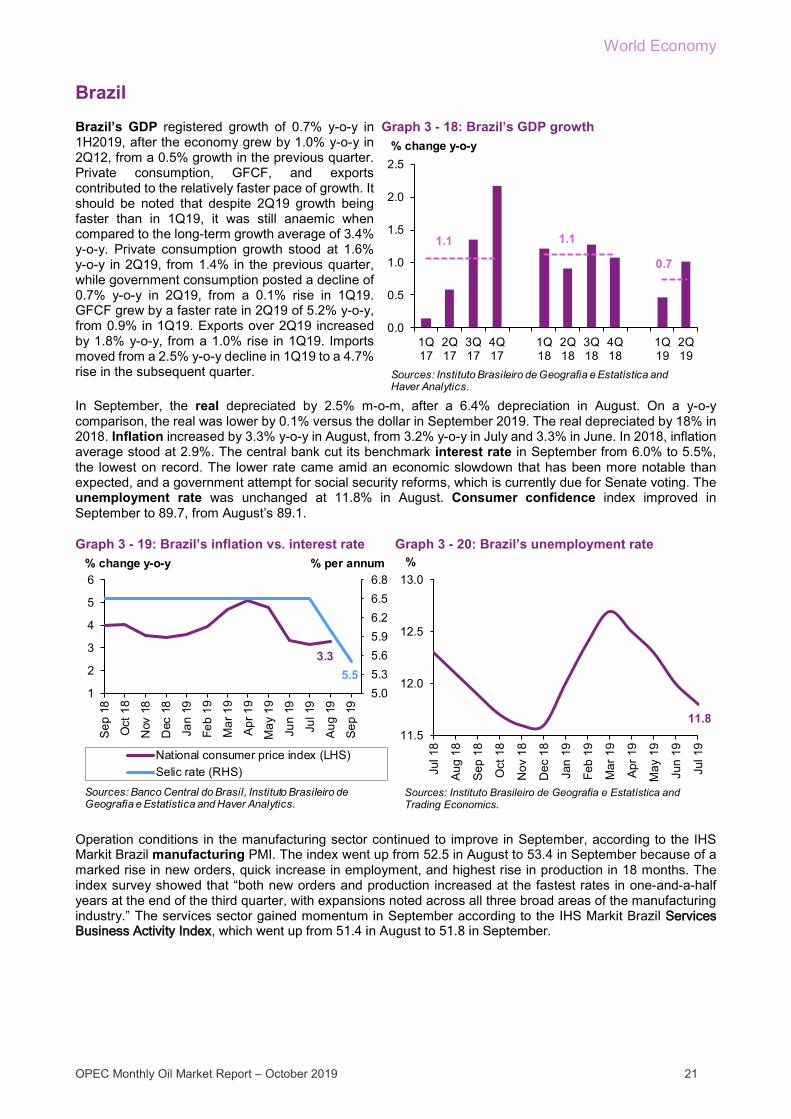
World Economy
OPEC Monthly Oil Market Report – October 2019 21
Brazil Brazil’s GDP registered growth of 0.7% y-o-y in 1H2019, after the economy grew by 1.0% y-o-y in 2Q12, from a 0.5% growth in the previous quarter. Private consumption, GFCF, and exports contributed to the relatively faster pace of growth. It should be noted that despite 2Q19 growth being faster than in 1Q19, it was still anaemic when compared to the long-term growth average of 3.4% y-o-y. Private consumption growth stood at 1.6% y-o-y in 2Q19, from 1.4% in the previous quarter, while government consumption posted a decline of 0.7% y-o-y in 2Q19, from a 0.1% rise in 1Q19. GFCF grew by a faster rate in 2Q19 of 5.2% y-o-y, from 0.9% in 1Q19. Exports over 2Q19 increased by 1.8% y-o-y, from a 1.0% rise in 1Q19. Imports moved from a 2.5% y-o-y decline in 1Q19 to a 4.7% rise in the subsequent quarter.
Graph 3 - 18: Brazil’s GDP growth
In September, the real depreciated by 2.5% m-o-m, after a 6.4% depreciation in August. On a y-o-y comparison, the real was lower by 0.1% versus the dollar in September 2019. The real depreciated by 18% in 2018. Inflation increased by 3.3% y-o-y in August, from 3.2% y-o-y in July and 3.3% in June. In 2018, inflation average stood at 2.9%. The central bank cut its benchmark interest rate in September from 6.0% to 5.5%, the lowest on record. The lower rate came amid an economic slowdown that has been more notable than expected, and a government attempt for social security reforms, which is currently due for Senate voting. The unemployment rate was unchanged at 11.8% in August. Consumer confidence index improved in September to 89.7, from August’s 89.1.
Graph 3 - 19: Brazil’s inflation vs. interest rate Graph 3 - 20: Brazil’s unemployment rate
Operation conditions in the manufacturing sector continued to improve in September, according to the IHS Markit Brazil manufacturing PMI. The index went up from 52.5 in August to 53.4 in September because of a marked rise in new orders, quick increase in employment, and highest rise in production in 18 months. The index survey showed that “both new orders and production increased at the fastest rates in one-and-a-half years at the end of the third quarter, with expansions noted across all three broad areas of the manufacturing industry.” The services sector gained momentum in September according to the IHS Markit Brazil Services Business Activity Index, which went up from 51.4 in August to 51.8 in September.
1.1 1.1
0.7
0.0
0.5
1.0
1.5
2.0
2.5
1Q17
2Q17
3Q17
4Q17
1Q18
2Q18
3Q18
4Q18
1Q19
2Q19
% change y-o-y
Sources: Instituto Brasileiro de Geografia e Estatística and Haver Analytics.
3.35.5
5.05.35.65.96.26.56.8
1
2
3
4
5
6
Sep
18
Oct
18
Nov
18
Dec
18
Jan
19
Feb
19
Mar
19
Apr
19
May
19
Jun
19
Jul 1
9
Aug
19
Sep
19
National consumer price index (LHS)Selic rate (RHS)
Sources: Banco Central do Brasil, Instituto Brasileiro de Geografia e Estatística and Haver Analytics.
% change y-o-y % per annum
11.811.5
12.0
12.5
13.0
Jul 1
8
Aug
18
Sep
18
Oct
18
Nov
18
Dec
18
Jan
19
Feb
19
Mar
19
Apr
19
May
19
Jun
19
Jul 1
9
%
Sources: Instituto Brasileiro de Geografia e Estatística and Trading Economics.
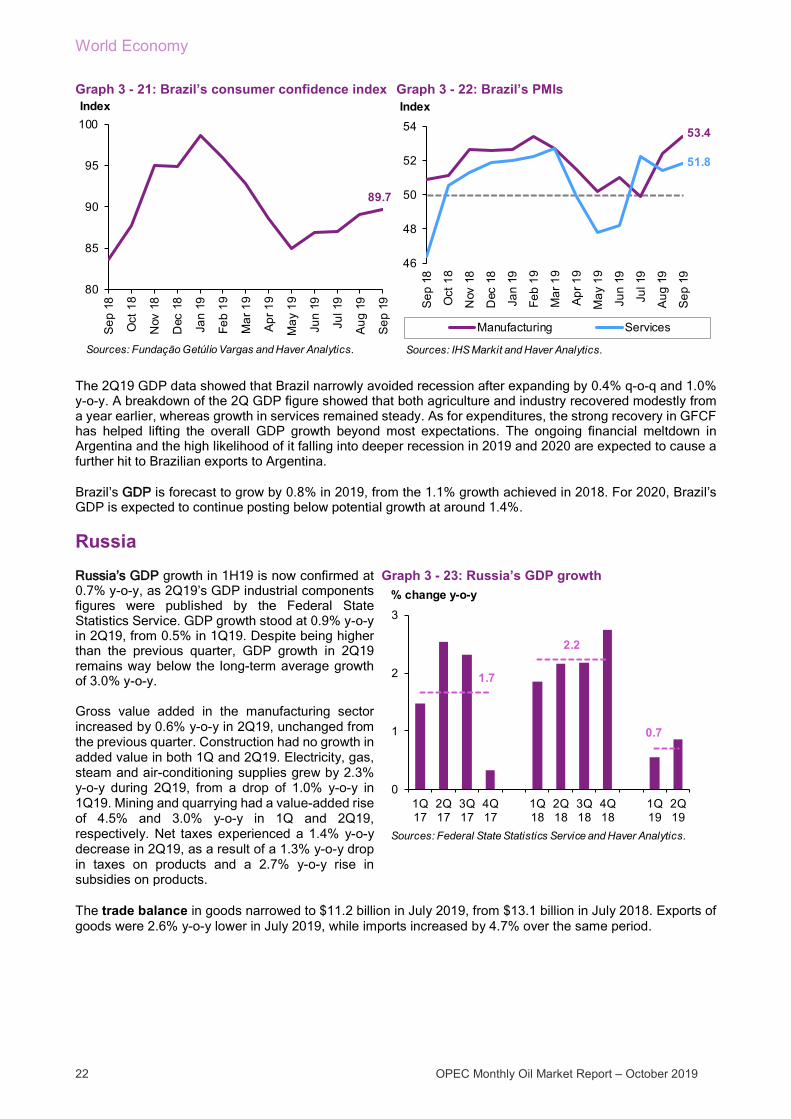
World Economy
22 OPEC Monthly Oil Market Report – October 2019
Graph 3 - 21: Brazil’s consumer confidence index Graph 3 - 22: Brazil’s PMIs
The 2Q19 GDP data showed that Brazil narrowly avoided recession after expanding by 0.4% q-o-q and 1.0% y-o-y. A breakdown of the 2Q GDP figure showed that both agriculture and industry recovered modestly from a year earlier, whereas growth in services remained steady. As for expenditures, the strong recovery in GFCF has helped lifting the overall GDP growth beyond most expectations. The ongoing financial meltdown in Argentina and the high likelihood of it falling into deeper recession in 2019 and 2020 are expected to cause a further hit to Brazilian exports to Argentina.
Brazil’s GDP is forecast to grow by 0.8% in 2019, from the 1.1% growth achieved in 2018. For 2020, Brazil’s GDP is expected to continue posting below potential growth at around 1.4%.
Russia Russia’s GDP growth in 1H19 is now confirmed at 0.7% y-o-y, as 2Q19’s GDP industrial components figures were published by the Federal State Statistics Service. GDP growth stood at 0.9% y-o-y in 2Q19, from 0.5% in 1Q19. Despite being higher than the previous quarter, GDP growth in 2Q19 remains way below the long-term average growth of 3.0% y-o-y. Gross value added in the manufacturing sector increased by 0.6% y-o-y in 2Q19, unchanged from the previous quarter. Construction had no growth in added value in both 1Q and 2Q19. Electricity, gas, steam and air-conditioning supplies grew by 2.3% y-o-y during 2Q19, from a drop of 1.0% y-o-y in 1Q19. Mining and quarrying had a value-added rise of 4.5% and 3.0% y-o-y in 1Q and 2Q19, respectively. Net taxes experienced a 1.4% y-o-y decrease in 2Q19, as a result of a 1.3% y-o-y drop in taxes on products and a 2.7% y-o-y rise in subsidies on products.
Graph 3 - 23: Russia’s GDP growth
The trade balance in goods narrowed to $11.2 billion in July 2019, from $13.1 billion in July 2018. Exports of goods were 2.6% y-o-y lower in July 2019, while imports increased by 4.7% over the same period.
89.7
80
85
90
95
100S
ep 1
8
Oct
18
Nov
18
Dec
18
Jan
19
Feb
19
Mar
19
Apr
19
May
19
Jun
19
Jul 1
9
Aug
19
Sep
19
Index
Sources: Fundação Getúlio Vargas and Haver Analytics.
53.4
51.8
46
48
50
52
54
Sep
18
Oct
18
Nov
18
Dec
18
Jan
19
Feb
19
Mar
19
Apr
19
May
19
Jun
19
Jul 1
9
Aug
19
Sep
19
Index
Manufacturing Services
Sources: IHS Markit and Haver Analytics.
1.7
2.2
0.7
0
1
2
3
1Q17
2Q17
3Q17
4Q17
1Q18
2Q18
3Q18
4Q18
1Q19
2Q19
% change y-o-y
Sources: Federal State Statistics Service and Haver Analytics.
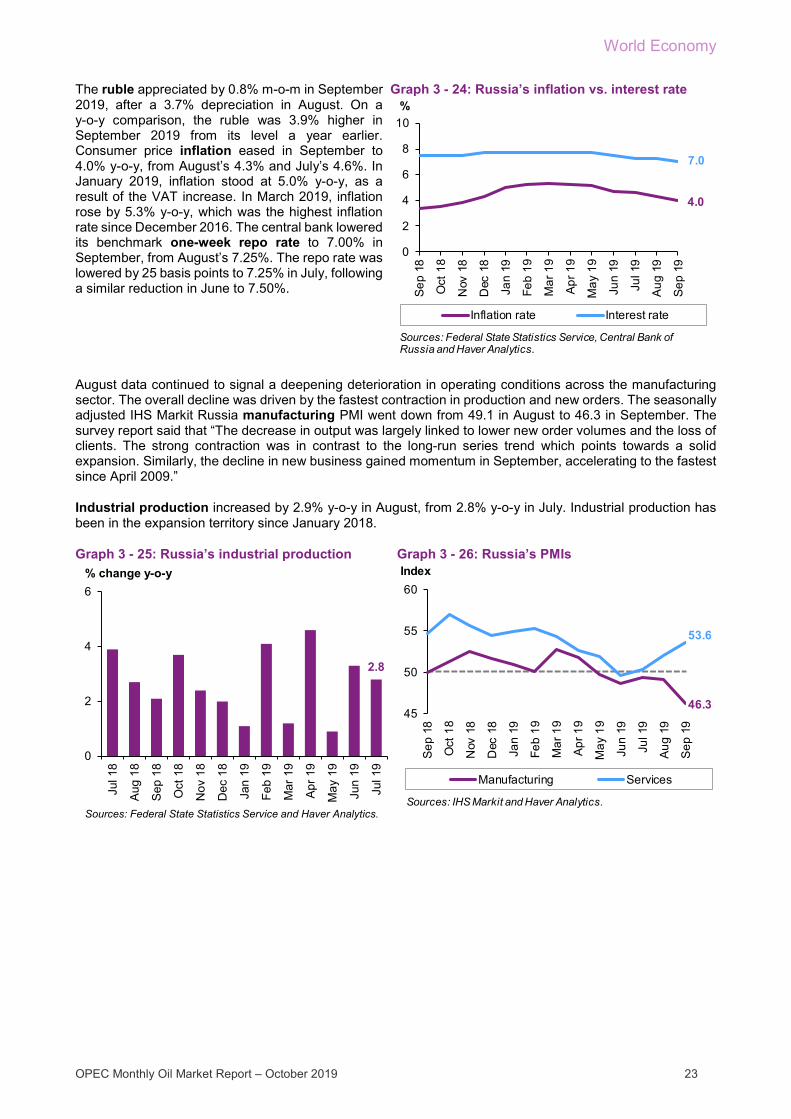
World Economy
OPEC Monthly Oil Market Report – October 2019 23
The ruble appreciated by 0.8% m-o-m in September 2019, after a 3.7% depreciation in August. On a y-o-y comparison, the ruble was 3.9% higher in September 2019 from its level a year earlier. Consumer price inflation eased in September to 4.0% y-o-y, from August’s 4.3% and July’s 4.6%. In January 2019, inflation stood at 5.0% y-o-y, as a result of the VAT increase. In March 2019, inflation rose by 5.3% y-o-y, which was the highest inflation rate since December 2016. The central bank lowered its benchmark one-week repo rate to 7.00% in September, from August’s 7.25%. The repo rate was lowered by 25 basis points to 7.25% in July, following a similar reduction in June to 7.50%.
Graph 3 - 24: Russia’s inflation vs. interest rate
August data continued to signal a deepening deterioration in operating conditions across the manufacturing sector. The overall decline was driven by the fastest contraction in production and new orders. The seasonally adjusted IHS Markit Russia manufacturing PMI went down from 49.1 in August to 46.3 in September. The survey report said that “The decrease in output was largely linked to lower new order volumes and the loss of clients. The strong contraction was in contrast to the long-run series trend which points towards a solid expansion. Similarly, the decline in new business gained momentum in September, accelerating to the fastest since April 2009.”
Industrial production increased by 2.9% y-o-y in August, from 2.8% y-o-y in July. Industrial production has been in the expansion territory since January 2018.
Graph 3 - 25: Russia’s industrial production Graph 3 - 26: Russia’s PMIs
4.0
7.0
0
2
4
6
8
10
Sep
18
Oct
18
Nov
18
Dec
18
Jan
19
Feb
19
Mar
19
Apr
19
May
19
Jun
19
Jul 1
9
Aug
19
Sep
19
%
Inflation rate Interest rate
Sources: Federal State Statistics Service, Central Bank of Russia and Haver Analytics.
2.8
0
2
4
6
Jul 1
8
Aug
18
Sep
18
Oct
18
Nov
18
Dec
18
Jan
19
Feb
19
Mar
19
Apr
19
May
19
Jun
19
Jul 1
9
% change y-o-y
Sources: Federal State Statistics Service and Haver Analytics.
46.3
53.6
45
50
55
60
Sep
18
Oct
18
Nov
18
Dec
18
Jan
19
Feb
19
Mar
19
Apr
19
May
19
Jun
19
Jul 1
9
Aug
19
Sep
19
Index
Manufacturing Services
Sources: IHS Markit and Haver Analytics.

World Economy
24 OPEC Monthly Oil Market Report – October 2019
The services sector business activity growth expanded by highest rate in six months, according to the IHS Markit Russia Services Business Activity Index, which went up from 52.1 in August to 53.6 in September. The survey report highlighted the “stronger business activity expansion across the service sector, with growth accelerating to a solid rate that was the fastest since March. Supporting the upturn was a moderate, albeit relatively subdued, increase in new orders. Subsequently, firms expanded their workforce numbers for the first time since April. Nonetheless, business confidence remained muted and dipped to a six-month low”.
Retail trade posted an expansion of only 0.8% y-o-y in August, from a 1.0% growth in July and 1.4% in June and May. Retail trade stood in the expansion territory since February 2017.
Graph 3 - 27: Russia’s retail sales
GDP growth inched higher in 2Q19 to 0.9% y-o-y, up from 0.5% in the previous quarter, easing the fears that the economy will slip into recession. However, industrial output contracted by 0.4% in 2Q19, its second consecutive quarterly decline, whilst construction stagnated. Household consumption has also been negatively affected by a VAT hike at the beginning of the year, which contributed to a rise in retail sales of only 0.8% y-o-y in August. The GDP growth forecast points to 1.0% y-o-y in 2019 and 1.2% in 2020.
India India’s GDP growth has declined 3.0 pp in 2Q19 compared with 1Q18. Looking at the main drivers, a sharp drop in consumption growth and moreover sluggish investment trends seem to have caused this decline. Furthermore, despite the strong deceleration in growth and aggressive monetary policy easing, high frequency indicators show few convincing signs of a looming recovery; in particular, consumption indicators remain low. According to the official data from India’s finance ministry, India’s real GDP growth is likely to pick up in the October 2019–March 2020 (2H20) period as consumer demand is expected to improve.
Graph 3 - 28: India’s GDP growth Graph 3 - 29: Repo rate and inflation in India
Most Indian government policy measures announced officially aim to boost consumption. On the one hand, the Reserve Bank of India (RBI) announced that it would decrease the repo rate, new floating rate loans would be linked to external benchmarks and there would be easier credit risk management norms for local banks to non-banking financial companies (NBFC) and consumer credit. On the other hand, India’s government tried to boost consumption through the following measures: releasing INR 700 billion for India’s public sector banks recapitalization, banks launching more repo rates linked to housing and vehicle loans, hikes in vehicle registration fees delayed and a reduction in bureaucracy for government departments to purchase new vehicles. These policies may help to recover consumption growth from 1Q20 ahead. However, the
0.8
0
1
2
3
4
Aug
18
Sep
18
Oct
18
Nov
18
Dec
18
Jan
19
Feb
19
Mar
19
Apr
19
May
19
Jun
19
Jul 1
9
Aug
19
% change y-o-y
Sources: Federal State Statistics Service and Haver Analytics.
6.97.4
5.4
4
5
6
7
8
9
1Q17
2Q17
3Q17
4Q17
1Q18
2Q18
3Q18
4Q18
1Q19
2Q19
Sources: National Informatics Centre (NIC) and Haver Analytics.
% change y-o-y
5.40
3.21
1.0801234567
Sep
18
Oct
18
Nov
18
Dec
18
Jan
19
Feb
19
Mar
19
Apr
19
May
19
Jun
19
Jul 1
9
Aug
19
Sep
19
Repo rateConsumer price index (CPI)Wholesale price index (WPI)
Sources: Ministry of Commerce and Industry, Reserve Bank of India and Haver Analytics.
% change y-o-y
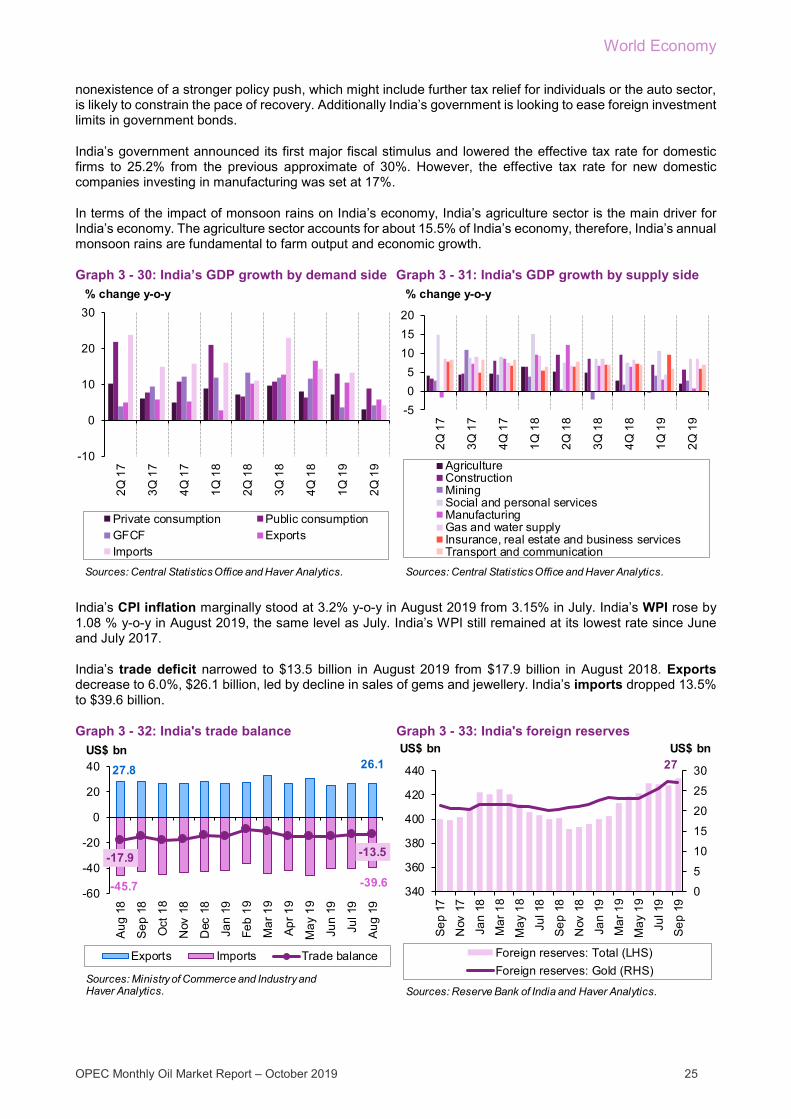
World Economy
OPEC Monthly Oil Market Report – October 2019 25
nonexistence of a stronger policy push, which might include further tax relief for individuals or the auto sector, is likely to constrain the pace of recovery. Additionally India’s government is looking to ease foreign investment limits in government bonds.
India’s government announced its first major fiscal stimulus and lowered the effective tax rate for domestic firms to 25.2% from the previous approximate of 30%. However, the effective tax rate for new domestic companies investing in manufacturing was set at 17%.
In terms of the impact of monsoon rains on India’s economy, India’s agriculture sector is the main driver for India’s economy. The agriculture sector accounts for about 15.5% of India’s economy, therefore, India’s annual monsoon rains are fundamental to farm output and economic growth.
Graph 3 - 30: India’s GDP growth by demand side Graph 3 - 31: India's GDP growth by supply side
India’s CPI inflation marginally stood at 3.2% y-o-y in August 2019 from 3.15% in July. India’s WPI rose by 1.08 % y-o-y in August 2019, the same level as July. India’s WPI still remained at its lowest rate since June and July 2017.
India’s trade deficit narrowed to $13.5 billion in August 2019 from $17.9 billion in August 2018. Exports decrease to 6.0%, $26.1 billion, led by decline in sales of gems and jewellery. India’s imports dropped 13.5% to $39.6 billion.
Graph 3 - 32: India's trade balance Graph 3 - 33: India's foreign reserves
-10
0
10
20
30
2Q 1
7
3Q 1
7
4Q 1
7
1Q 1
8
2Q 1
8
3Q 1
8
4Q 1
8
1Q 1
9
2Q 1
9
Private consumption Public consumptionGFCF ExportsImports
Sources: Central Statistics Office and Haver Analytics.
% change y-o-y
-505
101520
2Q 1
7
3Q 1
7
4Q 1
7
1Q 1
8
2Q 1
8
3Q 1
8
4Q 1
8
1Q 1
9
2Q 1
9
AgricultureConstructionMiningSocial and personal servicesManufacturingGas and water supplyInsurance, real estate and business servicesTransport and communication
Sources: Central Statistics Office and Haver Analytics.
% change y-o-y
27.8 26.1
-45.7 -39.6
-17.9 -13.5
-60
-40
-20
0
20
40
Aug
18
Sep
18
Oct
18
Nov
18
Dec
18
Jan
19
Feb
19
Mar
19
Apr
19
May
19
Jun
19
Jul 1
9
Aug
19
Exports Imports Trade balance
US$ bn
Sources: Ministry of Commerce and Industry and Haver Analytics.
27
0
5
10
15
20
25
30
340
360
380
400
420
440
Sep
17
Nov
17
Jan
18
Mar
18
May
18
Jul 1
8
Sep
18
Nov
18
Jan
19
Mar
19
May
19
Jul 1
9
Sep
19
US$ bnUS$ bn
Foreign reserves: Total (LHS)Foreign reserves: Gold (RHS)
Sources: Reserve Bank of India and Haver Analytics.
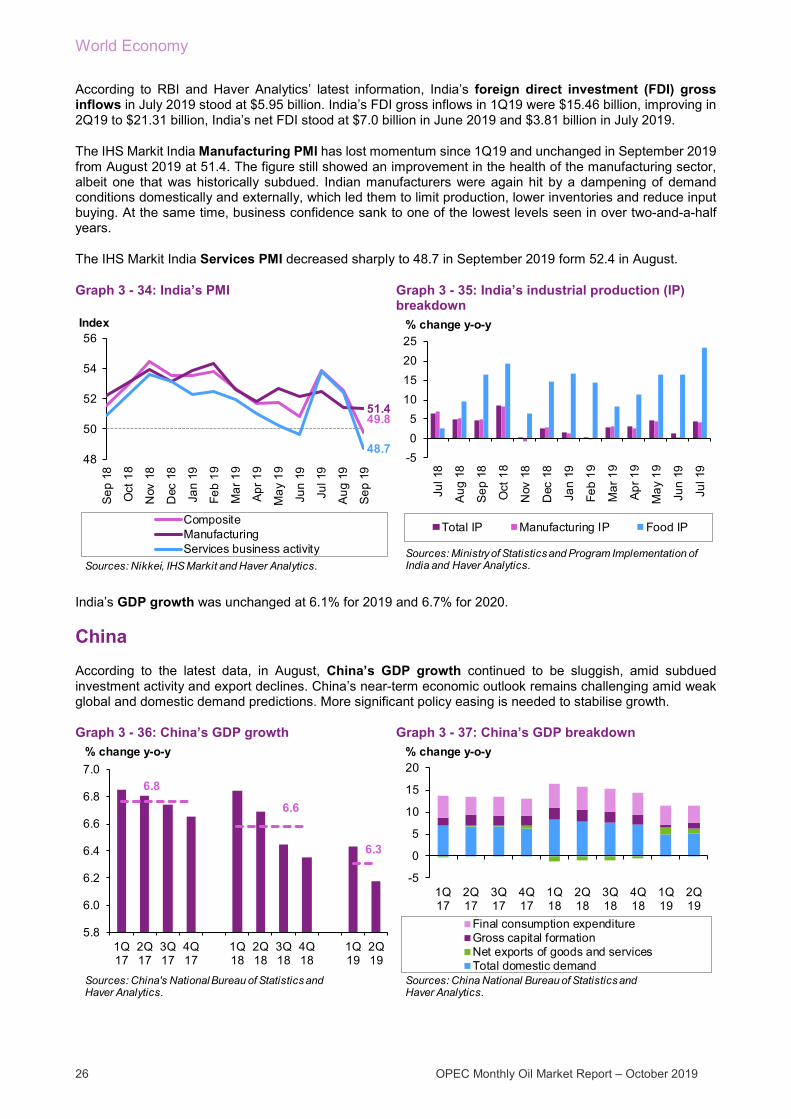
World Economy
26 OPEC Monthly Oil Market Report – October 2019
According to RBI and Haver Analytics’ latest information, India’s foreign direct investment (FDI) gross inflows in July 2019 stood at $5.95 billion. India’s FDI gross inflows in 1Q19 were $15.46 billion, improving in 2Q19 to $21.31 billion, India’s net FDI stood at $7.0 billion in June 2019 and $3.81 billion in July 2019.
The IHS Markit India Manufacturing PMI has lost momentum since 1Q19 and unchanged in September 2019 from August 2019 at 51.4. The figure still showed an improvement in the health of the manufacturing sector, albeit one that was historically subdued. Indian manufacturers were again hit by a dampening of demand conditions domestically and externally, which led them to limit production, lower inventories and reduce input buying. At the same time, business confidence sank to one of the lowest levels seen in over two-and-a-half years.
The IHS Markit India Services PMI decreased sharply to 48.7 in September 2019 form 52.4 in August.
Graph 3 - 34: India’s PMI Graph 3 - 35: India’s industrial production (IP) breakdown
India’s GDP growth was unchanged at 6.1% for 2019 and 6.7% for 2020.
China According to the latest data, in August, China’s GDP growth continued to be sluggish, amid subdued investment activity and export declines. China’s near-term economic outlook remains challenging amid weak global and domestic demand predictions. More significant policy easing is needed to stabilise growth.
Graph 3 - 36: China’s GDP growth Graph 3 - 37: China’s GDP breakdown
49.851.4
48.748
50
52
54
56
Sep
18
Oct
18
Nov
18
Dec
18
Jan
19
Feb
19
Mar
19
Apr
19
May
19
Jun
19
Jul 1
9
Aug
19
Sep
19
Index
CompositeManufacturingServices business activity
Sources: Nikkei, IHS Markit and Haver Analytics.
-505
10152025
Jul 1
8
Aug
18
Sep
18
Oct
18
Nov
18
Dec
18
Jan
19
Feb
19
Mar
19
Apr
19
May
19
Jun
19
Jul 1
9
Total IP Manufacturing IP Food IP
Sources: Ministry of Statistics and Program Implementation of India and Haver Analytics.
% change y-o-y
6.8
6.6
6.3
5.8
6.0
6.2
6.4
6.6
6.8
7.0
1Q17
2Q17
3Q17
4Q17
1Q18
2Q18
3Q18
4Q18
1Q19
2Q19
Sources: China's National Bureau of Statistics and Haver Analytics.
% change y-o-y
-5
0
5
10
15
20
1Q17
2Q17
3Q17
4Q17
1Q18
2Q18
3Q18
4Q18
1Q19
2Q19
Final consumption expenditureGross capital formationNet exports of goods and servicesTotal domestic demand
Sources: China National Bureau of Statistics andHaver Analytics.
% change y-o-y

World Economy
OPEC Monthly Oil Market Report – October 2019 27
China’s government is exploring policies aimed at boosting the economy. Quicker infrastructure and construction projects, improving and upgrading the industrial sector, various financial policies (tax and fee cuts) and also various monetary policies, ( a required reserve ratio cut )are likely to offset the influence of the subdued overseas demand and make adjust the downward pressure on China’s GDP growth in the short and midterm.
According to the latest report from the National Statistics Bureau (NSB), China’s economy is being increasingly driven by domestic consumption, even as the trade dispute and softer global demand continues to weigh on merchandise exports. Based on clear facts; weakness of domestic consumption, US-Chana trade dispute escalation and quite labour market have a negative impact on the China’s GDP growth in 3Q19. It seems decelerate 3Q19 GDP growth become lower than China’s government target which is about 6.0%-6.5%.
China’s CPI inflation is unchanged from July and stood at 2.8% y-o-y in August, compared to 2.7% in June. Since February 2018 China’s inflation remained at the highest rate. The producer prices index (PPI) decreased to 0.9% y-o-y in August in comparison to 0.4% y-o-y in July 2019. It is the sharpest fall in the PPI since August 2016, which is mainly due to prices falling for raw materials and processing.
Graph 3 - 38: China’s CPI and PPI Graph 3 - 39: China's trade balance
China's trade surplus in August 2019 widened to $34.8 billion, from $26.3 billion in August 2018. Exports decreased 1% surprisingly to $214.8 billion. Imports fell 5.6% to $180.0 billion. China's trade surplus narrowed with the US to $26.9 billion in August, from $28.0 billion in July.
The official NBS Manufacturing PMI stood at 51.4 in September, up from 50.4 in August. China’s factory activity unexpectedly expanded at the fastest pace in nineteen months in September, to signal an improvement in the health of the sector for the second month running. The rebound was largely supported by domestic demand.
The Caixin China General Manufacturing PMI as reported by Markit rose to 51.4 in September 2019 from 50.4 in August 2019.
2.8
-0.9
4.4
-2
0
2
4
6
8
Sep
17
Nov
17
Jan
18
Mar
18
May
18
Jul 1
8
Sep
18
Nov
18
Jan
19
Mar
19
May
19
Jul 1
9
Sep
19
CPI PPI Official interest rate
Sources: China Index Academy, China National Bureau of Statistics, Soufan and Haver Analytics.
% change y-o-y217 215
-191 -180
2635
-300
-200
-100
0
100
200
300
Aug
18
Sep
18
Oct
18
Nov
18
Dec
18
Jan
19Fe
b 19
Mar
19
Apr
19
May
19
Jun
19Ju
l 19
Aug
19
US$ bn
Exports Imports Trade balance
Sources: General Administration of Customs of China and Haver Analytics.
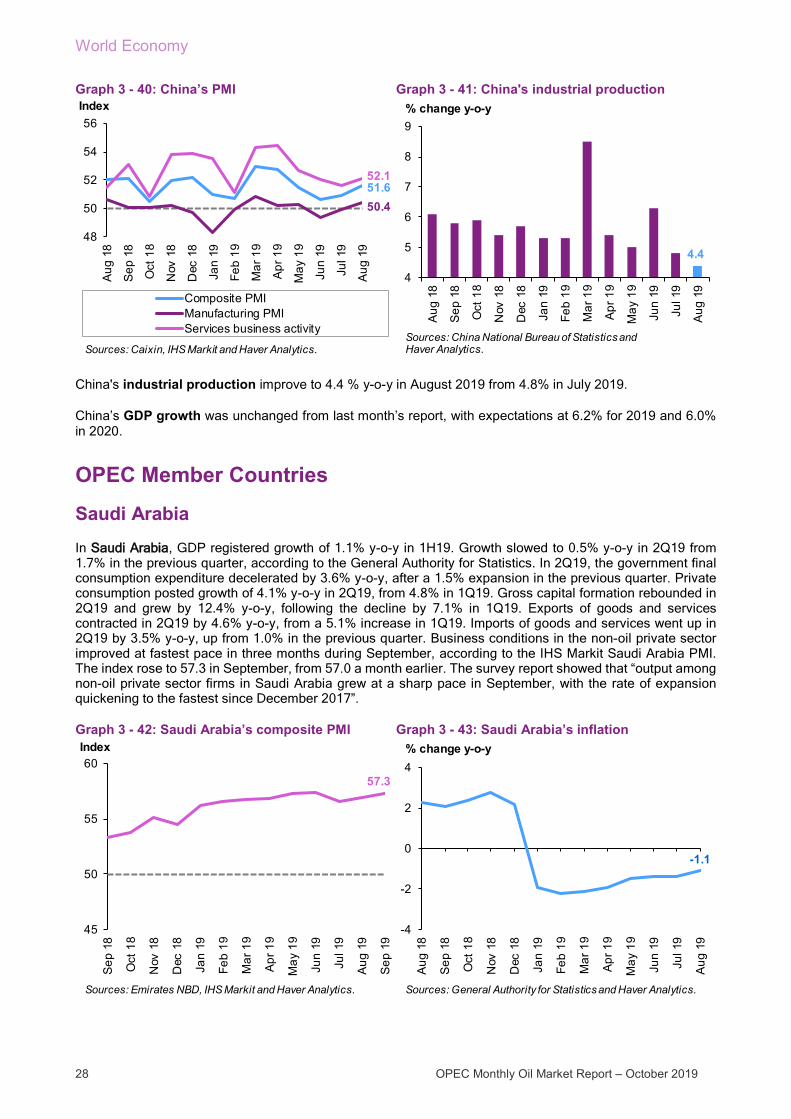
World Economy
28 OPEC Monthly Oil Market Report – October 2019
Graph 3 - 40: China’s PMI Graph 3 - 41: China's industrial production
China's industrial production improve to 4.4 % y-o-y in August 2019 from 4.8% in July 2019.
China’s GDP growth was unchanged from last month’s report, with expectations at 6.2% for 2019 and 6.0% in 2020.
OPEC Member Countries
Saudi Arabia In Saudi Arabia, GDP registered growth of 1.1% y-o-y in 1H19. Growth slowed to 0.5% y-o-y in 2Q19 from 1.7% in the previous quarter, according to the General Authority for Statistics. In 2Q19, the government final consumption expenditure decelerated by 3.6% y-o-y, after a 1.5% expansion in the previous quarter. Private consumption posted growth of 4.1% y-o-y in 2Q19, from 4.8% in 1Q19. Gross capital formation rebounded in 2Q19 and grew by 12.4% y-o-y, following the decline by 7.1% in 1Q19. Exports of goods and services contracted in 2Q19 by 4.6% y-o-y, from a 5.1% increase in 1Q19. Imports of goods and services went up in 2Q19 by 3.5% y-o-y, up from 1.0% in the previous quarter. Business conditions in the non-oil private sector improved at fastest pace in three months during September, according to the IHS Markit Saudi Arabia PMI. The index rose to 57.3 in September, from 57.0 a month earlier. The survey report showed that “output among non-oil private sector firms in Saudi Arabia grew at a sharp pace in September, with the rate of expansion quickening to the fastest since December 2017”.
Graph 3 - 42: Saudi Arabia’s composite PMI Graph 3 - 43: Saudi Arabia’s inflation
51.650.4
52.1
48
50
52
54
56A
ug 1
8
Sep
18
Oct
18
Nov
18
Dec
18
Jan
19
Feb
19
Mar
19
Apr
19
May
19
Jun
19
Jul 1
9
Aug
19
Index
Composite PMIManufacturing PMIServices business activity
Sources: Caixin, IHS Markit and Haver Analytics.
4.4
4
5
6
7
8
9
Aug
18
Sep
18
Oct
18
Nov
18
Dec
18
Jan
19
Feb
19
Mar
19
Apr
19
May
19
Jun
19
Jul 1
9
Aug
19
% change y-o-y
Sources: China National Bureau of Statistics and Haver Analytics.
57.3
45
50
55
60
Sep
18
Oct
18
Nov
18
Dec
18
Jan
19
Feb
19
Mar
19
Apr
19
May
19
Jun
19
Jul 1
9
Aug
19
Sep
19
Index
Sources: Emirates NBD, IHS Markit and Haver Analytics.
-1.1
-4
-2
0
2
4
Aug
18
Sep
18
Oct
18
Nov
18
Dec
18
Jan
19
Feb
19
Mar
19
Apr
19
May
19
Jun
19
Jul 1
9
Aug
19
Sources: General Authority for Statistics and Haver Analytics.
% change y-o-y

World Economy
OPEC Monthly Oil Market Report – October 2019 29
Nigeria In Nigeria, the Stanbic IBTC Bank Nigeria PMI rose to 57.1 in September, from 56.4 in August, as a result of higher rates of expansion in the private sector output and new orders. The survey report highlighted that “companies responded to improving new business by expanding their output. Business activity has now increased in 33 successive months, with the latest rise the sharpest for a year”. The central bank kept its benchmark monetary policy rate unchanged at 13.5% in September because inflation remains higher than the target rate range between 6% and 9%. In August, inflation eased to its lowest reading since January 2016 at 11.0% y-o-y, down from 11.1% in July. GDP grew 1.9% y-o-y in 2Q19, from an upwardly revised 2.1% expansion in 1Q19.
Graph 3 - 44: Nigeria’s composite PMI Graph 3 - 45: Nigeria’s inflation
The United Arab Emirates (UAE) In the UAE, consumer price inflation has been easing since the beginning of the year. It dropped by 2.2% y-o-y in July, after falling by 1.5% in June. Prices of housing, water, electricity and gas declined by 4.9% y-o-y in July, while transportation prices fell by 5.8% y-o-y in the same month. Net international reserves went up by 11.5% y-o-y in July at 367.6 billion dirham. The industrial production index of Abu Dhabi rose from 100.1 in 4Q18 to 142.5 in 1Q19. The GDP of Abu Dhabi registered growth of 5.7% y-o-y in 1Q19, up from 3.7% in 4Q18. The non-oil private sector continued to grow during September, albeit at a softer pace.
Graph 3 - 46: UAE’s composite PMIs Graph 3 - 47: UAE’s inflation
57.1
48
50
52
54
56
58
Sep
18
Oct
18
Nov
18
Dec
18
Jan
19
Feb
19
Mar
19
Apr
19
May
19
Jun
19
Jul 1
9
Aug
19
Sep
19
Index
Sources: IHS Markit, Stanbic IBTC Bank and Haver Analytics.
11.0
10.8
11.0
11.2
11.4
11.6
Aug
18
Sep
18
Oct
18
Nov
18
Dec
18
Jan
19
Feb
19
Mar
19
Apr
19
May
19
Jun
19
Jul 1
9
Aug
19
Sources: National Bureau of Statistics and Haver Analytics.
% change y-o-y
51.1
48
50
52
54
56
58
60
Sep
18
Oct
18
Nov
18
Dec
18
Jan
19
Feb
19
Mar
19
Apr
19
May
19
Jun
19
Jul 1
9
Aug
19
Sep
19
Index
Sources: Emirates NBD, IHS Markit and Haver Analytics.
-2.2
-4
-2
0
2
4
6
Aug
18
Sep
18
Oct
18
Nov
18
Dec
18
Jan
19
Feb
19
Mar
19
Apr
19
May
19
Jun
19
Jul 1
9
Aug
19
Sources: National Bureau of Statistics and Haver Analytics.
% change y-o-y

World Economy
30 OPEC Monthly Oil Market Report – October 2019
The IHS Markit UAE PMI plummeted from 51.6 in August to 51.1 in September. The survey report said that the “non-oil economy continued to lose steam at the end of the third quarter of 2019. After comparatively strong demand growth earlier this year, September data signalled the weakest monthly upturn in new orders in the survey history. Companies reported further competitive pressures, while also seeing a slowdown in customer movement despite sustained price discounting”.
Other Asia
Thailand In Thailand, GDP registered growth of 2.6% y-o-y in 1H19, as 2Q19’s growth slowed to 2.3% y-o-y, from 2.8% in the previous quarter. All GDP components pointed to slower growth except for imports. Private consumption growth went from 4.9% y-o-y in 1Q19 to 4.4% in the subsequent quarter, while government consumption growth dropped from 3.4% y-o-y in 1Q19 to 1.1% in 2Q19. GFCF increased by a smaller rate of 2.0% y-o-y during 2Q19, down from 3.2% in 1Q19. Exports of goods and services declined by 6.1% y-o-y in both 1Q and 2Q19, whereas imports was the only factor supporting faster GDP growth, falling by 2.7% y-o-y in 2Q19, after decreasing by 0.2% in the previous quarter. The IHS Markit Thailand manufacturing PMI suggested improvements in the operational conditions of the manufacturing sector as a result of faster growth in production and new orders. The index registered 50.6 in September, up from 50.0 in August. The survey report highlighted that “other survey indicators hinted that the improvement could be short-lived in the coming months. Business confidence among Thai goods producers remained among the lowest for the past year while factory employment continued to fall and inventory levels were stagnant. All these suggest that Thai manufacturers will continue to face considerable headwinds amid a slowing global growth environment and deteriorating trade conditions.”
Africa
Egypt In Egypt, GDP expanded by a strong 5.7% y-o-y in 1H19, as 2Q19’s GDP registered the fastest pace of growth since 1Q12. GDP grew by 5.7% y-o-y in 2Q19, up from 5.6% in the previous quarter. The increase in consumer price inflation was on a downward trend since February 2019. Inflation posted 6.8% y-o-y in August, from 7.8% a month earlier. The Egyptian pound appreciated for the ninth month in a row during September. It appreciated by 1.1% m-o-m in September, from 0.2% in August. The central bank’s policy rate was lowered in September to 13.25%, from 14.25%. The IHS Egypt PMI on September showed that the non-oil private sector remained slightly in the contraction territory. The index fractionally increased from 49.4 in August to 49.5 in September. The survey report said that “output and new orders were again reduced, although output fell at a weaker pace than in the previous month. The fall in new orders was mainly domestic, with panellists reporting a third consecutive increase in foreign sales, albeit one that was softer than in August”.
Latin America
Chile In Chile, GDP growth accelerated from 1.6% y-o-y in 1Q19 to 1.9% in 2Q19, because of the sharp decline in imports, while other GDP components showed a slower pace of growth. Private consumption growth went from 3.2% y-o-y in 1Q19 to 2.3% in 2Q19, while growth of government consumption also fell from 2.6% y-o-y in 1Q19 to 2.2% in 2Q19. Gross capital formation increased by 0.3% y-o-y in 2Q19, down from 1.4% in the previous quarter. The decline in exports continued in 2Q19 by 4.4% y-o-y, after falling by 2.6% in 1Q19. Imports were the only element that supported the achieved faster GDP growth, falling by 3.5% y-o-y in 2Q19, from a 1.4% rise in 1Q19. The Chilean peso depreciated for the second consecutive month in September. The depreciation in September was minor at 0.7% m-o-m, compared to a 4.0% depreciation in August. Inflation registered 2.3% y-o-y in August, from 2.2% a month earlier. Inflation remains within the central bank’s target limit of between 2% and 4%. As such, the central bank lowered its monetary policy rate in September from 2.5% to 2.0%. Industrial production grew by 1.4% y-o-y in August, down from a 2.9% growth in July. Manufacturing output deteriorated from a 6.3% y-o-y growth in July to a 1.6% contraction in August, whereas mining production notably improved from merely a 0.5% y-o-y increase in July to a 5.3% rise in August.

World Economy
OPEC Monthly Oil Market Report – October 2019 31
Transition region
Poland In Poland, GDP growth slowed to 4.2% y-o-y in 2Q19, down from 4.7% in the previous quarter, as a result of slower growth in exports and public expenditures. Household consumption and gross capital formation showed higher growth in 2Q19, while import growth declined. Public consumption growth went from a 6.4% y-o-y rise in 1Q19 to 2.9% in 2Q19. Exports increased by 3.9% y-o-y in 2Q19, down from 6.0% in the previous quarter. Household consumption accelerated by 4.1% y-o-y during 2Q19, up from a 3.7% rise in 1Q19. Likewise, gross capital formation went up by 7.2% y-o-y in 2Q19, from the 1Q19’s 3.7%. The increase in imports went from 5.2% y-o-y in 1Q19 to a 4.4% in 2Q19. The contraction in the manufacturing sector continued during September, as suggested by the IHS Markit Poland manufacturing PMI. The index went form 48.8 in August to 47.8 in September.

World Oil Demand
32 OPEC Monthly Oil Market Report – October 2019
World Oil Demand
World oil demand growth for 2019 was revised lower by 0.04 mb/d to 0.98 mb/d, with total oil demand standing at 99.80 mb/d. This despite an upwardly revised 3Q19 amid strong demand growth in Saudi Arabia, counterbalanced by a downward revision to oil demand data in 1H19 due to slower-than-expected oil requirements in OECD America, Asia Pacific and Other Asia.
In 2019, oil demand growth in the OECD was adjusted by 0.05 mb/d lower, due to lower-than-expected data in OECD Americas and Asia Pacific, particularly in 2Q19, as a result of weaker than expected gasoline and diesel demand in the US and slower-than-anticipated petrochemical feedstock requirements in Japan and South Korea.
In the non-OECD region, oil demand growth was revised marginally higher in 2019, mainly reflecting better-than-expected data from the Middle East. Demand in Saudi Arabia was robust due to an uptick in summer seasonal demand encouraging demand for transportation and industrial fuels. This was offset by some downward revisions to Other Asia region due slower-than-expected performance during the 2Q19.
World oil demand growth for 2020 is seen to be rising by 1.08 mb/d, similar to last month’s report, to average total demand of 100.88 mb/d. In the OECD region, oil demand is estimated to increase by 0.07 mb/d over 2019, with OECD Americas growing the most on the back of firm light and middle distillate demand. In the non-OECD region, oil demand is projected to contribute 1.01 mb/d to global oil demand growth in 2020, with Chinese oil demand growth reduced compared with 2019. However, this is offset by healthy gains in oil requirements in Other Asia, Latin America and the Middle East compared with 2019 projections.
World oil demand in 2019 and 2020 Table 4 - 1: World oil demand in 2019*, mb/d
2018 1Q19 2Q19 3Q19 4Q19 2019 Growth %
Americas 25.55 25.11 25.54 26.08 26.02 25.69 0.15 0.58 of which US 20.73 20.55 20.74 21.21 21.03 20.88 0.15 0.74Europe 14.31 13.99 14.23 14.68 14.30 14.30 0.00 -0.03Asia Pacific 8.08 8.45 7.65 7.73 8.12 7.99 -0.09 -1.14
Total OECD 47.93 47.55 47.42 48.50 48.44 47.98 0.05 0.11
Other Asia 13.64 13.91 13.96 13.71 14.21 13.95 0.31 2.27 of which India 4.73 5.03 4.75 4.57 5.14 4.87 0.14 3.00Latin America 6.53 6.36 6.58 6.83 6.49 6.57 0.04 0.62Middle East 8.12 8.25 7.90 8.54 7.88 8.14 0.02 0.25Africa 4.33 4.45 4.42 4.36 4.50 4.43 0.10 2.31
Total DCs 32.62 32.97 32.87 33.44 33.07 33.09 0.47 1.44
FSU 4.82 4.75 4.74 5.02 5.11 4.91 0.09 1.82Other Europe 0.74 0.75 0.71 0.75 0.84 0.76 0.02 2.69China 12.71 12.63 13.19 12.98 13.43 13.06 0.35 2.73
Total "Other regions" 18.27 18.13 18.64 18.75 19.38 18.73 0.45 2.49
Total world 98.82 98.65 98.93 100.70 100.89 99.80 0.98 0.99
Previous estimate 98.82 98.75 99.08 100.63 100.89 99.84 1.02 1.03Revision 0.00 -0.10 -0.15 0.07 0.00 -0.04 -0.04 -0.04
Source: OPEC Secretariat.
Change 2019/18
Totals may not add up due to independent rounding.Note: * 2019 = Forecast.
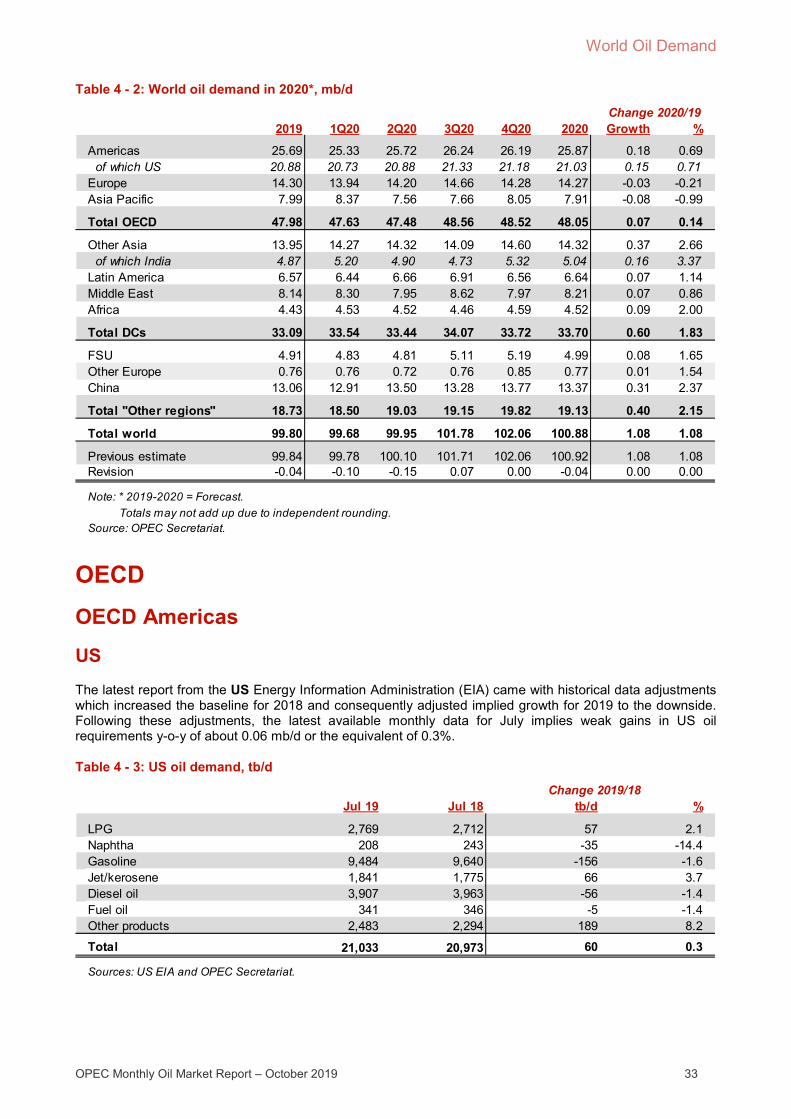
World Oil Demand
OPEC Monthly Oil Market Report – October 2019 33
Table 4 - 2: World oil demand in 2020*, mb/d
OECD OECD Americas
US The latest report from the US Energy Information Administration (EIA) came with historical data adjustments which increased the baseline for 2018 and consequently adjusted implied growth for 2019 to the downside. Following these adjustments, the latest available monthly data for July implies weak gains in US oil requirements y-o-y of about 0.06 mb/d or the equivalent of 0.3%.
Table 4 - 3: US oil demand, tb/d
2019 1Q20 2Q20 3Q20 4Q20 2020 Growth %
Americas 25.69 25.33 25.72 26.24 26.19 25.87 0.18 0.69 of which US 20.88 20.73 20.88 21.33 21.18 21.03 0.15 0.71Europe 14.30 13.94 14.20 14.66 14.28 14.27 -0.03 -0.21Asia Pacific 7.99 8.37 7.56 7.66 8.05 7.91 -0.08 -0.99
Total OECD 47.98 47.63 47.48 48.56 48.52 48.05 0.07 0.14
Other Asia 13.95 14.27 14.32 14.09 14.60 14.32 0.37 2.66 of which India 4.87 5.20 4.90 4.73 5.32 5.04 0.16 3.37Latin America 6.57 6.44 6.66 6.91 6.56 6.64 0.07 1.14Middle East 8.14 8.30 7.95 8.62 7.97 8.21 0.07 0.86Africa 4.43 4.53 4.52 4.46 4.59 4.52 0.09 2.00
Total DCs 33.09 33.54 33.44 34.07 33.72 33.70 0.60 1.83
FSU 4.91 4.83 4.81 5.11 5.19 4.99 0.08 1.65Other Europe 0.76 0.76 0.72 0.76 0.85 0.77 0.01 1.54China 13.06 12.91 13.50 13.28 13.77 13.37 0.31 2.37
Total "Other regions" 18.73 18.50 19.03 19.15 19.82 19.13 0.40 2.15
Total world 99.80 99.68 99.95 101.78 102.06 100.88 1.08 1.08
Previous estimate 99.84 99.78 100.10 101.71 102.06 100.92 1.08 1.08Revision -0.04 -0.10 -0.15 0.07 0.00 -0.04 0.00 0.00
Source: OPEC Secretariat. Totals may not add up due to independent rounding.
Change 2020/19
Note: * 2019-2020 = Forecast.
Jul 19 Jul 18 tb/d %
LPG 2,769 2,712 57 2.1Naphtha 208 243 -35 -14.4Gasoline 9,484 9,640 -156 -1.6Jet/kerosene 1,841 1,775 66 3.7Diesel oil 3,907 3,963 -56 -1.4Fuel oil 341 346 -5 -1.4Other products 2,483 2,294 189 8.2
Total 21,033 20,973 60 0.3
Change 2019/18
Sources: US EIA and OPEC Secretariat.
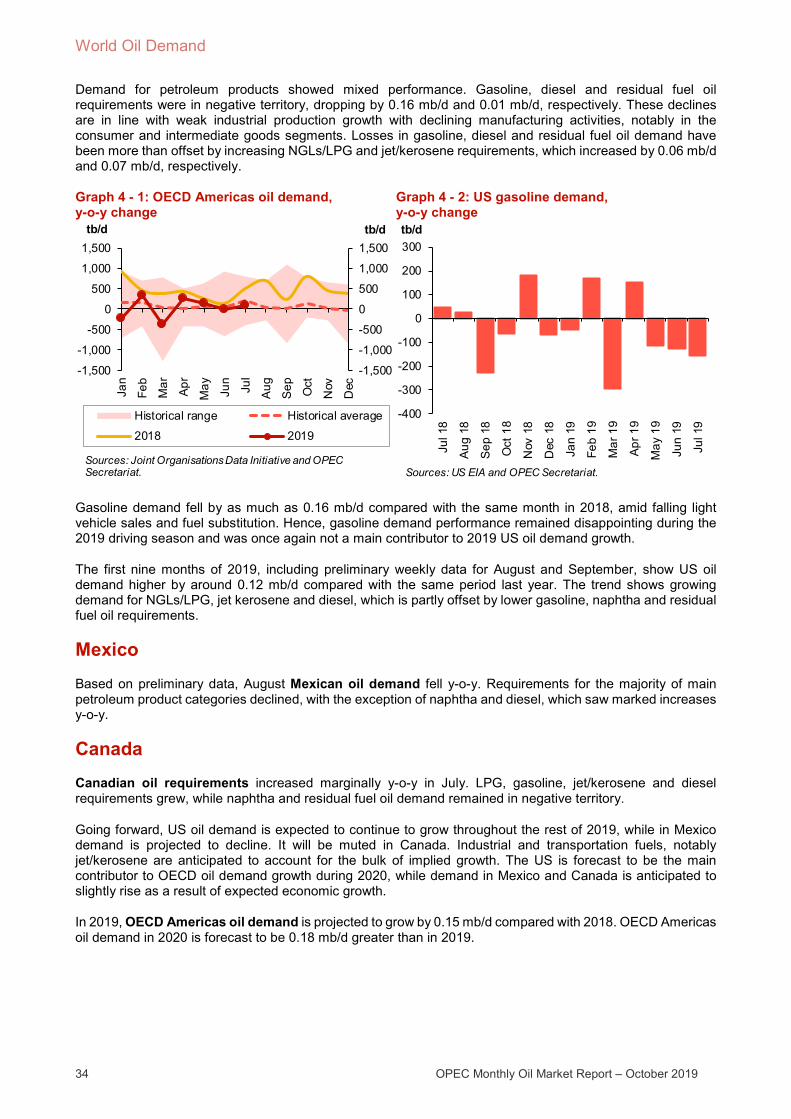
World Oil Demand
34 OPEC Monthly Oil Market Report – October 2019
Demand for petroleum products showed mixed performance. Gasoline, diesel and residual fuel oil requirements were in negative territory, dropping by 0.16 mb/d and 0.01 mb/d, respectively. These declines are in line with weak industrial production growth with declining manufacturing activities, notably in the consumer and intermediate goods segments. Losses in gasoline, diesel and residual fuel oil demand have been more than offset by increasing NGLs/LPG and jet/kerosene requirements, which increased by 0.06 mb/d and 0.07 mb/d, respectively.
Graph 4 - 1: OECD Americas oil demand, y-o-y change
Graph 4 - 2: US gasoline demand, y-o-y change
Gasoline demand fell by as much as 0.16 mb/d compared with the same month in 2018, amid falling light vehicle sales and fuel substitution. Hence, gasoline demand performance remained disappointing during the 2019 driving season and was once again not a main contributor to 2019 US oil demand growth.
The first nine months of 2019, including preliminary weekly data for August and September, show US oil demand higher by around 0.12 mb/d compared with the same period last year. The trend shows growing demand for NGLs/LPG, jet kerosene and diesel, which is partly offset by lower gasoline, naphtha and residual fuel oil requirements.
Mexico Based on preliminary data, August Mexican oil demand fell y-o-y. Requirements for the majority of main petroleum product categories declined, with the exception of naphtha and diesel, which saw marked increases y-o-y.
Canada
Canadian oil requirements increased marginally y-o-y in July. LPG, gasoline, jet/kerosene and diesel requirements grew, while naphtha and residual fuel oil demand remained in negative territory.
Going forward, US oil demand is expected to continue to grow throughout the rest of 2019, while in Mexico demand is projected to decline. It will be muted in Canada. Industrial and transportation fuels, notably jet/kerosene are anticipated to account for the bulk of implied growth. The US is forecast to be the main contributor to OECD oil demand growth during 2020, while demand in Mexico and Canada is anticipated to slightly rise as a result of expected economic growth.
In 2019, OECD Americas oil demand is projected to grow by 0.15 mb/d compared with 2018. OECD Americas oil demand in 2020 is forecast to be 0.18 mb/d greater than in 2019.
-1,500
-1,000
-500
0
500
1,000
1,500
-1,500
-1,000
-500
0
500
1,000
1,500
Jan
Feb
Mar
Apr
May Jun
Jul
Aug
Sep Oct
Nov
Dec
tb/dtb/d
Historical range Historical average
2018 2019
Sources: Joint Organisations Data Initiative and OPEC Secretariat.
-400
-300
-200
-100
0
100
200
300
Jul 1
8
Aug
18
Sep
18
Oct
18
Nov
18
Dec
18
Jan
19
Feb
19
Mar
19
Apr
19
May
19
Jun
19
Jul 1
9
tb/d
Sources: US EIA and OPEC Secretariat.
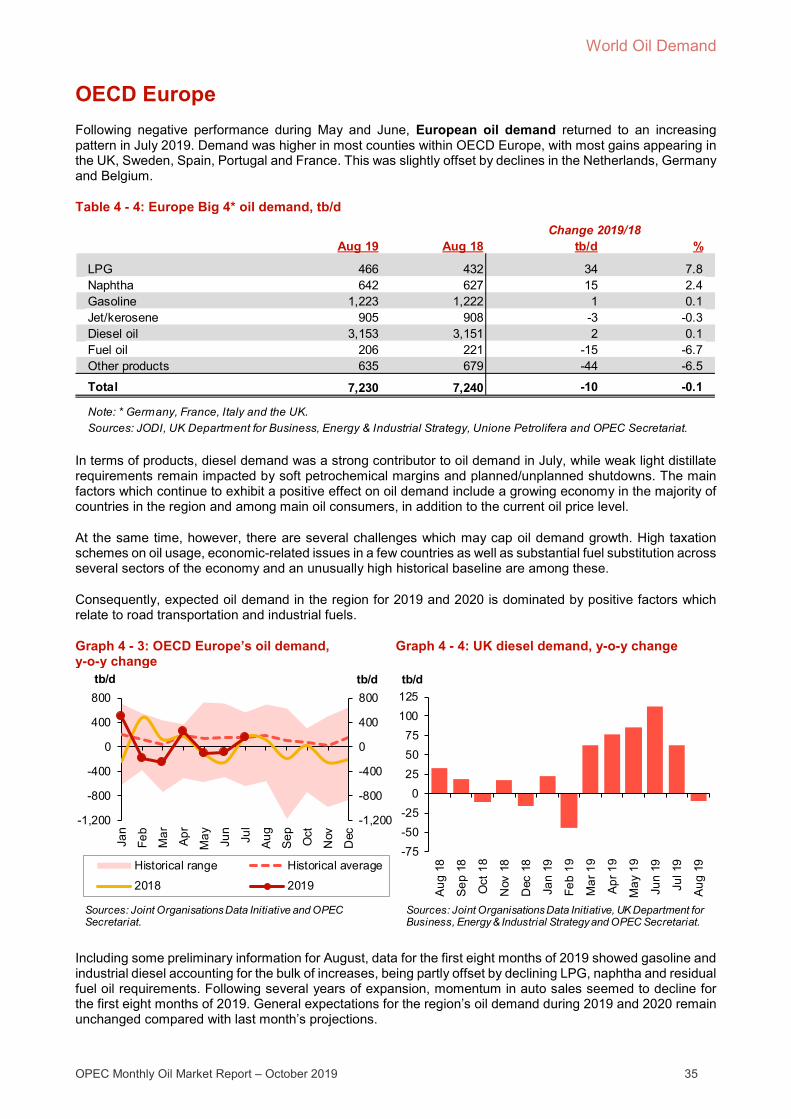
World Oil Demand
OPEC Monthly Oil Market Report – October 2019 35
OECD Europe Following negative performance during May and June, European oil demand returned to an increasing pattern in July 2019. Demand was higher in most counties within OECD Europe, with most gains appearing in the UK, Sweden, Spain, Portugal and France. This was slightly offset by declines in the Netherlands, Germany and Belgium.
Table 4 - 4: Europe Big 4* oil demand, tb/d
In terms of products, diesel demand was a strong contributor to oil demand in July, while weak light distillate requirements remain impacted by soft petrochemical margins and planned/unplanned shutdowns. The main factors which continue to exhibit a positive effect on oil demand include a growing economy in the majority of countries in the region and among main oil consumers, in addition to the current oil price level.
At the same time, however, there are several challenges which may cap oil demand growth. High taxation schemes on oil usage, economic-related issues in a few countries as well as substantial fuel substitution across several sectors of the economy and an unusually high historical baseline are among these.
Consequently, expected oil demand in the region for 2019 and 2020 is dominated by positive factors which relate to road transportation and industrial fuels.
Graph 4 - 3: OECD Europe’s oil demand, y-o-y change
Graph 4 - 4: UK diesel demand, y-o-y change
Including some preliminary information for August, data for the first eight months of 2019 showed gasoline and industrial diesel accounting for the bulk of increases, being partly offset by declining LPG, naphtha and residual fuel oil requirements. Following several years of expansion, momentum in auto sales seemed to decline for the first eight months of 2019. General expectations for the region’s oil demand during 2019 and 2020 remain unchanged compared with last month’s projections.
Aug 19 Aug 18 tb/d %
LPG 466 432 34 7.8Naphtha 642 627 15 2.4Gasoline 1,223 1,222 1 0.1Jet/kerosene 905 908 -3 -0.3Diesel oil 3,153 3,151 2 0.1Fuel oil 206 221 -15 -6.7Other products 635 679 -44 -6.5
Total 7,230 7,240 -10 -0.1
Sources: JODI, UK Department for Business, Energy & Industrial Strategy, Unione Petrolifera and OPEC Secretariat.
Change 2019/18
Note: * Germany, France, Italy and the UK.
-1,200
-800
-400
0
400
800
-1,200
-800
-400
0
400
800
Jan
Feb
Mar
Apr
May Jun
Jul
Aug
Sep Oct
Nov
Dec
tb/dtb/d
Historical range Historical average
2018 2019
Sources: Joint Organisations Data Initiative and OPEC Secretariat.
-75-50-25
0255075
100125
Aug
18
Sep
18
Oct
18
Nov
18
Dec
18
Jan
19
Feb
19
Mar
19
Apr
19
May
19
Jun
19
Jul 1
9
Aug
19
tb/d
Sources: Joint Organisations Data Initiative, UK Department forBusiness, Energy & Industrial Strategy and OPEC Secretariat.
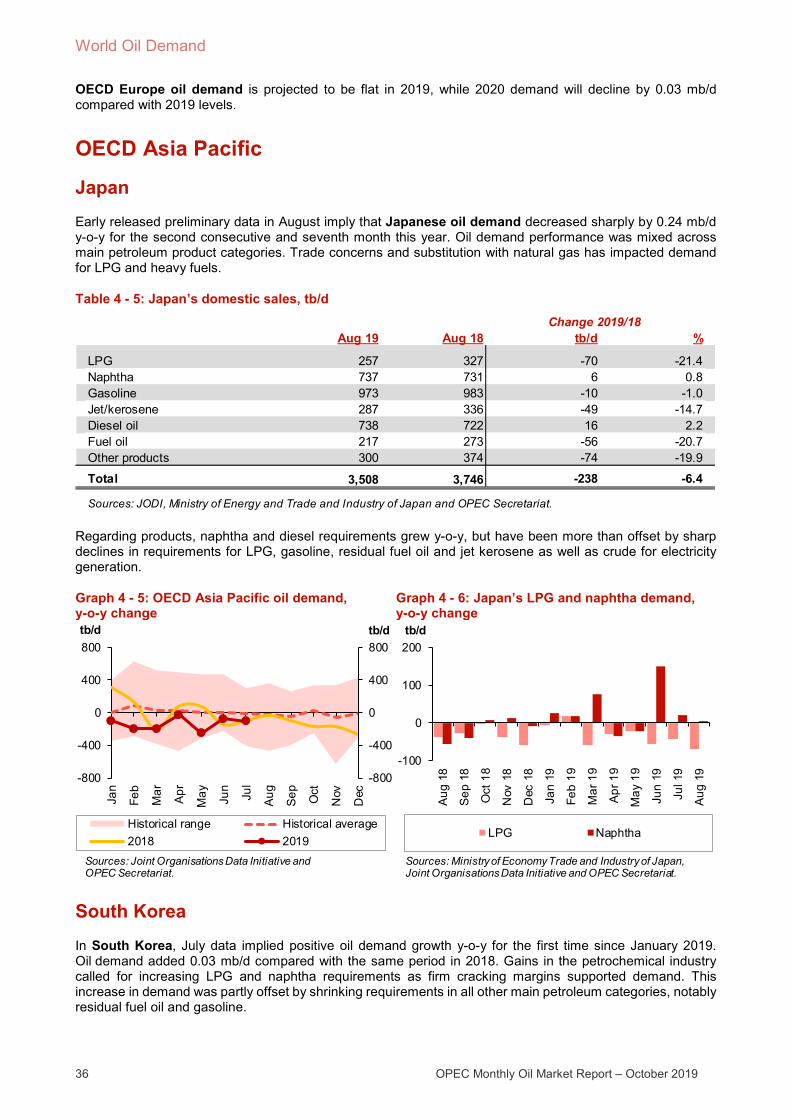
World Oil Demand
36 OPEC Monthly Oil Market Report – October 2019
OECD Europe oil demand is projected to be flat in 2019, while 2020 demand will decline by 0.03 mb/d compared with 2019 levels.
OECD Asia Pacific
Japan Early released preliminary data in August imply that Japanese oil demand decreased sharply by 0.24 mb/d y-o-y for the second consecutive and seventh month this year. Oil demand performance was mixed across main petroleum product categories. Trade concerns and substitution with natural gas has impacted demand for LPG and heavy fuels.
Table 4 - 5: Japan’s domestic sales, tb/d
Regarding products, naphtha and diesel requirements grew y-o-y, but have been more than offset by sharp declines in requirements for LPG, gasoline, residual fuel oil and jet kerosene as well as crude for electricity generation.
Graph 4 - 5: OECD Asia Pacific oil demand, y-o-y change
Graph 4 - 6: Japan’s LPG and naphtha demand, y-o-y change
South Korea In South Korea, July data implied positive oil demand growth y-o-y for the first time since January 2019. Oil demand added 0.03 mb/d compared with the same period in 2018. Gains in the petrochemical industry called for increasing LPG and naphtha requirements as firm cracking margins supported demand. This increase in demand was partly offset by shrinking requirements in all other main petroleum categories, notably residual fuel oil and gasoline.
Aug 19 Aug 18 tb/d %
LPG 257 327 -70 -21.4Naphtha 737 731 6 0.8Gasoline 973 983 -10 -1.0Jet/kerosene 287 336 -49 -14.7Diesel oil 738 722 16 2.2Fuel oil 217 273 -56 -20.7Other products 300 374 -74 -19.9
Total 3,508 3,746 -238 -6.4
Change 2019/18
Sources: JODI, Ministry of Energy and Trade and Industry of Japan and OPEC Secretariat.
-800
-400
0
400
800
-800
-400
0
400
800
Jan
Feb
Mar
Apr
May Jun
Jul
Aug
Sep Oct
Nov
Dec
tb/dtb/d
Historical range Historical average2018 2019
Sources: Joint Organisations Data Initiative and OPEC Secretariat.
-100
0
100
200
Aug
18
Sep
18
Oct
18
Nov
18
Dec
18
Jan
19
Feb
19
Mar
19
Apr
19
May
19
Jun
19
Jul 1
9
Aug
19
tb/d
LPG Naphtha
Sources: Ministryof Economy Trade and Industry of Japan, Joint Organisations Data Initiative and OPEC Secretariat.

World Oil Demand
OPEC Monthly Oil Market Report – October 2019 37
Australia In Australia, July oil demand was flat y-o-y; gains in LPG and diesel requirements were offset by declines in demand for other petroleum products.
The outlook for overall Japanese oil demand in 2019 remains bearish, with risks skewed to the downside. Oil demand projections for 2020 also foresee declines compared with 2019, with risks pointing to the downside. The outlook for South Korean oil demand during 2019 and 2020 remains in positive territory, with risks moving slightly upward compared with last month’s projections.
OECD Asia Pacific oil demand growth is projected to decline by 0.09 mb/d in 2019 compared with 2018. Oil demand in the region is projected to fall by 0.08 mb/d y-o-y in 2020.
Non-OECD
China Chinese oil demand was stronger than initially expected in August with 0.59 mb/d of growth y-o-y, the highest level in 2019 so far. Total consumption reached 12.3 mb/d according to Secretariat calculations. Oil demand growth was characterized by rising LPG and naphtha consumption in the petrochemical industry and jet fuel in transportation sector, with the latter posting more than 20% in gains y-o-y. Jet/kero demand posted solid gains in August 2019, adding 0.17 mb/d y-o-y, with total demand at around 0.97 mb/d. This increase is in line with an uptick in travel activities during the summer travel season. LPG and naphtha demand recorded an increase of 0.16 mb/d and 0.21 mb/d y-o-y, respectively.
Graph 4 - 7: Changes in China’s apparent oil demand, y-o-y change
Total consumption for LPG is now pegged at approximately 1.99 mb/d, while total demand for naphtha stood at 1.70 mb/d. Demand for light distillates was supported by the start-up of new naphtha crackers, in addition to healthy margins for propane dehydrogenation plants (PDH) around the country. Gasoline demand was marginally higher compared with last year, rising by 0.01 mb/d y-o-y. According to statistics and analysis from the China Association of Automobile Manufacturers (CAAM), passenger car sales remained declining for the 14th consecutive month, dropping by more than 8% y-o-y in August. Diesel demand dropped by around 0.07 mb/d, while industrial production growth softened to 4.4% y-o-y in August, marking the lowest reading since February 2002.
Graph 4 - 8: China’s gasoline and diesel demand growth, y-o-y change
-500-25002505007501,000
-500-250
0250500750
1,000
Jan
Feb
Mar
Apr
May Jun
Jul
Aug
Sep Oct
Nov
Dec
tb/dtb/d
Historical range Historical average2018 2019
Sources: Argus Global Markets, China OGP (Xinhua News Agency), Facts Global Energy, JODI, National Bureau of Statistics of China and OPEC Secretariat.
-300-200-100
0100200300400
Aug
18
Sep
18
Oct
18
Nov
18
Dec
18
Jan
19
Feb
19
Mar
19
Apr
19
May
19
Jun
19
Jul 1
9
Aug
19
tb/d
Gasoline Diesel
Sources: Facts Global Energy, China OGP (Xinhua News Agency), Argus Global Markets, JODI, National Bureau of Statistics, Chinaand OPEC Secretariat.

World Oil Demand
38 OPEC Monthly Oil Market Report – October 2019
Going forward, the overall outlook for Chinese oil demand is mainly dependent on projected economic growth in combination with the outlook for the petrochemical industry and transportation sector. Downside risks relate to fuel substitution in the industrial sector in addition to efficiencies and alternative vehicle penetration, as well as electric cars and bicycles in the road transportation sector. For 2020, oil demand in the transportation and industrial sectors is projected to continue rising, though GDP growth will be slightly lower than in 2019. The continuation of fuel quality programmes targeting fewer emissions, as well as fuel substitution by natural gas and coal, are factors to be watched.
For 2019, Chinese oil demand is anticipated to grow by around 0.35 mb/d while expectations for 2020 are in the range of 0.31 mb/d.
Other Asia
India Indian oil demand growth increased in August by more than 0.12 mb/d for the second month running, despite the late arrival of monsoon season, which brought heavy rains limiting oil demand.
Table 4 - 6: India’s oil demand, tb/d
Looking at the product mix, demand was supported by LPG, gasoline and naphtha, while middle distillates and residual fuel oil demand offset some of these increases. LPG grew during the month of August, recording 0.10 mb/d of growth, the equivalent of 13% y-o-y. Expansion of the LPG distribution system for use in the residential sector provided strong support for LPG demand in India.
Graph 4 - 9: Other Asia’s oil demand, y-o-y change
Graph 4 - 10: India’s gasoline demand, y-o-y change
Aug 19 Aug 18 tb/d %
LPG 868 768 100 13.0Naphtha 313 302 11 3.6Gasoline 705 647 58 8.9Jet/kerosene 277 301 -24 -7.8Diesel oil 1,608 1,622 -14 -0.9Fuel oil 232 276 -44 -16.0Other products 609 571 38 6.7
Total 4,611 4,486 125 2.8
Sources: JODI, Petroleum Planning and Analysis Cell of India and OPEC Secretariat.
Change 2019/18
-200
0
200
400
600
800
1,000
-200
0
200
400
600
800
1,000
Jan
Feb
Mar
Apr
May Jun
Jul
Aug
Sep Oct
Nov
Dec
tb/dtb/d
Historical range Historical average
2018 2019Sources: Joint Organisations Data Initiative and OPEC Secretariat.
0102030405060708090
Aug
18
Sep
18
Oct
18
Nov
18
Dec
18
Jan
19
Feb
19
Mar
19
Apr
19
May
19
Jun
19
Jul 1
9
Aug
19
tb/d
Sources: OPEC Secretariat, and Petroleum Planning and Analysis Cell of India.

World Oil Demand
OPEC Monthly Oil Market Report – October 2019 39
Gasoline consumption increased by around 0.06 mb/d, which equates to 9% y-o-y, with total consumption remaining above 0.71 mb/d, despite a continuous decrease in auto sales, which fell by more than 20% y-o-y across all segments. Two-wheelers which consume gasoline as the primary source of energy declined by more than 22% y-o-y during the same period.
On the other hand, diesel demand softened by 0.01 mb/d, or around 1% y-o-y, as slower industrial activity due to heavy rains decreased product usage. August’s composite Purchasing Manager Index (PMI) data underlined softening momentum m-o-m with 52.6 points, following 53.9 in July. The manufacturing PMI dropped by 1.1 points m-o-m to 51.4. Similarly, residual fuel oil demand flipped to the negative, shrinking by around 0.01 mb/d or around 1% y-o-y.
Thailand In Thailand, the latest July data shows a demand increase of around 0.06 mb/d, or 4%, y-o-y with mixed performance among products. Diesel led gains with growth of around 0.04 mb/d, supported by higher demand in the transportation and industrial sectors.
Indonesia In Indonesia, oil demand in July 2019 was flat y-o-y, despite increases in transportation fuel usage, which saw gasoline and diesel increasing. However, declines in jet/kerosene and residual fuel oil offset most of those increases.
Looking forward, oil demand should accelerate in 2H19 over 1H19 levels, when softer oil demand growth was noted in India, particularly in the construction sector. In 2020, assumptions hint at higher GDP growth than in the current year, as well as stable retail prices, hence further development in oil demand growth compared with the current year. India is anticipated to be the main contributor to growth in the Other Asian region. Middle distillates will be lead oil demand next year, followed by gasoline.
Other Asia’s oil demand is anticipated to grow by 0.31 mb/d y-o-y in 2019. As for 2020, oil demand is forecast to increase by 0.37 mb/d.
Latin America
Brazil Total oil demand for August in Brazil decreased slightly, in line with the economic downturn witnessed in the country. Oil demand fell by 0.01 mb/d, with mixed performance among product categories. While gasoline, diesel and ethanol posted growth, LPG, jet/kerosene and residual fuel oil offset most of these gains. Ethanol demand was stimulated by competitive pricing compared with gasoline, leading to a rise in ethanol consumption in August; it also rose by 0.01 mb/d y-o-y. Demand for gasoline increased similarly, mainly attributed to a low base line of comparison and despite higher retail prices.
Table 4 - 7: Brazil’s oil demand*, tb/d
Aug 19 Aug 18 tb/d %
LPG 240 246 -6 -2.4Naphtha 147 146 1 0.7Gasoline 661 650 12 1.8Jet/kerosene 117 124 -7 -5.6Diesel oil 1,072 1,055 17 1.6Fuel oil 74 110 -36 -32.6Other products 501 492 9 1.9
Total 2,812 2,821 -9 -0.3
Change 2019/18
Sources: JODI, Agencia Nacional do Petroleo, Gas Natural e Biocombustiveis and OPEC Secretariat.Note: * = Inland deliveries.

World Oil Demand
40 OPEC Monthly Oil Market Report – October 2019
As reported by ANP and Haver analytics, gasoline retail prices averaged 4.32 reais per litre in August, while ethanol prices averaged 2.83 reais per litre. Diesel demand improved y-o-y in line with positive manufacturing activities.
The Brazil PMI as reported by IHS Markit posted 52.5 points compared with 49.9 points in July. Diesel grew by around 0.02 mb/d as a result, with total consumption above 1.07 mb/d. Jet/kerosene dipped by around 6% y-o-y, as slower air travel activities suggested lower consumption compared with a year earlier.
Graph 4 - 11: Latin America oil demand, y-o-y change
Graph 4 - 12: Brazil’s gasoline demand, y-o-y change
The risks for the 2019 oil demand in the region are titled to the down side and are very much dependent on the performance of major economies in Latin America, with special focus on the Brazilian economy.
Projections for 2020 oil demand growth in Latin America remained unchanged from last month’s report, with anticipation of some improvement over 2019 growth levels. Brazil is projected to contribute the most to growth. Transportation fuels, construction and industrial fuels are the main industry growth contributors.
Latin American oil demand is expected to grow by 0.04 mb/d in 2019. During 2020, Latin American oil demand is projected to increase to 0.07 mb/d.
Middle East
Saudi Arabia For August, the latest monthly data from Saudi Arabia suggests firm growth in total product demand by a solid 0.38 mb/d or 16% y-o-y, the highest monthly y-o-y increase in the past five years and the second consecutive month of increases.
The most notable development was in diesel, as demand flipped into positive territory in June and remained positive over subsequent months. This was supported by a pick-up in construction activity in line with rising cement sales in August for the third straight month and compared with the same month one year earlier, suggesting that diesel consumption is expected to continue growing.
Moreover, oil demand in Saudi Arabia follows certain patterns, normally rising in the summer due to additional air conditioning usage. Demand for residual fuel oil increased by 11% y-o-y in August.
-400
-200
0
200
400
600
-400
-200
0
200
400
600
Jan
Feb
Mar
Apr
May Jun
Jul
Aug
Sep Oct
Nov
Dec
tb/dtb/d
Historical range Historical average
2018 2019
Sources: Joint Organisations Data Initiative and OPEC Secretariat.
-200
-150
-100
-50
0
50
Aug
18
Sep
18
Oct
18
Nov
18
Dec
18
Jan
19
Feb
19
Mar
19
Apr
19
May
19
Jun
19
Jul 1
9
Aug
19
tb/d
Sources: Agencia Nacional do Petroleo, Gas e Biocombustiveis of Brazil, Joint Organisations Data Initiative and OPEC Secretariat.
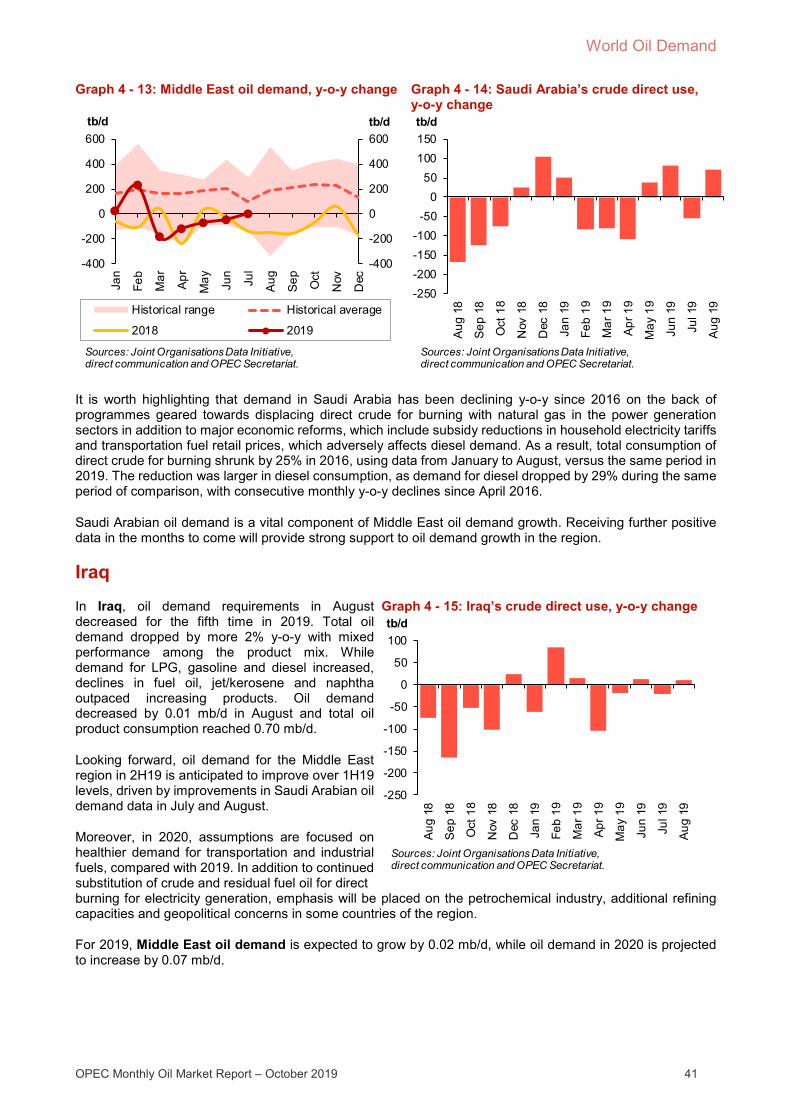
World Oil Demand
OPEC Monthly Oil Market Report – October 2019 41
Graph 4 - 13: Middle East oil demand, y-o-y change Graph 4 - 14: Saudi Arabia’s crude direct use, y-o-y change
It is worth highlighting that demand in Saudi Arabia has been declining y-o-y since 2016 on the back of programmes geared towards displacing direct crude for burning with natural gas in the power generation sectors in addition to major economic reforms, which include subsidy reductions in household electricity tariffs and transportation fuel retail prices, which adversely affects diesel demand. As a result, total consumption of direct crude for burning shrunk by 25% in 2016, using data from January to August, versus the same period in 2019. The reduction was larger in diesel consumption, as demand for diesel dropped by 29% during the same period of comparison, with consecutive monthly y-o-y declines since April 2016.
Saudi Arabian oil demand is a vital component of Middle East oil demand growth. Receiving further positive data in the months to come will provide strong support to oil demand growth in the region.
Iraq In Iraq, oil demand requirements in August decreased for the fifth time in 2019. Total oil demand dropped by more 2% y-o-y with mixed performance among the product mix. While demand for LPG, gasoline and diesel increased, declines in fuel oil, jet/kerosene and naphtha outpaced increasing products. Oil demand decreased by 0.01 mb/d in August and total oil product consumption reached 0.70 mb/d.
Looking forward, oil demand for the Middle East region in 2H19 is anticipated to improve over 1H19 levels, driven by improvements in Saudi Arabian oil demand data in July and August.
Moreover, in 2020, assumptions are focused on healthier demand for transportation and industrial fuels, compared with 2019. In addition to continued substitution of crude and residual fuel oil for direct
Graph 4 - 15: Iraq’s crude direct use, y-o-y change
burning for electricity generation, emphasis will be placed on the petrochemical industry, additional refining capacities and geopolitical concerns in some countries of the region.
For 2019, Middle East oil demand is expected to grow by 0.02 mb/d, while oil demand in 2020 is projected to increase by 0.07 mb/d.
-400
-200
0
200
400
600
-400
-200
0
200
400
600
Jan
Feb
Mar
Apr
May Jun
Jul
Aug
Sep Oct
Nov
Dec
tb/dtb/d
Historical range Historical average
2018 2019
Sources: Joint Organisations Data Initiative, direct communication and OPEC Secretariat.
-250-200-150-100
-500
50100150
Aug
18
Sep
18
Oct
18
Nov
18
Dec
18
Jan
19
Feb
19
Mar
19
Apr
19
May
19
Jun
19
Jul 1
9
Aug
19
tb/d
Sources: Joint Organisations Data Initiative, direct communication and OPEC Secretariat.
-250
-200
-150
-100
-50
0
50
100
Aug
18
Sep
18
Oct
18
Nov
18
Dec
18
Jan
19
Feb
19
Mar
19
Apr
19
May
19
Jun
19
Jul 1
9
Aug
19
tb/d
Sources: Joint Organisations Data Initiative, direct communication and OPEC Secretariat.

World Oil Supply
42 OPEC Monthly Oil Market Report – October 2019
World Oil Supply
The non-OPEC oil supply growth forecast for 2019 was revised down by 0.16 mb/d from the previous monthly report, to 1.82 mb/d. This is attributed to downward revisions mainly in the US as well as in Norway, the UK, Mexico, Malaysia and Ghana, which outpaced upward revisions for Kazakhstan, Russia, China, Brazil, Indonesia and Canada. US crude oil output fell for a third straight month in July as production in the federal offshore Gulf of Mexico (GoM) declined by 332 tb/d to average 1.58 mb/d following Hurricane Barry. US onshore crude output increased by only 50 tb/d compared to a month earlier on the back of strict capital discipline and lower rig counts, leading to a downward revision in this year’s forecast by 138 tb/d to average 1.67 mb/d, y-o-y. The main drivers for growth in 2019 are Brazil, China, the UK, Australia and Canada, while Mexico and Norway are projected to see the largest declines.
The non-OPEC oil supply growth forecast for 2020 was revised down by 0.05 mb/d from last month’s assessment and is now projected to grow by 2.20 mb/d y-o-y. This change is due to the downward revisions in Kazakhstan and Russia, which outpaced an upward revision in China. The US will be the main driver for growth for next year along with Brazil, Norway, Canada, Russia and Australia. Mexico, Indonesia, Egypt, the UK and Colombia are forecast to see the largest declines. The 2020 non-OPEC supply forecast remains subject to many uncertainties, including oil prices, capital spending, infrastructure constraints, and drilling and completion activities, particularly in the US.
OPEC NGLs y-o-y growth in 2019 is revised down by 0.02 mb/d and is now expected to grow by 0.05 mb/d to average 4.81 mb/d, while next year the growth will slow to 0.03 mb/d, reaching 4.84 mb/d.
In September, OPEC crude oil production decreased by 1,318 tb/d to average 28.49 mb/d, according to secondary sources. Preliminary non-OPEC supply, including OPEC NGLs, dropped by 0.45 mb/d m-o-m, to average 68.83 mb/d, up by 1.33 mb/d y-o-y.
As a result, preliminary data indicates that global oil supply decreased in September by 1.77 mb/d m-o-m to average 97.32 mb/d.
Table 5 - 1: Non-OPEC supply forecast comparison in 2019-2020*, mb/d
Change Change2019 2019/18 2020 2020/19
OECD Americas 25.64 1.61 27.16 1.51OECD Europe 3.73 -0.11 3.90 0.17OECD Asia Pacific 0.48 0.07 0.55 0.07Total OECD 29.85 1.56 31.60 1.75
Other Asia 3.45 -0.11 3.42 -0.03Latin America 5.39 0.20 5.64 0.25Middle East 3.21 0.00 3.25 0.04Africa 1.54 0.04 1.57 0.03Total DCs 13.60 0.13 13.88 0.28
FSU 14.30 0.01 14.41 0.10Other Europe 0.12 0.00 0.12 -0.01China 4.11 0.09 4.13 0.02
Non-OPEC production 61.98 1.79 64.13 2.15Processing gains 2.28 0.03 2.33 0.05Non-OPEC supply 64.26 1.82 66.46 2.20
Note: * 2019-2020 = Forecast.Source: OPEC Secretariat.
Region

World Oil Supply
OPEC Monthly Oil Market Report – October 2019 43
Monthly revisions to non-OPEC supply growth forecast Since the previous monthly assessment, non-OPEC supply growth in 2017 was revised down by 11 tb/d to stand at 0.79 mb/d y-o-y, mainly due to an upward revision to the historical oil supply of Africa Other. Furthermore, non-OPEC supply growth in 2018 was also revised up by 0.02 mb/d to 2.97 mb/d, mainly due to a revision to US oil supply.
Non-OPEC supply in September declined by 0.20 mb/d to average 64.23 mb/d, up by almost 1.53 mb/d y-o-y, based on preliminary data. At the same time, OPEC NGLs dropped by 0.25 mb/d to average 4.60 mb/d in September, mainly in Saudi Arabia. M-o-m increases from the US, UK, Malaysia and China offset lower output from Canada, Norway and Kazakhstan (the latter because of maintenance at the Tengiz and Karachaganak fields). Malaysia’s output rebounded to average 0.70 mb/d following the return from maintenance at Shell's Gumusut-Kakap field. US liquids supply was estimated to grow by 0.12 mb/d in September to average 18.71 mb/d, while Canadian oil output in September fell by 0.20 mb/d to average 5.19 mb/d.
Non-OPEC supply in 2019 is now estimated to grow y-o-y by 1.82 mb/d, revised down by 0.16 mb/d from the previous month’s assessment, and is expected to average 64.26 mb/d for the year.
In OECD Americas, the US supply growth forecast was revised down by 138 tb/d compared to last month’s assessment, due to downward revisions in most quarters - by 0.01 mb/d in 2Q19, by 248 tb/d in 3Q19 and 210 tb/d in 4Q19. On the other hand, Canada’s oil production growth was revised up by a minor 9 tb/d on a yearly basis, as production levels in 2Q19 and 3Q19 exceeded the supply forecast, which had been based on the mandatory production cuts imposed by the Alberta provincial government. Mexico’s oil supply forecast for 2019 was revised down by 11 tb/d following lower-than-expected output in 3Q19.
In OECD Europe, Norway’s supply forecast was revised down by 33 tb/d, on the back of lower-than-expected production by 132 tb/d in 3Q19. The UK oil supply is also revised down by 19 tb/d following a revision to production data for 2Q19 and lower-than-expected output for 3Q19.
In the developing countries, the 2019 oil supply forecasts for Malaysia, Trinidad & Tobago and Ghana were revised down by 17 tb/d, 6 tb/d and 17 tb/d, respectively, while Indonesia, Brazil and Bahrain saw upward revisions by 10 tb/d, 12 tb/d and 9 tb/d, respectively.
In the FSU, higher-than-forecast oil output in Russia in 3Q19 led to an upward revision by 8 tb/d. In Kazakhstan, production did not contract as much as previously projected for August and September because of reduced maintenance outages, leading to an upward revision of the country’s oil supply by 30 tb/d (Graph 5 - 1).
In China, the oil supply forecast for 2019 is also revised up by 14 tb/d due to good production performance in 3Q19.
Graph 5 - 1: Monthly oil market report Oct 19/Sep 19 revisions in 2019* annual supply changes
Graph 5 - 2: Monthly oil market report Oct 19/Sep 19 revisions in 2020* annual supply changes
-138
-33
-19
-17
10
12
14
30
-160 -110 -60 -10 40
US
Norway
UK
Malaysia
Indonesia
Brazil
China
Kazakhstan
tb/d
Note: * 2019 = Forecast.Source: OPEC Secretariat.
-65
-11
-5
-5
4
4
4
18
-100 -50 0 50
Kazakhstan
Russia
Brazil
Thailand
India
Qatar
Egypt
China
tb/d
Note: * 2020 = Forecast.Source: OPEC Secretariat.
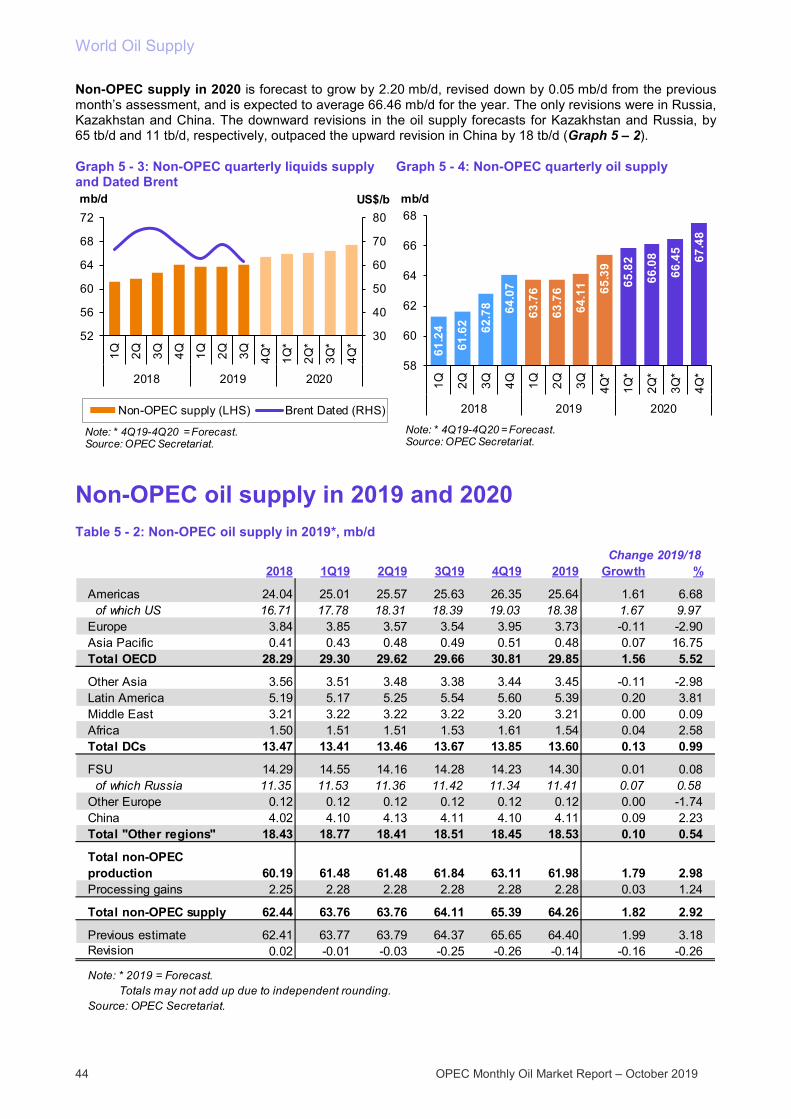
World Oil Supply
44 OPEC Monthly Oil Market Report – October 2019
Non-OPEC supply in 2020 is forecast to grow by 2.20 mb/d, revised down by 0.05 mb/d from the previous month’s assessment, and is expected to average 66.46 mb/d for the year. The only revisions were in Russia, Kazakhstan and China. The downward revisions in the oil supply forecasts for Kazakhstan and Russia, by 65 tb/d and 11 tb/d, respectively, outpaced the upward revision in China by 18 tb/d (Graph 5 – 2).
Graph 5 - 3: Non-OPEC quarterly liquids supply and Dated Brent
Graph 5 - 4: Non-OPEC quarterly oil supply
Non-OPEC oil supply in 2019 and 2020 Table 5 - 2: Non-OPEC oil supply in 2019*, mb/d
30
40
50
60
70
80
52
56
60
64
68
72
1Q 2Q 3Q 4Q 1Q 2Q 3Q 4Q*
1Q*
2Q*
3Q*
4Q*
2018 2019 2020
US$/bmb/d
Non-OPEC supply (LHS) Brent Dated (RHS)
Note: * 4Q19-4Q20 = Forecast.Source: OPEC Secretariat.
61.2
4
61.6
2 62.7
8 64.0
7
63.7
6
63.7
6
64.1
1 65.3
9
65.8
2
66.0
8
66.4
5
67.4
8
58
60
62
64
66
68
1Q 2Q 3Q 4Q 1Q 2Q 3Q 4Q*
1Q*
2Q*
3Q*
4Q*
2018 2019 2020
mb/d
Note: * 4Q19-4Q20 = Forecast.Source: OPEC Secretariat.
2018 1Q19 2Q19 3Q19 4Q19 2019 Growth %
Americas 24.04 25.01 25.57 25.63 26.35 25.64 1.61 6.68 of which US 16.71 17.78 18.31 18.39 19.03 18.38 1.67 9.97Europe 3.84 3.85 3.57 3.54 3.95 3.73 -0.11 -2.90Asia Pacific 0.41 0.43 0.48 0.49 0.51 0.48 0.07 16.75Total OECD 28.29 29.30 29.62 29.66 30.81 29.85 1.56 5.52
Other Asia 3.56 3.51 3.48 3.38 3.44 3.45 -0.11 -2.98Latin America 5.19 5.17 5.25 5.54 5.60 5.39 0.20 3.81Middle East 3.21 3.22 3.22 3.22 3.20 3.21 0.00 0.09Africa 1.50 1.51 1.51 1.53 1.61 1.54 0.04 2.58Total DCs 13.47 13.41 13.46 13.67 13.85 13.60 0.13 0.99
FSU 14.29 14.55 14.16 14.28 14.23 14.30 0.01 0.08 of which Russia 11.35 11.53 11.36 11.42 11.34 11.41 0.07 0.58Other Europe 0.12 0.12 0.12 0.12 0.12 0.12 0.00 -1.74China 4.02 4.10 4.13 4.11 4.10 4.11 0.09 2.23Total "Other regions" 18.43 18.77 18.41 18.51 18.45 18.53 0.10 0.54
Total non-OPEC production 60.19 61.48 61.48 61.84 63.11 61.98 1.79 2.98Processing gains 2.25 2.28 2.28 2.28 2.28 2.28 0.03 1.24
Total non-OPEC supply 62.44 63.76 63.76 64.11 65.39 64.26 1.82 2.92
Previous estimate 62.41 63.77 63.79 64.37 65.65 64.40 1.99 3.18Revision 0.02 -0.01 -0.03 -0.25 -0.26 -0.14 -0.16 -0.26
Source: OPEC Secretariat.
Change 2019/18
Totals may not add up due to independent rounding.Note: * 2019 = Forecast.

World Oil Supply
OPEC Monthly Oil Market Report – October 2019 45
Graph 5 - 5: Annual supply changes for selected countries in 2019*
Graph 5 - 6: Annual supply changes for selected countries in 2020*
Table 5 - 3: Non-OPEC oil supply in 2020*, mb/d
-0.15-0.14
-0.03-0.03-0.03
0.070.090.09
0.191.67
-0.5 0.0 0.5 1.0 1.5 2.0
Mexico
Norway
Malaysia
India
Kazakhstan
Australia
China
Canada
Brazil
US
mb/d
Non-OPEC supply growth
2019/181.82 mb/d
Note: * 2019 = Forecast.Source: OPEC Secretariat.
-0.12-0.03-0.03-0.03-0.03
0.090.10
0.220.28
1.54
-0.5 0.0 0.5 1.0 1.5 2.0
MexicoIndonesia
EgyptColombia
UK RussiaCanadaNorway
BrazilUS
mb/d
Non-OPEC supply growth
2020/192.20 mb/d
Note: * 2020 = Forecast.Source: OPEC Secretariat.
2019 1Q20 2Q20 3Q20 4Q20 2020 Growth %
Americas 25.64 26.67 26.95 27.36 27.65 27.16 1.51 5.90 of which US 18.38 19.31 19.90 20.11 20.33 19.92 1.54 8.37Europe 3.73 3.93 3.78 3.80 4.08 3.90 0.17 4.55Asia Pacific 0.48 0.54 0.53 0.56 0.56 0.55 0.07 15.06Total OECD 29.85 31.13 31.25 31.73 32.29 31.60 1.75 5.88
Other Asia 3.45 3.41 3.42 3.42 3.43 3.42 -0.03 -0.85Latin America 5.39 5.62 5.59 5.60 5.74 5.64 0.25 4.55Middle East 3.21 3.21 3.25 3.26 3.28 3.25 0.04 1.11Africa 1.54 1.58 1.57 1.57 1.56 1.57 0.03 1.92Total DCs 13.60 13.82 13.84 13.85 14.01 13.88 0.28 2.07
FSU 14.30 14.29 14.41 14.32 14.60 14.41 0.10 0.72 of which Russia 11.41 11.34 11.50 11.51 11.64 11.50 0.09 0.77Other Europe 0.12 0.12 0.12 0.12 0.11 0.12 -0.01 -4.92China 4.11 4.13 4.14 4.11 4.13 4.13 0.02 0.39Total "Other regions" 18.53 18.54 18.66 18.54 18.85 18.65 0.11 0.61
Total non-OPEC production 61.98 63.49 63.75 64.12 65.15 64.13 2.15 3.47Processing gains 2.28 2.33 2.33 2.33 2.33 2.33 0.05 2.37
Total non-OPEC supply 64.26 65.82 66.08 66.45 67.48 66.46 2.20 3.43
Previous estimate 64.40 66.04 66.24 66.64 67.69 66.65 2.25 3.50Revision -0.14 -0.22 -0.15 -0.18 -0.20 -0.19 -0.05 -0.07
Note: * 2019-2020 = Forecast. Totals may not add up due to independent rounding.Source: OPEC Secretariat.
Change 2020/19

World Oil Supply
46 OPEC Monthly Oil Market Report – October 2019
OECD Following robust growth of 2.59 mb/d in 2018, OECD oil supply in 2019 is forecast to grow by 1.56 mb/d to average 29.85 mb/d, representing a downward revision of 199 tb/d compared to last month's assessment, with OECD Americas accounting for 140 tb/d.
For 2020, yearly forecast growth for OECD oil supply remained unchanged at 1.75 mb/d to average 31.60 mb/d. OECD Americas, Europe and Asia Pacific are forecast to grow next year by 1.51 mb/d, 0.17 mb/d and 0.07 mb/d, respectively.
OECD Americas US Upstream spending in the US shale sector is expected to fall this year and next. Barclays Bank reported that although majors are expected to increase investments, however this would not be able to offset the pullback by independents seeking to balance their budgets. Barclays expects capital expenditure (capex) by operators in the region to fall by 2% this year compared to 2018, unchanged from its forecast in March, but far lower than the 9% increase it expected in January. This indicates spending will fall by about 15% in the second half of the year compared to the first half, when many companies spent more – 54% of the total budget by the top 35 producers – in an attempt to build momentum to sustain operations for the rest of the year, according to the bank.
US liquids output in July (excluding processing gains) fell m-o-m to average 17.87 mb/d, down by 0.46 mb/d compared to June, but higher by 1.12 mb/d y-o-y, while crude oil output dropped by 276 tb/d m-o-m to average 11.81 mb/d, but higher by 0.91 mb/d y-o-y. Production of NGLs in July was down by 114 tb/d m-o-m to average 4.68 mb/d, higher by 0.23 mb/d y-o-y. Preliminary data shows that the output of other non-conventional liquids, mainly ethanol, was down in July by 70 tb/d m-o-m to average 1.38 mb/d, higher by 21 tb/d compared to a year ago.
The EIA’s latest US monthly production information showed a decrease of 276 tb/d for crude oil production (including lease condensate) to average 11.81 mb/d in July 2019 m-o-m, more than preliminary weekly data, which would have suggested a m-o-m decrease of only 178 tb/d. Production in the federal offshore GoM plunged by
Graph 5 - 7: US monthly liquids supply by key component
332 tb/d to average 1.58 mb/d, a result of disruptions related to Hurricane Barry, while US onshore crude output increased by around 50 tb/d compared to a month earlier.
In July, crude production in Texas increased by 40 tb/d m-o-m to average 5.02 mb/d. In contrast, oil output in neighbouring New Mexico was almost flat to average 0.89 mb/d. Crude and condensate output in Colorado and Alaska fell by 10 tb/d and 7 tb/d, respectively, to average 0.51 mb/d and 0.45 mb/d. At the same time, oil output in North Dakota, Oklahoma and Wyoming grew by 14 tb/d, 18 tb/d and 14 tb/d m-o-m, respectively, to average 1.41 mb/d, 0.57 mb/d and 0.28 mb/d.
17,868
14,000
15,000
16,000
17,000
18,000
19,000
0
2,000
4,000
6,000
8,000
10,000
Jul 1
8A
ug 1
8S
ep 1
8O
ct 1
8N
ov 1
8D
ec 1
8Ja
n 19
Feb
19M
ar 1
9A
pr 1
9M
ay 1
9Ju
n 19
Jul 1
9
tb/dtb/d
Tight crude Gulf of Mexico crude
Unconventional NGL Total supply
Source: US EIA and OPEC Secretariat.
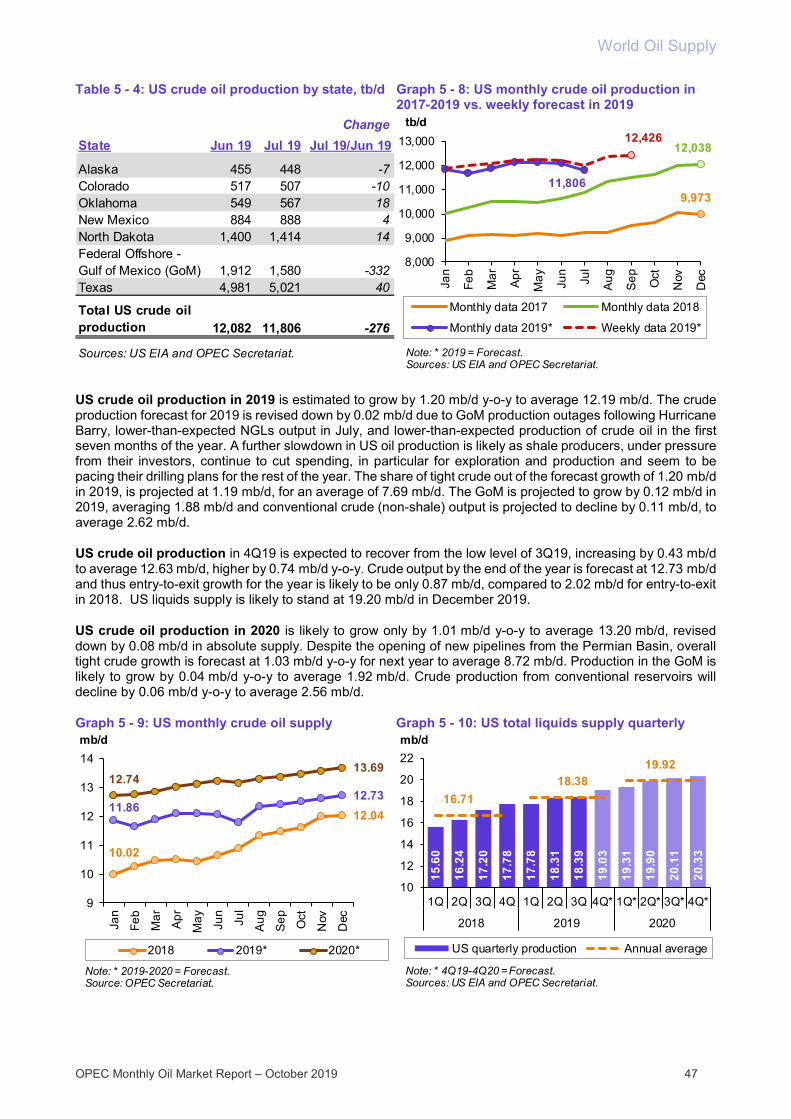
World Oil Supply
OPEC Monthly Oil Market Report – October 2019 47
Table 5 - 4: US crude oil production by state, tb/d Graph 5 - 8: US monthly crude oil production in 2017-2019 vs. weekly forecast in 2019
US crude oil production in 2019 is estimated to grow by 1.20 mb/d y-o-y to average 12.19 mb/d. The crude production forecast for 2019 is revised down by 0.02 mb/d due to GoM production outages following Hurricane Barry, lower-than-expected NGLs output in July, and lower-than-expected production of crude oil in the first seven months of the year. A further slowdown in US oil production is likely as shale producers, under pressure from their investors, continue to cut spending, in particular for exploration and production and seem to be pacing their drilling plans for the rest of the year. The share of tight crude out of the forecast growth of 1.20 mb/d in 2019, is projected at 1.19 mb/d, for an average of 7.69 mb/d. The GoM is projected to grow by 0.12 mb/d in 2019, averaging 1.88 mb/d and conventional crude (non-shale) output is projected to decline by 0.11 mb/d, to average 2.62 mb/d.
US crude oil production in 4Q19 is expected to recover from the low level of 3Q19, increasing by 0.43 mb/d to average 12.63 mb/d, higher by 0.74 mb/d y-o-y. Crude output by the end of the year is forecast at 12.73 mb/d and thus entry-to-exit growth for the year is likely to be only 0.87 mb/d, compared to 2.02 mb/d for entry-to-exit in 2018. US liquids supply is likely to stand at 19.20 mb/d in December 2019.
US crude oil production in 2020 is likely to grow only by 1.01 mb/d y-o-y to average 13.20 mb/d, revised down by 0.08 mb/d in absolute supply. Despite the opening of new pipelines from the Permian Basin, overall tight crude growth is forecast at 1.03 mb/d y-o-y for next year to average 8.72 mb/d. Production in the GoM is likely to grow by 0.04 mb/d y-o-y to average 1.92 mb/d. Crude production from conventional reservoirs will decline by 0.06 mb/d y-o-y to average 2.56 mb/d.
Graph 5 - 9: US monthly crude oil supply Graph 5 - 10: US total liquids supply quarterly
ChangeState Jun 19 Jul 19 Jul 19/Jun 19
Alaska 455 448 -7Colorado 517 507 -10Oklahoma 549 567 18New Mexico 884 888 4North Dakota 1,400 1,414 14Federal Offshore - Gulf of Mexico (GoM) 1,912 1,580 -332Texas 4,981 5,021 40
Total US crude oil production 12,082 11,806 -276
Sources: US EIA and OPEC Secretariat.
9,973
12,038
11,806
12,426
8,000
9,000
10,000
11,000
12,000
13,000
Jan
Feb
Mar
Apr
May Jun
Jul
Aug
Sep Oct
Nov
Dec
tb/d
Monthly data 2017 Monthly data 2018
Monthly data 2019* Weekly data 2019*
Note: * 2019 = Forecast.Sources: US EIA and OPEC Secretariat.
10.02
12.0411.8612.73
12.7413.69
9
10
11
12
13
14
Jan
Feb
Mar
Apr
May Jun
Jul
Aug
Sep Oct
Nov
Dec
mb/d
2018 2019* 2020*
Note: * 2019-2020 = Forecast.Source: OPEC Secretariat.
15.6
0
16.2
4
17.2
0
17.7
8
17.7
8
18.3
1
18.3
9
19.0
3
19.3
1
19.9
0
20.1
1
20.3
3
16.7118.38
19.92
10
12
14
16
18
20
22
1Q 2Q 3Q 4Q 1Q 2Q 3Q 4Q* 1Q* 2Q* 3Q* 4Q*
2018 2019 2020
mb/d
US quarterly production Annual average
Note: * 4Q19-4Q20 = Forecast.Sources: US EIA and OPEC Secretariat.
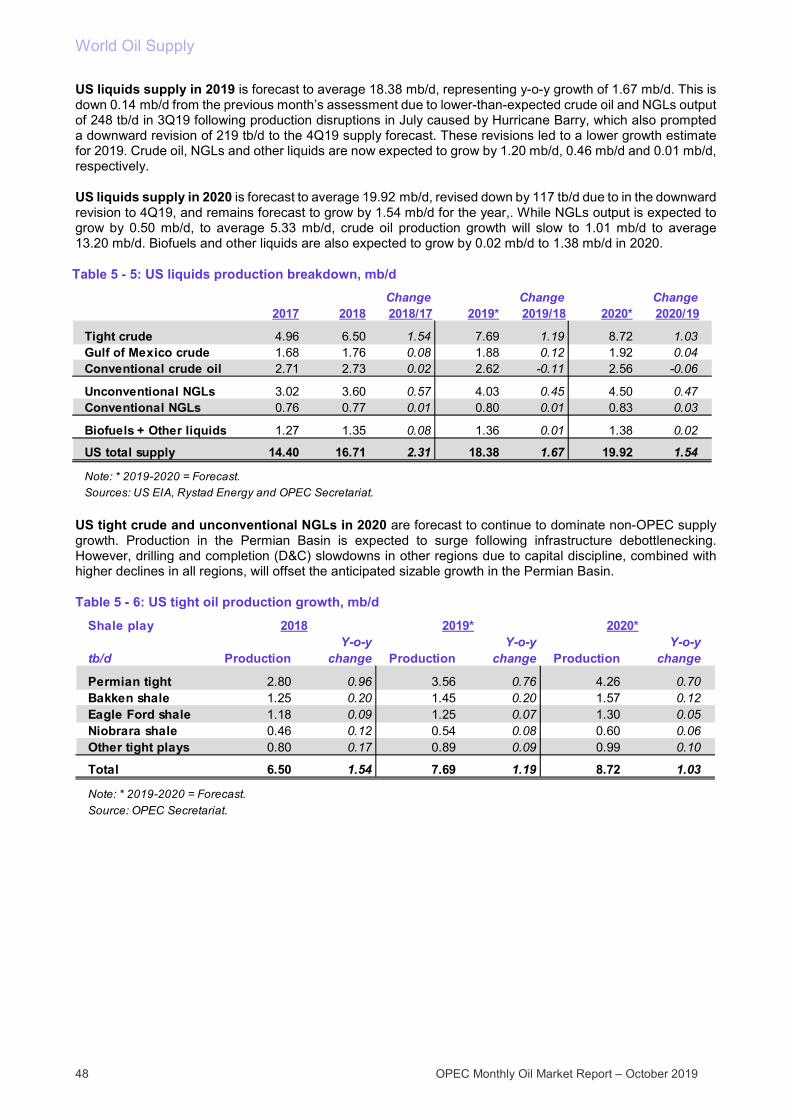
World Oil Supply
48 OPEC Monthly Oil Market Report – October 2019
US liquids supply in 2019 is forecast to average 18.38 mb/d, representing y-o-y growth of 1.67 mb/d. This is down 0.14 mb/d from the previous month’s assessment due to lower-than-expected crude oil and NGLs output of 248 tb/d in 3Q19 following production disruptions in July caused by Hurricane Barry, which also prompted a downward revision of 219 tb/d to the 4Q19 supply forecast. These revisions led to a lower growth estimate for 2019. Crude oil, NGLs and other liquids are now expected to grow by 1.20 mb/d, 0.46 mb/d and 0.01 mb/d, respectively.
US liquids supply in 2020 is forecast to average 19.92 mb/d, revised down by 117 tb/d due to in the downward revision to 4Q19, and remains forecast to grow by 1.54 mb/d for the year,. While NGLs output is expected to grow by 0.50 mb/d, to average 5.33 mb/d, crude oil production growth will slow to 1.01 mb/d to average 13.20 mb/d. Biofuels and other liquids are also expected to grow by 0.02 mb/d to 1.38 mb/d in 2020.
Table 5 - 5: US liquids production breakdown, mb/d
US tight crude and unconventional NGLs in 2020 are forecast to continue to dominate non-OPEC supply growth. Production in the Permian Basin is expected to surge following infrastructure debottlenecking. However, drilling and completion (D&C) slowdowns in other regions due to capital discipline, combined with higher declines in all regions, will offset the anticipated sizable growth in the Permian Basin.
Table 5 - 6: US tight oil production growth, mb/d
Change Change Change2017 2018 2018/17 2019* 2019/18 2020* 2020/19
Tight crude 4.96 6.50 1.54 7.69 1.19 8.72 1.03Gulf of Mexico crude 1.68 1.76 0.08 1.88 0.12 1.92 0.04Conventional crude oil 2.71 2.73 0.02 2.62 -0.11 2.56 -0.06
Unconventional NGLs 3.02 3.60 0.57 4.03 0.45 4.50 0.47Conventional NGLs 0.76 0.77 0.01 0.80 0.01 0.83 0.03
Biofuels + Other liquids 1.27 1.35 0.08 1.36 0.01 1.38 0.02
US total supply 14.40 16.71 2.31 18.38 1.67 19.92 1.54
Note: * 2019-2020 = Forecast.Sources: US EIA, Rystad Energy and OPEC Secretariat.
Shale play
tb/d ProductionY-o-y
change ProductionY-o-y
change ProductionY-o-y
change
Permian tight 2.80 0.96 3.56 0.76 4.26 0.70Bakken shale 1.25 0.20 1.45 0.20 1.57 0.12Eagle Ford shale 1.18 0.09 1.25 0.07 1.30 0.05Niobrara shale 0.46 0.12 0.54 0.08 0.60 0.06Other tight plays 0.80 0.17 0.89 0.09 0.99 0.10
Total 6.50 1.54 7.69 1.19 8.72 1.03
Note: * 2019-2020 = Forecast.Source: OPEC Secretariat.
2018 2019* 2020*
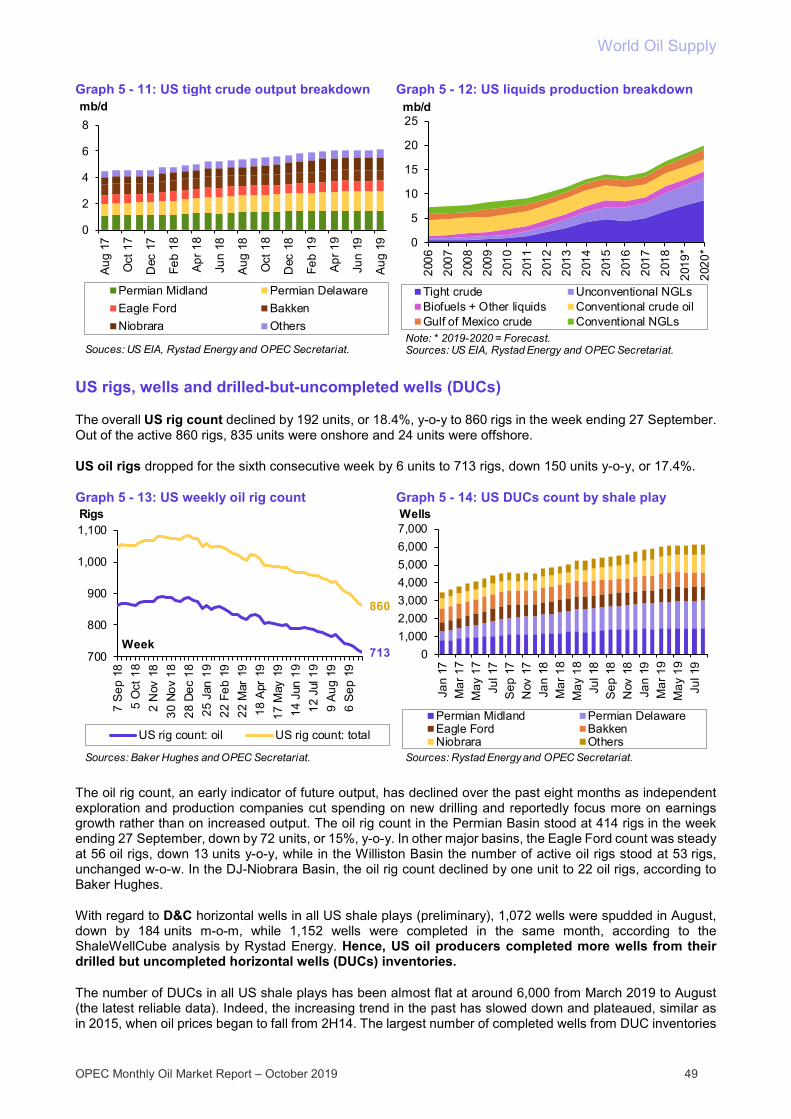
World Oil Supply
OPEC Monthly Oil Market Report – October 2019 49
Graph 5 - 11: US tight crude output breakdown Graph 5 - 12: US liquids production breakdown
US rigs, wells and drilled-but-uncompleted wells (DUCs)
The overall US rig count declined by 192 units, or 18.4%, y-o-y to 860 rigs in the week ending 27 September. Out of the active 860 rigs, 835 units were onshore and 24 units were offshore.
US oil rigs dropped for the sixth consecutive week by 6 units to 713 rigs, down 150 units y-o-y, or 17.4%.
Graph 5 - 13: US weekly oil rig count Graph 5 - 14: US DUCs count by shale play
The oil rig count, an early indicator of future output, has declined over the past eight months as independent exploration and production companies cut spending on new drilling and reportedly focus more on earnings growth rather than on increased output. The oil rig count in the Permian Basin stood at 414 rigs in the week ending 27 September, down by 72 units, or 15%, y-o-y. In other major basins, the Eagle Ford count was steady at 56 oil rigs, down 13 units y-o-y, while in the Williston Basin the number of active oil rigs stood at 53 rigs, unchanged w-o-w. In the DJ-Niobrara Basin, the oil rig count declined by one unit to 22 oil rigs, according to Baker Hughes.
With regard to D&C horizontal wells in all US shale plays (preliminary), 1,072 wells were spudded in August, down by 184 units m-o-m, while 1,152 wells were completed in the same month, according to the ShaleWellCube analysis by Rystad Energy. Hence, US oil producers completed more wells from their drilled but uncompleted horizontal wells (DUCs) inventories.
The number of DUCs in all US shale plays has been almost flat at around 6,000 from March 2019 to August (the latest reliable data). Indeed, the increasing trend in the past has slowed down and plateaued, similar as in 2015, when oil prices began to fall from 2H14. The largest number of completed wells from DUC inventories
0
2
4
6
8
Aug
17
Oct
17
Dec
17
Feb
18
Apr
18
Jun
18
Aug
18
Oct
18
Dec
18
Feb
19
Apr
19
Jun
19
Aug
19
mb/d
Permian Midland Permian DelawareEagle Ford BakkenNiobrara Others
Souces: US EIA, Rystad Energy and OPEC Secretariat.
0
5
10
15
20
25
2006
2007
2008
2009
2010
2011
2012
2013
2014
2015
2016
2017
2018
2019
*20
20*
mb/d
Tight crude Unconventional NGLsBiofuels + Other liquids Conventional crude oilGulf of Mexico crude Conventional NGLs
Note: * 2019-2020 = Forecast.Sources: US EIA, Rystad Energy and OPEC Secretariat.
713
860
700
800
900
1,000
1,100
7 S
ep 1
85
Oct
18
2 N
ov 1
830
Nov
18
28 D
ec 1
825
Jan
19
22 F
eb 1
922
Mar
19
18 A
pr 1
917
May
19
14 J
un 1
912
Jul
19
9 A
ug 1
96
Sep
19
Rigs
Week
US rig count: oil US rig count: total
Sources: Baker Hughes and OPEC Secretariat.
01,0002,0003,0004,0005,0006,0007,000
Jan
17M
ar 1
7M
ay 1
7Ju
l 17
Sep
17
Nov
17
Jan
18M
ar 1
8M
ay 1
8Ju
l 18
Sep
18
Nov
18
Jan
19M
ar 1
9M
ay 1
9Ju
l 19
Wells
Permian Midland Permian DelawareEagle Ford BakkenNiobrara Others
Sources: Rystad Energy and OPEC Secretariat.
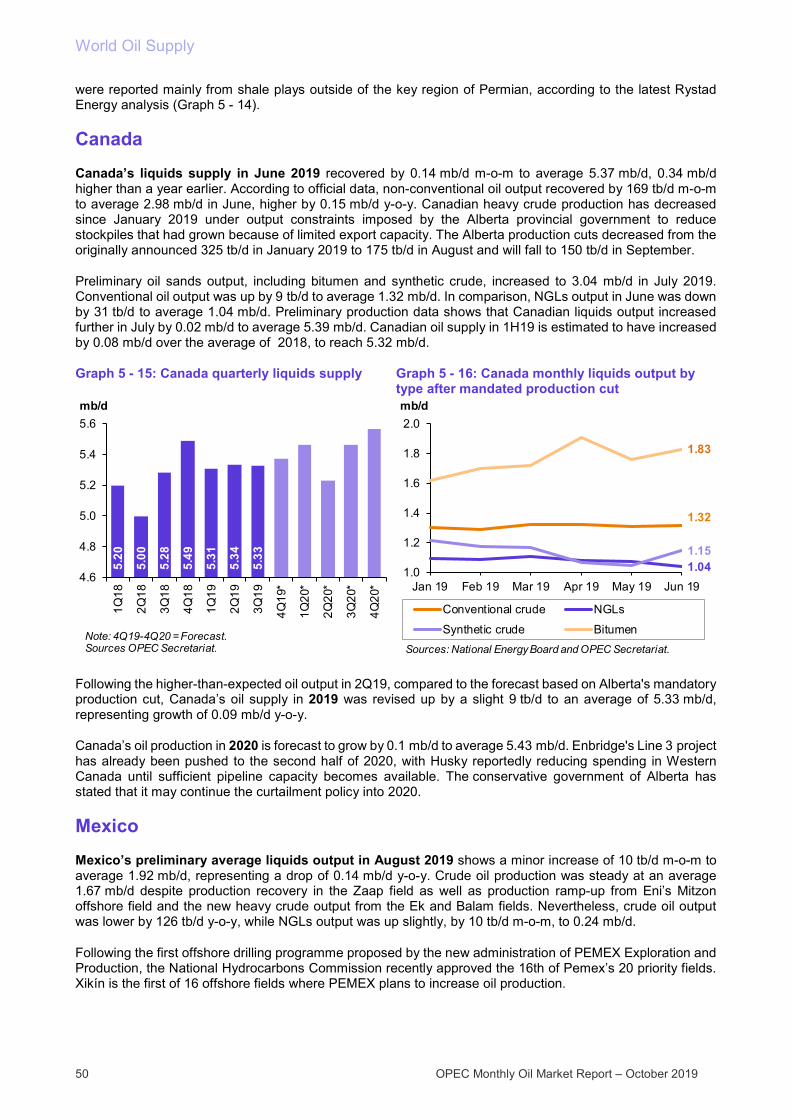
World Oil Supply
50 OPEC Monthly Oil Market Report – October 2019
were reported mainly from shale plays outside of the key region of Permian, according to the latest Rystad Energy analysis (Graph 5 - 14).
Canada Canada’s liquids supply in June 2019 recovered by 0.14 mb/d m-o-m to average 5.37 mb/d, 0.34 mb/d higher than a year earlier. According to official data, non-conventional oil output recovered by 169 tb/d m-o-m to average 2.98 mb/d in June, higher by 0.15 mb/d y-o-y. Canadian heavy crude production has decreased since January 2019 under output constraints imposed by the Alberta provincial government to reduce stockpiles that had grown because of limited export capacity. The Alberta production cuts decreased from the originally announced 325 tb/d in January 2019 to 175 tb/d in August and will fall to 150 tb/d in September.
Preliminary oil sands output, including bitumen and synthetic crude, increased to 3.04 mb/d in July 2019. Conventional oil output was up by 9 tb/d to average 1.32 mb/d. In comparison, NGLs output in June was down by 31 tb/d to average 1.04 mb/d. Preliminary production data shows that Canadian liquids output increased further in July by 0.02 mb/d to average 5.39 mb/d. Canadian oil supply in 1H19 is estimated to have increased by 0.08 mb/d over the average of 2018, to reach 5.32 mb/d.
Graph 5 - 15: Canada quarterly liquids supply Graph 5 - 16: Canada monthly liquids output by type after mandated production cut
Following the higher-than-expected oil output in 2Q19, compared to the forecast based on Alberta's mandatory production cut, Canada’s oil supply in 2019 was revised up by a slight 9 tb/d to an average of 5.33 mb/d, representing growth of 0.09 mb/d y-o-y.
Canada’s oil production in 2020 is forecast to grow by 0.1 mb/d to average 5.43 mb/d. Enbridge's Line 3 project has already been pushed to the second half of 2020, with Husky reportedly reducing spending in Western Canada until sufficient pipeline capacity becomes available. The conservative government of Alberta has stated that it may continue the curtailment policy into 2020.
Mexico Mexico’s preliminary average liquids output in August 2019 shows a minor increase of 10 tb/d m-o-m to average 1.92 mb/d, representing a drop of 0.14 mb/d y-o-y. Crude oil production was steady at an average 1.67 mb/d despite production recovery in the Zaap field as well as production ramp-up from Eni’s Mitzon offshore field and the new heavy crude output from the Ek and Balam fields. Nevertheless, crude oil output was lower by 126 tb/d y-o-y, while NGLs output was up slightly, by 10 tb/d m-o-m, to 0.24 mb/d.
Following the first offshore drilling programme proposed by the new administration of PEMEX Exploration and Production, the National Hydrocarbons Commission recently approved the 16th of Pemex’s 20 priority fields. Xikín is the first of 16 offshore fields where PEMEX plans to increase oil production.
5.20
5.00
5.28
5.49
5.31
5.34
5.33
4.6
4.8
5.0
5.2
5.4
5.6
1Q18
2Q18
3Q18
4Q18
1Q19
2Q19
3Q19
4Q19
*
1Q20
*
2Q20
*
3Q20
*
4Q20
*
mb/d
Note: 4Q19-4Q20 = Forecast.Sources OPEC Secretariat.
1.32
1.041.15
1.83
1.0
1.2
1.4
1.6
1.8
2.0
Jan 19 Feb 19 Mar 19 Apr 19 May 19 Jun 19
mb/d
Conventional crude NGLs
Synthetic crude BitumenSources: National Energy Board and OPEC Secretariat.

World Oil Supply
OPEC Monthly Oil Market Report – October 2019 51
Graph 5 - 17: Mexico’s quarterly liquids supply Graph 5 - 18: Mexico’s crude and condensate monthly output by region
Despite the start of production in Mexico's new oil fields in 2H19, the preliminary oil supply forecast in 3Q19 was unexpectedly at the same level in 2Q19 at 1.91 mb/d, leading to a downward revision in 2019 Mexico oil supply by 11 tb/d. This represents a y-o-y contraction of 0.15 mb/d to average 1.92 mb/d. This forecast assumes output of 1.95 mb/d in 4Q19.
Mexico’s oil supply growth forecast for 2020 is to decline by a further 0.12 mb/d to average 1.80 mb/d.
OECD Europe OECD Europe’s oil supply in August fell by 0.22 mb/d m-o-m to average 3.47mb/d, lower by 0.25 mb/d y-o-y. The decline was due to lower m-o-m oil output in Norway (-0.06 mb/d), the UK (-0.15 mb/d) and Denmark (-0.01 mb/d) while production in other OECD Europe was stagnant at 0.73 mb/d.
For 2019, OECD Europe’s oil supply is forecast to contract by 0.11 mb/d to average 3.73 mb/d, following growth of 0.01 mb/d in 2018. The projected increase of 0.04 mb/d for the UK is expected to be offset by production declines in other countries, particularly Norway. North Sea oil production is forecast to see a gradual ramp-up from 4Q19 onward, owing to the start-up of the giant Norwegian Johan Sverdrup field.
The outlook for 2020 calls for total growth of 0.17 mb/d y-o-y and average oil supply of 3.90 mb/d. While Norway’s output is forecast to grow by 0.22 mb/d, production in the UK and Denmark is projected to decline by 0.03 mb/d and 0.02 mb/d, respectively.
Graph 5 - 19: OECD Europe quarterly liquids supply
-237 -2
12
-164
-7-37
-105
-129
-214
-250
-200
-150
-100
-50
0
0
500
1,000
1,500
2,000
2,500
1Q 2Q 3Q 4Q
2019/18 (RHS) 2020/19 (RHS)2018 2019*2020*
Note: * 2019-2020 = Forecast.Source: OPEC Secretariat.
Y-o-y change (tb/d)Production (tb/d)
1,500
1,600
1,700
1,800
1,900
0200400600800
1,000
Aug
18
Sep
18
Oct
18
Nov
18
Dec
18
Jan
19Fe
b 19
Mar
19
Apr
19
May
19
Jun
19Ju
l 19
Aug
19
tb/dtb/d
CantarellKu-Maloob-ZaapAbkatún-Pol-ChucLitoral de TabascoOther regions'crudeTotal crude & condensate (RHS)
Sources: Pemex and OPEC Secretariat.
3.2
3.4
3.6
3.8
4.0
4.2
1Q 2Q 3Q 4Q
mb/d
2018 2019* 2020*Note: * 2019-2020 = Forecast.Source: OPEC Secretariat.

World Oil Supply
52 OPEC Monthly Oil Market Report – October 2019
Norway Norwegian liquids supply in August dropped by 67 tb/d to average 1.65 mb/d, mainly due to technical problems. This follows a recovery in production in July by 0.31 mb/d to average 1.71 mb/d. The August decline has led to a deeper annual contraction by 0.14 mb/d to average 1.71 mb/d for 2019. This forecast assumes that Norway’s oil supply will reach 1.87 mb/d in 4Q19 due to production start-up of the giant Johan Sverdrup oil field in 4Q19. Output in September is likely to decline by around 100 tb/d to average 1.55 mb/d.
Crude oil output in August declined slightly by 8 tb/d m-o-m to average 1.35 mb/d, lower by 152 tb/d y-o-y, while reported NGLs (including condensate) output fell by 59 tb/d to average 294 tb/d.
Graph 5 - 20: Norway monthly liquids output
Oil production in 2H19 is forecast to grow by 0.08 mb/d compared to 1H19. Aker BP’s Skogul field is ready to start up, while three Equinor fields are also scheduled for start-up before year’s end. Oil production from Trestakk in the Norwegian Sea, with recoverable resources estimated at 76 mb of oil, started on 16 July after completion of testing through five tied-back wells to the Åsgard FPSO. Peak production is forecast to be about 44 tb/d of oil, and the field is expected to produce for 12 years, according to Equinor. The Utgard field is possibly expected to start production in September and the giant Johan Sverdrup is expected in October or November.
For 2020, Norway's liquids supply forecast is to grow by 0.22 mb/d to average 1.93 mb/d. This is even lower than the level of average liquids output in 2017, despite the production ramp-up of Johan Sverdrup, which accounts for 50% of the new production. In addition, 20% of the new production will come from the ramp up of the Valhall and Oseberg projects and the start-up of Njord, Yme and Martin Linge. Maintenance is scheduled for 2Q20 and again for 4Q20.
Graph 5 - 21: Norway’s quarterly liquids supply
1.87
1.65
1.3
1.4
1.5
1.6
1.7
1.8
1.9
2.0
Aug
18
Sep
18
Oct
18
Nov
18
Dec
18
Jan
19
Feb
19
Mar
19
Apr
19
May
19
Jun
19
Jul 1
9
Aug
19
mb/d
Sources: Norwegian Petroleum DirectorateOPEC Secretariat.
-183
-222
-162
12
121 271
261
212
-300
-200
-100
0
100
200
300
1,5001,6001,7001,8001,9002,0002,1002,200
1Q 2Q 3Q 4Q
2019/18 (RHS) 2020/19 (RHS)2018 2019*2020*
Note: * 2019-2020 = Forecast.Source: OPEC Secretariat.
Y-o-y change (tb/d)Production (tb/d)
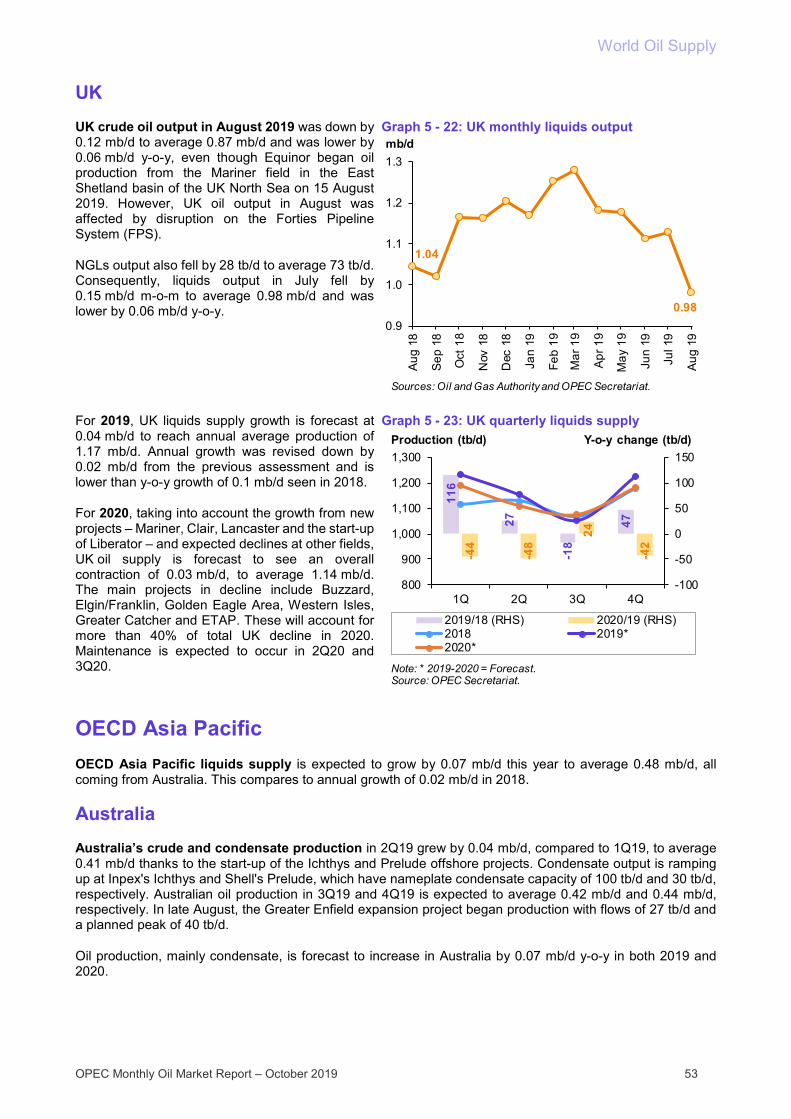
World Oil Supply
OPEC Monthly Oil Market Report – October 2019 53
UK UK crude oil output in August 2019 was down by 0.12 mb/d to average 0.87 mb/d and was lower by 0.06 mb/d y-o-y, even though Equinor began oil production from the Mariner field in the East Shetland basin of the UK North Sea on 15 August 2019. However, UK oil output in August was affected by disruption on the Forties Pipeline System (FPS).
NGLs output also fell by 28 tb/d to average 73 tb/d. Consequently, liquids output in July fell by 0.15 mb/d m-o-m to average 0.98 mb/d and was lower by 0.06 mb/d y-o-y.
Graph 5 - 22: UK monthly liquids output
For 2019, UK liquids supply growth is forecast at 0.04 mb/d to reach annual average production of 1.17 mb/d. Annual growth was revised down by 0.02 mb/d from the previous assessment and is lower than y-o-y growth of 0.1 mb/d seen in 2018.
For 2020, taking into account the growth from new projects – Mariner, Clair, Lancaster and the start-up of Liberator – and expected declines at other fields, UK oil supply is forecast to see an overall contraction of 0.03 mb/d, to average 1.14 mb/d. The main projects in decline include Buzzard, Elgin/Franklin, Golden Eagle Area, Western Isles, Greater Catcher and ETAP. These will account for more than 40% of total UK decline in 2020. Maintenance is expected to occur in 2Q20 and 3Q20.
Graph 5 - 23: UK quarterly liquids supply
OECD Asia Pacific OECD Asia Pacific liquids supply is expected to grow by 0.07 mb/d this year to average 0.48 mb/d, all coming from Australia. This compares to annual growth of 0.02 mb/d in 2018.
Australia Australia’s crude and condensate production in 2Q19 grew by 0.04 mb/d, compared to 1Q19, to average 0.41 mb/d thanks to the start-up of the Ichthys and Prelude offshore projects. Condensate output is ramping up at Inpex's Ichthys and Shell's Prelude, which have nameplate condensate capacity of 100 tb/d and 30 tb/d, respectively. Australian oil production in 3Q19 and 4Q19 is expected to average 0.42 mb/d and 0.44 mb/d, respectively. In late August, the Greater Enfield expansion project began production with flows of 27 tb/d and a planned peak of 40 tb/d.
Oil production, mainly condensate, is forecast to increase in Australia by 0.07 mb/d y-o-y in both 2019 and 2020.
1.04
0.980.9
1.0
1.1
1.2
1.3
Aug
18
Sep
18
Oct
18
Nov
18
Dec
18
Jan
19
Feb
19
Mar
19
Apr
19
May
19
Jun
19
Jul 1
9
Aug
19
mb/d
Sources: Oil and Gas Authority and OPEC Secretariat.
116
27
-18
47
-44
-48
24
-42
-100
-50
0
50
100
150
800
900
1,000
1,100
1,200
1,300
1Q 2Q 3Q 4Q
2019/18 (RHS) 2020/19 (RHS)2018 2019*2020*
Note: * 2019-2020 = Forecast.Source: OPEC Secretariat.
Y-o-y change (tb/d)Production (tb/d)
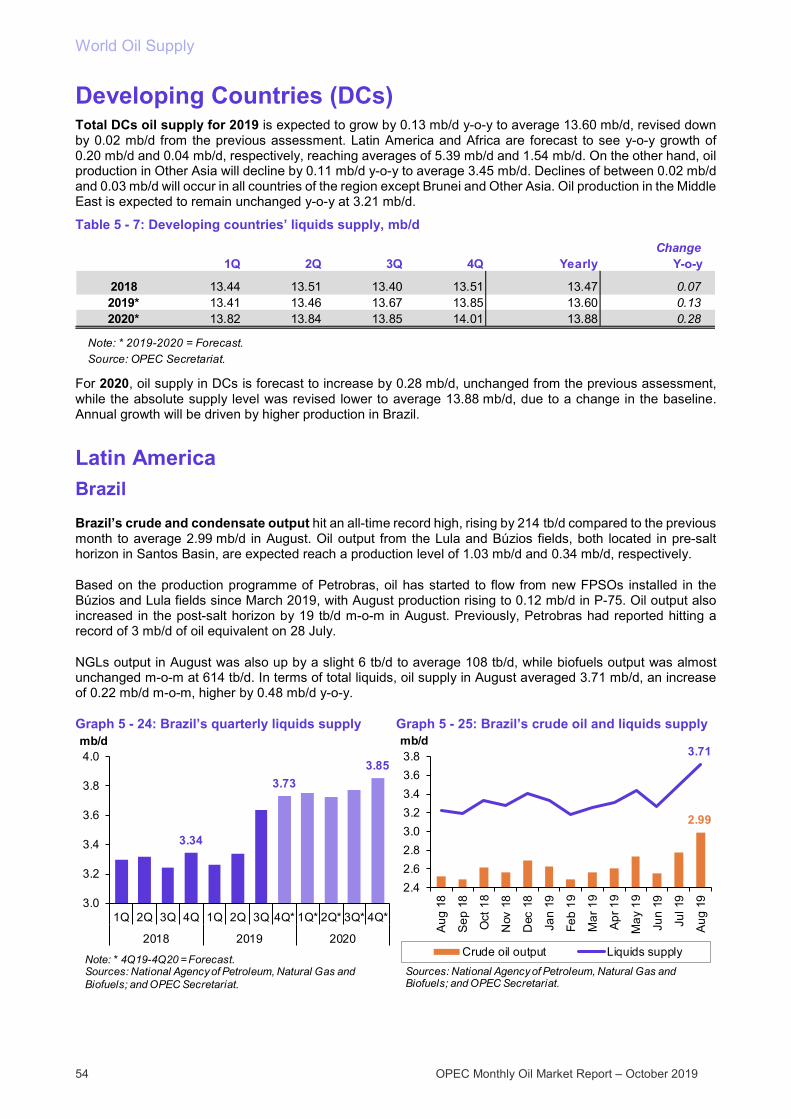
World Oil Supply
54 OPEC Monthly Oil Market Report – October 2019
Developing Countries (DCs) Total DCs oil supply for 2019 is expected to grow by 0.13 mb/d y-o-y to average 13.60 mb/d, revised down by 0.02 mb/d from the previous assessment. Latin America and Africa are forecast to see y-o-y growth of 0.20 mb/d and 0.04 mb/d, respectively, reaching averages of 5.39 mb/d and 1.54 mb/d. On the other hand, oil production in Other Asia will decline by 0.11 mb/d y-o-y to average 3.45 mb/d. Declines of between 0.02 mb/d and 0.03 mb/d will occur in all countries of the region except Brunei and Other Asia. Oil production in the Middle East is expected to remain unchanged y-o-y at 3.21 mb/d.
Table 5 - 7: Developing countries’ liquids supply, mb/d
For 2020, oil supply in DCs is forecast to increase by 0.28 mb/d, unchanged from the previous assessment, while the absolute supply level was revised lower to average 13.88 mb/d, due to a change in the baseline. Annual growth will be driven by higher production in Brazil.
Latin America Brazil Brazil’s crude and condensate output hit an all-time record high, rising by 214 tb/d compared to the previous month to average 2.99 mb/d in August. Oil output from the Lula and Búzios fields, both located in pre-salt horizon in Santos Basin, are expected reach a production level of 1.03 mb/d and 0.34 mb/d, respectively.
Based on the production programme of Petrobras, oil has started to flow from new FPSOs installed in the Búzios and Lula fields since March 2019, with August production rising to 0.12 mb/d in P-75. Oil output also increased in the post-salt horizon by 19 tb/d m-o-m in August. Previously, Petrobras had reported hitting a record of 3 mb/d of oil equivalent on 28 July.
NGLs output in August was also up by a slight 6 tb/d to average 108 tb/d, while biofuels output was almost unchanged m-o-m at 614 tb/d. In terms of total liquids, oil supply in August averaged 3.71 mb/d, an increase of 0.22 mb/d m-o-m, higher by 0.48 mb/d y-o-y.
Graph 5 - 24: Brazil’s quarterly liquids supply Graph 5 - 25: Brazil’s crude oil and liquids supply
Change1Q 2Q 3Q 4Q Yearly Y-o-y
2018 13.44 13.51 13.40 13.51 13.47 0.072019* 13.41 13.46 13.67 13.85 13.60 0.132020* 13.82 13.84 13.85 14.01 13.88 0.28
Note: * 2019-2020 = Forecast.Source: OPEC Secretariat.
3.34
3.733.85
3.0
3.2
3.4
3.6
3.8
4.0
1Q 2Q 3Q 4Q 1Q 2Q 3Q 4Q* 1Q* 2Q* 3Q* 4Q*
2018 2019 2020
mb/d
Note: * 4Q19-4Q20 = Forecast.Sources: National Agency of Petroleum, Natural Gas and Biofuels; and OPEC Secretariat.
2.99
3.71
2.42.62.83.03.23.43.63.8
Aug
18
Sep
18
Oct
18
Nov
18
Dec
18
Jan
19
Feb
19
Mar
19
Apr
19
May
19
Jun
19
Jul 1
9
Aug
19
mb/d
Crude oil output Liquids supplySources: National Agency of Petroleum, Natural Gas and Biofuels; and OPEC Secretariat.

World Oil Supply
OPEC Monthly Oil Market Report – October 2019 55
Brazil’s liquids supply in 2019 is forecast to grow by 0.19 mb/d y-o-y to average 3.49 mb/d, revised up by 12 tb/d from the previous month’s assessment. For 2020, y-o-y growth of 0.28 mb/d is forecast, for an average of 3.78 mb/d.
FSU FSU oil supply in 2019 was revised up by 40 tb/d due to the upward revisions for Kazakhstan and Russia, with growth projected at 0.01 mb/d y-o-y to average 14.30 mb/d. Russia’s oil supply is expected to increase by 0.07 mb/d y-o-y to average 11.41 mb/d, while oil output is likely to decline in Kazakhstan, Azerbaijan and FSU others by 0.03 mb/d, 0.02 mb/d and 0.01 mb/d, respectively.
For 2020, FSU oil supply is forecast to grow by 0.10 mb/d y-o-y and average 14.41 mb/d. Oil production in Russia is expected to rise by 0.09 mb/d to average 11.50 mb/d, assuming that production remains adjusted to 11.34 mb/d in 1Q20. Oil supply in Kazakhstan and Azerbaijan is likely to grow by 0.03 mb/d and 0.01 mb/d, respectively, while falling by 0.02 mb/d in FSU others.
Russia Russian liquids supply in September 2019 fell by 0.04 mb/d m-o-m to average 11.44 mb/d, down by 0.11 mb/d y-o-y.
A month earlier, following the debottlenecking of production restrictions due to a contamination in the Druzhba pipeline, Russia’s oil supply grew by 0.14 mb/d to average 11.48 mb/d. Consequently, average oil supply in 3Q19 was pegged at 11.42 mb/d.
Graph 5 - 26: Russia's quarterly supply forecast Graph 5 - 27: Russia’s monthly liquids supply
Russia’s oil supply in 2019 is forecast to grow by 0.07 mb/d to average 11.41 mb/d, representing an upward revision of 0.01 mb/d.
For 2020, growth of 0.09 mb/d is anticipated to average 11.50 mb/d.
Caspian
Kazakhstan
Kazakhstan’s liquids output in August was down by 0.11 mb/d m-o-m to average 1.78 mb/d, mainly due to outages during maintenance in parts of the Tengiz field from 1 August to 12 September. Crude oil output fell by 112 tb/d to average 1.51 mb/d in August, according to Nefte Compass. The ongoing maintenance in Tengiz and beginning maintenance in the Karachaganak field from 15 September to 13 October, has caused a reduction in oil output not only for September but also in October. However, the outages during the
11.4
2
11.3
4
11.3
4
10.810.911.011.111.211.311.411.511.611.7
1Q18
2Q18
3Q18
4Q18
1Q19
2Q19
3Q19
4Q19
*
1Q20
*
2Q20
*
3Q20
*
4Q20
*
mb/d
Note: * 4Q19-4Q20 = Forecast.Sources: Nefte Compass and OPEC Secretariat.
11.44
11.17
11.35
11.44
10.8
11.0
11.2
11.4
11.6
11.8
Sep
17
Nov
17
Jan
18
Mar
18
May
18
Jul 1
8
Sep
18
Nov
18
Jan
19
Mar
19
May
19
Jul 1
9
Sep
19
mb/d
Sources: Nefte Compass and OPEC Secretariat.
Avg. 17
Avg. 18
Avg. Jan-Sep 19
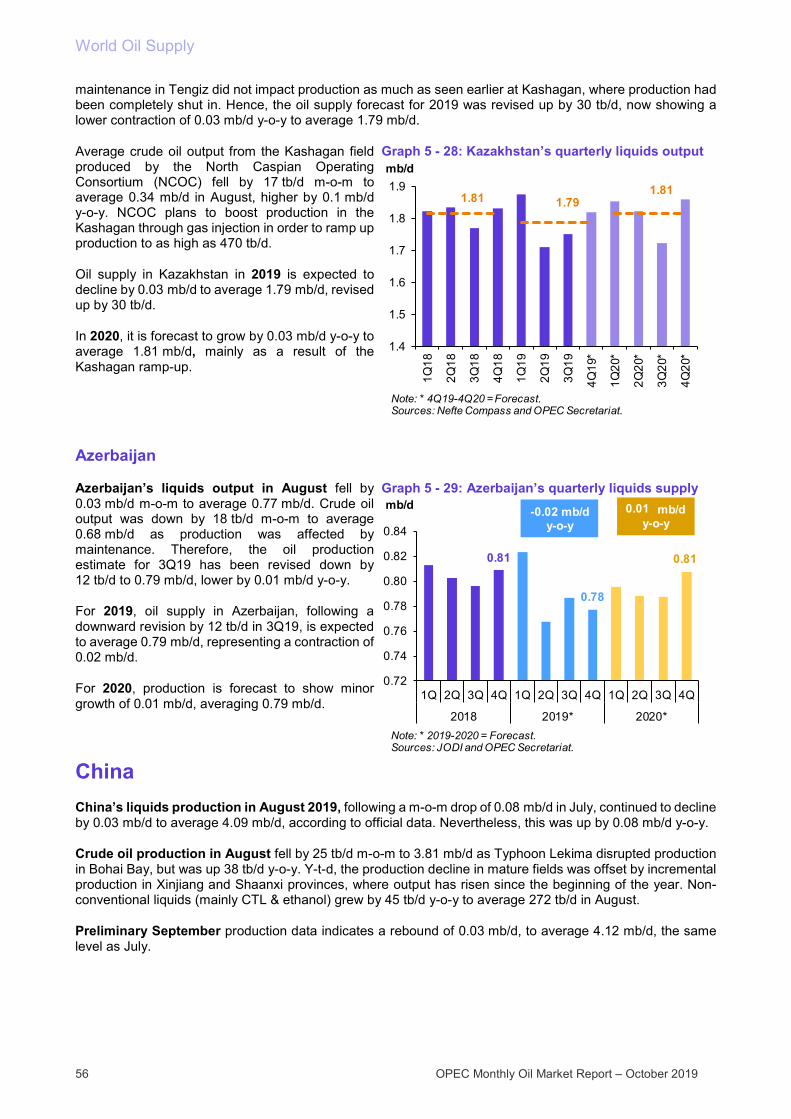
World Oil Supply
56 OPEC Monthly Oil Market Report – October 2019
maintenance in Tengiz did not impact production as much as seen earlier at Kashagan, where production had been completely shut in. Hence, the oil supply forecast for 2019 was revised up by 30 tb/d, now showing a lower contraction of 0.03 mb/d y-o-y to average 1.79 mb/d.
Average crude oil output from the Kashagan field produced by the North Caspian Operating Consortium (NCOC) fell by 17 tb/d m-o-m to average 0.34 mb/d in August, higher by 0.1 mb/d y-o-y. NCOC plans to boost production in the Kashagan through gas injection in order to ramp up production to as high as 470 tb/d.
Oil supply in Kazakhstan in 2019 is expected to decline by 0.03 mb/d to average 1.79 mb/d, revised up by 30 tb/d.
In 2020, it is forecast to grow by 0.03 mb/d y-o-y to average 1.81 mb/d, mainly as a result of the Kashagan ramp-up.
Graph 5 - 28: Kazakhstan’s quarterly liquids output
Azerbaijan
Azerbaijan’s liquids output in August fell by 0.03 mb/d m-o-m to average 0.77 mb/d. Crude oil output was down by 18 tb/d m-o-m to average 0.68 mb/d as production was affected by maintenance. Therefore, the oil production estimate for 3Q19 has been revised down by 12 tb/d to 0.79 mb/d, lower by 0.01 mb/d y-o-y.
For 2019, oil supply in Azerbaijan, following a downward revision by 12 tb/d in 3Q19, is expected to average 0.79 mb/d, representing a contraction of 0.02 mb/d.
For 2020, production is forecast to show minor growth of 0.01 mb/d, averaging 0.79 mb/d.
Graph 5 - 29: Azerbaijan’s quarterly liquids supply
China China’s liquids production in August 2019, following a m-o-m drop of 0.08 mb/d in July, continued to decline by 0.03 mb/d to average 4.09 mb/d, according to official data. Nevertheless, this was up by 0.08 mb/d y-o-y.
Crude oil production in August fell by 25 tb/d m-o-m to 3.81 mb/d as Typhoon Lekima disrupted production in Bohai Bay, but was up 38 tb/d y-o-y. Y-t-d, the production decline in mature fields was offset by incremental production in Xinjiang and Shaanxi provinces, where output has risen since the beginning of the year. Non-conventional liquids (mainly CTL & ethanol) grew by 45 tb/d y-o-y to average 272 tb/d in August.
Preliminary September production data indicates a rebound of 0.03 mb/d, to average 4.12 mb/d, the same level as July.
1.81 1.791.81
1.4
1.5
1.6
1.7
1.8
1.9
1Q18
2Q18
3Q18
4Q18
1Q19
2Q19
3Q19
4Q19
*
1Q20
*
2Q20
*
3Q20
*
4Q20
*
mb/d
Note: * 4Q19-4Q20 = Forecast.Sources: Nefte Compass and OPEC Secretariat.
0.81
0.78
0.81
0.72
0.74
0.76
0.78
0.80
0.82
0.84
1Q 2Q 3Q 4Q 1Q 2Q 3Q 4Q 1Q 2Q 3Q 4Q
2018 2019* 2020*
mb/d
Note: * 2019-2020 = Forecast.Sources: JODI and OPEC Secretariat.
mb/dy-o-y
0.01mb/dy-o-y
-0.02
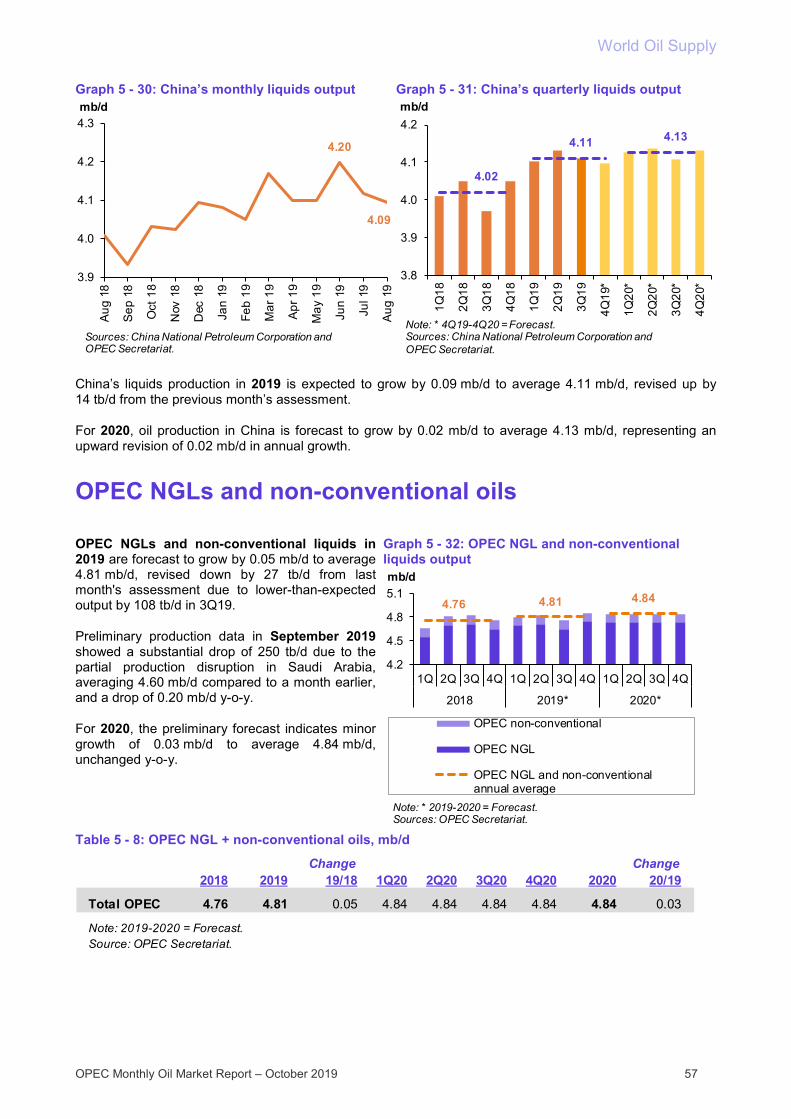
World Oil Supply
OPEC Monthly Oil Market Report – October 2019 57
Graph 5 - 30: China’s monthly liquids output Graph 5 - 31: China’s quarterly liquids output
China’s liquids production in 2019 is expected to grow by 0.09 mb/d to average 4.11 mb/d, revised up by 14 tb/d from the previous month’s assessment.
For 2020, oil production in China is forecast to grow by 0.02 mb/d to average 4.13 mb/d, representing an upward revision of 0.02 mb/d in annual growth.
OPEC NGLs and non-conventional oils OPEC NGLs and non-conventional liquids in 2019 are forecast to grow by 0.05 mb/d to average 4.81 mb/d, revised down by 27 tb/d from last month's assessment due to lower-than-expected output by 108 tb/d in 3Q19.
Preliminary production data in September 2019 showed a substantial drop of 250 tb/d due to the partial production disruption in Saudi Arabia, averaging 4.60 mb/d compared to a month earlier, and a drop of 0.20 mb/d y-o-y.
For 2020, the preliminary forecast indicates minor growth of 0.03 mb/d to average 4.84 mb/d, unchanged y-o-y.
Graph 5 - 32: OPEC NGL and non-conventional liquids output
Table 5 - 8: OPEC NGL + non-conventional oils, mb/d
4.20
4.09
3.9
4.0
4.1
4.2
4.3
Aug
18
Sep
18
Oct
18
Nov
18
Dec
18
Jan
19
Feb
19
Mar
19
Apr
19
May
19
Jun
19
Jul 1
9
Aug
19
mb/d
Sources: China National Petroleum Corporation and OPEC Secretariat.
4.02
4.11 4.13
3.8
3.9
4.0
4.1
4.2
1Q18
2Q18
3Q18
4Q18
1Q19
2Q19
3Q19
4Q19
*
1Q20
*
2Q20
*
3Q20
*
4Q20
*
mb/d
Note: * 4Q19-4Q20 = Forecast.Sources: China National Petroleum Corporation and OPEC Secretariat.
4.76 4.81 4.84
4.2
4.5
4.8
5.1
1Q 2Q 3Q 4Q 1Q 2Q 3Q 4Q 1Q 2Q 3Q 4Q
2018 2019* 2020*
mb/d
OPEC non-conventional
OPEC NGL
OPEC NGL and non-conventionalannual average
Note: * 2019-2020 = Forecast.Sources: OPEC Secretariat.
Change Change2018 2019 19/18 1Q20 2Q20 3Q20 4Q20 2020 20/19
Total OPEC 4.76 4.81 0.05 4.84 4.84 4.84 4.84 4.84 0.03
Note: 2019-2020 = Forecast.Source: OPEC Secretariat.
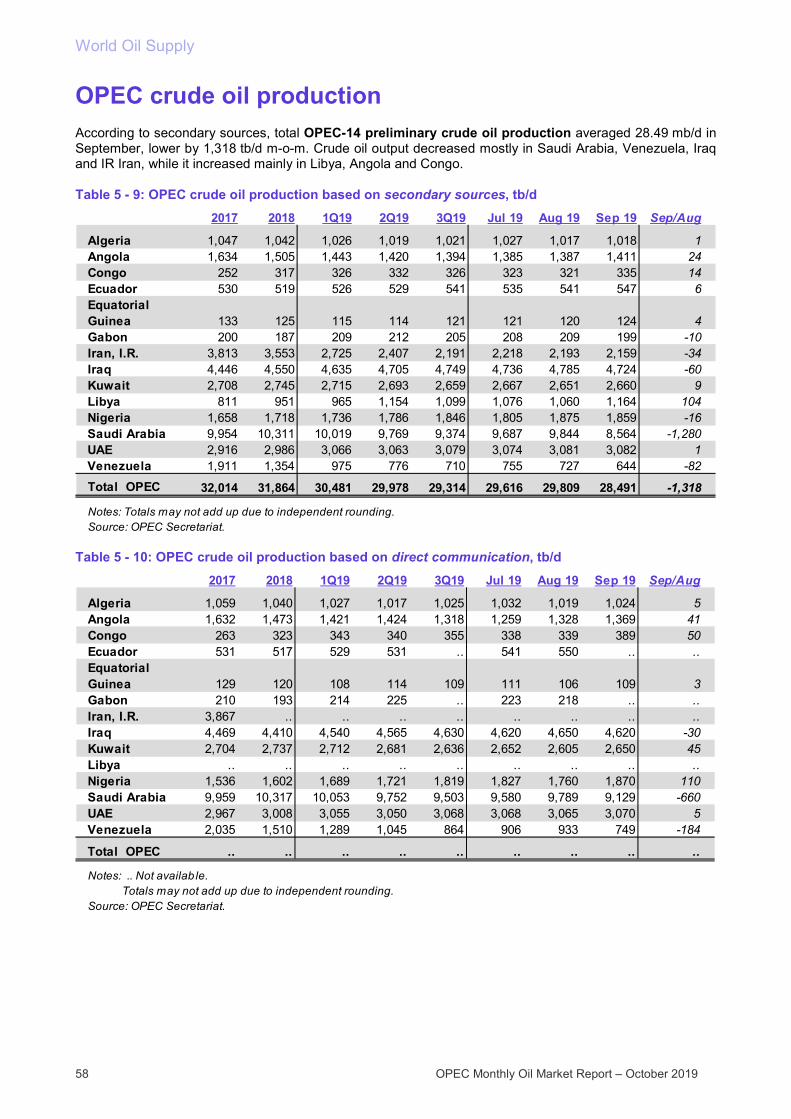
World Oil Supply
58 OPEC Monthly Oil Market Report – October 2019
OPEC crude oil production According to secondary sources, total OPEC-14 preliminary crude oil production averaged 28.49 mb/d in September, lower by 1,318 tb/d m-o-m. Crude oil output decreased mostly in Saudi Arabia, Venezuela, Iraq and IR Iran, while it increased mainly in Libya, Angola and Congo.
Table 5 - 9: OPEC crude oil production based on secondary sources, tb/d
Table 5 - 10: OPEC crude oil production based on direct communication, tb/d
2017 2018 1Q19 2Q19 3Q19 Jul 19 Aug 19 Sep 19 Sep/Aug
Algeria 1,047 1,042 1,026 1,019 1,021 1,027 1,017 1,018 1Angola 1,634 1,505 1,443 1,420 1,394 1,385 1,387 1,411 24Congo 252 317 326 332 326 323 321 335 14Ecuador 530 519 526 529 541 535 541 547 6Equatorial Guinea 133 125 115 114 121 121 120 124 4Gabon 200 187 209 212 205 208 209 199 -10Iran, I.R. 3,813 3,553 2,725 2,407 2,191 2,218 2,193 2,159 -34Iraq 4,446 4,550 4,635 4,705 4,749 4,736 4,785 4,724 -60Kuwait 2,708 2,745 2,715 2,693 2,659 2,667 2,651 2,660 9Libya 811 951 965 1,154 1,099 1,076 1,060 1,164 104Nigeria 1,658 1,718 1,736 1,786 1,846 1,805 1,875 1,859 -16Saudi Arabia 9,954 10,311 10,019 9,769 9,374 9,687 9,844 8,564 -1,280UAE 2,916 2,986 3,066 3,063 3,079 3,074 3,081 3,082 1Venezuela 1,911 1,354 975 776 710 755 727 644 -82
Total OPEC 32,014 31,864 30,481 29,978 29,314 29,616 29,809 28,491 -1,318
Notes: Totals may not add up due to independent rounding.Source: OPEC Secretariat.
2017 2018 1Q19 2Q19 3Q19 Jul 19 Aug 19 Sep 19 Sep/Aug
Algeria 1,059 1,040 1,027 1,017 1,025 1,032 1,019 1,024 5Angola 1,632 1,473 1,421 1,424 1,318 1,259 1,328 1,369 41Congo 263 323 343 340 355 338 339 389 50Ecuador 531 517 529 531 .. 541 550 .. ..Equatorial Guinea 129 120 108 114 109 111 106 109 3Gabon 210 193 214 225 .. 223 218 .. ..Iran, I.R. 3,867 .. .. .. .. .. .. .. ..Iraq 4,469 4,410 4,540 4,565 4,630 4,620 4,650 4,620 -30Kuwait 2,704 2,737 2,712 2,681 2,636 2,652 2,605 2,650 45Libya .. .. .. .. .. .. .. .. ..Nigeria 1,536 1,602 1,689 1,721 1,819 1,827 1,760 1,870 110Saudi Arabia 9,959 10,317 10,053 9,752 9,503 9,580 9,789 9,129 -660UAE 2,967 3,008 3,055 3,050 3,068 3,068 3,065 3,070 5Venezuela 2,035 1,510 1,289 1,045 864 906 933 749 -184
Total OPEC .. .. .. .. .. .. .. .. ..
Notes: .. Not availab le. Totals may not add up due to independent rounding.Source: OPEC Secretariat.
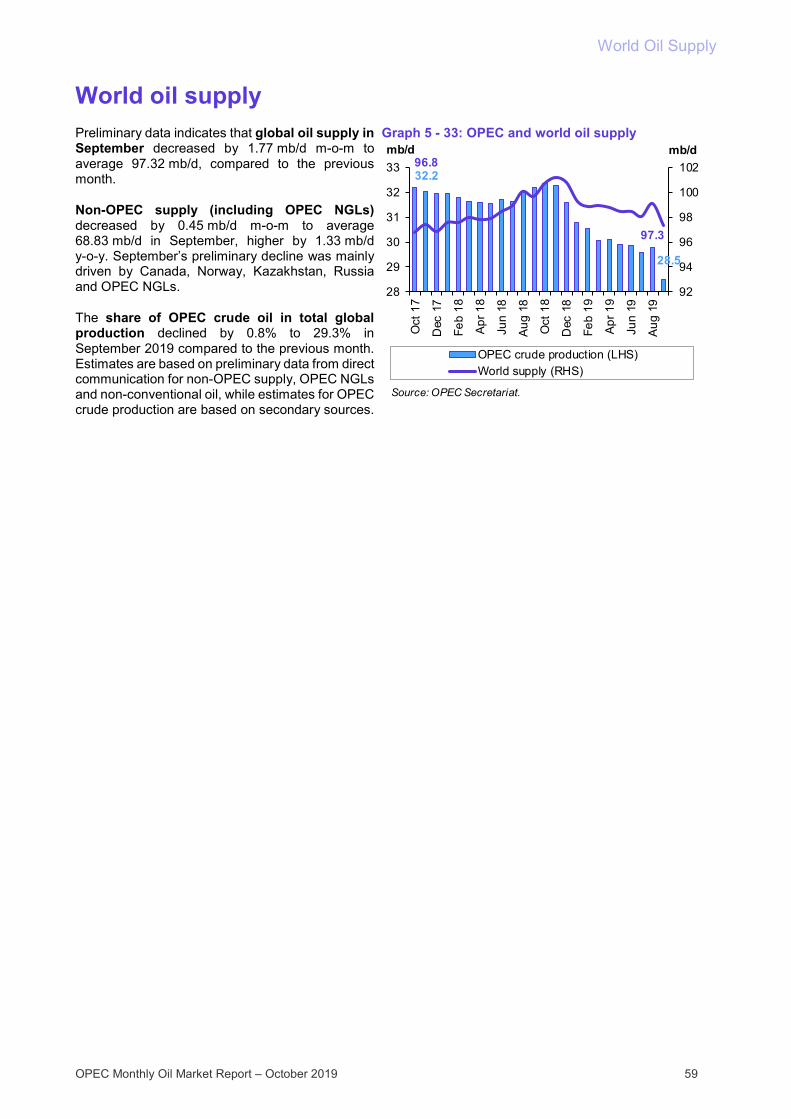
World Oil Supply
OPEC Monthly Oil Market Report – October 2019 59
World oil supply
Preliminary data indicates that global oil supply in September decreased by 1.77 mb/d m-o-m to average 97.32 mb/d, compared to the previous month.
Non-OPEC supply (including OPEC NGLs) decreased by 0.45 mb/d m-o-m to average 68.83 mb/d in September, higher by 1.33 mb/d y-o-y. September’s preliminary decline was mainly driven by Canada, Norway, Kazakhstan, Russia and OPEC NGLs.
The share of OPEC crude oil in total global production declined by 0.8% to 29.3% in September 2019 compared to the previous month. Estimates are based on preliminary data from direct communication for non-OPEC supply, OPEC NGLs and non-conventional oil, while estimates for OPEC crude production are based on secondary sources.
Graph 5 - 33: OPEC and world oil supply
32.2
28.5
96.8
97.3
92
94
96
98
100
102
28
29
30
31
32
33
Oct
17
Dec
17
Feb
18
Apr
18
Jun
18
Aug
18
Oct
18
Dec
18
Feb
19
Apr
19
Jun
19
Aug
19
mb/dmb/d
OPEC crude production (LHS)World supply (RHS)
Source: OPEC Secretariat.
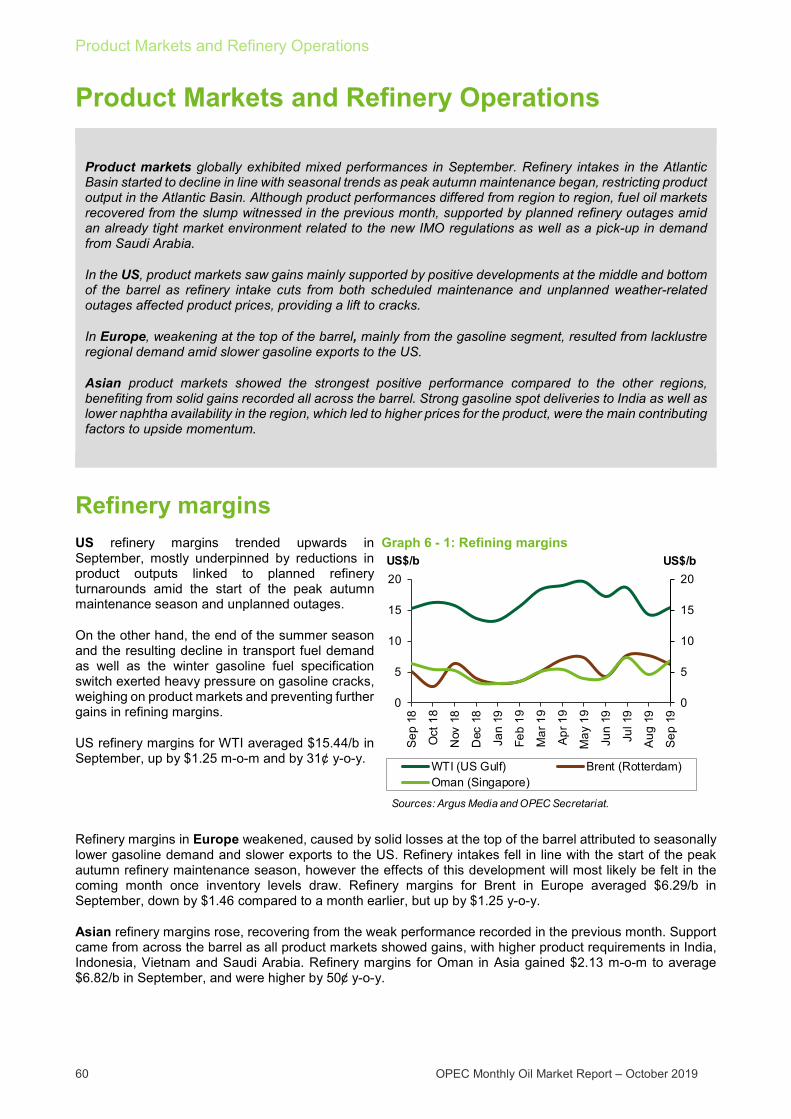
Product Markets and Refinery Operations
60 OPEC Monthly Oil Market Report – October 2019
Product Markets and Refinery Operations
Product markets globally exhibited mixed performances in September. Refinery intakes in the Atlantic Basin started to decline in line with seasonal trends as peak autumn maintenance began, restricting product output in the Atlantic Basin. Although product performances differed from region to region, fuel oil markets recovered from the slump witnessed in the previous month, supported by planned refinery outages amid an already tight market environment related to the new IMO regulations as well as a pick-up in demand from Saudi Arabia.
In the US, product markets saw gains mainly supported by positive developments at the middle and bottom of the barrel as refinery intake cuts from both scheduled maintenance and unplanned weather-related outages affected product prices, providing a lift to cracks.
In Europe, weakening at the top of the barrel, mainly from the gasoline segment, resulted from lacklustre regional demand amid slower gasoline exports to the US.
Asian product markets showed the strongest positive performance compared to the other regions, benefiting from solid gains recorded all across the barrel. Strong gasoline spot deliveries to India as well as lower naphtha availability in the region, which led to higher prices for the product, were the main contributing factors to upside momentum.
Refinery margins US refinery margins trended upwards in September, mostly underpinned by reductions in product outputs linked to planned refinery turnarounds amid the start of the peak autumn maintenance season and unplanned outages.
On the other hand, the end of the summer season and the resulting decline in transport fuel demand as well as the winter gasoline fuel specification switch exerted heavy pressure on gasoline cracks, weighing on product markets and preventing further gains in refining margins.
US refinery margins for WTI averaged $15.44/b in September, up by $1.25 m-o-m and by 31¢ y-o-y.
Graph 6 - 1: Refining margins
Refinery margins in Europe weakened, caused by solid losses at the top of the barrel attributed to seasonally lower gasoline demand and slower exports to the US. Refinery intakes fell in line with the start of the peak autumn refinery maintenance season, however the effects of this development will most likely be felt in the coming month once inventory levels draw. Refinery margins for Brent in Europe averaged $6.29/b in September, down by $1.46 compared to a month earlier, but up by $1.25 y-o-y.
Asian refinery margins rose, recovering from the weak performance recorded in the previous month. Support came from across the barrel as all product markets showed gains, with higher product requirements in India, Indonesia, Vietnam and Saudi Arabia. Refinery margins for Oman in Asia gained $2.13 m-o-m to average $6.82/b in September, and were higher by 50ȼ y-o-y.
0
5
10
15
20
0
5
10
15
20
Sep
18
Oct
18
Nov
18
Dec
18
Jan
19
Feb
19
Mar
19
Apr
19
May
19
Jun
19
Jul 1
9
Aug
19
Sep
19
US$/bUS$/b
WTI (US Gulf) Brent (Rotterdam)Oman (Singapore)
Sources: Argus Media and OPEC Secretariat.

Product Markets and Refinery Operations
OPEC Monthly Oil Market Report – October 2019 61
Refinery operations In the US, refinery utilization rates decreased in September to average 89.92%, which corresponds to a throughput of 16.91 mb/d. This represents a drop of 5.3 pp and 1.0 mb/d compared to the previous month. Y-o-y, the September refinery utilization rate was down by 3.22 pp, with throughputs down by 474 tb/d.
European refinery utilization averaged 79.58% in September, corresponding to a throughput of 9.86 mb/d. This constitutes a m-o-m drop of 4.4 pp or 550 tb/d. Y-o-y, utilization rates decreased by 4.94 pp and throughputs were down by 612 tb/d.
In selected Asia — comprising Japan, China, India and Singapore — refinery utilization rates rose, averaging 91.83% in September, corresponding to a throughput of 25.64 mb/d. Compared to the previous month, throughputs were up by 1.6 pp and 450 tb/d. Meanwhile, y-o-y, they were up by 2.4 pp and 1.12 mb/d.
Graph 6 - 2: Refinery utilization rates
Product markets
US market US gasoline cracks saw considerable losses in September as pressure from declining prices weighed on gasoline markets. The end of the driving season leading up to the switch to winter grade gasoline amid bearish market sentiment caused the drop in prices. This poor performance came despite a slight downward movement in US gasoline inventory levels during the month.
The increasingly lacklustre domestic consumption, typical for this time of year, would require a proportional lift in exports to keep inventory levels sustained and the market balanced.
In September, the gasoline crack spread lost $3.26 m-o-m to average $21.23/b, but was up slightly by 15ȼ y-o-y.
Graph 6 - 3: US Gulf crack spread vs. WTI
The USGC jet/kerosene crack spread gained some ground supported by maintenance-related reductions in refinery output amid an already tight market. Despite the end of the summer peak air travel season, lower jet fuel availability due to refinery turnarounds should keep jet fuel prices and cracks well sustained in the near term. Additional support could also be expected during the upcoming Thanksgiving and Christmas holiday seasons as air travel activities tend to pick up. The US jet/kerosene crack spread against WTI averaged $22.34/b, up by $1.09 m-o-m and by 16ȼ y-o-y.
US gasoil crack spreads performed positively, showing solid gains underpinned by bullish sentiment linked to declines in inventory levels recorded in the month and concerns over a tightening market in response to refinery intake cuts in the US.
70
80
90
100
70
80
90
100
Sep
18
Oct
18
Nov
18
Dec
18
Jan
19
Feb
19
Mar
19
Apr
19
May
19
Jun
19
Jul 1
9
Aug
19
Sep
19
%%
US EU-16 Selected Asia*
Note: * Includes Japan, China, India and SingaporeSources: EIA, Euroilstock, PAJ and Argus Media.
-20
-10
0
10
20
30
40
-20
-10
0
10
20
30
40
Sep
18
Oct
18
Nov
18
Dec
18
Jan
19
Feb
19M
ar 1
9
Apr
19
May
19
Jun
19
Jul 1
9
Aug
19
Sep
19
US$/bUS$/b
Premium gasoline Jet/KeroseneDiesel Fuel oil
Sources: Argus Media and OPEC Secretariat.

Product Markets and Refinery Operations
62 OPEC Monthly Oil Market Report – October 2019
Despite growing interest in production and inventory builds of VLSFO as the IMO 2020 implementation date approaches and demand for compliant marine fuels rises, diesel markets in the US could provide some upside in the coming months. However, this positive effect is expected to be more pronounced once the VLSFO stocks are depleted well beyond 1 January 2020. The US gasoil crack spread averaged $18.87/b, up by $3.03 m-o-m but down by 56ȼ y-o-y.
US fuel oil crack spreads reversed the declining trend to surge on the back of declining inventory levels over the month caused by a 410 tb/d stock draw in mid-September. In September, the US fuel oil crack spread averaged $7.59/b, up by $14.41 m-o-m and higher by $11.38 y-o-y.
European market The gasoline crack spread saw a negative performance in September, pressured by lower gasoline demand as consumption from the transportation sector began to fade with the end of the summer season. In addition, slower import requirements from the US added to the supply glut in the region.
The start of the autumn refinery maintenance season in September and the potential subsequent declines in gasoline output will most likely lead to declines in inventory levels and provide some support to European gasoline cracks in the near term. Furthermore, the rise in offline refining capacities globally could unlock additional export opportunities, supporting gasoline markets in the near term.
Graph 6 - 4: Rotterdam crack spreads vs. Brent
The gasoline crack spread averaged $14.64/b in September, down by $4.17 m-o-m and by $1.59 y-o-y.
The jet/kerosene crack spread also performed positively, edging up slightly higher compared to the previous month despite the onset of the seasonal low-demand period typically registered this time of year. The declines in jet/kerosene production recorded during the month as refineries undergo turnarounds will most likely offer some short term support. The Rotterdam jet/kerosene crack spread averaged $18.85/b, up by 62 ȼ m-o-m and higher by $5.14 y-o-y.
European gasoil crack spreads also strengthened slightly in September, supported by gasoil production cuts amid healthy, but relatively slower, regional demand. In addition, lower supplies from Russia out of Primorsk and Tuapse to Rotterdam contributed to a tighter gasoil balance, which helped sustain gasoil prices over the month and consequently provided some backing to gasoil cracks in Europe. The gasoil crack spread averaged $17.14/b, which was higher by 53ȼ m-o-m and by $3.08 y-o-y.
At the bottom of the barrel, fuel oil 3.5% crack spreads in Rotterdam showed solid gains supported by supply shortages that led to lower high sulphur fuel oil (HSFO) availability. A pick-up in trade flows due to reduced refined product outputs linked to autumn peak refinery maintenance season as product markets seek to rebalance regionally could likely support fuel consumption for the bunker sector. This, along with ongoing preparations as the implementation date for IMO 2020 regulations draws closer, amid government incentives for higher conversion capacity, could keep HSFO well sustained in the near term. In Europe, fuel oil cracks averaged minus $13.76/b in September, gaining $1.65 m-o-m and 32ȼ y-o-y.
-15
0
15
30
-15
0
15
30
Sep
18
Oct
18
Nov
18
Dec
18
Jan
19
Feb
19M
ar 1
9
Apr
19
May
19
Jun
19
Jul 1
9
Aug
19
Sep
19
US$/bUS$/b
Premium gasoline Jet/KeroseneGasoil Fuel oil
Sources: Argus Media and OPEC Secretariat.
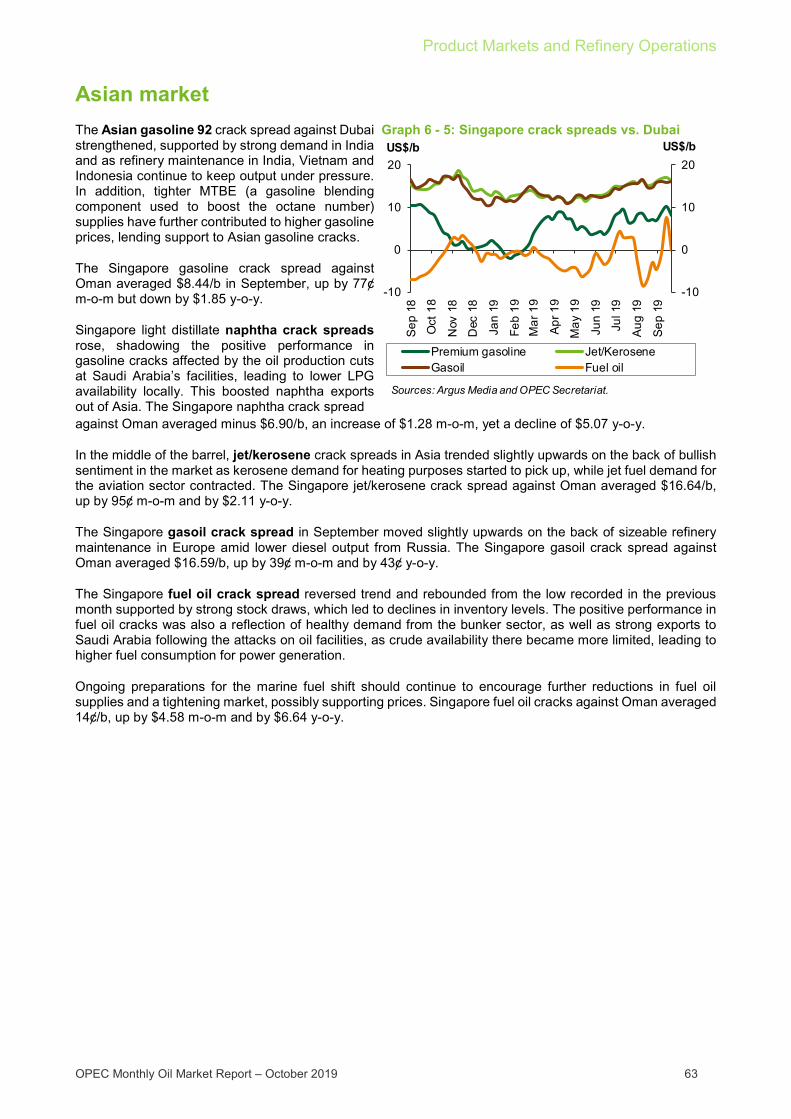
Product Markets and Refinery Operations
OPEC Monthly Oil Market Report – October 2019 63
Asian market The Asian gasoline 92 crack spread against Dubai strengthened, supported by strong demand in India and as refinery maintenance in India, Vietnam and Indonesia continue to keep output under pressure. In addition, tighter MTBE (a gasoline blending component used to boost the octane number) supplies have further contributed to higher gasoline prices, lending support to Asian gasoline cracks.
The Singapore gasoline crack spread against Oman averaged $8.44/b in September, up by 77ȼ m-o-m but down by $1.85 y-o-y.
Singapore light distillate naphtha crack spreads rose, shadowing the positive performance in gasoline cracks affected by the oil production cuts at Saudi Arabia’s facilities, leading to lower LPG availability locally. This boosted naphtha exports out of Asia. The Singapore naphtha crack spread
Graph 6 - 5: Singapore crack spreads vs. Dubai
against Oman averaged minus $6.90/b, an increase of $1.28 m-o-m, yet a decline of $5.07 y-o-y.
In the middle of the barrel, jet/kerosene crack spreads in Asia trended slightly upwards on the back of bullish sentiment in the market as kerosene demand for heating purposes started to pick up, while jet fuel demand for the aviation sector contracted. The Singapore jet/kerosene crack spread against Oman averaged $16.64/b, up by 95ȼ m-o-m and by $2.11 y-o-y.
The Singapore gasoil crack spread in September moved slightly upwards on the back of sizeable refinery maintenance in Europe amid lower diesel output from Russia. The Singapore gasoil crack spread against Oman averaged $16.59/b, up by 39ȼ m-o-m and by 43ȼ y-o-y.
The Singapore fuel oil crack spread reversed trend and rebounded from the low recorded in the previous month supported by strong stock draws, which led to declines in inventory levels. The positive performance in fuel oil cracks was also a reflection of healthy demand from the bunker sector, as well as strong exports to Saudi Arabia following the attacks on oil facilities, as crude availability there became more limited, leading to higher fuel consumption for power generation.
Ongoing preparations for the marine fuel shift should continue to encourage further reductions in fuel oil supplies and a tightening market, possibly supporting prices. Singapore fuel oil cracks against Oman averaged 14ȼ/b, up by $4.58 m-o-m and by $6.64 y-o-y.
-10
0
10
20
-10
0
10
20
Sep
18
Oct
18
Nov
18
Dec
18
Jan
19
Feb
19M
ar 1
9
Apr
19
May
19
Jun
19
Jul 1
9
Aug
19
Sep
19
US$/bUS$/b
Premium gasoline Jet/KeroseneGasoil Fuel oil
Sources: Argus Media and OPEC Secretariat.
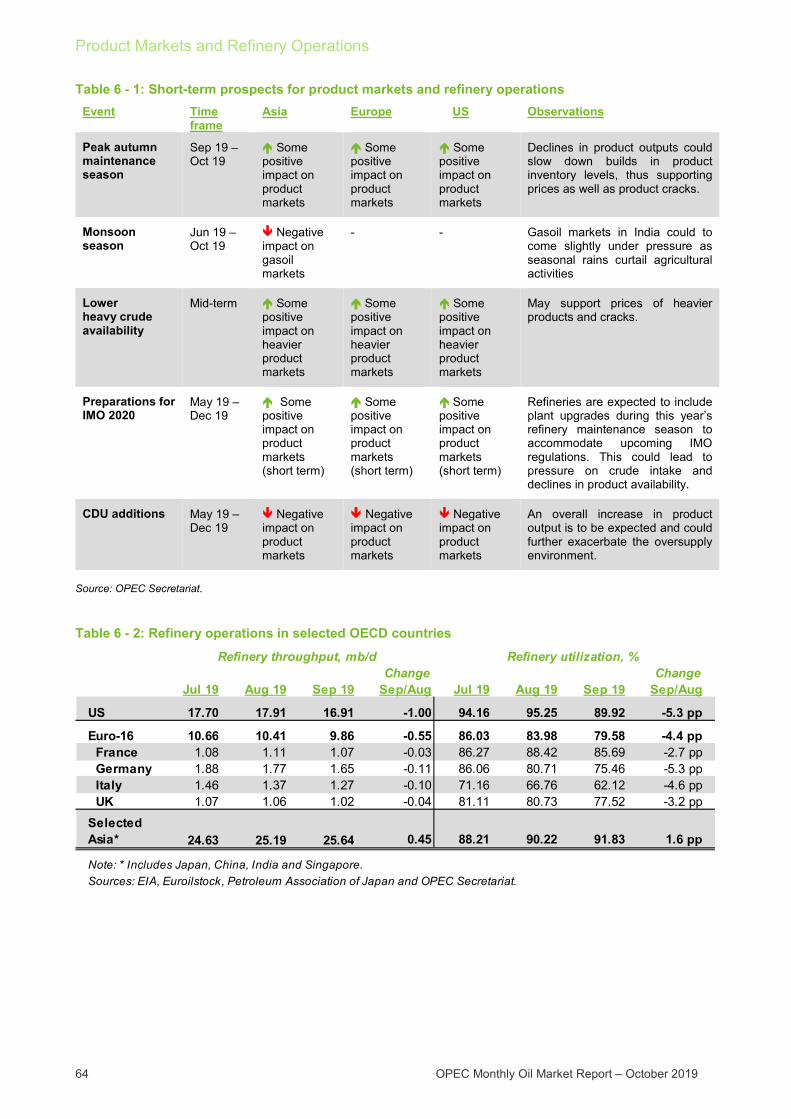
Product Markets and Refinery Operations
64 OPEC Monthly Oil Market Report – October 2019
Table 6 - 1: Short-term prospects for product markets and refinery operations Event Time
frame Asia Europe US Observations
Peak autumn maintenance season
Sep 19 –Oct 19
Some positive impact on product markets
Some positive impact on product markets
Some positive impact on product markets
Declines in product outputs could slow down builds in product inventory levels, thus supporting prices as well as product cracks.
Monsoon season
Jun 19 –Oct 19
Negative impact on gasoil markets
- - Gasoil markets in India could to come slightly under pressure as seasonal rains curtail agricultural activities
Lower heavy crude availability
Mid-term Some positive impact on heavier product markets
Some positive impact on heavier product markets
Some positive impact on heavier product markets
May support prices of heavier products and cracks.
Preparations for IMO 2020 May 19 –
Dec 19 Some positive impact on product markets (short term)
Some positive impact on product markets (short term)
Some positive impact on product markets (short term)
Refineries are expected to include plant upgrades during this year’s refinery maintenance season to accommodate upcoming IMO regulations. This could lead to pressure on crude intake and declines in product availability.
CDU additions May 19 –Dec 19 Negative
impact on product markets
Negative impact on product markets
Negative impact on product markets
An overall increase in product output is to be expected and could further exacerbate the oversupply environment.
Source: OPEC Secretariat.
Table 6 - 2: Refinery operations in selected OECD countries
Change ChangeJul 19 Aug 19 Sep 19 Sep/Aug Jul 19 Aug 19 Sep 19 Sep/Aug
US 17.70 17.91 16.91 -1.00 94.16 95.25 89.92 -5.3 pp
Euro-16 10.66 10.41 9.86 -0.55 86.03 83.98 79.58 -4.4 pp France 1.08 1.11 1.07 -0.03 86.27 88.42 85.69 -2.7 pp Germany 1.88 1.77 1.65 -0.11 86.06 80.71 75.46 -5.3 pp Italy 1.46 1.37 1.27 -0.10 71.16 66.76 62.12 -4.6 pp UK 1.07 1.06 1.02 -0.04 81.11 80.73 77.52 -3.2 pp
Selected Asia* 24.63 25.19 25.64 0.45 88.21 90.22 91.83 1.6 pp
Note: * Includes Japan, China, India and Singapore.Sources: EIA, Euroilstock, Petroleum Association of Japan and OPEC Secretariat.
Refinery throughput, mb/d Refinery utilization, %

Product Markets and Refinery Operations
OPEC Monthly Oil Market Report – October 2019 65
Table 6 - 3: Refinery crude throughput, mb/d
2016 2017 2018 3Q18 4Q18 1Q19 2Q19 3Q19
Total OECD 37.43 38.13 37.99 38.89 37.89 37.27 37.17 38.08
OECD Americas 18.78 19.09 19.30 19.79 19.14 18.36 19.07 19.53of which US 16.51 16.88 17.32 17.68 17.33 16.46 17.14 17.51
OECD Europe 11.91 12.24 11.98 12.43 11.92 12.06 11.65 12.01of which: France 1.14 1.17 1.10 1.21 1.15 1.12 0.98 1.09Germany 1.93 1.91 1.80 1.78 1.65 1.76 1.70 1.77Italy 1.30 1.40 1.35 1.37 1.35 1.24 1.33 1.36UK 1.09 1.10 1.06 1.14 1.14 1.08 1.03 1.05
OECD Asia Pacific 6.75 6.80 6.70 6.66 6.82 6.85 6.45 6.54of which Japan 3.28 3.22 3.11 3.07 3.20 3.19 2.94 3.05
Total Non-OECD 41.41 42.23 43.45 43.56 43.83 44.04 43.71 44.93
of which:China 10.77 11.35 12.03 12.10 12.25 12.63 12.66 12.75Middle East 6.93 7.04 7.26 7.34 7.46 7.22 7.11 7.23Russia 5.58 5.59 5.72 5.81 5.73 5.71 5.38 5.87Latin America 4.66 4.52 4.22 4.18 4.08 4.03 4.16 4.06India 4.68 4.73 4.83 4.78 4.83 5.23 5.02 5.05Africa 2.20 2.21 2.22 2.24 2.18 2.16 2.22 2.28
Total world 78.84 80.36 81.43 82.44 81.71 81.31 80.88 83.01
Note: Totals may not add up due to independent rounding.Sources: OPEC Secretariat, JODI, AFREC, APEC, EIA, IEA, Euroilstock, Petroleum Association of Japan, Ministry data, including Ministry of Energy of the Russian Federation, Ministry of Petroleum and Natural Gas of India.
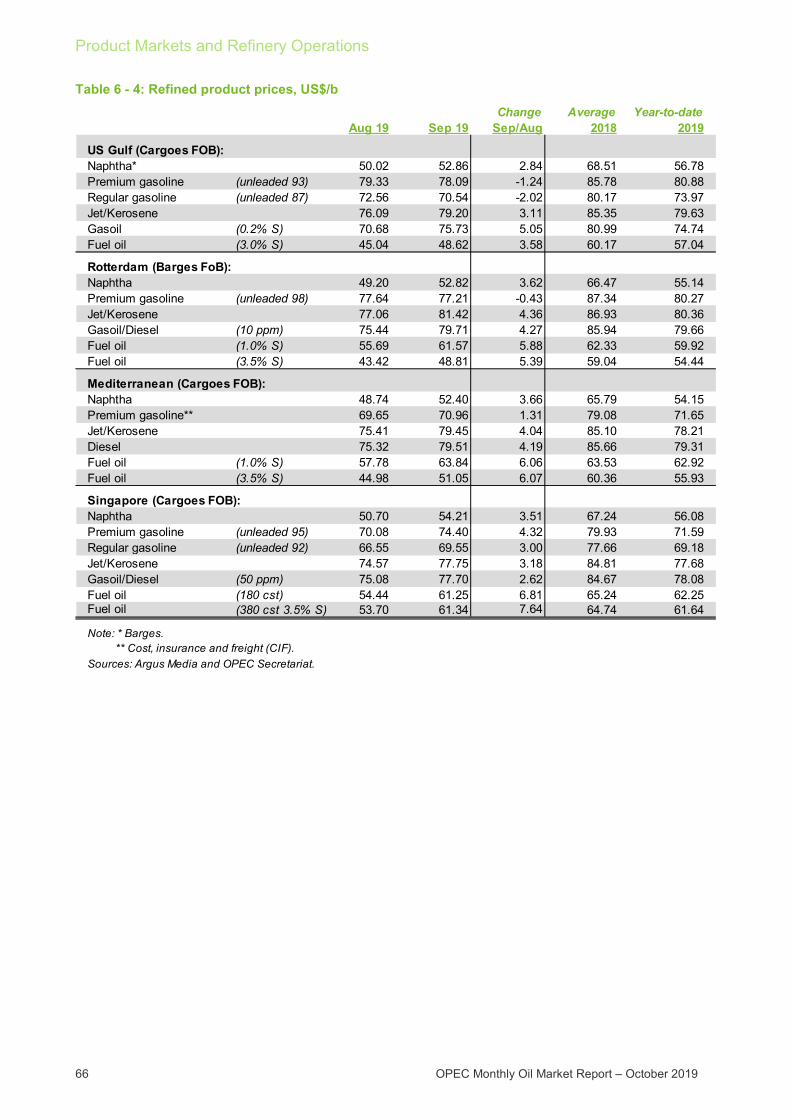
Product Markets and Refinery Operations
66 OPEC Monthly Oil Market Report – October 2019
Table 6 - 4: Refined product prices, US$/b
Change Average Year-to-dateAug 19 Sep 19 Sep/Aug 2018 2019
Naphtha* 50.02 52.86 2.84 68.51 56.78Premium gasoline (unleaded 93) 79.33 78.09 -1.24 85.78 80.88Regular gasoline (unleaded 87) 72.56 70.54 -2.02 80.17 73.97Jet/Kerosene 76.09 79.20 3.11 85.35 79.63Gasoil (0.2% S) 70.68 75.73 5.05 80.99 74.74Fuel oil (3.0% S) 45.04 48.62 3.58 60.17 57.04
Naphtha 49.20 52.82 3.62 66.47 55.14Premium gasoline (unleaded 98) 77.64 77.21 -0.43 87.34 80.27Jet/Kerosene 77.06 81.42 4.36 86.93 80.36Gasoil/Diesel (10 ppm) 75.44 79.71 4.27 85.94 79.66Fuel oil (1.0% S) 55.69 61.57 5.88 62.33 59.92Fuel oil (3.5% S) 43.42 48.81 5.39 59.04 54.44
Naphtha 48.74 52.40 3.66 65.79 54.15Premium gasoline** 69.65 70.96 1.31 79.08 71.65Jet/Kerosene 75.41 79.45 4.04 85.10 78.21Diesel 75.32 79.51 4.19 85.66 79.31Fuel oil (1.0% S) 57.78 63.84 6.06 63.53 62.92Fuel oil (3.5% S) 44.98 51.05 6.07 60.36 55.93
Naphtha 50.70 54.21 3.51 67.24 56.08Premium gasoline (unleaded 95) 70.08 74.40 4.32 79.93 71.59Regular gasoline (unleaded 92) 66.55 69.55 3.00 77.66 69.18Jet/Kerosene 74.57 77.75 3.18 84.81 77.68Gasoil/Diesel (50 ppm) 75.08 77.70 2.62 84.67 78.08Fuel oil (180 cst) 54.44 61.25 6.81 65.24 62.25Fuel oil (380 cst 3.5% S) 53.70 61.34 7.64 64.74 61.64
Sources: Argus Media and OPEC Secretariat.
Note: * Barges. ** Cost, insurance and freight (CIF).
US Gulf (Cargoes FOB):
Rotterdam (Barges FoB):
Mediterranean (Cargoes FOB):
Singapore (Cargoes FOB):
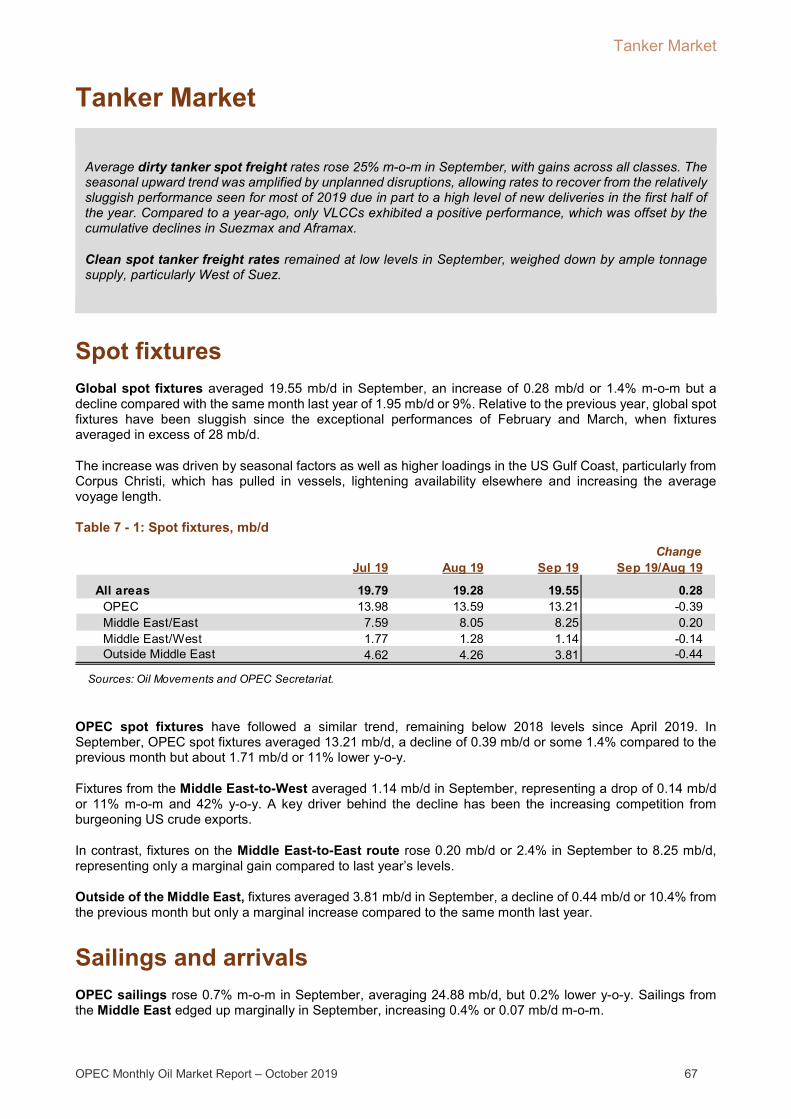
Tanker Market
OPEC Monthly Oil Market Report – October 2019 67
Tanker Market
Average dirty tanker spot freight rates rose 25% m-o-m in September, with gains across all classes. The seasonal upward trend was amplified by unplanned disruptions, allowing rates to recover from the relatively sluggish performance seen for most of 2019 due in part to a high level of new deliveries in the first half of the year. Compared to a year-ago, only VLCCs exhibited a positive performance, which was offset by the cumulative declines in Suezmax and Aframax.
Clean spot tanker freight rates remained at low levels in September, weighed down by ample tonnage supply, particularly West of Suez.
Spot fixtures Global spot fixtures averaged 19.55 mb/d in September, an increase of 0.28 mb/d or 1.4% m-o-m but a decline compared with the same month last year of 1.95 mb/d or 9%. Relative to the previous year, global spot fixtures have been sluggish since the exceptional performances of February and March, when fixtures averaged in excess of 28 mb/d.
The increase was driven by seasonal factors as well as higher loadings in the US Gulf Coast, particularly from Corpus Christi, which has pulled in vessels, lightening availability elsewhere and increasing the average voyage length.
Table 7 - 1: Spot fixtures, mb/d
OPEC spot fixtures have followed a similar trend, remaining below 2018 levels since April 2019. In September, OPEC spot fixtures averaged 13.21 mb/d, a decline of 0.39 mb/d or some 1.4% compared to the previous month but about 1.71 mb/d or 11% lower y-o-y.
Fixtures from the Middle East-to-West averaged 1.14 mb/d in September, representing a drop of 0.14 mb/d or 11% m-o-m and 42% y-o-y. A key driver behind the decline has been the increasing competition from burgeoning US crude exports.
In contrast, fixtures on the Middle East-to-East route rose 0.20 mb/d or 2.4% in September to 8.25 mb/d, representing only a marginal gain compared to last year’s levels.
Outside of the Middle East, fixtures averaged 3.81 mb/d in September, a decline of 0.44 mb/d or 10.4% from the previous month but only a marginal increase compared to the same month last year.
Sailings and arrivals OPEC sailings rose 0.7% m-o-m in September, averaging 24.88 mb/d, but 0.2% lower y-o-y. Sailings from the Middle East edged up marginally in September, increasing 0.4% or 0.07 mb/d m-o-m.
ChangeJul 19 Aug 19 Sep 19 Sep 19/Aug 19
All areas 19.79 19.28 19.55 0.28 OPEC 13.98 13.59 13.21 -0.39 Middle East/East 7.59 8.05 8.25 0.20 Middle East/West 1.77 1.28 1.14 -0.14 Outside Middle East 4.62 4.26 3.81 -0.44
Sources: Oil Movements and OPEC Secretariat.
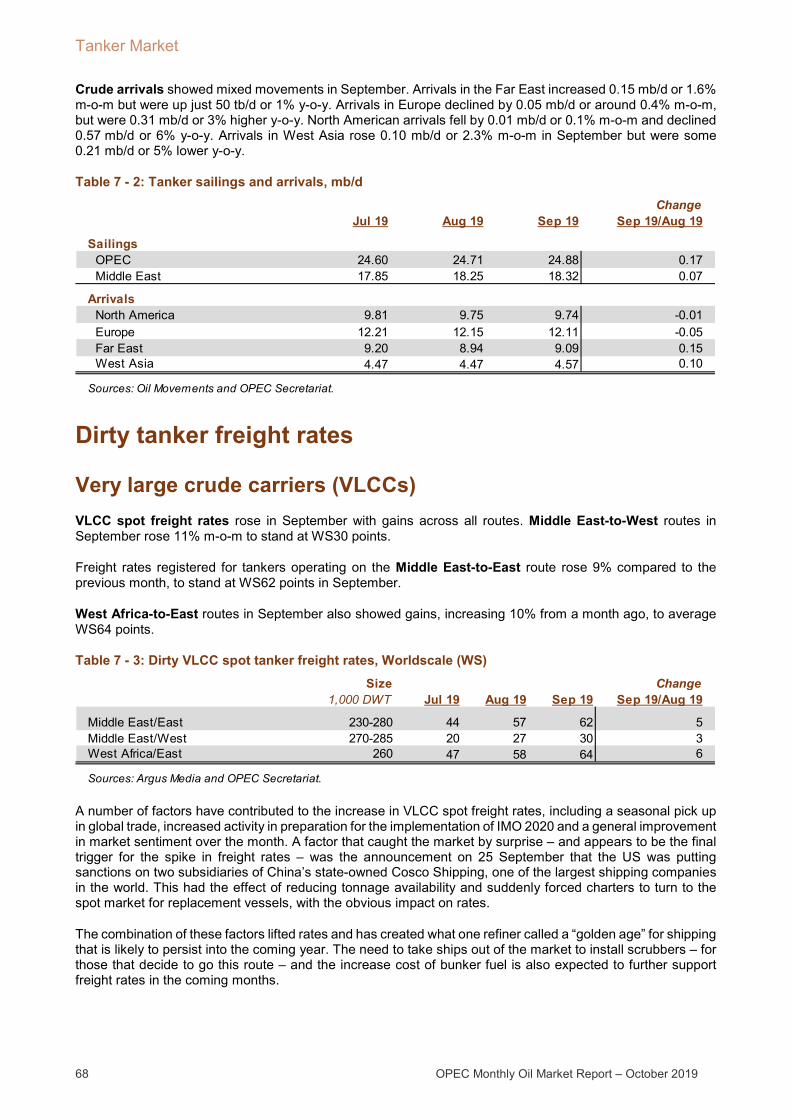
Tanker Market
68 OPEC Monthly Oil Market Report – October 2019
Crude arrivals showed mixed movements in September. Arrivals in the Far East increased 0.15 mb/d or 1.6% m-o-m but were up just 50 tb/d or 1% y-o-y. Arrivals in Europe declined by 0.05 mb/d or around 0.4% m-o-m, but were 0.31 mb/d or 3% higher y-o-y. North American arrivals fell by 0.01 mb/d or 0.1% m-o-m and declined 0.57 mb/d or 6% y-o-y. Arrivals in West Asia rose 0.10 mb/d or 2.3% m-o-m in September but were some 0.21 mb/d or 5% lower y-o-y.
Table 7 - 2: Tanker sailings and arrivals, mb/d
Dirty tanker freight rates
Very large crude carriers (VLCCs) VLCC spot freight rates rose in September with gains across all routes. Middle East-to-West routes in September rose 11% m-o-m to stand at WS30 points.
Freight rates registered for tankers operating on the Middle East-to-East route rose 9% compared to the previous month, to stand at WS62 points in September.
West Africa-to-East routes in September also showed gains, increasing 10% from a month ago, to average WS64 points.
Table 7 - 3: Dirty VLCC spot tanker freight rates, Worldscale (WS)
A number of factors have contributed to the increase in VLCC spot freight rates, including a seasonal pick up in global trade, increased activity in preparation for the implementation of IMO 2020 and a general improvement in market sentiment over the month. A factor that caught the market by surprise – and appears to be the final trigger for the spike in freight rates – was the announcement on 25 September that the US was putting sanctions on two subsidiaries of China’s state-owned Cosco Shipping, one of the largest shipping companies in the world. This had the effect of reducing tonnage availability and suddenly forced charters to turn to the spot market for replacement vessels, with the obvious impact on rates.
The combination of these factors lifted rates and has created what one refiner called a “golden age” for shipping that is likely to persist into the coming year. The need to take ships out of the market to install scrubbers – for those that decide to go this route – and the increase cost of bunker fuel is also expected to further support freight rates in the coming months.
ChangeJul 19 Aug 19 Sep 19 Sep 19/Aug 19
Sailings OPEC 24.60 24.71 24.88 0.17 Middle East 17.85 18.25 18.32 0.07
Arrivals North America 9.81 9.75 9.74 -0.01 Europe 12.21 12.15 12.11 -0.05 Far East 9.20 8.94 9.09 0.15 West Asia 4.47 4.47 4.57 0.10
Sources: Oil Movements and OPEC Secretariat.
Size Change1,000 DWT Jul 19 Aug 19 Sep 19 Sep 19/Aug 19
Middle East/East 230-280 44 57 62 5Middle East/West 270-285 20 27 30 3West Africa/East 260 47 58 64 6
Sources: Argus Media and OPEC Secretariat.

Tanker Market
OPEC Monthly Oil Market Report – October 2019 69
Suezmax Suezmax average spot freight rates saw a recovery in September. Rates for tankers operating on the West Africa-to-US Gulf Coast (USGC) route averaged WS68, a gain of 20%. Rates on the Northwest Europe-to-USGC route also rose, increasing 3% to average WS51 points.
As with VLCCs, seasonal factors, increased exports from the US Gulf Coast, and the impact of sanctions on availability, as well as increased voyage lengths, supported the Suezmax market in September.
Table 7 - 4: Dirty Suezmax spot tanker freight rates, WS
Aframax The Aframax sector in September also enjoyed across-the-board gains on all routes. The Caribbean to US East Coast led gains with an increase of 77% to average WS133 points. Meanwhile, the intra-Med route increased 45% to average 110 points, which was outpaced by a 49% gain on the Med-to-North West Europe route which averaged WS106 points. The Indonesia-to-East route edged up 4% to average WS91 points.
Table 7 - 5: Dirty Aframax spot tanker freight rates, WS
Ample availability have kept Aframax rates immune from some of the upward pressures facing other ship classes; however, tonnage lists tightened as the month progressed.
Graph 7 - 1: Crude oil spot tanker freight rates, monthly average
Graph 7 - 2: Products spot tanker freight rates, monthly average
Size Change1,000 DWT Jul 19 Aug 19 Sep 19 Sep 19/Aug 19
West Africa/US Gulf Coast 130-135 60 57 68 12Northwest Europe/US Gulf Coast 130-135 46 47 51 3
Sources: Argus Media and OPEC Secretariat.
Size Change1,000 DWT Jul 19 Aug 19 Sep 19 Sep 19/Aug 19
Indonesia/East 80-85 93 88 91 3Caribbean/US East Coast 80-85 75 75 133 58Mediterranean/Mediterranean 80-85 88 76 110 34Mediterranean/Northwest Europe 80-85 82 71 106 35
Sources: Argus Media and OPEC Secretariat.
20
60
100
140
180
220
20
60
100
140
180
220
Sep
18
Oct
18
Nov
18
Dec
18
Jan
19Fe
b 19
Mar
19
Apr
19
May
19
Jun
19Ju
l 19
Aug
19
Sep
19
Middle East/East (VLCC)West Africa/USGC (Suezmax)Mediterranean/Northwest Europe (Aframax)
Sources: Argus Media and Platts.
Worldscale Worldscale
50
100
150
200
250
50
100
150
200
250
Sep
18
Oct
18
Nov
18
Dec
18
Jan
19Fe
b 19
Mar
19
Apr
19
May
19
Jun
19Ju
l 19
Aug
19
Sep
19
Middle East/Far EastNorthwest Europe/USECMediterranean/Mediterranean
Sources: Argus Media and OPEC Secretariat.
Worldscale Worldscale

Tanker Market
70 OPEC Monthly Oil Market Report – October 2019
Clean tanker freight rates Clean spot tanker freight rates showed mixed movements in September, with East of Suez rates higher while West of Suez rates remained flat at relatively low levels.
Clean tanker spot freight rates West of Suez averaged WS104, unchanged from the previous month. The Mediterranean-to-Mediterranean and Med-to-North West Europe routes saw gains, increasing 1% to WS104 and WS112, respectively. Meanwhile, rates on the NWE-to-USEC route fell 3% to WS96.
To the East of Suez, clean tanker freight rates rose around 1.5% in September from the previous month to WS124, with the Singapore-to-East route increasing 6% to WS139, offsetting a 3% decline on the Middle East-to-East route which averaged WS109 points.
Table 7 - 6: Clean spot tanker freight rates, WS
Size Change1,000 DWT Jul 19 Aug 19 Sep 19 Sep 19/Aug 19
East of Suez
Middle East/East 30-35 96 112 109 -4Singapore/East 30-35 130 131 139 7
West of SuezNorthwest Europe/US East Coast 33-37 118 99 96 -3Mediterranean/Mediterranean 30-35 153 103 104 1Mediterranean/Northwest Europe 30-35 163 111 112 1
Sources: Argus Media and OPEC Secretariat.
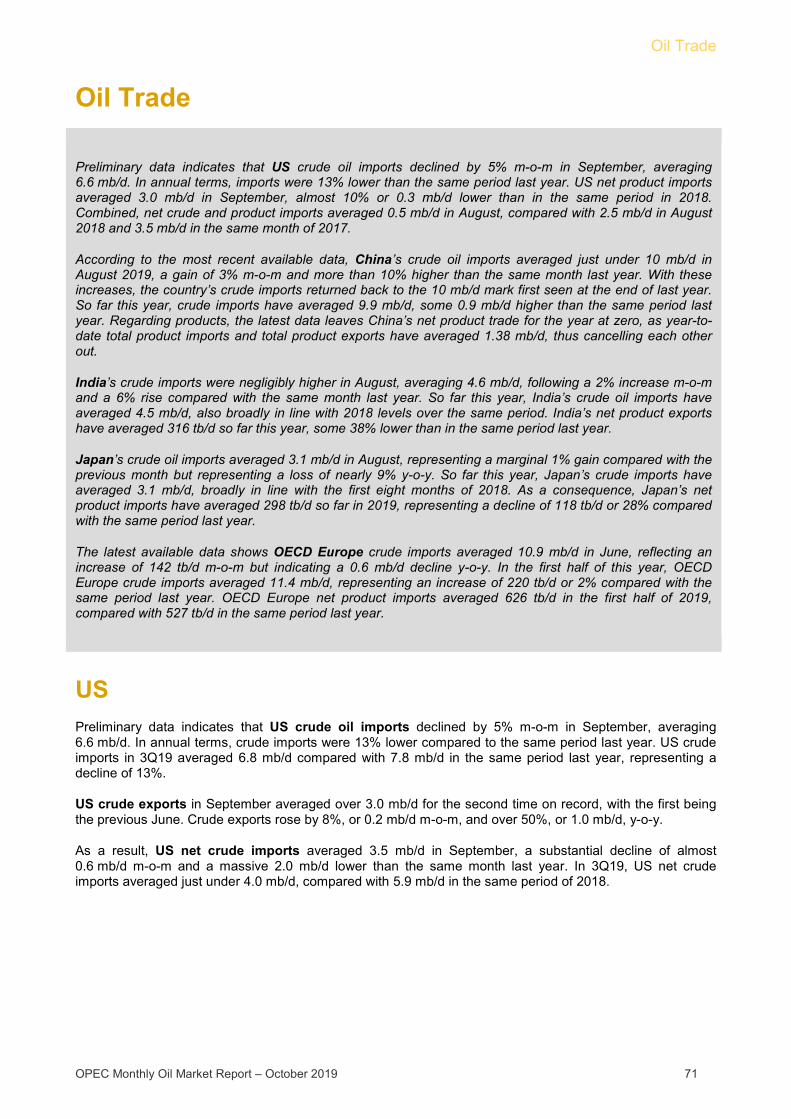
Oil Trade
OPEC Monthly Oil Market Report – October 2019 71
Oil Trade
Preliminary data indicates that US crude oil imports declined by 5% m-o-m in September, averaging 6.6 mb/d. In annual terms, imports were 13% lower than the same period last year. US net product imports averaged 3.0 mb/d in September, almost 10% or 0.3 mb/d lower than in the same period in 2018. Combined, net crude and product imports averaged 0.5 mb/d in August, compared with 2.5 mb/d in August 2018 and 3.5 mb/d in the same month of 2017.
According to the most recent available data, China’s crude oil imports averaged just under 10 mb/d in August 2019, a gain of 3% m-o-m and more than 10% higher than the same month last year. With these increases, the country’s crude imports returned back to the 10 mb/d mark first seen at the end of last year. So far this year, crude imports have averaged 9.9 mb/d, some 0.9 mb/d higher than the same period last year. Regarding products, the latest data leaves China’s net product trade for the year at zero, as year-to-date total product imports and total product exports have averaged 1.38 mb/d, thus cancelling each other out.
India’s crude imports were negligibly higher in August, averaging 4.6 mb/d, following a 2% increase m-o-m and a 6% rise compared with the same month last year. So far this year, India’s crude oil imports have averaged 4.5 mb/d, also broadly in line with 2018 levels over the same period. India’s net product exports have averaged 316 tb/d so far this year, some 38% lower than in the same period last year.
Japan’s crude oil imports averaged 3.1 mb/d in August, representing a marginal 1% gain compared with the previous month but representing a loss of nearly 9% y-o-y. So far this year, Japan’s crude imports have averaged 3.1 mb/d, broadly in line with the first eight months of 2018. As a consequence, Japan’s net product imports have averaged 298 tb/d so far in 2019, representing a decline of 118 tb/d or 28% compared with the same period last year.
The latest available data shows OECD Europe crude imports averaged 10.9 mb/d in June, reflecting an increase of 142 tb/d m-o-m but indicating a 0.6 mb/d decline y-o-y. In the first half of this year, OECD Europe crude imports averaged 11.4 mb/d, representing an increase of 220 tb/d or 2% compared with the same period last year. OECD Europe net product imports averaged 626 tb/d in the first half of 2019, compared with 527 tb/d in the same period last year.
US Preliminary data indicates that US crude oil imports declined by 5% m-o-m in September, averaging 6.6 mb/d. In annual terms, crude imports were 13% lower compared to the same period last year. US crude imports in 3Q19 averaged 6.8 mb/d compared with 7.8 mb/d in the same period last year, representing a decline of 13%.
US crude exports in September averaged over 3.0 mb/d for the second time on record, with the first being the previous June. Crude exports rose by 8%, or 0.2 mb/d m-o-m, and over 50%, or 1.0 mb/d, y-o-y.
As a result, US net crude imports averaged 3.5 mb/d in September, a substantial decline of almost 0.6 mb/d m-o-m and a massive 2.0 mb/d lower than the same month last year. In 3Q19, US net crude imports averaged just under 4.0 mb/d, compared with 5.9 mb/d in the same period of 2018.

Oil Trade
72 OPEC Monthly Oil Market Report – October 2019
Graph 8 - 1: US imports of crude and petroleum products
Graph 8 - 2: US exports of crude and petroleum products
US product imports fell by 17% or 0.4 mb/d in September to average slightly above 2.0 mb/d. Product imports to the US in 3Q19 averaged 2.4 mb/d, representing a gain of 1% or just 31 tb/d compared with the same period last year.
US product exports stood at 5.0 mb/d in September, representing a decline of 3% or 143 tb/d m-o-m. In 3Q19, product exports from the US averaged 5.2 mb/d, some 4% or 0.2 mb/d lower than in the same period of 2018.
As a result, US net product imports averaged 3.0 mb/d in September, almost 10% or 0.3 mb/d lower than in the same period of 2018. Combined, net crude and product imports averaged 0.5 mb/d in September, compared with 2.5 mb/d in September 2018 and 3.5 mb/d in the same month of 2017.
Table 8 - 1: US crude and product net imports, tb/d
China The latest date for China shows the country’s crude oil imports averaged just under 10 mb/d in August 2019, a gain of 3% m-o-m and more than 10% higher than the same month last year. With these increases, the country’s crude imports returned back to the 10 mb/d mark first reached in November last year. Imports remained largely above 10 mb/d until May, but fell back as refineries went into maintenance. So far this year, crude imports have averaged 9.9 mb/d, some 0.9 mb/d higher than the same period last year.
Saudi Arabia remained the top crude supplier to China with a share of 18.5% or 1.8 mb/d in imports, an increase of 11% over the previous month. Russia came in second with 14%, followed by Iraq with 11%, Angola with 9% and Oman with 6%.
4.5
5.5
6.5
7.5
8.5
0.00.51.01.52.02.53.0
Sep
18
Oct
18
Nov
18
Dec
18
Jan
19Fe
b 19
Mar
19
Apr
19
May
19
Jun
19Ju
l 19
Aug
19
Sep
19
mb/dmb/d
Fuel oil Jet fuel/keroseneGasoline PropaneOthers* Crude (RHS)
Note: * Others: Contains natural gas liquids, liquefied refinerygases (LRG's), other liquids and all finished petroleum productsexcept gasoline, jet fuel/kerosene, fuel oil and propane/propylene.Sources: US EIA and OPEC Secretariat.
05001,0001,5002,0002,5003,0003,500
01,0002,0003,0004,0005,0006,0007,000
Sep
18
Oct
18
Nov
18
Dec
18
Jan
19Fe
b 19
Mar
19
Apr
19
May
19
Jun
19Ju
l 19
Aug
19
Sep
19
tb/dtb/d
Fuel oil Jet fuel/keroseneGasoline PropaneOthers* Crude (RHS)
Note: * Others: Contains natural gas liquids, liquefied refinery gases (LRG's), other liquids and all finished petroleum products except gasoline, jet fuel/kerosene, fuel oil and propane/propylene.Sources: US EIA and OPEC Secretariat.
ChangeJul 19 Aug 19 Sep 19 Sep 19/Aug 19
Crude oil 4,241 4,109 3,535 -574Total products -2,775 -2,777 -3,044 -266
Total crude and products 1,466 1,332 491 -841
Sources: US EIA and OPEC Secretariat.
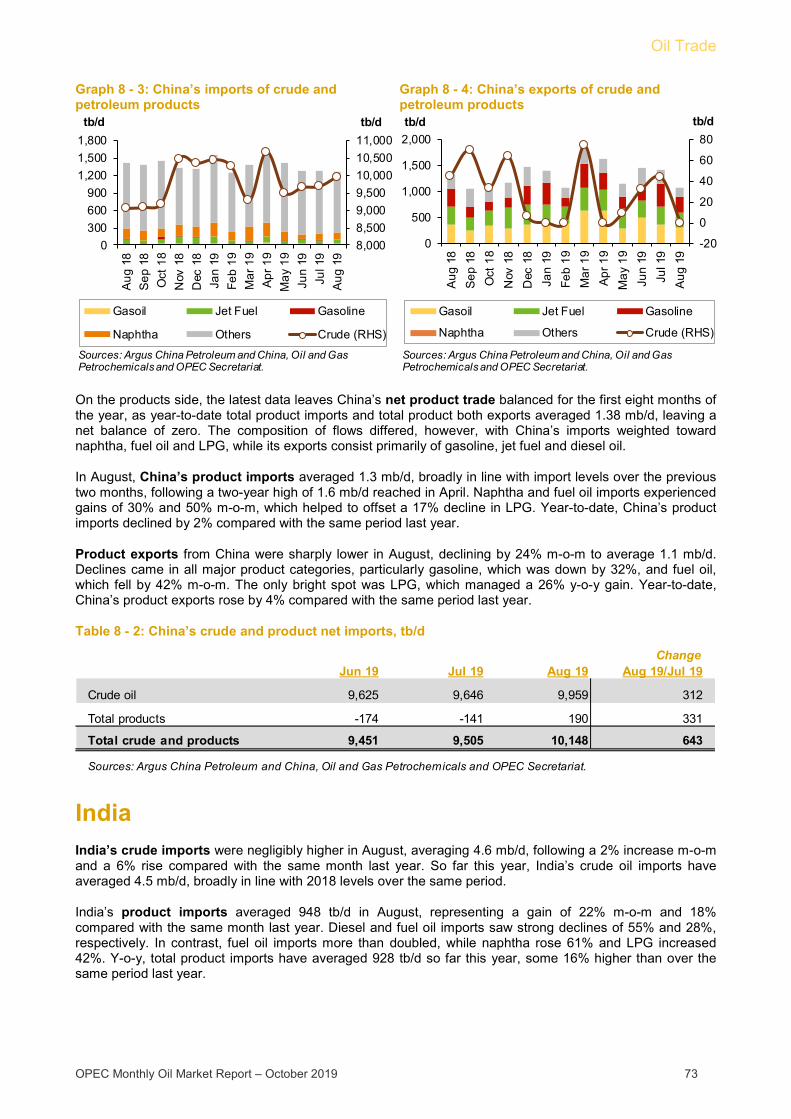
Oil Trade
OPEC Monthly Oil Market Report – October 2019 73
Graph 8 - 3: China’s imports of crude and petroleum products
Graph 8 - 4: China’s exports of crude and petroleum products
On the products side, the latest data leaves China’s net product trade balanced for the first eight months of the year, as year-to-date total product imports and total product both exports averaged 1.38 mb/d, leaving a net balance of zero. The composition of flows differed, however, with China’s imports weighted toward naphtha, fuel oil and LPG, while its exports consist primarily of gasoline, jet fuel and diesel oil.
In August, China’s product imports averaged 1.3 mb/d, broadly in line with import levels over the previous two months, following a two-year high of 1.6 mb/d reached in April. Naphtha and fuel oil imports experienced gains of 30% and 50% m-o-m, which helped to offset a 17% decline in LPG. Year-to-date, China’s product imports declined by 2% compared with the same period last year.
Product exports from China were sharply lower in August, declining by 24% m-o-m to average 1.1 mb/d. Declines came in all major product categories, particularly gasoline, which was down by 32%, and fuel oil, which fell by 42% m-o-m. The only bright spot was LPG, which managed a 26% y-o-y gain. Year-to-date, China’s product exports rose by 4% compared with the same period last year.
Table 8 - 2: China’s crude and product net imports, tb/d
India India’s crude imports were negligibly higher in August, averaging 4.6 mb/d, following a 2% increase m-o-m and a 6% rise compared with the same month last year. So far this year, India’s crude oil imports have averaged 4.5 mb/d, broadly in line with 2018 levels over the same period.
India’s product imports averaged 948 tb/d in August, representing a gain of 22% m-o-m and 18% compared with the same month last year. Diesel and fuel oil imports saw strong declines of 55% and 28%, respectively. In contrast, fuel oil imports more than doubled, while naphtha rose 61% and LPG increased 42%. Y-o-y, total product imports have averaged 928 tb/d so far this year, some 16% higher than over the same period last year.
8,0008,5009,0009,50010,00010,50011,000
0300600900
1,2001,5001,800
Aug
18
Sep
18
Oct
18
Nov
18
Dec
18
Jan
19Fe
b 19
Mar
19
Apr
19
May
19
Jun
19Ju
l 19
Aug
19
tb/dtb/d
Gasoil Jet Fuel Gasoline
Naphtha Others Crude (RHS)
Sources: Argus China Petroleum and China, Oil and Gas Petrochemicals and OPEC Secretariat.
-20
0
20
40
60
80
0
500
1,000
1,500
2,000
Aug
18
Sep
18
Oct
18
Nov
18
Dec
18
Jan
19Fe
b 19
Mar
19
Apr
19
May
19
Jun
19Ju
l 19
Aug
19
tb/dtb/d
Gasoil Jet Fuel Gasoline
Naphtha Others Crude (RHS)
Sources: Argus China Petroleum and China, Oil and Gas Petrochemicals and OPEC Secretariat.
ChangeJun 19 Jul 19 Aug 19 Aug 19/Jul 19
Crude oil 9,625 9,646 9,959 312
Total products -174 -141 190 331
Total crude and products 9,451 9,505 10,148 643
Sources: Argus China Petroleum and China, Oil and Gas Petrochemicals and OPEC Secretariat.
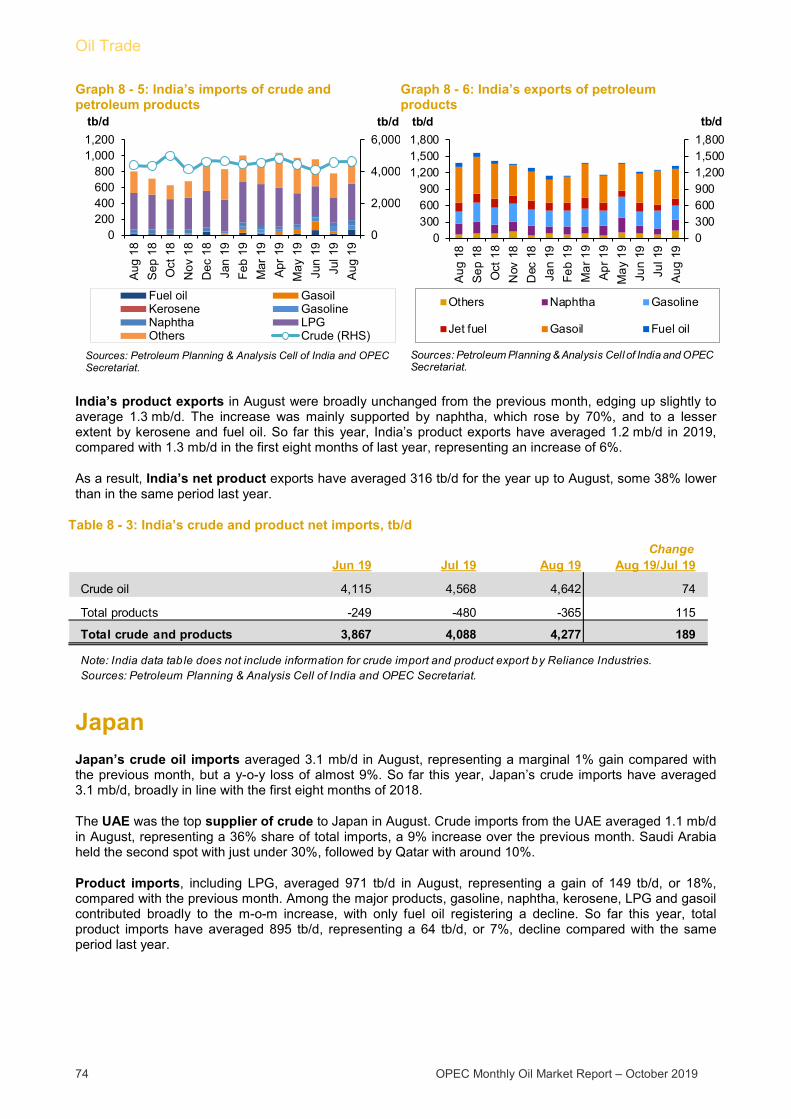
Oil Trade
74 OPEC Monthly Oil Market Report – October 2019
Graph 8 - 5: India’s imports of crude and petroleum products
Graph 8 - 6: India’s exports of petroleum products
India’s product exports in August were broadly unchanged from the previous month, edging up slightly to average 1.3 mb/d. The increase was mainly supported by naphtha, which rose by 70%, and to a lesser extent by kerosene and fuel oil. So far this year, India’s product exports have averaged 1.2 mb/d in 2019, compared with 1.3 mb/d in the first eight months of last year, representing an increase of 6%.
As a result, India’s net product exports have averaged 316 tb/d for the year up to August, some 38% lower than in the same period last year.
Table 8 - 3: India’s crude and product net imports, tb/d
Japan Japan’s crude oil imports averaged 3.1 mb/d in August, representing a marginal 1% gain compared with the previous month, but a y-o-y loss of almost 9%. So far this year, Japan’s crude imports have averaged 3.1 mb/d, broadly in line with the first eight months of 2018.
The UAE was the top supplier of crude to Japan in August. Crude imports from the UAE averaged 1.1 mb/d in August, representing a 36% share of total imports, a 9% increase over the previous month. Saudi Arabia held the second spot with just under 30%, followed by Qatar with around 10%.
Product imports, including LPG, averaged 971 tb/d in August, representing a gain of 149 tb/d, or 18%, compared with the previous month. Among the major products, gasoline, naphtha, kerosene, LPG and gasoil contributed broadly to the m-o-m increase, with only fuel oil registering a decline. So far this year, total product imports have averaged 895 tb/d, representing a 64 tb/d, or 7%, decline compared with the same period last year.
0
2,000
4,000
6,000
0200400600800
1,0001,200
Aug
18
Sep
18
Oct
18
Nov
18
Dec
18
Jan
19Fe
b 19
Mar
19
Apr
19
May
19
Jun
19Ju
l 19
Aug
19
tb/dtb/d
Fuel oil GasoilKerosene GasolineNaphtha LPGOthers Crude (RHS)
Sources: Petroleum Planning & Analysis Cell of India and OPEC Secretariat.
03006009001,2001,5001,800
0300600900
1,2001,5001,800
Aug
18
Sep
18
Oct
18
Nov
18
Dec
18
Jan
19Fe
b 19
Mar
19
Apr
19
May
19
Jun
19Ju
l 19
Aug
19
tb/dtb/d
Others Naphtha Gasoline
Jet fuel Gasoil Fuel oil
Sources: Petroleum Planning & Analysis Cell of India and OPEC Secretariat.
ChangeJun 19 Jul 19 Aug 19 Aug 19/Jul 19
Crude oil 4,115 4,568 4,642 74
Total products -249 -480 -365 115
Total crude and products 3,867 4,088 4,277 189
Note: India data tab le does not include information for crude import and product export by Reliance Industries.Sources: Petroleum Planning & Analysis Cell of India and OPEC Secretariat.

Oil Trade
OPEC Monthly Oil Market Report – October 2019 75
Graph 8 - 7: Japan’s imports of crude and petroleum products
Graph 8 - 8: Japan’s exports of petroleum products
Meanwhile, product exports, including LPG, averaged 581 tb/d in August, representing a decline of 44 tb/d, or 7%, from the previous month. Gasoil and jet fuel were the main drivers behind the drop, while kerosene and fuel oil saw gains. So far this year, Japan’s product exports have averaged 597 mb/d, a gain of almost 10% over the same period last year.
Table 8 - 4: Japan’s crude and product net imports, tb/d
As a consequence, Japan’s net product imports have averaged 298 tb/d so far in 2019, representing a decline of 118 tb/d or 28% compared with the same period last year.
OECD Europe The latest available data shows OECD Europe crude imports averaged 10.9 mb/d in June, reflecting an increase of 142 tb/d m-o-m but a 0.6 mb/d decline y-o-y. In the first half of this year, OECD Europe crude imports have averaged 11.4 mb/d, representing a rise of 220 tb/d or 2% compared with the same period last year.
Crude exports averaged 1.9 mb/d in June, following a decline of 225 tb/d or 11% m-o-m and a sharper fall of 425 tb/d or 19% y-o-y. So far this year, OECD Europe crude exports have averaged just under 2.1 mb/d, slightly lower than average exports over the same period in 2018.
As a result, OECD Europe net crude imports averaged 9.3 mb/d in the second half of 2019, compared with 9.0 mb/d in the same period of 2018.
012345
0
300
600
900
1,200A
ug 1
8S
ep 1
8O
ct 1
8N
ov 1
8D
ec 1
8Ja
n 19
Feb
19M
ar 1
9A
pr 1
9M
ay 1
9Ju
n 19
Jul 1
9A
ug 1
9
mb/dtb/d
Fuel oil Naphtha LPGOthers* Crude oil
Note: * Others: Contains gasoline, jet fuel, kerosene, gasoil, asphalt and paraffin wax.Sources: Ministry of Economy, Trade and Industry of Japan and OPEC Secretariat.
-2000200400600800
-2000
200400600800
Aug
18
Sep
18
Oct
18
Nov
18
Dec
18
Jan
19Fe
b 19
Mar
19
Apr
19
May
19
Jun
19Ju
l 19
Aug
19
tb/dtb/d
Fuel oil Gasoil Jet fuel Others*
Note: * Others: Contains LPG, gasoline, naphtha, kerosene, lubricating oil, asphalt and paraffin wax.Sources: Ministry of Economy, Trade and Industry of Japan and OPEC Secretariat.
ChangeJun 19 Jul 19 Aug 19 Aug 19/Jul 19
Crude oil 2,778 3,068 3,102 34Total products 180 303 399 95
Total crude and products 2,957 3,371 3,501 129
Sources: Ministry of Economy, Trade and Industry of Japan and OPEC Secretariat.
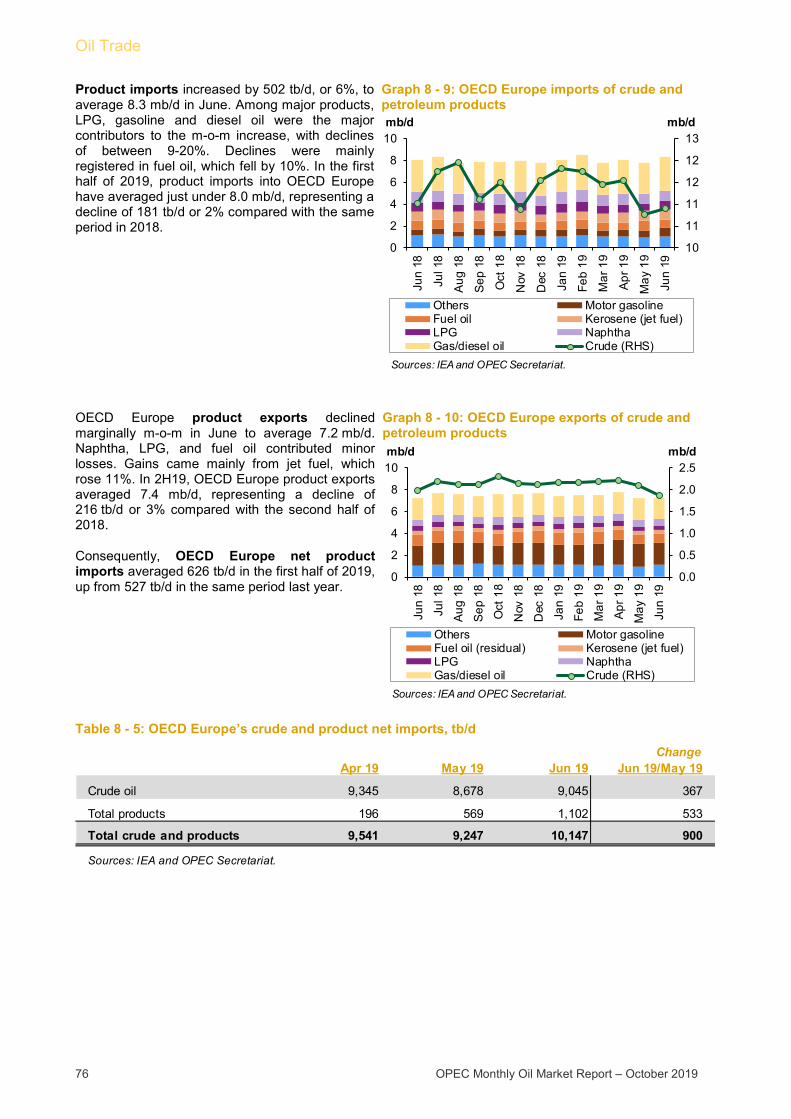
Oil Trade
76 OPEC Monthly Oil Market Report – October 2019
Product imports increased by 502 tb/d, or 6%, to average 8.3 mb/d in June. Among major products, LPG, gasoline and diesel oil were the major contributors to the m-o-m increase, with declines of between 9-20%. Declines were mainly registered in fuel oil, which fell by 10%. In the first half of 2019, product imports into OECD Europe have averaged just under 8.0 mb/d, representing a decline of 181 tb/d or 2% compared with the same period in 2018.
Graph 8 - 9: OECD Europe imports of crude and petroleum products
OECD Europe product exports declined marginally m-o-m in June to average 7.2 mb/d. Naphtha, LPG, and fuel oil contributed minor losses. Gains came mainly from jet fuel, which rose 11%. In 2H19, OECD Europe product exports averaged 7.4 mb/d, representing a decline of 216 tb/d or 3% compared with the second half of 2018.
Consequently, OECD Europe net product imports averaged 626 tb/d in the first half of 2019, up from 527 tb/d in the same period last year.
Graph 8 - 10: OECD Europe exports of crude and petroleum products
Table 8 - 5: OECD Europe’s crude and product net imports, tb/d
10
11
11
12
12
13
0
2
4
6
8
10
Jun
18
Jul 1
8
Aug
18
Sep
18
Oct
18
Nov
18
Dec
18
Jan
19
Feb
19
Mar
19
Apr
19
May
19
Jun
19
mb/dmb/d
Others Motor gasolineFuel oil Kerosene (jet fuel)LPG NaphthaGas/diesel oil Crude (RHS)
Sources: IEA and OPEC Secretariat.
0.0
0.5
1.0
1.5
2.0
2.5
0
2
4
6
8
10
Jun
18
Jul 1
8
Aug
18
Sep
18
Oct
18
Nov
18
Dec
18
Jan
19
Feb
19
Mar
19
Apr
19
May
19
Jun
19
mb/dmb/d
Others Motor gasolineFuel oil (residual) Kerosene (jet fuel)LPG NaphthaGas/diesel oil Crude (RHS)
Sources: IEA and OPEC Secretariat.
ChangeApr 19 May 19 Jun 19 Jun 19/May 19
Crude oil 9,345 8,678 9,045 367
Total products 196 569 1,102 533
Total crude and products 9,541 9,247 10,147 900
Sources: IEA and OPEC Secretariat.

Oil Trade
OPEC Monthly Oil Market Report – October 2019 77
FSU Total crude exports from the Former Soviet Union (FSU) declined by 134 tb/d m-o-m, or around 2%, to average 7.2 mb/d in August 2019. Crude exports through Russian pipelines rose marginally compared with the previous month to remain at 4.4 mb/d in August 2019.
In the Transneft system, total shipments from the Black Sea fell by 82 tb/d m-o-m, or 11%, to average 677 tb/d in August. Total Baltic Sea exports fell by 92 tb/d m-o-m, with shipments from Ust-Luga down by 93 tb/d or 7%. Meanwhile, shipments via the Druzhba pipeline continued to recover from contamination disruptions that began in mid-April of this year, reaching over 1.0 mb/d, an increase of almost 60% or 0.6 mb/d from the average seen in 2Q19 and even slightly higher than last year’s average. In Asia, Kozmino shipments rose by 52 tb/d m-o-m or 8% to average 731 tb/d. Exports to China via the ESPO pipeline averaged 637 tb/d, an increase of 10% or 58 tb/d m-o-m.
In the Lukoil system, exports via the Barents Sea rose by 28 tb/d to average 185 mb/d in August, while those from the Baltic Sea remained flat at 6 tb/d.
Russia’s Far East total exports rose 24 tb/d from the previous month to average 347 tb/d.
Central Asia’s total exports averaged 220 tb/d, a 2% decrease from the previous month.
Black Sea total exports declined by 59 tb/d m-o-m to average 1.4 mb/d, with the Novorossiyk port terminal (CPC) declining by 98 tb/d while the Supsa port terminal increased by 39 tb/d.
In the Mediterranean, BTC supplies decreased compared with the previous month, down by 135 tb/d m-o-m or 19% to average 579 tb/d.
FSU total product exports declined marginally in August, averaging just under 3.0 mb/d for the month. Movements were mixed, with naphtha, gasoil and VGO seeing losses, while gasoline, jet and fuel oil increased.
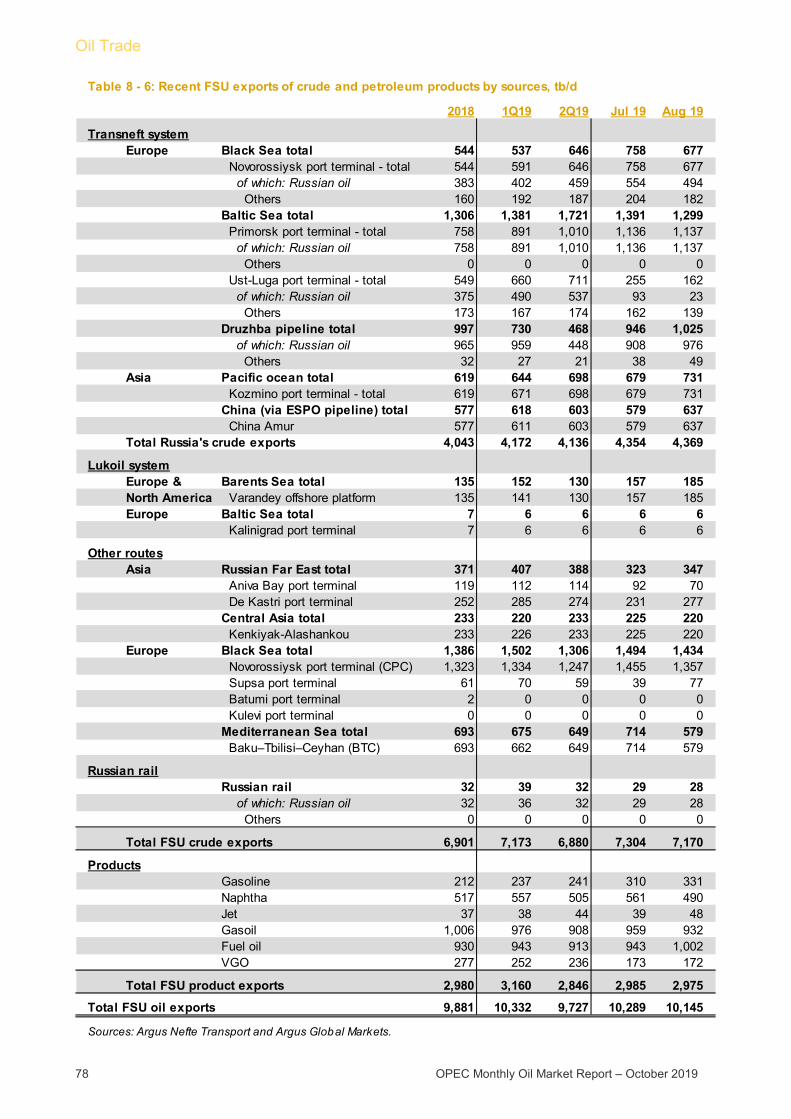
Oil Trade
78 OPEC Monthly Oil Market Report – October 2019
2018 1Q19 2Q19 Jul 19 Aug 19
Transneft systemEurope Black Sea total 544 537 646 758 677
Novorossiysk port terminal - total 544 591 646 758 677 of which: Russian oil 383 402 459 554 494 Others 160 192 187 204 182Baltic Sea total 1,306 1,381 1,721 1,391 1,299 Primorsk port terminal - total 758 891 1,010 1,136 1,137 of which: Russian oil 758 891 1,010 1,136 1,137 Others 0 0 0 0 0 Ust-Luga port terminal - total 549 660 711 255 162 of which: Russian oil 375 490 537 93 23 Others 173 167 174 162 139Druzhba pipeline total 997 730 468 946 1,025 of which: Russian oil 965 959 448 908 976 Others 32 27 21 38 49
Asia Pacific ocean total 619 644 698 679 731 Kozmino port terminal - total 619 671 698 679 731China (via ESPO pipeline) total 577 618 603 579 637 China Amur 577 611 603 579 637
Total Russia's crude exports 4,043 4,172 4,136 4,354 4,369
Lukoil systemEurope & Barents Sea total 135 152 130 157 185North America Varandey offshore platform 135 141 130 157 185Europe Baltic Sea total 7 6 6 6 6
Kalinigrad port terminal 7 6 6 6 6
Other routesAsia Russian Far East total 371 407 388 323 347
Aniva Bay port terminal 119 112 114 92 70 De Kastri port terminal 252 285 274 231 277Central Asia total 233 220 233 225 220 Kenkiyak-Alashankou 233 226 233 225 220
Europe Black Sea total 1,386 1,502 1,306 1,494 1,434 Novorossiysk port terminal (CPC) 1,323 1,334 1,247 1,455 1,357 Supsa port terminal 61 70 59 39 77 Batumi port terminal 2 0 0 0 0 Kulevi port terminal 0 0 0 0 0Mediterranean Sea total 693 675 649 714 579 Baku–Tbilisi–Ceyhan (BTC) 693 662 649 714 579
Russian railRussian rail 32 39 32 29 28 of which: Russian oil 32 36 32 29 28 Others 0 0 0 0 0
Total FSU crude exports 6,901 7,173 6,880 7,304 7,170
ProductsGasoline 212 237 241 310 331Naphtha 517 557 505 561 490Jet 37 38 44 39 48Gasoil 1,006 976 908 959 932Fuel oil 930 943 913 943 1,002VGO 277 252 236 173 172
Total FSU product exports 2,980 3,160 2,846 2,985 2,975
Total FSU oil exports 9,881 10,332 9,727 10,289 10,145
Sources: Argus Nefte Transport and Argus Global Markets.
Table 8 - 6: Recent FSU exports of crude and petroleum products by sources, tb/d

Stock Movements
OPEC Monthly Oil Market Report – October 2019 79
Stock Movements
Preliminary data for August showed that total OECD commercial oil stocks rose by 10 mb m-o-m, to stand at 2,937 mb, which was 85 mb higher than the same time one year ago, and 11 mb above the latest five-year average. Within the components, crude stocks fell by 21.9 mb m-o-m to stand at 28 mb below the latest five-year average, while product stocks rose by 32 mb m-o-m to remain 39 mb above the latest five-year average. In terms of days of forward cover, OECD commercial stocks rose by 0.4 days m-o-m in August to stand at 60.9 days, which was 1.6 days above the same period in 2018, but 1.2 days below the latest five-year average.
Preliminary data for September showed that US total commercial oil stocks fell by 2.4 mb m-o-m to stand at 1,296.7 mb, which was 23.5 mb above the same period a year ago, and 32 mb higher than the latest five-year average. Within the components, crude and product stocks fell by 0.3 mb and 2.1 mb m-o-m, respectively.
OECD Preliminary data for August showed that total OECD commercial oil stocks rose by 10 mb m-o-m for the fifth consecutive month, to stand at 2,937 mb, which was 85 mb higher than the same time one year ago, and 11 mb above the latest five-year average.
Within the components, crude stocks fell by 21.9 mb, while product stocks rose by 31.9 mb m-o-m. It should be noted that the overhang of total OECD commercial oil stocks has been reduced by around 290 mb since the ‘Declaration of Cooperation’ began at the beginning of 2017.
Within the regions, OECD America witnessed a stock draw, while OECD Asia Pacific and Europe registered a stock build.
Graph 9 - 1: OECD commercial oil stocks
OECD commercial crude stocks fell by 21.9 mb m-o-m in August, ending the month at 1,406 mb, which was 6 mb lower than the same time a year ago, and 28 mb below the latest five-year average. Compared to the previous month, OECD Americas and OECD Asia Pacific fell by 19.1 mb and 2.6 mb, respectively, while crude stocks in OECD Europe decreased slightly by 0.2 mb.
In contrast, OECD total product inventories rose by 31.9 mb m-o-m in August to stand at 1,530 mb, which was 91 mb above the same time a year ago, and around 39 mb above the latest five-year average. Within the OECD regions, product stocks in OECD America rose by 18.5 mb, while OECD Asia Pacific and Europe stocks rose by 5 mb and 8.4 mb, m-o-m, respectively.
In terms of days of forward cover, OECD commercial stocks rose by 0.4 days m-o-m in August to stand at 60.9 days, which was 1.6 days above the same period in 2018, but 1.2 days below the latest five-year average. Within the regions, OECD Americas was 1.2 days below the latest five-year average to stand at 60 days in August. OECD Europe’s stocks in line with the latest five-year average to finish the month at 67.9 days. OECD Asia Pacific stocks were 4.0 days below the latest five-year average to stand at 50.6 days.
2,5002,6002,7002,8002,9003,0003,1003,200
2,500
2,600
2,700
2,800
2,900
3,000
3,100
Jan
Feb
Mar
Apr
May Jun
Jul
Aug
Sep Oct
Nov
Dec
mbmb
2017 2018 2019
Historical range2014-18
Sources: Argus Media, Euroilstock, IEA, METI, OPEC Secretariat and US EIA.
Avg. 2014-18

Stock Movements
80 OPEC Monthly Oil Market Report – October 2019
Table 9 - 1: OECD’s commercial stocks, mb
OECD Americas OECD Americas total commercial stocks fell by 0.6 mb m-o-m in August to settle at 1,558 mb, which was 51 mb above a year ago, and 32 mb above the latest five-year average. Within the components, crude stocks fell by 19.1 mb, while products stocks rose by 18.5 mb m-o-m.
Commercial crude oil stocks in OECD Americas fell by 19.1 mb m-o-m in August to stand at 768 mb, which was 3.2 mb higher than the same time a year ago, but 2.8 mb below the latest five-year average. This drop could be attributed to higher US refinery runs, which rose by 210 tb/d to average 17.9 mb/d.
In contrast, total product stocks in OECD Americas rose by 18.5 mb m-o-m in August to stand at 790 mb, which was 48 mb above the same time one year ago, and 35 mb above the latest five-year average. Lower demand, combined with higher crude refinery output in the region, were behind the product stock build.
OECD Europe OECD Europe’s total commercial stocks rose by 8.1 mb m-o-m in August, ending the month at 985 mb, which was 36.3 mb higher than the same time a year ago and 17.3 mb higher than the latest five-year average. Crude stocks fell by 0.2 mb, while products rose by 8.4 mb.
OECD Europe’s commercial crude stocks fell by 0.2 mb m-o-m in August, ending the month at 429 mb, which was 5.2 mb above a year earlier, and 17 mb higher than the latest five-year average. The drop was driven by higher refinery throughput in the region.
In contrast, OECD Europe’s commercial product stocks rose by 8.4 mb m-o-m to end August at 555 mb, which was 31 mb above the same time a year ago, and 0.3 mb above the latest five-year average. The build came on the back of lower consumption in the region.
OECD Asia Pacific OECD Asia Pacific’s total commercial oil stocks rose by 2.4 mb m-o-m in August to stand at 394 mb, which was 2.5 mb lower than a year ago, and 38.1 mb below the latest five-year average. Within the components, crude fell m-o-m by 2.6 mb, while products stocks rose m-o-m by 5 mb.
OECD Asia Pacific’s crude inventories fell by 2.6 mb m-o-m to end August at 209 mb, which was 14.4 mb lower than one year ago, and 42 mb below the latest five-year average.
In contrast, OECD Asia Pacific’s total product inventories rose by 5 mb m-o-m to end August at 185 mb, which was 12 mb higher than the same time a year ago, and 3.8 mb above the latest five-year average.
ChangeJun 19 Jul 19 Aug 19 Aug 19/Jul 19 Aug 18
Crude oil 1,465 1,428 1,406 -21.9 1,412Products 1,460 1,498 1,530 31.9 1,439
Total 2,925 2,927 2,937 10.0 2,852Days of forward cover 60.3 60.5 60.9 0.4 59.3
Note: Totals may not add up due to independent rounding.Sources: Argus Media, Euroilstock, IEA, METI, OPEC Secretariat and US EIA.
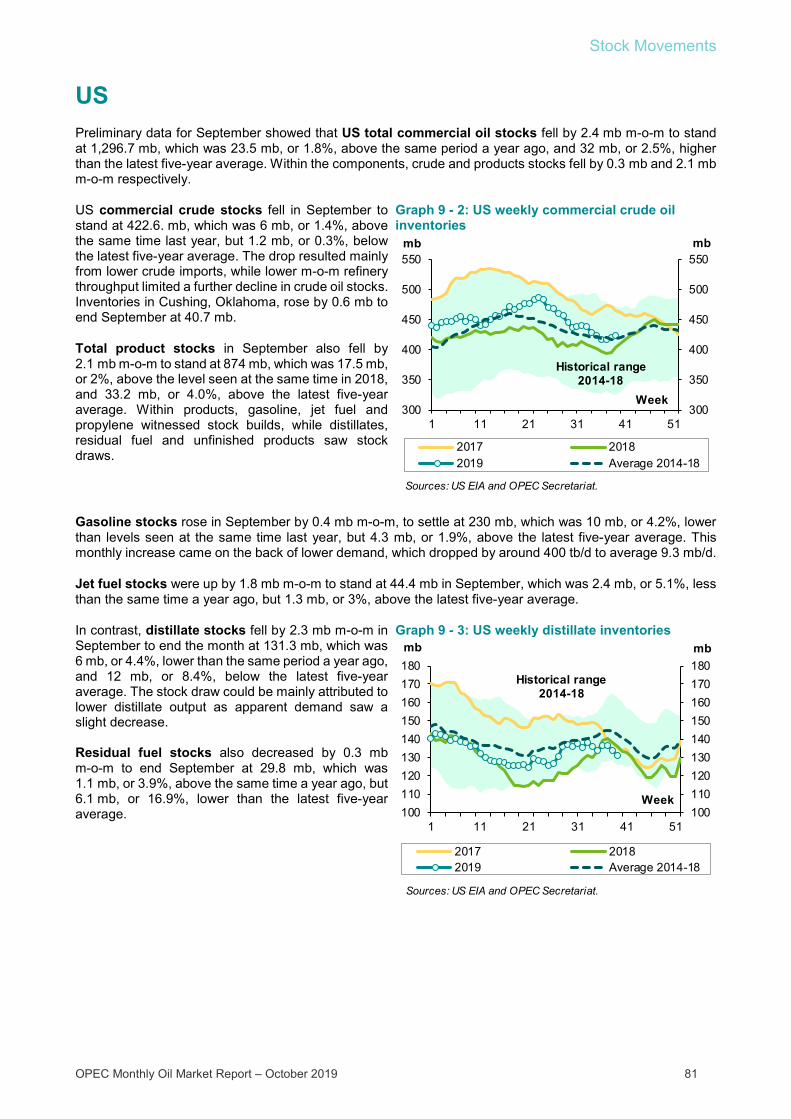
Stock Movements
OPEC Monthly Oil Market Report – October 2019 81
US Preliminary data for September showed that US total commercial oil stocks fell by 2.4 mb m-o-m to stand at 1,296.7 mb, which was 23.5 mb, or 1.8%, above the same period a year ago, and 32 mb, or 2.5%, higher than the latest five-year average. Within the components, crude and products stocks fell by 0.3 mb and 2.1 mb m-o-m respectively.
US commercial crude stocks fell in September to stand at 422.6. mb, which was 6 mb, or 1.4%, above the same time last year, but 1.2 mb, or 0.3%, below the latest five-year average. The drop resulted mainly from lower crude imports, while lower m-o-m refinery throughput limited a further decline in crude oil stocks. Inventories in Cushing, Oklahoma, rose by 0.6 mb to end September at 40.7 mb.
Total product stocks in September also fell by 2.1 mb m-o-m to stand at 874 mb, which was 17.5 mb, or 2%, above the level seen at the same time in 2018, and 33.2 mb, or 4.0%, above the latest five-year average. Within products, gasoline, jet fuel and propylene witnessed stock builds, while distillates, residual fuel and unfinished products saw stock draws.
Graph 9 - 2: US weekly commercial crude oil inventories
Gasoline stocks rose in September by 0.4 mb m-o-m, to settle at 230 mb, which was 10 mb, or 4.2%, lower than levels seen at the same time last year, but 4.3 mb, or 1.9%, above the latest five-year average. This monthly increase came on the back of lower demand, which dropped by around 400 tb/d to average 9.3 mb/d.
Jet fuel stocks were up by 1.8 mb m-o-m to stand at 44.4 mb in September, which was 2.4 mb, or 5.1%, less than the same time a year ago, but 1.3 mb, or 3%, above the latest five-year average.
In contrast, distillate stocks fell by 2.3 mb m-o-m in September to end the month at 131.3 mb, which was 6 mb, or 4.4%, lower than the same period a year ago, and 12 mb, or 8.4%, below the latest five-year average. The stock draw could be mainly attributed to lower distillate output as apparent demand saw a slight decrease. Residual fuel stocks also decreased by 0.3 mb m-o-m to end September at 29.8 mb, which was 1.1 mb, or 3.9%, above the same time a year ago, but 6.1 mb, or 16.9%, lower than the latest five-year average.
Graph 9 - 3: US weekly distillate inventories
300
350
400
450
500
550
300
350
400
450
500
550
1 11 21 31 41 51
mbmb
2017 20182019 Average 2014-18
Historical range2014-18
Sources: US EIA and OPEC Secretariat.
Week
100110120130140150160170180
100110120130140150160170180
1 11 21 31 41 51
mbmb
2017 20182019 Average 2014-18
Historical range2014-18
Sources: US EIA and OPEC Secretariat.
Week

Stock Movements
82 OPEC Monthly Oil Market Report – October 2019
Table 9 - 2: US onland commercial petroleum stocks, mb
Japan In Japan, total commercial oil stocks rose by 2.4 mb m-o-m in August to settle at 146.1 mb. The level was 7.1 mb, or 5.1%, higher than one year ago, but 9.2 mb, or 5.9%, below the latest five-year average. Within the components, crude stocks fell m-o-m by 2.6 mb, while product inventories rose by 5.0 mb.
Japanese commercial crude oil stocks fell by 2.6 mb m-o-m in August to stand at 81 mb, which was 2.8 mb, or 3.5%, above the same period a year ago, but 7.6 mb, or 8.6%, below the latest five-year average. The drop was driven mainly by higher refinery throughput outpacing the m-o-m increase in crude oil imports.
Graph 9 - 4: Japan’s commercial oil stocks
In contrast, Japan’s total product inventories rose by 5 mb m-o-m to end August at 65.1 mb, which was 4.3 mb, or 7.1%, higher than the same month last year, but 1.6 mb, or 2.4%, below the latest five-year average. Within the products, gasoline, distillates and naphtha stocks experienced stock builds, while residual fuel oil saw a stock draw.
Gasoline stocks rose by 0.4 mb m-o-m to stand at 10.1 mb in August, which was 0.1 mb, or 1.0 %, higher than a year ago, yet 0.1 mb, or 1.2 %, lower than the latest five-year average. The build was mainly driven by higher gasoline output, which increased by 12.7% from the previous month. Higher domestic sales, which increased by 11.9%, limited a further build in gasoline stocks.
Distillate stocks also rose by 4.7 mb m-o-m for the fourth consecutive month to stand at 31.4 mb in August. This was 1.8 mb, or 6.3% higher than the same time a year ago, but 0.4 mb, or 1.4%, lower than the latest five-year average. Within the distillate components, jet fuel and kerosene stocks rose by 14.8% and 26% m-o-m, respectively. Gasoil stocks also rose m-o-m in August by 8.5%. The build in all components was driven by higher output amid lower domestic sales.
In contrast, total residual fuel oil stocks fell by 0.1 mb m-o-m in August to stand at 12.3 mb, which was 0.6 mb, or 4.9%, below the same period a year ago, and 2.1 mb, or 14.7%, lower than the latest five-year average. Within the components, fuel oil A stocks rose by 3.1% on the back of lower domestic sales, while fuel B.C stocks fell m-o-m by 2.8%. The fall in fuel oil B.C stocks was driven by higher domestic sales.
ChangeJun 19 Jul 19 Aug 19 Aug 19/Jul 19 Aug 18
Crude oil 464.0 442.1 423.0 -19.1 407.6
Gasoline 229.7 235.2 229.6 -5.7 236.3 Distillate fuel 130.8 137.8 133.5 -4.3 132.3 Residual fuel oil 30.3 30.6 30.1 -0.5 27.8 Jet fuel 40.6 43.3 42.6 -0.6 41.8
Total products 846.2 872.6 876.1 3.5 826.2
Total 1,310.1 1,314.7 1,299.1 -15.6 1,233.8SPR 644.8 644.8 644.8 0.0 660.0
Sources: US EIA and OPEC Secretariat.
120
130
140
150
160
170
180
120
130
140
150
160
170
180Ja
n
Feb
Mar
Apr
May Jun
Jul
Aug
Sep Oct
Nov
Dec
mbmb
2017 2018 2019
Historical range2014-18
Sources: Ministry of Economic, Trade and Industry of Japanand OPEC Secretariat.
Avg. 2014-18

Stock Movements
OPEC Monthly Oil Market Report – October 2019 83
Table 9 - 3: Japan’s commercial oil stocks*, mb
EU plus Norway Preliminary data for August showed that total European commercial oil stocks rose by 8.1 mb m-o-m to stand at 1,092.9 mb, which was 15.9 mb, or 1.5%, above the same time a year ago, yet 19.3 mb, or 1.7%, lower than the latest five-year average. Within the components, crude stocks fell slightly by 0.2 mb and product stocks rose by 8.4 mb.
European crude inventories fell in August to stand at 481 mb, which was 1.8 mb, or 0.4%, higher than the same period a year ago, and 0.9 mb, or 0.2%, higher than the latest five-year average. The drop came despite lower throughput which dropped by 250 tb/d to 10.4 mb/d.
Graph 9 - 5: EU-15 plus Norway’s total oil stocks
In contrast, European total product stocks rose by 8.4 mb m-o-m, ending August at 611.9 mb, which was 14.1 mb, or 2.4%, higher than the same time a year ago, but 20.2 mb, or 3.2%, lower than the latest five-year average. The build in products stocks could be attributed to lower demand in the region. Within products, all witnessed a stock build.
Gasoline stocks rose by 1.8 mb m-o-m in August reversing the drop of the last five months to stand at 109.9 mb, which was 6.5 mb, or 6.2%, higher than the same time a year ago, and 1.2 mb, or 1.1%, above the latest five-year average.
Distillate stocks rose by 4.8 mb m-o-m in August for the third consecutive month to stand at 413.4 mb, which was 7.4 mb, or 1.8%, higher than the same time last year, albeit 13.9 mb, or 3.2%, below the latest five-year average.
Residual fuel and naphtha stocks rose in August by 0.3 mb and 1.6 mb, m-o-m, respectively. At 60.4 mb, residual fuel stood at 1.2 mb, or 1.9%, lower than the same time one year ago, and 10.5 mb, or 14.8%, below the latest five-year average. Naphtha stocks ended August at 28.2 mb, which was 1.4 mb, or 5.3%, above than last year’s August level and 3 mb, or 11.8%, higher than the latest five-year average.
ChangeJun 19 Jul 19 Aug 19 Aug 19/Jul 19 Aug 18
Crude oil 82.1 83.7 81.0 -2.6 78.3
Gasoline 9.5 9.7 10.1 0.4 10.0 Naphtha 10.7 11.3 11.4 0.1 8.3 Middle distillates 23.9 26.7 31.4 4.7 29.5 Residual fuel oil 12.6 12.4 12.3 -0.1 12.9
Total products 56.7 60.1 65.1 5.0 60.8Total** 138.9 143.7 146.1 2.4 139.0
Note: * At the end of the month. ** Includes crude oil and main products only.Sources: Ministry of Economy, Trade and Industry of Japan and OPEC Secretariat.
1,0401,0601,0801,1001,1201,1401,1601,1801,200
1,0401,0601,0801,1001,1201,1401,1601,1801,200
Jan
Feb
Mar
Apr
May Jun
Jul
Aug
Sep Oct
Nov
Dec
mbmb
2017 2018 2019
Historical range2014-18
Sources: Argus, Euroilstock and OPEC Secretariat.
Avg. 2014-18
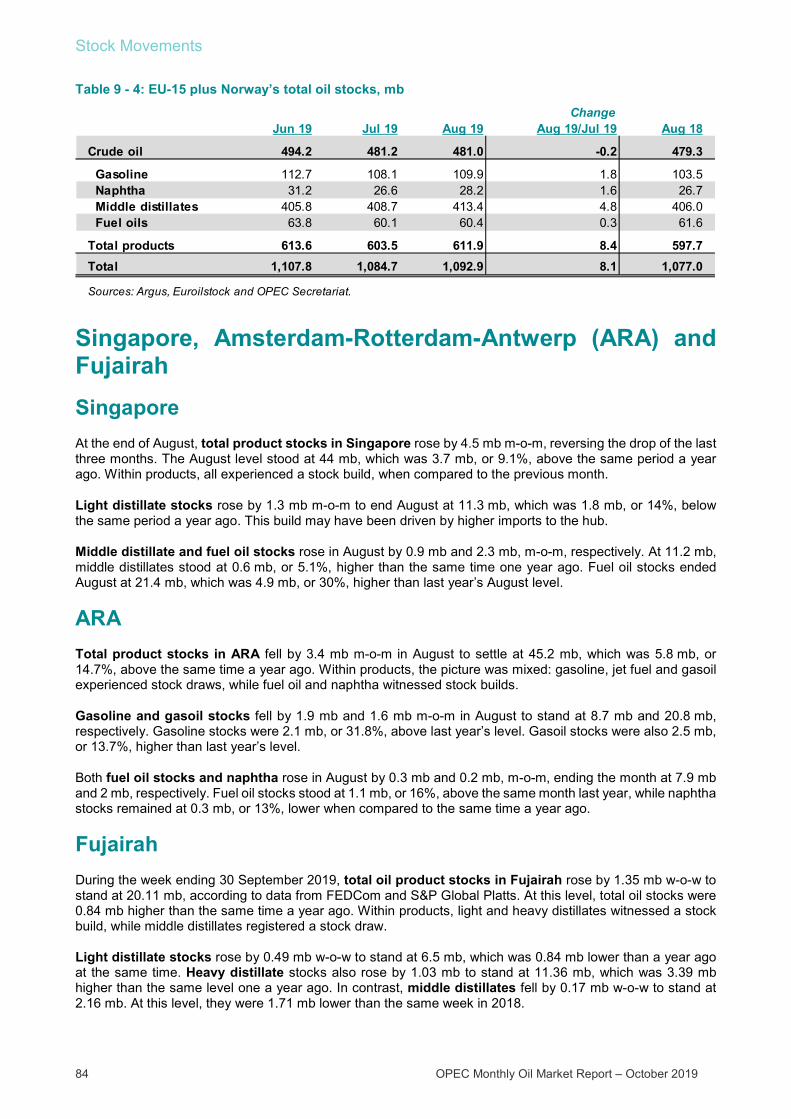
Stock Movements
84 OPEC Monthly Oil Market Report – October 2019
Table 9 - 4: EU-15 plus Norway’s total oil stocks, mb
Singapore, Amsterdam-Rotterdam-Antwerp (ARA) and Fujairah Singapore At the end of August, total product stocks in Singapore rose by 4.5 mb m-o-m, reversing the drop of the last three months. The August level stood at 44 mb, which was 3.7 mb, or 9.1%, above the same period a year ago. Within products, all experienced a stock build, when compared to the previous month.
Light distillate stocks rose by 1.3 mb m-o-m to end August at 11.3 mb, which was 1.8 mb, or 14%, below the same period a year ago. This build may have been driven by higher imports to the hub.
Middle distillate and fuel oil stocks rose in August by 0.9 mb and 2.3 mb, m-o-m, respectively. At 11.2 mb, middle distillates stood at 0.6 mb, or 5.1%, higher than the same time one year ago. Fuel oil stocks ended August at 21.4 mb, which was 4.9 mb, or 30%, higher than last year’s August level.
ARA Total product stocks in ARA fell by 3.4 mb m-o-m in August to settle at 45.2 mb, which was 5.8 mb, or 14.7%, above the same time a year ago. Within products, the picture was mixed: gasoline, jet fuel and gasoil experienced stock draws, while fuel oil and naphtha witnessed stock builds.
Gasoline and gasoil stocks fell by 1.9 mb and 1.6 mb m-o-m in August to stand at 8.7 mb and 20.8 mb, respectively. Gasoline stocks were 2.1 mb, or 31.8%, above last year’s level. Gasoil stocks were also 2.5 mb, or 13.7%, higher than last year’s level.
Both fuel oil stocks and naphtha rose in August by 0.3 mb and 0.2 mb, m-o-m, ending the month at 7.9 mb and 2 mb, respectively. Fuel oil stocks stood at 1.1 mb, or 16%, above the same month last year, while naphtha stocks remained at 0.3 mb, or 13%, lower when compared to the same time a year ago.
Fujairah During the week ending 30 September 2019, total oil product stocks in Fujairah rose by 1.35 mb w-o-w to stand at 20.11 mb, according to data from FEDCom and S&P Global Platts. At this level, total oil stocks were 0.84 mb higher than the same time a year ago. Within products, light and heavy distillates witnessed a stock build, while middle distillates registered a stock draw.
Light distillate stocks rose by 0.49 mb w-o-w to stand at 6.5 mb, which was 0.84 mb lower than a year ago at the same time. Heavy distillate stocks also rose by 1.03 mb to stand at 11.36 mb, which was 3.39 mb higher than the same level one a year ago. In contrast, middle distillates fell by 0.17 mb w-o-w to stand at 2.16 mb. At this level, they were 1.71 mb lower than the same week in 2018.
ChangeJun 19 Jul 19 Aug 19 Aug 19/Jul 19 Aug 18
Crude oil 494.2 481.2 481.0 -0.2 479.3
Gasoline 112.7 108.1 109.9 1.8 103.5 Naphtha 31.2 26.6 28.2 1.6 26.7 Middle distillates 405.8 408.7 413.4 4.8 406.0 Fuel oils 63.8 60.1 60.4 0.3 61.6
Total products 613.6 603.5 611.9 8.4 597.7Total 1,107.8 1,084.7 1,092.9 8.1 1,077.0
Sources: Argus, Euroilstock and OPEC Secretariat.

Balance of Supply and Demand
OPEC Monthly Oil Market Report – October 2019 85
Balance of Supply and Demand
Demand for OPEC crude in 2019 was revised up by 0.1 mb/d from the previous report to stand at 30.7 mb/d, which is 0.9 mb/d lower than the 2018 level.
Demand for OPEC crude in 2020 was revised up by 0.2 mb/d from the previous report, to stand at 29.6 mb/d. This is 1.2 mb/d lower than the 2019 level.
Balance of supply and demand in 2019 Demand for OPEC crude in 2019 was revised up by 0.1 mb/d from the previous report to stand at 30.7 mb/d, which is 0.9 mb/d lower than the 2018 level.
Compared with the previous monthly report, both 1Q19 and 2Q19 were revised down by 0.1 mb/d each, while 3Q19 and 4Q19 were revised up by 0.4 mb/d and 0.3 mb/d, respectively.
When compared to the same quarters in 2018, demand for OPEC crude in 1Q19 and 2Q19 were 1.9 mb/d and 1.4 mb/d lower. The 3Q19 remained at the same level as 3Q18, while 4Q19 is expected to show a drop of 0.2 mb/d.
According to secondary sources, OPEC crude production averaged 30.5 mb/d in 1Q19, about 0.4 mb/d higher than the demand for OPEC crude in the same period, while in 2Q19 OPEC crude production averaged 30.0 mb/d, around 0.4 mb/d lower than the demand for OPEC crude. In 3Q19 OPEC crude production averaged 29.3 mb/d, around 2.5 mb/d lower than the “demand for OPEC crude”. This relatively high figure reflects preliminary
Graph 10 - 1: Balance of supply and demand, 2019-2020*
data for world oil demand and non-OPEC supply for the first three quarters of 2019, as well as the available secondary sources for OPEC production. Going forward, this number will be adjusted further as more data becomes available.
Table 10 - 1: Supply/demand balance for 2019, mb/d
28
30
32
34
28
30
32
341Q
19
2Q19
3Q19
4Q19
1Q20
2Q20
3Q20
4Q20
mb/dmb/d
OPEC crude production
Demand for OPEC crude
Note: * 2019-2020 = Forecast.Source: OPEC Secretariat.
Change2018 1Q19 2Q19 3Q19 4Q19 2019 2019/18
(a) World oil demand 98.82 98.65 98.93 100.70 100.89 99.80 0.98 Non-OPEC supply 62.44 63.76 63.76 64.11 65.39 64.26 1.82 OPEC NGLs and non-conventionals 4.76 4.80 4.82 4.76 4.86 4.81 0.05
(b) Total non-OPEC supply and OPEC NGLs 67.20 68.56 68.58 68.87 70.24 69.07 1.87
Difference (a-b) 31.62 30.09 30.34 31.82 30.65 30.73 -0.89
OPEC crude oil production 31.86 30.48 29.98 29.31 #VALUE!Balance 0.24 0.39 -0.36 -2.51 * #VALUE!
Notes: * 3Q19 balance reflects preliminary data for world oil demand and non-OPEC supply for the first three quarters of 2019, as well as the availab le secondary sources for OPEC production. Totals may not add up due to independent rounding.Source: OPEC Secretariat.
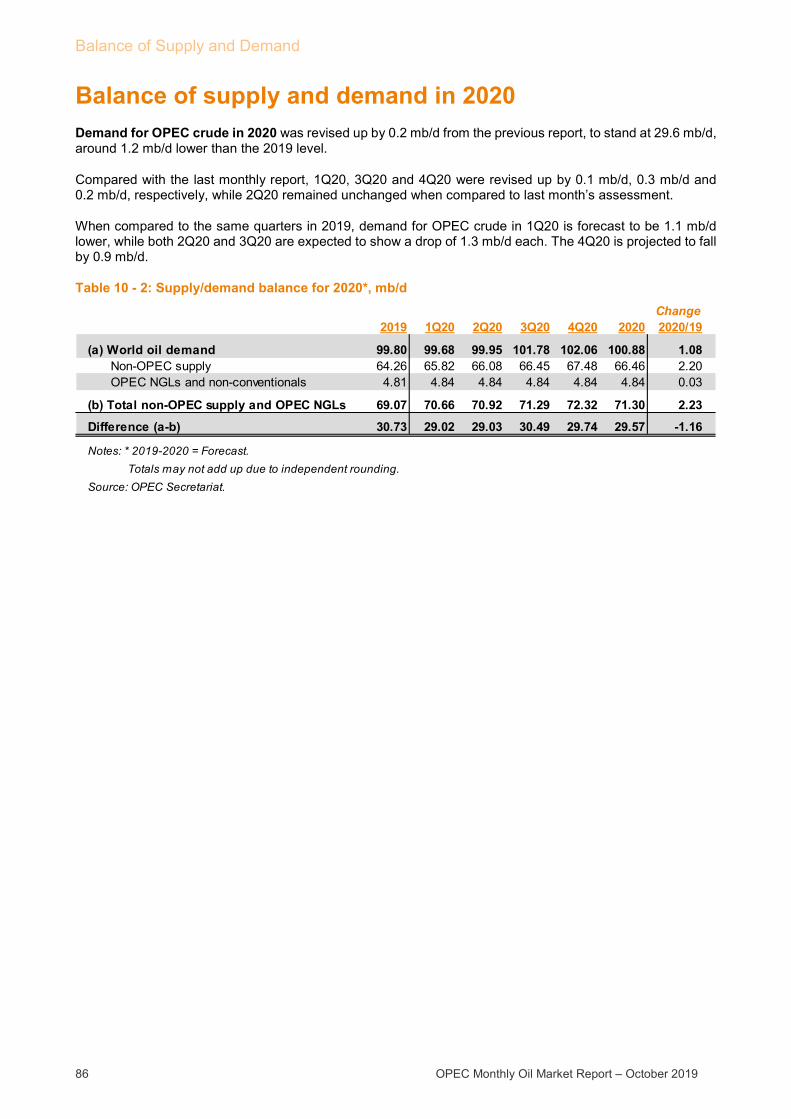
Balance of Supply and Demand
86 OPEC Monthly Oil Market Report – October 2019
Balance of supply and demand in 2020 Demand for OPEC crude in 2020 was revised up by 0.2 mb/d from the previous report, to stand at 29.6 mb/d, around 1.2 mb/d lower than the 2019 level.
Compared with the last monthly report, 1Q20, 3Q20 and 4Q20 were revised up by 0.1 mb/d, 0.3 mb/d and 0.2 mb/d, respectively, while 2Q20 remained unchanged when compared to last month’s assessment.
When compared to the same quarters in 2019, demand for OPEC crude in 1Q20 is forecast to be 1.1 mb/d lower, while both 2Q20 and 3Q20 are expected to show a drop of 1.3 mb/d each. The 4Q20 is projected to fall by 0.9 mb/d.
Table 10 - 2: Supply/demand balance for 2020*, mb/d
Change2019 1Q20 2Q20 3Q20 4Q20 2020 2020/19
(a) World oil demand 99.80 99.68 99.95 101.78 102.06 100.88 1.08 Non-OPEC supply 64.26 65.82 66.08 66.45 67.48 66.46 2.20 OPEC NGLs and non-conventionals 4.81 4.84 4.84 4.84 4.84 4.84 0.03
(b) Total non-OPEC supply and OPEC NGLs 69.07 70.66 70.92 71.29 72.32 71.30 2.23
Difference (a-b) 30.73 29.02 29.03 30.49 29.74 29.57 -1.16
Notes: * 2019-2020 = Forecast. Totals may not add up due to independent rounding.Source: OPEC Secretariat.

Appendix
OPEC Monthly Oil Market Report – October 2019 87
Appendix
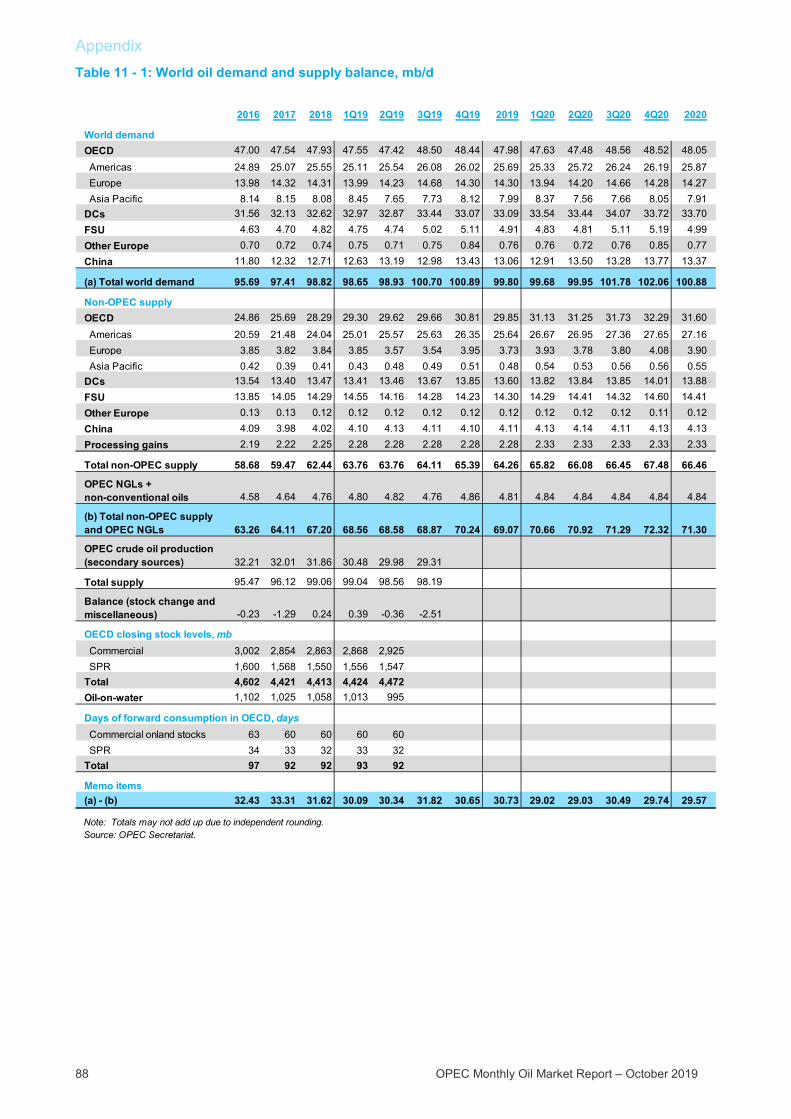
Appendix
88 OPEC Monthly Oil Market Report – October 2019
Table 11 - 1: World oil demand and supply balance, mb/d
2016 2017 2018 1Q19 2Q19 3Q19 4Q19 2019 1Q20 2Q20 3Q20 4Q20 2020
World demandOECD 47.00 47.54 47.93 47.55 47.42 48.50 48.44 47.98 47.63 47.48 48.56 48.52 48.05
Americas 24.89 25.07 25.55 25.11 25.54 26.08 26.02 25.69 25.33 25.72 26.24 26.19 25.87 Europe 13.98 14.32 14.31 13.99 14.23 14.68 14.30 14.30 13.94 14.20 14.66 14.28 14.27 Asia Pacific 8.14 8.15 8.08 8.45 7.65 7.73 8.12 7.99 8.37 7.56 7.66 8.05 7.91DCs 31.56 32.13 32.62 32.97 32.87 33.44 33.07 33.09 33.54 33.44 34.07 33.72 33.70FSU 4.63 4.70 4.82 4.75 4.74 5.02 5.11 4.91 4.83 4.81 5.11 5.19 4.99Other Europe 0.70 0.72 0.74 0.75 0.71 0.75 0.84 0.76 0.76 0.72 0.76 0.85 0.77China 11.80 12.32 12.71 12.63 13.19 12.98 13.43 13.06 12.91 13.50 13.28 13.77 13.37
(a) Total world demand 95.69 97.41 98.82 98.65 98.93 100.70 100.89 99.80 99.68 99.95 101.78 102.06 100.88
Non-OPEC supplyOECD 24.86 25.69 28.29 29.30 29.62 29.66 30.81 29.85 31.13 31.25 31.73 32.29 31.60
Americas 20.59 21.48 24.04 25.01 25.57 25.63 26.35 25.64 26.67 26.95 27.36 27.65 27.16 Europe 3.85 3.82 3.84 3.85 3.57 3.54 3.95 3.73 3.93 3.78 3.80 4.08 3.90 Asia Pacific 0.42 0.39 0.41 0.43 0.48 0.49 0.51 0.48 0.54 0.53 0.56 0.56 0.55DCs 13.54 13.40 13.47 13.41 13.46 13.67 13.85 13.60 13.82 13.84 13.85 14.01 13.88FSU 13.85 14.05 14.29 14.55 14.16 14.28 14.23 14.30 14.29 14.41 14.32 14.60 14.41Other Europe 0.13 0.13 0.12 0.12 0.12 0.12 0.12 0.12 0.12 0.12 0.12 0.11 0.12China 4.09 3.98 4.02 4.10 4.13 4.11 4.10 4.11 4.13 4.14 4.11 4.13 4.13Processing gains 2.19 2.22 2.25 2.28 2.28 2.28 2.28 2.28 2.33 2.33 2.33 2.33 2.33
Total non-OPEC supply 58.68 59.47 62.44 63.76 63.76 64.11 65.39 64.26 65.82 66.08 66.45 67.48 66.46
OPEC NGLs + non-conventional oils 4.58 4.64 4.76 4.80 4.82 4.76 4.86 4.81 4.84 4.84 4.84 4.84 4.84
(b) Total non-OPEC supply and OPEC NGLs 63.26 64.11 67.20 68.56 68.58 68.87 70.24 69.07 70.66 70.92 71.29 72.32 71.30
OPEC crude oil production (secondary sources) 32.21 32.01 31.86 30.48 29.98 29.31
Total supply 95.47 96.12 99.06 99.04 98.56 98.19
Balance (stock change and miscellaneous) -0.23 -1.29 0.24 0.39 -0.36 -2.51
OECD closing stock levels, mb Commercial 3,002 2,854 2,863 2,868 2,925 SPR 1,600 1,568 1,550 1,556 1,547Total 4,602 4,421 4,413 4,424 4,472Oil-on-water 1,102 1,025 1,058 1,013 995
Days of forward consumption in OECD, days Commercial onland stocks 63 60 60 60 60 SPR 34 33 32 33 32Total 97 92 92 93 92
Memo items(a) - (b) 32.43 33.31 31.62 30.09 30.34 31.82 30.65 30.73 29.02 29.03 30.49 29.74 29.57
Note: Totals may not add up due to independent rounding.Source: OPEC Secretariat.

Appendix
OPEC Monthly Oil Market Report – October 2019 89
Table 11 - 2: World oil demand and supply balance: changes from last month's table*, mb/d
2016 2017 2018 1Q19 2Q19 3Q19 4Q19 2019 1Q20 2Q20 3Q20 4Q20 2020
World demandOECD - - - -0.10 -0.09 - - -0.05 -0.10 -0.09 - - -0.05Americas - - - -0.10 -0.12 - - -0.05 -0.10 -0.12 - - -0.05Europe - - - 0.02 0.05 - - 0.02 0.02 0.05 - - 0.02Asia Pacific - - - -0.02 -0.02 - - -0.01 -0.02 -0.02 - - -0.01DCs - - - - -0.06 0.07 - - - -0.06 0.07 - -FSU - - - - - - - - - - - - -Other Europe - - - - - - - - - - - - -China - - - - - - - - - - - - -
(a) Total world demand - - - -0.10 -0.15 0.07 - -0.04 -0.10 -0.15 0.07 - -0.04
Non-OPEC supplyOECD 0.01 - 0.03 0.01 -0.02 -0.47 -0.21 -0.17 -0.17 -0.17 -0.17 -0.17 -0.17Americas 0.01 - 0.02 - 0.01 -0.27 -0.21 -0.12 -0.12 -0.12 -0.12 -0.12 -0.12Europe - - 0.01 0.01 -0.03 -0.19 - -0.05 -0.05 -0.05 -0.05 -0.05 -0.05Asia Pacific - - - - - - - - - - - - -DCs 0.01 0.01 -0.01 -0.02 -0.01 -0.06 - -0.02 -0.02 -0.02 -0.02 -0.02 -0.02FSU - - - - - 0.21 -0.05 0.04 -0.04 -0.03 -0.03 -0.03 -0.03Other Europe - - - - - - - - - - - - -China - - - - - 0.06 - 0.02 0.02 0.07 0.04 0.02 0.03Processing gains - - - - - - - - - - - - -
Total non-OPEC supply 0.01 0.01 0.02 -0.01 -0.03 -0.25 -0.26 -0.14 -0.22 -0.15 -0.18 -0.20 -0.19
OPEC NGLs + non-conventionals - - - - - -0.11 - -0.03 -0.03 -0.03 -0.03 -0.03 -0.03
(b) Total non-OPEC supply and OPEC NGLs 0.01 0.01 0.02 -0.01 -0.03 -0.36 -0.26 -0.17 -0.24 -0.18 -0.21 -0.23 -0.22
OPEC crude oil production (secondary sources) - - - - 0.01Total supply 0.01 0.01 0.02 - -0.02
Balance (stock change and miscellaneous) 0.01 0.01 0.02 0.10 0.13
OECD closing stock levels (mb) Commercial - - -9 -5 -30 SPR - - 3 4 7 Total - - -6 -1 -23Oil-on-water - - - - -
Days of forward consumption in OECDCommercial onland stocks - - - - -1SPR - - - - -Total - - - - -
Memo items
(a) - (b) -0.01 -0.01 -0.02 -0.09 -0.12 0.43 0.26 0.12 0.14 0.03 0.28 0.23 0.17
Note: * This compares Table 11 - 1 in this issue of the MOMR with Table 11 - 1 in the September 2019 issue.
This table shows only where changes have occurred.
Source: OPEC Secretariat.
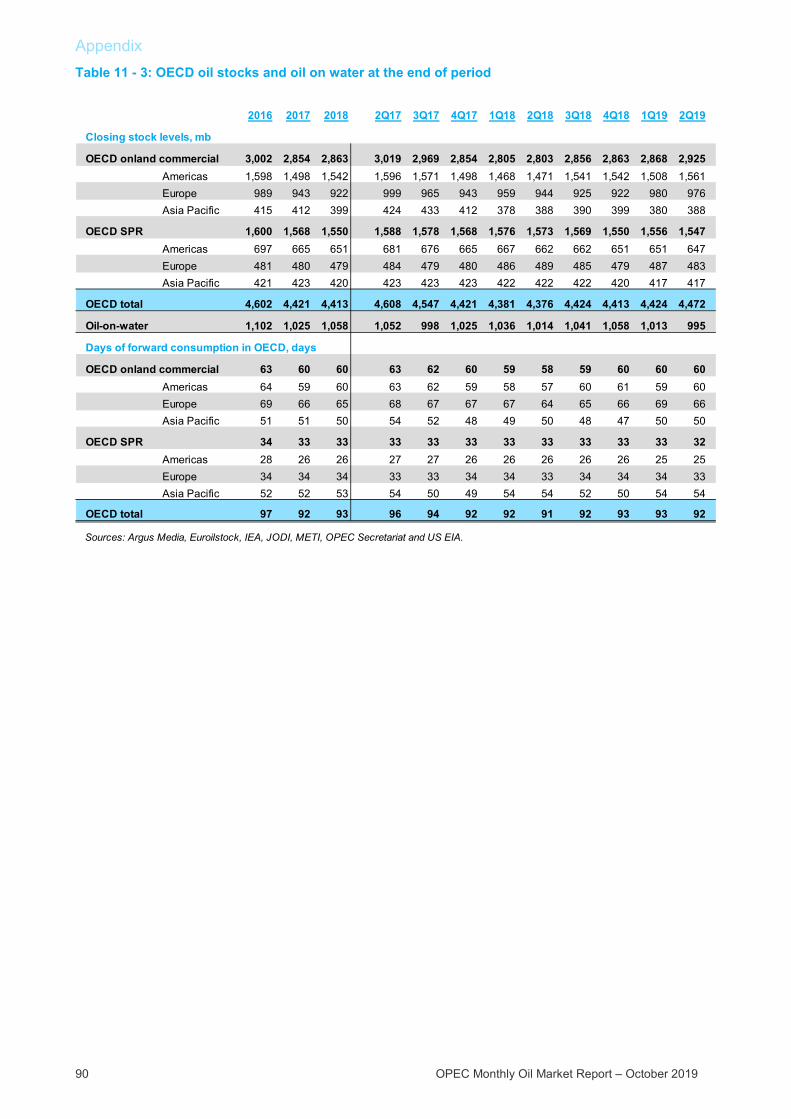
Appendix
90 OPEC Monthly Oil Market Report – October 2019
Table 11 - 3: OECD oil stocks and oil on water at the end of period
2016 2017 2018 2Q17 3Q17 4Q17 1Q18 2Q18 3Q18 4Q18 1Q19 2Q19
Closing stock levels, mb
OECD onland commercial 3,002 2,854 2,863 3,019 2,969 2,854 2,805 2,803 2,856 2,863 2,868 2,925Americas 1,598 1,498 1,542 1,596 1,571 1,498 1,468 1,471 1,541 1,542 1,508 1,561Europe 989 943 922 999 965 943 959 944 925 922 980 976Asia Pacific 415 412 399 424 433 412 378 388 390 399 380 388
OECD SPR 1,600 1,568 1,550 1,588 1,578 1,568 1,576 1,573 1,569 1,550 1,556 1,547Americas 697 665 651 681 676 665 667 662 662 651 651 647Europe 481 480 479 484 479 480 486 489 485 479 487 483Asia Pacific 421 423 420 423 423 423 422 422 422 420 417 417
OECD total 4,602 4,421 4,413 4,608 4,547 4,421 4,381 4,376 4,424 4,413 4,424 4,472
Oil-on-water 1,102 1,025 1,058 1,052 998 1,025 1,036 1,014 1,041 1,058 1,013 995
Days of forward consumption in OECD, days
OECD onland commercial 63 60 60 63 62 60 59 58 59 60 60 60Americas 64 59 60 63 62 59 58 57 60 61 59 60Europe 69 66 65 68 67 67 67 64 65 66 69 66Asia Pacific 51 51 50 54 52 48 49 50 48 47 50 50
OECD SPR 34 33 33 33 33 33 33 33 33 33 33 32Americas 28 26 26 27 27 26 26 26 26 26 25 25Europe 34 34 34 33 33 34 34 33 34 34 34 33Asia Pacific 52 52 53 54 50 49 54 54 52 50 54 54
OECD total 97 92 93 96 94 92 92 91 92 93 93 92
Sources: Argus Media, Euroilstock, IEA, JODI, METI, OPEC Secretariat and US EIA.
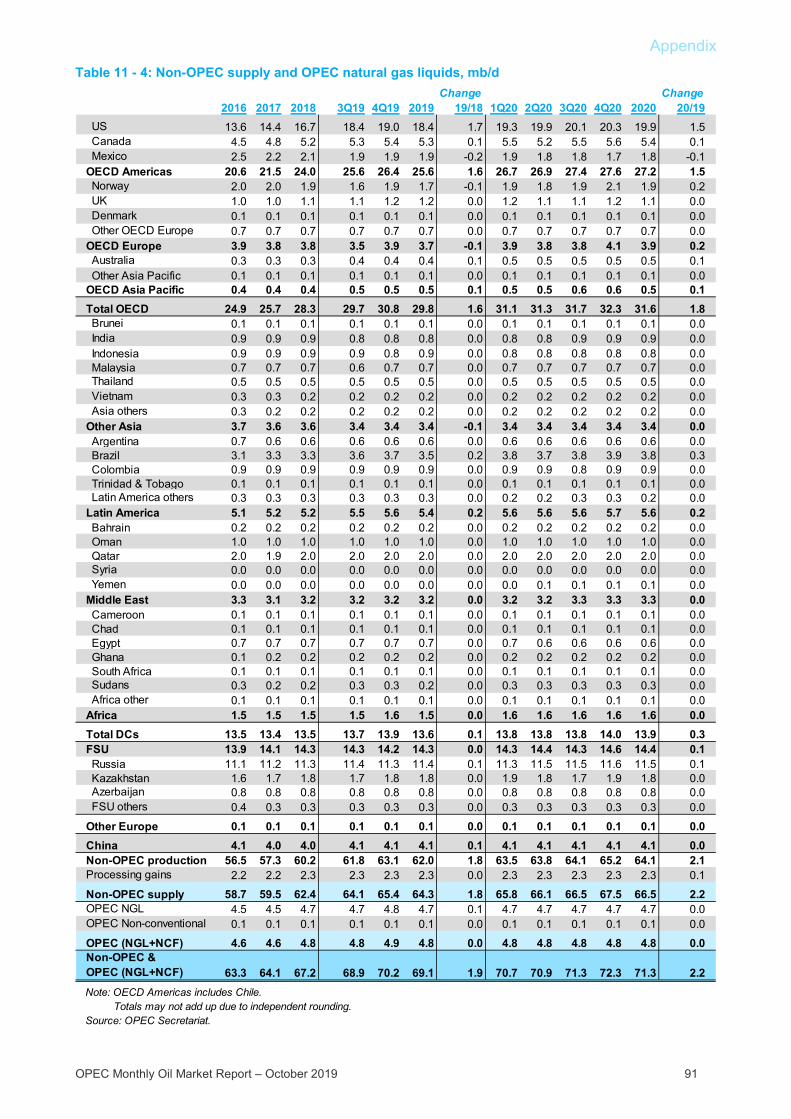
Appendix
OPEC Monthly Oil Market Report – October 2019 91
Table 11 - 4: Non-OPEC supply and OPEC natural gas liquids, mb/d
Change Change2016 2017 2018 3Q19 4Q19 2019 19/18 1Q20 2Q20 3Q20 4Q20 2020 20/19
US 13.6 14.4 16.7 18.4 19.0 18.4 1.7 19.3 19.9 20.1 20.3 19.9 1.5 Canada 4.5 4.8 5.2 5.3 5.4 5.3 0.1 5.5 5.2 5.5 5.6 5.4 0.1 Mexico 2.5 2.2 2.1 1.9 1.9 1.9 -0.2 1.9 1.8 1.8 1.7 1.8 -0.1OECD Americas 20.6 21.5 24.0 25.6 26.4 25.6 1.6 26.7 26.9 27.4 27.6 27.2 1.5 Norway 2.0 2.0 1.9 1.6 1.9 1.7 -0.1 1.9 1.8 1.9 2.1 1.9 0.2 UK 1.0 1.0 1.1 1.1 1.2 1.2 0.0 1.2 1.1 1.1 1.2 1.1 0.0 Denmark 0.1 0.1 0.1 0.1 0.1 0.1 0.0 0.1 0.1 0.1 0.1 0.1 0.0 Other OECD Europe 0.7 0.7 0.7 0.7 0.7 0.7 0.0 0.7 0.7 0.7 0.7 0.7 0.0OECD Europe 3.9 3.8 3.8 3.5 3.9 3.7 -0.1 3.9 3.8 3.8 4.1 3.9 0.2 Australia 0.3 0.3 0.3 0.4 0.4 0.4 0.1 0.5 0.5 0.5 0.5 0.5 0.1 Other Asia Pacific 0.1 0.1 0.1 0.1 0.1 0.1 0.0 0.1 0.1 0.1 0.1 0.1 0.0OECD Asia Pacific 0.4 0.4 0.4 0.5 0.5 0.5 0.1 0.5 0.5 0.6 0.6 0.5 0.1Total OECD 24.9 25.7 28.3 29.7 30.8 29.8 1.6 31.1 31.3 31.7 32.3 31.6 1.8 Brunei 0.1 0.1 0.1 0.1 0.1 0.1 0.0 0.1 0.1 0.1 0.1 0.1 0.0 India 0.9 0.9 0.9 0.8 0.8 0.8 0.0 0.8 0.8 0.9 0.9 0.9 0.0 Indonesia 0.9 0.9 0.9 0.9 0.8 0.9 0.0 0.8 0.8 0.8 0.8 0.8 0.0 Malaysia 0.7 0.7 0.7 0.6 0.7 0.7 0.0 0.7 0.7 0.7 0.7 0.7 0.0 Thailand 0.5 0.5 0.5 0.5 0.5 0.5 0.0 0.5 0.5 0.5 0.5 0.5 0.0 Vietnam 0.3 0.3 0.2 0.2 0.2 0.2 0.0 0.2 0.2 0.2 0.2 0.2 0.0 Asia others 0.3 0.2 0.2 0.2 0.2 0.2 0.0 0.2 0.2 0.2 0.2 0.2 0.0Other Asia 3.7 3.6 3.6 3.4 3.4 3.4 -0.1 3.4 3.4 3.4 3.4 3.4 0.0 Argentina 0.7 0.6 0.6 0.6 0.6 0.6 0.0 0.6 0.6 0.6 0.6 0.6 0.0 Brazil 3.1 3.3 3.3 3.6 3.7 3.5 0.2 3.8 3.7 3.8 3.9 3.8 0.3 Colombia 0.9 0.9 0.9 0.9 0.9 0.9 0.0 0.9 0.9 0.8 0.9 0.9 0.0 Trinidad & Tobago 0.1 0.1 0.1 0.1 0.1 0.1 0.0 0.1 0.1 0.1 0.1 0.1 0.0 Latin America others 0.3 0.3 0.3 0.3 0.3 0.3 0.0 0.2 0.2 0.3 0.3 0.2 0.0Latin America 5.1 5.2 5.2 5.5 5.6 5.4 0.2 5.6 5.6 5.6 5.7 5.6 0.2 Bahrain 0.2 0.2 0.2 0.2 0.2 0.2 0.0 0.2 0.2 0.2 0.2 0.2 0.0 Oman 1.0 1.0 1.0 1.0 1.0 1.0 0.0 1.0 1.0 1.0 1.0 1.0 0.0 Qatar 2.0 1.9 2.0 2.0 2.0 2.0 0.0 2.0 2.0 2.0 2.0 2.0 0.0 Syria 0.0 0.0 0.0 0.0 0.0 0.0 0.0 0.0 0.0 0.0 0.0 0.0 0.0 Yemen 0.0 0.0 0.0 0.0 0.0 0.0 0.0 0.0 0.1 0.1 0.1 0.1 0.0Middle East 3.3 3.1 3.2 3.2 3.2 3.2 0.0 3.2 3.2 3.3 3.3 3.3 0.0 Cameroon 0.1 0.1 0.1 0.1 0.1 0.1 0.0 0.1 0.1 0.1 0.1 0.1 0.0 Chad 0.1 0.1 0.1 0.1 0.1 0.1 0.0 0.1 0.1 0.1 0.1 0.1 0.0 Egypt 0.7 0.7 0.7 0.7 0.7 0.7 0.0 0.7 0.6 0.6 0.6 0.6 0.0 Ghana 0.1 0.2 0.2 0.2 0.2 0.2 0.0 0.2 0.2 0.2 0.2 0.2 0.0 South Africa 0.1 0.1 0.1 0.1 0.1 0.1 0.0 0.1 0.1 0.1 0.1 0.1 0.0 Sudans 0.3 0.2 0.2 0.3 0.3 0.2 0.0 0.3 0.3 0.3 0.3 0.3 0.0 Africa other 0.1 0.1 0.1 0.1 0.1 0.1 0.0 0.1 0.1 0.1 0.1 0.1 0.0Africa 1.5 1.5 1.5 1.5 1.6 1.5 0.0 1.6 1.6 1.6 1.6 1.6 0.0Total DCs 13.5 13.4 13.5 13.7 13.9 13.6 0.1 13.8 13.8 13.8 14.0 13.9 0.3FSU 13.9 14.1 14.3 14.3 14.2 14.3 0.0 14.3 14.4 14.3 14.6 14.4 0.1 Russia 11.1 11.2 11.3 11.4 11.3 11.4 0.1 11.3 11.5 11.5 11.6 11.5 0.1 Kazakhstan 1.6 1.7 1.8 1.7 1.8 1.8 0.0 1.9 1.8 1.7 1.9 1.8 0.0 Azerbaijan 0.8 0.8 0.8 0.8 0.8 0.8 0.0 0.8 0.8 0.8 0.8 0.8 0.0 FSU others 0.4 0.3 0.3 0.3 0.3 0.3 0.0 0.3 0.3 0.3 0.3 0.3 0.0
Other Europe 0.1 0.1 0.1 0.1 0.1 0.1 0.0 0.1 0.1 0.1 0.1 0.1 0.0China 4.1 4.0 4.0 4.1 4.1 4.1 0.1 4.1 4.1 4.1 4.1 4.1 0.0Non-OPEC production 56.5 57.3 60.2 61.8 63.1 62.0 1.8 63.5 63.8 64.1 65.2 64.1 2.1Processing gains 2.2 2.2 2.3 2.3 2.3 2.3 0.0 2.3 2.3 2.3 2.3 2.3 0.1
Non-OPEC supply 58.7 59.5 62.4 64.1 65.4 64.3 1.8 65.8 66.1 66.5 67.5 66.5 2.2OPEC NGL 4.5 4.5 4.7 4.7 4.8 4.7 0.1 4.7 4.7 4.7 4.7 4.7 0.0OPEC Non-conventional 0.1 0.1 0.1 0.1 0.1 0.1 0.0 0.1 0.1 0.1 0.1 0.1 0.0
OPEC (NGL+NCF) 4.6 4.6 4.8 4.8 4.9 4.8 0.0 4.8 4.8 4.8 4.8 4.8 0.0Non-OPEC & OPEC (NGL+NCF) 63.3 64.1 67.2 68.9 70.2 69.1 1.9 70.7 70.9 71.3 72.3 71.3 2.2
Totals may not add up due to independent rounding.Source: OPEC Secretariat.
Note: OECD Americas includes Chile.
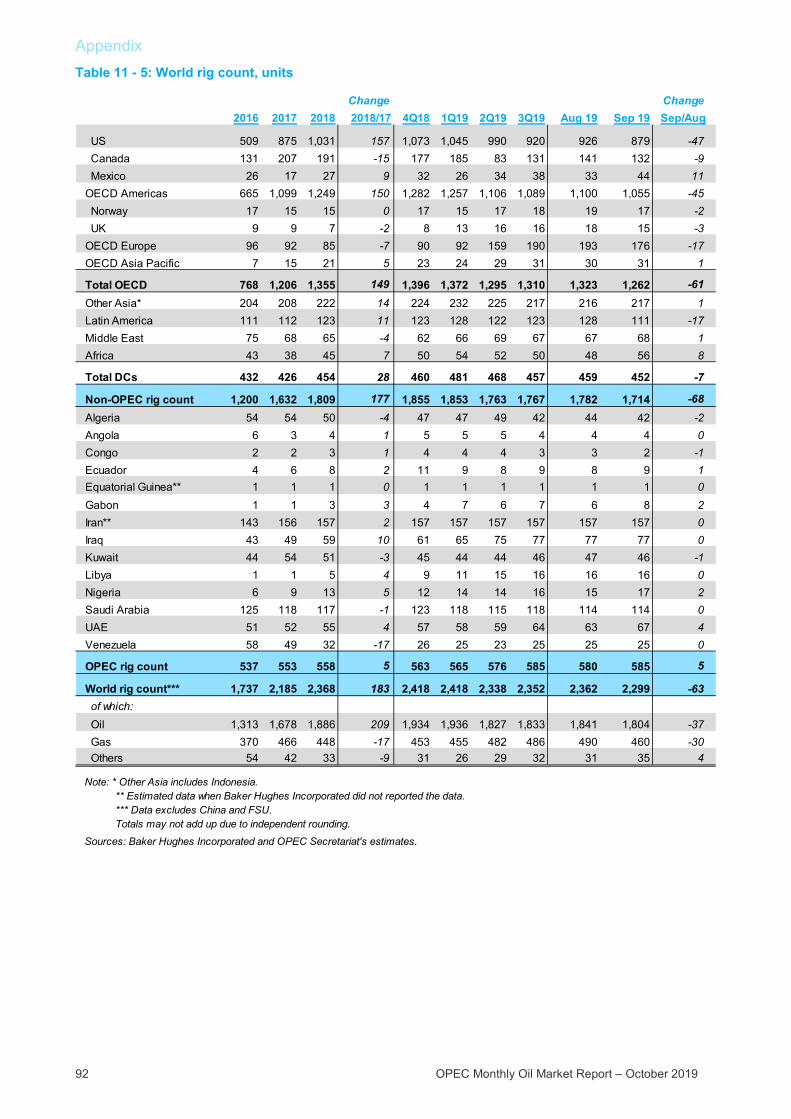
Appendix
92 OPEC Monthly Oil Market Report – October 2019
Table 11 - 5: World rig count, units
Change Change2016 2017 2018 2018/17 4Q18 1Q19 2Q19 3Q19 Aug 19 Sep 19 Sep/Aug
US 509 875 1,031 157 1,073 1,045 990 920 926 879 -47 Canada 131 207 191 -15 177 185 83 131 141 132 -9 Mexico 26 17 27 9 32 26 34 38 33 44 11OECD Americas 665 1,099 1,249 150 1,282 1,257 1,106 1,089 1,100 1,055 -45 Norway 17 15 15 0 17 15 17 18 19 17 -2 UK 9 9 7 -2 8 13 16 16 18 15 -3OECD Europe 96 92 85 -7 90 92 159 190 193 176 -17OECD Asia Pacific 7 15 21 5 23 24 29 31 30 31 1
Total OECD 768 1,206 1,355 149 1,396 1,372 1,295 1,310 1,323 1,262 -61Other Asia* 204 208 222 14 224 232 225 217 216 217 1Latin America 111 112 123 11 123 128 122 123 128 111 -17Middle East 75 68 65 -4 62 66 69 67 67 68 1Africa 43 38 45 7 50 54 52 50 48 56 8
Total DCs 432 426 454 28 460 481 468 457 459 452 -7
Non-OPEC rig count 1,200 1,632 1,809 177 1,855 1,853 1,763 1,767 1,782 1,714 -68Algeria 54 54 50 -4 47 47 49 42 44 42 -2Angola 6 3 4 1 5 5 5 4 4 4 0Congo 2 2 3 1 4 4 4 3 3 2 -1Ecuador 4 6 8 2 11 9 8 9 8 9 1Equatorial Guinea** 1 1 1 0 1 1 1 1 1 1 0Gabon 1 1 3 3 4 7 6 7 6 8 2Iran** 143 156 157 2 157 157 157 157 157 157 0Iraq 43 49 59 10 61 65 75 77 77 77 0Kuwait 44 54 51 -3 45 44 44 46 47 46 -1Libya 1 1 5 4 9 11 15 16 16 16 0Nigeria 6 9 13 5 12 14 14 16 15 17 2Saudi Arabia 125 118 117 -1 123 118 115 118 114 114 0UAE 51 52 55 4 57 58 59 64 63 67 4Venezuela 58 49 32 -17 26 25 23 25 25 25 0
OPEC rig count 537 553 558 5 563 565 576 585 580 585 5
World rig count*** 1,737 2,185 2,368 183 2,418 2,418 2,338 2,352 2,362 2,299 -63 of which: Oil 1,313 1,678 1,886 209 1,934 1,936 1,827 1,833 1,841 1,804 -37 Gas 370 466 448 -17 453 455 482 486 490 460 -30 Others 54 42 33 -9 31 26 29 32 31 35 4
Note: * Other Asia includes Indonesia. ** Estimated data when Baker Hughes Incorporated did not reported the data. *** Data excludes China and FSU. Totals may not add up due to independent rounding.
Sources: Baker Hughes Incorporated and OPEC Secretariat's estimates.

Glossary of Terms
OPEC Monthly Oil Market Report – October 2019 93
Glossary of Terms
Abbreviations b barrels b/d barrels per day bp basis points bb billion barrels bcf billion cubic feet cu m cubic metres mb million barrels mb/d million barrels per day mmbtu million British thermal units mn million m-o-m month-on-month mt metric tonnes q-o-q quarter-on-quarter pp percentage points tb/d thousand barrels per day tcf trillion cubic feet y-o-y year-on-year y-t-d year-to-date
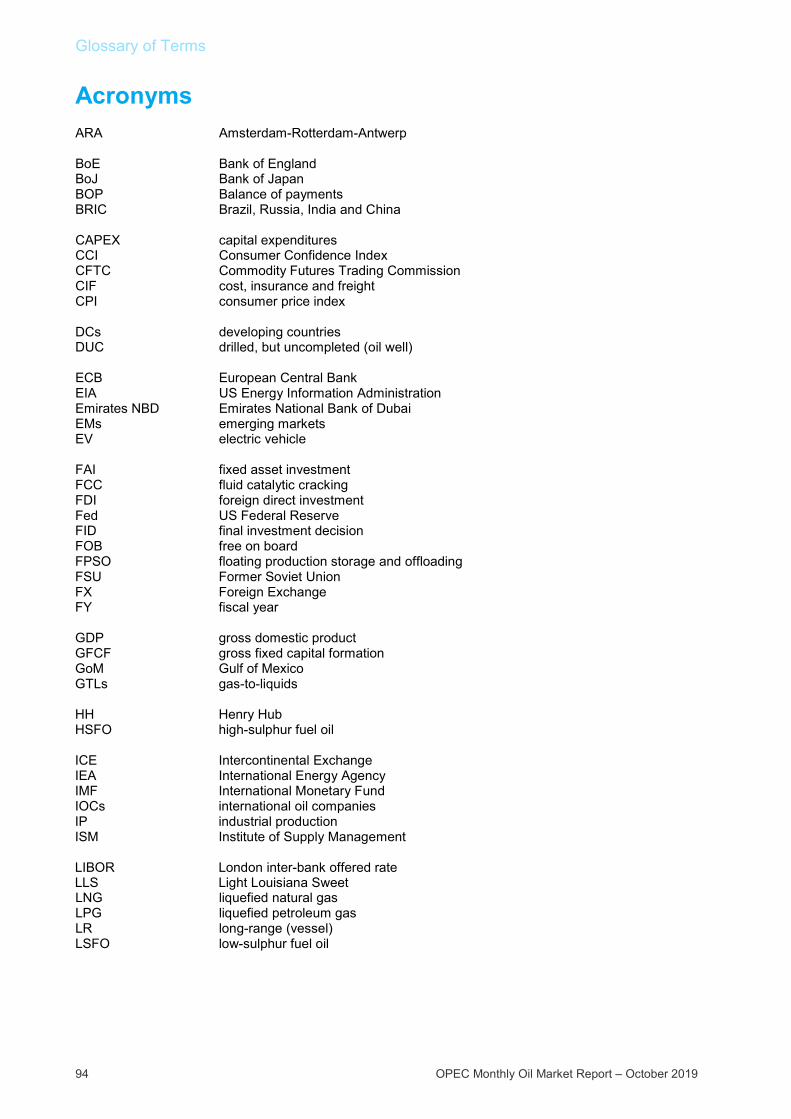
Glossary of Terms
94 OPEC Monthly Oil Market Report – October 2019
Acronyms ARA Amsterdam-Rotterdam-Antwerp BoE Bank of England BoJ Bank of Japan BOP Balance of payments BRIC Brazil, Russia, India and China CAPEX capital expenditures CCI Consumer Confidence Index CFTC Commodity Futures Trading Commission CIF cost, insurance and freight CPI consumer price index DCs developing countries DUC drilled, but uncompleted (oil well) ECB European Central Bank EIA US Energy Information Administration Emirates NBD Emirates National Bank of Dubai EMs emerging markets EV electric vehicle FAI fixed asset investment FCC fluid catalytic cracking FDI foreign direct investment Fed US Federal Reserve FID final investment decision FOB free on board FPSO floating production storage and offloading FSU Former Soviet Union FX Foreign Exchange FY fiscal year GDP gross domestic product GFCF gross fixed capital formation GoM Gulf of Mexico GTLs gas-to-liquids HH Henry Hub HSFO high-sulphur fuel oil ICE Intercontinental Exchange IEA International Energy Agency IMF International Monetary Fund IOCs international oil companies IP industrial production ISM Institute of Supply Management LIBOR London inter-bank offered rate LLS Light Louisiana Sweet LNG liquefied natural gas LPG liquefied petroleum gas LR long-range (vessel) LSFO low-sulphur fuel oil

Glossary of Terms
OPEC Monthly Oil Market Report – October 2019 95
MCs (OPEC) Member Countries MED Mediterranean MENA Middle East/North Africa MOMR (OPEC) Monthly Oil Market Report MPV multi-purpose vehicle MR medium-range or mid-range (vessel) NBS National Bureau of Statistics NGLs natural gas liquids NPC National People’s Congress (China) NWE Northwest Europe NYMEX New York Mercantile Exchange OECD Organisation for Economic Co-operation and Development OPEX operational expenditures OIV total open interest volume ORB OPEC Reference Basket OSP Official Selling Price PADD Petroleum Administration for Defense Districts PBoC People’s Bank of China PMI purchasing managers’ index PPI producer price index RBI Reserve Bank of India REER real effective exchange rate ROI return on investment SAAR seasonally-adjusted annualized rate SIAM Society of Indian Automobile Manufacturers SRFO straight-run fuel oil SUV sports utility vehicle ULCC ultra-large crude carrier ULSD ultra-low sulphur diesel USEC US East Coast USGC US Gulf Coast USWC US West Coast VGO vacuum gasoil VLCC very large crude carriers WPI wholesale price index WS Worldscale WTI West Texas Intermediate WTS West Texas Sour


Next report to be issued on 14 November 2019.
OPEC Basket average price US$/b
September OPEC crude production mb/d, according to secondary sources
Economic growth rate per cent
up 2.74 in September
down 1.32 in September
September 2019 62.36
August 2019 59.62
Year-to-date 64.38
September 2019 28.49
August 2019 29.81
World OECD US Japan Euro-zone China India
2019 3.0 1.6 2.3 0.9 1.2 6.2 6.1
2020 3.0 1.4 1.8 0.3 1.1 5.9 6.7
Supply and demand mb/d
OECD commercial stocks mb
2019 19/18 2020 20/19
World demand 99.8 1.0 World demand 100.9 1.1
Non-OPEC supply 64.3 1.8 Non-OPEC supply 66.5 2.2
OPEC NGLs 4.8 0.0 OPEC NGLs 4.8 0.0
Difference 30.7 –0.9 Difference 29.6 –1.2
Jun 19 Jul 19 Aug 19 Aug 19/Jul 19 Aug 18Crude oil 1,465 1,428 1,406 –21.9 1,412Products 1,460 1,498 1,530 31.9 1,439
Total 2,925 2,927 2,937 10.0 2,852
Days of forward cover 60.3 60.5 60.9 0.4 59.3