the next linux superpower: ebpf primer
TRANSCRIPT
SRECon Europe 2016 @goldshtn https://s.sashag.net/bpf07
SRECon Europe 2016 @goldshtn https://s.sashag.net/bpf07
The Next Linux Superpower:eBPF Primer
Sasha GoldshteinCTO, Sela Group
@goldshtn

SRECon Europe 2016 @goldshtn https://s.sashag.net/bpf07
SRECon Europe 2016 @goldshtn https://s.sashag.net/bpf07
Agenda• Modern Linux tracing landscape• BPF• BCC – BPF Compiler Collection• Using BCC tools• Authoring BCC tools

SRECon Europe 2016 @goldshtn https://s.sashag.net/bpf07
SRECon Europe 2016 @goldshtn https://s.sashag.net/bpf07
Linux Tracing Tools, TodayEase of use
BPF/BCC
SysDig
ktap
SystemTap
LTTng
ftrace
perf
custom .ko
new stable dead
Level of detail, features

SRECon Europe 2016 @goldshtn https://s.sashag.net/bpf07
SRECon Europe 2016 @goldshtn https://s.sashag.net/bpf07
Berkeley Packet Filters (BPF)• Originally designed for, well, packet filtering:dst port 80 and len >= 100• Custom instruction set, interpreted/JIT compiled• Verified to be safe: no unsafe memory accesses, no backward jumps
0: (bf) r6 = r1 1: (85) call 14 2: (67) r0 <<= 32 3: (77) r0 >>= 32 4: (15) if r0 == 0x49f goto pc+40

SRECon Europe 2016 @goldshtn https://s.sashag.net/bpf07
SRECon Europe 2016 @goldshtn https://s.sashag.net/bpf07
Extended BPF (3.18 and ongoing)• Attach BPF programs to kprobes/uprobes (4.1) and tracepoints (4.7)• Data structures: array, hash (expandable), stack map (4.6)• Output to trace buffer (4.3) and perf cyclic buffer (4.4)• Helper functions: get time, get current comm, get current CPU, etc.

SRECon Europe 2016 @goldshtn https://s.sashag.net/bpf07
SRECon Europe 2016 @goldshtn https://s.sashag.net/bpf07
BCC: BPF Compiler Collection• Library and Python/Lua module for compiling, loading, and executing
BPF programs• Compile BPF program from C source• Attach BPF program to kprobe/uprobe/tracepoint/USDT/socket• Poll data from BPF program using Python/Lua
• Can do in-kernel aggregation and filtering• Growing collection of tracing and performance tools

SRECon Europe 2016 @goldshtn https://s.sashag.net/bpf07
SRECon Europe 2016 @goldshtn https://s.sashag.net/bpf07
BCC• The BCC repository contains a variety of existing scripts and tools to
get you started• The BPF module (Python/Lua) can be used to build new tools or one-
off scripts
$ ls.pyargdist.pybashreadline.pybiolatency.pybiosnoop.pybiotop.pybitesize.pybtrfsdist.pybtrfsslower.pycachestat.pycpudist.pydcsnoop.pydcstat.py
execsnoop.pyext4dist.pyext4slower.pyfilelife.pyfileslower.pyfiletop.pyfunccount.pyfunclatency.pygethostlatency.pyhardirqs.pykillsnoop.pymdflush.pymemleak.py
offcputime.pyoffwaketime.pyoomkill.pyopensnoop.pypidpersec.pyrunqlat.pysoftirqs.pysolisten.pystackcount.pystacksnoop.pystatsnoop.pysyncsnoop.pytcpaccept.py
tcpconnect.pytcpconnlat.pytcpretrans.pytplist.pytrace.pyvfscount.pyvfsstat.pywakeuptime.pyxfsdist.pyxfsslower.pyzfsdist.pyzfsslower.py

SRECon Europe 2016 @goldshtn https://s.sashag.net/bpf07
SRECon Europe 2016 @goldshtn https://s.sashag.net/bpf07

SRECon Europe 2016 @goldshtn https://s.sashag.net/bpf07
SRECon Europe 2016 @goldshtn https://s.sashag.net/bpf07
Specialized Tools# ./hardirqs.pyTracing hard irq event time... Hit Ctrl-C to end.^CHARDIRQ TOTAL_usecsvirtio0-input.0 959ahci[0000:00:1f.2] 1290# ./biolatency.pyTracing block device I/O... Hit Ctrl-C to end.^C usecs : count distribution 64 -> 127 : 7 |********* | 128 -> 255 : 14 |****************** | 256 -> 511 : 5 |****** | 512 -> 1023 : 30 |****************************************| 1024 -> 2047 : 1 |* |

SRECon Europe 2016 @goldshtn https://s.sashag.net/bpf07
SRECon Europe 2016 @goldshtn https://s.sashag.net/bpf07
Specialized Tools# ./filetop.py 01:35:51 loadavg: 0.01 0.04 0.03 2/139 3611
PID COMM READS WRITES R_Kb W_Kb T FILE2496 sshd 3 1 48 0 O ptmx2939 screen 4 1 16 0 O ptmx2496 sshd 1 3 16 0 S TCP3611 clear 2 0 8 0 R screen2939 screen 1 3 4 0 O 03589 filetop.py 2 0 2 0 R loadavg3611 clear 1 0 0 0 R libtinfo.so.5.93611 clear 1 0 0 0 R libc-2.21.so3611 filetop.py 3 0 0 0 R clear3611 filetop.py 2 0 0 0 R ld-2.21.so3611 clear 0 1 0 0 O 23589 filetop.py 0 3 0 0 O 2# ./cachestat.py HITS MISSES DIRTIES READ_HIT% WRITE_HIT% BUFFERS_MB CACHED_MB 0 0 0 0.0% 0.0% 54 482 842 0 0 100.0% 0.0% 54 482 889 128 0 87.4% 12.6% 54 482

SRECon Europe 2016 @goldshtn https://s.sashag.net/bpf07
SRECon Europe 2016 @goldshtn https://s.sashag.net/bpf07
Specialized Tools# ./stackcount.py __kmallocTracing 1 functions for "__kmalloc"... Hit Ctrl-C to end.^C __kmalloc alloc_fdtable dup_fd copy_process.part.31 _do_fork sys_clone do_syscall_64 return_from_SYSCALL_64 4
__kmalloc create_pipe_files __do_pipe_flags sys_pipe entry_SYSCALL_64_fastpath 6
__kmalloc htree_dirblock_to_tree ext4_htree_fill_tree ext4_readdir iterate_dir SyS_getdents entry_SYSCALL_64_fastpath 14

SRECon Europe 2016 @goldshtn https://s.sashag.net/bpf07
SRECon Europe 2016 @goldshtn https://s.sashag.net/bpf07
BPF Tracing TargetsTarget Support Overheadkprobes Native Low
uprobes Native Mediumhandler runs in KM
Kernel tracepoints NativeNEW Low
USDT tracepoints Temporarythrough uprobes
Mediumhandler runs in KM

SRECon Europe 2016 @goldshtn https://s.sashag.net/bpf07
SRECon Europe 2016 @goldshtn https://s.sashag.net/bpf07
Multi-Tools: argdist# ./argdist.py -C 'p:c:write(int fd, const void *buf, size_t count):size_t:count:fd==1'[01:49:00] p:c:write(int fd, const void *buf, size_t count):size_t:count:fd==1 COUNT EVENT 1 count = 3134 1 count = 170 1 count = 181 2 count = 18 3 count = 30

SRECon Europe 2016 @goldshtn https://s.sashag.net/bpf07
SRECon Europe 2016 @goldshtn https://s.sashag.net/bpf07
Multi-Tools: argdist# ./argdist.py -i 5 -H 'r::__vfs_read(void *file, void *buf, size_t count):size_t:$entry(count):$latency > 1000000'[01:51:40] count : count distribution 0 -> 1 : 20 |****************************************| 2 -> 3 : 0 | | 4 -> 7 : 0 | | 8 -> 15 : 0 | | 16 -> 31 : 0 | | 32 -> 63 : 0 | | 64 -> 127 : 0 | | 128 -> 255 : 6 |************ | 256 -> 511 : 0 | | 512 -> 1023 : 0 | | 1024 -> 2047 : 1 |** |

SRECon Europe 2016 @goldshtn https://s.sashag.net/bpf07
SRECon Europe 2016 @goldshtn https://s.sashag.net/bpf07
Multi-Tools: trace# ./trace.py 'r:/usr/bin/bash:readline "%s", retval'TIME PID COMM FUNC -02:02:26 3711 bash readline ls –la02:02:36 3711 bash readline wc -l src.c# ./tplist.py -v block:block_rq_completeblock:block_rq_complete dev_t dev; sector_t sector; unsigned int nr_sector; int errors; char rwbs[8];# ./trace.py 't:block:block_rq_complete "sectors=%d", tp.nr_sector'TIME PID COMM FUNC -02:03:56 0 swapper/0 block_rq_complete sectors=1602:03:56 0 swapper/0 block_rq_complete sectors=802:03:58 0 swapper/0 block_rq_complete sectors=2402:04:00 0 swapper/0 block_rq_complete sectors=0

SRECon Europe 2016 @goldshtn https://s.sashag.net/bpf07
SRECon Europe 2016 @goldshtn https://s.sashag.net/bpf07
Multi-Tools: trace# ./tplist.py -l pthread -v libpthread:pthread_create/usr/lib64/libpthread-2.21.so libpthread:pthread_create location 0x7c63 8 unsigned bytes @ register %rax 8 unsigned bytes @ -192(%rbp) 8 unsigned bytes @ -168(%rbp) 8 unsigned bytes @ -176(%rbp)# ./trace.py 'u:pthread:pthread_create "%llx", arg3'TIME PID COMM FUNC -02:07:29 4051 contentions pthread_create 400e0002:07:29 4051 contentions pthread_create 400e0002:07:29 4051 contentions pthread_create 400e0002:07:29 4051 contentions pthread_create 400e00^C

SRECon Europe 2016 @goldshtn https://s.sashag.net/bpf07
SRECon Europe 2016 @goldshtn https://s.sashag.net/bpf07
Multi-Tools: trace# trace -p $(pidof node) 'u:node:http__server__request "%s %s (from %s:%d)" arg5, arg6, arg3, arg4'TIME PID COMM FUNC -04:50:44 22185 node http__server__request GET /foofoo (from ::1:51056)04:50:46 22185 node http__server__request GET / (from ::1:51056)^C# ./trace.py 'u:/tmp/libjvm.so:thread__start "%s [%d]", arg1, arg4' \ 'u:/tmp/libjvm.so:thread__stop "%s [%d]", arg1, arg4'TIME PID COMM FUNC -06:55:24 32157 java thread__start Reference Handler [32157]06:55:24 32158 java thread__start Finalizer [32158]06:55:24 32159 java thread__start Signal Dispatcher [32159]06:55:24 32160 java thread__start C2 CompilerThread0 [32160]06:55:24 32161 java thread__start C2 CompilerThread1 [32161]06:55:24 32162 java thread__start C1 CompilerThread2 [32162]06:55:24 32163 java thread__start Service Thread [32163]06:55:28 32159 java thread__stop Signal Dispatcher [32159]^C

SRECon Europe 2016 @goldshtn https://s.sashag.net/bpf07
SRECon Europe 2016 @goldshtn https://s.sashag.net/bpf07
Kernel
Custom Tool Design
BPF program
Tracepoint kprobe
Python/Lua driverApp process
uprobeUSDT
Probe handler
Probe handler
Hash or histogram
Cyclic buffer
UK

SRECon Europe 2016 @goldshtn https://s.sashag.net/bpf07
SRECon Europe 2016 @goldshtn https://s.sashag.net/bpf07
BPF Program: Counting Allocations#include <linux/ptrace.h>struct alloc_info_t { u64 count; u64 size;};BPF_HASH(allocs, u32, struct alloc_info_t);int handler(struct pt_regs *ctx, size_t size) { u32 pid = bpf_get_current_pid_tgid(); struct alloc_info_t init = { 0 }, *info;
info = allocs.lookup_or_init(&pid, &init); info->count += 1; info->size += size;
return 0;}
SRECon Europe 2016 @goldshtn https://s.sashag.net/bpf07
SRECon Europe 2016 @goldshtn https://s.sashag.net/bpf07
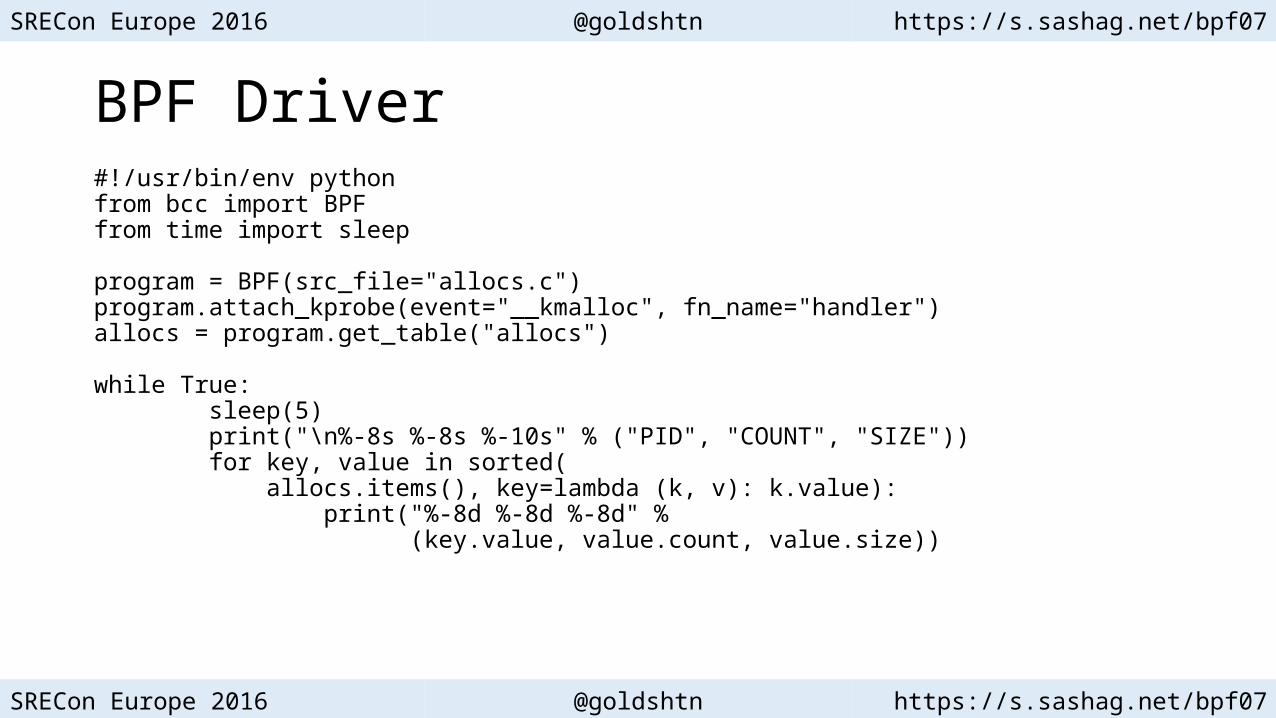
BPF Driver#!/usr/bin/env pythonfrom bcc import BPFfrom time import sleep
program = BPF(src_file="allocs.c")program.attach_kprobe(event="__kmalloc", fn_name="handler")allocs = program.get_table("allocs")
while True: sleep(5) print("\n%-8s %-8s %-10s" % ("PID", "COUNT", "SIZE")) for key, value in sorted( allocs.items(), key=lambda (k, v): k.value): print("%-8d %-8d %-8d" % (key.value, value.count, value.size))

SRECon Europe 2016 @goldshtn https://s.sashag.net/bpf07
SRECon Europe 2016 @goldshtn https://s.sashag.net/bpf07
BPF Execution# ./allocs.pyPID COUNT SIZE28064 3 45628157 10 7628158 5 1116
PID COUNT SIZE 28001 113 1828 28064 8 1216 28110 38 683 28157 46 328 28158 5 1116 28159 41 12894 ^C

SRECon Europe 2016 @goldshtn https://s.sashag.net/bpf07
SRECon Europe 2016 @goldshtn https://s.sashag.net/bpf07
Deployment• At development-time, BCC has a bunch of dependencies, which are
not required for deployment• For Python tools, deploy Python + libbcc.so• For Lua tools, deploy only bcc-lua• Statically links libbcc.a but allows plugging libbcc.so

SRECon Europe 2016 @goldshtn https://s.sashag.net/bpf07
SRECon Europe 2016 @goldshtn https://s.sashag.net/bpf07
Summary• Tracing can identify bugs and performance issues that no debugger or
profiler can catch• Tools make low-overhead, dynamic, production tracing possible• BPF is the next-generation backend for Linux tracing tools

SRECon Europe 2016 @goldshtn https://s.sashag.net/bpf07
SRECon Europe 2016 @goldshtn https://s.sashag.net/bpf07
Thank You!Sasha Goldshtein
@goldshtn