the new york state trauma system - health.ny.gov · the new york state trauma system: a special...
TRANSCRIPT
The New York State Trauma System:A Special Report on Pediatric Trauma
1994-1998
New York State Department of Health / Health Research, Inc.
This report has been made possible, in part, from grant # 5MCH 00036 from the Health Resources and ServicesAdministration, Maternal and Child Health Bureau, Emergency Medical Services for Children Program in collaborationwith the National Highway Traffic Safety Administration.

2
For additional information, please contact:
Ms. Gloria C. Hale, MPHEmergency Medical Services for Children Program CoordinatorNew York State Department of HealthBureau of Emergency Medical ServicesHedley Park Place, Suite 303433 River StreetTroy, New York 12180-2299
Phone: (518) 402-0996, ext. 1,4Fax: (518) 402-0985Email: [email protected]

3
The New York State Trauma System:A Special Report on Pediatric Trauma
1994-1998
This report has been compiled by:
the New York State Dept. of Health, Bureau of Emergency Medical Services,Emergency Medical Services for Children (EMSC) Program
in cooperation with
the State University of New York at Albany, School of Public Health
Report preparation was done by:
Gloria C. Hale, M.P.H.
Samantha A. Caudill, M.P.H.
Christine M. Hicks-Waller, M.S.
Louise S. Farrell, M.S.
Edward L. Hannan, Ph.D.
4
Table of Contents
Key Findings ……………………………………………………………………………………………. 9
Executive Summary …………………………………………………………………………………….11
Maps ……………………………………………………………………………………………………….13
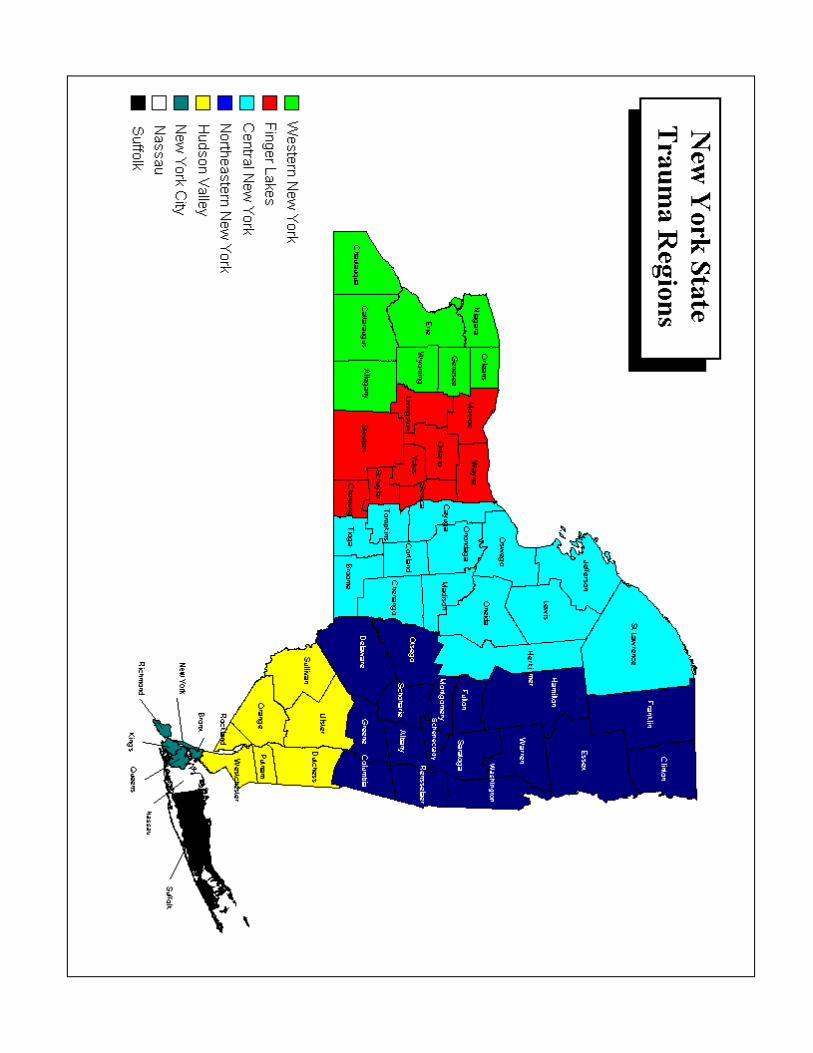
New York State Trauma Regions ……………………………………………………………………….13
New York State Trauma Centers ………………………………………………………………………..14
New York City Trauma Centers ………………………………………………………………………….15
Introduction ……………………………………………………………………………………………….17
Descriptive Results …………………………………………………………………………………….. 19
Pediatric Population Profile ……………………………………………………………………………… 20
Mechanism of Injury ……………………………………………………………………………………….24
Motor vehicle crash (MVC) injuries ……………………………………………………………. 26
Pedestrian injuries ………………………………………………………………………………. 27
Bicycle crash injuries ……………………………………………………………………………. 28
Fall injuries ……………………………………………………………………………………….. 29
Sports/recreation injuries ……………………………………………………………………….. 30
Assault injuries …………………………………………………………………………………… 31
Method of Transportation ………………………………………………………………………………… 32
Discharge Disposition …………………………………………………………………………………….. 32
Functional Independence Measures ……………………………………………………………………. 33
Transfers …………………………………………………………………………………………………… 34
DOAs and DIEs …………………………………………………………………………………………… 35
Appendices
Appendix 1: Hospitals Participating in the New York State Trauma Registry in 1998 ……………. 38
Appendix 2: E-codes Categorization of Mechanism of Injury ……………………………………….. 47
Appendix 3: Injuries Included in Other MOI ………………………………………………………….. 49

5
Appendix 4: FIMS (Functional Independence Measures) Definitions ……………………………….50
Appendix 5: Regional Data ……………………………………………………………………………... 51
Central New York ………………………………………………………………………………. 51
Finger Lakes ……………………………………………………………………………………. 54
Hudson Valley ………………………………………………………………………………….. 57
Nassau ………………………………………………………………………………………….. 60
Northeastern New York ……………………………………………………………………….. 63
New York City …………………………………………………………………………………. 66
Suffolk …………………………………………………………………………………………… 69
Western New York …………………………………………………………………………….. 72
Appendix 6: New York State Emergency Medical Services for Children Advisory Committee …. 75

6
Figures
Figure 1: Percent of Pediatric Patients in the New York State Trauma Registry, 1994-1998Figure 2: Total Pediatric Patients in the New York State Trauma Registry
by Year, 1994-1998Figure 3: Distribution of Pediatric Patients in the New York State Trauma Registry
by Hospital Level, 1994-1998Figure 4: Distribution of Pediatric Patients in the New York State Trauma Registry
by Region, 1994-1998Figure 5: Percent of Pediatric Patients in the New York State Trauma Registry
by Region, 1994-1998Figure 6: Age & Gender Distribution of Pediatric Patients in the New York State Trauma Registry,
1994-1998Figure 7: Mechanism of Injury of Pediatric Patients in the New York State Trauma Registry, 1994-
1998Figure 8: Mechanism of Injury of Pediatric Patients in the New York State Trauma Registry Among
Regional Trauma Centers, 1994-1998Figure 9: Mechanism of Injury of Pediatric Patients in the New York State Trauma Registry Among
Area Trauma Centers, 1994-1998Figure 10: Mechanism of Injury of Pediatric Patients in the New York State Trauma Registry Among
Noncenters, 1994-1998Figure 11: Age & Gender Distribution of Pediatric Patients with Motor Vehicle Crash Injuries in the
New York State Trauma Registry, 1994-1998Figure 12: Regional Distribution of Pediatric Patients with Motor Vehicle Crash Injuries in the New
York State Trauma Registry, 1994-1998Figure 13: Age & Gender Distribution of Pediatric Patients with Pedestrian Injuries in the New York
State Trauma Registry, 1994-1998Figure 14: Regional Distribution of Pediatric Patients with Pedestrian Injuries in the New York State
Trauma Registry, 1994-1998 Figure 15: Age & Gender Distribution of Pediatric Patients with Bicycle Crash Injuries in the New
York State Trauma Registry, 1994-1998 Figure 16: Regional Distribution of Pediatric Patients with Bicycle Crash Injuries in the New York
State Trauma Registry, 1994-1998Figure 17: Age & Gender Distribution of Pediatric Patients with Fall Injuries in the New York State
Trauma Registry, 1994-1998Figure 18: Regional Distribution of Pediatric Patients with Fall Injuries in the New York State Trauma
Registry, 1994-1998Figure 19: Age & Gender Distribution of Pediatric Patients with Sports/Recreation Injuries in the
New York State Trauma Registry, 1994-1998Figure 20: Regional Distribution of Pediatric Patients with Sports/Recreation Injuries in the New York
State Trauma Registry, 1994-1998Figure 21: Age & Gender Distribution of Pediatric Patients with Assault Injuries in the New York
State Trauma Registry, 1994-1998Figure 22: Regional Distribution of Pediatric Patients with Assault Injuries in the New York State
Trauma Registry, 1994-1998Figure 23: Mode of Transportation to First Hospital of Pediatric Patients in the New York State
Trauma Registry, 1994-1998Figure 24: Discharge Disposition of Admitted Pediatric Patients in the New York State Trauma
Registry, 1994-1998Figure 25: Functional Independence Measures: Feeding of Pediatric Patients in the New York State
Trauma Registry, 1994-1998Figure 26: Functional Independence Measures: Expression of Pediatric Patients in the New York

7
State Trauma Registry, 1994-1998 Figure 27: Functional Independence Measures: Locomotion of Pediatric Patients in the New York
State Trauma Registry, 1994-1998Figure 28: Transfers of Pediatric Patients in the New York State Trauma Registry, 1994-1998Figure 29: Distribution of Pediatric DOAs in the New York State Trauma Registry by Hospital Level,
1994-1998Figure 30: Distribution of Pediatric DIEs in the New York State Trauma Registry by Region, 1994-
1998Figure 31: Distribution of Pediatric DOAs in the New York State Trauma Registry by Mechanism of
Injury, 1994-1998Figure 32: Distribution of Pediatric DIEs in the New York State Trauma Registry by Mechanism of
Injury, 1994-1998Figure 33: Distribution of Pediatric DOAs in the New York State Trauma Registry by Age & Gender,
1994-1998Figure 34: Distribution of Pediatric DIEs in the New York State Trauma Registry by Age & Gender,
1994-1998
8
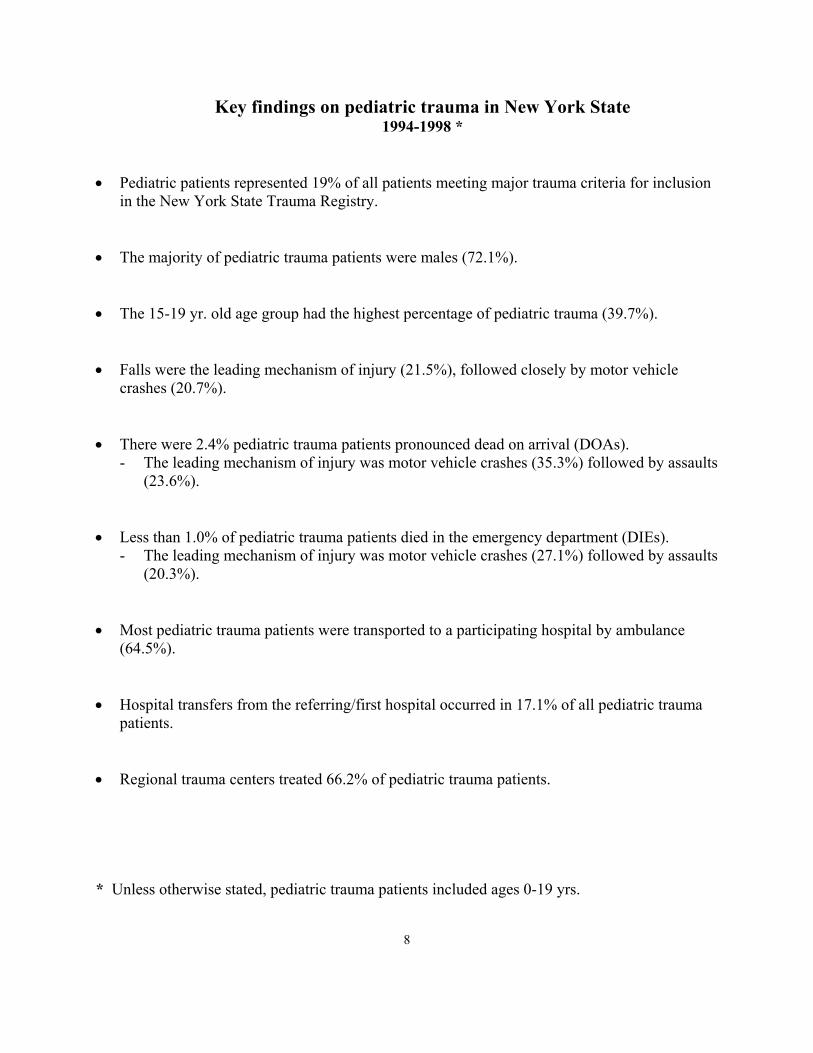
Key findings on pediatric trauma in New York State1994-1998 *
• Pediatric patients represented 19% of all patients meeting major trauma criteria for inclusionin the New York State Trauma Registry.
• The majority of pediatric trauma patients were males (72.1%).
• The 15-19 yr. old age group had the highest percentage of pediatric trauma (39.7%).
• Falls were the leading mechanism of injury (21.5%), followed closely by motor vehiclecrashes (20.7%).
• There were 2.4% pediatric trauma patients pronounced dead on arrival (DOAs). - The leading mechanism of injury was motor vehicle crashes (35.3%) followed by assaults
(23.6%).
• Less than 1.0% of pediatric trauma patients died in the emergency department (DIEs). - The leading mechanism of injury was motor vehicle crashes (27.1%) followed by assaults
(20.3%).
• Most pediatric trauma patients were transported to a participating hospital by ambulance(64.5%).
• Hospital transfers from the referring/first hospital occurred in 17.1% of all pediatric traumapatients.
• Regional trauma centers treated 66.2% of pediatric trauma patients.
* Unless otherwise stated, pediatric trauma patients included ages 0-19 yrs.
9
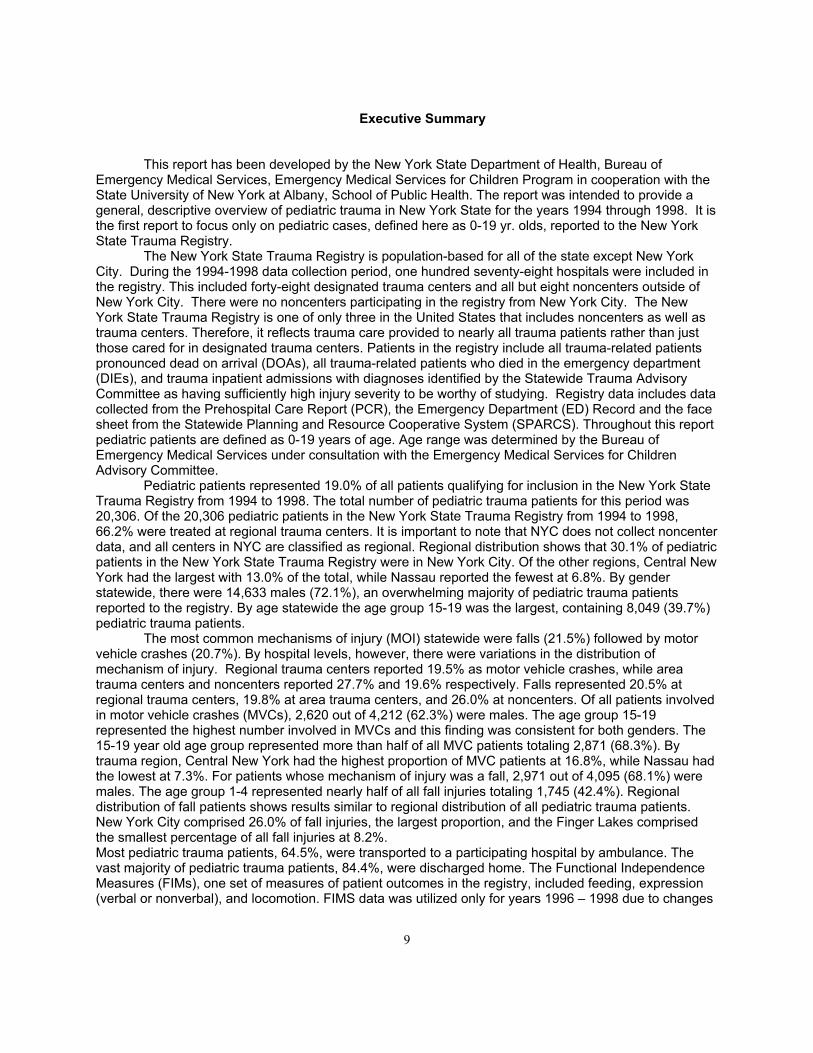
Executive Summary
This report has been developed by the New York State Department of Health, Bureau ofEmergency Medical Services, Emergency Medical Services for Children Program in cooperation with theState University of New York at Albany, School of Public Health. The report was intended to provide ageneral, descriptive overview of pediatric trauma in New York State for the years 1994 through 1998. It isthe first report to focus only on pediatric cases, defined here as 0-19 yr. olds, reported to the New YorkState Trauma Registry.
The New York State Trauma Registry is population-based for all of the state except New YorkCity. During the 1994-1998 data collection period, one hundred seventy-eight hospitals were included inthe registry. This included forty-eight designated trauma centers and all but eight noncenters outside ofNew York City. There were no noncenters participating in the registry from New York City. The NewYork State Trauma Registry is one of only three in the United States that includes noncenters as well astrauma centers. Therefore, it reflects trauma care provided to nearly all trauma patients rather than justthose cared for in designated trauma centers. Patients in the registry include all trauma-related patientspronounced dead on arrival (DOAs), all trauma-related patients who died in the emergency department(DIEs), and trauma inpatient admissions with diagnoses identified by the Statewide Trauma AdvisoryCommittee as having sufficiently high injury severity to be worthy of studying. Registry data includes datacollected from the Prehospital Care Report (PCR), the Emergency Department (ED) Record and the facesheet from the Statewide Planning and Resource Cooperative System (SPARCS). Throughout this reportpediatric patients are defined as 0-19 years of age. Age range was determined by the Bureau ofEmergency Medical Services under consultation with the Emergency Medical Services for ChildrenAdvisory Committee.
Pediatric patients represented 19.0% of all patients qualifying for inclusion in the New York StateTrauma Registry from 1994 to 1998. The total number of pediatric trauma patients for this period was20,306. Of the 20,306 pediatric patients in the New York State Trauma Registry from 1994 to 1998,66.2% were treated at regional trauma centers. It is important to note that NYC does not collect noncenterdata, and all centers in NYC are classified as regional. Regional distribution shows that 30.1% of pediatricpatients in the New York State Trauma Registry were in New York City. Of the other regions, Central NewYork had the largest with 13.0% of the total, while Nassau reported the fewest at 6.8%. By genderstatewide, there were 14,633 males (72.1%), an overwhelming majority of pediatric trauma patientsreported to the registry. By age statewide the age group 15-19 was the largest, containing 8,049 (39.7%)pediatric trauma patients.
The most common mechanisms of injury (MOI) statewide were falls (21.5%) followed by motorvehicle crashes (20.7%). By hospital levels, however, there were variations in the distribution ofmechanism of injury. Regional trauma centers reported 19.5% as motor vehicle crashes, while areatrauma centers and noncenters reported 27.7% and 19.6% respectively. Falls represented 20.5% atregional trauma centers, 19.8% at area trauma centers, and 26.0% at noncenters. Of all patients involvedin motor vehicle crashes (MVCs), 2,620 out of 4,212 (62.3%) were males. The age group 15-19represented the highest number involved in MVCs and this finding was consistent for both genders. The15-19 year old age group represented more than half of all MVC patients totaling 2,871 (68.3%). Bytrauma region, Central New York had the highest proportion of MVC patients at 16.8%, while Nassau hadthe lowest at 7.3%. For patients whose mechanism of injury was a fall, 2,971 out of 4,095 (68.1%) weremales. The age group 1-4 represented nearly half of all fall injuries totaling 1,745 (42.4%). Regionaldistribution of fall patients shows results similar to regional distribution of all pediatric trauma patients.New York City comprised 26.0% of fall injuries, the largest proportion, and the Finger Lakes comprisedthe smallest percentage of all fall injuries at 8.2%.Most pediatric trauma patients, 64.5%, were transported to a participating hospital by ambulance. Thevast majority of pediatric trauma patients, 84.4%, were discharged home. The Functional IndependenceMeasures (FIMs), one set of measures of patient outcomes in the registry, included feeding, expression(verbal or nonverbal), and locomotion. FIMS data was utilized only for years 1996 – 1998 due to changes

10
in reporting procedures. Of all statewide pediatric trauma patients for years 1996-1998, 8,860 (74.1%)measured independent for feeding. There were 8,633 (72.2%) who measured independentexpression and 5,790 (48.4%) who measured independent for locomotion.
Hospital transfers for pediatric trauma patients represented 17.1% of all pediatric trauma patientsin the registry. This number includes those initially admitted to a referring/first hospital (2.3%) and thosewho were seen only in the emergency department of the referring/first hospital prior to transfer (14.8%).There were a total of 496 pediatric DOAs and 177 pediatric DIEs reported to the New York State TraumaRegistry from 1994 to 1998. Over one-third, or 186 (37.5%) of the DOA population were transported toregional centers. Nearly one half of the pediatric DIE population, or 84 (47.5%), were treated at regionalcenters.
Compared to the overall distribution for pediatric trauma patients by mechanism of injury, therewere higher proportions of MVCs and assaults for DOAs and DIEs. Of all pediatric trauma patients 20.5%were MVC patients. Of the DOA population 35.3% were MVC patients, and of the DIE population 27.1%were MVC patients. Of all pediatric trauma patients 14.7% were assault patients. Of the DOA population23.6% were assault patients, and of the DIE population 20.3% were assault patients. Males representedthe highest percentages of DOAs and DIEs in the pediatric trauma population at 68.3% and 74.6%respectively. By age group, 15-19 was the largest group, comprising 305 (61.5%) of the DOA populationand 113 (63.8%) of the DIE population.
11

12

13

14
The New York State Trauma System:A Special Report on Pediatric Trauma
1994-1998
Introduction
This report has been developed by the New York State Department of Health, Bureau ofEmergency Medical Services, Emergency Medical Services for Children Program in cooperation with theState University of New York at Albany, School of Public Health. It has been supported, in part, byproject grant #6 H33 MC 00036 from the Emergency Medical Services for Children Program, HealthResources and Services Administration, U.S. Department of Health and Human Services, in cooperationwith the National Highway Traffic Safety Administration.
The Emergency Medical Services for Children Program of the Bureau of Emergency MedicalServices undertook this report with the support and input of the state’s Emergency Medical Services forChildren Advisory Committee. The report is intended to provide a general overview of pediatric trauma inNew York State for the years 1994 through 1998. It is the first report of its kind in the state to look only atpediatric cases reported to the New York State Trauma Registry. Information contained herein isintended to assist the Department, emergency medical services and trauma system providers inidentifying areas of pediatric trauma that may need further study. It may also serve to inform child injuryprevention efforts, or aid in services or systems review.
The New York State Trauma Registry is population-based for all of the state except New YorkCity. During the 1994-1998 data collection period, one hundred seventy-eight hospitals were included inthe registry. Forty-eight of these hospitals were designated trauma centers. All but eight noncentersoutside of New York City were participants. No noncenters participated from New York City. To see adetailed list of participating hospitals by trauma region please see Appendix 1. The New York StateTrauma Registry is one of only three in the United States that includes noncenters as well as traumacenters. Therefore, it reflects trauma care provided to virtually all trauma patients rather than just thosecared for in trauma centers. There are eight trauma regions in the state: Central New York (CNY), FingerLakes (FIN), Hudson Valley (HUD), Nassau (NAS), New York City (NYC), Northeastern New York (NNY),Suffolk (SUF) and Western New York (WNY). Each trauma region has at least one regional trauma centerwith the exception of New York City, which had seventeen regional trauma centers. Maps, provided inAppendix A, show the boundaries of the eight regional systems, and the locations of the currentlydesignated trauma centers in New York City and elsewhere in New York State.
Patients in the registry include all patients pronounced dead on arrival (DOAs), all patients whodied in the emergency department (DIEs), and trauma inpatient admissions with diagnoses identified bythe Statewide Trauma Advisory Committee as having sufficiently high injury severity to be worthy ofstudying. Data is collected from the Prehospital Care Report (PCR), the Emergency Department (ED)Record and the face sheet from the Statewide Planning and Resource Cooperative System (SPARCS).
Throughout this report, unless otherwise stated, pediatric patients are defined as 0-19 years ofage. Analyses utilize 1994 through 1998 data qualifying for inclusion in the New York State TraumaRegistry.

15
Descriptive Results

16
Patient Characteristics
Pediatric patients represented 19.0% of all patients qualifying for inclusion in the New York StateTrauma Registry from 1994 to 1998 (Figure 1). Each year approximately 4,000 pediatric patients qualifyfor inclusion in the New York State Trauma Registry (Figure 2). The total number of pediatric traumapatients for this period was 20,306. This includes 19,633 patients admitted to participating hospitals, 496patients pronounced dead on arrival (DOAs), and 177 who died in the emergency room (DIEs).
Figure 1:
Figure 2:
��������������������������������������������������������������������������������������������������������������������������������������������������������������������������������������������������������������������������������������������������������������������������������������������������������������������������������������������������������������
�������������������������������������������������������������������������������������������������������������������������������������������������������������������������������������������������������������������������������������������������������������������������������������������������������������������������������������
������������������������������������������������������������������������������������������������������������������������������������������������������������������������������������������������������������������������������������������������������������������������������������������������������������������������
�������������������������������������������������������������������������������������������������������������������������������������������������������������������������������������������������������������������������������������������������������������������������������������������������������������������������������������
�������������������������������������������������������������������������������������������������������������������������������������������������������������������������������������������������������������������������������������������������������������������������������������������������������������������������������������
Total Pediatric Patients in the New York State Trauma Registry, 1994-1998
18,236 17,802 16,941 16,864 16,800
3,8904,0694,00644063,935
0
5,000
10,000
15,000
20,000
25,000
1994 1995 1996 1997 1998
NU
MB
ER O
F PA
TIEN
TS
Pediatric�������� Adult
������������������������������������������������������������������������������������������������������������������������������������������������������������������������������������������������������������������������������������������������������������������������������������������������������������������������������������������������������������������������������������������������������������������������������������������������������������������������������������������������������������������������������������������������������������������������������������������������������������������������������������������������������������������������������������������������������������������������������������������������������������������������������������������������������������������������������������������������������������������������������������������������������������������������������������������������������������������������������������������������������������������������������������������������������������������������������������������
Percent of Pediatric & Adult Patients in the New York State Trauma Registry, 1994-1998
Adult81.0%
Pediatric19.0%
17
Figure 3:
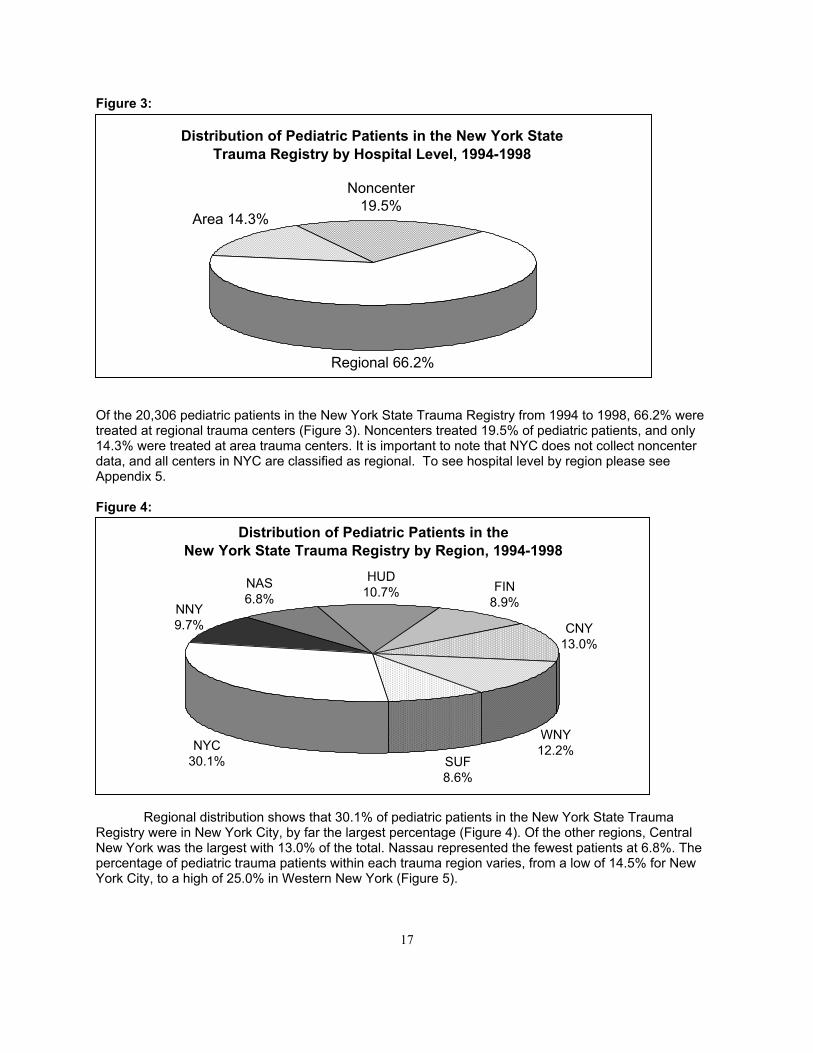
Of the 20,306 pediatric patients in the New York State Trauma Registry from 1994 to 1998, 66.2% weretreated at regional trauma centers (Figure 3). Noncenters treated 19.5% of pediatric patients, and only14.3% were treated at area trauma centers. It is important to note that NYC does not collect noncenterdata, and all centers in NYC are classified as regional. To see hospital level by region please seeAppendix 5.
Figure 4:
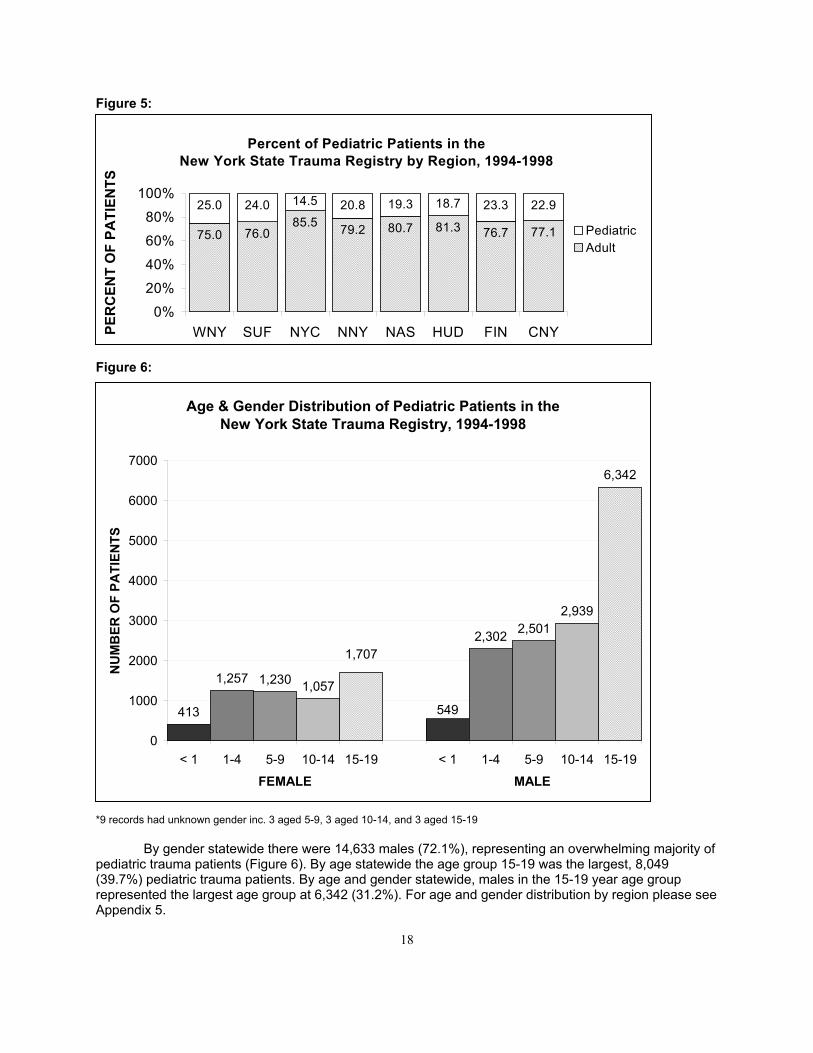
Regional distribution shows that 30.1% of pediatric patients in the New York State TraumaRegistry were in New York City, by far the largest percentage (Figure 4). Of the other regions, CentralNew York was the largest with 13.0% of the total. Nassau represented the fewest patients at 6.8%. Thepercentage of pediatric trauma patients within each trauma region varies, from a low of 14.5% for NewYork City, to a high of 25.0% in Western New York (Figure 5).
����������
��������������������������������������������������������������������������������������������������������������������������������������������������������������������������������������������������������������������������������������������������������������������������������������������������������������������������������������
������������������������������������������������������������������������������������������������������������������������������������������������������
�����������������������������������������������������������������������������������������������������������������������������������������������������������������������������������������������������������������������������������������������������������������������������������������������������������������������������������������
����������������������������������������������������������������������������������������������������������������������������������������������������
����������������������������������������������������������������������������������������������������������������������������������������������������������������������������������������������������������������������������
Distribution of Pediatric Patients in the New York State Trauma Registry by Region, 1994-1998
WNY12.2%
SUF8.6%
NYC30.1%
NNY9.7%
NAS6.8%
HUD10.7% FIN
8.9%
CNY13.0%
����������������������������������������������������������������������������������������������������������������������������������������������������������������������������������������������������������������������������������������������������������������������������������������������������
����������������������������������������������������������������������������������������������������������������������������������������������������������������������������������������������������������������������������������������������������������������
Distribution of Pediatric Patients in the New York State Trauma Registry by Hospital Level, 1994-1998
Regional 66.2%
Area 14.3%
Noncenter 19.5%
18
Figure 5:
Figure 6:
*9 records had unknown gender inc. 3 aged 5-9, 3 aged 10-14, and 3 aged 15-19
By gender statewide there were 14,633 males (72.1%), representing an overwhelming majority ofpediatric trauma patients (Figure 6). By age statewide the age group 15-19 was the largest, 8,049(39.7%) pediatric trauma patients. By age and gender statewide, males in the 15-19 year age grouprepresented the largest age group at 6,342 (31.2%). For age and gender distribution by region please seeAppendix 5.
����������������������������������������������������������������������������������������������������������������
����������������������������������������������������������������������������������������������������������������
�����������������������������������������������������������������������������������������������������������������������
����������������������������������������������������������������������������������������������������������������
����������������������������������������������������������������������������������������������������������������
Percent of Pediatric Patients in the New York State Trauma Registry by Region, 1994-1998
75.0 76.0 79.2 80.7 81.3 76.7 77.1
25.0 24.0 20.8 19.3 18.7 23.3 22.985.5
14.5
0%20%40%60%80%
100%
WNY SUF NYC NNY NAS HUD FIN CNYPER
CEN
T O
F PA
TIEN
TS
Pediatric����Adult
�������������������������������������������������������������������������������������
������������������������������������������������������������������������������������������������������������������������������������������������������������������������������������������������������������������������������������������������������������������������������������������������������������������
Age & Gender Distribution of Pediatric Patients in the New York State Trauma Registry, 1994-1998
413
6,342
2,9392,5012,302
549
1,707
1,0571,2301,257
0
1000
2000
3000
4000
5000
6000
7000
< 1 1-4 5-9 10-14 15-19 < 1 1-4 5-9 10-14 15-19FEMALE MALE
NU
MB
ER O
F PA
TIEN
TS

19
Mechanism of Injury
The mechanism of injury (MOI) categories were selected based on generally acceptedcriteria from the field of injury prevention. For a detailed list of E-codes used in each category please seeAppendix 2. The category motor vehicle crashes (MVCs) includes injuries to the occupants of motorvehicles and riders of motorcycles involved in crashes either on or off the highway. Motor vehicle-relatedinjuries not involving crashes, such as a fall while boarding a bus, are excluded from this grouping, andare included in the “Other MOI” category. Injuries to pedestrians or pedal cyclists from motor vehiclecrashes are excluded from this category and included in the “Pedestrian” and “Bicycle Crash” categories.The Pedestrian and Bicycle Crash categories also include injuries to pedestrians and bicyclists fromrailways and from other road vehicles. Injuries due to falls includes accidental falls (codes E880-E888),excluding injuries that were related to sports or recreational activities. Those injuries excluded from thefalls category were included in the “Sports/Recreation” category, as well as injuries from Water Transportto a skier or swimmer, injuries from Submersions while skiing or while engaged in sport or recreationalactivity (with or without diving equipment), and injuries related to striking against or struck accidentally byobjects or persons in sports. Assaults are injuries inflicted by another person with intent to injure or kill byany means. Not included in this category are injuries related to legal intervention such as police actionand operations of war. Also not included are those instances where intent was undetermined. All otherinjuries were included in the “Other MOI” category. To see a detailed list of mechanisms of injury includedin the Other MOI category please see Appendix 3.
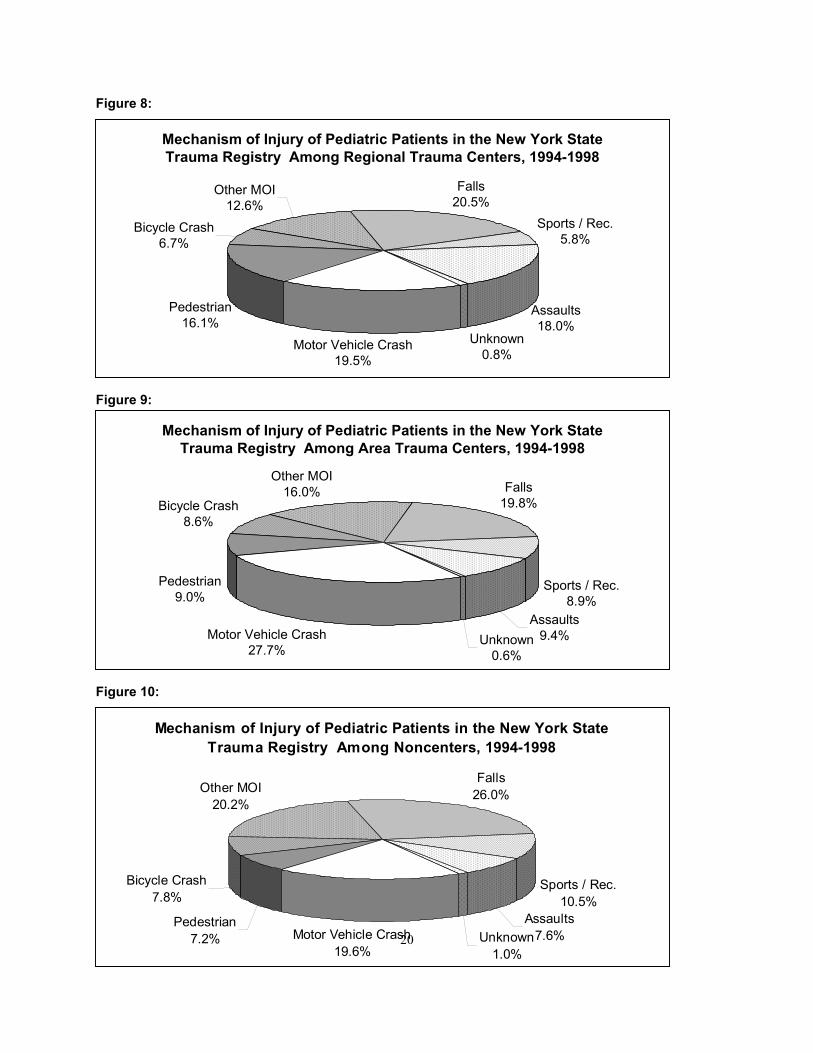
The most common MOIs statewide were falls (21.5%) followed by motor vehicle crashes (20.7%)(Figure 7). The distribution of mechanism of injury by hospital levels varies. For example, motor vehiclecrashes were the most common mechanism of injury for all hospital levels as a group, however theproportion of motor vehicle crashes varied by hospital level. For regional trauma centers 19.5% of theinjuries were due to motor vehicle crashes. Area trauma centers and noncenters had 27.7% and 19.6%respectively (Figures 8,9,10). Variation was also seen for falls with regional trauma centers having 20.5%,area trauma centers 19.8%, and noncenters 26.0%. For MOI by trauma region please see Appendix 5.
Figure 7:
Mechanism of Injury of Pediatric Patients in the New York State Trauma Registry, 1994-1998
Unknown0.8% MVC
20.7%
Falls21.5%
Assaults14.7%
Bicycle Crash7.2%
Sports / Rec.7.2%
Other MOI14.6%
Pedestrian13.4%
20
Figure 8:
Figure 9:
Figure 10:
���������������������������������������������������������������������������������������������������������������������������������������������������������������������������
������������������������������������������������������������������������������������������������������������������������������������������������������������������������������������ ������
������������������������
��������������������������������������������������������������������������������������������������������������������������������������������������
������������������������������������������������������������������������������������������������
���������������������������������������������������������������������������������������������������������������������������������������������������������������������������
���������
���������������������������������������������������������������������������������������������������
Motor Vehicle Crash27.7%
Pedestrian9.0%
Bicycle Crash8.6%
Other MOI16.0% Falls
19.8%
Assaults9.4%Unknown
0.6%
Sports / Rec.8.9%
Mechanism of Injury of Pediatric Patients in the New York State Trauma Registry Among Area Trauma Centers, 1994-1998
������������������������������������������������������������������������������������������������������������������������������������������������������������
��������������������������������������������������������������������������������������������������������������������������
�������������������������������������������������������������������������������������������������������������������������� ����������������������������
��������������������������������������������������������������������������������������������������������������������������������������������
�������������������������������������������������������������������������������������������������������������������������������������������������������������������������������������������
������������
������������������������������������������������������������������������������������������������������
Motor Vehicle Crash19.5%
Pedestrian16.1%
Bicycle Crash6.7%
Other MOI12.6%
Falls20.5%
Assaults18.0%
Unknown0.8%
Sports / Rec.5.8%
Mechanism of Injury of Pediatric Patients in the New York State Trauma Registry Among Regional Trauma Centers, 1994-1998
����������������������������������������������������������������������������������������������������������������������������������������������������������������������������������������������������������������������������������������������������������������������������
���������������������������������������������������������������������������������������������������������������������������������������������������������������������������������������
����������������������������������������
�����������������������������������������������������������������������������������������������������������������������������������������������������������������������������������������������������������
������������������������������������������������������������
�����������������������������������������������������������������������������������������������������������������������������������������������������������������������
���������������
���������������������������������������������������������������������������������������������������������
Motor Vehicle Crash19.6%
Pedestrian7.2%
Bicycle Crash7.8%
Other MOI20.2%
Falls26.0%
Assaults7.6%Unknown
1.0%
Sports / Rec.10.5%
Mechanism of Injury of Pediatric Patients in the New York State Trauma Registry Among Noncenters, 1994-1998
21
Figure 11:
* 1 patient aged 10-14 excluded for unknown genderFigure 12:
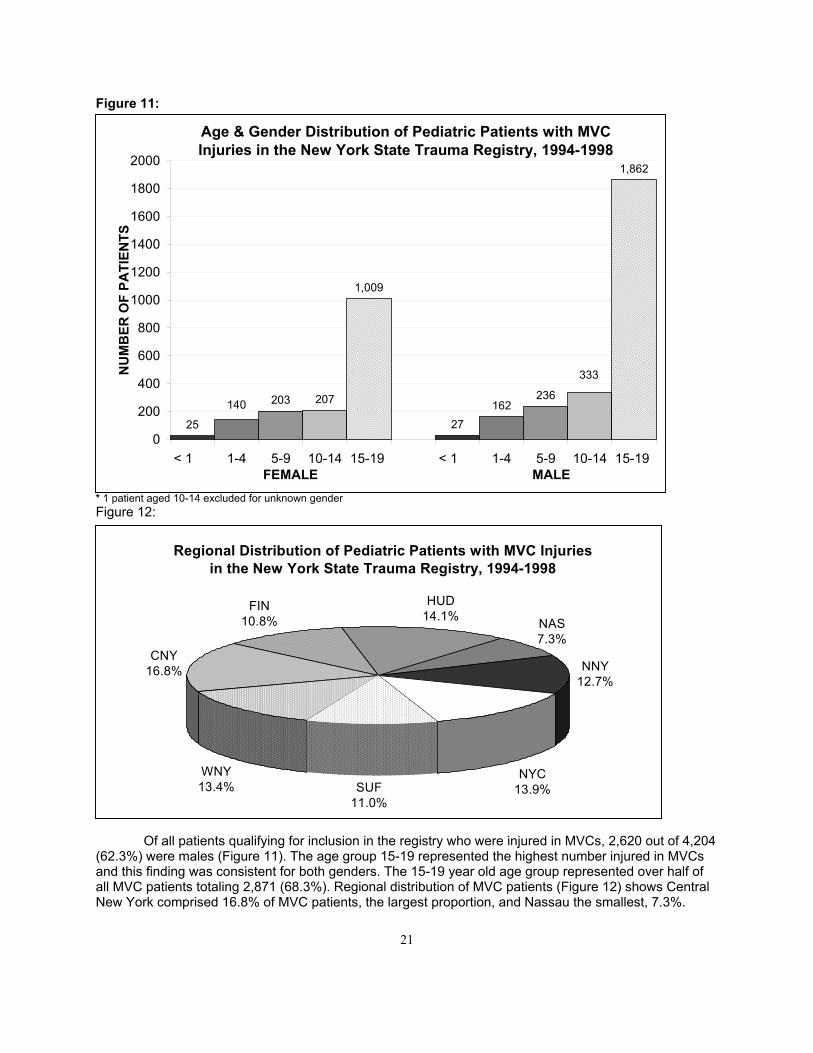
Of all patients qualifying for inclusion in the registry who were injured in MVCs, 2,620 out of 4,204(62.3%) were males (Figure 11). The age group 15-19 represented the highest number injured in MVCsand this finding was consistent for both genders. The 15-19 year old age group represented over half ofall MVC patients totaling 2,871 (68.3%). Regional distribution of MVC patients (Figure 12) shows CentralNew York comprised 16.8% of MVC patients, the largest proportion, and Nassau the smallest, 7.3%.
����������������������������������������������������������������������������������������������������������������������������������������������������������������������������������������������������������������������������������������
������������������������������������������������������������������������������������������������������������������������������������������������������������������������������������������������������������������������������������������������������������������������
����������������������������������������������������������������������������������������������������������������������������������������������������������������������������������������������������������������������������������������������������������������������������������������������������������������������������������������������������
������������������������������������������������������������������������������������������������������������������������������������������������������������
����������������������������������������������������������������������������������������������������������������������������������������������������������������������������������������������������������������
Regional Distribution of Pediatric Patients with MVC Injuries in the New York State Trauma Registry, 1994-1998
CNY16.8%
FIN10.8%
HUD14.1% NAS
7.3%
NNY12.7%
NYC13.9%SUF
11.0%
WNY13.4%
����������������������������������������������������������������������������������������������������������������������������������������������������������������������������������������������
������������������������������������������������������������������������������������������������������������������������������������������������������������������������������������������������������������������������������������������������������������������������������������������������������������������
Age & Gender Distribution of Pediatric Patients with MVC Injuries in the New York State Trauma Registry, 1994-1998
25
203 207
27162
236
333
140
1,862
1,009
0
200
400
600
800
1000
1200
1400
1600
1800
2000
< 1 1-4 5-9 10-14 15-19 < 1 1-4 5-9 10-14 15-19 FEMALE MALE
NU
MB
ER O
F PA
TIEN
TS

22
Figure 13:
* 2 patients aged 5-9 excluded for unknown gender
Figure 14:
Of all pediatric patients qualifying for the registry who were injured as pedestrians, 1,836 out of2,711 (67.7 %) were males (Figure 13). The 5-9 year old age group represented the highest proportion(38.0%) of all pediatric trauma patients injured as pedestrians totaling 1,033. By trauma region New YorkCity comprised 48.6% of all pedestrian injuries, the largest proportion, while the Finger Lakes had thesmallest at 6.2% (Figure 14).
������������������������������������������������������������������������������������������������������������������������������������������������������������������������������������������������������������������������������
������������������������������������������������������������������������������������������������������������������������������������������������������������������
���������������������������������������������������������������������������������������������������������������������������������������������������������������������������������������������������������������������������������������������������
������������������������������������������������������������������������������������������������������������������������������������
��������������������������������������������������������������������������������������������������������������������������������������������������������������������������������
Regional Distribution of Pediatric Patients with Pedestrian Injuries in the New York State Trauma Registry, 1994-1998
CNY6.9%
FIN6.2%
NAS7.0%
NNY6.3%
NYC48.6%
SUF7.4%
WNY9.4%
HUD8.2%
������������������������������������������������������������������������
������������������������������������������������������������������������������������������������������������������������������������������������3
111
334
8
236
697
334
561
164
263
0
100
200
300
400
500
600
700
800
< 1 1-4 5-9 10-14 15-19 < 1 1-4 5-9 10-14 15-19 FEMALE MALE
NU
MB
ER O
F PA
TIEN
TSAge & Gender Distribution of Pediatric Patients with Pedestrian Injuries
in the New York State Trauma Registry, 1994-1998

23

24
Figure 15:
* 2 patients aged 10-14 excluded for unknown gender
Figure 16:
Of the patients whose MOI was bicycle crash, 1,175 out of 1,456 (80.7%) were males (Figure 15).The age group 10-14 had the highest proportion of bicycle crashes for both genders, representing nearlyhalf of all bicycle crash patients totaling 668 (46.0%). Regional distribution of bicycle crash patients
��������������������������������������������������������������������������������������������������������������������������������������������������������������������������������������������������������������������������������������������������������������������
������������������������������������������������������������������������������������������������������������������������������������������������������������������������������������������������������������������������������������������
���������������������������������������������������������������������������������������������������������������������������������������������������������������������������������������������������������������������������������������������������������������������������������������������������������������������������������������������������������
���������������������������������������������������������������������������������������������������������������������������������������������������������������������������������������
����������������������������������������������������������������������������������������������������������������������������������������������������������������������������������������������������������������������������������������������������
CNY14.1%
FIN9.8%
HUD8.9%
NAS7.1% NNY
11.4%
NYC23.3%
SUF13.2%
WNY12.3%
Regional Distribution of Pediatric Patients with Bicycle Crash Injuries in the New York State Trauma Registry, 1994-1998
������������������������������������
������������������������������������������������������������������������������������������������������������������������������������������������������������������������������������0 6
113 128
342
39
307
540
287
0
100
200
300
400
500
600
< 1 1-4 5-9 10-14 15-19 < 1 1-4 5-9 10-14 15-19 FEMALE MALE
NU
MB
ER O
F PA
TIEN
TSAge & Gender Distribution of Pediatric Patients with Bicycle Crash Injuries
in the New York State Trauma Registry, 1994-1998

25
(Figure 16) shows that NYC had the largest proportion (23.3%), while Nassau had the smallest (7.1%).

26
Figure 17:
Figure 18:
For patients whose MOI was a fall, 2,971 out of 4,364 (68.1%) were males (Figure 17). The agegroup 1-4 represented nearly half of all falls patients totaling 1,848 (42.3%). Regional distribution of fallspatients found that New York City had the largest proportion at 26.0%, while the Finger Lakes had thesmallest at 8.2% (Figure 18).
��������������������������������������������������������������������������������������������������������������������������������������������������������������������������������������������������������������������������������������������������������������������������������
������������������������������������������������������������������������������������������������������������������������������������������������������������������������������������������������������������������������������������������������������������������������������������������������������
��������������������������������������������������������������������������������������������������������������������������������������������������������������������������������������������������������������������������������������������������������������������������������������������������������������������������������������
������������������������������������������������������������������������������������������������������������������������������������������������������������������������
������������������������������������������������������������������������������������������������������������������������������������������������������������������������
Regional Distribution of Pediatric Patients with Fall Injuries in the New York State Trauma Registry, 1994-1998
CNY12.6%
FIN8.2%
HUD11.9%
NAS8.8%
NNY10.5%
NYC26.0%
SUF8.8%
WNY13.1%
��������������������������������������
������������������������������������������������������������������������������������������������������������
Age & Gender Distribution of Pediatric Patients with Fall Injuries in the New York State Trauma Registry, 1994-1998
236
619
250162
308
1229
508 495431
126
0
200
400
600
800
1000
1200
1400
< 1 1-4 5-9 10-14 15-19 < 1 1-4 5-9 10-14 15-19 FEMALE MALE
NU
MB
ER O
F PA
TIEN
TS

27
Figure 19:
* 1 patient aged 5-9 excluded for unknown gender
Figure 20:
Of the patients whose MOI was sports/recreation, 1,311 out of 1,451 (90.4%) were males (Figure19). The combined age groups 10-14 and 15-19 represented approximately 30% of all sports/recreationinjuries. Regional distribution of patients with sports/recreation injuries shows that Western New York hadthe largest proportion at 20.6%, while the Finger Lakes had the smallest at 8.5% (Figure 20).
��������������������������������������������������������������������������������������������������������������������������������������������������������������������������������������������������������������������������������������������������������������������������������
��������������������������������������������������������������������������������������������������������������������������������������������������������������������������������������������������������������������������������������
����������������������������������������������������������������������������������������������������������������������������������������������������������������������������������������������������������������
������������������������������������������������������������������������������������������������������������������������������������������������������������������������������������������������������������������������������������������������������������������������������������������������������������������������������������������������������������������������������������������������������������������������������������������������������������������������������
��������������������������������������������������������������������������������������������������������������������������������������������������������������������������������������������������������������������������������������������������������������������������������������������������������������������
Regional Distribution of Pediatric Patients with Sports/Rec. Injuries in the New York State Trauma Registry, 1994-1998
CNY12.8%
FIN8.5%
HUD10.9%
NAS9.0%
NNY12.4%
NYC14.9%
SUF10.8%
WNY20.6%
���������������������������������������������������������
������������������������������������������������������������������������������������������������������������������������������������������������������������������������������������������������������������������������������������������������������������������������������3
56
12087
54
7
102
263
356
403
0
50
100
150
200
250
300
350
400
450
< 1 1-4 5-9 10-14 15-19 < 1 1-4 5-9 10-14 15-19 FEMALE MALE
NU
MB
ER O
F PA
TIEN
TSAge & Gender Distribution of Pediatric Patients with Sports/Rec.
Injuries in the New York State Trauma Registry, 1994-1998

28
Figure 21:
* 2 patients aged 15-19 excluded for unknown gender
Figure 22:
Of the patients whose MOI was assault, 2,613 out of 2,991 (87.4%) were males (Figure 21). Theage group 15-19 represented an overwhelming majority of all assault patients at 2,334 (78.0%). Malesaged 15-19 represented 72.9% of all pediatric assault patients. By trauma region New York Citycontained approximatly two-thirds of all assault patients (Figure 22).
������������������������������������������������������������������������������������������������������������������������������������������������������
������������������������������������������������������������������������������������������������������������������������������������������������������������������
�������������������������������������������������������������������������������������������������������������������������������������������������������������������������������������������������������������������������������������������������������������������������������������������������������������
��������������������������������������������������������������������
������������������������������������������������������������������������������������������������������������������������������������������������������������������������������������
Regional Distribution of Pediatric Patients with Assault Injuries in the New York State Trauma Registry, 1994-1998
CNY5.9%
FIN7.4%
HUD7.3%
NAS3.1%
NYC59.6%
SUF3.9%
WNY9.5%
NNY3.2%
��������������������������������������
������������������������������������������������������������������������������������������������������������������������������������������������������������������������������������������������������������������������������������������������������������������������������������������������������������������
Age & Gender Distribution of Pediatric Patients with Assault Injuries in the New York State Trauma Registry, 1994-1998
86 9018 29
155 130 12023
161
2179
0
500
1000
1500
2000
2500
< 1 1-4 5-9 10-14 15-19 < 1 1-4 5-9 10-14 15-19 FEMALE MALE
NU
MB
ER O
F PA
TIEN
TS
29
Mode of Transportation
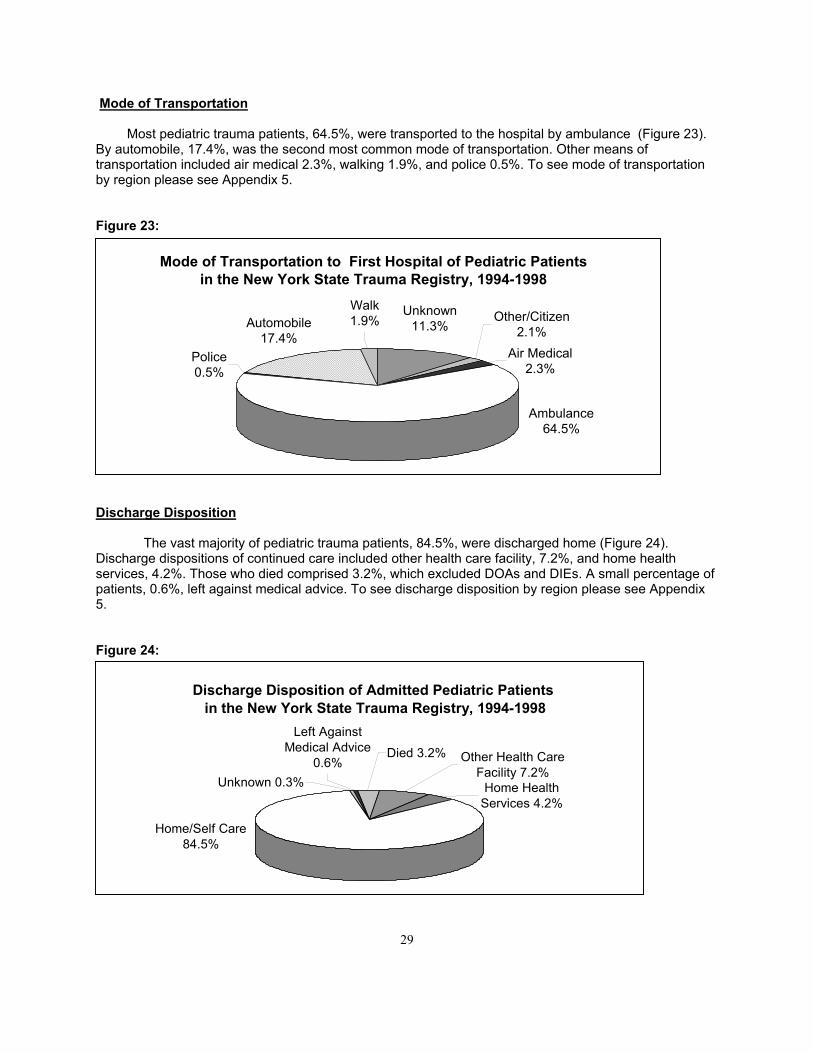
Most pediatric trauma patients, 64.5%, were transported to the hospital by ambulance (Figure 23).By automobile, 17.4%, was the second most common mode of transportation. Other means oftransportation included air medical 2.3%, walking 1.9%, and police 0.5%. To see mode of transportationby region please see Appendix 5.
Figure 23:
Discharge Disposition
The vast majority of pediatric trauma patients, 84.5%, were discharged home (Figure 24).Discharge dispositions of continued care included other health care facility, 7.2%, and home healthservices, 4.2%. Those who died comprised 3.2%, which excluded DOAs and DIEs. A small percentage ofpatients, 0.6%, left against medical advice. To see discharge disposition by region please see Appendix5.
Figure 24:
Home/Self Care84.5%
Other Health Care Facility 7.2%
Home Health Services 4.2%
Died 3.2%Left Against
Medical Advice 0.6%
Unknown 0.3%
Discharge Disposition of Admitted Pediatric Patients in the New York State Trauma Registry, 1994-1998
���������������������������������������������������������������������������������������������������������������������������������������������������������������
Air Medical2.3%
Other/Citizen2.1%
Ambulance64.5%
Police0.5%
Walk1.9%Automobile
17.4%
Unknown11.3%
Mode of Transportation to First Hospital of Pediatric Patients in the New York State Trauma Registry, 1994-1998

30
Functional Independence Measures (FIMs)
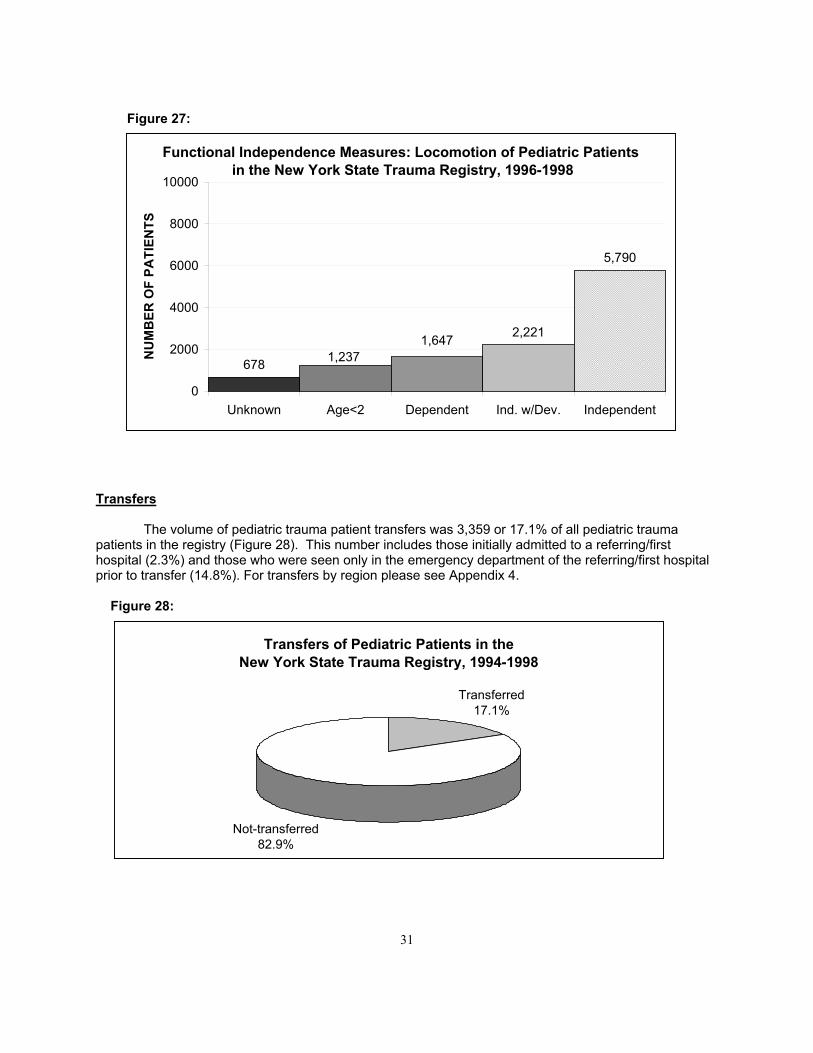
The Functional Independence Measures (FIMs) captured in the registry were feeding, expression(verbal or nonverbal), and locomotion. For a description of each measure please see Appendix 4. Due toa change in reporting procedure, 1994 and 1995 data was not used in this analysis of FIMS measures. Ofall pediatric trauma patients statewide, 8,860 (76.6%) measured independent for feeding (Figure 25).There were 8,633 (74.6%) who measured independent for expression and 5,790 (50.0%) who measuredindependent for locomotion (Figures 26 and 27). For FIMS by region please see Appendix 4.
Figure 25:
Figure 26:
�������������������������������������������������������������������������������������������������������������������������������������������������������������������������������������������������������������������������������������������������������������������������������������������������������������������������������������������������������������������������������������������������������������������������������������������������������������������������������������������������
665 431 60
8,860
1,557
0
2000
4000
6000
8000
10000
Unknown Age<3 Dependent Ind. w/Dev. Independent
NU
MB
ER O
F PA
TIEN
TS
Functional Independence Measures: Feeding of Pediatric Patients in the New York State Trauma Registry, 1996-1998
�������������������������������������������������������������������������������������������������������������������������������������������������������������������������������������������������������������������������������������������������������������������������������������������������������������������������������������������������������������������������������������������������������������������������������������������������������������������������������������������������
667233 41
8,633
1,999
0
2000
4000
6000
8000
10000
Unknown Age<5 Dependent Ind. w/Dev. Independent
NU
MB
ER O
F PA
TIEN
TS
Functional Independence Measures: Expression of Pediatric Patients in the New York State Trauma Registry, 1996-1998
31
Figure 27:
Transfers
The volume of pediatric trauma patient transfers was 3,359 or 17.1% of all pediatric traumapatients in the registry (Figure 28). This number includes those initially admitted to a referring/firsthospital (2.3%) and those who were seen only in the emergency department of the referring/first hospitalprior to transfer (14.8%). For transfers by region please see Appendix 4.
Figure 28:
���������������������������������������������������������������������������������������������������������������������������������������������������������������������������������������������������������������������������������������������������������������������������������������������������������������������������������������������
678
5,790
2,2211,6471,237
0
2000
4000
6000
8000
10000
Unknown Age<2 Dependent Ind. w/Dev. Independent
NU
MB
ER O
F PA
TIEN
TSFunctional Independence Measures: Locomotion of Pediatric Patients
in the New York State Trauma Registry, 1996-1998
Transfers of Pediatric Patients in the New York State Trauma Registry, 1994-1998
Not-transferred82.9%
Transferred17.1%

32
DOAs and DIEs
There were a total of 496 pediatric DOAs (2.4%) and 177 pediatric DIEs (0.9%) in the NewYork State Trauma Registry from 1994 - 1998. Approximately one-third (37.5%) of the DOA populationwere transported to regional centers (Figure 29). A total of 47.5% of the DIE population were treated atregional centers (Figure 30).
Figure 29:
Figure 30:
Distribution of Pediatric DOAs in the New York State Trauma Registry by Hospital Level, 1994-1998
Area21.0%
Noncenter41.5%
Regional37.5%
Distribution of Pediatric DIEs in the New York State Trauma Registry by Hospital Level, 1994-1998
Area22.0%
Noncenter30.5%
Regional47.5%
33
Figure 31:
Figure 32:
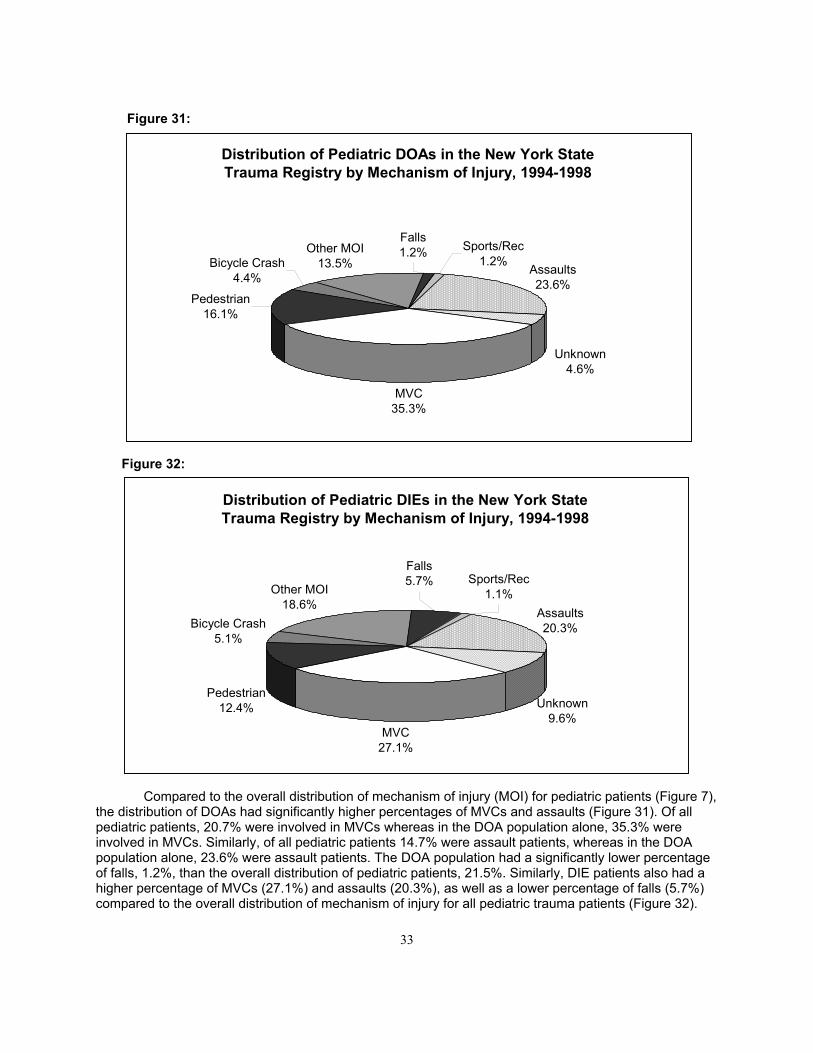
Compared to the overall distribution of mechanism of injury (MOI) for pediatric patients (Figure 7),the distribution of DOAs had significantly higher percentages of MVCs and assaults (Figure 31). Of allpediatric patients, 20.7% were involved in MVCs whereas in the DOA population alone, 35.3% wereinvolved in MVCs. Similarly, of all pediatric patients 14.7% were assault patients, whereas in the DOApopulation alone, 23.6% were assault patients. The DOA population had a significantly lower percentageof falls, 1.2%, than the overall distribution of pediatric patients, 21.5%. Similarly, DIE patients also had ahigher percentage of MVCs (27.1%) and assaults (20.3%), as well as a lower percentage of falls (5.7%)compared to the overall distribution of mechanism of injury for all pediatric trauma patients (Figure 32).
����
������������������������������������������������������������������������������������������������������������������������������������������������������������������������
������������������
������������������������������������������������������������������������������������������������������������
Distribution of Pediatric DOAs in the New York State Trauma Registry by Mechanism of Injury, 1994-1998
MVC35.3%
Pedestrian16.1%
Bicycle Crash4.4%
Other MOI13.5% Assaults
23.6%
Unknown4.6%
Falls1.2% Sports/Rec
1.2%
��������
�����������������������������������������������������������������������������������������������������������������������������������������������������������������������������������������
��������������������������������������������������������������������
���������������������������������������������������������������������������������������������������������������������������������������������������������������������
Distribution of Pediatric DIEs in the New York State Trauma Registry by Mechanism of Injury, 1994-1998
Unknown9.6%
MVC27.1%
Pedestrian12.4%
Bicycle Crash5.1%
Other MOI18.6%
Assaults20.3%
Sports/Rec1.1%
Falls5.7%
34
Figure 33:
Figure 34:
* 1 patient aged 15-19 excluded for unknown gender
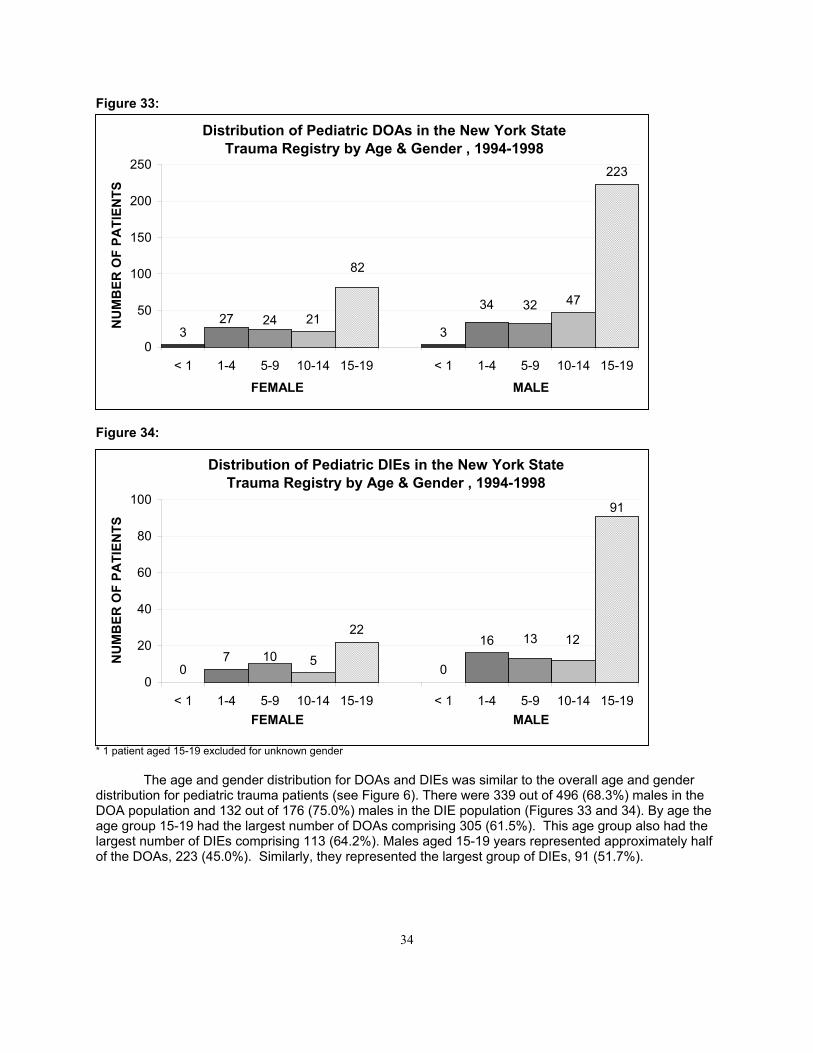
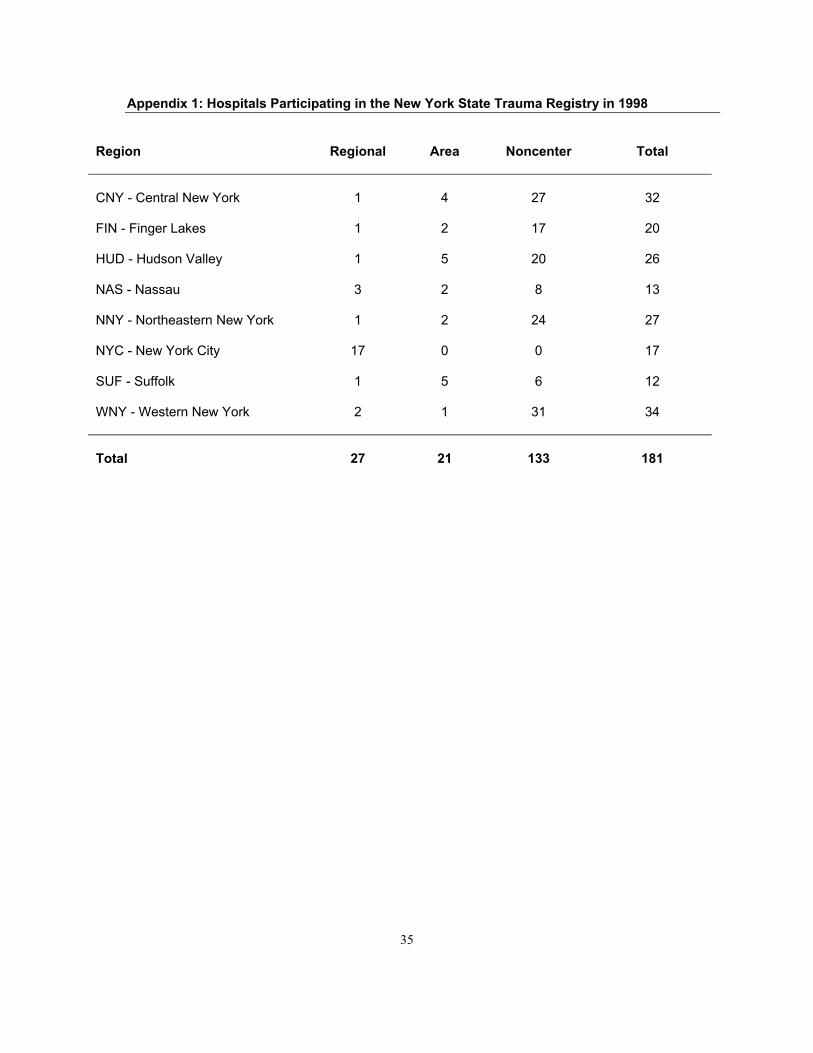
The age and gender distribution for DOAs and DIEs was similar to the overall age and genderdistribution for pediatric trauma patients (see Figure 6). There were 339 out of 496 (68.3%) males in theDOA population and 132 out of 176 (75.0%) males in the DIE population (Figures 33 and 34). By age theage group 15-19 had the largest number of DOAs comprising 305 (61.5%). This age group also had thelargest number of DIEs comprising 113 (64.2%). Males aged 15-19 years represented approximately halfof the DOAs, 223 (45.0%). Similarly, they represented the largest group of DIEs, 91 (51.7%).
������������������������������������������������������������������������
������������������������������������������������������������������������������������������������������������������������������������������������������������������������������������������������������
Distribution of Pediatric DOAs in the New York State Trauma Registry by Age & Gender , 1994-1998
321
3
47
223
24273234
82
0
50
100
150
200
250
< 1 1-4 5-9 10-14 15-19 < 1 1-4 5-9 10-14 15-19FEMALE MALE
NU
MB
ER O
F PA
TIEN
TS
������������������������������������������������������
������������������������������������������������������������������������������������������������������������������������������������������������������������������������������������������������������������������������
Distribution of Pediatric DIEs in the New York State Trauma Registry by Age & Gender , 1994-1998
07 5
22
0
16
91
121310
0
20
40
60
80
100
< 1 1-4 5-9 10-14 15-19 < 1 1-4 5-9 10-14 15-19FEMALE MALE
NU
MB
ER O
F PA
TIEN
TS
35
Appendix 1: Hospitals Participating in the New York State Trauma Registry in 1998
Region Regional Area Noncenter Total
CNY - Central New York 1 4 27 32
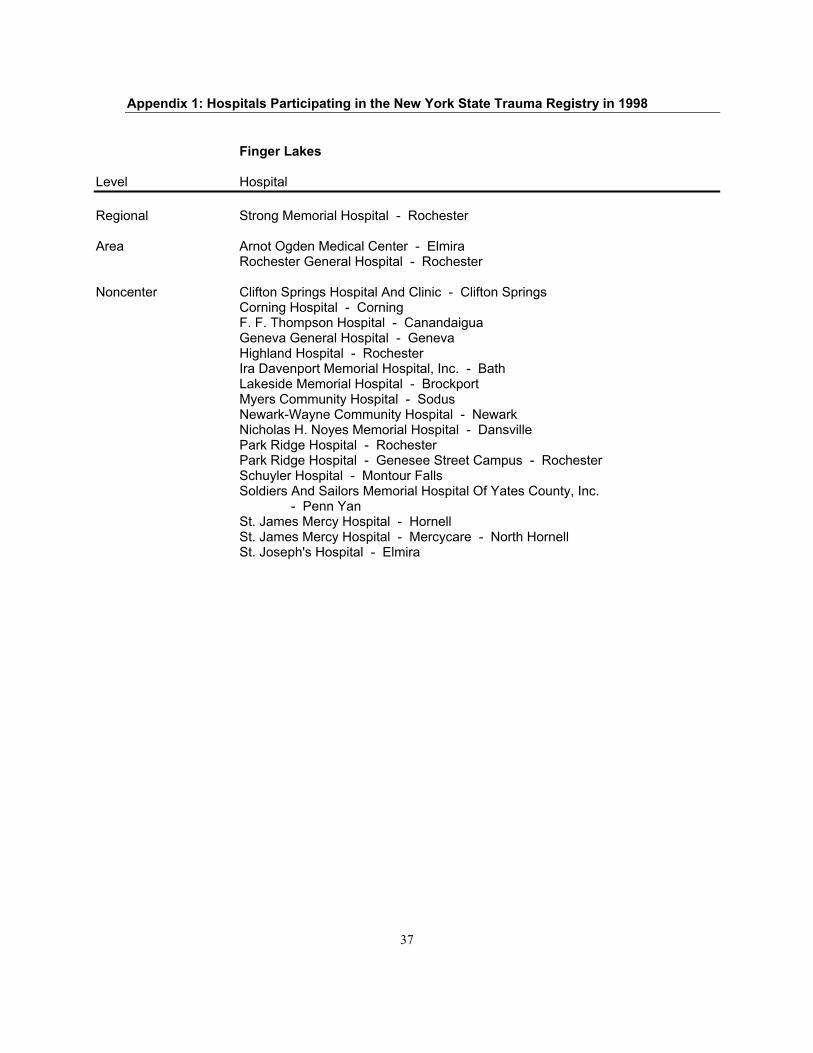
FIN - Finger Lakes 1 2 17 20
HUD - Hudson Valley 1 5 20 26
NAS - Nassau 3 2 8 13
NNY - Northeastern New York 1 2 24 27
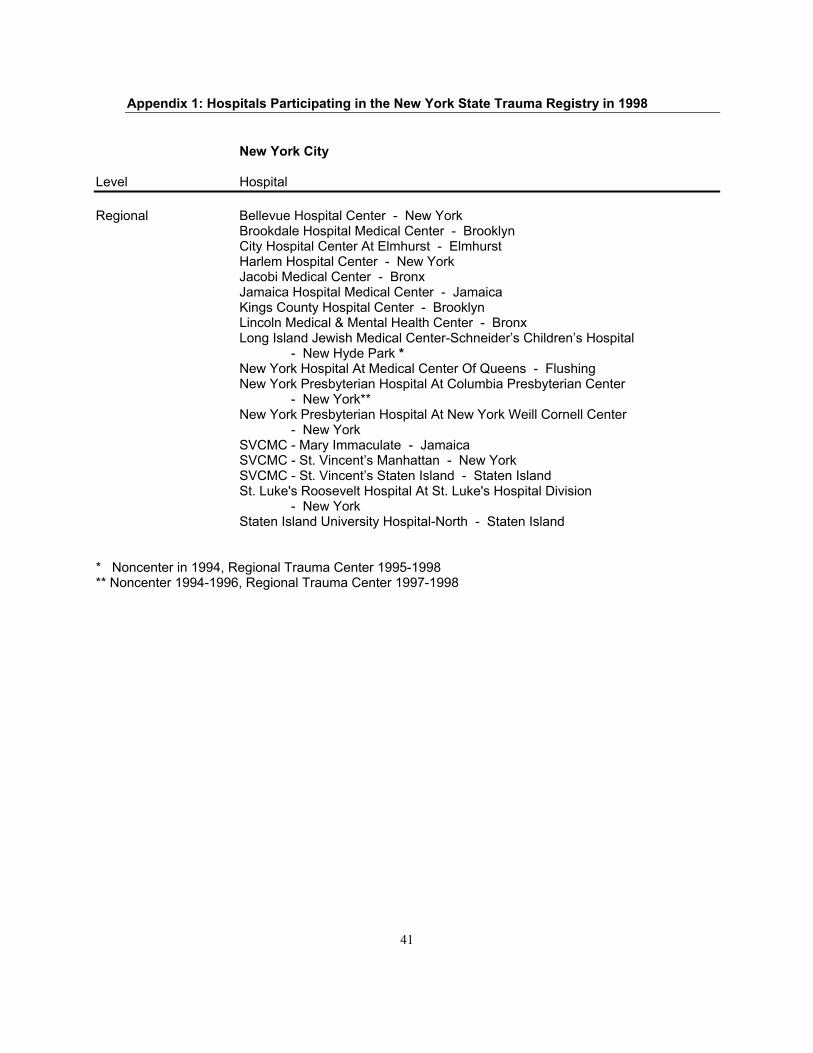
NYC - New York City 17 0 0 17
SUF - Suffolk 1 5 6 12
WNY - Western New York 2 1 31 34
Total 27 21 133 181

36
Appendix 1: Hospitals Participating in the New York State Trauma Registry in 1998
Central New York
Level HospitalRegional University Hospital SUNY Health Science Center - SyracuseArea Crouse Hospital - Syracuse
St. Elizabeth Medical Center - UticaSt. Joseph's Hospital Health Center - SyracuseUnited Health Services Hospitals, Inc.-Wilson Hospital Division
- Johnson City
Noncenter Albert Lindley Lee Memorial Hospital - FultonAuburn Memorial Hospital - AuburnCanton-Potsdam Hospital - PotsdamCarthage Area Hospital, Inc. - CarthageCayuga Medical Center At Ithaca - IthacaChenango Memorial Hospital, Inc. - NorwichClifton-Fine Hospital - Star LakeCommunity Memorial Hospital, Inc. - HamiltonCommunity-General Hospital Of Greater Syracuse - SyracuseCortland Memorial Hospital, Inc. - CortlandEdward John Noble Hospital Of Alexandria Bay - Alexandria BayEdward John Noble Hospital Of Gouverneur - GouverneurFaxton-St. Luke's Healthcare Faxton Division - UticaFaxton-St. Luke's Healthcare St. Luke's Division - New HartfordHepburn Medical Center - OgdensburgLewis County General Hospital - LowvilleLittle Falls Hospital - Little FallsMassena Memorial Hospital - MassenaMohawk Valley General Hospital - IlionMohawk Valley Heart Institute, Inc. - UticaOneida Healthcare Center - OneidaOswego Hospital - OswegoOur Lady Of Lourdes Memorial Hospital, Inc. - BinghamtonRome Memorial Hospital, Inc. - RomeSamaritan Medical Center - WatertownSamaritan Medical Center At Samaritan Medical Center - Stone St.
Division - WatertownSyracuse Veterans Administration Hospital - SyracuseThe Hospital - SidneyUnited Health Services Hospitals, Inc.-Binghamton General
Hospital Division - Binghamton
37
Appendix 1: Hospitals Participating in the New York State Trauma Registry in 1998
Finger Lakes
Level Hospital
Regional Strong Memorial Hospital - Rochester
Area Arnot Ogden Medical Center - Elmira Rochester General Hospital - Rochester
Noncenter Clifton Springs Hospital And Clinic - Clifton SpringsCorning Hospital - CorningF. F. Thompson Hospital - CanandaiguaGeneva General Hospital - GenevaHighland Hospital - RochesterIra Davenport Memorial Hospital, Inc. - BathLakeside Memorial Hospital - BrockportMyers Community Hospital - SodusNewark-Wayne Community Hospital - NewarkNicholas H. Noyes Memorial Hospital - DansvillePark Ridge Hospital - RochesterPark Ridge Hospital - Genesee Street Campus - RochesterSchuyler Hospital - Montour FallsSoldiers And Sailors Memorial Hospital Of Yates County, Inc.
- Penn YanSt. James Mercy Hospital - HornellSt. James Mercy Hospital - Mercycare - North HornellSt. Joseph's Hospital - Elmira

38
Appendix 1: Hospitals Participating in the New York State Trauma Registry in 1998
Hudson Valley
Level Hospital
Regional Westchester Medical Center - Valhalla
Area Good Samaritan Hospital Of Suffern - Suffern*Hudson Valley Hospital Center - Cortlandt Manor*Nyack Hospital - Nyack Sound Shore Medical Center Of Westchester - New Rochelle*St. Francis Hospital - Poughkeepsie
Noncenter Arden Hill Hospital - GoshenBenedictine Hospital - KingstonCommunity General Hospital Of Sullivan County - HarrisCommunity General Hospital Of Sullivan County G. Hermann Division
- HarrisCommunity Hospital At Dobbs Ferry - Dobbs FerryCornwall Hospital - CornwallKingston Hospital - KingstonLawrence Hospital - BronxvilleMercy Community Hospital - Port JervisMid-Hudson Health - PoughkeepsieMount Vernon Hospital - Mount VernonNorthern Dutchess Hospital - RhinebeckNorthern Westchester Hospital - Mount KiscoSt. Agnes Hospital - White PlainsSt. John’s Riverside Hospital - YonkersSt. Joseph’s Hospital Yonkers - YonkersSt. Luke's Hospital Of Newburgh - NewburghVassar Brothers Hospital - PoughkeepsieWhite Plains Hospital Center - White PlainsYonkers General Hospital - Yonkers
* Noncenter 1994-1997, Area Trauma Center 1998

39
Appendix 1: Hospitals Participating in the New York State Trauma Registry in 1998
Nassau
Level Hospital
Regional Nassau University Medical Center - East Meadow North Shore University Hospital - ManhassetWinthrop University Hospital - Mineola
Area Mercy Medical Center - Rockville CentreSouth Nassau Communities Hospital - Oceanside
Noncenter Franklin Hospital Medical Center - Valley StreamLong Beach Medical Center - Long BeachMassapequa General Hospital, Inc. - SeafordNew Island Hospital - BethpageNorth Shore University Hospital At Glen Cove - Glen CoveNorth Shore University Hospital At Plainview - PlainviewNorth Shore University Hospital At Syosset - SyossetSt. Francis Hospital - Roslyn

40
Appendix 1: Hospitals Participating in the New York State Trauma Registry in 1998
Northeastern New York
Level Hospital
Regional Albany Medical Center Hospital - Albany
Area Champlain Valley Physicians' Hospital Medical Center - PlattsburghMary Imogene Bassett Hospital - Cooperstown
Noncenter Adirondack Medical Center-Lake Placid Site - Lake PlacidAdirondack Medical Center-Saranac Lake Site - Saranac LakeAlbany Memorial Hospital - AlbanyAlbany Veterans Administration Hospital - AlbanyAlice Hyde Medical Center - MaloneAmsterdam Memorial Hospital - AmsterdamAurelia Osborn Fox Memorial Hospital - OneontaBassett Hospital Of Schoharie County - CobleskillColumbia Memorial Hospital - HudsonDelaware Valley Hospital, Inc. - WaltonEddy Cohoes Rehabilitation Center - CohoesElizabethtown Community Hospital - ElizabethtownEllis Hospital - SchenectadyGlens Falls Hospital - Glens FallsMargaretville Memorial Hospital - MargaretvilleMary Imogene Bassett Hospital - O’connor Division - CooperstownMary Mcclellan Hospital - CambridgeMoses-Ludington Hospital - TiconderogaNathan Littauer Hospital - GloversvilleSamaritan Hospital - TroySaratoga Hospital - Saratoga SpringsSeton Health System-St. Mary's Campus - TroySt. Clare's Hospital - SchenectadySt. Mary's Hospital At Amsterdam - AmsterdamSt. Peter's Hospital - Albany
41
Appendix 1: Hospitals Participating in the New York State Trauma Registry in 1998
New York City
Level Hospital
Regional Bellevue Hospital Center - New YorkBrookdale Hospital Medical Center - BrooklynCity Hospital Center At Elmhurst - ElmhurstHarlem Hospital Center - New YorkJacobi Medical Center - BronxJamaica Hospital Medical Center - JamaicaKings County Hospital Center - BrooklynLincoln Medical & Mental Health Center - BronxLong Island Jewish Medical Center-Schneider’s Children’s Hospital
- New Hyde Park *New York Hospital At Medical Center Of Queens - FlushingNew York Presbyterian Hospital At Columbia Presbyterian Center
- New York**New York Presbyterian Hospital At New York Weill Cornell Center
- New YorkSVCMC - Mary Immaculate - JamaicaSVCMC - St. Vincent’s Manhattan - New YorkSVCMC - St. Vincent’s Staten Island - Staten IslandSt. Luke's Roosevelt Hospital At St. Luke's Hospital Division
- New YorkStaten Island University Hospital-North - Staten Island
* Noncenter in 1994, Regional Trauma Center 1995-1998** Noncenter 1994-1996, Regional Trauma Center 1997-1998

42
Appendix 1: Hospitals Participating in the New York State Trauma Registry in 1998
Suffolk
Level Hospital
Regional University Hospital - Stony Brook
Area Brookhaven Memorial Hospital Medical Center, Inc. - Patchogue*Good Samaritan Hospital Medical Center - West Islip*Huntington Hospital - Huntington*Southside Hospital - Bay Shore*St. Catherine Of Siena Hospital - Smithtown*
Noncenter Brunswick Hospital Center, Inc. - AmityvilleCentral Suffolk Hospital - RiverheadEastern Long Island Hospital - GreenportJohn T. Mather Memorial Hospital Of Port Jefferson New York, Inc.
- Port JeffersonSouthampton Hospital - SouthamptonSt. Charles Hospital And Rehabilitation Center, Inc.
- Port Jefferson
* Noncenter in 1994, Area Trauma Center 1995-1998

43
Appendix 1: Hospitals Participating in the New York State Trauma Registry in 1998
Western New York
Level Hospital
Regional Children's Hospital of Buffalo - Buffalo Erie County Medical Center - Buffalo
Area Woman's Christian Association - Jamestown
Noncenter Batavia Veterans Administration Hospital - BataviaBertrand Chaffee Hospital - SpringvilleBrooks Memorial Hospital - DunkirkBuffalo General Hospital - BuffaloBuffalo Veterans Administration Hospital - BuffaloColumbus Community Healthcare Center - BuffaloCuba Memorial Hospital, Inc. - CubaDegraff Memorial Hospital - North TonawandaInter-Community Memorial Hospital at Newfane, Inc. - NewfaneKenmore Mercy Hospital - KenmoreLake Shore Hospital, Inc. - IrvingLockport Memorial Hospital - LockportMedina Memorial Hospital - MedinaMemorial Hospital Of Wm. F. & Gertrude F. Jones A/K/A Jones
Memorial Hospital - WellsvilleMercy Hospital - BuffaloMillard Fillmore Hospital - BuffaloMillard Fillmore Suburban Hospital - AmherstMount St. Mary's Hospital And Health Center - LewistonNiagara Falls Memorial Medical Center - Niagara FallsOlean General Hospital At Olean General Hospital Main - OleanOlean General Hospital At Olean General West - OleanOur Lady Of Victory Hospital Of Lackawanna - LackawannaSalamanca Health Care Complex - Salamanca (Closed Early 1998)Sheehan Memorial Hospital - BuffaloSisters Of Charity Hospital - BuffaloSt. Joseph Hospital Of Cheektowaga At New York - CheektowagaTri-County Memorial Hospital - GowandaUnited Memorial Medical Center Bank Street Campus - BataviaUnited Memorial Medical Center North Street Campus - BataviaWestfield Memorial Hospital, Inc. - Westfield

44
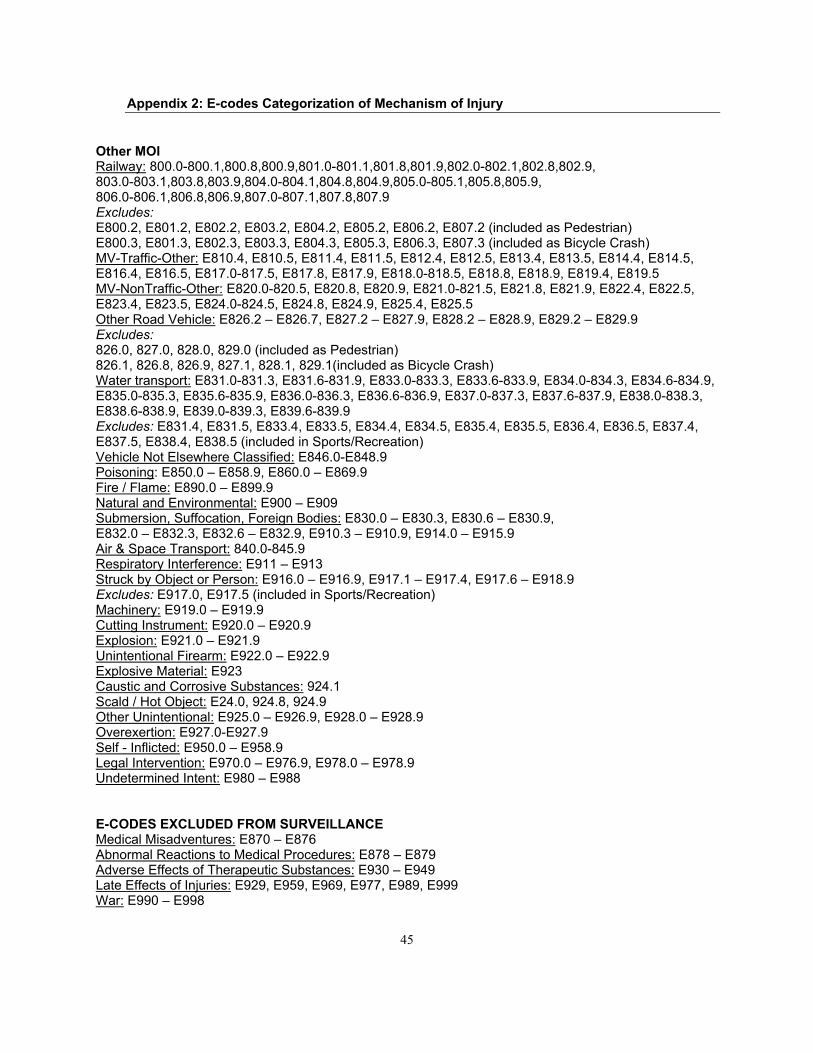
Appendix 2: E-codes Categorization of Mechanism of Injury
Motor Vehicle CrashE810.0 – E810.3, E810.8, E810.9, E811.0 – E811.3, E811.8, E811.9, E812.0 – E812.3, E812.8, E812.9, E813.0 – E813.3, E813.8, E813.9, E814.0 – E814.3, E814.8, E814.9, E815.0 – E815.3, E815.8, E815.9, E816.0 – E816.3, E816.8, E816.9, E819.0 – E819.3, E819.8, E819.9, E822.0 – E822.3, E822.8, E822.9, E823.0 – E823.3, E823.8, E823.9, E825.0 – E825.3, E825.8, E825.9
Exclusions: .4 = occupant of street car (included in Other MOI).5 = rider of animal (included in Other MOI).6 = Pedal Cyclist (included in Bicycle Crash).7 = Pedestrian (included in Pedestrians)E817 = Noncollision traffic accident while boarding/alighting (included in Other MOI)E818 = Other noncollision traffic accident (included in Other MOI)E820 = Nontraffic accident involving motor-driven snow vehicle (included in Other MOI)E821 = Nontraffic accident involving other off-road motor vehicle (included in Other MOI)E824 = Other nontraffic accident while boarding/alighting (included in Other MOI)
PedestrianRailway Related: E800.2, E801.2, E802.2, E803.2, E804.2, E805.2, E806.2, E807.2Motor Vehicle Related: E810.7, E811.7, E812.7, E813.7, E814.7, E815.7, E816.7, E817.7, E818.7,E819.7, E820.7, E821.7, E822.7, E823.7, E824.7, E825.7Other Road Vehicle Related: E826.0, E827.0, E828.0, E829.0
Bicycle CrashRailway Related: E800.3, E801.3, E802.3, E803.3, E804.3, E805.3, E806.3, E807.3Motor Vehicle Related: E810.6, E811.6, E812.6, E813.6, E814.6, E815.6, E816.6, E817.6, E818.6,E819.6, E820.6, E821.6, E822.6, E823.6, E824.6, E825.6 Other Road Vehicle Related: E826.1, E826.8, E826.9, E827.1, E828.1, E829.1
FallsE880.0 – E882.9, E883.1 – E883.9, E884.1 – E884.9, E885.0, E885.5 – E885.9, E886.1 – E888.9Exclusions: E883.0, E884.0, E885.1 – E885.4, E886.0 (included in Sports/Recreation)
Sports / RecreationWater Transport Related: E831.4, E831.5, E833.4, E833.5, E834.4, E834.5, E835.4, E835.5, E836.4,E836.5, E837.4, E837.5, E838.4, E838.5, Falls Related: E883.0, E884.0, E885.1 – E885.4, E886.0 Submersion Related: E830.4, E830.5, E832.4, E832.5, E910.0-910.2E883.0, E884.0, E885.1-885.4, E886.0, E917.0, E917.5Struck by Object or Person Related: E917.0, E917.5
AssaultsE960.0 – E968.9
45
Appendix 2: E-codes Categorization of Mechanism of Injury
Other MOIRailway: 800.0-800.1,800.8,800.9,801.0-801.1,801.8,801.9,802.0-802.1,802.8,802.9,803.0-803.1,803.8,803.9,804.0-804.1,804.8,804.9,805.0-805.1,805.8,805.9,806.0-806.1,806.8,806.9,807.0-807.1,807.8,807.9Excludes:E800.2, E801.2, E802.2, E803.2, E804.2, E805.2, E806.2, E807.2 (included as Pedestrian)E800.3, E801.3, E802.3, E803.3, E804.3, E805.3, E806.3, E807.3 (included as Bicycle Crash)MV-Traffic-Other: E810.4, E810.5, E811.4, E811.5, E812.4, E812.5, E813.4, E813.5, E814.4, E814.5,E816.4, E816.5, E817.0-817.5, E817.8, E817.9, E818.0-818.5, E818.8, E818.9, E819.4, E819.5MV-NonTraffic-Other: E820.0-820.5, E820.8, E820.9, E821.0-821.5, E821.8, E821.9, E822.4, E822.5,E823.4, E823.5, E824.0-824.5, E824.8, E824.9, E825.4, E825.5Other Road Vehicle: E826.2 – E826.7, E827.2 – E827.9, E828.2 – E828.9, E829.2 – E829.9Excludes: 826.0, 827.0, 828.0, 829.0 (included as Pedestrian)826.1, 826.8, 826.9, 827.1, 828.1, 829.1(included as Bicycle Crash)Water transport: E831.0-831.3, E831.6-831.9, E833.0-833.3, E833.6-833.9, E834.0-834.3, E834.6-834.9,E835.0-835.3, E835.6-835.9, E836.0-836.3, E836.6-836.9, E837.0-837.3, E837.6-837.9, E838.0-838.3,E838.6-838.9, E839.0-839.3, E839.6-839.9Excludes: E831.4, E831.5, E833.4, E833.5, E834.4, E834.5, E835.4, E835.5, E836.4, E836.5, E837.4,E837.5, E838.4, E838.5 (included in Sports/Recreation)Vehicle Not Elsewhere Classified: E846.0-E848.9Poisoning: E850.0 – E858.9, E860.0 – E869.9Fire / Flame: E890.0 – E899.9 Natural and Environmental: E900 – E909Submersion, Suffocation, Foreign Bodies: E830.0 – E830.3, E830.6 – E830.9, E832.0 – E832.3, E832.6 – E832.9, E910.3 – E910.9, E914.0 – E915.9 Air & Space Transport: 840.0-845.9Respiratory Interference: E911 – E913 Struck by Object or Person: E916.0 – E916.9, E917.1 – E917.4, E917.6 – E918.9Excludes: E917.0, E917.5 (included in Sports/Recreation)Machinery: E919.0 – E919.9 Cutting Instrument: E920.0 – E920.9Explosion: E921.0 – E921.9Unintentional Firearm: E922.0 – E922.9Explosive Material: E923Caustic and Corrosive Substances: 924.1Scald / Hot Object: E24.0, 924.8, 924.9Other Unintentional: E925.0 – E926.9, E928.0 – E928.9 Overexertion: E927.0-E927.9Self - Inflicted: E950.0 – E958.9Legal Intervention: E970.0 – E976.9, E978.0 – E978.9Undetermined Intent: E980 – E988
E-CODES EXCLUDED FROM SURVEILLANCEMedical Misadventures: E870 – E876Abnormal Reactions to Medical Procedures: E878 – E879Adverse Effects of Therapeutic Substances: E930 – E949Late Effects of Injuries: E929, E959, E969, E977, E989, E999War: E990 – E998

46

47
Appendix 3: Injuries Included in Other MOI
Injuries Included in Other MOI Railway 29MV-Traffic-Other 209MV-NonTraffic-Other 385Other Road Vehicle 109Submersion/Suffocation/Foreign Bodies 26Water Transport 19Air & Space Transport 5Vehicle Not Elsewhere Classified 126Poisoning 19Fire/Flame 12Natural Environmental 124Respiratory Interference 9Struck by Object or Person 700Machinery 104Cutting Instrument 266Explosion 3Unintentional Firearm 176Explosive Materials 45Scald/Hot Object 4Other Unintentional 218Overexertion 111Self-Inflicited 126Legal Intervention 11Undetermined Intent 122
48
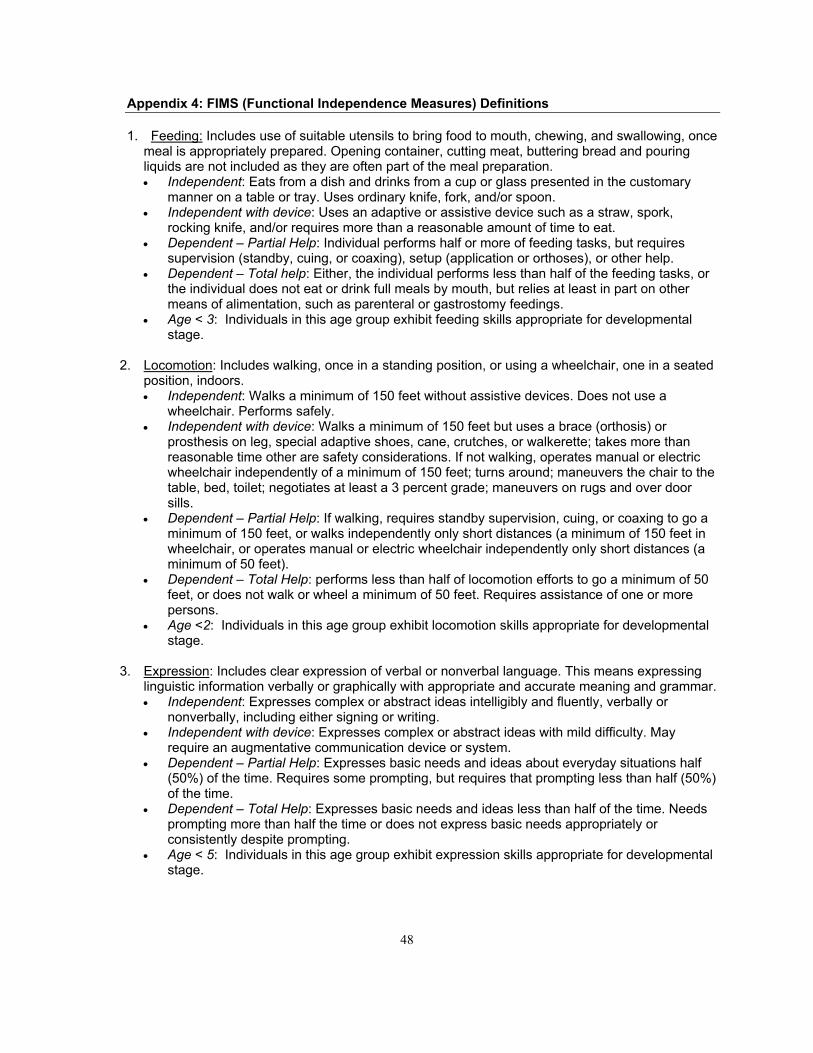
Appendix 4: FIMS (Functional Independence Measures) Definitions
1. Feeding: Includes use of suitable utensils to bring food to mouth, chewing, and swallowing, oncemeal is appropriately prepared. Opening container, cutting meat, buttering bread and pouringliquids are not included as they are often part of the meal preparation.• Independent: Eats from a dish and drinks from a cup or glass presented in the customary
manner on a table or tray. Uses ordinary knife, fork, and/or spoon.• Independent with device: Uses an adaptive or assistive device such as a straw, spork,
rocking knife, and/or requires more than a reasonable amount of time to eat.• Dependent – Partial Help: Individual performs half or more of feeding tasks, but requires
supervision (standby, cuing, or coaxing), setup (application or orthoses), or other help.• Dependent – Total help: Either, the individual performs less than half of the feeding tasks, or
the individual does not eat or drink full meals by mouth, but relies at least in part on othermeans of alimentation, such as parenteral or gastrostomy feedings.
• Age < 3: Individuals in this age group exhibit feeding skills appropriate for developmentalstage.
2. Locomotion: Includes walking, once in a standing position, or using a wheelchair, one in a seatedposition, indoors. • Independent: Walks a minimum of 150 feet without assistive devices. Does not use a
wheelchair. Performs safely. • Independent with device: Walks a minimum of 150 feet but uses a brace (orthosis) or
prosthesis on leg, special adaptive shoes, cane, crutches, or walkerette; takes more thanreasonable time other are safety considerations. If not walking, operates manual or electricwheelchair independently of a minimum of 150 feet; turns around; maneuvers the chair to thetable, bed, toilet; negotiates at least a 3 percent grade; maneuvers on rugs and over doorsills.
• Dependent – Partial Help: If walking, requires standby supervision, cuing, or coaxing to go aminimum of 150 feet, or walks independently only short distances (a minimum of 150 feet inwheelchair, or operates manual or electric wheelchair independently only short distances (aminimum of 50 feet).
• Dependent – Total Help: performs less than half of locomotion efforts to go a minimum of 50feet, or does not walk or wheel a minimum of 50 feet. Requires assistance of one or morepersons.
• Age <2: Individuals in this age group exhibit locomotion skills appropriate for developmentalstage.
3. Expression: Includes clear expression of verbal or nonverbal language. This means expressinglinguistic information verbally or graphically with appropriate and accurate meaning and grammar.• Independent: Expresses complex or abstract ideas intelligibly and fluently, verbally or
nonverbally, including either signing or writing. • Independent with device: Expresses complex or abstract ideas with mild difficulty. May
require an augmentative communication device or system. • Dependent – Partial Help: Expresses basic needs and ideas about everyday situations half
(50%) of the time. Requires some prompting, but requires that prompting less than half (50%)of the time.
• Dependent – Total Help: Expresses basic needs and ideas less than half of the time. Needsprompting more than half the time or does not express basic needs appropriately orconsistently despite prompting.
• Age < 5: Individuals in this age group exhibit expression skills appropriate for developmentalstage.

49
Appendix 5: Regional - Central New York
GENDER & AGEFrequency|Percent |Row Pct |Col Pct | < 1 | 1 - 4 | 5 - 9 |10 - 14 |15 - 19 | Total | | | | | |---------+--------+--------+--------+--------+--------+FEMALE | 41 | 177 | 137 | 136 | 253 | 744 | 1.55 | 6.71 | 5.20 | 5.16 | 9.59 | 28.21 | 5.51 | 23.79 | 18.41 | 18.28 | 34.01 | | 35.65 | 35.40 | 29.34 | 25.37 | 24.83 |---------+--------+--------+--------+--------+--------+MALE | 74 | 323 | 329 | 400 | 766 | 1892 | 2.81 | 12.25 | 12.48 | 15.17 | 29.05 | 71.75 | 3.91 | 17.07 | 17.39 | 21.14 | 40.49 | | 64.35 | 64.60 | 70.45 | 74.63 | 75.17 |---------+--------+--------+--------+--------+--------+UNKNOWN | 0 | 0 | 1 | 0 | 0 | 1 | 0.00 | 0.00 | 0.04 | 0.00 | 0.00 | 0.04 | 0.00 | 0.00 | 100.00 | 0.00 | 0.00 | | 0.00 | 0.00 | 0.21 | 0.00 | 0.00 |---------+--------+--------+--------+--------+--------+Total 115 500 467 536 1019 2637 4.36 18.96 17.71 20.33 38.64 100.00
Mechanism of InjuryMechanism of Injury Frequency Percent---------------------------------------------Unknown 26 0.99Other MOI 598 22.68Pedestrian 187 7.09Motor Vehicle Crash 707 26.81Bicycle Crash 205 7.77Sports / Recreation 186 7.05Falls 550 20.86Assaults 178 6.75

50
Appendix 5: Regional - Central New York
Mode of transportation to first hospitalTransportation Frequency Percent------------------------------------UNK/MIS 277 10.50Air Medical 103 3.91Ambulance 1651 62.61Citizen 28 1.06Automobile 494 18.73Other 47 1.78Police 1 0.04Walk 36 1.37
Status at the referring hospitalTransferred Frequency Percent-------------------------------------------------------------admitted to a referring hospital 42 1.59at ED only of referring hospital 475 18.01no contact with a referring hospital 2120 80.39
Deaths Before AdmissionDOADIE Frequency Percent-------------------------------DIE 30 1.14DOA 77 2.92

51
Appendix 5: Regional - Central New York
Discharge Disposition from the final hospitalDischarge Disposition Frequency Percent----------------------------------------------------------UNK/MIS 5 0.20Died after Admitted 74 2.92Home 2117 83.68Home Health Services 138 5.45Left Against Medical Advice 7 0.28Other Health Care Facility 189 7.47
Feeding status at discharge from the final hospitalFEED Frequency Percent-------------------------------------------Unknown 87 5.89AGE < 3 224 15.16Dep. w/ Part. Help 12 0.81Dep. w/ Total Help 24 1.62Indep. W/Dev. 4 0.27Independent 1127 76.25
Expression status at discharge from the final hospitalEXPRESS Frequency Percent-------------------------------------------Unknown 86 5.82AGE < 5 293 19.82Dep. w/ Part. Help 16 1.08Dep. w/ Total Help 19 1.29Indep. W/Dev. 4 0.27Independent 1060 71.72
Locomotion status at discharge from the final hospital LOCO Frequency Percent-------------------------------------------Unknown 86 5.82AGE < 2 163 11.03Dep. w/ Total Help 92 6.22Dep. w/ Part. Help 87 5.89Indep. W/Dev. 291 19.69Independent 759 51.35

52
Appendix 5: Regional – Finger Lakes
GENDER & AGE Frequency|Percent |Row Pct |Col Pct | < 1 | 1 - 4 | 5 - 9 |10 - 14 |15 - 19 | Total | | | | | |---------+--------+--------+--------+--------+--------+UNKNOWN | 0 | 0 | 0 | 0 | 1 | 1 | 0.00 | 0.00 | 0.00 | 0.00 | 0.06 | 0.06 | 0.00 | 0.00 | 0.00 | 0.00 | 100.00 | | 0.00 | 0.00 | 0.00 | 0.00 | 0.13 |---------+--------+--------+--------+--------+--------+FEMALE | 32 | 119 | 105 | 107 | 178 | 541 | 1.77 | 6.56 | 5.79 | 5.90 | 9.82 | 29.84 | 5.91 | 22.00 | 19.41 | 19.78 | 32.90 | | 53.33 | 39.02 | 30.88 | 29.56 | 23.86 |---------+--------+--------+--------+--------+--------+MALE | 28 | 186 | 235 | 255 | 567 | 1271 | 1.54 | 10.26 | 12.96 | 14.07 | 31.27 | 70.10 | 2.20 | 14.63 | 18.49 | 20.06 | 44.61 | | 46.67 | 60.98 | 69.12 | 70.44 | 76.01 |---------+--------+--------+--------+--------+--------+Total 60 305 340 362 746 1813 3.31 16.82 18.75 19.97 41.15 100.00
Mechanism of InjuryMechanism of Injury Frequency Percent----------------------------------------------Unknown 11 0.61Pedestrian 167 9.21Motor Vehicle Crash 455 25.10Bicycle Crash 143 7.89Other MOI 335 18.48Falls 358 19.75Sports / Recreation 124 6.84Assaults 220 12.13

53
Appendix 5: Regional – Finger Lakes
Mode of transportation to first hospitalTransportation Frequency Percent------------------------------------UNK/MIS 511 28.19Air Medical 52 2.87Ambulance 994 54.83Automobile 228 12.58Citizen 17 0.94Other 5 0.28Police 1 0.06Walk 5 0.28
Status at the referring hospitalTransferred Frequency Percent-------------------------------------------------------------admitted to a referring hospital 21 1.16at ED only of referring hospital 370 20.41no contact with a referring hospital 1422 78.43
Deaths Before AdmissionDOADIE Frequency Percent-------------------------------DIE 18 0.99DOA 63 3.47

54
Appendix 5: Regional – Finger Lakes
Discharge Disposition from the final hospitalDischarge Disposition Frequency Percent----------------------------------------------------------Died after Admitted 53 3.06Home 1457 84.12Home Health Services 112 6.47Left Against Medical Advice 6 0.35UNK/MIS 3 0.17Other Health Care Facility 101 5.83
Feeding status at discharge from the final hospitalFrequency Percent-------------------------------------------Unknown 58 5.84AGE < 3 111 11.18Dep. w/ Part. Help 40 4.03Dep. w/ Total Help 15 1.51Indep. W/Dev. 3 0.30Independent 766 77.14
Expression status at discharge from the final hospitalEXPRESS Frequency Percent-------------------------------------------Unknown 58 5.84AGE < 5 158 15.91Dep. w/ Part. Help 8 0.81Dep. w/ Total Help 3 0.30Independent 766 77.14
Locomotion status at discharge from the final hospital LOCO Frequency Percent-------------------------------------------Unknown 60 6.04AGE < 2 88 8.86Dep. w/ Total Help 70 7.05Dep. w/ Part. Help 44 4.43Indep. W/Dev. 227 22.86Independent 504 50.76

55
Appendix 5: Regional – Hudson Valley
GENDER & AGE Frequency|Percent |Row Pct |Col Pct | < 1 | 1 - 4 | 5 - 9 |10 - 14 |15 - 19 | Total | | | | | |---------+--------+--------+--------+--------+--------+FEMALE | 41 | 141 | 145 | 101 | 214 | 642 | 1.89 | 6.51 | 6.69 | 4.66 | 9.88 | 29.63 | 6.39 | 21.96 | 22.59 | 15.73 | 33.33 | | 44.57 | 36.62 | 32.88 | 23.99 | 25.85 |---------+--------+--------+--------+--------+--------+MALE | 51 | 244 | 294 | 318 | 614 | 1521 | 2.35 | 11.26 | 13.57 | 14.67 | 28.33 | 70.19 | 3.35 | 16.04 | 19.33 | 20.91 | 40.37 | | 55.43 | 63.38 | 66.67 | 75.53 | 74.15 |---------+--------+--------+--------+--------+--------+UNKNOWN | 0 | 0 | 2 | 2 | 0 | 4 | 0.00 | 0.00 | 0.09 | 0.09 | 0.00 | 0.18 | 0.00 | 0.00 | 50.00 | 50.00 | 0.00 | | 0.00 | 0.00 | 0.45 | 0.48 | 0.00 |---------+--------+--------+--------+--------+--------+Total 92 385 441 421 828 2167 4.25 17.77 20.35 19.43 38.21 100.00
Mechanism of InjuryMechanism of Injury Frequency Percent----------------------------------------------Unknown 5 0.23Other MOI 321 14.81Motor Vehicle Crash 592 27.32Bicycle Crash 130 6.00Pedestrian 221 10.20Sports / Recreation 158 7.29Falls 521 24.04Assaults 219 10.11

56
Appendix 5: Regional – Hudson Valley
Mode of transportation to first hospitalTransportation Frequency Percent------------------------------------UNK/MIS 174 8.03Air Medical 165 7.61Ambulance 1236 57.04Citizen 11 0.51Automobile 468 21.60Other 62 2.86Police 8 0.37Walk 43 1.98
Status at the referring hospitalTransferred Frequency Percent-------------------------------------------------------------admitted to a referring hospital 79 3.65at ED only of referring hospital 508 23.44no contact with a referring hospital 1580 72.91
Deaths Before AdmissionDOADIE Frequency Percent-------------------------------DIE 20 0.92DOA 48 2.22

57
Appendix 5: Regional – Hudson Valley
Discharge Disposition from the final hospitalDischarge Disposition Frequency Percent----------------------------------------------------------Died after Admitted 78 3.72Home 1702 81.09Home Health Services 110 5.24Other Health Care Facility 199 9.48Left Against Medical Advice 8 0.38UNK/MIS 2 0.10
Feeding status at discharge from the final hospitalFEED Frequency Percent-------------------------------------------Unknown 155 12.25AGE < 3 161 12.73Dep. w/ Part. Help 12 0.95Dep. w/ Total Help 24 1.90Indep. W/Dev. 13 1.03Independent 900 71.15
Expression status at discharge from the final hospitalEXPRESS Frequency Percent-------------------------------------------Unknown 153 12.09AGE < 5 205 16.21Dep. w/ Part. Help 10 0.79Dep. w/ Total Help 15 1.19Indep. W/Dev. 18 1.42Independent 864 68.30
Locomotion status at discharge from the final hospital LOCO Frequency Percent-------------------------------------------Unknown 159 12.57AGE < 2 128 10.12Dep. w/ Total Help 107 8.46Dep. w/ Part. Help 32 2.53Indep. W/Dev. 282 22.29Independent 557 44.03

58
Appendix 5: Regional – Nassau
GENDER & AGE Frequency|Percent |Row Pct |Col Pct | < 1 | 1 - 4 | 5 - 9 |10 - 14 |15 - 19 | Total | | | | | |---------+--------+--------+--------+--------+--------+FEMALE | 39 | 89 | 74 | 80 | 105 | 387 | 2.83 | 6.46 | 5.37 | 5.81 | 7.63 | 28.10 | 10.08 | 23.00 | 19.12 | 20.67 | 27.13 | | 49.37 | 30.38 | 31.62 | 27.03 | 22.11 |---------+--------+--------+--------+--------+--------+MALE | 40 | 204 | 160 | 216 | 370 | 990 | 2.90 | 14.81 | 11.62 | 15.69 | 26.87 | 71.90 | 4.04 | 20.61 | 16.16 | 21.82 | 37.37 | | 50.63 | 69.62 | 68.38 | 72.97 | 77.89 |---------+--------+--------+--------+--------+--------+Total 79 293 234 296 475 1377 5.74 21.28 16.99 21.50 34.50 100.00
Mechanism of Injury Mechanism of Injury Frequency Percent----------------------------------------------Unknown 7 0.51Pedestrian 191 13.87Other MOI 161 11.69Motor Vehicle Crash 307 22.29Bicycle Crash 103 7.48Sports / Recreation 131 9.51Falls 384 27.89Assaults 93 6.75

59
Appendix 5: Regional – Nassau
Mode of transportation to first hospitalTransportation Frequency Percent------------------------------------UNK/MIS 142 10.31Air Medical 61 4.43Ambulance 671 48.73Automobile 434 31.52Other 11 0.80Police 47 3.41Walk 11 0.80
Status at the referring hospitalTransferred Frequency Percent-------------------------------------------------------------admitted to a referring hospital 15 1.09at ED only of referring hospital 137 9.95no contact with a referring hospital 1225 88.96
Deaths Before AdmissionDOADIE Frequency Percent-------------------------------DIE 2 0.15DOA 22 1.60

60
Appendix 5: Regional – Nassau
Discharge Disposition from the final hospitalDischarge Disposition Frequency Percent----------------------------------------------------------Died after Admitted 36 2.66Home 1169 86.40Home Health Services 57 4.21Other Health Care Facility 84 6.21Left Against Medical Advice 1 0.07UNK/MIS 6 0.44
Feeding status at discharge from the final hospitalFEED Frequency Percent-------------------------------------------Unknown 19 2.33AGE < 3 164 20.12Dep. w/ Part. Help 11 1.35Dep. w/ Total Help 12 1.47Indep. W/Dev. 3 0.37Independent 606 74.36
Expression status at discharge from the final hospitalEXPRESS Frequency Percent-------------------------------------------Unknown 20 2.45AGE < 5 196 24.05Dep. w/ Part. Help 4 0.49Dep. w/ Total Help 7 0.86Indep. W/Dev. 6 0.74Independent 582 71.41
Locomotion status at discharge from the final hospital LOCO Frequency Percent-------------------------------------------Unknown 20 2.45AGE < 2 137 16.81Dep. w/ Total Help 70 8.59Dep. w/ Part. Help 37 4.54Indep. W/Dev. 130 15.95Independent 421 51.66

61
Appendix 5: Regional – Northeastern New York
GENDER & AGE Frequency|Percent |Row Pct |Col Pct | < 1 | 1 - 4 | 5 - 9 |10 - 14 |15 - 19 | Total | | | | | |---------+--------+--------+--------+--------+--------+FEMALE | 35 | 101 | 134 | 130 | 221 | 621 | 1.77 | 5.11 | 6.78 | 6.58 | 11.19 | 31.44 | 5.64 | 16.26 | 21.58 | 20.93 | 35.59 | | 48.61 | 30.61 | 36.71 | 29.41 | 28.85 |---------+--------+--------+--------+--------+--------+MALE | 37 | 229 | 231 | 311 | 545 | 1353 | 1.87 | 11.59 | 11.70 | 15.75 | 27.59 | 68.51 | 2.73 | 16.93 | 17.07 | 22.99 | 40.28 | | 51.39 | 69.39 | 63.29 | 70.36 | 71.15 |---------+--------+--------+--------+--------+--------+UNKNOWN | 0 | 0 | 0 | 1 | 0 | 1 | 0.00 | 0.00 | 0.00 | 0.05 | 0.00 | 0.05 | 0.00 | 0.00 | 0.00 | 100.00 | 0.00 | | 0.00 | 0.00 | 0.00 | 0.23 | 0.00 |---------+--------+--------+--------+--------+--------+Total 72 330 365 442 766 1975 3.65 16.71 18.48 22.38 38.78 100.00
Mechanism of InjuryMechanism of Injury Frequency Percent----------------------------------------------Unknown 5 0.25Pedestrian 172 8.71Other MOI 360 18.23Motor Vehicle Crash 536 27.14Bicycle Crash 166 8.41Sports / Recreation 180 9.11Falls 459 23.24Assaults 97 4.91

62
Appendix 5: Regional – Northeastern New York
Mode of transportation to first hospitalTransportation Frequency Percent------------------------------------UNK/MIS 71 3.59Air Medical 31 1.57Ambulance 1263 63.95Citizen 52 2.63Automobile 448 22.68Other 74 3.75Police 3 0.15Walk 33 1.67
Status at the referring hospitalTransferred Frequency Percent-------------------------------------------------------------admitted to a referring hospital 52 2.63at ED only of referring hospital 504 25.52no contact with a referring hospital 1419 71.85
Deaths Before AdmissionDOADIE Frequency Percent-------------------------------DIE 24 1.22DOA 63 3.19
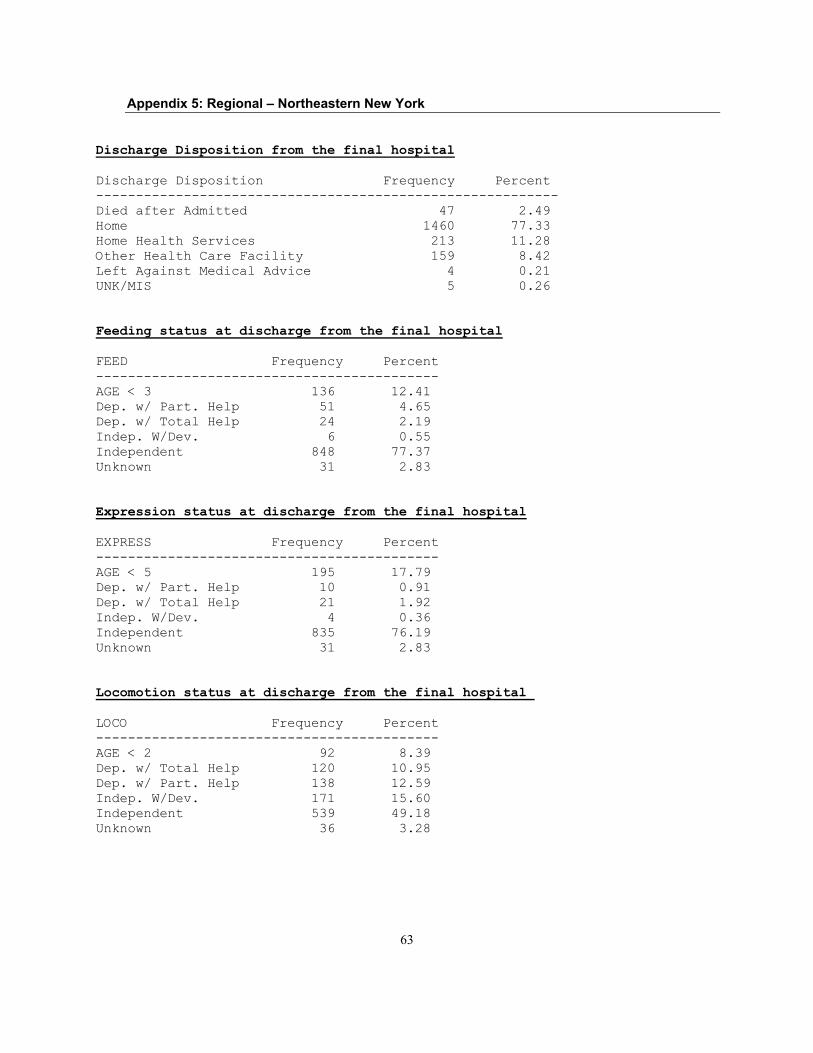
63
Appendix 5: Regional – Northeastern New York
Discharge Disposition from the final hospitalDischarge Disposition Frequency Percent----------------------------------------------------------Died after Admitted 47 2.49Home 1460 77.33Home Health Services 213 11.28Other Health Care Facility 159 8.42Left Against Medical Advice 4 0.21UNK/MIS 5 0.26
Feeding status at discharge from the final hospitalFEED Frequency Percent-------------------------------------------AGE < 3 136 12.41Dep. w/ Part. Help 51 4.65Dep. w/ Total Help 24 2.19Indep. W/Dev. 6 0.55Independent 848 77.37Unknown 31 2.83
Expression status at discharge from the final hospitalEXPRESS Frequency Percent-------------------------------------------AGE < 5 195 17.79Dep. w/ Part. Help 10 0.91Dep. w/ Total Help 21 1.92Indep. W/Dev. 4 0.36Independent 835 76.19Unknown 31 2.83
Locomotion status at discharge from the final hospital LOCO Frequency Percent-------------------------------------------AGE < 2 92 8.39Dep. w/ Total Help 120 10.95Dep. w/ Part. Help 138 12.59Indep. W/Dev. 171 15.60Independent 539 49.18Unknown 36 3.28

64
Appendix 5: Regional –New York City
GENDER & AGE Frequency|Percent |Row Pct |Col Pct | < 1 | 1 - 4 | 5 - 9 |10 - 14 |15 - 19 | Total | | | | | |---------+--------+--------+--------+--------+--------+FEMALE | 138 | 339 | 349 | 278 | 348 | 1452 | 2.26 | 5.55 | 5.72 | 4.55 | 5.70 | 23.78 | 9.50 | 23.35 | 24.04 | 19.15 | 23.97 | | 42.86 | 36.18 | 31.24 | 25.23 | 13.25 |---------+--------+--------+--------+--------+--------+MALE | 184 | 598 | 768 | 824 | 2277 | 4651 | 3.01 | 9.80 | 12.58 | 13.50 | 37.30 | 76.18 | 3.96 | 12.86 | 16.51 | 17.72 | 48.96 | | 57.14 | 63.82 | 68.76 | 74.77 | 86.68 |---------+--------+--------+--------+--------+--------+UNKNOWN | 0 | 0 | 0 | 0 | 2 | 2 | 0.00 | 0.00 | 0.00 | 0.00 | 0.03 | 0.03 | 0.00 | 0.00 | 0.00 | 0.00 | 100.00 | | 0.00 | 0.00 | 0.00 | 0.00 | 0.08 |---------+--------+--------+--------+--------+--------+Total 322 937 1117 1102 2627 6105 5.27 15.35 18.30 18.05 43.03 100.00
Mechanism of InjuryMechanism of Injury Frequency Percent----------------------------------------------Unknown 76 1.24Other MOI 652 10.68Pedestrian 1319 21.61Bicycle Crash 339 5.55Motor Vehicle Crash 585 9.58Falls 1134 18.57Sports / Recreation 217 3.55Assaults 1783 29.21
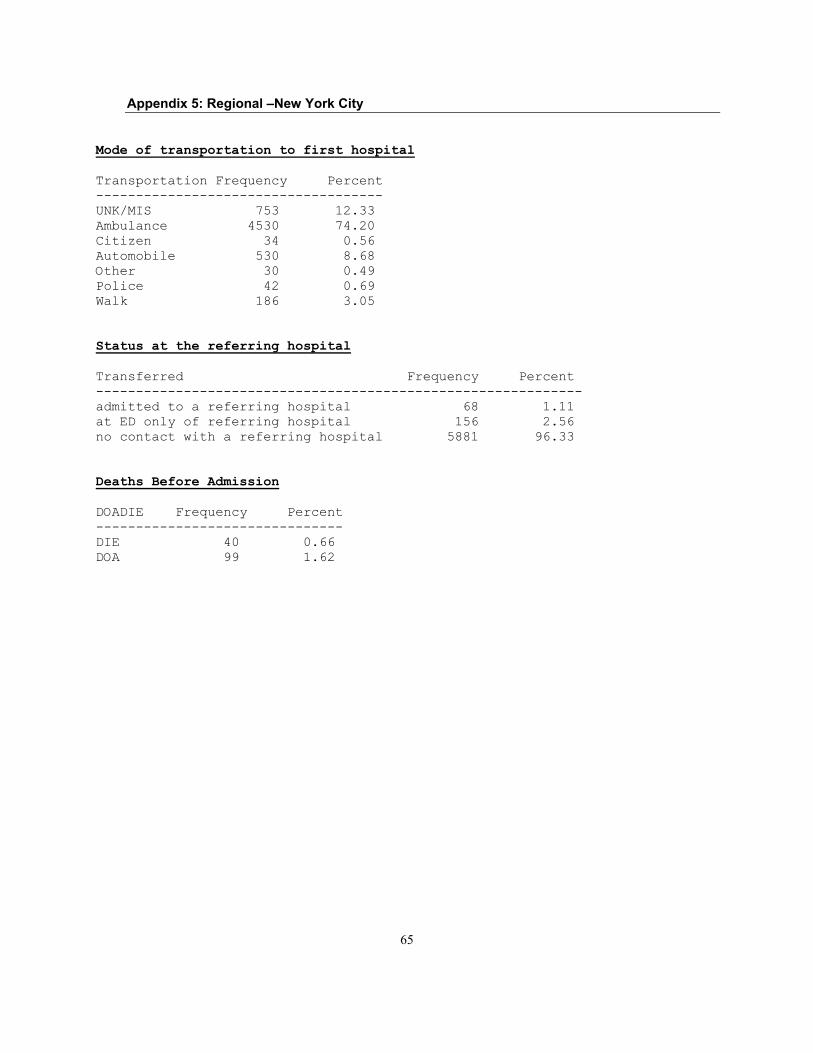
65
Appendix 5: Regional –New York City
Mode of transportation to first hospitalTransportation Frequency Percent------------------------------------UNK/MIS 753 12.33Ambulance 4530 74.20Citizen 34 0.56Automobile 530 8.68Other 30 0.49Police 42 0.69Walk 186 3.05
Status at the referring hospitalTransferred Frequency Percent-------------------------------------------------------------admitted to a referring hospital 68 1.11at ED only of referring hospital 156 2.56no contact with a referring hospital 5881 96.33
Deaths Before AdmissionDOADIE Frequency Percent-------------------------------DIE 40 0.66DOA 99 1.62

66
Appendix 5: Regional –New York City
Discharge Disposition from the final hospitalDischarge Disposition Frequency Percent----------------------------------------------------------UNK/MIS 31 0.52Left Against Medical Advice 85 1.42Home 5126 85.92Died after Admitted 201 3.37Other Health Care Facility 421 7.06Home Health Services 102 1.71
Feeding status at discharge from the final hospitalFEED Frequency Percent-------------------------------------------Unknown 214 6.02AGE < 3 447 12.58Dep. w/ Part. Help 62 1.75Dep. w/ Total Help 59 1.66Indep. W/Dev. 23 0.65Independent 2747 77.34
Expression status at discharge from the final hospitalEXPRESS Frequency Percent-------------------------------------------Unknown 217 6.11AGE < 5 576 16.22Dep. w/ Part. Help 38 1.07Dep. w/ Total Help 36 1.01Indep. W/Dev. 5 0.14Independent 2680 75.45
Locomotion status at discharge from the final hospital LOCO Frequency Percent-------------------------------------------Unknown 215 6.05AGE < 2 367 10.33Dep. w/ Total Help 238 6.70Dep. w/ Part. Help 181 5.10Indep. W/Dev. 708 19.93Independent 1843 51.89
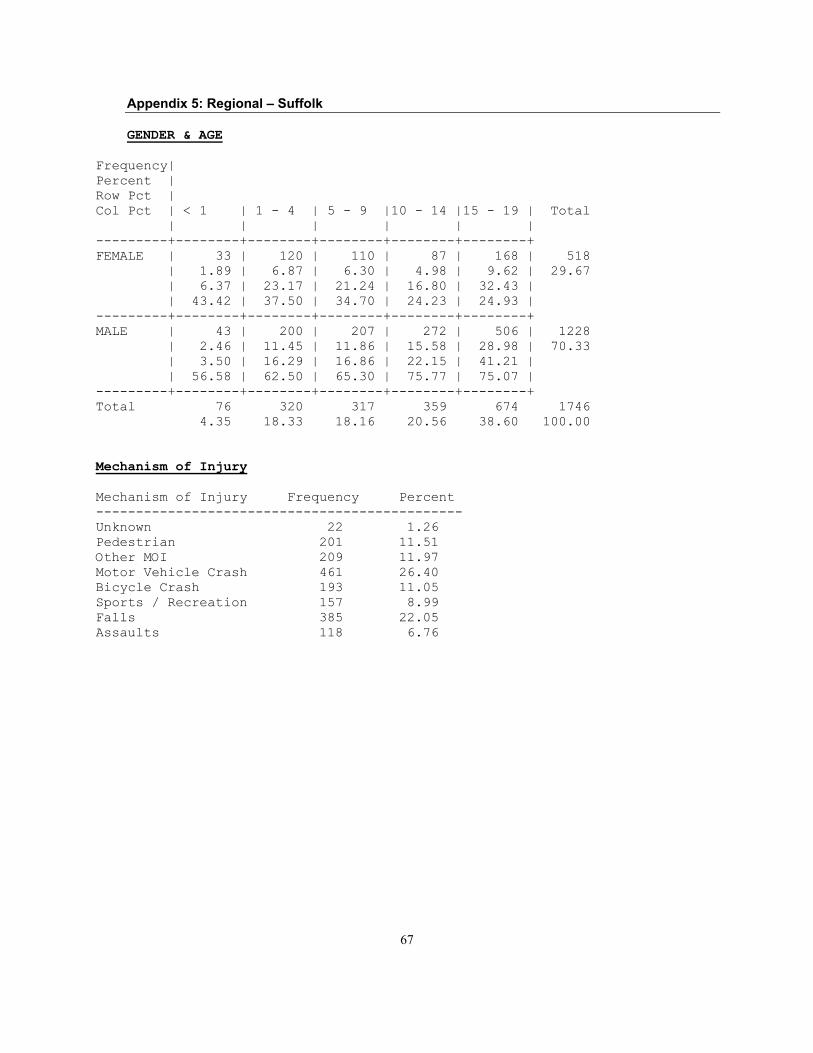
67
Appendix 5: Regional – Suffolk
GENDER & AGE Frequency|Percent |Row Pct |Col Pct | < 1 | 1 - 4 | 5 - 9 |10 - 14 |15 - 19 | Total | | | | | |---------+--------+--------+--------+--------+--------+FEMALE | 33 | 120 | 110 | 87 | 168 | 518 | 1.89 | 6.87 | 6.30 | 4.98 | 9.62 | 29.67 | 6.37 | 23.17 | 21.24 | 16.80 | 32.43 | | 43.42 | 37.50 | 34.70 | 24.23 | 24.93 |---------+--------+--------+--------+--------+--------+MALE | 43 | 200 | 207 | 272 | 506 | 1228 | 2.46 | 11.45 | 11.86 | 15.58 | 28.98 | 70.33 | 3.50 | 16.29 | 16.86 | 22.15 | 41.21 | | 56.58 | 62.50 | 65.30 | 75.77 | 75.07 |---------+--------+--------+--------+--------+--------+Total 76 320 317 359 674 1746 4.35 18.33 18.16 20.56 38.60 100.00
Mechanism of InjuryMechanism of Injury Frequency Percent----------------------------------------------Unknown 22 1.26Pedestrian 201 11.51Other MOI 209 11.97Motor Vehicle Crash 461 26.40Bicycle Crash 193 11.05Sports / Recreation 157 8.99Falls 385 22.05Assaults 118 6.76

68
Appendix 5: Regional – Suffolk
Mode of transportation to first hospitalTransportation Frequency Percent------------------------------------UNK/MIS 175 10.02Air Medical 3 0.17Ambulance 1105 63.29Citizen 18 1.03Automobile 388 22.22Other 5 0.29Police 4 0.23Walk 48 2.75
Status at the referring hospitalTransferred Frequency Percent-------------------------------------------------------------admitted to a referring hospital 151 8.65at ED only of referring hospital 117 6.70no contact with a referring hospital 1478 84.65
Deaths Before AdmissionDOADIE Frequency Percent-------------------------------DIE 18 1.03DOA 45 2.58
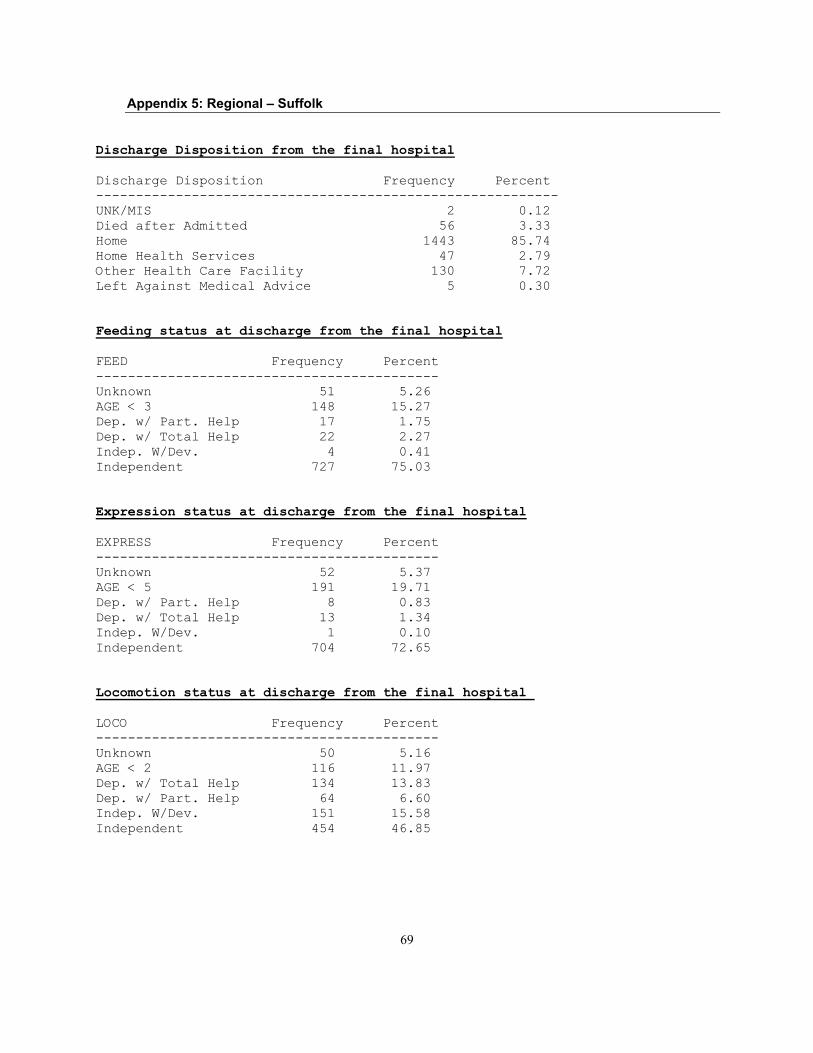
69
Appendix 5: Regional – Suffolk
Discharge Disposition from the final hospitalDischarge Disposition Frequency Percent----------------------------------------------------------UNK/MIS 2 0.12Died after Admitted 56 3.33Home 1443 85.74Home Health Services 47 2.79Other Health Care Facility 130 7.72Left Against Medical Advice 5 0.30
Feeding status at discharge from the final hospitalFEED Frequency Percent-------------------------------------------Unknown 51 5.26AGE < 3 148 15.27Dep. w/ Part. Help 17 1.75Dep. w/ Total Help 22 2.27Indep. W/Dev. 4 0.41Independent 727 75.03
Expression status at discharge from the final hospitalEXPRESS Frequency Percent-------------------------------------------Unknown 52 5.37AGE < 5 191 19.71Dep. w/ Part. Help 8 0.83Dep. w/ Total Help 13 1.34Indep. W/Dev. 1 0.10Independent 704 72.65
Locomotion status at discharge from the final hospital LOCO Frequency Percent-------------------------------------------Unknown 50 5.16AGE < 2 116 11.97Dep. w/ Total Help 134 13.83Dep. w/ Part. Help 64 6.60Indep. W/Dev. 151 15.58Independent 454 46.85
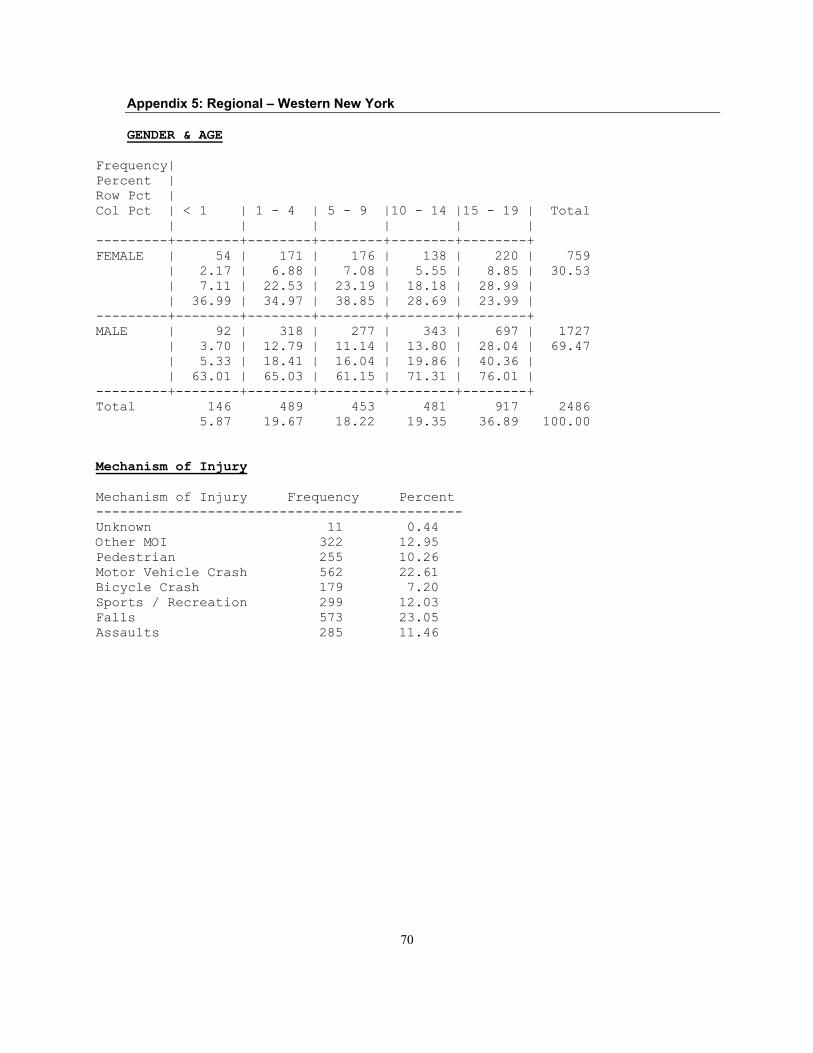
70
Appendix 5: Regional – Western New York
GENDER & AGE Frequency|Percent |Row Pct |Col Pct | < 1 | 1 - 4 | 5 - 9 |10 - 14 |15 - 19 | Total | | | | | |---------+--------+--------+--------+--------+--------+FEMALE | 54 | 171 | 176 | 138 | 220 | 759 | 2.17 | 6.88 | 7.08 | 5.55 | 8.85 | 30.53 | 7.11 | 22.53 | 23.19 | 18.18 | 28.99 | | 36.99 | 34.97 | 38.85 | 28.69 | 23.99 |---------+--------+--------+--------+--------+--------+MALE | 92 | 318 | 277 | 343 | 697 | 1727 | 3.70 | 12.79 | 11.14 | 13.80 | 28.04 | 69.47 | 5.33 | 18.41 | 16.04 | 19.86 | 40.36 | | 63.01 | 65.03 | 61.15 | 71.31 | 76.01 |---------+--------+--------+--------+--------+--------+Total 146 489 453 481 917 2486 5.87 19.67 18.22 19.35 36.89 100.00
Mechanism of InjuryMechanism of Injury Frequency Percent----------------------------------------------Unknown 11 0.44Other MOI 322 12.95Pedestrian 255 10.26Motor Vehicle Crash 562 22.61Bicycle Crash 179 7.20Sports / Recreation 299 12.03Falls 573 23.05Assaults 285 11.46
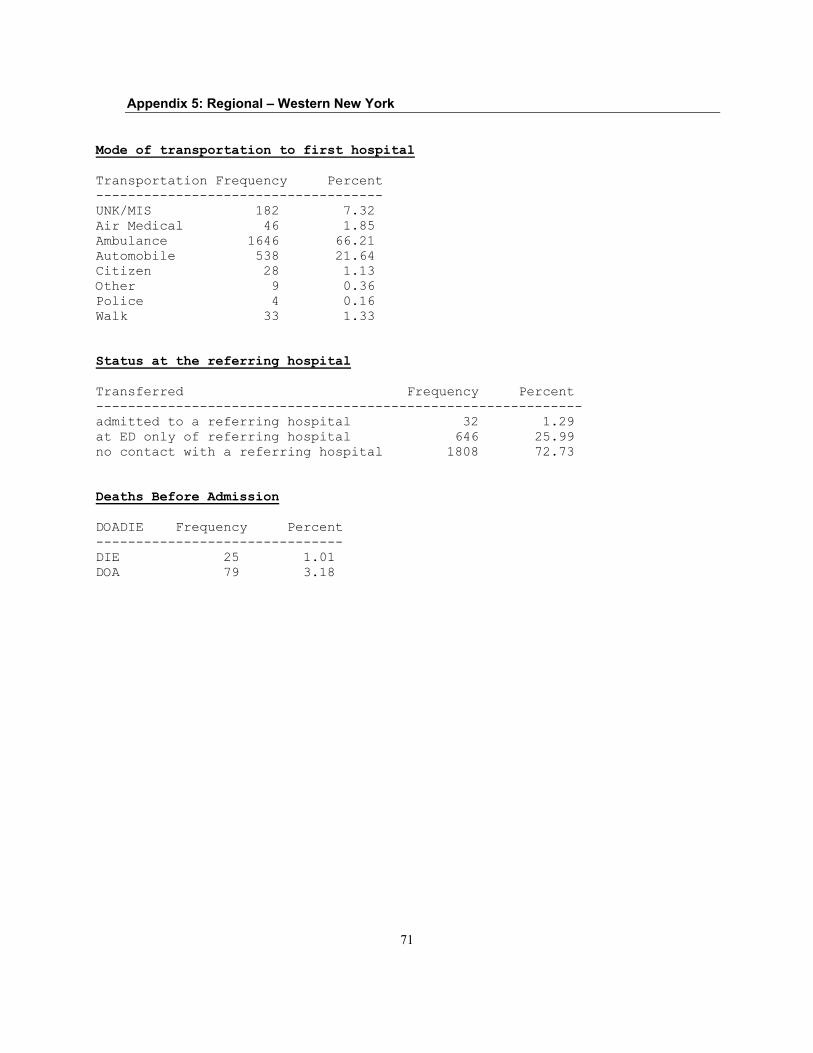
71
Appendix 5: Regional – Western New York
Mode of transportation to first hospitalTransportation Frequency Percent------------------------------------UNK/MIS 182 7.32Air Medical 46 1.85Ambulance 1646 66.21Automobile 538 21.64Citizen 28 1.13Other 9 0.36Police 4 0.16Walk 33 1.33
Status at the referring hospitalTransferred Frequency Percent-------------------------------------------------------------admitted to a referring hospital 32 1.29at ED only of referring hospital 646 25.99no contact with a referring hospital 1808 72.73
Deaths Before AdmissionDOADIE Frequency Percent-------------------------------DIE 25 1.01DOA 79 3.18
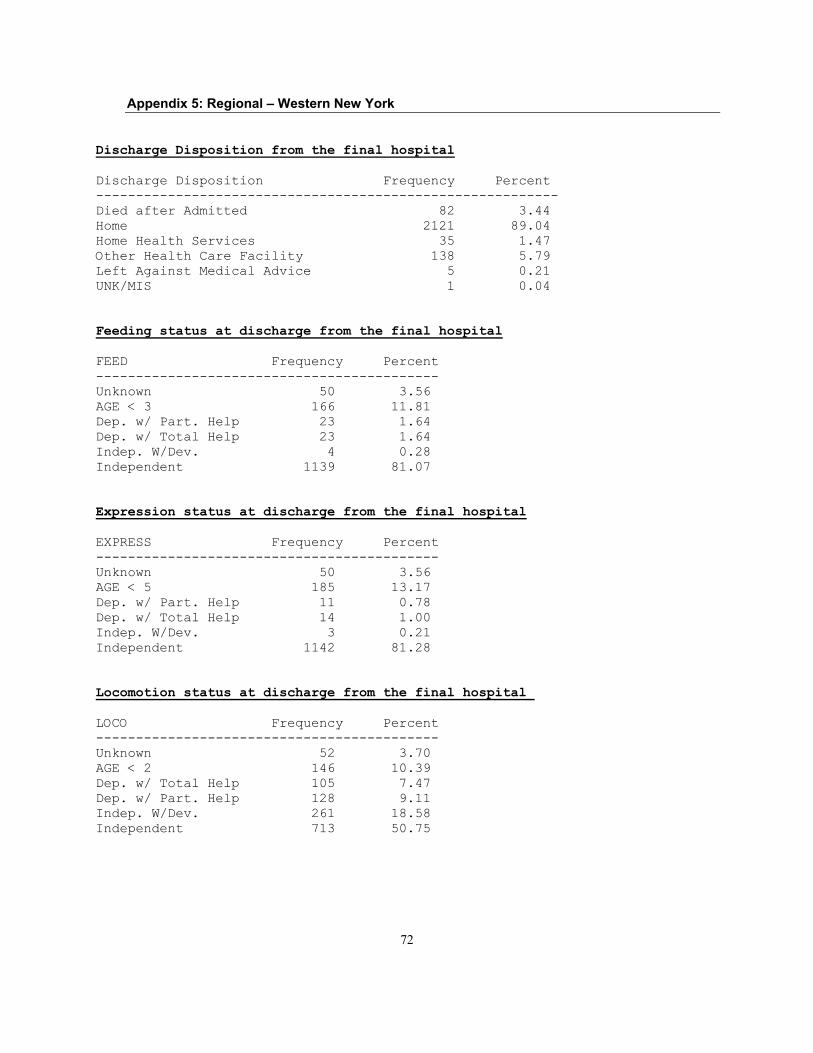
72
Appendix 5: Regional – Western New York
Discharge Disposition from the final hospitalDischarge Disposition Frequency Percent----------------------------------------------------------Died after Admitted 82 3.44Home 2121 89.04Home Health Services 35 1.47Other Health Care Facility 138 5.79Left Against Medical Advice 5 0.21UNK/MIS 1 0.04
Feeding status at discharge from the final hospitalFEED Frequency Percent-------------------------------------------Unknown 50 3.56AGE < 3 166 11.81Dep. w/ Part. Help 23 1.64Dep. w/ Total Help 23 1.64Indep. W/Dev. 4 0.28Independent 1139 81.07
Expression status at discharge from the final hospitalEXPRESS Frequency Percent-------------------------------------------Unknown 50 3.56AGE < 5 185 13.17Dep. w/ Part. Help 11 0.78Dep. w/ Total Help 14 1.00Indep. W/Dev. 3 0.21Independent 1142 81.28
Locomotion status at discharge from the final hospital LOCO Frequency Percent-------------------------------------------Unknown 52 3.70AGE < 2 146 10.39Dep. w/ Total Help 105 7.47Dep. w/ Part. Help 128 9.11Indep. W/Dev. 261 18.58Independent 713 50.75

Appendix 6: New York State Emergency Medical Services for Children AdvisoryCommittee Members
Susan Brillhart, MS, RN, CPNP – NYS Nurses AssociationKathleen Brown, MD – Upstate University Medical Center, SyracuseHoward Callman, EMT-CC – NYS Volunteer Ambulance AssociationSharon Chiumento, BSN, EMT-P – University of Rochester Medical Center, Office ofPrehospital CareArthur Cooper, MD, MS – Columbia University College of Physicians and Surgeons,Harlem HospitalAnn Fitton, EMT-P – Fire Department of the City of New YorkKathleen Lillis, MD – Children’s Hospital of BuffaloJanice Rogers, MS, RN, CS – NYS Emergency Nurses AssociationRuth Walden – parent representative and NYS Department of Health, Children withSpecial Health Care Needs