the new power brokers: gaining clout in turbulent markets
TRANSCRIPT
McKinsey Global Institute
The New Power Brokers:Gaining Clout in Turbulent Markets
July 2008
2
McKinsey Global Institute
The McKinsey Global Institute (MGI), founded in 1990, is McKinsey & Com-
pany’s economics research arm. MGI’s mission is to help business and
government leaders develop a deeper understanding of the evolution of the
global economy and provide a fact base that contributes to decision making
on critical management and policy issues.
MGI’s research is a unique combination of two disciplines: economics and
management. By integrating these two perspectives, MGI is able to gain
insights into the microeconomic underpinnings of the broad trends shap-
ing the global economy. MGI has utilized this “micro-to-macro” approach in
research covering over 15 countries and 28 industry sectors, on topics that
include economic productivity, global economic integration, offshoring, capi-
tal markets, health care, energy, demographics, and consumer demand.
MGI’s research is conducted by a group of full-time MGI fellows based in
offices in San Francisco; Washington, DC; London; and Shanghai and led
by MGI’s director, Diana Farrell. MGI project teams also include consultants
drawn from McKinsey’s offices around the world and are supported by
McKinsey’s network of industry and management experts and worldwide
partners. In addition, MGI teams work with leading economists, including
Nobel laureates and policy experts, who act as advisers to MGI projects.
MGI’s research is funded by the partners of McKinsey & Company and is
not commissioned by any business, government, or other institution. Further
information about MGI and copies of MGI’s published reports can be found
at www.mckinsey.com/mgi.
The New Power Brokers:Gaining Clout in Turbulent Markets
Diana FarrellSusan Lund Koby Sadan
McKinsey Global Institute
July 2008

4

5
Four groups of investors—Asian governments, oil exporters, hedge funds, and
private equity firms—are having a growing impact on global capital markets. In
our October 2007 report, we labeled them “the new power brokers” because
their rising influence reflects a dispersion of financial power away from traditional
institutions in Western developed economies and toward new players and other
parts of the world (for new readers, see the sidebar Meet the New Power Brokers).1
In this update, we examine how the four have fared since then, during the turmoil
of skyrocketing oil prices, evaporating liquidity, and disappearing leverage.
We find that the financial and economic events since mid-2007 have, if anything,
accelerated the trends we identified earlier: The power brokers’ wealth and clout
have grown. They have adapted by expanding their investment strategies. And
they have increased the use of private financing as an alternative to public mar-
kets. Their actions have brought clear benefits in containing the financial market
crisis but also have highlighted the risks associated with their rise.
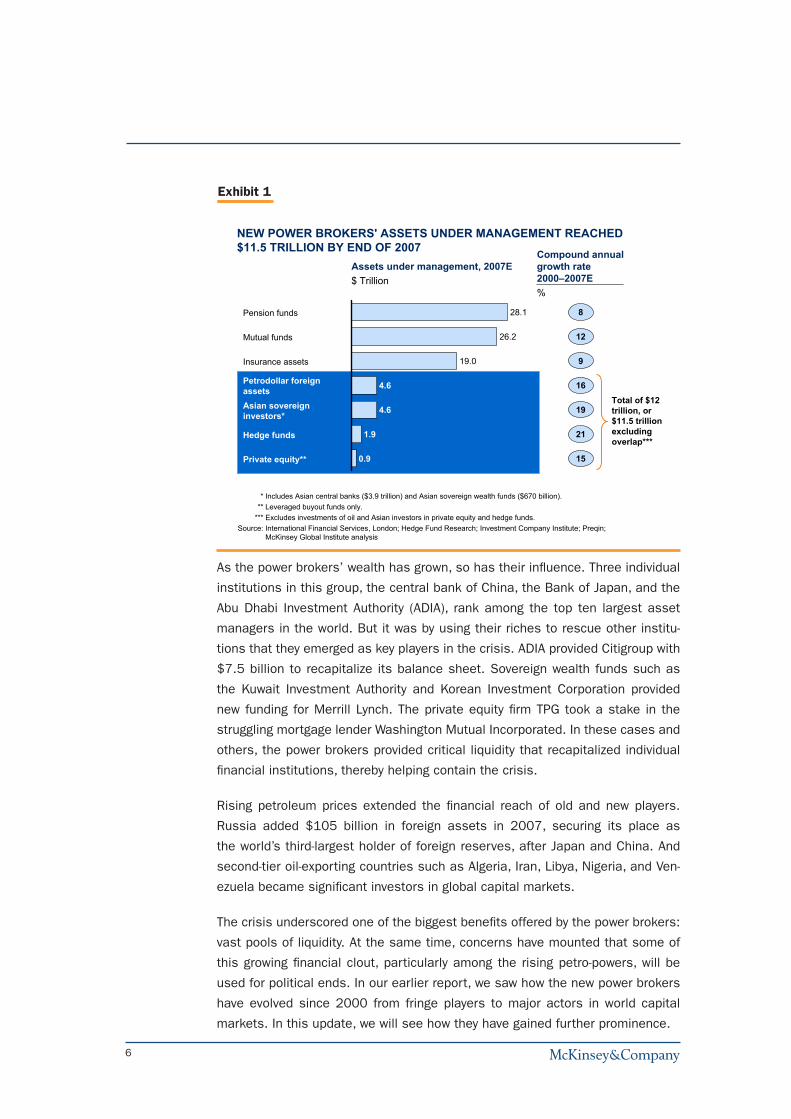
The combined financial assets of the four power brokers increased by 22
percent—even faster than before—to $11.5 trillion in 2007 (Exhibit 1).2 Asian
countries’ trade surpluses and oil exporters’ petro-profits have both continued
to grow. Private equity, which relies on leverage to amplify returns, has survived
the turbulence in reasonably good shape and its new fund-raising has continued.
Hedge funds have been hardest hit by the crisis, and we have lowered our fore-
cast of their future growth.
1 See The New Power Brokers: How Oil, Asia, Hedge Funds, and Private Equity Are Shaping Global Capital Markets, The McKinsey Global Institute, available online at www.mckinsey.com/mgi. Based on new information, we have revised upwards our estimate of petrodollar foreign assets in 2006 to $3.9 trillion, bringing the total 2006 assets of the power brokers to $9.2 trillion, or $8.9 trillion excluding overlap.
2 This figure includes $670 billion in Asian sovereign wealth funds that we did not include in the original report. It excludes overlap of $450 billion due to the estimated investments of petrodollar investors and Asian sovereign investors in private equity and hedge funds.
The New Power Brokers: Gaining Clout in Turbulent Markets
6
As the power brokers’ wealth has grown, so has their influence. Three individual
institutions in this group, the central bank of China, the Bank of Japan, and the
Abu Dhabi Investment Authority (ADIA), rank among the top ten largest asset
managers in the world. But it was by using their riches to rescue other institu-
tions that they emerged as key players in the crisis. ADIA provided Citigroup with
$7.5 billion to recapitalize its balance sheet. Sovereign wealth funds such as
the Kuwait Investment Authority and Korean Investment Corporation provided
new funding for Merrill Lynch. The private equity firm TPG took a stake in the
struggling mortgage lender Washington Mutual Incorporated. In these cases and
others, the power brokers provided critical liquidity that recapitalized individual
financial institutions, thereby helping contain the crisis.
Rising petroleum prices extended the financial reach of old and new players.
Russia added $105 billion in foreign assets in 2007, securing its place as
the world’s third-largest holder of foreign reserves, after Japan and China. And
second-tier oil-exporting countries such as Algeria, Iran, Libya, Nigeria, and Ven-
ezuela became significant investors in global capital markets.
The crisis underscored one of the biggest benefits offered by the power brokers:
vast pools of liquidity. At the same time, concerns have mounted that some of
this growing financial clout, particularly among the rising petro-powers, will be
used for political ends. In our earlier report, we saw how the new power brokers
have evolved since 2000 from fringe players to major actors in world capital
markets. In this update, we will see how they have gained further prominence.
Exhibit 1
4.6
4.6
1.9
0.9
28.1
26.2
19.0
Assets under management, 2007E$ Trillion
8
12
9
16
19
21
15
Pension funds
Mutual funds
Petrodollar foreign assetsAsian sovereign investors*
Hedge funds
Private equity**
Insurance assets
Compound annual growth rate 2000–2007E%
* Includes Asian central banks ($3.9 trillion) and Asian sovereign wealth funds ($670 billion).** Leveraged buyout funds only.
*** Excludes investments of oil and Asian investors in private equity and hedge funds.Source: International Financial Services, London; Hedge Fund Research; Investment Company Institute; Preqin;
McKinsey Global Institute analysis
Total of $12 trillion, or $11.5 trillion excludingoverlap***
NEW POWER BROKERS' ASSETS UNDER MANAGEMENT REACHED $11.5 TRILLION BY END OF 2007

7
Meet the New Power Brokers
Petrodollar investors had $4.6 trillion in foreign assets at the end of 2007.
Their wealth has soared along with oil prices, which rose from just $23 per
barrel in 2002 to more than $100 in the first quarter of 2008. This is a
diverse group, including investors in the six states of the Gulf Cooperation
Council (Bahrain, Kuwait, Oman, Qatar, Saudi Arabia, and the United Arab
Emirates) and other oil exporters in the Middle East and North Africa, as well
as Norway, Russia, Venezuela, Nigeria, and Indonesia. The investors include
central banks, sovereign wealth funds, companies, and wealthy individuals.
Overall, government entities control 60 percent of petrodollar foreign assets,
while wealthy individuals and companies hold 40 percent. These investors
display varied investment styles, ranging from conservative and passive to
more risk-seeking and active. The three largest petrodollar investors are
the Abu Dhabi Investment Authority, which has up to $875 billion in assets;
Norway’s sovereign wealth fund, called the Government Pension Fund, with
$380 billion; and Russia’s Central Bank, with $320 billion.3
Asian sovereign investors include central banks, which held $3.9 trillion
in foreign assets at the end of 2007, and sovereign wealth funds (SWFs),
which held $670 billion.4 Their foreign assets have grown rapidly over the
past decade because of their countries’ rising trade surpluses combined with
government monetary policies aimed at preventing significant appreciation of
their currencies. Apart from Singapore, Asian governments manage most of
their foreign assets through their central banks, rather than through SWFs.
The central banks have traditionally invested nearly all their foreign reserves in
low-risk, fixed-income securities, particularly US Treasury securities. However,
these countries have far more reserve assets than are needed for financial
stabilization purposes. We calculate that the opportunity cost of investing
excess reserves in relatively low-yielding assets is $123 billion per year,
equivalent to 1.3 percent of these countries’ GDP .5 They are therefore moving
more of their reserves into SWFs, which seek higher returns by investing in a
wider variety of financial assets. And countries without SWFs, such as Japan
and India are considering establishing them. The largest Asian sovereign
3 This figure excludes the $157 billion in Russia’s sovereign wealth funds.
4 We exclude the $30 billion in Korea’s sovereign wealth fund because those assets are included in Korea’s central bank reserves.
5 This calculation is based on the amount of excess foreign reserve assets and the assumption that these assets could earn higher returns if invested in a broadly diversified portfolio. See the October 2007 report for more detail.

8
investors are the central bank of China, with $1.5 trillion in foreign reserve
assets by end of 2007, and the central bank of Japan ($1 trillion), followed by
Singapore’s Government Investment Corporation, which is believed to have up
to $330 billion in assets.
Private equity, the name commonly applied to leveraged buyout funds, is the
smallest of the new power brokers, managing $900 billion in investors’ assets
at the end of 2007. Both private equity firms and hedge funds are financial
intermediaries that invest the money of wealthy individuals and institutional
investors, such as pension funds, foundations, endowments, insurance
companies, and, increasingly, SWFs. A private equity firm typically generates
returns by borrowing large sums to acquire a publicly traded company, and
then restructuring it to improve performance. The equity firm’s returns depend
on its management skill, and are amplified by the leverage involved. Although
the megadeals of early 2007 fueled popular perceptions of spectacular
performance, we find that returns are quite variable. Only the top quartile of
funds is significantly outperforming public equity market returns. Among the
best-known names in the industry are Kohlberg Kravis Roberts & Company,
The Blackstone Group, TPG, and The Carlyle Group in the United States, and
Apax Partners, Permira, and CVC Capital Partners in Europe.
Hedge funds’ global assets under management reached $1.9 trillion at the
end of 2007. After accounting for the leverage that they use to boost their
returns, hedge funds’ gross investments in financial markets today could be
as high as $5 trillion. Hedge funds are investment pools but differ from mutual
funds in several ways, including their use of leverage, their highly active and
diverse trading styles, and the fact that they are subject to fewer regulatory
constraints than traditional institutional investors. Hedge funds, for example,
can “short sell” assets, betting that the price will fall, whereas mutual
funds cannot. They also invest in complex derivatives and other structured
products. The industry includes more than 7,000 funds, although the 100
largest hedge funds control 71 percent of assets under management. Hedge
funds employ a diverse set of investment strategies, ranging from directional
bets on macroeconomic indicators and asset prices, to quantitative models
that arbitrage price discrepancies, to funds exploiting event-driven asset price
movements. The largest hedge funds globally include Highbridge Capital
Management (majority owned by JPMorgan Chase), Bridgewater Associates,
Farallon Capital Management, Renaissance Technologies, and Och-Ziff Capital
Management Group.

9
ASIAN GOVERNMENTS AND OIL INVESTORS PROVIDE CRITICAL LIQUIDITY
DURING THE CRISIS
The fortunes of the two largest power brokers, petrodollar investors and Asian
sovereign investors, have continued to grow. The foreign financial assets of oil
exporters rose to an estimated $4.6 trillion by the end of 2007, an 18 percent
increase over the previous year.6 Asian sovereign foreign assets grew to $4.6
trillion, of which $3.9 trillion are central banks’ foreign exchange reserves and
approximately $670 billion are held by SWFs, a figure we expect to grow as
these governments seek higher returns on their wealth (see sidebar Spotlight on
Sovereign Wealth Funds).7
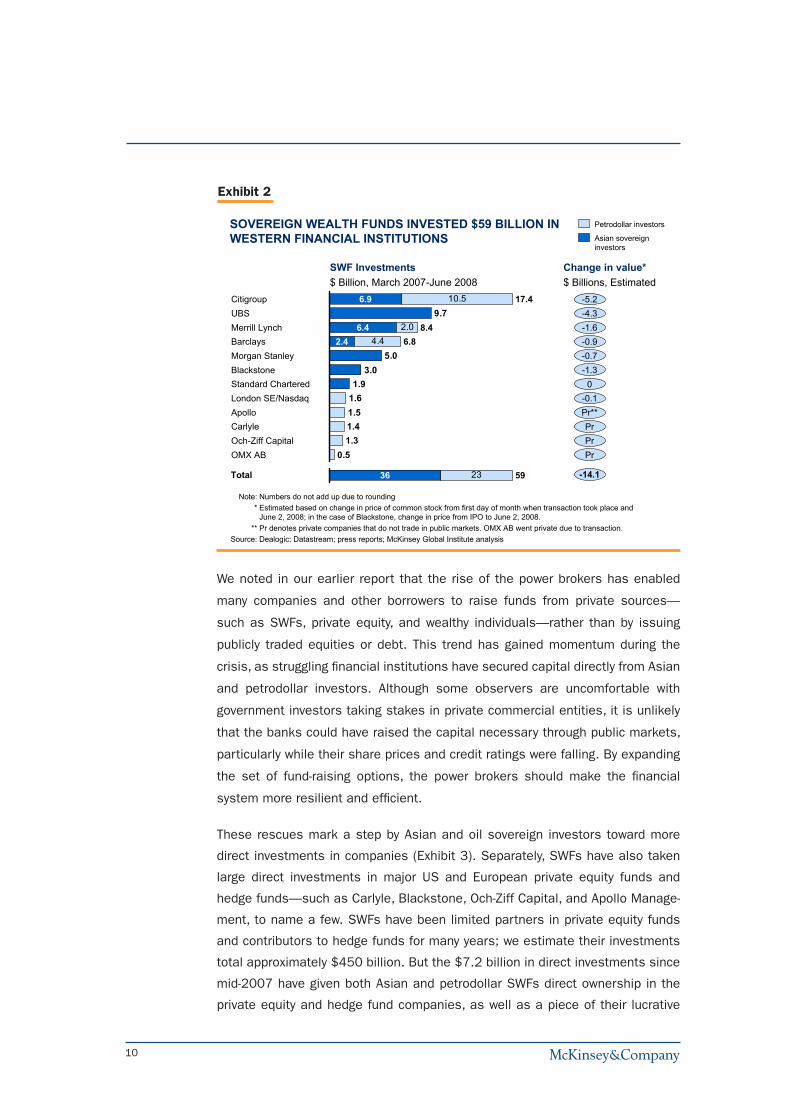
Asian and oil sovereign investors proved to be an important source of liquidity
during the financial crisis of the past year. As Western financial institutions
reported multibillion-dollar write-downs of faltering assets, they turned to SWFs
and wealthy private individuals to recapitalize their balance sheets. From March
2007 through June 2008, Asian SWFs invested $36 billion in Western financial
institutions while oil-based SWFs invested $23 billion (Exhibit 2). For investors
long accustomed to operating behind the scenes, these actions marked bold
steps into the limelight and a break from past practices of working through asset
management firms and investing in publicly traded securities.
By mobilizing so much capital so quickly, the SWFs helped limit the scope of the
financial crisis and prevent more large-scale bank failures. Given the flexibility of
their investment strategies and long investment horizons, these institutions were
able to provide an infusion of capital when it was most needed—and when it was
not necessarily the most attractive investment. At the writing of this report, their
investments have lost approximately $14 billion in market value, although they
will likely generate positive returns in the long term.8 Two of the power brokers
thus provided a first line of defense during the crisis. It is doubtful that Western
governments could have provided taxpayer-funded financial assistance to the
banks on the same scale without triggering a public uproar.
6 Based on new information, we have revised upwards our 2006 estimate of petrodollar foreign assets to $3.9 trillion. MGI estimates are based on interviews with financial industry experts in the region, proprietary data on wealth management, and public data on annual capital outflows. See the October 2007 report for more detail on how we arrived at these figures.
7 In our earlier report, we singled out Asian central banks because they were the dominant managers of those countries’ reserves. In this update we broaden the category to Asian sovereign investors, reflecting the proliferation and growth of the region’s sovereign wealth funds.
8 This calculation is based on the change in share price of each of the banks at the first day of the month of the SWF capital injection compared with the share price on June 2, 2008.
10
We noted in our earlier report that the rise of the power brokers has enabled
many companies and other borrowers to raise funds from private sources—
such as SWFs, private equity, and wealthy individuals—rather than by issuing
publicly traded equities or debt. This trend has gained momentum during the
crisis, as struggling financial institutions have secured capital directly from Asian
and petrodollar investors. Although some observers are uncomfortable with
government investors taking stakes in private commercial entities, it is unlikely
that the banks could have raised the capital necessary through public markets,
particularly while their share prices and credit ratings were falling. By expanding
the set of fund-raising options, the power brokers should make the financial
system more resilient and efficient.
These rescues mark a step by Asian and oil sovereign investors toward more
direct investments in companies (Exhibit 3). Separately, SWFs have also taken
large direct investments in major US and European private equity funds and
hedge funds—such as Carlyle, Blackstone, Och-Ziff Capital, and Apollo Manage-
ment, to name a few. SWFs have been limited partners in private equity funds
and contributors to hedge funds for many years; we estimate their investments
total approximately $450 billion. But the $7.2 billion in direct investments since
mid-2007 have given both Asian and petrodollar SWFs direct ownership in the
private equity and hedge fund companies, as well as a piece of their lucrative
Exhibit 2
SOVEREIGN WEALTH FUNDS INVESTED $59 BILLION IN WESTERN FINANCIAL INSTITUTIONS
Note: Numbers do not add up due to rounding* Estimated based on change in price of common stock from first day of month when transaction took place and
June 2, 2008; in the case of Blackstone, change in price from IPO to June 2, 2008.** Pr denotes private companies that do not trade in public markets. OMX AB went private due to transaction.
Source: Dealogic; Datastream; press reports; McKinsey Global Institute analysis
0.51.31.41.51.61.9
3.05.0
9.7
4.42.0
10.56.9 17.4CitigroupUBS
8.4Merrill Lynch2.4 6.8Barclays
Morgan Stanley
6.4
BlackstoneStandard CharteredLondon SE/NasdaqApolloCarlyle Och-Ziff CapitalOMX AB
Petrodollar investors
Asian sovereign investors
SWF Investments$ Billion, March 2007-June 2008
Change in value*$ Billions, Estimated
-5.2-4.3
0
-1.6
-0.7-0.9
-1.3
-0.1Pr**PrPrPr
Total 23 5936 -14.1

11
income stream. These investments can take many forms. For example, China In-
vestment Corporation bought pre-IPO shares in the private equity firm Blackstone
and is reported to be investing with J.C. Flowers & Company in a fund focused
on financial institutions. Through these direct investments, SWFs are seeking
lucrative returns and, in some cases, are seeking to acquire new skills and build
internal capabilities.
Spotlight on Sovereign Wealth Funds
Sovereign wealth funds (SWFs) attracted attention in 2007, not least because
of their very public role in capitalizing some of the world’s largest banks. With
approximately $2.9 trillion in assets, and growing, they are important players
in global financial markets.
But SWFs are just one part of a larger picture of rising wealth in the Middle East,
Asia, and beyond. We estimate that in the oil-exporting countries, sovereign
wealth funds account for 40 percent of total foreign investment assets, with
the exact proportion varying across countries. The remainder—more than $2
trillion—is in the hands of central banks, wealthy individuals, and state-owned
and private companies that are active in foreign markets. In Asia, sovereign
wealth funds are relatively small outside of Singapore, accounting for just 2
percent of total foreign assets; central banks and even state-owned companies
are far larger players in global capital markets (Sidebar exhibit).
Exhibit 3
SOVEREIGN INVESTORS ARE SHIFTING TOWARD MORE EQUITY INVESTMENTS, SOMETIMES ACTIVE
* Includes direct stakes in companies, not through a private equity fund.Source: Press reports; interviews; Institute for International Finance; RGE Monitor; “Understanding the New Financial
Superpower,” Setser and Ziemba (2007); Morgan Stanley; Cap Gemini/Merrill Lynch; McKinsey Global Institute analysis
Examples • Saudi Arabia: Saudi Arabia Monetary Agency and Pension
• Russia Oil Fund• Central banks
• Abu Dhabi Investment Authority
• Kuwait Invt. Authority • Singapore GIC• Norway Government
Pension Fund
• Qatar Invt. Authority• Istithmar World
Estimated asset allocations of sovereign investors %
Passive Active
100025
55
20
Liability-driven
10-15Real estate and OtherPrivate equity*Equity
Fixed income
Cash / deposits0 0
30-35
50-60
Yield-seeking funds
1010-15
50-60
5-10
Strategic investors

12
Moreover, SWFs are just one vehicle for managing sovereign wealth. Central
banks, government ministries, government holding corporations, and state-
owned companies are also important. And the distinctions between sovereign
wealth funds and other types of government investors are blurring. Traditionally,
central banks invested their reserve assets in highly liquid, safe instruments,
such as US Treasuries, while SWFs pursued a more diversified portfolio of
investments. But some SWFs, such as Russia’s Reserve Fund or Alaska’s
Permanent Fund, also invest mainly in conservative fixed-income securities.
And some central banks are beginning to expand their investment strategies
as well. China’s State Administration of Foreign Exchange, for instance, has
announced in the first half of 2008 direct investments in three Australian
banks, in British Petroleum, and in the French energy giant Total, moving its
investment strategy closer to that of a sovereign wealth fund. For all these
reasons, we find an exclusive focus on sovereign wealth funds too narrow.
NEW PETRODOLLAR POWERS EMERGE
The high oil prices of the past 12 months have elevated a new group of petroleum
exporters into the ranks of major foreign investors. Saudi Arabia, Norway, Kuwait,
and the United Arab Emirates have been active investors in global capital mar-
kets for 25 years or more. In 2007, Russia emerged as a major global financial
player as well. Its foreign investment assets ($811 billion at the end of 2007)
Sidebar exhibit
* South Korea's sovereign wealth fund assets are deducted from official reserves to avoid double counting.Source: Cap-Gemini Private Wealth Report 2006, IMF; Global Insight; McKinsey Global Institute Cross-Border
Investments Database; ministries of finance of respective countries; McKinsey Global Institute analysis
11
10
6 54
3651 56
27
81
5
84
1,824
China
54
186
Malay-sia
43
553
SouthKorea*
2
42
648
Taiwan
19
808
Singa-pore
0
19
5,181
Japan
Private individuals and companies
Sovereign wealth funds/ government holding companies
Central bank reserves
100%
Foreign assets by investor type 2007 $ Billion
52
7671
48 50
40
17 23
47 45
19
41
40
811
Russia
8
115
Qatar
7
964
UAE
6
381
Kuwait
5
794
Nor-way
5
723
Saudi Arabia
Asia Oil-exporting countries
ASIAN CENTRAL BANKS HOLD HIGH PROPORTION OF FOREIGN ASSETS
13
are second-largest among oil exporters after the United Arab Emirates, and they
have been growing by 24 percent per year since 2002. Nearly 60 percent of
these assets are held by the Russian government. Russia’s central bank has
$320 billion in foreign exchange reserves, as well as $157 billion in the country’s
two sovereign wealth funds.9
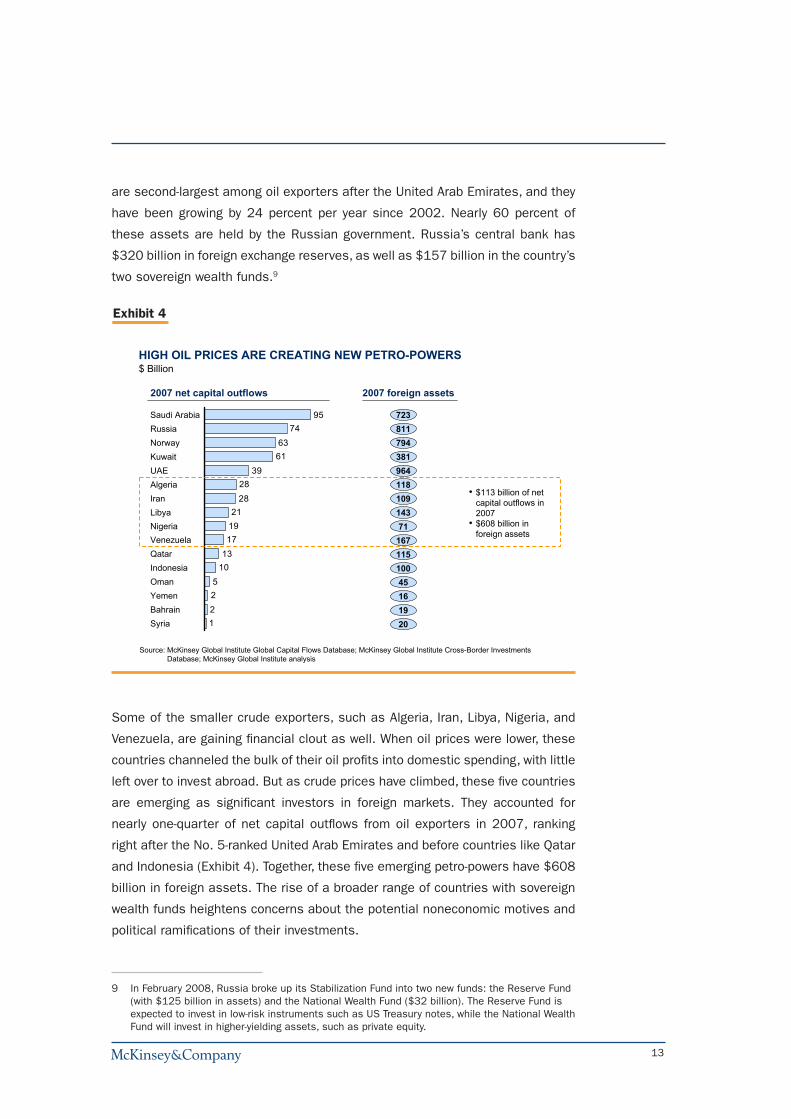
Some of the smaller crude exporters, such as Algeria, Iran, Libya, Nigeria, and
Venezuela, are gaining financial clout as well. When oil prices were lower, these
countries channeled the bulk of their oil profits into domestic spending, with little
left over to invest abroad. But as crude prices have climbed, these five countries
are emerging as significant investors in foreign markets. They accounted for
nearly one-quarter of net capital outflows from oil exporters in 2007, ranking
right after the No. 5-ranked United Arab Emirates and before countries like Qatar
and Indonesia (Exhibit 4). Together, these five emerging petro-powers have $608
billion in foreign assets. The rise of a broader range of countries with sovereign
wealth funds heightens concerns about the potential noneconomic motives and
political ramifications of their investments.
9 In February 2008, Russia broke up its Stabilization Fund into two new funds: the Reserve Fund (with $125 billion in assets) and the National Wealth Fund ($32 billion). The Reserve Fund is expected to invest in low-risk instruments such as US Treasury notes, while the National Wealth Fund will invest in higher-yielding assets, such as private equity.
Exhibit 4
HIGH OIL PRICES ARE CREATING NEW PETRO-POWERS
Source: McKinsey Global Institute Global Capital Flows Database; McKinsey Global Institute Cross-Border Investments Database; McKinsey Global Institute analysis
1225
1013171921
2828
396163
7495Saudi Arabia
RussiaNorwayKuwaitUAEAlgeriaIranLibyaNigeriaVenezuela
SyriaBahrainYemenOmanIndonesiaQatar
2007 net capital outflows
• $113 billion of net capital outflows in 2007
• $608 billion in foreign assets
2007 foreign assets
723811794381964
115100
11810914371
167
45161920
$ Billion

14
PRIVATE EQUITY: ADAPTING TO NEW MARKET CONDITIONS
For private equity, the first half of 2007 was the best of times, while the second
half of the year was among the worst. New fund-raising by private equity firms
around the world soared in the first two quarters of 2007—then plummeted in
the third quarter after the US subprime mortgage crisis began (Exhibit 5). But
fund-raising rose a bit in the last three months of the year, bringing total assets
under management in leveraged buyout funds (LBOs)10 to $900 billion.
Still, the game has changed for private equity firms as funding—particularly for
the largest buyout deals—has dried up. The spread between high-yield bond
rates over swap rates, a common measure of private equity’s cost of credit,
increased from 190 basis points in June 2007 to 539 basis points in March
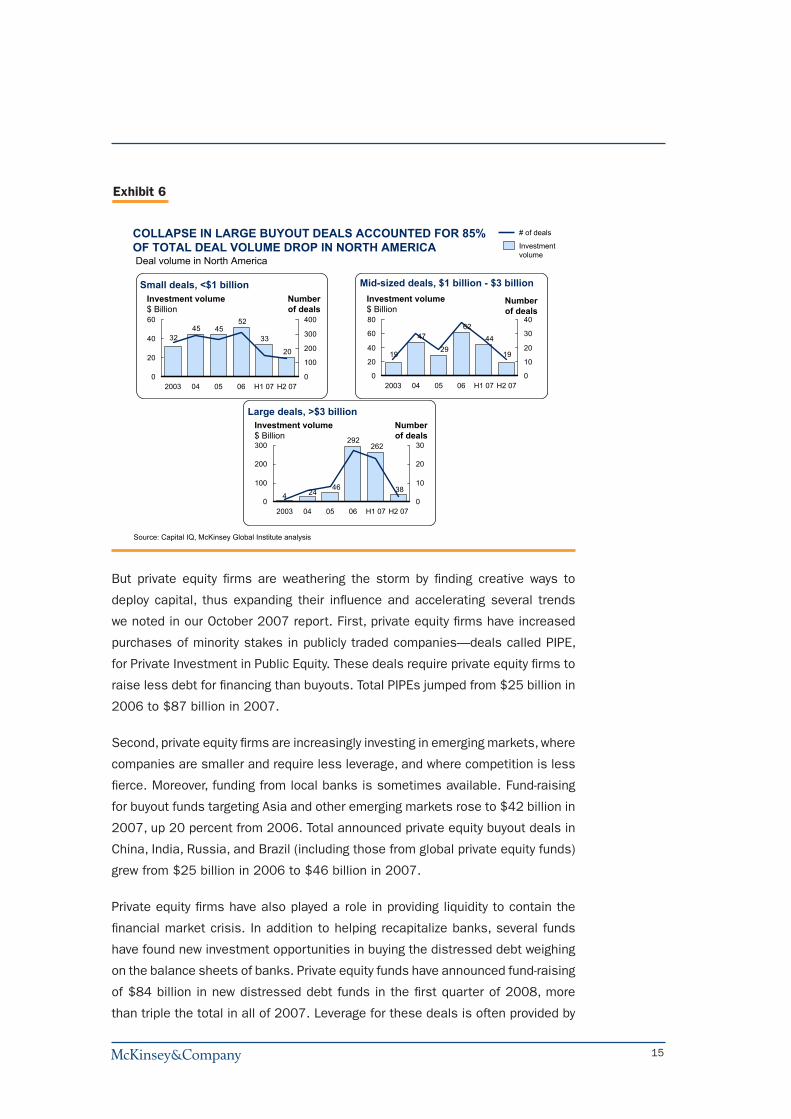
2008. As a result, the total value of announced deals in North America fell from
$339 billion in the first half of 2007 to just $77 billion in the second half of the
year—a 77 percent decline. Most of this drop reflects the near-disappearance
of the “megadeals” worth more than $3 billion; deals for less than $1 billion
showed only a modest decline (Exhibit 6). Europe has been hit even harder, with
the value of total announced deals in 2007 lower than a year earlier.
10 In this report, we focus only on leveraged buyout funds (LBOs). We use the terms “private equity” and “LBOs” interchangeably. In broader usage, “private equity” also sometimes refers to venture capital, mezzanine financing, and distressed debt. We focus on LBOs because they are the largest segment and the focus of public debate.
Exhibit 5
PRIVATE EQUITY NEW FUNDRAISING FELL SHARPLY IN THIRD QUARTER 2007, THEN REBOUNDED
* Estimated breakdown to quarters according to closed funds breakdown.Source: Preqin; McKinsey Global Institute analysis
58
41
80
4643
29
Avg'06
Q1'07
Q2'07
Q3'07
Q4'07
Avg'05
25
8
32
1623
16
Avg'05
Avg'06
Q1'07
Q2'07
Q3'07
Q4'07
8
07543
Avg'05
Avg'06
Q1'07
Q2'07
Q3'07
Q4'07
North America Europe Asia/Rest of World
Fundraising* for leveraged buyout (LBO) funds$ Billion
15
But private equity firms are weathering the storm by finding creative ways to
deploy capital, thus expanding their influence and accelerating several trends
we noted in our October 2007 report. First, private equity firms have increased
purchases of minority stakes in publicly traded companies—deals called PIPE,
for Private Investment in Public Equity. These deals require private equity firms to
raise less debt for financing than buyouts. Total PIPEs jumped from $25 billion in
2006 to $87 billion in 2007.
Second, private equity firms are increasingly investing in emerging markets, where
companies are smaller and require less leverage, and where competition is less
fierce. Moreover, funding from local banks is sometimes available. Fund-raising
for buyout funds targeting Asia and other emerging markets rose to $42 billion in
2007, up 20 percent from 2006. Total announced private equity buyout deals in
China, India, Russia, and Brazil (including those from global private equity funds)
grew from $25 billion in 2006 to $46 billion in 2007.
Private equity firms have also played a role in providing liquidity to contain the
financial market crisis. In addition to helping recapitalize banks, several funds
have found new investment opportunities in buying the distressed debt weighing
on the balance sheets of banks. Private equity funds have announced fund-raising
of $84 billion in new distressed debt funds in the first quarter of 2008, more
than triple the total in all of 2007. Leverage for these deals is often provided by
Exhibit 6
COLLAPSE IN LARGE BUYOUT DEALS ACCOUNTED FOR 85% OF TOTAL DEAL VOLUME DROP IN NORTH AMERICA
Source: Capital IQ, McKinsey Global Institute analysis
Small deals, <$1 billionNumberof deals
20
33
524545
32
0
20
40
60
0
100
200
300
400
2003 04 05 06 H1 07 H2 07
# of deals
Investmentvolume
Mid-sized deals, $1 billion - $3 billion
19
4462
29
47
19
0
20
40
60
80
0
10
20
30
40
2003 04 05 06 H1 07 H2 07
Large deals, >$3 billion
38
262292
46244
0
100
200
300
0
10
20
30
H1 07 H2 072003 04 05 06
Investment volume$ Billion
Numberof deals
Investment volume$ Billion
Numberof deals
Investment volume$ Billion
Deal volume in North America

16
the banks themselves, and in some cases, private equity firms and hedge funds
are purchasing the loans made to finance their own deals. These debt sales
will likely prove to be lucrative for the private equity firms. And they will enable
the banks to improve their balance sheets, which should help them resume
lending.
HEDGE FUND INDUSTRY HIT HARDEST BY THE CRISIS
Hedge funds have been most adversely affected by the credit crisis of the past
year. Although their total assets under management grew in 2007 to $1.9 trillion,
new capital inflows from investors declined throughout the year and into the first
quarter of 2008 (Exhibit 7). The decline affected all hedge fund strategies.
The main reasons have been investor nervousness and disappointing hedge
fund returns. From October 2007 through March 2008, the Tremont index of
aggregate hedge fund returns fell 3 percent. That’s better than global equities—
the MSCI World Index fell 16 percent—but still a decline. Total hedge fund
industry returns were negative in the first quarter of 2008 for the first time since
2004. Moreover, the aggregate results mask large differences across hedge
fund strategies. Several high-profile hedge funds closed down or defaulted in
2007 and 2008, including Bear Stearns’ hedge funds, Peloton Partners, Sailfish
Capital Partners, Focus Capital, and UBS’s Dillon Read. Many fixed-income strat-
egies have performed very poorly.
Exhibit 7
HEDGE FUND INFLOWS FELL SHARPLY OVER 2007
* Excluding assets of funds of hedge funds (FoHF).Source: Hedge Fund Research; McKinsey Global Institute analysis
Assets under management* Inflows to funds*
1,8751,8681,8101,7451,605
Q12007
Q22007
Q32007
Q42007
Q12008
+9%+4% +3% +0%
16
30
45
5960
Q12007
Q22007
Q32007
Q42007
Q12008
-73%
$ Billion
17
Hedge funds also are suffering from the drying up of credit used to enhance
their returns. According to an analysis by JPMorgan Chase, hedge fund leverage
decreased by 67 percent in 2007.11 While it has increased somewhat since then,
leverage remains about 40 percent below its early 2007 level. Banks are being
particularly careful about lending to hedge funds. And like banks, hedge funds
are taking large asset write-downs and credit losses.
These trends likely will lead to further consolidation in the hedge fund industry,
favoring the larger hedge fund groups that use multiple investment strategies and
may have larger capital cushions. Additionally, the hedge funds that have raised
permanent capital through tapping public markets may be better positioned than
others to ride out a rough market. Already, the 100 largest hedge funds control
71 percent of assets under management, up from 68 percent in 2006. That
share may continue to rise.12
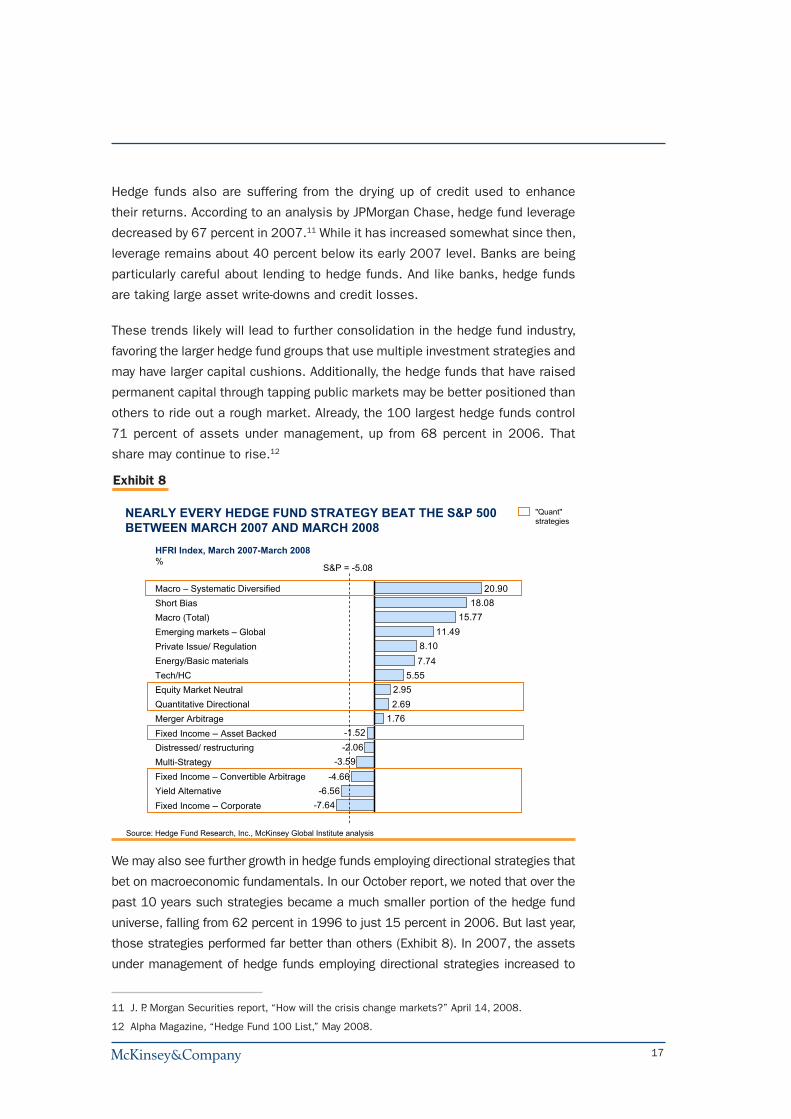
We may also see further growth in hedge funds employing directional strategies that
bet on macroeconomic fundamentals. In our October report, we noted that over the
past 10 years such strategies became a much smaller portion of the hedge fund
universe, falling from 62 percent in 1996 to just 15 percent in 2006. But last year,
those strategies performed far better than others (Exhibit 8). In 2007, the assets
under management of hedge funds employing directional strategies increased to
11 J. P. Morgan Securities report, “How will the crisis change markets?” April 14, 2008.
12 Alpha Magazine, “Hedge Fund 100 List,” May 2008.
Exhibit 8
-7.64-6.56
-4.66-3.59
-2.06-1.52
1.762.692.95
5.557.748.10
11.4915.77
18.0820.90Macro – Systematic Diversified
Short BiasMacro (Total)Emerging markets – GlobalPrivate Issue/ RegulationEnergy/Basic materialsTech/HCEquity Market NeutralQuantitative DirectionalMerger ArbitrageFixed Income – Asset BackedDistressed/ restructuringMulti-StrategyFixed Income – Convertible ArbitrageYield AlternativeFixed Income – Corporate
NEARLY EVERY HEDGE FUND STRATEGY BEAT THE S&P 500 BETWEEN MARCH 2007 AND MARCH 2008
Source: Hedge Fund Research, Inc., McKinsey Global Institute analysis
HFRI Index, March 2007-March 2008%
S&P = -5.08
"Quant"strategies
18
16 percent of the total; we may see further increases in coming years as investors
reconsider their hedge fund portfolios.
RISKS REMAIN
The rapid rise of the new power brokers also poses potential risks that warrant
discussion. In our October report, we highlighted four main concerns: that the
additional liquidity might foster asset price inflation; that state investors might
use their wealth for political purposes; that hedge fund failures might destabilize
the financial system; and that private equity firms’ heavy leverage might increase
credit defaults. Market events since then have shown that these risks are genuine
and have underscored the need for regulators to find ways to minimize them.
The first risk is that the power brokers’ liquidity could fuel asset price bubbles.
We noted in the October report that Asian and petrodollar investors together had
helped lower US long-term interest rates by as much as 75 basis points through
their significant purchases of US Treasuries and corporate bonds. In retrospect,
it is clear this low-interest rate environment helped create the conditions that
spurred larger mortgages, additional home-equity loans, and subprime lending—
all of which inflated housing prices and set the stage for the current credit crisis.
Indeed, as global investors seek new investment opportunities for their rapidly
rising wealth, the risk of asset price bubbles remains.
A second risk is that state investors might have noneconomic motives for their
investments. The rise of SWFs in a broader range of oil exporters heightens this
concern because some have a history of mixing politics with business. Venezu-
ela’s President Hugo Chavez, for instance, has openly sought to use his nation’s
oil wealth to advance his political agenda. And Russia briefly cut off natural gas
supplies to Ukraine during a dispute in January 2006.
At the same time, some of the more established SWFs are showing increased
openness regarding their investment strategies and operations. In March 2008,
representatives from the Abu Dhabi Investment Authority and the Singapore
Government Investment Corporation met with US Treasury officials and agreed
that sovereign wealth funds should base investment decisions on commercial
grounds rather than geopolitical goals. Representatives of the 25 largest SWFs
are meeting with International Monetary Fund representatives in an effort to reach
consensus on a “code of conduct” around transparency of investment criteria.
Some SWF managers and government officials have started discussing their
19
activities more publicly through the media.13 This is not a comfortable position
for investment vehicles accustomed to complete confidentiality. Nonetheless,
they are showing a willingness to discuss Western government concerns.
One question remaining is whether SWFs will actively participate in the manage-
ment of their portfolio companies. It’s a question for which there is no clear right
answer. In most of the recent investments in distressed financial institutions,
SWFs agreed to invest without board representation. This may assuage public
concerns about their motives. But it then raises questions about the efficacy
of their involvement and long-term implications for the quality of management,
since activist shareholders pressure management to raise performance. From
an economic perspective, passive investors with very deep pockets may not be
good for long-term corporate health. Striking the right balance will be essential.
A third concern is that hedge fund failures could cause the kind of systemic risk
that followed Long-Term Capital Management’s near-collapse in 1998. So far,
even very large hedge fund failures have not led to the same kind of contagion.
Nonetheless, many of the hedge funds that rely on quantitative models to drive
investment contributed to equity market volatility in fall 2007.
A final risk is that the large amounts of debt that private equity funds load onto
the balance sheet of their portfolio companies will cause a rise in defaults dur-
ing this economic downturn. So far, this fear has not played out. According to
Moody’s, the volume of all corporate bond and loan defaults was $7 billion in
2007, compared with $10 billion in 2006 and $34 billion in 2005. Moreover,
private equity firms are hardly cash-strapped—on the contrary, they are overly
liquid, eagerly looking for investment targets that could generate acceptable re-
turns. If, however, the economic downturn continues, it is possible that a growing
number of portfolio companies might not be able to make their debt payments,
in which case we would see an increase in defaults. That would be another blow
to banks already reeling from mortgage losses.
THE POWER BROKERS’ SIZE AND CLOUT WILL CONTINUE TO GROW
Despite the financial crisis, we foresee the four power brokers continuing to grow
in wealth and clout. In our conservative, base-case scenario, we project their
combined assets will grow to $21 trillion (excluding overlap between them) by
13 Examples include Gao Xiqing, president of the China Investment Corporation; Bader Moham-mad Al-Saad, managing director of the Kuwait Investment Authority; and Russian Finance Minister Alexei Kudrin.

20
Exhibit 10
NEW POWER BROKERS COULD BE 60 PERCENT THE SIZE OF GLOBAL PENSION FUNDS IN 2013Assets under management, 2013E$ Trillion
7.7
35.9
57.7
49.3
10.0* 12.2**
12.2
3.0 4.9
1.6 3.0
* At oil price of $70 per barrel.** At oil price of $100 per barrel.
Source: Hedge Fund Research; Preqin; IFSL; IMF; Global Insight; McKinsey Global Institute Cross-Border Investments Database; McKinsey Global Institute analysis
Pension funds
Mutual funds
Petrodollar foreign assetsAsian sovereign investors
Hedge funds
Private equity
Insurance assets
Base case
Continued growth
Total assets of $21 trillion– $31 trillion in 2013(excludingoverlap)
Exhibit 9
0.9
2007
1.6
Base-casescenario
3.0
Continued-growthscenario
1.9
2007
3.0
Base-casescenario
4.9
Continued-growthscenario
Source: McKinsey Global Institute analysis
$ Trillion
20072013 base case2013 continued-growth
4.6
2007
7.7
Base-casescenario
12.2
Continued-growthscenario
Asian sovereign investors Petrodollar foreign assets
Hedge funds Private equity
4.6
2007
10.0
Base-casescenario($70 bbl)
12.2
Continued-growth($100 bbl)
EACH OF THE NEW POWER BROKERS WILL GROW LARGER BY 2013

21
2013 (Exhibit 9).14 If, instead, they grow more briskly, at their 2000 to 2007 pace,
their wealth would rise to $31 trillion: equivalent to roughly 60 percent of the
expected size of global pension funds or mutual funds in 2013 (Exhibit 10). We
have, however, made some adjustments to our forecast in light of recent events:
Petrodollar wealth is likely to grow more rapidly than we envisioned in October,
when our base-case scenario assumed $50-a-barrel oil. With oil surpassing $120
a barrel in May 2008, it’s hard to foresee a decline that dramatic. High prices may
already be dampening demand somewhat in developed economies, but it will take
years to significantly improve energy efficiency and develop feasible alternatives to
oil. Meanwhile, demand is still rising steadily in booming emerging market econo-
mies. We expect oil exporters to invest more of their petro-profits domestically—a
trend we are already seeing—but their economies and capital markets are too
small to absorb all of the windfall.15 So much of their growing revenue will continue
to spill over into global capital markets, boosting their foreign assets. In our new
base case, with oil averaging $70 a barrel, we forecast the oil exporters’ foreign
assets to grow to $10 trillion by 2013. At $100 a barrel, their foreign wealth could
reach $12.2 trillion. We also project that the ranking of the financial clout of oil-
exporting nations will change over this period, with both Saudi Arabia and Russia
overtaking the United Arab Emirates, accumulating a total of $2.3 trillion and $2.4
trillion, respectively, in foreign assets at $100 per barrel oil. African oil exporters
will experience the fastest growth over the period, at 30 percent annually, and their
foreign assets will grow to $1.6 trillion at $100 per barrel oil.
Asian sovereign investors’ assets depend on foreign exchange reserve accumula-
tion, which is subject to considerable uncertainty. Allowing more appreciation of
their currencies—as many international policy makers and financial institutions
believe they should—would reduce the flow of capital into central banks’ cof-
fers and possibly lower trade surpluses. China has recently allowed its currency,
the renminbi, to appreciate a bit to under 7 renminbi to the US dollar, from
its longtime value of 8.29. Even assuming shrinking trade surpluses in coming
years, however, we calculate that Asian sovereign assets will grow to $7.7 trillion
by 2013 in our base case, of which $1.6 trillion will be in sovereign wealth
14 Assuming the portfolio allocation to private equity and hedge funds remains the same as today, petrodollar investors will have $550 billion in private equity and hedge funds by 2013 in our base case, while Asian sovereign investors will invest $450 billion in private equity and hedge funds.
15 See The Coming Oil Windfall in the Gulf, The McKinsey Global Institute, January 2008, available online at www.mckinsey.com/mgi.

22
funds.16 If, instead, surpluses continue to grow at their 2000 to 2007 rate, Asian
sovereign assets will climb to $12.2 trillion by 2013, of which $2 trillion could
be in SWFs.17
The hedge fund industry will likely get through the current crisis and continue
growing in coming years, but our forecast is now a bit lower than before the
crisis. Although investor inflows had slowed to a halt by early 2008, the long-term
fundamental trends that have driven the industry’s growth so far will likely con-
tinue. New money will come from large institutional investors, such as pensions
and endowments, increasing their allocations to alternative asset classes; from
petrodollar investors seeking higher returns; and from growing funds of hedge
funds, which opens up the asset class to less wealthy investors. Still, we have
lowered our forecast since October. We now assume going forward that investor
inflows will be a quarter of their 2000 to 2007 growth rates, or 9 percent per
year, and that hedge fund returns will be at half their 2000 to 2007 growth rates,
or 5 percent per year. That would mean their assets under management will grow
to $3 trillion in 2013.
Private equity will continue to grow, in part because of the same trends fuel-
ing hedge fund growth—rising allocations from institutional investors and new
money from petrodollar investors. Our base-case forecast is unchanged since
October: New US and European fund-raising will continue at its 2007 pace, while
fund-raising in Asia and the rest of the world grows at 10 percent annually, or half
its previous rate. That would boost assets under management in buyout funds
to $1.6 trillion by 2013. However, sovereign wealth funds are a wild card in this
forecast. Currently, we estimate that just over half of SWFs (by assets) invest in
private equity funds, and that their average allocation to private equity is less
than 5 percent. If SWFs were to double their allocation to private equity by 2013
to 10 percent, their investments in private equity would grow from approximately
$80 billion today to nearly $380 billion by 2013.18 This would add an additional
$200 billion to our forecast for private equity assets in 2013.
•••
16 This assumes that the RMB/$US exchange rate will decline to 5.6 by 2013 and that the Yen/$US exchange rate will decline to 90.4; other major Asian currencies are not expected to affect the forecast.
17 This calculation assumes a 4.4 percent real appreciation on assets, and an additional 10 percent of Asian central bank reserves are shifted into SWFs by 2013 (a total of $620 billion).
18 This calculation assumes that Asian SWFs grow to $1.6 trillion in assets by 2013, reflecting a shift of central bank reserve assets into SWFs, and that petrodollar SWFs grow to $4.8 trillion in assets, reflecting $100 per barrel oil.

23
The financial market turbulence of the past year has thrust the four new power bro-
kers into the spotlight and accelerated trends we identified earlier. Financial power
is dispersing more rapidly than before. These four investor groups will continue to
grow, expanding their investment strategies in pursuit of higher returns and spurring
the growth of private financing as an alternative to public markets. The concerns
we’ve cited remain on the table and justify careful monitoring. But overall, the rise of
these new power brokers has been largely beneficial to global capital markets.

24
McKinsey Global Institute Last modified: 03/07/08 Copyright © McKinsey & Company www.mckinsey.com/mgi Design by Visual Aids, McKinsey & Company, São Paulo