the new municipal reality: difficult choices
DESCRIPTION
The New Municipal Reality: Difficult Choices. Raphael J. Caprio, Ph.D., University Professor Edward J. Bloustein School of Planning and Public Policy. Overview of Major Issues. Major Shifts in the New Jersey Economic Landscape - PowerPoint PPT PresentationTRANSCRIPT

THE NEW MUNICIPAL REALITY:DIFFICULT CHOICES
Raphael J. Caprio, Ph.D., University ProfessorEdward J. Bloustein School of Planning and Public Policy
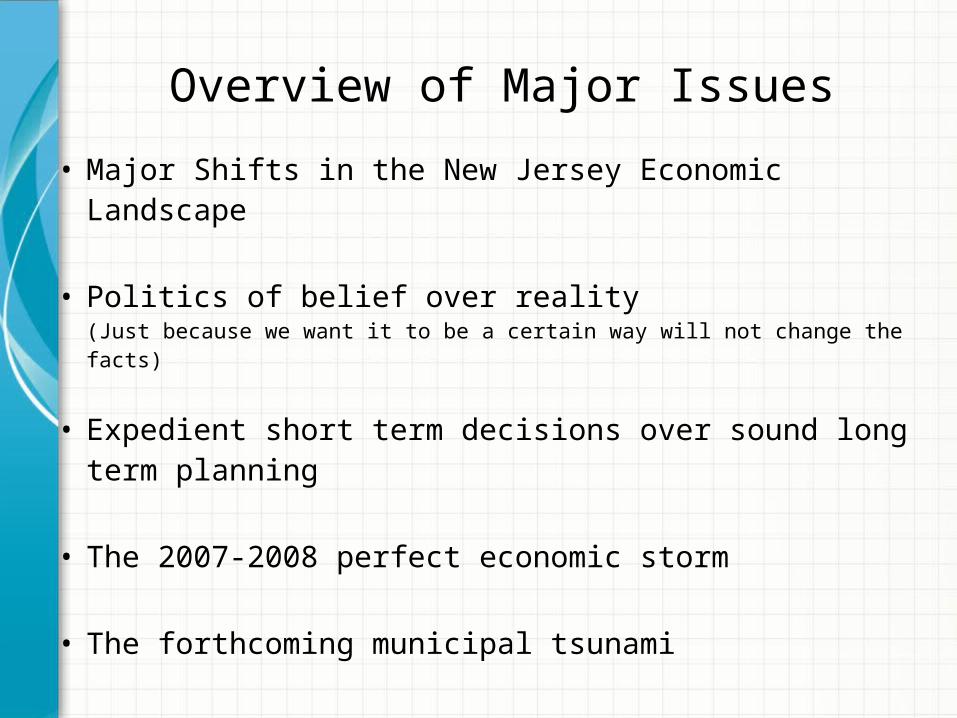
Overview of Major Issues• Major Shifts in the New Jersey Economic Landscape
• Politics of belief over reality(Just because we want it to be a certain way will not change the facts)
• Expedient short term decisions over sound long term planning
• The 2007-2008 perfect economic storm
• The forthcoming municipal tsunami

4
41
16
13
3.5
13.5
9
Major Annual Public Revenue Sources
Surplus: all levels
Property Tax
State Income Tax
State Sales Tax
State Corporation Tax
Other State Taxes/Revenue
Other Local/School Revenue
19.5
10.5
39.5
30.5
Annual Public Spending
Local Government County GovernmentSchools State Government (less Aid)

2006 2007 2008 2009 2010 2011 2012 2013$25.0
$26.0
$27.0
$28.0
$29.0
$30.0
$31.0
$32.0
$33.0
Total NJ State Government Revenues (in billions)
Reve
nue
in B
illio
ns

Source: Tom Moran, The Star Ledger, June 17, 2012


Total Government Employment in New Jersey
Most of the constraints on revenue have been met by reductions in the workforce

Atlantic City - Hammonton Camden Edison - New Brunswick Newark - Union Trenton - Ewing Ocean City Vineland-Millville-Bridgeton0
2
4
6
8
10
12
14
16
5.7
4.94.3
4.94.4 4.3
7
12.9
10.7
9.59.9
8.99.5
14.3
Regional Unemployment Rates: 2007 v. 2012
2007 2012

• Cost Share – Chapter 781
• Property Tax Levy Cap2
• Interest Arbitration Changes3
Major Actions

Chapter 78: The Health Premium Cost Shift
$30,000
$40,000
$50,000
$60,000
$70,000
$80,000
$90,000
$100,000
$110,000
$130,000
$150,000
$170,000
$190,000 0.00%
1.00%
2.00%
3.00%
4.00%
5.00%
6.00%
7.00%
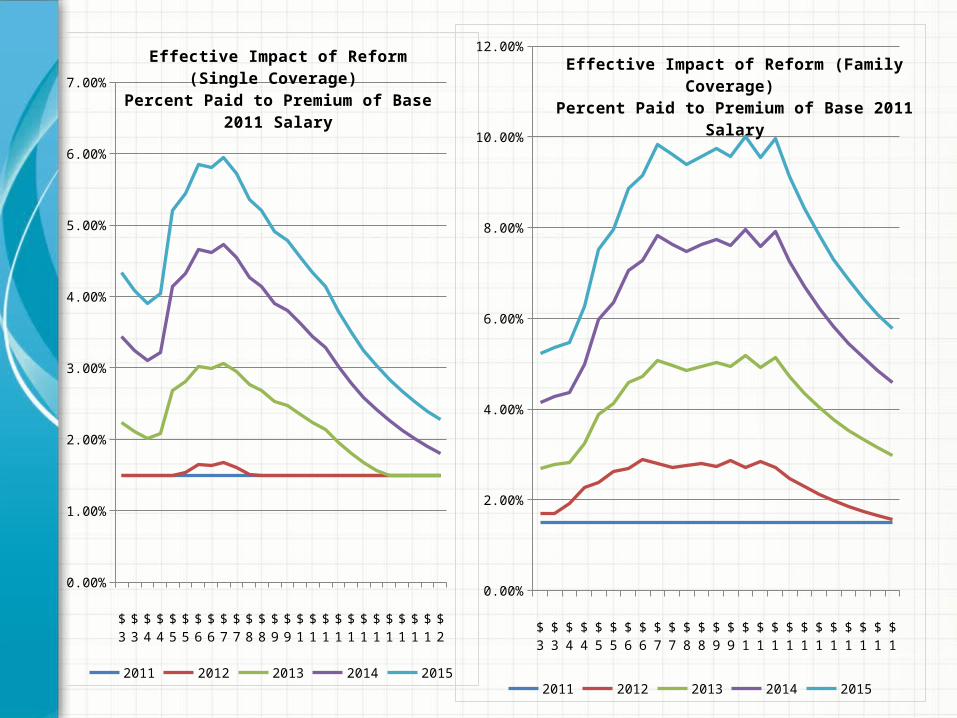
Effective Impact of Reform (Single Coverage) Percent Paid to Premium of Base 2011 Salary
2011 2012 2013 2014 2015
$30,000
$40,000
$50,000
$60,000
$70,000
$80,000
$90,000
$100,000
$110,000
$130,000
$150,000
$170,000
$190,000 0.00%
2.00%
4.00%
6.00%
8.00%
10.00%
12.00%Effective Impact of Reform (Family Coverage) Percent Paid to Premium of Base 2011 Salary
2011 2012 2013 2014 2015

-- In Addition -- Effective Wage Loss Due to Cost of Living
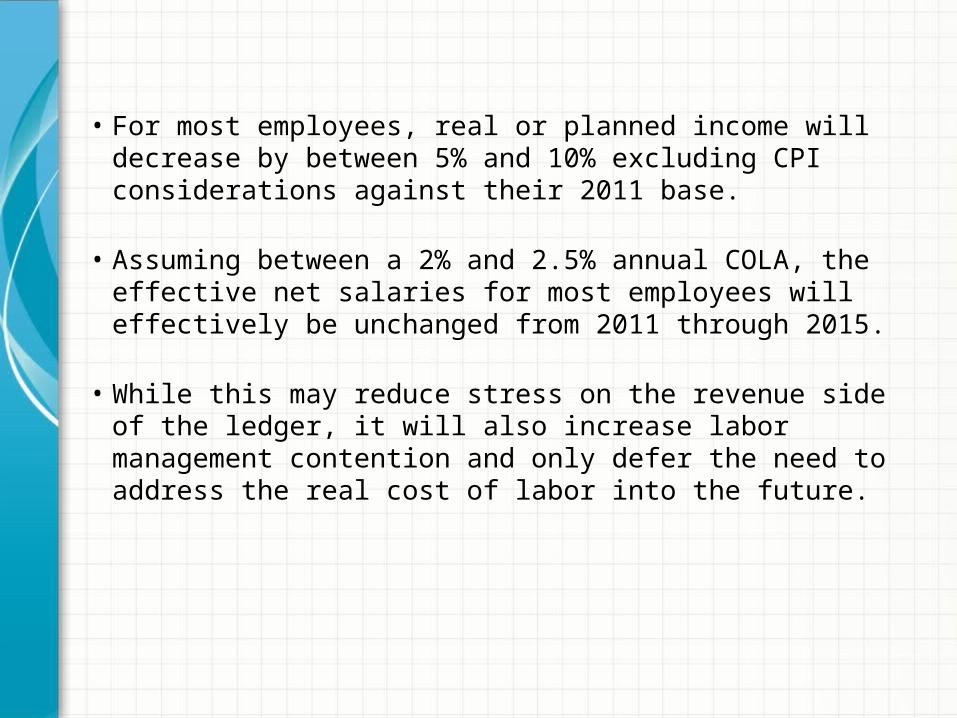
• For most employees, real or planned income will decrease by between 5% and 10% excluding CPI considerations against their 2011 base.
• Assuming between a 2% and 2.5% annual COLA, the effective net salaries for most employees will effectively be unchanged from 2011 through 2015.
• While this may reduce stress on the revenue side of the ledger, it will also increase labor management contention and only defer the need to address the real cost of labor into the future.

A Quick Look at the 2% Levy Cap

Municipal Purpose County Purpose Schools0.00%
0.20%
0.40%
0.60%
0.80%
1.00%
1.20%
1.40%
1.60%
0.64%
0.48%
1.35%
0.58%
0.35%
1.05%
Property Tax Burden as a Percent of Equalized Value: 2001 v. 2011
2001 2011
• Statewide, the total property tax burden (taxes assessed) as a percentage of equalized value, has gone from 2.46% of value in 2001 to 2.01% of value in 2011.
• Appreciating that value expressed in 2011 reflects considerable loss due to the housing market collapse, this represents a reduction in total burden vis-à-vis value of 18.3%.
2005 2006 2007 2008 2009 2010 2011 2012 2013 2014 2015 2016 2017$0
$200,000,000
$400,000,000
$600,000,000
$800,000,000
$1,000,000,000
$1,200,000,000
$1,400,000,000
$1,600,000,000
$1,800,000,000
$2,000,000,000
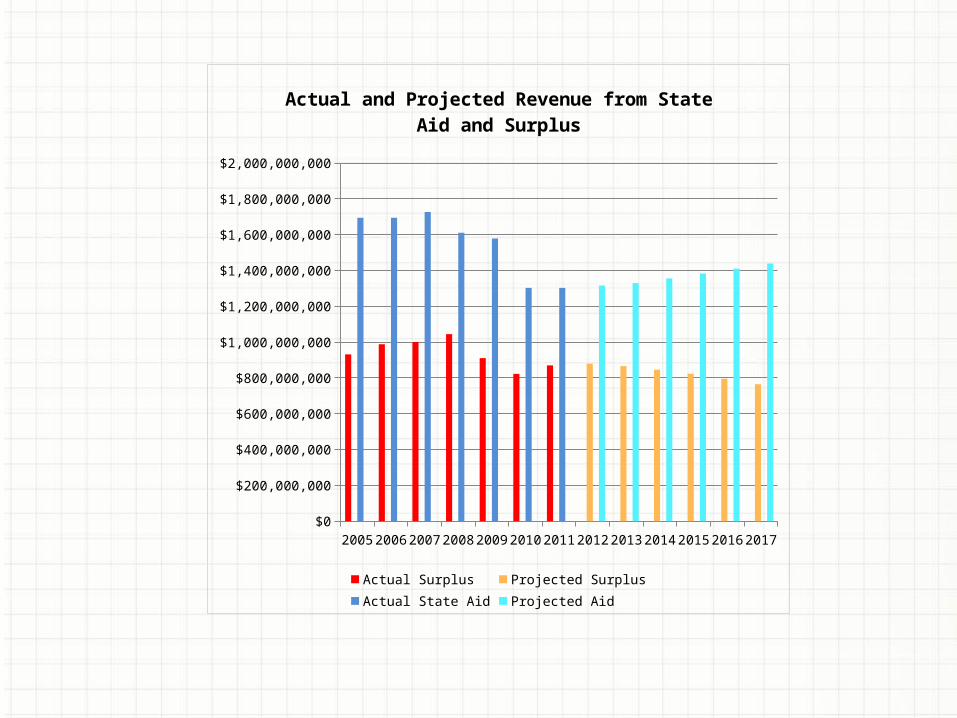
Actual and Projected Revenue from State Aid and Surplus
Actual Surplus Projected Surplus Actual State Aid Projected Aid
CY2001/FY
2002
CY2002/FY
2003
CY2003/FY
2004
CY2004/FY
2005
CY205/FY
2006
CY2006/FY
2007
CY2007/FY
2008
CY2008/FY
2009
CY2009/FY
2010
CY2010/FY
2011
CY2011/FY
2012$0
$500,000,000
$1,000,000,000
$1,500,000,000
$2,000,000,000
$2,500,000,000
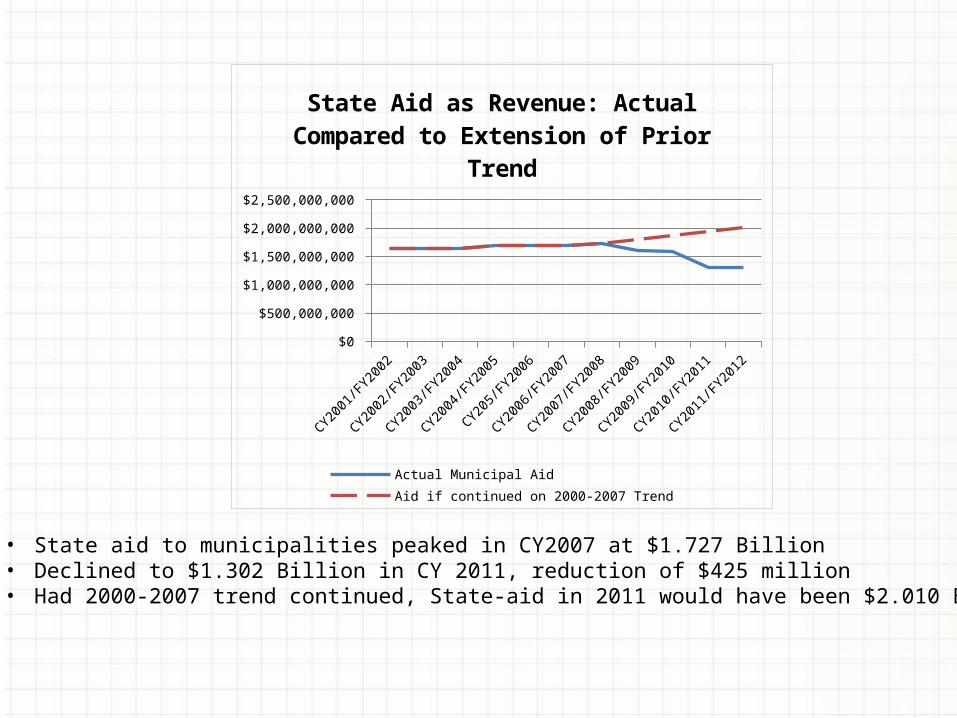
State Aid as Revenue: Actual Compared to Extension of Prior Trend
Actual Municipal AidAid if continued on 2000-2007 Trend
• State aid to municipalities peaked in CY2007 at $1.727 Billion• Declined to $1.302 Billion in CY 2011, reduction of $425 million• Had 2000-2007 trend continued, State-aid in 2011 would have been $2.010 Billion

CY2007/FY2008 CY2008/FY2009 CY2009/FY2010 CY2010/FY2011 CY2011/FY20120.00
10.00
20.00
30.00
40.00
50.00
60.00
Percent of Property Tax Increase Necessary to Offset State Aid Policy Change
Perc
ent o
f Tot
al A
nnua
l Ta
x In
crea
se O
ffsetti
ng Lo
ss o
f Sta
te A
id
• The State’s inability to fund aid to municipalities at past trends during the“recession” period (representing approximately $707 million in lost aid to municipalities) effectively accounts for 50% of municipal purpose property tax increases by CY2011

General Government
Financial Administration
Legal Services
Police
Fire and EMS
Municipal Court
Other Public Safety
Public Works
Solid Waste and Recycling
Parks and Recreation
Health and Human Services
Land Use Administration
Code Enforcement
Library
Insurance
Debt Service
Capital Budget
Utilities
Reserve/ Uncollected Taxes
Pensions
Health Benefits
0.00% 5.00% 10.00% 15.00% 20.00% 25.00%
3.10%
2.14%
0.97%
20.17%
6.31%
1.10%
0.94%
8.34%
4.75%
2.01%
1.25%
0.58%
1.29%
2.48%
4.91%
8.93%
1.06%
3.18%
4.82%
7.50%
11.26%
Total Municipal Appropriations by Type (2010)
Flexibility exists in only about two-thirds of most budgets.
Reduction of a $1.00 is really a proportional decision about where to cut $1.50 elsewhere

2010 2011 2012 2013 2014 2015 2016 2017$10,000,000,000
$11,000,000,000
$12,000,000,000
$13,000,000,000
$14,000,000,000
$15,000,000,000
$16,000,000,000
$17,000,000,000
Projected Shortfall of Revenue Against Required Appropri-ations to Maintain Services at the 2009 Level
Required Appropriations Available Revenue

Option: Consolidation In Light Of The Cost of Delivering Municipal Government
An Analysis of 561 municipalities (exclude under 100 and over 100,000).
51 Variables including population, equalized property value, total budget, appropriations per capita, vacancy rates, demographic data, crime rates, etc.
Lots of variables are related to size.
Almost nothing is related to municipal appropriation per capita suggesting that the amount appropriated per capita is completely independent of the size of the municipality

• There are approximately 175 municipalities with fewer than 4,500 people• Data – particularly from among the smallest municipalities (under 4,500 persons) -
would suggest certain savings can be gained by “consolidation”
Under 4,500
4500-6999
7000-9999
10000-14999
15000-19999
20000-29999
Over 30,000
$0
$500
$1,000
$1,500
$2,000
$2,500
$3,000
$3,500
$3,042
$1,401$1,277
$1,397 $1,377 $1,353$1,432
Cost of Local Government Per CapitaThe 50,000 Foot View

MantolokingHarvey Cedars
AllenhurstBarnegat Light
West WildwoodLoch Arbour
DealInterlaken
Stone HarborLongport
Ship BottomBeach Haven
Surf CityBay Head
West Cape MayAvalon
Sea BrightSeaside Park
and more
well, also consider another “outlier”
Teterboro
Reality (well, partial reality) Gets in the Way
Consider
There are several dozen municipalities with disproportionately small year round populationswith services and infrastructure serving a “real” population many times larger

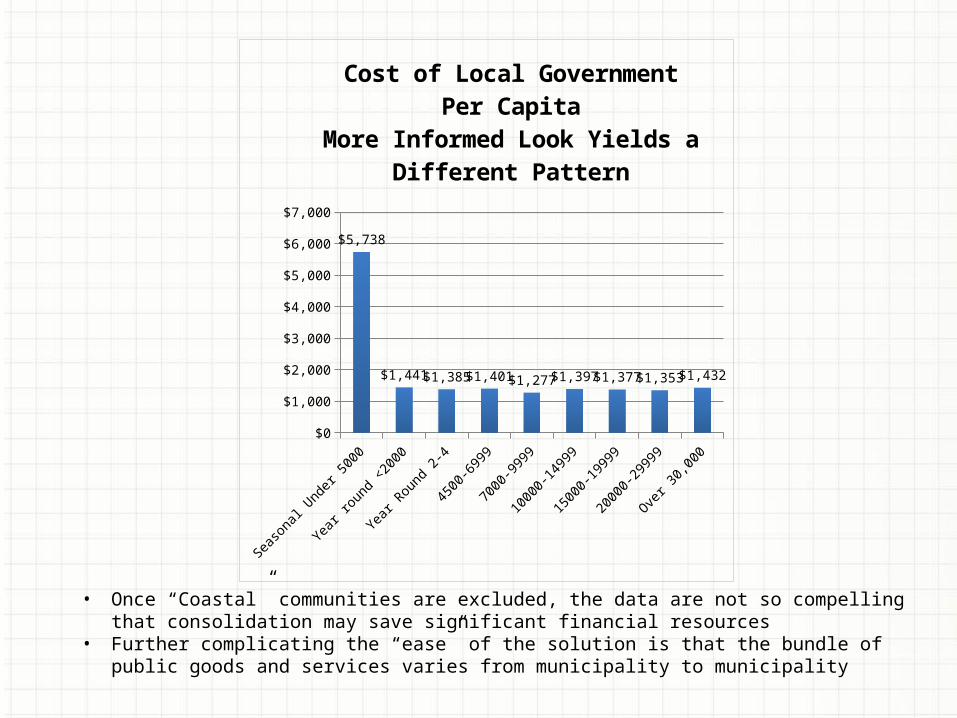
Sea-sonal Under 5000
Year round <2000
Year Round
2-4
4500-6999
7000-9999
10000-14999
15000-19999
20000-29999
Over 30,000
$0
$1,000
$2,000
$3,000
$4,000
$5,000
$6,000
$7,000
$5,738
$1,441 $1,385 $1,401 $1,277 $1,397 $1,377 $1,353 $1,432
Cost of Local Government Per CapitaMore Informed Look Yields a Different
Pattern
• Once “Coastal” communities are excluded, the data are not so compelling that consolidation may save significant financial resources
• Further complicating the “ease” of the solution is that the bundle of public goods and services varies from municipality to municipality
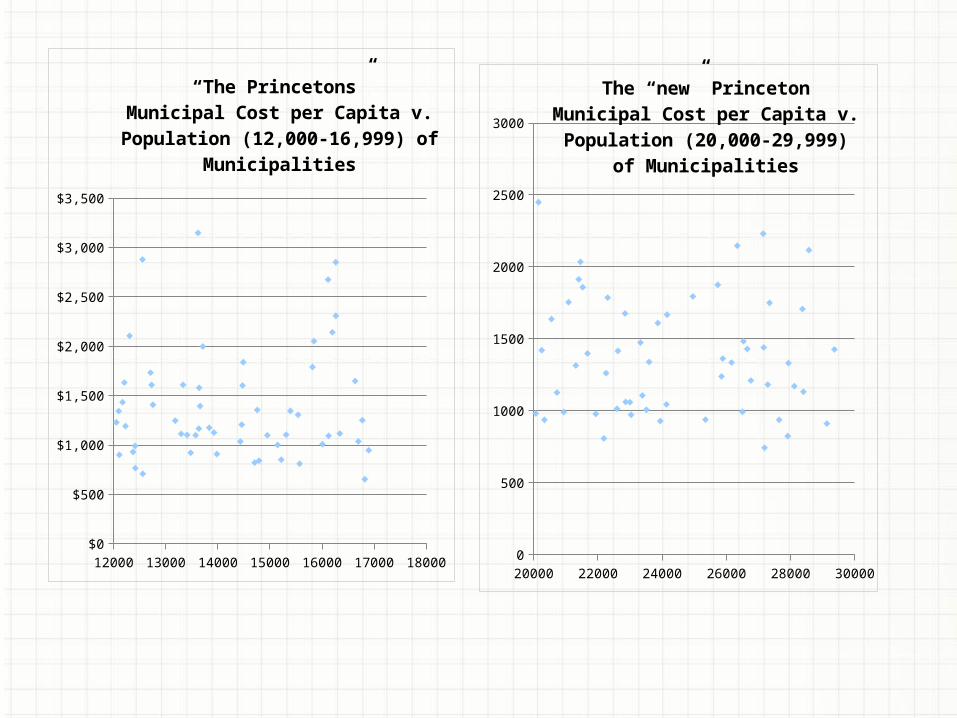
12000 13000 14000 15000 16000 17000 18000$0
$500
$1,000
$1,500
$2,000
$2,500
$3,000
$3,500
“The Princetons”Municipal Cost per Capita v. Population
(12,000-16,999) of Municipalities
20000 22000 24000 26000 28000 300000
500
1000
1500
2000
2500
3000
The “new” PrincetonMunicipal Cost per Capita v. Population
(20,000-29,999) of Municipalities

Interest Arbitration
Just an Observation or Two
Pendulum is Now at the Other Extreme
Most Salary Guides Require more than 2% simply to meet the “cost of doing business”
Uncertain pressures and outcomes

• Limited surplus growth
• Miscellaneous Revenue tied to a slow recovery
• State aid growth marginal at best
• Dependence upon property tax actually increasing while ability to raise revenue from this source is constrained
• Health care cost increases only slightly deferred two years with virtually no bottom line savings
• Labor pressures likely from Chapter 78 cost shifts
• Consolidation not a realistic answer to provide the scale of savings (if savings actually would result from consolidation)
• Shared service savings not sufficient in scale to compensate for regulated property tax revenue

• Revenue will continue to be highly constrained – need to think now about how to do things differently.
• Consolidation is unlikely to yield solutions at the scale necessary.
• Shared services, while they should continue to be encouraged and explored are not likely to yield savings of sufficient size to solve the revenue gap challenge.
• How do you protect against increases in contract costs once you enter into an agreement (no CCCA equivalent in NJ).
• Public employees will experience four years of declining purchasing power, further reinforced by changes in the Interest Arbitration “rules” probably leading to extremely challenging labor relations that will have to be addressed by 2015 if not before.
• Service priority decisions will become increasingly difficult as the easy “across-the-board” options will have been exhausted.
• Need to place every service on the table and explore whether it is a priority and how it should be delivered.
• We no longer have the luxury not dealing with how public good and services are paid for, organized, and delivered. A 19th century structure cannot deliver 21st century services in an economic environment that may be more modest in its growth than that which we saw in the 50s and 60s.
• Need to think outside the box.

Some options explored by the CNJG Initiative and Others
• County-wide (State-wide) annual revaluations to equalize tax burden and reduce tax appeal liabilities
• Consolidation of IT services where in most municipalities there is not sufficient scale to incur the economies nor expanded services that are possible
• County-wide “back-office” support for School Districts
• Explore expansion of regional dispatch and other place independent services
• Assess which services must remain as part of the local “bundle of government services”
• Expansion of contract (shared) services … but structured in a way that allows for some quasi-market benchmark and price control (e.g., CCCA)
• In those very few places where it may make sense (i.e. there is a sense of common community), yes, … consolidation should be considered
• Proportional assessment to schools and county of the Reserve for Uncollected Taxes
• Several dozen of more than 700 examples are provided by the CNJG in its updated report
• Every municipality/county/district is a potential participant in a pilot to help solve the challenges!

OPEN DISCUSSION AND Q&A