the natural history and management of vestibular …etheses.bham.ac.uk/3748/1/martin12md.pdf ·...
TRANSCRIPT

THE NATURAL HISTORY AND MANAGEMENT OF VESTIBULAR SCHWANNOMAS by THOMAS PETER CUTLACK MARTIN A thesis submitted to the Department of Medical Education University of Birmingham University of Birmingham For the degree of March 2012 Doctor of Medicine

University of Birmingham Research Archive
e-theses repository This unpublished thesis/dissertation is copyright of the author and/or third parties. The intellectual property rights of the author or third parties in respect of this work are as defined by The Copyright Designs and Patents Act 1988 or as modified by any successor legislation. Any use made of information contained in this thesis/dissertation must be in accordance with that legislation and must be properly acknowledged. Further distribution or reproduction in any format is prohibited without the permission of the copyright holder.

ABSTRACT Over the past decade (2000-), the management of vestibular schwannomas has been in
a state of flux. An increasing availability of magnetic resonance imaging has allowed
clinicians to monitor tumour progression and increasingly, it has become recognised
that once diagnosed, a significant proportion of lesions do not continue to grow. As a
result, a number of neurotological centres have advocated conservative management
as appropriate for small-medium sized tumours. Birmingham has been one of these
centres, and this thesis presents data gathered over the past fifteen years that reflects
this change in management, drawing upon the Birmingham Vestibular Schwannoma
Database maintained by the author. The thesis addresses issues pertinent to
conservative management: growth rates among observed tumours, risk factors for
growth, the evolution of hearing while under observation and proposes a radiological
surveillance protocol. More broadly, the thesis examines other themes important in
the management of patients with vestibular schwannomas: the role of functional
surgery and the possibility of rehabilitation in single-sided deafness. A number of
chapters from the thesis have been published in peer-reviewed journals and are
presented here in updated or amended form.

DEDICATION
This thesis is dedicated to my parents Jamie and Rosie Martin in gratitude for their love and support over many years.

ACKNOWLEDGEMENTS
This thesis represents work carried out during the course of my registrar training and I
have been fortunate enough to have been supported by a large number of colleagues during
this time. Several chapters have been published as independent articles, and I am indebted
to those colleagues who have collaborated with me in these publications. Dr Roger Holder
has clarified countless statistical conundrums over the years. Konstance Tzifa, Caroline
Kowalski, Hannah Fox and Eu Chin Ho have all collected data from the database at
different times. Swarap Chavda, Latha Senthil, David Proops, Andrew Reid, Huw Cooper
and Richard Walsh in particular have all provided advice and support as senior authors. I
would like to thank Rachel Lowther for her stirling work in the POCIA testing room. I
must also thank Tracey Plant, who has patiently tolerated my frequent residency in her
office and disruption of her filing system. My mother, Rosie Martin, has kindly read the
proofs.
My academic supervisor, Dr Sue Wilson, has been an inspiration in this and other projects:
her advice and critical eye have improved the quality of this thesis immeasurably.
Above all, I must thank my clinical supervisor, Richard Irving. He is a supremely skilled
surgeon who knows when not to operate. His meticulous history-taking and record-keeping
have made the construction of the database upon which this thesis is built possible. Above
all, his forward-thinking ideas have inspired the direction and substance of this work.

TABLE OF CONTENTS
Chapters and sections Pages Introduction 1-60 Pathology, basic science and clinical features of disease Nomenclature 2 Anatomy of vestibular schwannomas 2-5 Tumour classification 5 Histopathology 6 Molecular genetics 6-9 Risk factors: mobile telephone usage 9-10 Epidemiology 10-12 Symptomatology 13-16 Overview of management Investigations 17-20 Treatment 20-25 Literature searches Search strategy 26 Literature search: the natural history of tumour growth 28-37 Literature search: the status of hearing in managed vestibular schwannomas Conservative management 38-43 Surgery 43-45 Radiotherapy 45-48 Summary of weaknesses in existing Literature 48-49 Birmingham database of vestibular schwannomas Audit of data collection 50-51 Ethical approval 51 Data security 51 Data fields covered by the database 52-54 Strengths and limitations 55-57 Thesis aims and objectives 58 Forthcoming chapters 59-60

Chapter 1: The natural history of vestibular schwannoma growth Introduction 61 Analysis of patient and tumour characteristics of patients
managed with either primary definitive management or primary conservative management 62-65
Method 61-62 Results Patient demographics 62-63 Symptomatology 64-65 Tumour characteristics
Analysis of growth and non-growth in conservatively-
managed patients 65-71 The importance of follow-up 65-66 Analysis of patients lost to follow-up 66-71
Chapter conclusion 71-72 Chapter 2: Risk factors for growth in watched vestibular schwannomas Introduction 73 Methods
Data collection 73-75 Statistical analysis 75
Results Demographic risk factors 75-76 Tumour risk factors 76 Symptom duration risk factors 77 Discussion Significant findings 78-80 Comparison with other studies 80-81 Clinical applicability of the study 81-82 Chapter conclusion 82 Chapter 3: Hearing loss and preservation in watched vestibular schwannomas Introduction 83-84
Methods Analysis of hearing loss at presentation Audiological assessment 84 Statistical analysis 84-85 Analysis of patients presenting with ‘serviceable’ hearing and undergoing initial conservative management Patients 85-86 Data analysis 86 Statistical analysis 86 Results Hearing loss at initial presentation 87-88 Patients presenting with ‘serviceable’ hearing and undergoing initial conservative management 88-92 Patients (including discussion of follow-up) 88-89
Hearing preservation results 89-90 Risk factors for hearing preservation 90-92
Discussion 92-96 Chapter conclusion 96-97 Chapter 4: An intention to treat analysis of conservative versus surgical management of vestibular schwannomas Introduction 98-100 Method Study design 101-103 Data analysis 103-105 Results Description of study arms 105-107 Comparison between groups 107-108 Discussion 109-113 Chapter conclusions 113 Chapter 5: A protocol to direct the conservative management of vestibular schwannomas Introduction 114-115

Methods Description of historical surveillance regime 115 Data collection 116-117 Results Outcomes of conservative management 117-118 Tumour growth rates and timing of detection of growth 119-122 Proposed surveillance protocol and rationale 122-125 Discussion 125-127 Chapter conclusion 128 Chapter 6: Functional surgery in the management of vestibular schwannomas: the prioritization of the facial nerve over total tumour removal Introduction 129-130 Literature search Search strategy 130 Background 130-131 Sub-total vs. near-total 131-132 Facial nerve outcomes 133 Recurrence rates 133-135 Methods Patients 135-136 Study design 136-138 Results Patient demographics and tumour characteristics 138-139 Surgical findings 139-140 Facial nerve outcomes 140-142 Follow-up imaging and recurrence 142-143 Discussion 143-145 Chapter conclusion 146-146 Chapter 7: The rehabilitation of single-sided deafness with the bone-anchored hearing aid Introduction 147-151

Methods Patient recruitment 151-153 Testing and questionnaires employed 153-155 Statistical analysis and ethical considerations 155-156 Results Speech discrimination in noise testing 156-157 Speech, spatial and qualities of hearing scale 157-158 Glasgow benefit inventory 158-159 Open questions 158-159 Discussion Synopsis of key findings 160-162 Comparison with other studies 162-163 Chapter conclusions 163-164 Conclusion Suggested management for differing categories of
vestibular schwannoma 165-170 Rehabilitation of single-sided deafness 170-171 Further avenues of research 171-172 References 173-190 Appendix Letter to Dr Bowman, Chairman, South Birmingham Research Ethics Committee Reply to above letter

LIST OF FIGURES Introduction Page Figure 1: Anatomy of brainstem and internal auditory canal. (reproduced with permission from Prof. R Jackler) 3 Figure 2: Moderately-large sized vestibular schwannoma compressing neighbouring structures (reproduced with permission from Prof. R Jackler) 4 Chapter 1 Figure 3: Evolution in management of intracanalicular tumours over time 69 Figure 4: Evolution in management of small-medium sized tumours (Tokyo Grade 1-2) over time 70 Figure 5: Increasing referrals to Birmingham Skull Base Unit 1997-2008 71 Chapter 4 Figure 5: Study arms 106 Chapter 5 Figure 6: Growth rates in growing tumours 119 Figure 7: Time of detection of growth with tumour growth rates 120 Figure 8: Proposed protocol for the conservative management of vestibular schwannomas 123

LIST OF TABLES
Introduction Page
Table 1. Tokyo Classification System 5
Table 2. Protocols for the investigation of hearing asymmetry 19
Table 3: Outline of management strategies for tumours of
differing size and hearing status at Queen Elizabeth Medical
Centre, Birmingham 21
Table 4: Summary of advantages and disadvantages of different
surgical approaches (after Driscoll, 2000) 23
Table 5: Summary of published series of conservatively managed
patients with vestibular schwannomas (landscape) 27-28
Table 6: American Academy of Otolaryngology – Head and Neck
Surgery Classification of Hearing (1995) 39
Table 7: Summary of hearing outcomes in published series of
conservatively managed vestibular schwannomas (landscape) 40-41
Table 8: Surgical series detailing hearing preservation results.
(landscape) 44
Table 9: Series describing radiosurgical hearing preservation
and tumour control (landscape) 46
Chapter 1
Table 10: Demographic details of patients managed
conservatively or primarily in Birmingham 62
Table 11: Presenting symptoms: conservatively and primarily
treated patients 64
Table 12: Tumour characteristics: conservatively and primarily

treated patients 64
Table 13: Number of conservatively managed patients with
different duration of follow-up and proportion of patients within
each group demonstrating growth 67
Table 14: Patients under conservative management lost to
follow-up (n.43): demographics and time of presentation 67
Table 15: Cause of loss to follow-up (where known) and duration
of follow-up achieved 68
Table 16: Duration of follow-up achieved prior to loss to follow-up 70
Chapter 2
Table 17: Comparison of demographic data: tumour growth vs.
tumour non-growth 76
Table 18: Tumour characteristics: tumour growth vs. non-tumour
growth 76
Table 19: Symptom data: Comparison of duration of symptoms
between growth and non-growth groups 77
Chapter 3
Table 20: Hearing levels at presentation: factors predictive of
Class A/B or Class C/D hearing 87
Table 21: Patients without audiological data at presentation
(Total n. 128) 87
Table 22. Demographic and tumour data 89
Table 23: Analysis of patients presenting with Class A or B
hearing and managed conservatively (follow-up >24 months) 90
Table 24: Analysis of potential risk factors for hearing
preservation/degradation 91

Chapter 4
Table 25: Demographic and tumour characteristics of patients
treated with primary surgery 107
Table 26: Demographic, tumour and outcomes in conservative arm 108
Table 27: Original data relating to preservation of hearing
(as published in Martin, 2008) 111
Chapter 5
Table 28: Patients under conservative management 118
Table 29: Clinical characteristics of differentially growing tumours 121
Chapter 6
Table 30: Demographic, tumour and surgical approach used in
groups studied 139
Table 31: Facial nerve outcomes in different groups studied 141
Table 32: Facial nerve rehabilitation techniques employed in
excisional group of patients 142
Table 33: Tumour recurrence in groups studied 143
Chapter 7
Table 34: Demographic details of fitted patients 152

Table 35: Results of Speech-in-Noise Testing (19 subjects,
paired t test of differences) 157
Table 36: Results of SSQ questionnaire 157
Table 37: Sub-group analysis in BAHA users (SSQ and GBI) 159

1
INTRODUCTION
Vestibular schwannomas represent 7-10% of intra-cranial neoplasms (Nager, 1993) and their
management forms a considerable portion of a neurotologist’s clinical workload. The aim of
this thesis is to explore issues related to the natural history of tumour growth, to clinical
management and to the rehabilitation of patients with a vestibular schwannoma in the light of
the world literature and studies performed in the neurotology department of the University
Hospital, Birmingham, United Kingdom.
This introduction will consist of the following elements:
i. An introduction to the pathology, epidemiology and management of vestibular schwannomas.
ii. A review of published studies addressing the above topics with an identification of
weaknesses in the current world literature in the field.
iii. A description of the data source employed in the studies that form the body of the work.
iv. A statement of the aims and objectives of the thesis.
iv. An outline of forthcoming chapters.

2
Nomenclature
Vestibular schwannomas are commonly described in the United Kingdom as ‘acoustic
neuromas’. The term ‘vestibular schwannoma’, reflecting the cell and nerve of origin of the
tumour is preferred in this thesis and is recommended by the National Institute of Health
Consensus document (Eldridge and Parry, 1992).
Pathology of vestibular schwannomas
Anatomical considerations
Vestibular schwannomas are benign tumours arising from the perineural Schwann cells of the
vestibular component of the VIIIth cranial nerve (the vestibulo-cochlear nerve). Figure 1
illustrates the anatomy of the VIIIth cranial nerve as it leaves the brainstem pons, crosses the
cistern of the cerebellopontine angle, and enters the internal auditory canal. This anatomical
course, in particular the relationship between the VIIIth and VIIth (facial nerve), and the close
proximity of the brainstem explain the presenting and later symptomatology described below.
As the nerve leaves the brainstem, it is initially covered by neuroglial cells (astrocytes and
oligodendrocytes): Schwann cells sheath the nerve at the neuroglial-Schwann cell junction as
the VIIIth nerve emerges from the pia mater some 7 to 13 mm distal to the brainstem (Tarlov,
1937, cited in Nager, 1993). For this reason, tumours most commonly originate in the internal
auditory canal, or in the cerebellopontine angle just medial to the medial limit of the internal
auditory canal (the ‘poros acusticus’). This tendency to begin growth within the internal
auditory canal and emerge into the cerebellopontine angle cistern gives rise to the typical
appearance of a moderately large vestibular schwannoma as seen in Figure 2.

3
Figure 1: Anatomy of brainstem and internal auditory canal (reproduced with permission from
Prof. R Jackler)

4
Figure 2: Moderately-large sized vestibular schwannoma compressing neighbouring structures
(reproduced with permission from Prof. R Jackler)

5
For unknown reasons, the inferior vestibular nerve seems to be more commonly the site of
tumour origin than the superior: in a series of 200 consecutive cases Khrais (2007) found that
91% of tumours for which a judgement could be made (76% of the total) arose from the inferior
nerve.
Tumour classification
Vestibular schwannomas are classified according to their size in their largest extrameatal
diameter, following guidelines produced at the Consensus Meeting on Reporting Systems on
Vestibular Schwannoma (Kanzaki, 2003). Prior to this consensus statement, a considerable
number of different systems for measurement existed (Tos, 2008), confusing comparison
between different studies. The salient feature of this reporting system is that tumours are
classified according to their dimensions in the cistern of the cerebello-pontine angle, without
measuring tumour within the internal auditory canal. Tumours confined to the internal auditory
canal are classified as ‘intrameatal’. Further details (such as whether the tumour is cystic or
involves the fundus of the internal auditory canal), may be added to the classification system.
The classification is summarised in Table 1.
Table 1. Tokyo Classification System
Extrameatal size mm
Grade 1 Small 1-10
Grade 2 Medium 11-20
Grade 3 Moderately large 21-30
Grade 4 Large 31-40
Grade 5 Giant >41

6
Histopathology
Vestibular schwannomas are characterised by two distinct tissue types: Antonini types “A” and
“B”. Type A tissue is densely packed with cylindrical bipolar cells, arranged in whorls that can
lend an ‘onion-skin’ appearance to the tissue. Type B tissue is more loosely packed with cells
connected by a finely honeycombed watery matrix prone to microcystic degeneration (Nager,
1993). The importance of cyst formation within tumours is significant to tumour natural history
and will be discussed below.
Traditionally, vestibular schwannomas were considered to be encapsulated with connective
tissue (Nager, 1993), but more recently, Kuo (1997) has called this into question, observing that
a connective tissue layer is present but is microscopically thin (3-5 µm), and that neoplastic
cells extend to the macroscopic limit of the tumour. This has clinical relevance when
considering sub- and near-total excision of tumour in order to avoid damage to the facial or
cochlear nerves (discussed below): a visible remnant of tissue left protecting the surface of the
nerve may demonstrate tumour growth at a later stage, whereas a remnant of tumour capsular
connective tissue should not.
Molecular genetics
Although this thesis addresses only the management and natural history of sporadic vestibular
schwannomas, it is important to recognise that 5% of vestibular schwannomas are associated
with the familial disorder neurofibromatosis type 2 (NF-2). NF-2 is a condition characterised by
multiple vestibular, spinal and other schwannomas, meningiomas, ependymomas and
ophthalmic lesions. The condition is caused by a defect in the tumour suppressor protein
7
‘merlin’ or ‘schwannomin’, coded by the location 22q12, and originally independently
identified by Rouleau (1993) and Trofatter (1993). Prior to this, it had been established that
sporadic vestibular schwannomas demonstrated somatic chromosomal deletions of chromosome
22 (Seizinger, 1986 with later addition by Irving 1997), and it would seem clear that merlin
plays an important role in the pathogenesis of both NF-2-derived vestibular schwannomas and
the sporadic variant.
Merlin appears to have a role in human embryogenesis, in the regulation of growth factors, and
in the interaction between the normal Schwann cell and the axon in peripheral nerves (reviewed
in Welling, 2009). In the embryo, transgenic studies suggest that merlin is important in the
regulation of neural crest cell migration and neural tube closure (Akhmametyeva, 2007): these
studies demonstrated particularly high levels of activity at anatomical sites associated with NF-
2 disease (the acoustic ganglion, the pigmented retina of the lens and others). Beyond
embryogenesis, merlin has been demonstrated to blunt tyrosine kinase receptor-driven
proliferation by interacting with intracellular signalling pathways (Chadee, 2006). In a non-
functioning form, it is supposed that growth will be inappropriately stimulated. Finally, it has
been demonstrated that a loss of merlin-driven suppression of the Rac protein adversely affects
the Schwann cell cytoskeletal morphology and function, disrupting Schwann cell-axonal
interaction and producing cells morphologically characteristic of schwannomas (Nakai, 2006).
Another field of interest has been the exploration of the significance of angiogenic factors in the
development of vestibular schwannomas. In a recent study, Koutsimpelas (2007) examined
levels of vascular endothelial growth factor (VEGF) and basic fibroblast growth factor (bFGF)

8
expression in a group (n. 17) of sporadic vestibular schwannomas. The group found an
association between levels of mRNA and protein expression of these growth factors and
tumours that could be described as ‘more aggressive’: these tumours were larger, more vascular,
and had grown to a greater volume during a shorter period of symptoms. Plotkin (2009) also
examined levels of VEGF expression in schwannoma tissue, and found high levels, although
these were also seen in normal schwann cells.
The aim of the molecular studies briefly described above is both to understand pathogenesis and
to identify potential medical treatment. Therapies are likely either to address the underlying
genetic abnormality found in NF-2 and sporadic vestibular schwannomas (i.e. the loss of the
wild-type NF-2 gene), or to seek to interact with the molecular pathways that merlin is thought
to influence. Pursuing the first of these avenues, Messerli (2006) used recombinant viral gene
therapy techniques to introduce wild type merlin to a murine NF2 model and achieved a
reduction in schwannoma growth without any apparent toxicity.
Targeted chemotherapeutic agents have also been used to effect in animal studies: monoclonal
antibodies to ErbB2 (Herceptin) can inhibit vestibular schwannoma growth by interacting with
the tyrosine kinase receptor mediated growth pathway (Hansen, 2006). A further avenue is
suggested by Nakai in the study described above: restoration of normal Schwann cell: axonal
interaction was achieved by administration of a Rac-specific inhibitor with a consequent
reduction in schwannoma volumes. In humans, Plotkin (2009) has treated patients with
advanced NF2 with beficizumab (an anti-VEGF antibody), and shown evidence of both tumour
volume reduction and hearing improvement. Although none of these therapeutic avenues are

9
currently routinely employed in the management of sporadic vestibular schwannomas,
beficizumab is increasingly offered to problematic cases of NF-2 and it may be that this
treatment will in time play a part in the management of sporadic tumours.
Risk factors for vestibular schwannomas: radiation exposure due to mobile telephones
Beyond NF-2 abnormalities, there are no well-established risk factors for the development of
vestibular schwannomas, although there is a developing literature that suggests an association
between the use of mobile telephones and vestibular schwannoma. Hardell (2009) recently
reported a series of studies examining an association between mobile telephone usage and
neoplasms of the brain. These studies attempt to determine laterality of tumour and (through
questionnaires), laterality of mobile or cordless telephone usage. Results are presented
according to the age of onset of mobile telephone usage. Interestingly, Hardell reports a
significant association between laterality of telephone usage and laterality of vestibular
schwannoma (replicated in astrocytoma) in patients with mobile telephone usage beginning
before the age of 20 years (OR 6.8, CI 1.4-34). A weaker association (OR 3.0, CI 1.4-6.2) was
also found in patients with a later onset of mobile telephone usage.
Hardell’s findings are only partly supported by other studies: Shoemaker (2005) found a weak
association between usage and ipsilateral vestibular schwannoma development in those patients
with an exposure greater than ten years (OR 1.8, CI 1.1-3.1), but no association in overall usage
(OR 0.9, CI 0.7-1.1). The confidence intervals in Hardell’s data belie the smaller number of
patients available for analysis in the high risk group of patients, but the rapid expansion in
mobile telephone usage in all age groups and particularly among the young suggests that data

10
may become more solid in time, and that mobile telephones may prove to be a significant risk
factor for vestibular schwannoma development.
Epidemiology
Incidence
The incidence of vestibular schwannomas has been a topic for debate for a number of years and
it is generally considered that a rising incidence represents an increasing detection of previously
occult tumours (although recent evidence detailed above describing a proposed association
between vestibular schwannomas and mobile telephones may cast doubt upon this assertion).
Rosenburg (2000) cites a review of 1,400 temporal bones by Shuknecht (1977) that found an
prevalence of 570:100,000 vestibular schwannomas at post-mortem (it is unclear whether these
were asymptomatic or not). This relatively high prevalence (suggesting an annual incidence of
approximately 7:100,000) is contrasted with a clinically significant annual incidence of
1:100,000 reported by the National Institute of Health Consensus Statement (NIH Consensus
Statement 1991), and Rosenburg suggests that a ‘true’ incidence is likely to lie somewhere
between these two figures. The concept that a significant number of vestibular schwannomas
are found at post-mortem without having caused morbidity or mortality is central to the concept
of conservative management of tumours that are diagnosed and will be discussed in greater
depth below.
In addition to the argument advanced above, strong evidence of a rising incidence of identified
vestibular schwannomas has been provided by the Danish group led by Professor Tos. This
group is the only medical team serving the Danish population with vestibular schwannoma and

11
can therefore reasonably claim that any change in referral numbers represents a change in
incidence (or at least detection) of vestibular schwannomas nationally. Tos (2004) analyses
referral rates over time and calculates incidence based upon a Danish population of 5.2 million
people. In consecutive periods (1976-83, 1983-90, 1990-95 and 1996-2001), the calculated
incidence rose from 0.8:100,000 in the first period to 0.9, 1.2 and 1.7:100,000 in subsequent
years. This increasing incidence is reflected in a trend towards the identification of smaller
tumours: in the same time periods detailed above, the median size of extrameatal tumours fell
consistently from 28mm in 1976-83 through 25mm, 18mm to 15mm in 1996-2000.
A similar change in incidence as detected by referral patterns is found in the United Kingdom,
although the lack of a single referral centre or robust pooled data precludes the analysis
described above. In the database detailed in this thesis, annual referrals have increased steadily
in number from a level of 28 tumours in 1998 to 124 in 2008 (detailed below). Although an
incidence cannot be helpfully calculated from this figure due to the confounding factor of an
undoubtedly expanding population base in the context of the relatively fluid referral pattern that
exists in the United Kingdom, it would seem reasonable to expect that there is some genuine
increase in incidence of detected tumours demonstrated by these figures.
Whether this perceived increase in incidence will continue to rise or has reached a plateau is
unclear. It may be that - as argued by Moffat (2004) - incidence will stabilise as facilities for
investigation (in particular magnetic resonance imaging (MRI)) are available freely to all
clinicians. A contrary view might be that increasingly available healthcare and a more
medically aware population lead to presentation of a larger number of patients with milder

12
symptoms than hitherto. It may be that if this occurs, the clinical incidence of vestibular
schwannomas will reflect the post mortem prevalence described by Shuknecht.
Sex distribution
Traditional opinion has maintained that vestibular schwannomas are more common in females
than males with a ratio of 2:1 (Zülch, 1986, cited by Nager, 1993). In our experience, there is
very little sex difference at presentation: in our database of 730 patients with vestibular
schwannoma, 371 (51%) of patients are female, 359 (49%) are male. Other series suggest a very
slight tendency towards a female bias, but one less significant than that suggested traditionally:
in a series of 1000 surgically managed tumours, Samii (1997) describes a sex distribution of
54% female and 46% male patients; Bakkouri (2009) finds 53:47% F:M ratio in conservatively
managed patients; and the Danish group described above reports a 52% female proportion in a
total database of 2283 patients (Stangerup, 2009, personal communication).
Age at presentation
In our series, the mean age of presentation is 56 years, with a range 18-88 years. Although
presentation in the third decade is rare in our series (3%), presentation is well-distributed over
the 4th, 5th, 6th, 7th and 8th decades, with the majority of patients presenting in the 6th and 7th
decades (27% and 26% respectively). Vestibular schwannomas in children are very rare, and
will usually form part of an NF-2 syndrome.
13
Clinical features of disease: symptomatology
Traditionally, the symptoms produced by vestibular schwannomas are considered to be either
otological or neurosurgical. Patients will often present with a combination of symptoms, and
otological symptoms will almost always precede neurosurgical compromise, with the latter
rarely found in smaller tumours. The reporting of symptoms in the literature is variable, and it is
likely that, particularly in retrospective analyses, the quality of data is questionable. It is
unusual that studies will report symptomatology as a primary outcome, and little detail is
offered describing definitions or severity. A further confounding factor is whether the symptom
reported is seen as the ‘dominant’ symptom within a constellation, or as the only symptom (a
rare occurrence in our experience).
Otological symptoms
These are characteristically unilateral, and form the basis for radiological screening guidelines
(see below). Samii (1997) reports unilateral hearing loss as occurring in 95% of patients and
Glasscock (1997) in 85%, and these figures concord with our experience of 90% of patients
presenting with unilateral hearing loss as at least one of their symptoms. Generally, hearing loss
is progressive and thought to occur due to a combination of compression of the cochlear nerve
by the growing tumour and a degree of ischaemia caused by compromise of the cochlear blood
supply (Prasher, 1995). On rare occasions (less than 1% in our database), hearing loss may be
sudden in onset. In common with other sensorineural hearing losses and in contrast to
conductive hearing loss, the functional hearing loss as measured by speech discrimination
thresholds is often more severe than that suggested by pure tone audiometry (Van Dijk, 2000).

14
Tinnitus is the second most commonly reported symptom and will usually occur in combination
with hearing loss. In our database 58% of patients reported tinnitus as a symptom, while in a
small but significant number (7%), tinnitus was the sole reported complaint. Glasscock (1997)
reports a slightly lower figure (42%) than that found in our database, while Bakkouri (2009)
finds 4% with tinnitus alone, and a relatively small group of patients (13%) (in contradiction to
our experience) with multiple symptoms.
Although the tumour derives from the vestibular nerve, patients rarely complain of balance
disturbances as their primary symptom. It is generally accepted that this is because of the slow
rate of tumour growth allowing the vestibular system to compensate to a gradual loss of
function (Driscoll, 2000). Nevertheless, a small proportion of patients present with vertigo
alone (1% in our database), and a larger group admit to vertigo or imbalance in combination
with other symptoms (30%). Driscoll observes that the symptoms in these patients are probably
due to incomplete vestibular compensation, and are rarely significant enough to prompt the
patient to seek medical attention. A distinction should be drawn between those patients that
present with a small tumour in the internal auditory canal which may cause mild symptoms of
imbalance or occasional brief attack of vertigo (as described above), and those that present with
ataxia due to a large tumour pressing upon the flocculus of the cerebellum: in the latter case,
imbalance will often form part of a constellation of neurosurgical symptoms.
Cranial nerve symptoms
Other cranial nerves, in particular the VIIth (facial) and Vth (trigeminal) are occasionally
affected, with the latter more commonly impaired. Despite its location, and in contrast to the

15
cochlear nerve, the facial nerve appears to particularly resistant to damage: the House Ear Clinic
reported a rate of 2% facial nerve impairment (Angeli, 1997), and in our series, we have a lower
rate (1.5%). Trigeminal symptoms are more common, and usually a sign of a larger tumour with
a significant cerebellopontine angle component involving the under-surface of the trigeminal
nerve as it emerges from the pons. Generally, the sensory roots of the nerve are affected with
motor branches intact. A rate of 16.5% in a surgical series (Mathies, 1997) compares with a rate
of 1% in a conservatively managed series (Bakkouri, 2009), and this is probably reflects the
larger tumours found among patients undergoing surgery. In our database, 5% of all patients
presented with some form of sensory trigeminal nerve impairment.
Neurosurgical complications
In a number of cases, presentation of the vestibular schwannoma is emergent, usually due to the
development of hydrocephalus. Prior to the widespread availability of cross-sectional imaging,
a significant proportion of patients presented with neurosurgical symptoms: Cushing (1917,
cited by Driscoll, 2000) reported headache as a symptom in all 4 patients. By the latter half of
the twentieth century, when cross-sectional imaging was available but limited and investigation
was predominantly audiological, this had reduced to 29% (Mathew, 1978) and 38% (Harner,
1981). Currently, in our series, we find a small but significant number of patients presenting
with headache or hydrocephalus (23 patients, 3% of the total database).
Interestingly, such low rates of clinical hydrocephalus may underestimate the sub-clinical
prevalence. It is traditionally accepted that the hydrocephalus seen in vestibular schwannomas is
of an obstructive type caused by compression of the 4th ventricle by large tumours (Driscoll,

16
2000). In our series, the majority of patients with clinically recognised hydrocephalus have
presented with tumours greater than 3cm in size (90%), with the aetiology of the hydrocephalus
presumed to be obstructive. A recent publication in the radiological literature, however,
describes much higher rates of hydrocephalus in a population with vestibular schwannoma
(18% of 157 patients) (Rogg, 2005). In this paper, there is a high rate of communicating
hydrocephalus (61%), without a strong correlation with tumour volume (as is seen in non-
communicating hydrocephalus). The authors postulate that this sub-clinical hydrocephalus may
be related to tumour protein sloughing, but further research is necessary to clarify this.
Asymptomatic patients
A small proportion of patients present without any symptoms, usually following radiological
investigations for other pathologies. In our series, 7 patients (1%) have presented in this
manner: interestingly, none of these patients have required any management beyond serial
monitoring.
Management
The aim is not to comprehensively address issues of management – this will form much of the
substance of the thesis – but rather to provide an overview of the investigation and treatment of
patients with vestibular schwannoma. Much of the focus of the literature searches that form the
second part of this introductory chapter will address issues of management, and these will not
be comprehensively addressed in this section.
17
Investigations
History
Historically, and before the 1980s, the investigation of suspected vestibular schwannomas was
focussed upon audio-vestibular investigations supported by plain radiology enhanced with
contrast dyes injected into the cerebro-spinal fluid. As detailed above, the most common
presenting symptom is a unilateral hearing loss or a unilateral tinnitus. A unilateral hearing loss
can be investigated with evoked audiometry (auditory brainstem response) and otoacoustic
emissions (a measure of cochlear outer hair cell function) to determine whether a hearing loss is
cochlear (the most common form of hearing loss) or retrocochlear (located proximal to the
cochlear, and found in vestibular schwannoma). Typically, a vestibular schwannoma
demonstrates inter-wave latency (between waves I and V) and inter-aural latency in the auditory
brainstem response with otoacoustic emissions better than those expected by the recorded
hearing loss.
A recent meta-analysis of studies assessing the sensitivity of auditory brainstem response
measurement (Fortnum, 2009) concludes that, while sensitive for large tumours, the technique
is less successful for smaller tumours. Pooled results produce sensitivity values of 79%, 95%
and 98% for tumours sized at less than 1cm, 1cm-2cm and >2cm respectively. This failure to
identify a significant proportion of smaller tumours is indicative of the fact that a positive
auditory brainstem response result is dependent upon a mass effect upon the cochlear nerve, and
has led to the reservation of the technique as a second-line investigation.

18
Current investigative strategies
An essential dilemma that has complicated the investigation of patients with a unilateral hearing
loss or unilateral tinnitus is the fact that, while the symptoms that are caused by a vestibular
schwannoma (unilateral hearing loss, tinnitus or vertigo) are common, the tumour itself is rare
(despite the rising apparent incidence discussed above). Harcourt (1999) has demonstrated that
20% of patients attending a general ear, nose and throat clinic have symptoms that could be
caused by a lesion at the cerebellopontine angle. This reflects a calculated national prevalence
of hearing asymmetry in the United Kingdom of 2.9% (Davis, 1995, cited by Fortnum, 2009).
To address this issue, clinical effectiveness guidelines have been developed by the British
Association of Otolaryngologists, Head and Neck Surgeons (now ENT-UK) with the aim
(among others) of directing the investigation of patients with symptoms suggestive of a
vestibular schwannoma (BAO-HNS, 2002). These guidelines advise investigation of any patient
with either hearing asymmetry or unilateral tinnitus. The guidelines also recommend that
investigation of patients with facial numbness or imbalance unexplained by another diagnosis
should be considered for investigation.
No explicit thresholds for hearing asymmetry are advised in these guidelines, and a variety of
protocols exist that offer subtly differing criteria for radiological investigation (see Table 2).
These protocols vary in the ‘yield’ of vestibular schwannomas detected, depending upon the
audiological criteria imposed. In our series, a significant number of patients have been
identified who, for example, fell outwith the Charing Cross guidelines: this issue is discussed
below (see Chapter 3).

19
Table 2. Protocols for the investigation of hearing asymmetry
Protocol and
reference
Clinical criteria Threshold asymmetry Proportion of positive
results
Sunderland (Dawes,
1998)
Unilateral tinnitus,
Meniere’s disease
symptoms
≥20 dB in two
neighbouring
frequencies
0.3%
Charing Cross
(Snelling, 2007)
None ≥15 dB in any two
neighbouring
frequencies or ≥20 dB
if hearing impaired
>30 dB in better
hearing ear
4.3%
Oxford (Sheppard,
1996)
Unilateral tinnitus,
>70 years of age
≥15 dB mean of
frequencies between
0.5 KHz and 4 KHz
0.4%
Further investigation is recommended with MRI in the BAO-HNS guidelines referenced above,
and this is supported by Fortnum’s recent economic analysis of investigative strategies
(Fortnum, 2009). A number of different MRI techniques are available, the most common being
‘T1’ (longitudinal relaxation time constant) with contrast enhancement (gadolinium), and ‘T2’
(transverse relaxation time constant) without contrast. Within T2 are a number of subtly
differing techniques that can all be used to image vestibular schwannomas (‘Constructive
interface steady state’ (CISS), ‘Fast imaging employing steady state acquisition’ (FIESTA)).
The gold standard test is generally considered to be T1 weighting enhanced with gadolinium but

20
increasingly, T2 techniques are found to have comparable sensitivity: Fortnum’s meta-analysis
of studies produced a pooled sensitivity of 98% (Fortnum, 2009). There are considerable cost
benefits in employing T2 in preference to gadolinium-enhanced T1 imaging, both in terms of
reduced cost of materials, reduced time, and in particular because patients undergoing imaging
without contrast enhancement do not require the supervision of a medically trained radiologist.
Treatment
History
For the majority of the 20th century, the mainstay of treatment of vestibular schwannomas was
surgical, usually involving the excision of large tumours presenting with neurosurgical
symptoms. Cushing (1917, cited by Driscoll, 2000), credits Thomas Annandale, a surgeon in
Edinburgh, with the first successful removal of a vestibular schwannoma from a pregnant
patient, who later successfully gave birth to a healthy child. Subsequent attempts in the early
20th century were characterised by high mortality rates of over 50%, although Cushing himself
was able to achieve a rate of 21% (Cushing, 1917, cited by Driscoll, 2000). Driscoll observes
that Cushing’s relative success could be attributed to his surgical skill and (Cushing’s own
words), a ‘celerity of execution’. As the century progressed, a second neurosurgical pioneer,
Dandy, was able to reduce the mortality rate further (to 11%) with improved technique as more
sophisticated anaesthetic and haemostatic techniques allowed for a longer operative time
(Dandy, 1941, cited by Driscoll, 2000).
Incremental developments in technique were substantially enhanced by the introduction of the
operating microscope in 1961 by House and Doyle (Driscoll, 2000). The operating microscope,

21
combined with high-speed drills, microsurgical instruments and the concept of a team surgical
approach between neurotologist and neurosurgeon, has led to a situation currently where
mortality is rare, and the surgical goals have become focussed upon the preservation of neural
function (facial and auditory). The complications and results of surgical treatment are discussed
below in the literature search.
Table 3: Outline of management strategies for tumours of differing size and hearing status at
Queen Elizabeth Medical Centre, Birmingham
Tumour size and hearing
function
Management Caveats
Intracanicular, non-hearing Conservative, radiosurgery if
tumour growing
Some may advocate primary
treatment, either surgery or
radiotherapy
Intracanicular, hearing Conservative, radiosurgery if
tumour growing
Many would advocate
hearing-preserving surgery
0-2cm in cerebellopontine
angle (hearing or non-hearing)
Conservative, radiosurgery if
tumour growing
Many would argue an upper
limit of 2cm for conservative
management too large, similar
debate as above re. hearing
preservation surgery
>2cm, <3cm in
cerebellopontine angle
Either radiotherapy or surgery,
depending upon patient choice
Many would offer only
surgery
>3cm in cerebellopontine
angle
Surgery (translabyrinthine or
retrosigmoid)
Non controversial
Current practice
22
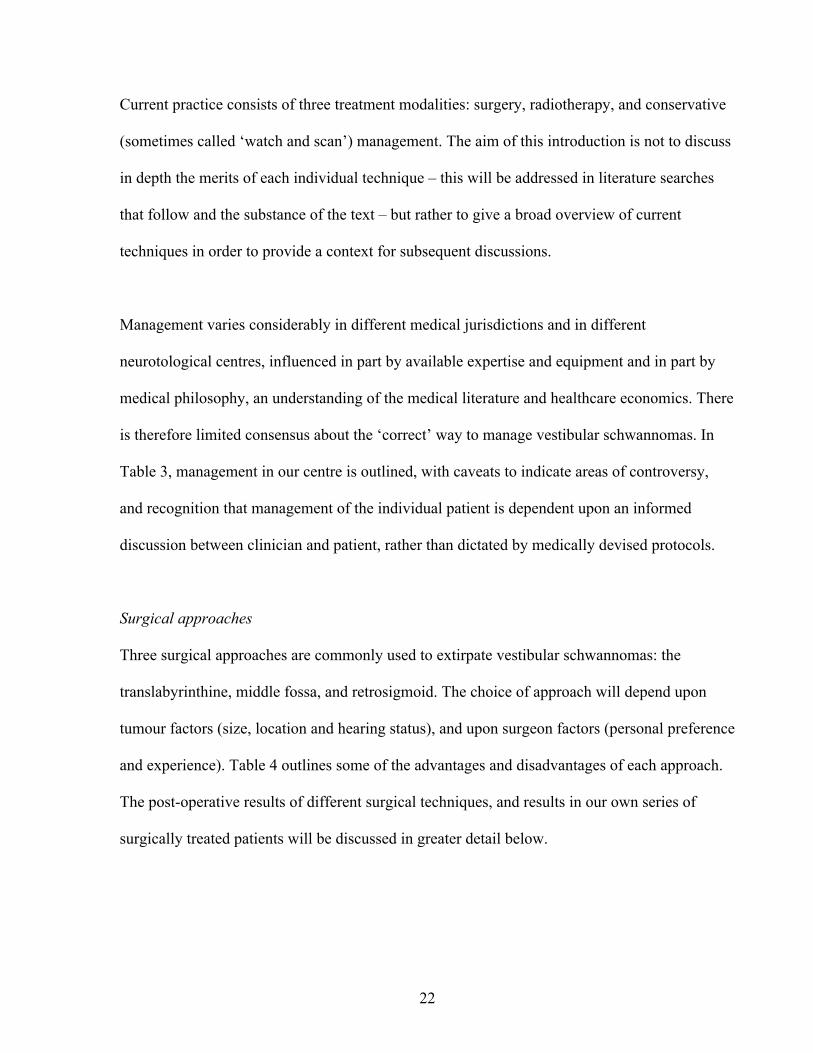
Current practice consists of three treatment modalities: surgery, radiotherapy, and conservative
(sometimes called ‘watch and scan’) management. The aim of this introduction is not to discuss
in depth the merits of each individual technique – this will be addressed in literature searches
that follow and the substance of the text – but rather to give a broad overview of current
techniques in order to provide a context for subsequent discussions.
Management varies considerably in different medical jurisdictions and in different
neurotological centres, influenced in part by available expertise and equipment and in part by
medical philosophy, an understanding of the medical literature and healthcare economics. There
is therefore limited consensus about the ‘correct’ way to manage vestibular schwannomas. In
Table 3, management in our centre is outlined, with caveats to indicate areas of controversy,
and recognition that management of the individual patient is dependent upon an informed
discussion between clinician and patient, rather than dictated by medically devised protocols.
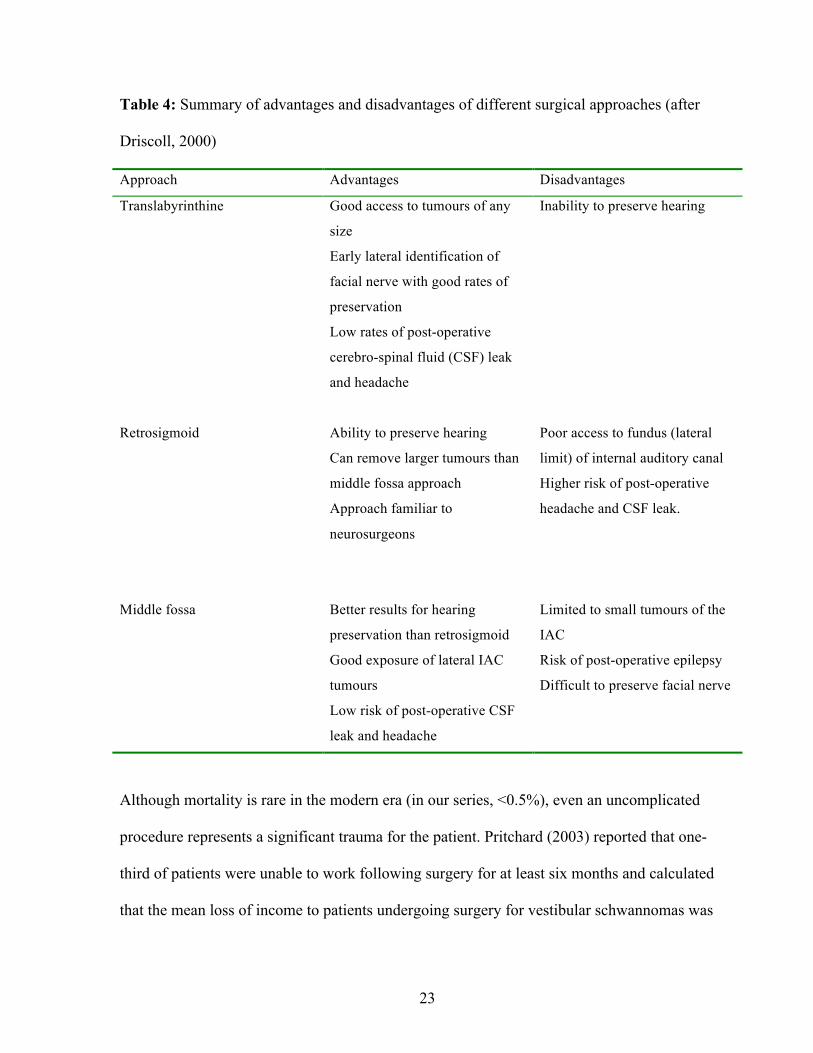
Surgical approaches
Three surgical approaches are commonly used to extirpate vestibular schwannomas: the
translabyrinthine, middle fossa, and retrosigmoid. The choice of approach will depend upon
tumour factors (size, location and hearing status), and upon surgeon factors (personal preference
and experience). Table 4 outlines some of the advantages and disadvantages of each approach.
The post-operative results of different surgical techniques, and results in our own series of
surgically treated patients will be discussed in greater detail below.
23
Table 4: Summary of advantages and disadvantages of different surgical approaches (after
Driscoll, 2000)
Approach Advantages Disadvantages
Translabyrinthine Good access to tumours of any
size
Early lateral identification of
facial nerve with good rates of
preservation
Low rates of post-operative
cerebro-spinal fluid (CSF) leak
and headache
Inability to preserve hearing
Retrosigmoid
Ability to preserve hearing
Can remove larger tumours than
middle fossa approach
Approach familiar to
neurosurgeons
Poor access to fundus (lateral
limit) of internal auditory canal
Higher risk of post-operative
headache and CSF leak.
Middle fossa
Better results for hearing
preservation than retrosigmoid
Good exposure of lateral IAC
tumours
Low risk of post-operative CSF
leak and headache
Limited to small tumours of the
IAC
Risk of post-operative epilepsy
Difficult to preserve facial nerve
Although mortality is rare in the modern era (in our series, <0.5%), even an uncomplicated
procedure represents a significant trauma for the patient. Pritchard (2003) reported that one-
third of patients were unable to work following surgery for at least six months and calculated
that the mean loss of income to patients undergoing surgery for vestibular schwannomas was

24
£11,220. 40% of patients were depressed post-operatively, and 75% expressed anxiety that they
‘would ever be the same again’. The majority of patients who are treated surgically will lose
residual hearing, and among those for whom hearing preservation is attempted, this is
successful in only 50% (see below). A degree of facial nerve impairment is found in most cases,
even if only temporarily, with results reflecting the size of the tumour (Mamikoglu, 2002).
Other complications include cerebrospinal fluid leak, imbalance, headache and facial numbness
(Driscoll, 2000).
Radiosurgery
Radiosurgical techniques were first introduced in the 1950s (Leksell, 1951, cited by Driscoll,
2000), and over the past two decades have become increasingly popular in the management of
vestibular schwannomas. The principle of radiosurgery is to deliver a single fraction of high-
dose radiation to the tumour with the aim of arresting tumour growth. The patient’s head is
fixed in a stereotactic frame that allows the accurate planning of the delivery of ionising
radiation in multiple doses to conform to the contours of the tumour (Rowe, 2008). In general,
the tumour undergoes a period of oedematous swelling after the delivery of the radiosurgery,
and then subsequently either reduces in volume or remains static. Two forms of radiosurgical
treatment are commonly used: gamma-knife - which employs gamma radiation - and linear
accelerator (LINAC) - which uses x-rays. Details of tumour control rates, complications and
controversies will be discussed below.
25
Conservative management
Over the course of the past 3 decades, conservative management has become an increasingly
popular management option for treating vestibular schwannomas measuring less than 2cm in
the cerebellopontine angle. The practice depends upon serial monitoring of the tumour, with
definitive intervention - or in some cases, continued observation - in those cases that
demonstrate growth. Initially proposed as a treatment modality to manage those patients who
are unsuitable for definitive treatment due to old age or medical co-morbidities (Wazen, 1985,
Nedzelski, 1986), a period of observation to prove active tumour growth has become standard
practice in almost all small and many medium-sized tumours. A detailed discussion of the
literature pertaining to the conservative management of vestibular schwannomas follows.

26
Literature search
The aim of this literature search is to carry out a systematic review of the literature pertinent to
topics raised in this thesis. Situating this literature search in the introduction to the thesis will
allow the reader to refer back to this section while reading forthcoming chapters, and avoid
repetition of material.
There are two main topics addressed in this literature search:
-the natural history of tumour growth (a review of published series of conservatively managed
vestibular schwannomas).
-the status of hearing in vestibular schwannomas treated by the three modalities most
commonly used (observation, radiosurgery and microsurgery).
Search strategy
A Pubmed search was carried out using the MeSH terms ‘vestibular schwannoma, acoustic
neuroma and acoustic neurinoma’ for titles containing the words: ‘watch’, ‘conservative’,
‘wait’, ‘growth’, ‘surveillance’, ‘hearing preservation’, ‘radiosurgery’ and ‘microsurgery’. All
articles identified were case series, representing level 3 evidence, and none were excluded for
reasons of methodological quality. Series that contained less than 50 patients were excluded in
most cases, as were those written in a language other than English. Due to the heterogeneity of
the studies and the lack of randomised, controlled trials, formal meta-analyses were not
attempted.

Table 5: Summary of published series of conservatively managed patients with vestibular schwannomas Reference Centre Period of data
collection N Mean
age Follow-up (months, (range))
Percentage growth
Growth rate Factors predictive of growth
Loss to follow-up Tumour measurement technique
Malhotra, 2009
Philadelphia, USA
1997-2007 202 60 2.5 (1-192) 9.4% failed No details Larger tumours, disequilibrium
10% (time of presentation to most recent treatment)
Largest linear dimension of tumour in any direction
El-Bakkouri, 2009
Paris, France 1990-2005 386 58 Range 12-108 (no mean given
24% failed, 8% had growth >3mm per year
1.15 mean, 10% growth rate >3mm per year
Short duration of symptoms
16% lost to follow-up at 1 year
Largest diameter outside the IAC
Hajihoff, 2008
Toronto, Canada
1987-98 72 61 121 35% failed 1 mm overall Larger tumours 3% Square root of product of maximum AP and ML dimensions (axial scan)
Ferri, 2008 Bologna, Italy
1981-2006 123 61 56 35.5% growth 1.2mm in growing tumours, 0.3mm overall
Short duration of symptoms, CPA tumours and tinnitus
2% (but no definition)
Tumours measured along 3 axes, and recorded as greatest dimension: IAC included
Al Sanosi, 2006
Sydney, Australia
1989-2005 205 61 41 34% growth No rate given None 4% excluded because follow-up less than 12 months
No details of measurement technique given
Battaglia, 2006
San Diego, USA
1986-2004 111 71 38 51% growth 0.7mm overall Larger tumours more likely to grow than IAC tumours
No details but patients excluded if less than 1 year of follow-up recorded
Square root of product of maximum AP and ML dimensions (axial scan)
Grayeli, 2005 Clichy, France
1991-2002 111 59 33 47% growth 1.1mm overall, but gives full break-down
None 17% Greatest diameter on axial scan including IAC component
Flint, 2005 Auckland, New Zealand
1992-2003 100 61 26 36% growth (80% in 1st year)
2.7mm, with breakdown of cases
None No details Largest measured diameter in CPA, IAC excluded
Hoistad, 2001
Chicago, Illinois, USA
1982-99 102 64 29 44% growth 2.2mm (growing tumours only)
None 4 patients with growing tumours lost to follow-up.
Largest diameter on a single image (usually from the porous acousticus to the brainstem)
Shin, 2000 Toulouse, France
1989-98 87 63 31 53% growth 1.5mm all patients None 20%. Good follow-up defined as at least 2 MRI scans
Mean of sum of largest AP and ML dimensions (axial scan), including IAC

Table 5 (cont’d): Summary of published series of conservatively managed patients with vestibular schwannomas. Reference Centre Period of data
collection N Mean
age Follow-up (months, (range))
Percentage growth
Growth rate Factors predictive of growth
Loss to follow-up
Tumour measurement technique
Tschudi, 2000
Zurich, Switzerland
1989-94 74 53 35 31% growth 2.7mm mean in growing tumours, max growth 7.7mm
None 7% with inadequate follow-up excluded
Greatest axial dimension along long axis of the IAC
Deen, 1996 Arizona, USA
1983-92 68 67 41 29% growth, 15% requiring treatment
3.0mm in tumours requiring treatment, 0.72mm in overall group
No details 32% did not attend after first presentation
Not given
Strasnick, 1994
Norfolk, Virginia, USA
1979-1992 51 68 30 24% failed surveillance
1mm overall, 3.5mm in tumours failing surveillance
No details Mean of greatest AP and ML diameter (IAC inclusion not specified)
Stangerup, 2006
Copenhagen, Denmark
1975-2005 729 59 43 24% growth Growing tumours: high (10mm intr- and 5mm extra- if grew in first year, less if discovered later
More common in larger tumours (ie extra-meatal)
Not recorded Largest extrameatal dimension
Fucci, 1999 Fort Myers, Florida, USA
1988-1996 119 65 30 30% growth, 18.5% underwent treatment
1.2 mm overall, growing tumours, 3.5mm
Larger tumours (>20mm more likely to grow
No details, but excluded some patients with inadequate data prior to analysis
Longest dimensions on a film (including IAC)
Mohyuddin, 2003
Manchester, UK
No details 50 NA 17 41% definite growth, a further 38% probable growth
3mm in growing tumours
None Some lost to follow-up, but no details given
Volumetric measurements, also maximal tumour diameter (no further details)

29
The natural history of tumour growth
The studies identified by the literature search are summarised in Table 5 above. A number of
issues related to the quality of data are instructive and these are discussed here, followed by a
presentation of the salient findings from the literature search.
Critique of existing literature
Population selection bias
Perhaps the ideal study to explore the natural history of vestibular schwannoma growth would
be a cohort study. In such a study, all patients with tumours of a certain size would be entered
into the study and then monitored using a standardised imaging protocol. In most of the studies
identified in the literature search, however, there is a bias towards monitoring patients who are
either elderly or medically unfit, and hence not thought to be ‘good’ surgical candidates.
Interestingly, this bias is perhaps not as marked as might be expected: although the majority of
authors cite old age as an important indication for conservative management, the mean age of
patients in the series presented in Table 5 (61 years) is only 5 years older than the mean age of
all patients presenting to our service (56 years). The cause for this discrepancy is not clear: it
may be that authors rationalise their use of conservative management as a treatment for the
elderly, while the reality is that it has become a standard treatment for the majority of small to
medium-sized tumours. This is clearly demonstrated in Grayeli’s paper (2005):

30
“Conservative management was chosen in patients aged >60 years or in those for whom
surgery was contraindicated or refused. This group comprised 49 males and 62 females… with
a mean age of 59 years (range 19-87)…”
As will be described below, one strength of the database presented in this thesis is a lack of
population bias in the selection of patients for conservative management, although as seen by
the above quotation, the apparent population bias in the literature as a whole may not be as
genuine as that suggested at first sight.
Follow-up
Effective follow-up is an essential element of conservative management, and an important part
of the consultation with a patient considering conservative management is emphasising the
importance of compliance with serial imaging and clinical review. It could be argued that the
mark of an effective conservative management regime is the integrity of its follow-up: patients
should be monitored regularly until the clinician is confident the tumour is not growing and
then less frequently, but few would argue that any but the most elderly patients with stable
tumours should be discharged. Unfortunately, there are considerable defects in the existing
literature in terms of accurate and clear description of the definition of follow-up, and in the
reporting of compliance.
Loss to follow-up is not consistently defined. In a number of series (Fucci, 1999, Tschudi, 2000,
Battaglia, 2006), patients with inadequate serial follow-up are excluded prior to

31
analysis, thus preventing a calculation of a loss to follow-up rate. In those series that do admit
to a loss to follow-up, the definition of ‘loss’ would seem to be very generous: an inclusion
criterion often mentioned is that of having undergone at least two MRI scans; those that do not
fulfil this criteria are then considered ‘lost’ (Shin, 2000, Al Sanosi, 2006, El Bakkouri, 2009).
While it is true that these patients with at least two MRI scans have been seen more than once, it
is difficult to argue that a patient seen in (for example) 1998 for the first time and then reviewed
in 1999, is not ‘lost’ if the series is reported in 2005. Such a patient could quite easily have a
very slow growing tumour that was not detected in 1999, but was falsely reassured and is now
at some risk.
The effect of the loose definitions applied to follow-up in the series reporting conservative
management is to give reasonably positive figures for loss to follow-up (see Table 5), but the
true nature of follow-up in these series is belied by the duration reported. Although rarely
explicitly defined, it is implied that ‘follow-up’ is calculated by measuring the time between the
first MRI scan (i.e. at presentation), and the most recent scan reviewed. The duration of follow-
up often sits oddly with the study recruitment period: thus Ferri (2008) reports a series of
patients recruited over 25 years with a mean follow-up of only 56 months. Even assuming that a
disproportionately large proportion of the patients studied were recruited in latter years, this
short duration of follow-up suggests a considerable number of patients are not being followed-
up routinely and that the loss to follow-up rate of 2% has been generously calculated.

32
‘Front-loading’ of series
While the detailing of a lack of follow-up has safety issues as outlined above, there are also
important confounding factors that may confuse an appreciation of the natural history of
vestibular schwannomas. It is well-recognised that the growth of a significant number of
tumours is very slow: the mean calculated rate for all tumours is described in most series as in
the region of 1mm annually (see Table 5). For this reason, a number of tumours only reveal
themselves as ‘growing’ tumours after a number of serial MRI scans. If series report large
numbers of patients with a short period of follow-up, there is a risk that a considerable
proportion of tumours that are slow-growing are registered as ‘not-growing’.
A close examination of El Bakkouri’s data (2009) reveals the extent to which patient numbers
are often concentrated in the early years of follow-up:
- initial number of patients (and publication ‘headline’) = 386
- number of patients following exclusion of those without at least 2 scans = 325
- number of patients with 3 scans = 160
- number of patients with 4 scans = 56
- number of patients with 5 scans = 21
- number of patients with 6 scans = 8
The stated surveillance regimen for this study is as follows:
- initial scan at presentation
- a first follow-up scan at 1 year
- a further scan at 1 year if the tumour demonstrated slow growth, scan at two

33
years if growth not seen
- further scans every two years if no growth seen
Given this surveillance regime, and the fact that the study recruited between 1990 and 2005, it
is surprising that only 8 patients underwent 6 MRI scans.
Assuming a change in practice shifting towards conservative management over time, it might
expected that less patients might be allocated to surveillance in the period 1990-1995 than in
2000-2005, but if it is assumed that only 50 patients were recruited during this period (13% of
the total number of patients included in the study), it would be reasonable to expect all of these
individuals (unless diverted to definitive treatment) to have undergone at least 6 scans. The fact
that only 8 patients are reported in this group suggests a significant loss of patients to follow-up,
and hence a potentially confoundingly low estimation of the risk of tumour growth.
Definition of tumour growth
There is considerable heterogeneity seen in the definition of tumour growth in the series
presented in Table 5. In some cases, the primary outcome measure is ‘failure of conservative
therapy’, in others ‘tumour growth’. It is important to recognise that these two terms are not
synonymous: patients may elect to have definitive treatment in the absence of tumour growth
due to other symptoms, or in many cases, the clinician and patient will tolerate very slow
growth and elect to continue monitoring the tumour.

34
Recording of growth rates
The definition of tumour growth is variable in the series examined. In many series, a helpful
distinction is drawn between ‘growing tumours’ and ‘static tumours’, while in others, a mean
growth rate for all tumours is produced (see Table 5). This has been discussed in the literature
previously (Martin, 2005), and has led to the under-estimation of growth in meta-analyses
(Smouha, 2005). A concentration upon mean growth rates is perhaps less helpful clinically than
a recognition of the range of potential rates of growth - in our series, we have seen rates of
growth of almost 20mm annually in a very small number of conservatively managed patients –
a recognition that a number of tumours show an aggressive biology is more beneficial than a
calculation of mean growth rates when a considerable proportion of the calculation involves
tumours that do not grow at all.
Tumour measurement technique
A number of different techniques are used to determine tumour size. The most common (but
only appearing in two series) is that recommended by the 1995 guidelines produced by the
American Academy of Otolaryngology-Head and Neck Surgery (AAO-HNS)(AAO-HNS,
1995). In these guidelines, the tumour dimension is calculated as the reciprocal of the product
of the maximal anteroposterior and mediolateral dimensions on axial scan (√(AP)(ML)). There
are many other techniques employed with subtle variation, as demonstrated in Table 5.
Although consistency may aid a confident estimation of tumour growth rates, probably more
important is the quality of measurements carried out, and unfortunately none of the described
studies employ a quality-controlled measurement system such as independent calculations made
by two individual assessors.

35
Long time period covered by studies
It is noticeable that a number of the studies report periods of data collection extending over a
number of years. Stangerup (2006) reports over 30 years, Ferri (2008) over 28 years; the
majority of groups report series with a recruitment period of 10-15 years (see Table 5). Such
long periods of time carry risks for confounding factors. It is noticeable, for example, that a
number of studies (especially those recruiting before the mid-1980s) employ both computed
tomography (CT) studies and MRI in assessment of tumour size and location. There is also a
probability of considerable clinician heterogeneity during such an extended time period, leading
to likely inconsistency in tumour measurement techniques or recording of symptoms. It is one
of the strengths of the series reported in this thesis that a large population has been recruited
over a relatively shot period of time, allowing predominantly homogenous data collection.
Conclusions from reviewed publications
With the above reservations noted, it is possible to draw a number of tentative conclusions from
the published data assessing tumour growth rates and risk factors for tumour growth.
Tumour growth
As is seen in Table 5, there is a range of rates offered between 10 and 55% for either ‘tumour
growth’ or ‘failure’ of conservative management, with a coalescence around a figure of
approximately 30-35%. As noted above, however, questions of data quality, in particular
questions of follow-up, call a number of series’ results into question. One series that offers
sound follow-up data is that reported by Hajihoff (2008): this series (although relatively small),
is collected prospectively and offers a mean follow-up (121 months) that is both consistent with

36
the period of data collection and significantly has a range that begins at 80 months, thus
avoiding the confounding effect of ‘front-loading’ described above. A further strength of this
series is a relatively low rate of loss-to-follow-up of 6%, although a weakness is that this is not
explicitly defined.
In Hajihoff’s series, the overall rate for ‘failure’ of conservative management is 40% (this
includes those lost to follow-up, the rate would be 35% without this group). Interestingly, the
reported rate of tumour growth is higher: 40% are reported as demonstrating ‘significant
growth’ of >1 mm per year, suggesting that a small number of patients with growing tumours
are being managed conservatively. 38% are described as demonstrating growth of <1mm per
year, and this is described as ‘non-significant’. A further 22% have negative growth rates of
<0mm per year. This growth rate is higher than that reported by the largest series reported to
date in the literature (Stangerup, 2006) (24%), but this may be explained by the relatively low
rate of follow-up in the latter study (43 months in a study collecting tumours over 30 years).
Factors predictive of growth or failure of conservative management
This issue is one that is important for advising patients considering conservative management
and valuable for clinicians debating conservative or definitive treatment in ‘borderline’ cases. In
those series that address the issue, two consistent factors seem to suggest growth: tumour size
and a short duration of symptoms are predictive of growth in a number of papers (see Table 5).

37
Tumour growth rates
As discussed above, a consistent definition of tumour growth is difficult to obtain. Series that
break tumours into groups of ‘growing’ tumours to calculate a mean growth rate suggest a mean
of 3mm annually in most cases. Those that consider all tumours together will provide a mean
growth rate of 1mm.

38
The status of hearing in managed vestibular schwannomas (a review of hearing outcomes
with different treatment modalities).
The management of the hearing patient with a small-medium-sized vestibular schwannoma is
perhaps the most controversial area of management, and hence one where there is considerable
diversity of practise among clinicians. The aim of this literature search is to review the evidence
for the natural history of hearing progression in watched vestibular schwannomas.
Hearing preservation in conservatively managed patients
In common with those papers discussed above addressing the natural history of tumour growth
(many are the same series, and often the same studies), much of the data pertaining to hearing
status is problematic, and this section will begin with a discussion of methodology in the
various studies summarised below. In many papers, clarity is compromised because hearing
data is included with other data pertaining to tumour growth, often with a different sub-set of
patients considered, and rarely a separate discussion of, for example, follow-up within the group
of patients in whom hearing is addressed.
Hearing Classification
The majority of studies use the classification system proposed by the American Academy of
Otolaryngology-Head and Neck Surgery (1995) to determine whether hearing is ‘serviceable’ or
not. This system employs both pure tone audiometry (PTA) and speech discrimination studies
(SDS), and is summarised in Table 6 below. A further classification system is the Gardner-
Robertson (1988), a system that emphasises speech discrimination and in which there are four

39
grades (I-IV, corresponding to A-D in the AAO-HNS classification). This latter classification is
used more frequently in the literature relating to radiosurgery.
Table 6: American Academy of Otolaryngology – Head and Neck Surgery Classification of
Hearing (1995)
Class Pure-Tone Thresholds
(Average of 0.5, 1, 2, 3 kHz)
Speech Discrimination (%)
A 30dB or less and 70 or greater
B 30dB or less and 50-69
B 30-50dB and 50 or greater
C >50dB and 50 or greater
D Any level Less than 50
Follow-up
As found in the discussion of the natural history of tumour growth, the importance of the
duration of follow-up and its documentation is central to a critical appraisal of the studies
described. Unfortunately, as outlined above, many of the studies that appear in Table 7 and
discuss hearing preservation also appear in Table 5. In these studies, hearing preservation is
often reported as a secondary outcome, and it is often difficult to calculate duration of follow-up
of hearing results distinct from follow-up of tumour surveillance. In Table 7, an attempt has
been made to clarify these questions.
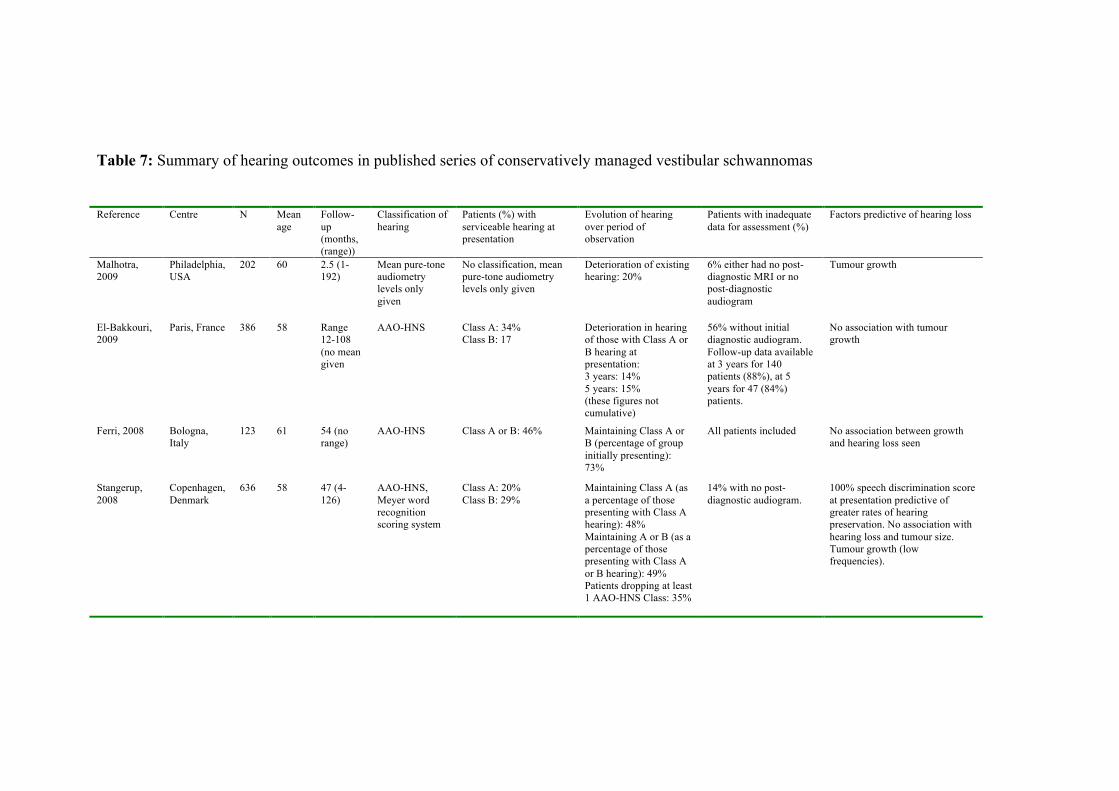
Table 7: Summary of hearing outcomes in published series of conservatively managed vestibular schwannomas Reference Centre N Mean
age Follow-up (months, (range))
Classification of hearing
Patients (%) with serviceable hearing at presentation
Evolution of hearing over period of observation
Patients with inadequate data for assessment (%)
Factors predictive of hearing loss
Malhotra, 2009
Philadelphia, USA
202 60 2.5 (1-192)
Mean pure-tone audiometry levels only given
No classification, mean pure-tone audiometry levels only given
Deterioration of existing hearing: 20%
6% either had no post-diagnostic MRI or no post-diagnostic audiogram
Tumour growth
El-Bakkouri, 2009
Paris, France 386 58 Range 12-108 (no mean given
AAO-HNS Class A: 34% Class B: 17
Deterioration in hearing of those with Class A or B hearing at presentation: 3 years: 14% 5 years: 15% (these figures not cumulative)
56% without initial diagnostic audiogram. Follow-up data available at 3 years for 140 patients (88%), at 5 years for 47 (84%) patients.
No association with tumour growth
Ferri, 2008 Bologna, Italy
123 61 54 (no range)
AAO-HNS Class A or B: 46% Maintaining Class A or B (percentage of group initially presenting): 73%
All patients included No association between growth and hearing loss seen
Stangerup, 2008
Copenhagen, Denmark
636 58 47 (4-126)
AAO-HNS, Meyer word recognition scoring system
Class A: 20% Class B: 29%
Maintaining Class A (as a percentage of those presenting with Class A hearing): 48% Maintaining A or B (as a percentage of those presenting with Class A or B hearing): 49% Patients dropping at least 1 AAO-HNS Class: 35%
14% with no post-diagnostic audiogram.
100% speech discrimination score at presentation predictive of greater rates of hearing preservation. No association with hearing loss and tumour size. Tumour growth (low frequencies).

Table 7 (cont’d): Summary of hearing outcomes in published series of conservatively managed vestibular schwannomas. Reference Centre N Mean
age Follow-up (months, (range))
Classification of hearing
Patients (%) with serviceable hearing at presentation
Evolution of hearing over period of observation.
Patients with inadequate data for assessment (%)
Factors predictive of hearing loss
Hajioff, 2008 Toronto 72 - 121 (median, range 80-272)
Mean change in PTA
- Mean change in hearing from baseline 35.6 dB
18% Growth
Grayeli, 2005 Clichy, France
105 59 33 (6-111) AAO-HNS Class A: 23% Class B: 18% Class C or D: 58%
Maintaining Class A or B as a percentage of group at last follow-up visit: 8%
17% Tumour growth
Flint, 2005 Auckland, New Zealand
79 No details
No details AAO-HNS Class A: 28% Maintaining Class A (as a proportion of those presenting with good hearing): 66%
32% (of those with good hearing)
No details
Tschudi, 2000
Zurich, Switzerland
70 53 No details AAO-HNS Class A: 21% Class B: 27%
Maintaining Class A: 67% Maintaining A or B: 65% Percentages refer to a percentage of those with initially good hearing.
5% of total
42
Hearing loss in observed vestibular schwannomas
As is indicated by Table 7, there is a general trend towards a decline in hearing in patients
managed conservatively over time: of the 50% of patients that present with ‘serviceable’
hearing, a significant proportion will lose this over the relatively short period of follow-up
described in the series presented. Thus, Stangerup (2008) reports that approximately 50% of
patients with serviceable hearing maintain this. Tschudi (2000) reports that a proportion of 65%
approximately maintain hearing that is useful over the period studied. Unfortunately, neither
author details follow-up within each group: hearing preservation may simply be a reflection of
shorter follow-up.
Other studies suggest that this may indeed be the case. Grayeli (2005) details hearing results at
serial visits: thus at the first visit, 41% of 105 patients tested have useful hearing (Class A or B),
but by the 6th visit, only 8% of 13 patients have been able to preserve this level of hearing.
Ferri’s paper suggests a similar phenomenon: patients with preservation of hearing have a mean
follow-up period of 44 months, whereas those with deterioration have a mean follow-up of 80
months. Useful data to be made available would be the proportion of patients within each group
that maintain static hearing, but this is rarely offered.
Risk Factors for Hearing Loss
Predicting whether a patient is likely to loose their hearing is obviously of interest to clinicians.
In most series, tumour growth is associated with an increased risk of hearing loss, but this is not
universally the case, and often hearing loss can occur in the absence of growth. A further
indicator, suggested by Stangerup (2008) is the significance of perfect speech discrimination at

43
presentation: thus while in the series as a whole, Class A hearing was preserved in 48%; in
those with perfect speech discrimination, this level was maintained in 80%.
Stangerup’s observation, further supported by a later publication (Stangerup, 2009) recording
further data from the same series, is of interest and can possibly inform the wider debate about
the most appropriate management for the sub-group of patients that present with normal or
near-normal hearing. The cause for this finding is not clear - and its validity is debateable (see
Chapter 3 below) - but it is possible to speculate that if the process that leads to hearing loss has
not begun at the time of presentation, it is unlikely to develop during a period of observation,
particularly in the absence of tumour growth. The argument is sometimes made that clinicians
should expedite definitive treatment of patients with good hearing to prevent further
deterioration in auditory function (Meyer, 2006): this argument is undermined if, as this
evidence suggests, this group of patients are the least likely to demonstrate a deterioration in
hearing when observed.
Hearing preservation in surgically treated patients
Table 8 summarises a number of recent series that address outcomes in surgical treatment of
vestibular schwannomas when hearing preservation is attempted. Although the series are
heterogenous (in particular with reference to inclusion criteria), a number of tentative
conclusions are possible:

Table 8: Surgical series detailing hearing preservation results Reference Centre N Mean age Surgical approach Hearing at
presentation Hearing preservation (percentages refer to total group, unless otherwise stated)
Factors influencing outcome
Yamakami, 2009
Chiba, Japan 22 51 Retrosigmoid Class A: 50% Class B: 32% Total A or B: 82%
Class A: 9% Class B: 55% Total A or B: 64%
Nil (series of small tumours)
Samii, 2006 Hannover, Germany
200 Retrosigmoid 51% functional preservation
Arts, 2006 Ann Arbor, USA 74 No details
Middle cranial fossa Class A: 46% Class B: 38% Total A or B: 84%
Class A: 29% Class B: 33% Total A or B: 62%
Nil (series of small tumours)
Meyer, 2006 Iowa City, USA 162 49 Middle cranial fossa Class A: 62% Class B: 16% Total A or B: 78%
Class A: 28% Class B: 18% Total A or B: 46%
Tumour size (larger tumours give worse outcomes) Introduction of near-field cochlear nerve action potential monitoring improved outcomes
Mangham, 2004 Seattle, USA 72 No details
Retrosigmoid Class A: 31% Class B: 38%
Class A: 22% Class B: 26% Total A or B: 48%
Analysed results from other institutions to conclude that hearing preservation more successful with middle fossa approach than retrosigmoid
Yates, 2003 San Francisco, USA
64 45 Retrosigmoid All tumours class A or B, no break-down given
Class A: 0% Class B: 6% Total A or B: 6%
All tumours large (>15mm in CPA). ‘Best results’ with (relatively) smaller tumours
Gjuic, 2001 Erlangen, Germany
735 51 Middle cranial fossa (enlarged)
Class A: 51% Class B: 27%
Class A: 18% Class B: 14%
Strong correlation between tumour size and hearing preservation
Kaylie, 2001 Portland, USA 97 N/A Suboccipital Class A or B: 45% Class A or B: 29% Nil (small sample) Brackmann, 2000
Los Angeles, USA
333 Middle cranial fossa Class A: 33% Class B: 26% Total A or B: 50%
Outcomes significantly improved if pre-operative hearing better, if tumour originating from the superior vestibular nerve and if characteristic ABR findings present
Irving, 1998 San Francisco, USA
98 Retrosigmoid and middle cranial fossa
Class A or B (MCF): 52% Class A or B (RS): 17%
Comparison between two techniques found middle cranial fossa approach superior, significant association between results and tumour size
Gormley, 1997 Pittsburgh, USA 197 47 Retrosigmoid Gardner-Robertson I or II: 39%
Gardner-Robertson I or II preserved in 48% of those in which preservation attempted
Strong correlation between tumour size and hearing outcomes

45
Hearing preservation rates
In most of the above series, initial pre-operative hearing is considered suitable for attempted
hearing preservation (usually considered either Class A or B) in approximately 50% of cases.
An excellent hearing outcome (preservation of Class A hearing in a patient presenting with this
hearing level), is achieved in between 30-60% of patients. A good outcome (preservation of
Class A or B) can equally be achieved in between 30-60% of individuals.
Factors determining outcomes
Two factors would seem to influence outcome in these series: tumour size and surgical
approach. The most important is tumour size, with all those series including tumours of
different sizes reporting a strong correlation. In Yates’ series, where all tumours are of a size
that would be considered an upper limit for tumour resection with attempted hearing
preservation, outcomes are notably poor. A further correlation is seen between surgical
approach: in a direct comparison between the retrosigmoid and middle cranial fossa approaches,
both Irving (1998) and Staecker (2001) found the latter to be more likely to give a successful
result, and this is confirmed by Mangham’s review of 2004.
Hearing preservation in patients treated with radiosurgery and radiotherapy
Table 9 summarises recent publications describing radiotherapeutic treatment of vestibular
schwannomas. In most series, the modality used is radiosurgery, or gamma-knife stereotactic
radiosurgery (GKSRS). This technique consists of the administration of a single dose of high-
level radiation targeted to the tumour employing high-resolution volumetric magnetic resonance

Table 9: Series describing radiosurgical hearing preservation and tumour control
Reference Centre Date range
Follow-up (months)
N Type of DXT
Mean dose (marginal dose unless otherwise stated))
Selection criteria
Tumour control rate
Definition of tumour control
Hearing preservation Complications
Pollock, 2009
Mayo Clinic, Rochester, USA
1990-2004
61 293 GKSRS 13 Gy All patients 94% at 4 years after treatment
Tumour enlargement on two or more serial imaging studies
Not studied N/A
Andrews, 2009
Philidelphia, USA
N/A 1st group: 12 2nd group: 15
89 FRST 1st group: 50 Gy 2nd group: 47 Gy
Patients with serviceable hearing
100% (but short follow-up)
N/A Hearing preservation significantly more successful in lower dose cohort
N/A
Combs, 2009
Heidleburg, Germany
N/A 75 (median)
202 FSRT and GKSRS (compares two
FSRT=57.6Gy (5X1.8 per week) SRS=13Gy
Growing tumours or progressive symptoms, 18% previous surgery
N/A N/A Same for both, but worse for higher doses of GKRS
N/A
Timmer, 2009
Nijmegen, Netherlands
2003-7 14 69 GKSRS 11 Gy N/A N/A N/A 41% preservation of serviceable hearing, correlating with cochlea dose
N/A
Lobato-Polo, 2009
Pittsburgh, USA
1987-2003
64 (min. 4 years)
55 GKSRS 11 Gy Young patients (<40 yrs.) 24% of patients had had previous surgery
96% No further intervention
93% preservation of hearing in same class as pre-GKSRS
1 VII palsy (grade III), 2 cases of trigeminal neuropathy, both related to higher marginal doses given early in series
Wang, 2009 (article in Chinese: abstract only seen)
Shanghai, China
1994-2000
86 50 GKSRS 12.3 Gy Elderly patients (range 60-80) with large tumours
94% Reduction or stabilisation in tumour size
N/A 2 patients died due to tumour expansion post-treatment. 2 cases of facial palsy, 18 cases of trigeminal neuropathy

47
imaging to conform the radiation dose to the tumour bulk. Although traditional fractionated
radiotherapy (FSRT) is also used to treat vestibular schwannomas (Combs, 2009, Thomas,
2007) with similar results in terms of tumour control, GKSRS offers advantages in patient
convenience, and is the more commonly used technique.
Hearing outcomes
While most studies of surgical and conservative management traditionally employ AAO-HNS
guidelines for reporting hearing outcomes, the majority of radiosurgical reports employ the
Gardner-Robertson classification system, probably reflecting the neurosurgical (rather than
neurotological) origin of these studies. As noted above the systems are equivalent, although the
AAO-HNS includes audiological results in addition to the speech discrimination studies
employed in the Gardner-Robertson system.
As seen in Table 9, most studies report rates of hearing preservation of between 60-80%. There
is a strong correlation between hearing preservation and cochlear radiation dose seen in most
series that address the issue (Timmer, 2009, Régis, 2008, Kano, 2007), as well as between
hearing preservation and radiation dose generally (Andrews, 2009). Appropriately, Kano also
finds better outcomes in those small tumours that are located in the medial part of the internal
auditory canal: these tumours will allow radiosurgeons to avoid administering radiation to the
cochlear more easily. Interestingly, Combs (2009) finds improved hearing preservation with
FSRT than when high doses of marginal radiation are administered with GKSRS: it may be that
in those patients with very lateral tumours in which a degree of cochlear radiation is inevitable,
FRST should be offered preferentially in order to seek to avoid cochlear damage.
48
Putative mechanisms of hearing damage with radiotherapeutic techniques
While irradiation of the cochlea is most frequently recognised as a cause for hearing loss
following radiotherapy or radiosurgery, Linskey (2008) suggests that the irradiation of the
brainstem may also play a significant role. This is supported by evidence from Paek (2005), and
in addition to damage sustained to the cochlear nerve, suggests a mechanism for hearing
deterioration in cases where cochlear irradiation can be avoided. This factor may also explain
why hearing preservation outcomes are found to be less successful in larger, more medially
placed tumours undergoing irradiation that might allow cochlear sparing.
Summary of weaknesses in existing literature
1. The true natural history of vestibular schwannoma growth and non-growth is obscured by the
manner in which data are reported:
-there is a population bias in a number of series.
-there is a lack of clarity in the description of the duration of follow-up.
2. Similar concerns related to reporting of follow-up data confuse an appreciation of hearing
outcomes:
-hearing data is often reported as a secondary outcome, without dedicated description of follow-
up data pertaining to hearing alone, rather than to ‘follow-up’ in general.
-hearing outcomes are reported in terms of preservation of hearing class: a measurement that is
dependent upon duration of follow-up.

49
3. There are few attempts to statistically evaluate risk factors for growth in substantial case
series of conservatively managed tumours.
4. There is little evidence offered beyond the anecdotal to support a particular management
strategy: thus Meyer (2006) asserts that conservative management risks rendering the outcomes
of surgery less successful without offering evidence.
5. There is a lack of an evidence-based protocol to guide the frequency of surveillance scans in
conservatively managed patients.

50
Birmingham Database of Vestibular Schwannomas
The Birmingham database of vestibular schwannomas records information relating to all
vestibular schwannomas (excluding patients with Neurofibromatosis Type II) managed in the
Queen Elizabeth Skull Base Unit since 1997 under the care of the surgical supervisor of this
thesis (RMI). Since this date, relevant clinical details have been stored in the ENT Department
offices, allowing simple and rapid access to patient data. An electronic version of the database
(Microsoft Exel) was created by the author of this thesis (TPCM) in 2004, and this electronic
database has been maintained prospectively since that date, with updating of data every quarter.
Audit of data collection
In order to attempt to assess the quality of data collected in the database, a request was made to
the audit department at Queen Elizabeth Medical Centre asking for a comprehensive list of all
new patients treated in the hospital with a new diagnosis of vestibular schwannoma or acoustic
neuroma in the years 2007 and 2008 (audit code CA2-02262-09). Unfortunately, clinical coding
in the hospital only extends to patients treated as in-patients, and therefore no search could be
carried out that identified patients treated only as out-patients: a group representing a significant
proportion of patients seen in the hospital and included in the database.
A request was made to the audit department to recover data relating to patients treated
surgically to remove an acoustic neuroma or vestibular schwannoma (Ca2-02262-09) in these
years, and this search identified 5 and 16 patients in 2007 and 2008 respectively. The
corresponding number of patients recorded in the database undergoing surgical treatment in

51
these years are 13 and 9. Interestingly, these figures are divergent. A number of possible
reasons for this can be suggested:
1. The number of surgical cases recorded by the audit department may be less than those
recovered by the database (as found in 2007) due to inappropriate coding systems.
2. The number of surgical cases recorded in the database may be less than those recorded by the
audit department (as seen in 2008) because some vestibular schwannomas may be followed-up
by the neurosurgical department.
3. A number of tumours are treated by other colleagues in the hospital: these patients are not
recorded in the Birmingham Database.
Ethical approval
A submission was made to the local ethical committee chair (Dr S Bowman, South Birmingham
Research Ethics Committee) in order to determine whether formal ethical approval for the
studies described within the thesis was required. In response, Dr Bowman felt that the thesis
represented an audit of an approved database, and as such was not subject to formal ethical
approval in line with NRES guidelines. These communications are attached in the appendix to
this thesis (Appendix 1 and 2).
Data security
Data are stored securely in the Queen Elizabeth Hospital, and on a password-protected
computer. The database is registered with the hospital audit department and TPCM is registered
with the Data Protection Agency.
52
Data fields
Demographic
All patients are registered with simple demographic data detailing age (at presentation) and sex.
Presenting data
The date of presentation (to our unit) is recorded, with details of presenting symptoms, duration
of those symptoms, hearing and tumour characteristics and the management option chosen by
the clinician and patient (i.e. conservative, surgery or radiotherapy). Presenting
symptomatology is recovered from the letter written to the referring clinician. The symptoms
described by patients are often multiple, and all are recorded. The duration of symptoms is
recorded in months, and will usually refer to the onset of the earliest presenting symptom: the
time recorded is subjective, but the patient is closely questioned. Hearing data at presentation
includes pure tone audiometry and speech audiometry for both the affected and non-affected
ear. Pure tone audiometry is recorded as an average of 0.5, 1, 2 and 3 kHz. Speech audiometry
is recorded as the maximal percentage of words comprehended at any presenting volume.
Tumour measurements are recovered from the letter sent to the referring clinician and are as
measured from the original MRI scan by RMI. Tumours in the internal auditory canal only are
not measured, but in most cases, are described according to their location in the internal
auditory canal (thus: ‘medial’ or ‘filling the whole auditory canal’). Tumours extending into the
cerebello-pontine angle are measured at the level of the cochlear parallel to the medial border of

53
the petrous bone. A record is made of the side of the tumour and whether the tumour is cystic or
not.
Surgery
A full record is made of surgery undertaken, with details of any complications and outcomes in
terms of tumour recurrence, facial nerve rehabilitation (with status recorded according to the
House-Brackmann scale (House, 1985)), and hearing preservation. If a near- or sub-total
surgical excision is performed, this is noted in the database. Facial nerve preservation is
recorded as the status of the facial nerve after maximum recovery has taken place: if the facial
nerve is impaired (House-Brackmann Grade III or worse) and less than 12 months have passed
(a standard timeframe for neural recovery), the result is not considered ‘complete’. If facial
nerve reanimation surgery is performed, this is noted and the facial nerve status recorded both
prior to and after any reanimation. Surgical complications such as cerebro-spinal fluid leak are
recorded with details of any further procedures undertaken. Follow-up MRI scans to assess for
residual tumour are generally carried out 3 years after surgery unless a less-than total tumour
excision has taken place, in which case a follow-up scan will often be requested at a more early
date.
Conservative management
Follow-up of conservatively managed patients is monitored and details recorded of any tumour
growth (including growth rates), and any change in hearing. Patients with static tumours are
scanned and seen at six months following presentation then at yearly intervals for two years.
Thereafter, patients are scanned and seen after a further two years and then at five yearly

54
intervals (this policy has developed during the time of study: see Chapter 5). Any tumour
growth will lead to either definitive treatment or an adjustment of the above management plan.
In the database, patients are considered to be lost to follow-up if they default from the above
schedule by more than 1 year: if they fall within this schedule, their duration of follow-up is
calculated from the time of presentation until the time of data collection.
An effort is made to encourage patients to attend the Queen Elizabeth Hospital for both follow-
up scans and follow-up clinic assessments. In some cases, however, where patients live far from
the hospital, they are seen and scanned locally. In these cases, we encourage the clinicians
managing them to send copy letters detailing their progress. In the absence of these copy letters,
patients are considered lost to follow-up. Patients who are found to be lost to follow-up are
contacted through their general practitioners or referring otolaryngologists if possible.
In the course of conservative management, a record is made of the patients’ status at quarterly
reviews of the database. Patients with static tumours are noted, as are those with tumours that
grow at a very slow rate and are managed with continued observation. In cases of growth
leading to a change in management, the treatment undertaken is noted, as is the time at which
tumour growth was detected. A record is made of tumour dimensions at the time of tumour
growth detection, and from this a tumour growth rate (in mm change in tumour diameter
annually) is recorded. Hearing status is also noted, following principles outlined above.
Although an effort is made to record hearing data in all patients under observation, resource
limitations make this difficult in those patients where hearing is perceived to be static, and for
this reason, full audiometric data is not available for every visit.

55
Strengths and Limitations of the Database
Strengths
Consistency of assessment and data entry
As noted above, a potential confounding factor in reported series of conservatively managed
vestibular schwannomas is the long duration of time over which the series is developed. This
risks an introduction of inconsistency due to different teams assessing patients and different
imaging modalities being employed to assess tumour dimensions. In the Birmingham series,
this is avoided by a series of a relatively short duration (13 years to date). The period of data
acquisition has been overseen by one clinician (RMI), who has seen all the patients included in
the series and has employed a consistent approach to assessment in these patients. Furthermore,
data entry has been carried out prospectively by one individual (TPCM) ensuring continuity of
data over the period of acquisition.
Clarity of follow-up definition and lack of loss to follow-up
Good follow-up is a prerequisite to effective conservative management, and as demonstrated
above, a source of potential bias in publications if not explicitly documented. In this series, we
offer explicit definitions for follow-up (i.e. failing to be seen within 1 year of a scheduled
clinical episode), thus allowing a clear understanding of the likely importance of such loss to
follow-up. In many cases, patients ‘lost’ have in fact been seen in the clinic for a number of
years with stable tumours, and as such are unlikely to be at risk.

56
Lack of population bias
Although initially following a policy of ‘selected’ conservative management - offering this
modality to the elderly or medically unfit - increasingly our policy has become to offer all
patients an initial period of conservative management if their tumours are of a size less than
2cm in the cerebellopontine angle. This reduces the population bias seen in other published
series and allows a more robust analysis of, for example, growth rates in different population
groups.
Limitations of the database
‘Front-loading’
As noted above in the discussion of published series of conservatively managed patients, there
is a considerable bias introduced by the phenomenon of ‘front loading’, whereby a large
proportion of the patients studied are recently recruited and have a short duration of follow-up.
Thus in our series, the total number of patients under conservative management is 470, but of
these, a disproportionate group (37%) have less than two years follow-up. 294 patients have
greater than 2 years follow-up, but only 179 (38% of the series as a whole) have greater than 4
years follow-up. The effect of this phenomenon is to distort calculated rates of tumour growth
by including large numbers of patients with only a short duration of follow-up.
Availability of MR scans for review of measurements
Although patients’ MR scans are now stored electronically, allowing easy comparison of
tumour sizes, this technology has only been available for the past 6 years in our hospital.
Previously, ‘hard’ films were taken, introducing logistical problems when attempting to recover
57
films in order to review growth rates in tumours over serial MR scans. This problem is
exacerbated by the fact that original MR scans are often performed in outlying, referring
hospitals. For this reason, it has been difficult to recover films in order to allow a systematic
review of tumour growth. In the absence of such a review, our practise in compiling data has
been to depend upon clinician assessment (RMI) documented in medical records.

58
Thesis aims and objectives
1. To address issues relating to the natural history of vestibular schwannomas (in particular
growth and non-growth proportions and the natural history of hearing in observed patients). In
analysing these issues, the thesis will pay particular attention to issues of follow-up, its duration
and compliance.
2. To use the Birmingham database to explore risk factors for tumour growth or non-growth in
observed vestibular schwannomas.
3. To provide an evidence-based protocol for the safe and efficient surveillance of
conservatively managed vestibular schwannomas.
4. To address issues of vestibular schwannoma management (conservative, surgical and
rehabilitative) supported by evidence from the Birmingham database.

59
Forthcoming Chapters
Chapter 1: The natural history of vestibular schwannoma growth
An analysis of growth rates among watched vestibular schwannomas, and a comparison with
the world literature.
Chapter 2: Risk factors for growth in watched vestibular schwannomas
An analysis of features that suggest vestibular schwannomas are at greater or lesser risk of
growth.
Chapter 3: Hearing loss and preservation in watched vestibular schwannomas
An analysis of hearing data in the context of the world literature.
Chapter 4: An intention to treat analysis of conservative versus surgical management of
vestibular schwannomas.
A case-control study comparing facial nerve preservation in patients managed by either primary
surgical or conservative management.
Chapter 5: A protocol to direct the conservative management of vestibular schwannomas
A discussion of issues relating to the formulation of a safe and effective regime to dictate the
frequency of follow-up imaging in patients undergoing conservative management.

60
Chapter 6: Functional surgery in the management of vestibular schwannomas: the
prioritisation of the facial nerve over total tumour removal.
Comparing outcomes of ‘neurologically-sparing’ less-than-total tumour removal with
traditionally employed total tumour excision.
Chapter 7: The rehabilitation of single-sided deafness with the bone-anchored hearing aid.
Single-sided deafness is the most common disability of both conservatively and definitively
treated patients with a vestibular schwannoma. This chapter will describe a study to assess the
efficacy of the Bone-Anchored Hearing Aid (BAHA) in treating this condition.
61
CHAPTER 1: THE NATURAL HISTORY OF VESTIBULAR SCHWANNOMA GROWTH
A presentation of patient, symptom and tumour characteristics of vestibular schwannomas
undergoing different management strategies and an analysis of growth rates among watched
vestibular schwannomas.
Introduction
As previously discussed in the introduction to this thesis, an estimation of growth or non-
growth in watched vestibular schwannomas is often complicated by questions of follow-up. In
many series, a significant proportion of patients presented have a very short duration of follow-
up, with a consequent tendency to under-estimate the proportion of growing tumours within the
group. This chapter will summarise the Birmingham experience in terms of tumour growth in
observed vestibular schwannomas, and will also discuss issues raised by the ‘front-loading’ of
our series of watched tumours. Before addressing these issues, however, demographics of
conservatively managed patients, with tumour characteristics and patient symptoms, are
presented.
Patients undergoing conservative management: a comparison with patients managed with
either primary surgery or radiosurgery
Method
Data collection

62
As detailed above, the Birmingham database is updated regularly, and data presented in this
chapter was collected in January 2010. Conservatively managed patients are presented with
patients managed with primary surgery or radiosurgery in order to provide comparison, and are
assessed in terms of demographics, symptomatology, and tumour characteristics.
Table 10: Demographic details of patients managed conservatively or primarily in Birmingham
All
patients
Conservatively
managed patients
Patients treated
with surgery or
radiotherapy as
first treatment
Intracanalicular
tumours
Small-
Medium
(Tokyo
1,2)
Moderately
large - Giant
(Tokyo 3+)
Sex
Distribution
F: 371
(51%)
M: 359
(49%)
F: 225 (48%)
M: 243 (52%)
P 0.201
F: 141 (55%)
M: 115 (45%)
P 0.13
F: 118 (48%)
M: 130 (52%)
P 0.20
F: 138
(49%)
M: 145
(51%)
P 0.30
F: 102
(57%)
M: 78
(43%)
P 0.09
Age (mean,
range)
57 (18-88) 60 (22-88) 50 (18-81) 58 (22-86) 59 (21-
88)
52 (18-81)
1. P values refer to a comparison between the sex-distribution seen within each category when tested against sex
distribution seen within the group as a whole (‘all patients’).
Results
Patient demographics
Patient demographics are presented in Table 10. An interesting observation is that there seems
to be a consistent weak trend towards a sex bias indicating that females are more prone to
aggressive tumours than males. This is seen both in terms of tumours undergoing surgery vs.
those that are watched and in terms of tumours of differing sizes, with women more likely to
present with large tumours than men. This observation may explain the previously discussed

63
historical belief that vestibular schwannomas are more common in females than males: in a pre-
imaging age where only the more aggressive tumours presented, it would be expected that a sex
bias would be seen favouring females.
Symptomatology
As discussed above (see Introduction), symptomatology data is often problematic for reasons
related to data collection and patient recollection. Notwithstanding, data related to
symptomatology are presented in Table 11. As might be expected, those tumours that present
while intracanicular or at Tokyo Grade 1 or 2 (size of up to 2cm in the CPA) will generally
present with otological or mixed vestibular and otological symptoms. Larger
tumours are more likely to present with additional trigeminal nerve symptoms or with
neurosurgical complications.
There is an interesting correlation between the duration of presenting symptoms, the size of
tumour, and the initial management plan undertaken. Those tumours that are given definitive
treatment as their initial management have a mean duration of symptoms of only 35 months,
whereas those treated conservatively have a mean duration of symptoms of 57 months. A
corresponding trend is seen in tumours of differing sizes, with larger tumours tending to present
with a shorter duration of symptoms. This inverse association between symptom duration and
tumour aggression is also found when analysing factors predictive of tumour growth, and will
be explored in greater depth in Chapter 2 below.
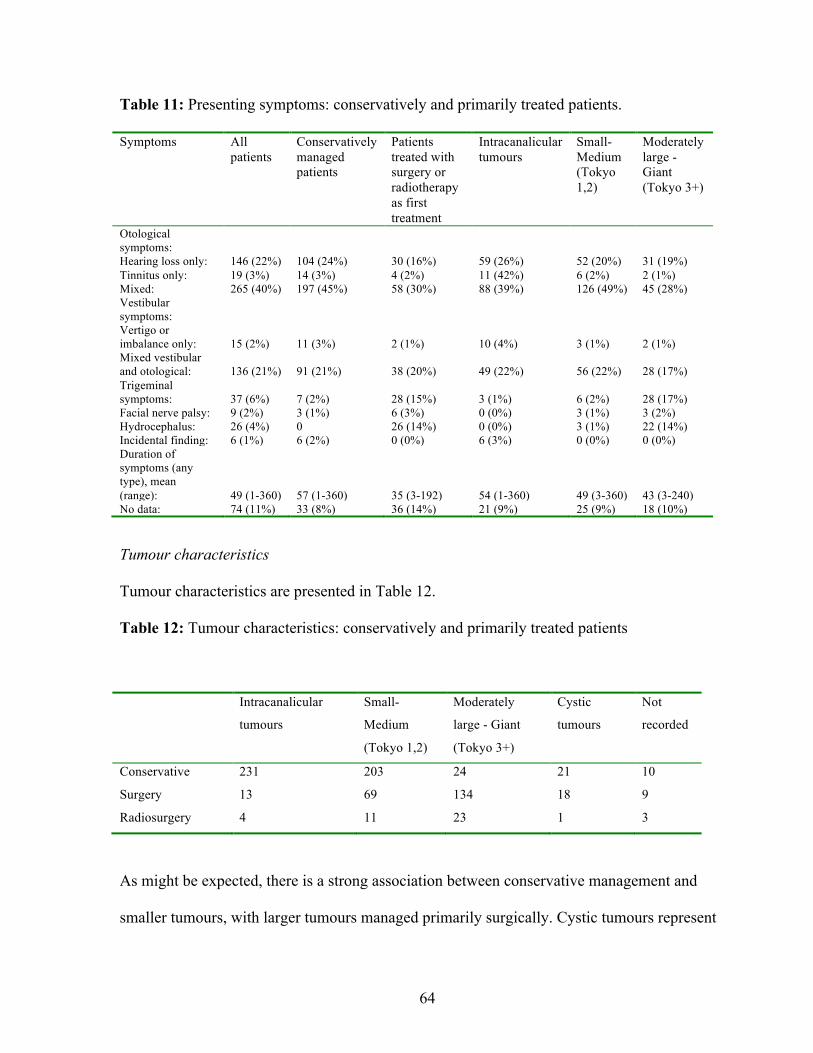
64
Table 11: Presenting symptoms: conservatively and primarily treated patients.
Symptoms All patients
Conservatively managed patients
Patients treated with surgery or radiotherapy as first treatment
Intracanalicular tumours
Small-Medium (Tokyo 1,2)
Moderately large - Giant (Tokyo 3+)
Otological symptoms: Hearing loss only: Tinnitus only: Mixed:
146 (22%) 19 (3%) 265 (40%)
104 (24%) 14 (3%) 197 (45%)
30 (16%) 4 (2%) 58 (30%)
59 (26%) 11 (42%) 88 (39%)
52 (20%) 6 (2%) 126 (49%)
31 (19%) 2 (1%) 45 (28%)
Vestibular symptoms: Vertigo or imbalance only: Mixed vestibular and otological:
15 (2%) 136 (21%)
11 (3%) 91 (21%)
2 (1%) 38 (20%)
10 (4%) 49 (22%)
3 (1%) 56 (22%)
2 (1%) 28 (17%)
Trigeminal symptoms:
37 (6%)
7 (2%)
28 (15%)
3 (1%)
6 (2%)
28 (17%)
Facial nerve palsy: 9 (2%) 3 (1%) 6 (3%) 0 (0%) 3 (1%) 3 (2%) Hydrocephalus: 26 (4%) 0 26 (14%) 0 (0%) 3 (1%) 22 (14%) Incidental finding: 6 (1%) 6 (2%) 0 (0%) 6 (3%) 0 (0%) 0 (0%) Duration of symptoms (any type), mean (range):
49 (1-360)
57 (1-360)
35 (3-192)
54 (1-360)
49 (3-360)
43 (3-240)
No data: 74 (11%) 33 (8%) 36 (14%) 21 (9%) 25 (9%) 18 (10%)
Tumour characteristics
Tumour characteristics are presented in Table 12.
Table 12: Tumour characteristics: conservatively and primarily treated patients
Intracanalicular
tumours
Small-
Medium
(Tokyo 1,2)
Moderately
large - Giant
(Tokyo 3+)
Cystic
tumours
Not
recorded
Conservative 231 203 24 21 10
Surgery 13 69 134 18 9
Radiosurgery 4 11 23 1 3
As might be expected, there is a strong association between conservative management and
smaller tumours, with larger tumours managed primarily surgically. Cystic tumours represent

65
approximately 5% of the tumours seen, although it should be recognised that cysts rarely form
in intracanalicular tumours and therefore the proportion of cystic tumours among vestibular
schwannomas with dimensions in the CPA is higher (at 9%).
Growth and non-growth in conservatively managed patients
As outlined in the introduction to this thesis, the aim of conservative management is to monitor
tumours over time to determine whether definitive intervention is required. In this thesis,
tumours are defined either as ‘not growing’, ‘growing requiring a change in management’ or
‘growing but not requiring a change in management’. The latter group is formed by patients
persisting with conservative management usually because of a combination of tumour factors
(very slow or inconsistent growth), or patient factors (old age or patient choice). In common
with other published series, growth of ≥2mm in diameter annually is considered significant
enough to indicate growth, with less rapid growth confirmed over a number of years also being
considered significant.
The importance of follow-up
As noted above, follow-up duration can have a significant influence upon the proportion of
patients thought to have ‘growing’ vestibular schwannomas, with a tendency to under-estimate
the risk of tumour growth. This is largely due to a disproportionate number of patients within
the group having a short period of follow-up, and hence not demonstrating growth at the time of
data collection. In our own series, there is a similar predominance numerically of patients with a
short duration of follow-up, as demonstrated in Table 13.

66
Table 13: Number of conservatively managed patients with different duration of follow-up and
proportion of patients within each group demonstrating growth.
Duration of follow-up Patients showing
no growth
Patients with growth,
but not sufficient to
alter management
Patients with sufficient
growth to alter
management
Minimum 6/12 (n.378) 278 (74%) 27 (7%) 74 (20%)
Minimum 18/12 (n.336) 238 (71%) 25 (7%) 73 (22%)
Minimum 30/12 (n.250) 172 (69%) 19 (8%) 59 (24%)
Minimum 42/12 (n.206) 143 (69%) 12 (6%) 51 (25%)
Minimum 60/12 (n.140) 93 (66%) 9 (6%) 38 (27%)
If those patients with at least 5 year’s follow-up (n. 140) are considered, then a proportion of
approximately 66% demonstrating no growth is found. This proportion is somewhat smaller
than that found (75%) if all patients with at least one follow-up scan are included. Interestingly,
this figure of 66% is consistent with Hadjihoff’s data (2008) documenting the Toronto series of
conservatively managed vestibular schwannomas (65% no growth). This cohort series has been
maintained prospectively and offers the most comprehensive follow-up data of those series
detailed in Table 5, and probably represents an accurate reflection of the natural history of
tumour growth.
Analysis of patients lost to follow-up
The loss of patients to follow-up is defined for the purposes of this study (and thesis) as a
failure to record an outcome for at least one year after an expected clinic appointment. Table 14
details the characteristics of those patients who have been lost to follow-up: it is noticeable that

67
patients who have been lost to follow-up do not differ markedly in demography, tumour
characteristics, or the time at which they presented to the service from those patients managed
conservatively as a whole. Tables 15 and 16 further characterise these patients.
Table 14: Patients under conservative management lost to follow-up (n.43): demographics and
time of presentation
Age Sex Tumour size 1997-2002 2002-2006 2006-
Lost 62 F:23 (53%)
M:20 (47%)
I.can:24 (56%)
CPA:19 (44%)
7 (16%) 14 (33%) 22 (52%)
All
conservatively
managed
patients
60 F:225 (48%)
M:243
(52%)
I.can: 230
(49%)
CPA: 226
(48%)
No data: 12
63 (13%) 137 (29%) 268 (57%)
Table 15: Cause of loss to follow-up (where known) and duration of follow-up achieved
Total n. Refused
follow-up
Moved abroad Thought to be followed by other
consultants1
Unknown
43 3 2 19 19
1. In cases where patients are under surveillance by other consultants, attempts have been made to update clinical
progress, with some success. In other cases (cited here), no response has been obtained.
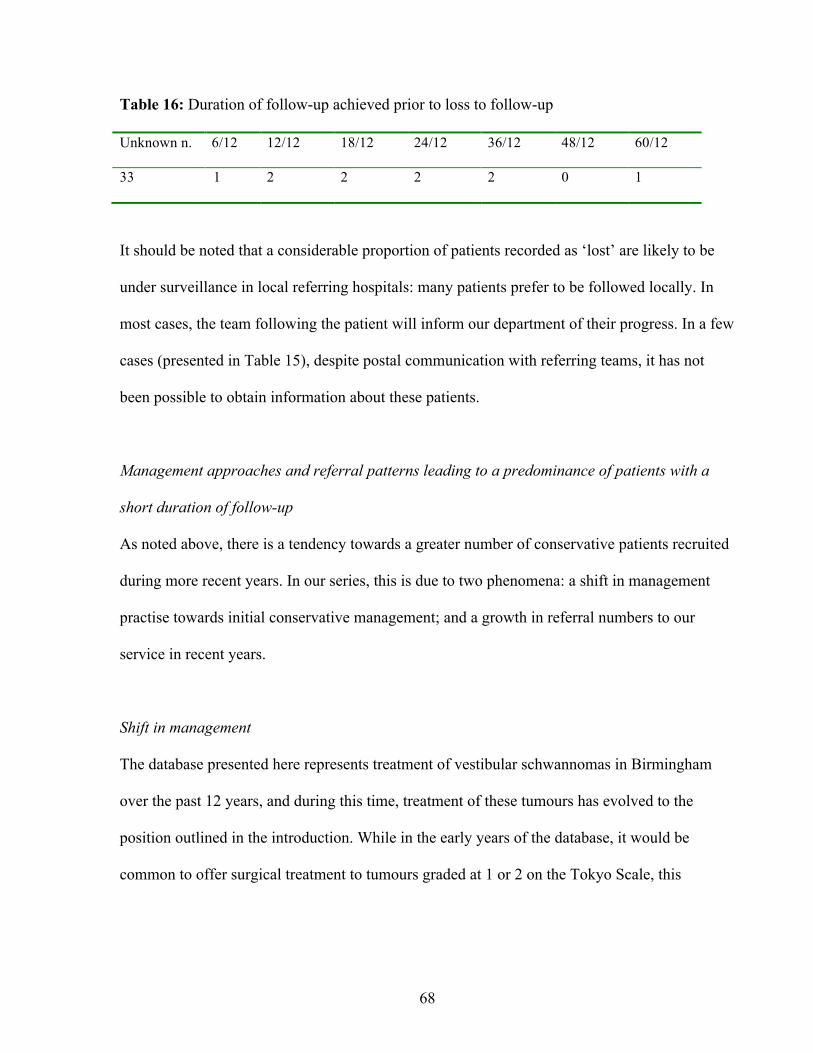
68
Table 16: Duration of follow-up achieved prior to loss to follow-up
Unknown n. 6/12 12/12 18/12 24/12 36/12 48/12 60/12
33 1 2 2 2 2 0 1
It should be noted that a considerable proportion of patients recorded as ‘lost’ are likely to be
under surveillance in local referring hospitals: many patients prefer to be followed locally. In
most cases, the team following the patient will inform our department of their progress. In a few
cases (presented in Table 15), despite postal communication with referring teams, it has not
been possible to obtain information about these patients.
Management approaches and referral patterns leading to a predominance of patients with a
short duration of follow-up
As noted above, there is a tendency towards a greater number of conservative patients recruited
during more recent years. In our series, this is due to two phenomena: a shift in management
practise towards initial conservative management; and a growth in referral numbers to our
service in recent years.
Shift in management
The database presented here represents treatment of vestibular schwannomas in Birmingham
over the past 12 years, and during this time, treatment of these tumours has evolved to the
position outlined in the introduction. While in the early years of the database, it would be
common to offer surgical treatment to tumours graded at 1 or 2 on the Tokyo Scale, this

69
approach is now unusual unless the patient particularly requests definitive treatment. This
practise shift is demonstrated in Figures 3 and 4.
Figure 3: Evolution in management of intracanalicular tumours over time
0
10
20
30
40
50
60
70
80
90
100
1997-2000 2001-2004 2005-2009
Perc
entage
ConservativeSurgery or Radiotherapy
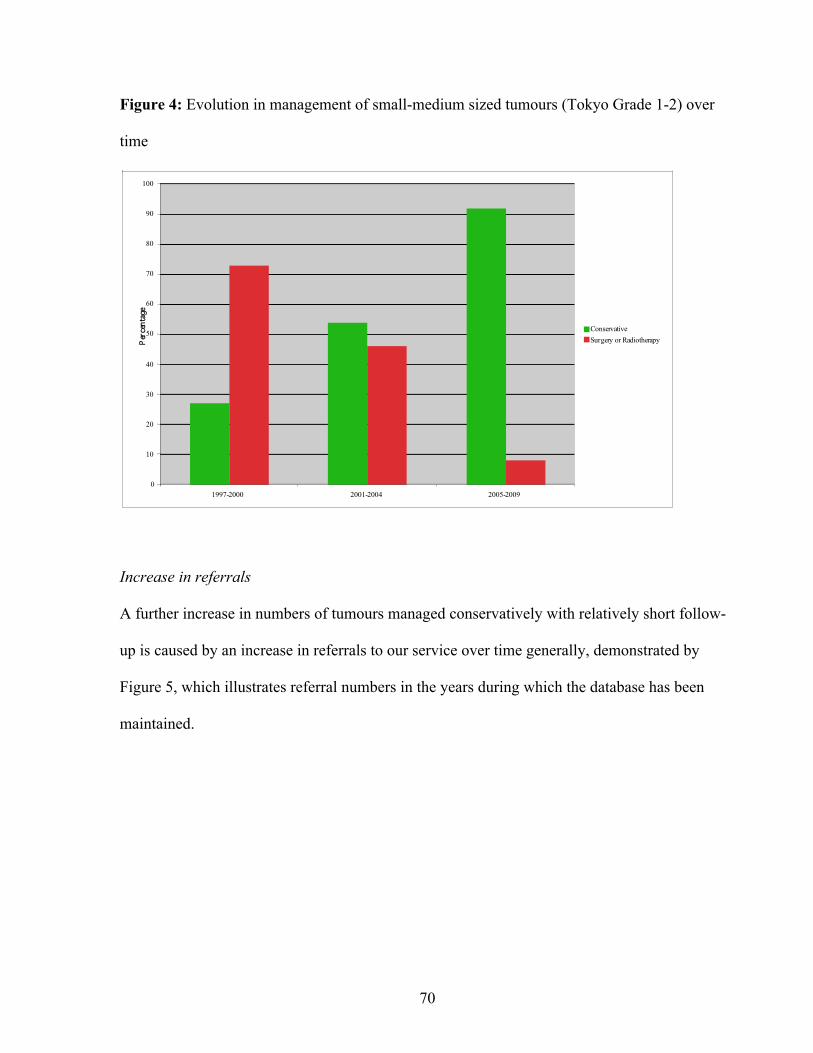
70
Figure 4: Evolution in management of small-medium sized tumours (Tokyo Grade 1-2) over
time
0
10
20
30
40
50
60
70
80
90
100
1997-2000 2001-2004 2005-2009
Perc
entage
ConservativeSurgery or Radiotherapy
Increase in referrals
A further increase in numbers of tumours managed conservatively with relatively short follow-
up is caused by an increase in referrals to our service over time generally, demonstrated by
Figure 5, which illustrates referral numbers in the years during which the database has been
maintained.

71
Figure 5: Increasing referrals to Birmingham Skull Base Unit 1997-2008
0
20
40
60
80
100
120
140
1997 1998 1999 2000 2001 2002 2003 2004 2005 2006 2007 2008
New Patients
Chapter conclusion
The aim of this chapter has been to characterise those patients undergoing conservative
management within the Birmingham Skull Base Unit, and to determine an accurate
understanding of the proportion of growing tumours among tumours managed conservatively
overall. It is recognised that, in common with other published series of conservatively managed
vestibular schwannomas, there is a predominance of patients with a relatively short duration of
follow-up, caused by an increasing referral base and a philosophical shift towards conservative
management in more recent years. The effect of this distortion is to suggest that a larger
proportion of tumours (75%) do not grow when watched, than that which is more likely to be
the case if longer-term follow-up is seen (66%).

72
An interesting observation seen in analysis of the characteristics of tumours managed
conservatively when compared to those managed with primary surgery or radiosurgery is that
these ‘less aggressive’ tumours are found to be more likely to present with a longer duration of
symptoms, and to present in male patients. The following chapter, analysing risk factors for
growth in observed vestibular schwannomas, will explore these issues further.

73
CHAPTER 2:RISK FACTORS FOR GROWTH IN WATCHED VESTIBULAR
SCHWANNOMAS
An analysis of factors predictive of growth in conservatively managed vestibular schwannomas
Introduction
Prediction of growth in vestibular schwannomas is of obvious clinical relevance. If the clinician
is able to say with certainty whether a particular tumour will or will not grow, s/he is in a
position to remove considerable uncertainty from the patient, and to expedite treatment if
required. The aim of this chapter is to analyse data relating to presenting symptomatology and
demographics in patients managed conservatively in order to determine whether any factors are
significantly predictive of growth.
Table 5 above summarises published series of conservatively managed vestibular
schwannomas. In a number of these series, an attempt has been made to determine risk factors
for growth. This chapter will explore whether the Birmingham experience reflects these
findings and discuss the clinical relevance of risk factors in management.
Methods
Data collection
The study is confined to patients undergoing conservative management as an initial treatment
modality, with the database updated in March 2010. Tumours were categorised as either
‘growing’ or ‘non-growing’. The former group included any patients who had shown a

74
sustained growth in tumour dimensions. In most cases, these patients are treated definitively
with either surgery or radiosurgery, but in a minority, conservative management is continued
because of either tumour factors (very slow growth) or patient factors (old age or co-
morbidities). Demographic data analysed consists of patient age at presentation and sex.
Tumour data includes tumour size at presentation, laterality and cystic versus non-cystic. In
considering tumour size, two analyses were carried out: the first compared intracanicular (ICan)
tumours with those extending to the cerebellopontine angle (CPA), the second comparing
different sized CPA tumours. Finally the study compared duration of symptoms between the
two groups of patients.
Although an analysis of the significance of different symptoms to growth or non-growth might
seem an obvious study to perform, this has not been attempted for a number of reasons.
Symptoms described by patients are numerous and often multiple: it would be very difficult, if
not impossible, to perform analyses which determined the significance of (for example) a
complaint of hearing loss and tinnitus in comparison to hearing loss and vertigo. A further
impediment is the subjective nature of symptoms and variable recording by clinicians recording
data during clinical assessment: duration of symptoms will be analysed, but it is recognised that
this is a subjective report from the patient and should be viewed as such.
As described in the previous chapter, there is a tendency to under-estimate growth rates if
patients with a shorter duration of follow-up are included in analyses. In this study, all patients
with at least one follow-up scan are included, accepting that there will be a small proportion of

75
tumours categorised inaccurately as ‘non-growing’. To exclude patients with less than 2 or 4
years follow-up would considerably reduce the power of the study.
Statistical analysis
Analyses were performed using SPSS 16.0 for Mac. A Chi-squared analysis was used for
categorical data, an independent samples T-test for continuous data.
Results
468 patients treated conservatively as an initial management plan were identified from the
database. Of these patients, some 47 are awaiting a second scan and are excluded. A further 43
patients have been lost to follow-up, defined as having not been seen in the outpatient clinic
within 1 year of an expected follow-up appointment. Of the remaining 378 patients, 101 (27%)
have demonstrated growth of some description, while 277 (to date) have not.
Demographic results
Demographic results are presented in Table 17. In both analyses, the groups are markedly
concordant, with no significant differences seen.

76
Table 17: Comparison of demographic data: tumour growth vs. tumour non-growth
Non-growing
tumours (n.=277)
Growing tumours
(n.=101)
Statistical analysis
Sex distribution F=135, M=142 F=46, M=55 P 0.58
Mean age (SD) 61 (12) 60 (12) P 0.83
Tumour results
Results for differences between the two groups in terms of tumour characteristics at
presentation are presented in Table 18.
Table 18: Tumour characteristics: tumour growth vs. non-tumour growth
Non-growing tumours
(n.=277)
Growing tumours
(n.=101)
Statistical analysis
Laterality L=139, R=134 L=54, R=46 p=0.82
Cystic vs. non-cystic Cystic=10 (4%)
Non-cystic=243
No record=24
Cystic=11 (12%)
Non-cystic=83
No record=7
p=0.02
Size (ICan vs. CPA) ICan=147 (54%)
CPA=125 (46%)
No record=5
ICan=34 (35%)
CPA=64 (65%)
No record=3
P=0.004
Size (CPA mean size) 1.2 (0.6) 1.2 (0.6) p=0.66

77
Duration of symptoms results
Results for differences in duration of symptoms between the two groups are presented in Table
19. There is a statistically significant association between a short duration of symptoms and a
tendency for tumour growth.
Table 19: Symptom data: Comparison of duration of symptoms between growth and non-
growth groups
Non-growing
tumours (n.=277)
Growing tumours
(n.=101)
Statistical analysis
Duration of
symptoms, months
(mean [SD])
66 (67) 40 (52) P 0.002
Discussion
Although there have not been any molecular biological studies examining the differing
characteristics of ‘static’ and ‘growing’ tumours that might identify, for example, particular
genetic events leading to a more aggressive phenotype, some recent studies have suggested that
angiogenesis may well play a part. Koutsimpelas (2007) compared vascular growth factor
expression in 17 sporadic vestibular schwannomas and was able to demonstrate that apparently
more ‘aggressive’ tumours (larger, with a shorter history of symptoms, and a denser
microvasculature) were associated with increased levels of angiogenic expression. This study
would suggest, and evidence of successful treatment of patients with advanced NFII with anti-
VEGF monoclonal antibody also implies (Plotkin, 2009), that angiogenesis is of importance in
determining tumour growth.

78
If this is the case - that some tumours are able to successfully stimulate angiogenesis while
others fail to do so and remain static - it is regrettably the case that there are no biochemical
markers available to the clinician that indicate angiogenic potential. It is, of course, not possible
to biopsy the vast majority of vestibular schwannomas without risking significant damage to
neighbouring structures, and the clinician is therefore compelled to seek clinical predictors of
growth potential such as those presented below.
Significant findings
In this study, a number of significant predictors of growth have been identified associated with
tumour characteristics and the duration of the symptoms reported by the patient. In terms of the
tumour, there is a tendency for ‘growing’ tumours to be extending into the cerebellopontine
angle at presentation, and for the tumour to be cystic. We have also demonstrated that the
symptoms a patient presents with are likely to be of a shorter duration than those in patients
with a static tumour.
The tumour characteristics identified are perhaps those that might be expected to be found.
Tumours that are found to extend to the cerebellopontine angle at presentation are generally
larger than those confined to the internal auditory canal (the majority of tumours originate
within the canal). If it is thought that tumours become static because a maximal viable tumour
size has been reached, it might be expected that tumours that have grown beyond the limits of
the internal auditory canal are those with potential to grow further. Clearly, a proportion of
growing tumours will be identified that are growing, but have not yet had time to reach the
79
cerebellopontine angle. Of note, there is no association between growth and the size of the
tumour within the cerebellopontine angle: this would suggest that if there is a ‘terminal’ tumour
volume (i.e. a volume beyond which tumours no longer grow), this can be relatively large,
suggesting that conservative initial management of cerebellopontine tumours is a reasonable
treatment option.
The strong association between tumour growth and cystic degeneration is also perhaps to be
expected. Chapter 4 below will discuss in greater detail growth patterns in cystic tumours, but it
is well-recognised (Benech, 2005) that cystic tumours show a propensity for rapid growth due
to intra-cystic haemorrhage. It may be conjectured that a characteristic of a rapidly growing,
‘aggressive’ tumour is to have a more loosely organised arrangement of Antonini Type B cells:
Nager (1993) has observed that these cells are prone to micro-cystic degeneration.
The observation that tumours are more likely to grow if they present with a short duration of
symptoms is intuitive. As awareness of the importance of unilateral otological symptoms
increases among physicians of all types, it is to be expected that a significant number of patients
will be identified with a very long history of symptoms. In our database, 22% of patients
present with reported symptoms of at least ten years duration: it is to be expected that a
disproportionate number of this group of patients have indolent or static tumours. On the other
hand, while there is a statistically significant association between a short duration of symptoms
and growth, there is a large number of patients with a short history of symptoms who do not
subsequently manifest growth; the converse is also the case (this is reflected by the large
standard deviation figures seen in Table 19). Thus, of the 67 patients with a history of one year
80
or less, 56 do not manifest growth at subsequent follow-up, and of the 70 patients in our
database with symptoms for longer than 10 years, some 7 have demonstrated growth to date.
It is interesting that we have not been able to demonstrate any significant association between
tumour growth and female gender. As observed above, there is a historical tendency to see
vestibular schwannomas as more commonly found in females with a ratio of 2:1 (Zülch, 1986,
cited by Nager, 1993). This is not supported by our own database, and the large Danish
database (Stangerup, 2009, personal communication): in these and other databases, there is an
almost equal female: male sex distribution. In Chapter 1 we demonstrated an association
between the female gender and more aggressive tumours that require definitive treatment as an
initial management option.
It could be speculated (as above, see Introduction), that the reason for the traditional belief that
vestibular schwannomas were more common in women than men could arise from the fact that
tumours that historically presented to clinicians were those that grew beyond a certain size and
therefore presented with significant symptoms; a situation more commonly found in female
than male patients. If this were the case, we might expect to see a relatively high proportion of
female patients within the group demonstrating tumour growth. The fact that we have not been
able to demonstrate such an association calls into question the validity of the above theory.
Comparison with other studies
Studies assessing risk factors for tumour growth are presented in Table 5. There is a general
concordance with our own findings: Malhotra (2009), Ferri (2008), Hajihoff (2008), Stangerup

81
(2006), and Battaglia (2006) have all demonstrated an association between larger tumours and
growth. Symptomatology is less frequently investigated, but El-Bakkouri (2009) and Ferri
(2008) have both found similar outcomes to those we have demonstrated in this study.
Clinical applicability of the study
If we have been able to identify some significant predictors of tumour growth potential, does
this enable more effective clinical decision making? At present, our practice is to monitor
almost all tumours that are less than 2cm in the cerebellopontine angle: those that are seen to
grow are treated definitively. To predict with certainty that a particular tumour is at risk of
growth would reduce anxiety on the part of the clinician and patient, would conserve resources
and allow prompt treatment. It is well recognised that surgery is more prone to complications in
larger tumours (Gormley, 1997, Kaylie, 2001, Mamikoglu, 2002), and there would be benefit in
allowing treatment of tumours before a period of observation allowed growth to take place.
While we have determined that there are statistically significant associations between certain
clinical features and a tendency to grow, it is not clear that these associations are strong enough
to warrant a change in the management outlined above. As has been seen, while patients with a
short history of symptoms are statistically more likely to demonstrate growth over time, there is
also a large number of patients with a short history of less than one year who do not manifest
growth. Similar observations can be made about tumour size: although tumours that are
diagnosed within the internal auditory canal are less likely to demonstrate growth than those in
the CPA, there are a large number of tumours that do not follow this pattern.
82
Were the risks of conservative management more significant (if, for example, there was a
recognised risk of patients demonstrating rapid and life-threatening growth while under
observation), then the associations demonstrated above might be more clinically applicable. In
such a case, it would be useful to identify those tumours presenting the lowest risk of growth,
and reserving these only for a careful conservative approach: the topic of whether harm is
caused by conservative management will be addressed in Chapter 4 in this thesis below.
If in most cases, the risk factors identified are not powerful enough to warrant an abandonment
of conservative management, it would be reasonable to use these indicators in order to guide
management in cases that present a dilemma. Thus, with a tumour at the upper limit of what
might usually be considered acceptable for an initial period of observation (extending 2cm into
the CPA, for example), the clinician may be prompted to offer early intervention if the patient
has a short history of symptoms, or to advise observation if the history is long. Cystic tumours
represent a further dilemma: in our experience, these are particularly prone to growth: their
management will be discussed in greater detail below in Chapter 5 of this thesis.
Chapter Conclusion
This study has demonstrated (in common with published reports), that there is a statistically
significant association between tumour growth and a number of clinical findings. While these
associations may not allow a clinician to predict with certainty whether a tumour is likely to
demonstrate growth, they do allow an informed discussion with the patient and, in cases that
present management dilemmas, may help direct treatment.

83
CHAPTER 3: HEARING LOSS AND PRESERVATION IN WATCHED VESTIBULAR
SCHWANNOMAS
A presentation of the evolution in hearing in watched patients with vestibular schwannomas, an
analysis of risk factors for deterioration or preservation and a discussion of outcome reporting
methodology.
Introduction
Hearing loss is the most common presenting symptom troubling patients with vestibular
schwannomas, affecting 89% of the patients in our database. Furthermore, the management of
the hearing patient with a vestibular schwannoma is a source of considerable controversy
among surgeons and physicians treating patients with these tumours. The aim of this chapter is
to explore issues related to the natural history of hearing loss based upon data recovered from
the Birmingham database.
In particular, attention will be paid to those patients who present with a small tumour and
relatively normal or ‘near-normal’ hearing: the management of these individuals is particularly
controversial. The study will thus focus upon individuals with Class A and B hearing (AAO-
HNS Classification [see Table 6, Introduction]) treated with conservative management. In
addition, an analysis will be made of initial hearing levels among all patients presenting with a
vestibular schwannoma, identifying whether any risk factors dictate the severity of hearing loss
at presentation.
84
While a number of publications have addressed the evolution of hearing in observed patients
with vestibular schwannomas, (see Table 7) a clear view of the natural history of hearing loss is
only slowly emerging. In many cases, hearing outcomes are presented as secondary (to, for
example, growth), with a consequent lack of clarity with respect to important issues such as
duration of follow-up. In other cases, definitions of ‘hearing preservation’ employed obscure a
clear understanding: this chapter will address these issues and propose an alternative means of
describing hearing preservation to that of ‘preservation within class’.
Methods
Analysis of hearing loss at presentation
Audiological assessment
All patients in the Birmingham Database in March 2010 were included in this component of the
study. Patients are routinely investigated with both pure tone audiometry (PTA) and speech
discrimination testing (SDS) at the time of their first visit to our department. Audiological data
were recovered from patient records. With respect to pure tone audiometry (PTA), a mean of
dBHl at 0.5, 1, 2 and 3 KHz was calculated, using masked bone conduction if performed.
Speech discrimination studies (SDS) were recorded as the maximum percentage of words
correctly identified, as indicated by the AAO-HNS classification system. Demographic data are
recovered as previously described, as are data pertaining to tumour size.
Statistical analysis
Data were analysed using SPSS for Mac 16.0. For the comparison of means (duration of
symptoms, age) an independent samples t-test was employed. To analyse categorical data

85
(gender, tumour types, treatment offered), a Pearson Chi-square test is used. A p-value of <0.05
is taken as evidence of a significant difference in results.
Analysis of patients presenting with ‘serviceable’ hearing and undergoing initial conservative
management
Patients
Patients initially managed conservatively and presenting with a pure tone average (PTA, mean
of thresholds at 0.5, 1, 2 and 3 [calculated as mean of 2 and 4 kHz]) of 50dB or less and the
potential for 24 months follow-up were identified from the Birmingham database (updated in
March 2011). Although speech audiometry is recorded routinely at presentation, it is not
recorded routinely in follow-up due to resource pressures, and this audiometric data is not
included in the study. Routine demographic and tumour data were recorded as was the duration
of follow-up, defined as the time (in months) between the initial audiogram at presentation and
the most recent recorded. Patients were excluded from the study if there were no available
audiometric data following presentation.
In order to grade hearing deterioration, the rate of hearing loss relative to the contralateral ear
was calculated. This calculation is summarised below:
([Final PTA-Initial PTA]-[Final contralateral PTA-Initial contralateral PTA]) / duration of
follow-up

86
This calculation was used in order to allow (by inclusion of the contralateral hearing) for any
inter-test variability in addition to any presbyacusis-related hearing loss occurring. To allow
inclusion of cases where there was no contralateral hearing (n.=3), a mean annual fall in
contralateral hearing was calculated from the group as a whole. A further classification of
hearing preservation (largely for the purposes of comparison with other publications) was also
made, defined as preservation of class of hearing (accepting that a complete assessment of
AAO-HNS hearing class would require inclusion of speech audiometry values).
Data analysis
In the first instance patients with perfect hearing preservation (defined as the affected hearing
deteriorating less than or at the same rate as the contra-lateral ear) were studied with reference
to an equal number of patients with the poorest hearing preservation rates. In the second
analysis, the group as a whole were divided into two groups equally with respect to their rate of
hearing loss (see formula above). In both cases, groups were tested to determine an association
between demographic data, tumour size and levels of hearing at presentation.
Statistical analysis
Analyses were performed using the software SPSS 16.0 for Mac. Groups were compared using
either independent samples t-tests or chi-square tests as described above.

87
Results
Hearing loss at initial presentation
Findings are presented in Table 20. Of 729 patients registered on the database, 601 had
sufficient data for analysis.
Table 20: Hearing levels at presentation: factors predictive of Class A/B or Class C/D hearing.
Hearing level at
presentation
Age: mean
(years) and
SD
Sex Duration of
symptoms prior
to presentation:
mean (months)
and SD
Tumour
characteristics
(intracanalicular or
extending to
cerebello-pontine
angle)
Treatment
offered at first
presentation
Class A or B (PTA
≥50 dBHL and
SDS ≥50% max.)
n.= 311
53.3 (13) M: 49%
F: 51%
34.5 (38) IAC: 41%
CPA: 59%
Conservative:
68%
Surgery: 26%
Radiotherapy:
5%
Class C or D (PTA
or SDS <50 dBHL
or <50% max.
SDS) n.=290
60.6 (12) M: 50%
F: 50%
65.6 (70) IAC: 28%
CPA: 72%
Conservative:
66%
Surgery: 29%
Radiotherapy:
3%
Cases without audiological data are presented in Table 21.
Table 21: Patients without audiological data at presentation (Total n. 128)
Large tumour
at presentation
Recent addition to database
(proforma only without
audiological data)
Private
patients
Others (cause
unknown)
n. patients 21 35 7 65

88
In some cases, tumours were large at presentation (n. >3cm CPA=21), and it is suspected that
because surgery (which would be hearing-destroying) was planned, it was not felt worthwhile to
perform an audiogram. In a number of cases (n. 7), patients are treated privately, and full data
may not be available. A further group of patients are initially registered using a proforma that
does not record audiological data (n. 35). Subsequently, fuller data from patient records are
added. It is not anticipated that the latter two groups should significantly bias results, but it
could be argued that the group presenting as an emergency (usually too unwell to undergo
audiological
tests and with other priorities) may represent a group with specific characteristics that contribute
a (numerically small) bias to the study.
Table 20 records a number of significant findings. From this data, it would seem that patients
with better hearing are younger, have smaller tumours, and suffer with their symptoms for a
significantly shorter duration than their counterparts with poorer hearing. These findings will be
discussed below.
Patients presenting with ‘serviceable’ hearing and undergoing initial conservative
management
Patients
196 patients were identified initially. Of these, some 132 had sufficient data for further analysis.
Of those patients without sufficient data (n. 64), 23 were removed from our conservative
management protocol due to tumour growth before follow-up audiometry could be performed.
18 further patients were seen in our department at initial presentation, and then followed-up in

89
their local hospitals: attempts are made to recover data in these cases, and if possible, data are
included in the study. In these 18 cases this was not possible. For the remaining 23 patients no
clear reason can be found for a lack of follow-up data. Of the 132 patients studied, 112 (84%)
had full audiometric data available for analysis (defined as an audiogram recorded at
presentation and at the most recent follow-up visit as determined by our follow-up protocol). In
these 20 cases of incomplete follow-up, the most recent available follow-up audiogram is
included in the study. The demographic and tumour factors of the 132 patients included are
presented in Table 22.
Table 22: Demographic and tumour data
Sex Age, years: mean (range)
Tumour size: Intracanicular only n.
Tumour size: Dimensions in cerebellopontine angle (CPA)(mean, range)
F: 63 M: 69
55 (25-82) 78 11mm (2-22)
Within the group, 8 patients demonstrated growth after an initial period of conservative
management and were treated definitively (this in addition to the 20 patients described above).
A further 15 patients demonstrated growth but remained within the conservatively managed
cohort.
Hearing preservation
In the group as a whole, 39 (30%) patients preserved hearing when defined as preservation of
hearing in the affected ear at the same level or better than that in the contralateral ear. If hearing
preservation is defined as preservation of hearing in the same class as at presentation, then 77
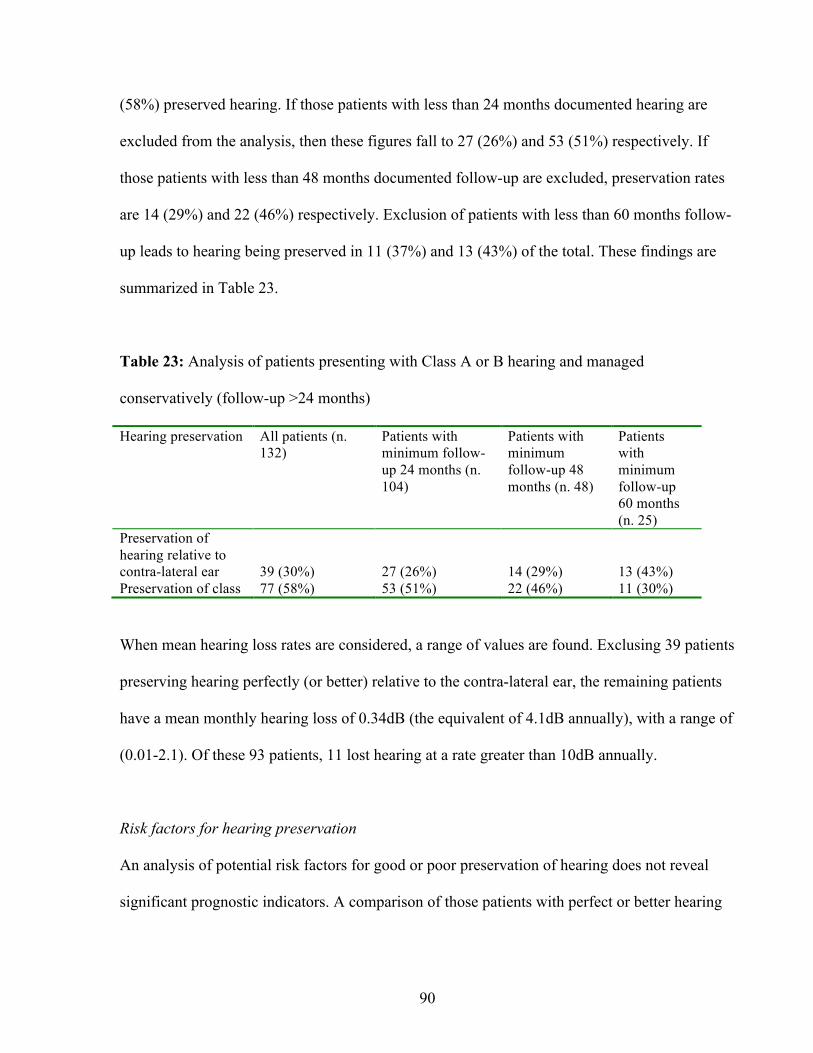
90
(58%) preserved hearing. If those patients with less than 24 months documented hearing are
excluded from the analysis, then these figures fall to 27 (26%) and 53 (51%) respectively. If
those patients with less than 48 months documented follow-up are excluded, preservation rates
are 14 (29%) and 22 (46%) respectively. Exclusion of patients with less than 60 months follow-
up leads to hearing being preserved in 11 (37%) and 13 (43%) of the total. These findings are
summarized in Table 23.
Table 23: Analysis of patients presenting with Class A or B hearing and managed
conservatively (follow-up >24 months)
Hearing preservation All patients (n. 132)
Patients with minimum follow-up 24 months (n. 104)
Patients with minimum follow-up 48 months (n. 48)
Patients with minimum follow-up 60 months (n. 25)
Preservation of hearing relative to contra-lateral ear
39 (30%)
27 (26%)
14 (29%)
13 (43%)
Preservation of class 77 (58%) 53 (51%) 22 (46%) 11 (30%)
When mean hearing loss rates are considered, a range of values are found. Exclusing 39 patients
preserving hearing perfectly (or better) relative to the contra-lateral ear, the remaining patients
have a mean monthly hearing loss of 0.34dB (the equivalent of 4.1dB annually), with a range of
(0.01-2.1). Of these 93 patients, 11 lost hearing at a rate greater than 10dB annually.
Risk factors for hearing preservation
An analysis of potential risk factors for good or poor preservation of hearing does not reveal
significant prognostic indicators. A comparison of those patients with perfect or better hearing

91
preservation relative to the contralateral ear (n. 39) (referred to as ‘Group 1’ in Table 24) with
the 39 worst ‘performing’ individuals (Group 2) demonstrates statistically insignificant
differences in terms of presenting hearing levels and tumour size. These findings are repeated if
the analysis is expanded by dividing the patients into two equally sized groups of hearing
‘preservers’ and hearing ‘losers’ (Groups 3 and 4) (see Table 24 for details).
Table 24: Analysis of potential risk factors for hearing preservation/degradation
Sex Age (mean) PTA at
presentation
Tumour size1
Group 1 vs.
Group 2
47% female
47% female
P 1.0
54.6
58.4 P 0.12
28dB
30dB P 0.46
47% small
47% small
P 1.0
Group 3 vs.
Group 4
48% female
47% female
P 0.86
54.3
55.8 P 0.46
28dB
29dB P 0.90
54% small
57% small
P 0.86
1. Tumour size is assessed by comparing intracanalicular tumours with those extending to the
cerebellopontine angle, with the latter considered large tumours. In six cases, initial data with respect to
tumour size were not available.
Tumour growth as a risk factor for hearing preservation
Tumour growth is a difficult parameter to study: many growing tumours sustain only very short
follow-up, and as detailed above, a significant proportion lack follow-up data. Of those patients
who have been followed and have undergone definitive treatment due to tumour growth (n. 8),
two retained perfect hearing prior to definitive management. A more interesting group are those
patients who have growing tumours that do not receive definitive treatment, but remain under

92
observation: in our study, some 15 patients have been followed in this way, with a mean follow-
up of 47 months (range 16-140). Of these, two patients followed for 21 and 140 months have
preserved perfect hearing relative to the contralateral ear, while the remaining 13 patients have a
mean hearing loss of 0.5 dB/mth, equivalent to 6 dB annual hearing loss, suggesting that this
group are a little more likely to lose hearing than the group as a whole, but that hearing loss is
not inevitable.
Discussion
This study has examined hearing data drawn from the Birmingham database: the aim of this
discussion will be to situate this data within the context of the world literature (summarised in
Table 7, Introduction).
Hearing loss at original presentation
To the author’s knowledge, this subject has not been addressed in the literature to date. Studies
that assess hearing outcomes (see Tables 7, 8 and 9 Introduction) will generally focus upon
outcomes from a particular treatment modality (i.e. surgery, radiotherapy or conservative
management), rather than upon the group of patients as a whole. Our findings are twofold: we
have demonstrated that patients presenting with poorer hearing are those with a longer duration
of symptoms, and are older than those patients who present with either Class A or B hearing.
While this finding is perhaps intuitive given the natural history of vestibular schwannomas, it
suggests that hearing loss is a gradual, progressive phenomenon rather than a rapidly
progressive or abrupt process.

93
Hearing preservation and deterioration in conservatively managed patients presenting with
serviceable hearing
The study of the evolution of hearing in conservatively managed patients is more thoroughly
addressed in the world literature. Some of the methodological difficulties with these studies
have been discussed previously in the introduction to this thesis, but it is worthwhile re-iterating
these briefly here:
-studies rarely clearly describe follow-up duration, frequently offering only a
mean figure and not distinguishing between those in the cohort with a long follow-up and those
with short follow-up. The effect of this is to allow the inclusion of a significant number of cases
with very short follow-up and misleadingly ‘good’ hearing preservation.
-this effect is enhanced by the use of ‘preservation within class’ as a methodology for assessing
hearing preservation.
A close examination of published data illustrates this effect: Grayeli (2005) details hearing
results at serial visits: thus at the first visit, 41% of 105 patients tested have useful hearing
(Class A or B), but by the 6th visit, only 8% of 13 patients fall into this category. Ferri’s paper
suggests a similar phenomenon: patients with preservation of hearing have a mean follow-up
period of 44 months, whereas those with deterioration have a mean follow-up of 80 months.
Clearly, if all patients show a gradual deterioration in hearing and the measure for
‘preservation’ is maintenance below a threshold (30 or 50dB), time of observation will be the
most important determinant of hearing preservation. Our own study demonstrates this
phenomenon (see Table 23).

94
We have found a rate of hearing loss to be a more useful outcome measurement. In addition, we
have included a measurement of hearing in the contralateral ear in order to control the study.
This is both to control for the effects of presbycusis and also to allow for inter-test variability
(either due to patient, audiologist or device factors). Using this approach, we have demonstrated
that a significant proportion of patients (25-35%) seem to preserve hearing perfectly while
under observation: we would argue that this figure may remain stable over longer follow-up. A
further 19% of the group as a whole lose hearing at a slow rate of less than 1dB annually. 10%
lose hearing rapidly, at a rate of at least 10dB annually.
We have been unable to identify any significant prognostic factors for hearing preservation.
Sughrue’s review found an association between tumour growth and a lack of hearing
preservation. Our study of a small number of growing tumours that are observed (n.15) would
reinforce this finding: this group has a reduced rate of perfect hearing preservation (13%),
coupled with an elevated rate of hearing loss among those with deteriorating hearing levels (6.3
dB annually).
Stangerup (2008) identified an association between perfect hearing at presentation, and hearing
preservation over time. This paper defines ‘preservation’ as retention of AAO-HNS class of
hearing, and an examination of our data illuminates potential confounding factors when using
this approach: of 22 patients in our group presenting with 100% speech discrimination, some 6
(30%) are seen to preserve hearing relative to the contralateral ear, with the remaining patients
losing hearing at a rate of 4.1dB relative to the contralateral ear. This finding is entirely

95
consistent with the hearing preservation seen within the group as a whole. In contrast, 16 (80%)
preserve hearing if defined as preservation of AAO-HNS class: with limited follow-up, patients
presenting with perfect hearing who lose hearing progressively at a rate of 4.1dB annually will
retain Class A hearing for a number of years. We would argue that such patients should not be
described as ‘preserving hearing’.
Lack of complete data represents a significant risk of bias in the presentation of case series, and
we have made an attempt to clarify as much as possible any missing data within our study. We
have taken as an initial patient group all those individuals presenting with hearing levels of
≤50dB: from this group a significant proportion (33%) do not have further data available to us
for study. As detailed above, these patients fall into three groups: those followed in other
centres, some with growing tumours and a number for who no identifiable cause can be found
to explain a lack of data. Finally, we have also identified a smaller group of patients with partial
data (a further 16%): in these cases, audiometric follow-up is available but this does not extend
until the most recent clinic visit as determined by our protocol for surveillance.
In some cases, we feel that bias is likely to be introduced due to these missing data. Our own
study, in addition to Sughrue’s review would suggest that growing tumours have a tendency to
lose hearing more rapidly than static tumours, and the lack of data with respect to these tumours
should have the effect of ‘up-regulating’ rates of hearing preservation. On the other hand, we do
not anticipate that the tumours followed in regional hospitals differ from those followed in our
tertiary centre, and would suggest that this group of patients do not represent a significant
source of bias. Those patients with a lack of data for no clear reason may either up- or down-

96
regulate outcomes: it may be that audiometry is not performed because hearing is unchanged, or
because it is unrecordable.
If our study does document regrettable lapses in complete data collection, other studies also
have similar flaws. Stangerup offers a very clear description of missing data (presented in Table
2 of Stangerup, 2009), characterizing ‘ideal’ and ‘actual’ follow-up. Thus, for the 125 patients
within his study that have potential for 5 years audiometric follow-up, only 67 (54%) have been
followed for 5 years. Similarly, Flint describes 22 patients with serviceable hearing at
presentation, but reports only 15 (68%) available for analysis. Even in a rigorously-maintained
cohort study, such as that reported by Hajioff, 9 of 49 (18%) of patients followed do not have
audiometric results available for analysis.
Chapter Conclusion
The management of the patient with a small to medium sized vestibular schwannoma (i.e.
intracanicular tumours and Tokyo Class 1 and 2) with good hearing at presentation is subject to
controversy. While clinicians may dispute the upper size limit of lesions appropriate for initial
conservative management, there is a developing consensus that a considerable proportion of
tumours do not grow over time, and that initial observation is a reasonable treatment option.
There is also an increasing awareness that hearing deteriorates gradually in the majority of
patients treated conservatively, often apparently independently of tumour growth. A synthesis
of these two principles has led some to argue that an early intervention to ‘save’ hearing before
it deteriorates inevitably offers the patient the best opportunity for hearing preservation, despite
an accepted risk of losing hearing due to either surgical or radiosurgical intervention.

97
In our experience between one quarter and one third of patients who do not have growing
tumours can expect their hearing to remain stable with respect to the contralateral ear. A further
one fifth will have a very slowly evolving hearing loss, and one tenth are likely to lose hearing
rapidly. Of those that do loose hearing, the mean annual loss we have seen is 4.1dB with a
(range of 1-25dB). Patients with growing tumours are more likely (but not guaranteed) to lose
hearing at a greater rate than those with static tumours. Beyond this weak association (not
proven statistically due to inadequate data for analysis), there would seem to be no statistically
significant risk factors for hearing loss or preservation.
The author suggests that this data is novel in the literature to date. Hitherto, authors have either
presented their data in terms of ‘preservation in class’ or in terms of mean hearing loss. As
described above in detail (and demonstrated using our own data), a ‘preservation within class’
description is liable to lead to a confounding increase in a rate of preservation if follow-up is
limited. Similarly, a mean rate of hearing change (as cited by Hajioff, 2008 and Malhotra, 2009)
offers only a limited understanding of likely outcomes if there is significant variation within the
group: the author would argue that these data offer firmer direction to patients considering the
likely evolution of hearing if their vestibular schwannoma is observed.

98
CHAPTER 4: AN INTENTION TO TREAT ANALYSIS OF CONSERVATIVE VERSUS
SURGICAL MANAGEMENT OF VESTIBULAR SCHWANNOMAS
A case-control study comparing facial nerve preservation in patients managed by either initial
conservative or initial surgical management. This chapter represents an updated version of a
study published previously by the author in the journal ‘Clinical Otolaryngology’ (Martin,
2008).
Introduction
Central to this thesis is the concept of conservative management of vestibular schwannomas: a
management strategy that allows the study of tumour growth patterns and their secondary
consequences, such as the progression of hearing loss in watched lesions. The data presented
here is critically dependent upon the accumulation of a significant database of ‘watched’
patients with growing or static tumours: without the management strategy outlined in the
introduction to this thesis, this database would not have been developed.
It is important to recognise, however, that conservative management remains a debated strategy.
Traditionally, the strategy has been seen as one that should be reserved for elderly patients or
those who are unfit for surgical treatments due to medical comorbidities (Nedzelski, 1986). As
recently as in 2005, in a ‘meta-analysis’ of conservative management – more accurately
described as a compendium and summary of published case series - published in Laryngoscope
(the leading international journal of otolaryngology), the technique was described as
‘controversial’ (Smouha, 2005).

99
‘Wait and scan’ or ‘conservative’ management was initially proposed in the mid-1980’s
(Nedzelski, 1986) and has become increasingly accepted (among some clinicians) over the past
two decades. As described elsewhere in this thesis, in our department conservative management
takes the form of an initial clinical assessment when the patient is seen with the diagnostic MRI
scan. If the tumour is small or medium sized (<2cm in the cerebellopontine angle (CPA)), and
the patient agrees, the scan is repeated after an observation period of 6 months dating from the
initial scan. Thereafter, assuming the tumour has not grown, scans are repeated according to the
protocol described in the following chapter. Follow-up continues life-long. If the tumour
demonstrates evidence of growth (generally a change in maximal diameter of >2mm annually),
then definitive treatment is offered (surgery or radiotherapy). The attractions of conservative
management as a strategy are obvious: in a case where a tumour does not grow, a patient avoids
a major otoneurological procedure that requires a protracted recovery period with considerable
morbidity attached. Following this argument, it would seem logical to pursue an initial period of
observation in all patients whose tumours are not of a size that demand urgent removal due to a
high risk of incipient intra-cranial complications.
There are, however, counter arguments to this approach, which focus on the increased growth of
the tumour during the period of observation. It is well-recognised that the rates of facial nerve
paralysis for all types of vestibular schwannoma surgery increase with size of tumour (Gormley,
1997, Kaylie, 2001, Mamikoglu, 2002), and it follows from this observation that patients who
have been ‘watched’ and ‘failed’ conservative management will suffer more complications than
those who undergo an operation at the earliest opportunity. It is also recognised that hearing can

100
deteriorate while patients are under observation (see Chapter 3), and observed patients are at
risk of missing an opportunity for hearing preservation surgery. Furthermore, it is argued that
growth in acoustic neuromas is unpredictable, and it is unsafe to leave a tumour in a young
patient untreated that may grow sporadically at an unspecified time in the future, perhaps long
after the patient has been lost to follow-up. Advocates of early surgical intervention often cite
these arguments when suggesting that conservative management should be reserved for those
patients who are elderly or unfit for ‘definitive’ (i.e. surgical or radiotherapeutic) management
(Meyer, 2006).
Regrettably, no randomised studies exist that compare the efficacy of different management
techniques employed to treat vestibular schwannomas. In the absence of such studies, this
chapter presents a case-control study with an intention-to-treat analysis comparing the primary
surgical outcome in vestibular schwannoma surgery (facial nerve preservation).
Methods
Database
As previously, data are taken from the Birmingham Vestibular Schwannoma Database, updated
here in January 2010. Details of data collection and recording with respect to surgery and
conservative management are discussed in the introduction to this thesis (Introduction, section
‘Birmingham database of vestibular schwannomas’).

101
Study design: Intention-to-treat analysis
An ‘intention-to-treat’ analysis is one in which two or more treatment options are compared,
with analysis of results made based upon the initial treatment group allocated, even when
individuals in that group may have received treatment from another therapeutic arm. This form
of analysis is employed to prevent bias that may occur when high risk patients move from a
conservative management arm to a more interventional one. An example sometimes cited might
be an analysis of medical versus surgical treatment for ischaemic heart disease: some patients
(the high risk individuals), may begin in the medical arm and then move (due to treatment
failure) to the surgical arm: for the purposes of analysis, those ‘surgical’ patients must be
analysed with the ‘medical’ rather than the ‘surgical’ group, otherwise they will bias the
outcome in favour of medical treatment. In this study, patients who undergo conservative
management initially, but then demonstrate growth and are treated surgically are analysed in the
‘conservative’ rather than the ‘surgical’ arm.
Design of surgical and conservative ‘arms’
As discussed above in this thesis (see Introduction, section ‘Treatment, Conservative
Management’), patients undergoing initial surgical management are most commonly those
patients with tumours measuring greater than 2cm in the cerebellopontine angle (CPA), whereas
those undergoing conservative management are those that are either intracanicular (not
extending to the CPA, but located in the internal auditory meatus), or measuring less than 2cm
extending to the CPA. To devise arms that consisted solely of ‘initially surgically’ and ‘initially
conservatively’ managed patients would be misleading: those grouped in the surgical ‘arm’
would have presented with tumours of much greater size than those in the conservative arm and

102
their tumours would not have been suitable for conservative management, leading to a
irrelevant comparison.
In order to avoid this problem, only those patients treated with initial surgical management who
might have been eligible for conservative management are included in the study. To this end, all
patients with tumours measuring <2.5cm in the CPA are included in the surgical arm:
historically in our department, these patients were managed more aggressively than at present.
An upper limit of 2.5cm was chosen because this allows the maximum number of surgical
patients to be studied while allowing for appropriate conservative ‘control’ subjects.
The conservative arm of the study is designed in order to match the surgical arm described
above, with priority in matching given to those two factors - tumour size and duration of
follow-up – that are considered most likely to be of relevance to the study. Tumour size is of
importance because of the known association between surgical outcomes and tumour size,
follow-up duration because it is only through surveillance that change in tumour behaviour is
recognised with conservative management. Many more tumours of small-medium size are
managed conservatively than with initial surgical management, and therefore it is possible
match patients in this arm to those in the surgical arm.
Matching was carried out by ‘batching’ patients in groups according to tumour size, and then
selecting those patients with the longest duration of follow-up. Thus: in the surgical group, 13
patients were treated with CPA tumours that measured between 0 and 5mm. In order to find
conservatively managed matches, all those patients with tumours of that size were grouped and

103
the 13 patients with the longest duration of follow-up were chosen. The process was then
repeated with CPA tumours measuring 5-10mm, with the largest group of tumours measuring
20-25mm.
Data analysis
Facial nerve preservation rates are recorded according to the most recent clinical assessment
made, assuming this is at least 12 months following surgery (12 months is a standard reporting
time for facial nerve outcomes after surgical treatment and reflects the fact that nerve recovery
after surgery may not be maximal until this time has elapsed [Mamikoglu 2003]). If the most
recent data is less than 12 months following surgery, and the facial nerve outcome is greater
than grade II, the patient is excluded. In some cases, a good facial nerve outcome is recorded
relatively soon after surgery and thereafter not recorded: such patients are not excluded. In one
case, facial nerve rehabilitation has been carried out: in this case, the rehabilitated facial nerve
outcome is reported.
Conservatively managed patients are considered to have normal facial nerve outcomes unless
otherwise recorded, as are patients treated with radiotherapy. In both cases, an abnormal
outcome would be unexpected, and therefore it is not unreasonable to consider omission of the
information as indicative of normal facial function. In all cases, the most recent facial nerve
outcome (using the House-Brackmann scoring system [House, 1985]) is recorded.
104
House-Brackmann Facial Nerve Scoring System
The House-Brackmann System for grading the function of the facial nerve (House, 1985) is the
most commonly used among many available, and that employed in our department. Its strengths
include that it is relatively easy to apply, and consistent between assessors. A weakness is that
the six grades (I-VI with I representing normal function and VI representing complete lack of
function) are designed to enable the above described strengths rather than to reflect the severity
of the disability. Thus the severity of disability suffered in a move from grade I-II is unlikely to
be of exactly the same handicap as a move from grade III-IV. Equally, inter-patient effects may
be different: it may be that a twenty-year-old young woman would feel the effects of a grade II
palsy more acutely than a seventy-year-old man would suffer from a grade III palsy.
Unfortunately, there has not been a study validating the scoring system against patient self-
assessment, thus making quantification of handicap difficult.
Statistical analysis
The two arms of the study were compared for equivalence and assessed in terms of facial nerve
outcome using SPSS for Mac 1.6. The groups were compared in terms of patient demographics
(age and sex) and tumour size at presentation. Appropriate independent samples t-tests and chi-
square tests were used.
Statistical analysis of facial nerve outcomes differs considerably when compared to the
technique employed in the study published in 2008, with an improvement in methodology. In
the original study, groups were not matched, and comparison was made between facial nerve
outcomes for all conservatively managed tumours and surgically treated tumours that may have

105
been suitable for conservative management. A calculation was made to generate ‘expected’
facial nerve outcomes for conservatively managed patients with data drawn from the surgical
cohort. The ‘observed’ and ‘expected’ outcomes were then compared for equivalence. The flaw
with this approach was that our calculations treated the facial nerve grading system scores in a
manner appropriate for continuous but not ordinal data.
In the current study for this thesis, the means of testing facial nerve outcomes has been adapted
in order to make the calculations more appropriate for the assessment of ordinal data. Thus,
facial nerve outcomes are categorised as either representing a ‘good’ outcome (House-
Brackmann grades I or II) or a ‘less-than-good’ outcome (House-Brackmann III-VI). The
decision to classify
grades I and II as ‘good’ reflects other published studies of facial nerve outcome data
(Mamikoglu, 2003). The resulting data is then assessed for a statistically significant difference
with a Chi-square test.
Results
The study ‘arms’ are summarised in Figure 5.

106
Figure 5: Study arms
Surgical arm Conservative arm 217 patients underwent Initial group (matched for size to primary surgery surgical arm), n=94 100 suitable for conservative no growth: management n=59 included in study growth not requiring 2 patients awaiting intervention: n=7 surgery, 4 inadequate follow-up significant growth requiring treatment n=28 Total surgical arm= 94 Surgery n=16 Radiotherapy n=12 Surgical arm
From the database, 217 patients who had undergone primary surgical treatment of a vestibular
schwannoma were identified. Of these, 100 vestibular schwannomas were sized <2.5cm in the
CPA, and might have been considered eligible for conservative management. 2 patients had not
yet received treatment, and were therefore excluded from the study. A further 4 patients were
excluded due to inadequate follow-up. The 94 remaining patients are presented in Table 25. 75
patients in this group have a ‘good’ outcome (House-Brackmann I-II), 19 a ‘less-than-good’
outcome (House-Brackmann III-VI).
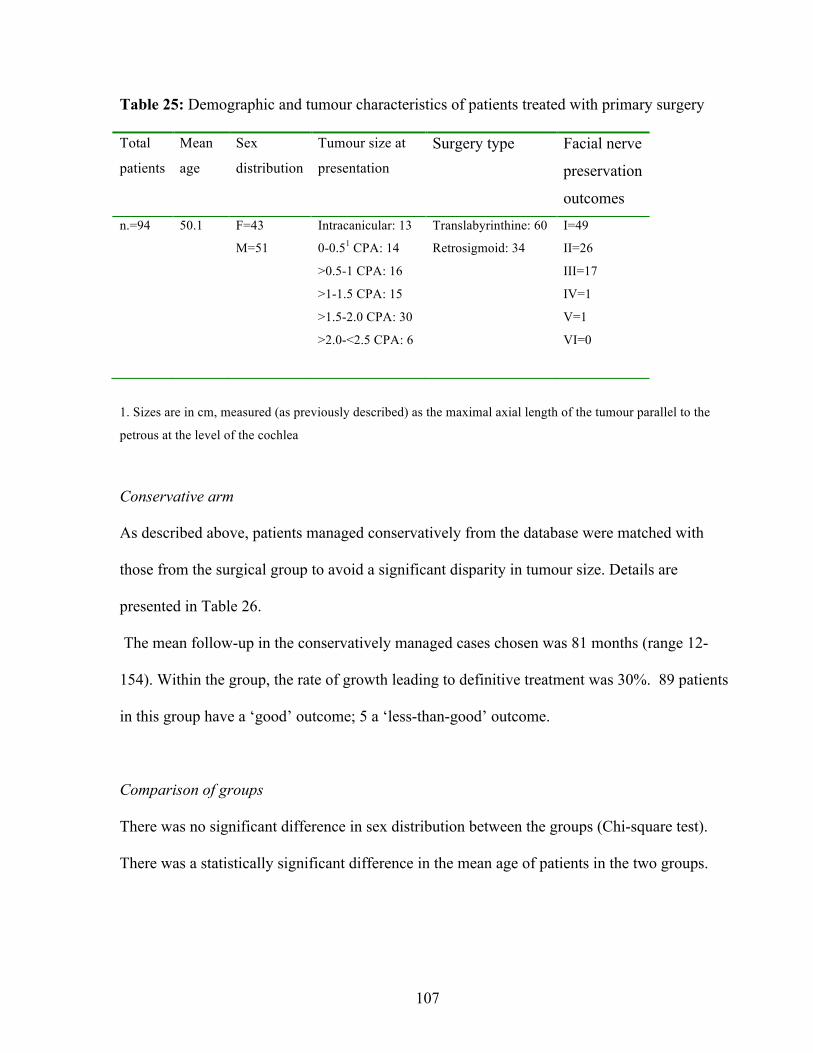
107
Table 25: Demographic and tumour characteristics of patients treated with primary surgery
Total
patients
Mean
age
Sex
distribution
Tumour size at
presentation
Surgery type Facial nerve
preservation
outcomes n.=94 50.1 F=43
M=51
Intracanicular: 13
0-0.51 CPA: 14
>0.5-1 CPA: 16
>1-1.5 CPA: 15
>1.5-2.0 CPA: 30
>2.0-<2.5 CPA: 6
Translabyrinthine: 60
Retrosigmoid: 34
I=49
II=26
III=17
IV=1
V=1
VI=0
1. Sizes are in cm, measured (as previously described) as the maximal axial length of the tumour parallel to the
petrous at the level of the cochlea
Conservative arm
As described above, patients managed conservatively from the database were matched with
those from the surgical group to avoid a significant disparity in tumour size. Details are
presented in Table 26.
The mean follow-up in the conservatively managed cases chosen was 81 months (range 12-
154). Within the group, the rate of growth leading to definitive treatment was 30%. 89 patients
in this group have a ‘good’ outcome; 5 a ‘less-than-good’ outcome.
Comparison of groups
There was no significant difference in sex distribution between the groups (Chi-square test).
There was a statistically significant difference in the mean age of patients in the two groups.

108
Table 26: Demographic, tumour and outcomes in conservative arm
Total patients Mean
age
Sex
distribution
Tumour size at
presentation
Outcome of
conservative
management
Facial nerve
preservation
outcomes
n.=94 61.6 F=43
M=51
Intracanicular: 13
0-0.5 CPA: 14
>0.5-1 CPA: 16
>1-1.5 CPA: 15
>1.5-2.0 CPA: 30
>2.0-<2.5 CPA: 6
No growth: 59
Minimal growth: 7
Growth requiring
further treatment: 28
(Surgery: 16
Radiotherapy: 12)
I=87
II=2
III=5
IV=0
V=0
VI=0
Those in the surgical group were younger (mean age 50 (SD 10) vs. 62 (SD 11)) than those in
the conservative group (p=0.000, CI -15 - -8). This difference in age between the conservative
and surgical groups studied reflects a general age bias towards youth in patients in our database
that are managed definitively at presentation (see Chapter 1, Table 10). It is not thought to be
relevant to the study undertaken here: to match for age would have necessitated a reduction in
duration of follow-up available to the conservative arm studied. Tumour size was a little larger
(mean 14mm vs. 13mm) in the surgical group, but this difference was not statistically
significant.
Mean facial nerve outcome: comparison between groups
Chi-Square test evaluating the difference between the groups in terms of facial nerve outcome
was highly significant (p=0.002).

109
Discussion
The aim of this study has been to compare outcomes between two different treatment modalities
used to manage small-medium sized vestibular schwannomas: primary conservative
management and primary surgical management. In the absence of any randomised, controlled
trials addressing the topic, a case-control study using an intention to treat design has been
developed. The cases are those patients undergoing surgical treatment for vestibular
schwannomas with controls (matched for tumour size) drawn from our database of
conservatively managed patients. Despite caveats to be discussed below, this study offers strong
evidence that initial conservative management (with appropriate secondary ‘definitive’
management) offers the best opportunity of facial nerve function preservation for patients
presenting with a small-to-medium sized vestibular schwannoma.
Limitations of the study
Retrospective design
As noted above, there are no prospective, randomised studies that explore this question. This is
perhaps understandable given the history of the topic. Initially, conservative management was
seen as a treatment suitable only for those with medical co-morbidities or advanced age: to
many practitioners, to randomise young healthy patients to a conservative treatment arm would
have been unethical. Subsequently, as conservative management became more acceptable,
randomisation to surgery would have posed similar ethical difficulties.
There are, of course, other benefits to a prospective study design. It would have been preferable,
for example, to submit patients to independent assessment of facial nerve function: there is an

110
obvious temptation for the assessor to upgrade outcomes, particularly if he is the operating
surgeon (as was the case in our study). In this study, any effect of such a bias would be negated:
there would be the same felt in both arms, hence reducing any impact.
Limited outcome measurement: lack of hearing data
In this study, we have only measured one outcome: facial nerve preservation. There are other
outcomes that could be considered, including hearing preservation, patient satisfaction and
economic considerations. Some of these issues have been previously addressed in the literature,
and will be addressed below. The previously published study (Martin, 2008) that forms the
basis of this chapter did address hearing preservation, and found a significant preservation of
hearing within the conservative group relative to those patients treated with hearing
preservation surgery. Table 27 reproduces these data.

111
Table 27: Original data relating to preservation of hearing (as published in Martin, 2008)
Patients managed conservatively at first consultation Patients managed surgically at first consultation
Total n. 59 (Class A n. 23, Class B n. 36)
Demographic characteristics at presentation:
Sex distribution: F 30, M 29
Tumour size: n. Intracanicular= 41
n. CPA= 18
Mean CPA= 0.9cm
Mean follow-up: 45 months
Total n. 30 (Class A n. 15, Class B n. 15)
Demographic characteristics at presentation:
Sex distribution: F 15, M 14
Tumour size: n. Intracanicular= 8
n. CPA= 21
Mean CPA= 1.0cm
Outcomes (includes growth patients):
n. with documented audiological follow-up: 41 (mean
duration of follow-up: 45 months)
(n. Class A =15, n. Class B=26)
Class A
n. preserving Class A hearing: 7
n. from Class A moving to Class B: 7
n. from Class A moving to Class C/D: 1
n. with no hearing: 0
Class B
n. preserving Class B hearing: 12
n. dropping to Class C or D: 13
n. rising to Class A: 1
n. with no hearing: 0
n. preserving hearing Class A or B: 26 (63%)
Outcomes:
n. with follow-up: 30
Class A
n. preserving Class A hearing: 1
n. preserving Class B hearing: 2
n. preserving Class C/D hearing: 2
n. with no hearing: 10
Class B
n. preserving Class B hearing: 2
n. preserving Class C/D hearing: 3
n. with no hearing: 10
Total n preserving hearing Class A or B: 5 (17%)
In this chapter, hearing preservation has not been addressed for a number of reasons. Most
importantly, to compare conservative and surgical management in this way is less appropriate
for this outcome than for facial nerve function. Chapter 3 has demonstrated that hearing loss in
conservative management is common and generally slowly progressive: most patients will lose
112
their hearing, but this end-point will often be delayed for a number of years. Patients who
undergo hearing preservation surgery will either lose their hearing immediately, or it will be
maintained: it is not expected to progressively decline at a greater rate following surgery than
that seen in presbycusis. To compare these two modalities with relatively short follow-up,
therefore, would seem a little disingenuous: the issue of hearing preservation is perhaps better
considered by examining a large cohort of conservatively managed patients (such as our own),
while also examining a large cohort of surgically-managed patients from the literature. An
observation made in our previous study and supported by data in Chapter 3 (see Table 24,
Chapter 3) is that only a small proportion of patients lose candidature for hearing preservation
surgery during the period of observation before tumour growth becomes manifest (n. 2 of a total
of 12 individuals).
Other outcome measurements
The psychological effect of a partial facial nerve palsy upon patients cannot be under-estimated.
Even those results classed as ‘good’ by the surgeon (House Brackmann grades II and III) may
be seen as disfiguring by patients. A recent survey of 2,372 members of the Acoustic Neuroma
Association (response rate 82%) who had undergone surgery for a vestibular schwannoma
found that 45% of patients experienced facial weakness post-operatively, and in 72% this was
permanent. 28% of all respondents to the survey felt significantly affected by facial weakness,
and 30% felt their quality of life had suffered following surgery (Ryzenman, 2005). Although
mortality is extremely rare in vestibular schwannoma surgery in the modern era, other
complications such as CSF leak post-operatively can be troublesome as can be symptoms such
as headache and imbalance.
113
The psycho-socio-economic cost to patients of vestibular schwannoma surgery has been studied
by Pritchard et al., (2003). These authors point out that many patients with vestibular
schwannomas are at the peak of their life-time earning power, and that a significant proportion
(34%) are unable to work for more than six months following surgery: they calculate the
economic cost to each patient at £11 220 each. Psychologically, 75% felt anxious about whether
‘they would ever be normal again’ and 39% of patients were depressed post-operatively; similar
findings were reported by carers of patients with acoustic neuromas. Another study
(Sandooram, 2003) comparing quality of life between patients undergoing conservative
management, surgery and radiotherapy found a significantly higher quality of life in
conservatively managed patients.
Chapter conclusion
This chapter reports a case-control study comparing facial nerve preservation rates in patients
managed with primary surgery and with primary conservative treatment. The study design
follows principles of ‘intention-to-treat’ reporting ‘failures’ of conservative management
undergoing surgery or radiotherapy within the conservative group. The study finds strongly and
statistically significantly in favour of conservative management with respect to preservation of
the facial nerve.

114
CHAPTER 5: A PROTOCOL TO DIRECT THE CONSERVATIVE MANAGEMENT OF
VESTIBULAR SCHWANNOMAS
A review of data in order to develop a protocol to enable safe and cost-effective conservative
management of vestibular schwannomas minimising superfluous investigation and loss to
follow-up. This chapter represents an updated version of a study published previously by the
author in the journal ‘Otology and Neurotology’ (Martin, 2009). The work presented here was
awarded a prize for the best trainee presentation at the British Skull Base Society Meeting
(London, 2010).
Introduction
Although the view is controversial, it has gradually become accepted by many clinicians that
conservative management can represent effective treatment to stand next to ‘definitive’
established treatments (surgery or radiotherapy), and is not merely a compromise therapy
reserved for those unfit for interventional management. The aim of this paper is not to discuss
the validity of conservative management per se, but rather to present a protocol to guide the
frequency of imaging follow-up employed.
Conservative management of vestibular schwannomas is evolving, and to date, little has been
proposed in the form of a protocol to guide clinicians with respect to the frequency and timing
of follow-up scans. Clearly, the priority is not to allow rapid tumour growth to pass un-noticed,
but at the same time, it is important to minimise unnecessary investigations with attendant costs
in terms of resources and patient time. In order to devise such a protocol, we have reviewed our

115
database of conservatively managed patients to determine temporal patterns of growth. We have
assessed the timing of detection of growth, and also sought trends in different rates of growth.
In approaching the study, a number of key questions are asked related to the timing of
monitoring radiological investigations. The first question pertains to the timing of the initial
scan following diagnosis: when should this be carried out in order to detect rapidly growing
tumours? The second to the timing of subsequent scans: how often should these be carried out?
Finally, it is important to consider whether scanning can be discontinued at any stage in the
management of patients with apparently stable vestibular schwannomas.
Methods
Historical surveillance regime
As previously outlined in this thesis, all patients with small or medium-sized tumours
presenting to the Birmingham skull base unit are offered an initial trial of conservative
management. Tumours fulfilling these criteria are either intracanalicular or ≤2 cm in maximum
diameter in the cerebellopontine angle (CPA). If the patient agrees, a follow-up scan takes place
at 6 months, then annually thereafter for 5 years. If a tumour is demonstrated to grow (defined
as growth of >2mm/yr. in maximal diameter, or persistent more indolent growth over a longer
timescale), the patient is offered expeditious intervention in the form of either surgery or
radiotherapy, dependent upon tumour and patient factors, hearing status, and patient preference.
In some cases, where patient and tumour factors indicate, surveillance continues.
116
Data collection
The Birmingham database of vestibular schwannomas carries data pertaining to all patients
managed in the above way from 1997-. As previously outlined, demographic data and the
outcomes of conservative management are recorded in the database, updated for the purposes of
this chapter in January 2010. Patients being managed with primary conservative management
were reviewed. Those awaiting a follow-up scan following diagnosis were not examined
further. A record of those lost to follow-up was made: this is defined as there being no record of
attendance within 6 months of an anticipated out-patient visit. The effect of this is to include
patients within this category who may have been followed for some time before being lost.
A record of the number of scans attended by each patient within the series of conservative
management was also made. It has been previously noted that within all series of conservatively
managed patients, there is a tendency for there to be many more patients with shorter, rather
than longer follow-up, and our series is no exception. A central argument within this chapter is
the redundancy of later scans in detecting tumour growth, and it is important to recognise that a
significant proportion of patients have been imaged at this stage within the series. It should be
recognised that these data are drawn from the duration of follow-up, rather than from an actual
calculation of attendances for radiological surveillance.
Patients who had demonstrated growth during observation were analysed further with the aim
of answering the following questions:
1. Did the tumour demonstrate growth during the time of surveillance?
117
2. If so, at what time following diagnosis was growth manifest?
3. What was the rate of growth seen?
Data pertaining to tumour growth are taken from patient records. As previously described
(Introduction), tumours extending to the CPA were measured in their greatest dimension
parallel to the petrous ridge. The records were searched to determine the timing of detection of
growth following the patient’s initial clinic presentation.
Results
Outcomes of conservative management
Table 28 presents details of patients considered during the study. Of 471 patients under
conservative management, some 421 had been seen at least once following diagnosis (50
patients are awaiting follow-up). From this group, 99 patients had demonstrated tumour growth
over time. It should be noted that not all of these patients have been treated definitively with
either surgery or radiotherapy: some 26 continue to be monitored due to very slow tumour
growth, medical co-morbidities, patient choice, old age, or a combination of these factors.
A protocol such as that presented below is highly dependent upon effective follow-up. In Table
28, a loss to follow-up rate of 10% is reported, based upon a rigorous definition that considers a
patient ‘lost’ if they are not seen in the out-patient department within 6 months of an anticipated
review appointment. This figure is similar to those published by other series (see Table 5). In
reality, the number of patients genuinely ‘lost’ within our series is likely to be less than this.
Included within the group are a number of patients who have voluntarily refused further follow-

118
up due to old age or claustrophobia preventing further scanning: in these cases, at least one
follow-up scan has been able to rule out a rapidly growing vestibular schwannoma.
Table 28: Patients under conservative management
Total number of patients: 471
Number with at least one follow-up scan: 421
Number displaying growth: 99 (24%)
Number not growing or regressing:
Mean follow-up in this group:
281 (67%)
51 mths
Number lost to follow-up (4 patients failed
to attend any follow-up, 2 patients actively
refused follow-up due to age):
41 (10%)
In other cases, patients may be lost from follow-up after a number of serial attendances: such
individuals are unlikely to be at significant risk from a rapidly growing vestibular schwannoma.
Finally, a number of patients are under surveillance by local otolaryngologists after attending
the Birmingham skull base clinic for their first review: although attempts are made to ensure
contact is maintained between local teams and our centre, this is not always achievable. While
these patients may be defined as ‘lost to follow-up’ in this chapter, they are unlikely to be at
significant risk. Further details of patients lost to follow-up are provided in Chapter 1.
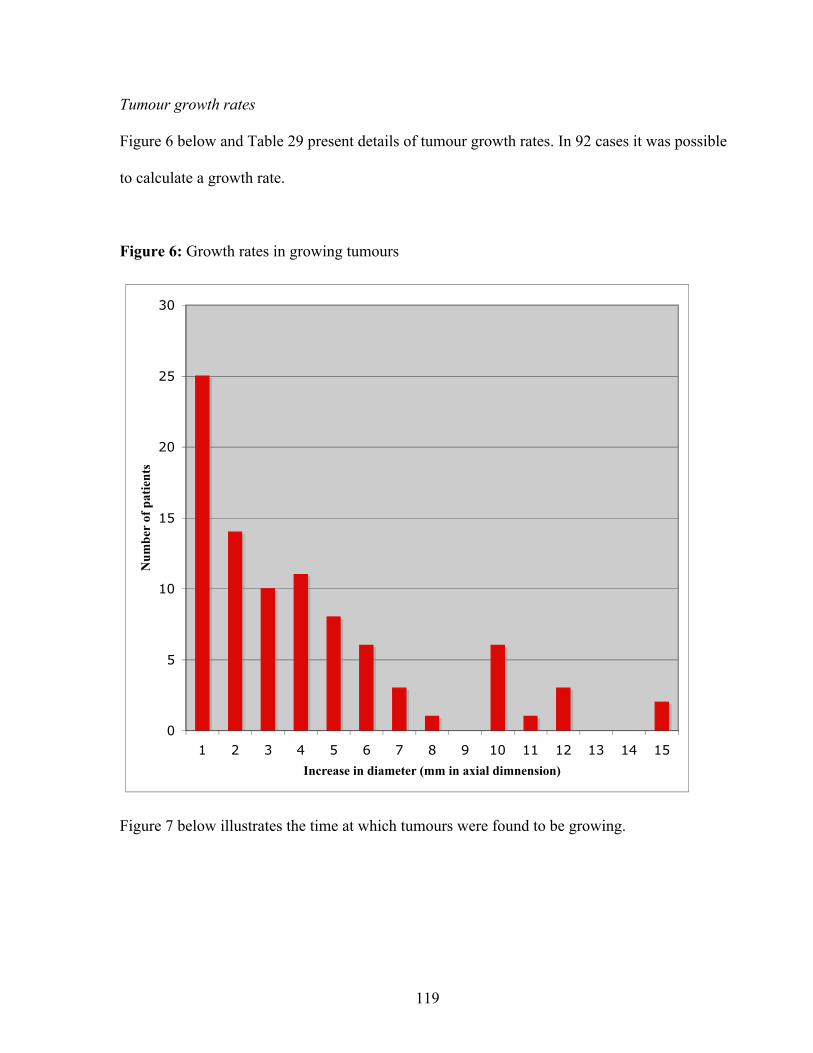
119
Tumour growth rates
Figure 6 below and Table 29 present details of tumour growth rates. In 92 cases it was possible
to calculate a growth rate.
Figure 6: Growth rates in growing tumours
0
5
10
15
20
25
30
1 2 3 4 5 6 7 8 9 10 11 12 13 14 15
Increase in diameter (mm in axial dimnension)
Nu
mb
er o
f p
ati
ents
Figure 7 below illustrates the time at which tumours were found to be growing.

120
Figure 7: Time of detection of growth with tumour growth rates
Key: Green: 0-4mm annually
Blue: 4-10mm annually
Red: >10mm annually
The growth rates found illustrate clearly the variability of growth rates among tumours. While
the majority of tumours grow slowly, with rates of between 0.5 and 4 mm annually, there are a
significant number that grow much more rapidly. The misleading impression given by
0
5
10
15
20
25
30
6-12mths 12-24mths 24-36mths 36-48mths >48mths

121
publishing ‘mean’ growth rates that include non-growing tumours has been discussed
previously in this thesis (see Introduction and Martin, 2005), and an awareness of the variability
of growth rates emphasises the importance of this argument further.
Table 29: Clinical characteristics of differentially growing tumours
Growth rate (increase in
annual axial diameter, mm)
Cystic Intracanicular (%), mean
CPA size
0-4 mm n=62 9% 33% I.can, 11 mm
4-10 mm n=18 11% 28% I.can, 12 mm
>10 mm n=12 42% 18% I.can, 15 mm
All watched tumours 0.5% 50% I.can, 12 mm
While the numbers of rapidly growing tumours are relatively small, a number of trends are
noticeable. The first and most important is the significance of a cystic morphology. As has been
demonstrated in Chapter 2 of this thesis, intra-tumoral cysts are strongly predictive of growth
within vestibular schwannomas. Table 29 illustrates that cystic tumours are both more likely to
grow than solid tumours, but are also more likely to grow rapidly: of those tumours that grew at
a rate of more than 10 mm annually, almost half contained intra-tumoral cysts. A further
observation is that there is also a weak trend towards smaller tumours showing less rapid
growth than larger tumours.
Figure 7 illustrates the time at which tumours were found to be growing. Of interest is the fact
that the majority of growing tumours are identified at either the first or second surveillance scan
122
following diagnosis. This is particularly true of those tumours that represent the greatest risk to
patients: those that are rapidly growing. Tumours that are after a number of review visits at
which the tumour was not felt to be growing are almost exclusively those tumours that
demonstrate slow growth. In one case only, growth was detected more than 4 years after initial
presentation: in this case the tumour was found to have grown only 4mm over the course of 6
years.
Proposed protocol for conservative management and rationale (see Figure 8)
If conservative management of acoustic neuromas is to prove successful, it must achieve two
broad aims. The first is to identify growing tumours in a timely fashion so that the change in
tumour dimensions does not prejudice outcomes in terms of facial nerve preservation and an
opportunity for hearing preservation surgery. The second is to ensure patient compliance with
follow-up: although our series suggests that tumour growth will be manifest in the first few
years of surveillance, long-term follow-up of large patient series is not available, and it is vital
that patients remain under active surveillance in order to chart the natural history of a tumour
that can be life-threatening if left untreated. A treatment algorithm such as the one proposed
below can, achieve both these ends.

123
Figure 8: Proposed protocol for the conservative management of vestibular schwannomas
Solid tumour, size intracanicular or <2cm in CPA, opt for conservative management
Scan at 6 months post Growth
diagnostic scan Surgery, DXT or continued observation2
Growth
Repeat after 1 year Surgery, DXT or continued observation
No growth
Growth
Repeat after 1 year Surgery, DXT or continued observation
No growth
Growth
Repeat after 2 years Surgery, DXT or continued observation
No growth
Scan every 5 years (lifelong)

124
In our series, a decision to intervene and to offer definitive treatment (i.e. surgery or
radiotherapy) has been taken in 90% of patients before 2 years have elapsed, thereafter, the
proportion of scans that reveal growth becomes much smaller. Clearly, a negative scan is
reassuring to both clinician and patient, and provides useful data to explore the natural history
of acoustic neuromas, but it also represents a considerable burden in terms of imaging services.
For this reason, the protocol presented advocates that an initial follow-up scan takes place at 6
months, then at annual intervals for two years. A further scan after 2 years have elapsed will
detect those rare tumours that demonstrate an early non-linear growth pattern. Following this
period, we recommend repeat imaging every 5 years to continue lifelong. Our experience of
long-term follow-up of patients with acoustic neuromas is evolving, but we have to date
followed some 80 patients for at least five years, and none of these patients have manifested
growth after 5 years.
An area of debate lies in the size of tumours that should be considered for conservative
management at the outset. Stangerup (2006) suggests managing tumours of <15mm in the CPA
conservatively. We have successfully managed larger tumours (up to 27mm) in this manner,
although would only routinely treat those <20mm in this way. Clearly, in cases where tumours
are larger, a number of patient and tumour factors can be taken into account to guide therapy. In
the case of a young patient with a 15mm tumour, a short duration of symptoms, serviceable
hearing and a willingness to undergo surgery, for example, conservative management may not
be appropriate. On the other hand, an elderly patient with a very long history of symptoms, a
25mm tumour and medical co-morbidities might be an excellent candidate.
125
If Chapter 2 of this thesis has demonstrated the difficulty of predicting whether vestibular
schwannomas are likely to grow under observation or not, it is clear that in the case of cystic
tumours, the risk of growth is particularly high. As seen previously, these tumours represent a
disproportionate number of growing tumours and as seen in this chapter, are highly likely to
demonstrate rapid growth. In some cases, cystic degeneration occurs in a previously ‘solid’
tumour, but in others, cysts are present from diagnosis, and such tumours should only be
managed conservatively with great caution.
Discussion
Series that have described conservatively managed acoustic neuromas to date have generally
described a group of patients who have been accumulated over a relatively long period of time
(see Table 5). These patients have been managed conservatively for various reasons (medical
problems, old age, or patient preference), and there is rarely a description of a structured
approach to the timing of follow-up scans. We believe that the series we present here is
relatively unusual in that the patients presented have been managed conservatively from the
outset, with an initial period of conservative management advocated in almost all cases of
small-medium sized tumours that present to our service, regardless of age. This has been
particularly true latterly, as has been previously discussed in this thesis. This approach to the
management of acoustic neuromas has necessarily led to the accumulation of a large cohort of
patients with tumours that are being followed with serial imaging: at present, we have some 472
patients who are being monitored for evidence of tumour growth, and each year we are adding a
further 80-100 patients to this group. Clearly, such a cohort represents a significant burden to
our neurotological imaging service.

126
Most authors have hitherto recommended annual follow-up scans after an initial scan at 6
months (Glasscock, 1997, Flint, 2005). Raut (2005) advocates these scans to continue lifelong.
While we concur that surveillance should continue indefinitely, we feel that such frequent
scanning is unnecessary. While a number of authors (Stangerup, 2006, Raut, 2005) have noted
an unpredictable pattern of tumour growth, in our series, the majority of patients (91%) have
demonstrated growth within three years, a finding echoed by Wiet (1995). In the largest
published series of conservatively managed acoustic neuromas published to date, Stangerup
(2006) has also observed that growth becomes manifest within 5 years. For this reason, we are
reluctant to suggest that patients should be recalled on an annual basis after this time period has
elapsed. Clearly, long-term follow-up of acoustic neuromas is lacking, and we would therefore
be reluctant to discharge patients who would appear to have an apparently static tumour. The
period of five years is an arbitrary figure for intermittent follow-up following the initial
surveillance episode, but should allow us to remain in contact with patients without obliging
them to attend too frequently.
Stangerup (2006) has published a protocol to guide conservative management suggesting
annual scans for five years, a further two scans after years 7 and 9, and finally a scan after 14
years prior to discharge. While our protocol broadly follows this regime, we differ in three
important areas. We believe an initial scan at 6 months is a valuable tool, and will identify a
considerable number of growing tumours, in particular those that most represent a threat to
patients in terms of the complications of definitive treatment in cases of failed conservative
management. Secondly, we advocate less frequent scans in the period following this initial

127
interval scan- tumours that are identified at this stage are likely to be indolent in nature. Finally,
we would suggest that follow-up be lifelong, carried out every five years: as stated above, the
natural history of acoustic neuromas in the long term has yet to be fully described.
Fundamental to the success of conservative management is effective follow-up. The danger in
losing patients with known pathology is evident- Glasscock (1997) reports a case of a patient
lost to follow-up who re-presented after over three years with a significantly enlarged tumour
and subsequently died from surgical complications. In our own series, a rate of 10% loss to
follow-up is reported using a rigorous definition, and for reasons outlined above, it is unlikely
that all the patients within this group are at risk of the fate described by Glasscock. Despite this,
a number of principles can be followed to ensure maximal compliance with follow-up. It is
essential that patients understand clearly the rationale of the treatment they receive and the
responsibility they have to attend for follow-up: in some cases where a chaotic lifestyle
threatens to make this unrealistic, conservative management may not be appropriate. We also
make every attempt to ensure that follow-up is convenient: many patients are scanned at their
local hospitals, thus reducing the distance travelled to attend appointments at the tertiary referral
centre. We also feel that reducing the number of follow-up scans should have a positive effect
upon follow-up: if a patient feels they are continually having to attend for scans that are
negative, they may be inclined to default.

128
Chapter Conclusion
The aim of this chapter has been to design a protocol for the timing of surveillance scans based
upon evidence provided by over ten years of conservative management. The Birmingham series
is the second largest single series of conservatively managed acoustic neuromas in the
published literature to date. Furthermore, this large cohort of patients has been collected due to
an evolving management policy of treating all tumours that are intracanalicular or <2cm in the
CPA conservatively. Such a policy inevitably leads to a significant accumulation of patients
requiring radiological follow-up. Existing recommendations in the literature advocate annual
follow-up to continue indefinitely, a practise that would exert an exponential burden upon an
imaging service. Review of our series of conservatively managed patients over the past ten
years reveals that the majority of patients (90%) who will demonstrate tumour growth do so
before three years have elapsed: the remaining 10% have become manifest within 6 years of
presentation. We have presented a protocol that focuses upon regular follow-up in the first 5
years, with greatest intensity during the initial period when growth is most commonly detected.
We believe that further growth may be seen, however, and advocate 5-yearly follow-up
thereafter. We feel that the initial 6 months scan is of paramount importance, and will identify
the majority of tumours that represent a considerable threat to patient health. Cystic tumours
represent a particular threat to patients, and should only be managed conservatively with great
caution. It is to be hoped that longer- term follow-up will allow this protocol to be improved
and modified.

129
CHAPTER 6: FUNCTIONAL SURGERY IN THE MANAGEMENT OF VESTIBULAR
SCHWANNOMAS: THE PRIORITISATION OF THE FACIAL NERVE OVER TOTAL
TUMOUR REMOVAL
A case-control study examining the effect of a less radical approach to surgical tumour
excision. This chapter represents a modified version of a paper published in the Journal of
Laryngology and Otology (Martin, 2012).
Introduction
In tandem with the conservative approach to management of vestibular schwannomas in the
outpatient setting, there has been a parallel move towards a less aggressive surgical model in the
operating theatre. Whereas the surgical team traditionally saw the complete removal of the
tumour as the primary object of surgery, current practice is to prioritise the preservation of
facial nerve function; often at the expense of tumour removal. The aim of this chapter is to
assess the impact of this change in surgical philosophy.
To date, the focus of this thesis has been to discuss various elements of conservative
management of vestibular schwannomas with the reservation of surgical treatment for those
tumours that demonstrate growth over time. There has been little focus upon the outcomes of
surgery itself beyond providing comparison with outcomes for patients managed with a
conservative ‘watch-and-scan’ as a primary strategy (see Chapters 3 and 4). The aim of this
chapter is to turn attention to surgical outcomes (specifically facial nerve preservation) in
patients who have been managed with surgery that does not aim to completely remove tumour.
130
The chapter will demonstrate that there has been an evolution in surgical practice within the
Birmingham series that mirrors that in overall management. Increasingly, there is a tendency to
take a more conservative approach to surgery: while the original philosophy of the surgical
team favoured a total tumour resection, this has been modified, particularly since 2007, with a
policy now to undertake near-total surgical excision if dissection of tumour from the facial
nerve proves difficult.
Issues relating to this area have not been fully addressed in the literature search performed in
the introduction to this thesis, and this chapter will therefore begin with a discussion of issues
relating to sub- and near-total tumour removal. Following this, data will be presented to assess
the evolution in management in Birmingham and the results of surgery.
Literature search
Search strategy
PubMed was searched using the terms: ‘vestibular schwannoma’, ‘surgery’, ‘partial’, ‘sub-
total’, ‘near-total’, ‘recurrence’ and ‘limited’. From identified articles, further articles were
identified for study.
Background
As also seen in the history of ‘watch-and-scan’ management described above, a ‘conservative’
approach to surgery for vestibular schwannomas dates to the mid-1980’s when Silverstein
(1985) recommended sub-total resection of tumours in elderly patients with large symptomatic
tumours. Historically, a decision to limit resection to a sub-total or near-total excision has been

131
made either pre-operatively (as above in patients for whom a lengthy procedure might prove
difficult), or intra-operatively, when total resection of tumour adherent to the facial nerve
rendered the procedure likely to cause significant neurological deficit, or when adverse intra-
operative events (for example haemorrhage) led a surgeon to abandon the operation (Freeman,
2007).
The obvious benefits of partial surgical resection are a reduced surgical duration, and perhaps
more significantly, the opportunity for improved functional outcomes: an aggressive pursuit of
tumour that is adherent to the facial nerve can result in trauma manifest either as nerve division,
stretching or ischaemic damage resulting in adverse outcomes post-operatively. The principle
risk of less-than total removal are that the tumour residuum will re-grow necessitating further
treatment.
Sub-total vs. near-total
Traditionally, a distinction has been drawn between ‘sub-total’ and ‘near-total’ excision of
tumour. The terms have been defined in the 2003 Consensus on Reporting Results in Vestibular
Schwannomas (Kanzaki, 2003): a ‘sub-total’ tumour removal removes less than 95% of the
original tumour bulk during surgery, whereas a ‘near-total’ tumour excision is more complete.
While not all articles discussing these issues adhere to this definition, the terms ‘sub-‘and ‘near-
total’ are used commonly. Most series find that in terms of recurrence, there is a significantly
higher risk of this occurring if a sub-total excision is achieved (Bloch, 2004, Seol, 2006,
Freeman, 2007).
132
An interesting finding by Godefoy (2009) casts doubt upon the accuracy of surgeon’s
assessment of the extent of tumour resection as judged intra-operatively. In this paper, Godefoy
examined the records of 51 patients treated surgically. The patients were distributed evenly
between those in which the surgeon had judged him or herself to have performed ‘total’, ‘near-
total’ or ‘sub-total’ excisions. Subsequently, a correlation was sought between post-operative
MRI estimates of tumour excision and the surgeon’s intra-operative assessment. MRI
classification of sub- versus near-total excision followed the consensus definition described
above (Kanzaki, 2003). While there was a perfect correlation between surgeon and post-
operative MRI with respect to whether total or incomplete excision had been achieved, there
was only a poor correlation with reference to ‘sub-‘ versus ‘near-total‘ excision.
The implications of Godefoy’s findings are interesting. It is perhaps to be expected that the
‘errors’ found in the surgeon’s assessment tended towards an over-confidence with respect to
tumour excision. Thus, while the surgeon felt that 15 cases represented ‘near-total’ excision, the
post-operative (blinded) radiological assessment found that only 4 cases fell into this group.
Those cases where the surgeon felt that a ‘sub-total’ excision had taken place were all
confirmed to be such. It is perhaps natural that a surgeon should wish to think that he or she has
effected a more complete resection than is the case: complete tumour resection is an important
principle in surgery, and to leave tumour behind represents a ‘failure’ for most surgeons. There
will of course, be great variation between the way in which surgeons report such matters, but
Godefoy’s paper points to a potential flaw in those reports that do not independently measure
tumour remnant in order to determine whether a resection is best described as ‘sub-‘ or ‘near-
total’.

133
Facial nerve outcomes
While medical co-morbidities or intra-operative complications may necessitate a planned (or
unplanned) ‘de-bulking’ or sub-total excision, the most common motivation for less-than total
tumour excision is to avoid excessive manipulation of the facial nerve and hence to minimise
post-operative facial nerve impairment. As previously discussed, there is a strong correlation
both in our own series of operated tumours and in the literature generally (see Chapter 4)
between tumour size pre-operatively and post-operative surgical outcomes. An early paper by
Kemnick (1991) suggested that facial nerve outcomes (90% Grade I and II following the House
Brackmann classification) in medium-large tumours undergoing a planned less-then-total
resection could achieve those more usually associated with smaller tumours. More recently,
Godefoy (2009) found a lower proportion of poor facial nerve outcomes (Grade III-VI House
Brackmann) in patients who had undergone sub- or near-total resection when compared to those
who had undergone total excision (13% vs. 42%). Conversely, although Seol (2006) reports
better facial nerve outcomes in the immediate post-operative period for patients undergoing
less-than total excision, this finding is not sustained in longer follow-up, with differences losing
statistical significance. Of interest in this paper will be to determine whether our series reflects
what might intuitively seem to be likely (as demonstrated by Godefoy and Kemnick), or that
found by Seol.
Recurrence rates
As discussed above, the principle risk posed by incomplete tumour excision is tumour
recurrence. An early report from Japan (Sakaki, 1991) analysed outcomes in 51 tumours that
134
had been completely or incompletely excised. Recurrence in totally excised tumours was not
seen, but in sub-totally and near-totally excised tumours was common (25% and 29%
respectively). Similar findings were subsequently reported by El-Kashlan (2000) who analysed
39 incompletely excised tumours and found growth on subsequent surveillance in 44%: of
these, 59% required further treatment.
Freeman (2007) has offered more optimistic results in a much larger series of patients than
either of those described above. In a total series of 1,083 patients with vestibular schwannomas
treated surgically, 866 underwent total surgical excision, with a revision rate of only 0.5%. 128
near-totally excised tumours are described, with a revision rate of 1.6%, and a further 43 sub-
totally excised tumours required revision in 26% of cases: in all cases there are impressively
long periods of follow-up that are close to ten years. It should be recognised that these results
report rates of revision rather than recurrence: there may be a number of cases where tumour
remnant remains under surveillance despite slow growth.
From these studies, the importance of definition is clear: Freeman defines ‘near-total excision’
as ‘tiny fragments of tumour capsule left behind, usually on the facial nerve’: anything greater
than this in bulk is considered a sub-total excision. In a large tumour, therefore, a ‘sub-total’
excision following this definition could easily represent less than 5% (the definition offered by
the 2003 Consensus Document). The implication from these studies would be that there is a low
risk of recurrence in those excisions where genuinely minimal amounts of tumour material have
been left behind, but this risk increases significantly if bulky tissue remains (irrespective of the
95:5% definition offered by the 2003 Consensus Document).

135
The two definitions of ‘near-total’ outlined above represent quite significant differences in
terms of tumour volume. If the ‘tiny fragments’ described by Freeman may account for perhaps
a few cubic millimetres or less of tumour, then 5% of the original tumour could consist of up to
1.7 cubic centimetres in a 4cm tumour. If (as Freeman suggests), ‘tiny fragments left behind’
become non-viable due to poor vasculature, then it cannot be assumed that a tumour remnant of
significant bulk would also become non-viable. It could therefore be argued that the poorer
recurrence rates in some series found in near-total tumour excisions relative to those seen in
Freeman’s series are found because the tumour remnant is a significant, viable tumour mass
rather than non-viable ‘fragments’. Clearly, in assessing the risk of recurrence in any series of
‘near-total’ tumour excisions, it would be interesting to know whether the tumour residuum is a
matter of tumour fragments or a more sizeable mass.
Methods
Patients
The Birmingham Database was searched (June 2010) to identify patients undergoing surgery.
Those with inadequate data (either a lack of intra-operative information or a lack of post-
operative facial nerve evaluation) were excluded from the study.
Data recovered
A record was made of demographic details recording patient age at the time of surgery and
patient sex. The size of tumour at surgery was noted as was the surgical approach. The
operative notes were reviewed to determine whether a ‘total’, ‘sub-total’ or ‘near-total’ tumour

136
removal was achieved. Where possible, a note was made of the location of any tumour
remnants, and of any particular difficulties during the procedure. In terms of functional
recovery, a record was made of facial nerve status (House-Brackman Classification, 1985) at
the first post-operative visit (usually at two weeks following surgery), at three months following
surgery and after one year. Facial nerve outcomes are those achieved with rehabilitation. A
record was also made of any rehabilitation of the facial nerve, whether in the form of
physiotherapy or surgery (passive or dynamic). Finally, details of any post-operative imaging
were recorded.
Study design
As noted above, there has been an evolution in surgical practice towards a more conservative
approach to surgery over time in Birmingham. In order to assess the effect of this change, two
groups of patients are studied: those undergoing ‘functional’ surgery (a term used because the
aim of surgery is to preserve nerve function), and those undergoing ‘excisional’ surgery (in this
group the aim will have been to remove tumour with nerve function important but subordinate
to the first aim). After discussion with the surgical team responsible for the cases studied it was
felt appropriate to define these groups chronologically: a date of April 2007 was felt to
represent a time at which a more functional approach was adopted.
Although the philosophy guiding surgery is as outlined above, it is important to recognise that
there has never been a rigid approach to the prioritisation of tumour excision over facial nerve
preservation. Thus if tumour dissection from the facial nerve proved very difficult, it has always
been the case that the surgeon may elect to leave fragments of tumour in situ in order to try to

137
avoid facial nerve trauma (hence the inclusion of a number of patients with incomplete tumour
excision in the ‘excisional’ group).
Comparison between groups
As outlined above, two groups were generated: the first undergoing surgery before April 2007
and classified as ‘excisional’, the second undergoing ‘functional’ surgery. The groups were
studied in order to determine any differences in facial nerve outcomes, with the primary
outcome represented by facial nerve function (House Brackmann Classification, 1986) at 12
months following surgery. Secondary outcome measures were facial nerve function at three
months and the need for revision surgery or further treatment. Tumours in the ‘functional’
surgery group are significantly larger than those in the ‘excisional’ group, and for this reason, a
modified ‘excisional’ group has been created by removing smaller tumours from the analysis.
Examination of operative records
An analysis was made of operative records in order to determine any factors that may have
affected the preservation of facial nerve function. Particular attention was paid to facial nerve
sacrifice or inadvertent damage. Where possible, a record was made of the location of any
tumour fragments left in situ during sub- or near-total tumour excision.
Post-operative imaging
In cases where post-operative imaging was available, a record was made of findings in order to
assess the risk of tumour recurrence. Because the majority of patients undergoing functional

138
surgery are awaiting follow-up imaging, data were grouped in terms of degree of resection
(allowing an assessment of potential tumour re-growth following less-than-total resection).
Statistical analysis
In order to compare rates of facial nerve preservation between the functional and the modified
excisional group, outcomes at three months and one year were classified as either ‘good’
(Grades I-II) or ‘moderate-poor’ (Grades III-VI). The two groups were then subjected to a Chi-
Square analysis (SPSS 16.0 for Mac).
Results
Patients
229 patients were identified with a minimum potential follow-up of one year following surgery.
Of these, 216 had sufficient data for analysis. A total of 44 patients underwent surgery after or
during April 2007, while 172 underwent ‘excisional’ surgery prior to this date.
Demographics, tumour size and surgical approaches
Excisional group
This group contained 90 females and 82 males with a mean age of 52 (range 19-82). The mean
tumour size (at the time of surgery, measured in the axial plane parallel to the petrous bone at
the level of the cochlear) was 22mm (range 2-50mm). 35 operations employed the retro-
sigmoid approach to the tumour, 137 the translabyrinthine. Total tumour removal was achieved
in 137 cases, with sub-total excision in 9 and near-total excision in 26.
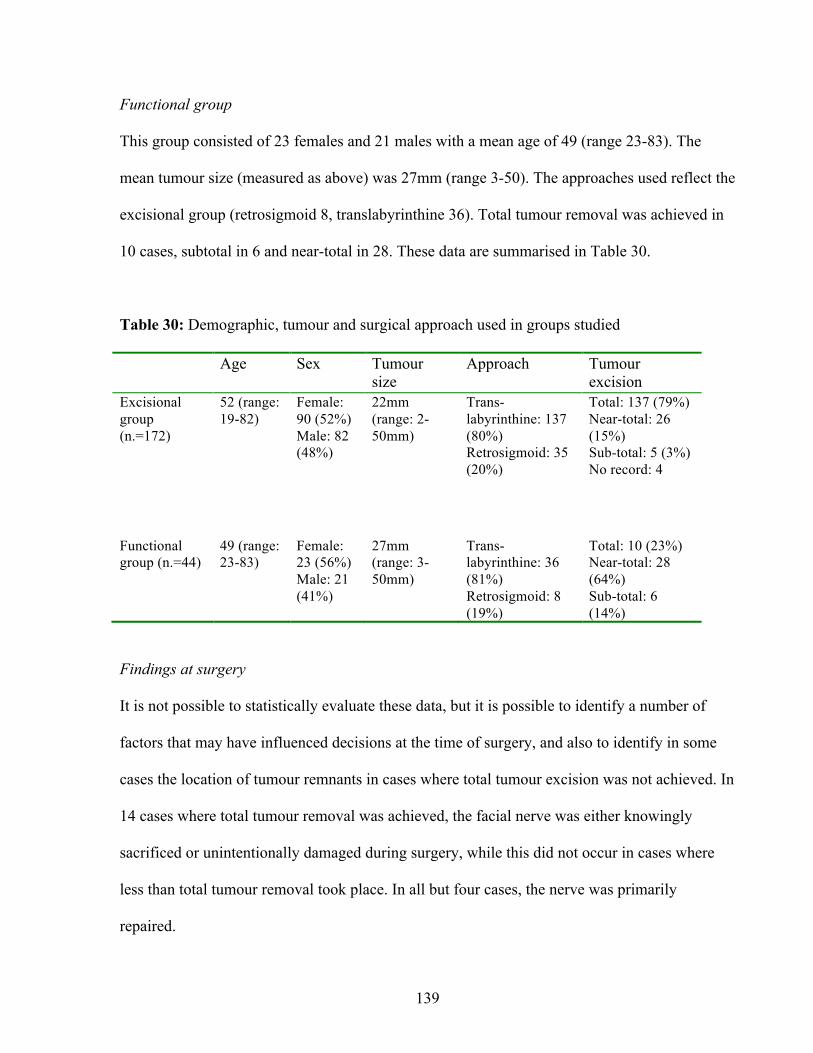
139
Functional group
This group consisted of 23 females and 21 males with a mean age of 49 (range 23-83). The
mean tumour size (measured as above) was 27mm (range 3-50). The approaches used reflect the
excisional group (retrosigmoid 8, translabyrinthine 36). Total tumour removal was achieved in
10 cases, subtotal in 6 and near-total in 28. These data are summarised in Table 30.
Table 30: Demographic, tumour and surgical approach used in groups studied
Age Sex Tumour size
Approach Tumour excision
Excisional group (n.=172)
52 (range: 19-82)
Female: 90 (52%) Male: 82 (48%)
22mm (range: 2-50mm)
Trans-labyrinthine: 137 (80%) Retrosigmoid: 35 (20%)
Total: 137 (79%) Near-total: 26 (15%) Sub-total: 5 (3%) No record: 4
Functional group (n.=44)
49 (range: 23-83)
Female: 23 (56%) Male: 21 (41%)
27mm (range: 3-50mm)
Trans-labyrinthine: 36 (81%) Retrosigmoid: 8 (19%)
Total: 10 (23%) Near-total: 28 (64%) Sub-total: 6 (14%)
Findings at surgery
It is not possible to statistically evaluate these data, but it is possible to identify a number of
factors that may have influenced decisions at the time of surgery, and also to identify in some
cases the location of tumour remnants in cases where total tumour excision was not achieved. In
14 cases where total tumour removal was achieved, the facial nerve was either knowingly
sacrificed or unintentionally damaged during surgery, while this did not occur in cases where
less than total tumour removal took place. In all but four cases, the nerve was primarily
repaired.
140
In near-total tumour excision, the most common location for tumour remnants was on the facial
nerve. Of 57 near- and sub-total excisions, data were available in 43 cases to determine the
location of tumour left in situ: in 41 cases this was adherent to the facial nerve, usually medial
to the porus acusticus. In most cases of ‘near-total’ excision, terminology implies that the bulk
of tumour left in situ is very small: terms such as ‘small fragment’, ‘microscopic fragment’ and
‘small nubbin’ are used. In a small number of ‘near-total’ excisions (n.=3), a more
mathematical description is used: the surgeon describes ‘>95% removed’ or ‘left on facial nerve
medial to porus (5%)’.
Facial nerve outcomes (also presented in Table 31)
Excisional group
At the first post-operative visit, excellent results (Grade I and II) were achieved in 62 patients
(36%), moderate (Grade III and IV) in 42 (25%) and poor in 67 (39%). At three months, these
figures were respectively: 91 (53%), 19 (11%) and 61 (36%). At one year, these had improved
to: 113 (66%), 42 (24%) and 17 (10%).
Functional group
At the first post-operative visit, excellent results (Grade I and II) were achieved in 25 patients
(68%), moderate (Grade III and IV) in 3 (8%) and poor in 9 (24%). At three months, these
figures were respectively: 31 (72%), 5 (12%) and 7 (16%). At one year, these had improved to:
34 (77%), 10 (23%) and 0. Of the 34 patients with good facial function at one year, 27 (61% of
the total) were considered to have normal facial nerve function (grade I) at one year: this
compares with 38 (33%) in the modified excisional group. At both 3 months and at one year,

141
the difference in outcomes between the ‘functional’ group and the modified ‘excisional’ group
were significantly different (p=0.002 and 0.027 respectively).
Table 31: Facial nerve outcomes in different groups studied
Ist post-operative
visit
At three months
following surgery
At 12 months
following surgery
Excisional group (n.=172)
Grade I and II: 62 (36%) Grade III and IV: 42 (25%) Grade V and VI: 67 (39%) Not scored: 1
Grade I and II: 91 (53%) Grade III and IV: 19 (11%) Grade V and VI: 61 (36%) Not scored: 1
Grade I and II: 113 (66%) Grade III and IV: 421 (24%) Grade V and VI: 17 (10%)
Excisional group with correction for tumour size (n.=115)
Grade I and II: 30 (26%) Grade III and IV: 26 (23%) Grade V and VI: 58 (50%) Not scored: 1
Grade I and II: 51 (45%) Grade III and IV: 10 (9%) Grade V and VI: 53 (46%) Not scored: 1
Grade I and II: 66 (57%) Grade III and IV: 323 (28%) Grade V and VI: 17 (15%)
Functional group (n.=44)
Grade I and II: 25 (68%) Grade III and IV: 3 (8%) Grade V and VI: 9 (24%) Not scored: 7
Grade I and II: 31 (72%) Grade III and IV: 5 (12%) Grade V and VI: 7 (16%) Not scored: 1
Grade I and II: 34 (77%) Grade III and IV: 104 (23%) Grade V and VI: 0
Facial nerve rehabilitation
In a number of cases, facial nerve rehabilitation, whether passive or dynamic, surgical or
conservative, has been offered to patients with impaired facial nerve function. In the functional
group studied, rehabilitation has been largely in the form of physiotherapy (n.=2), and in one
case, oculoplastic surgery. In the excisional group, a variety of surgical and non-surgical
techniques have been employed: these are summarised in Table 32.

142
Table 32: Facial nerve rehabilitation techniques employed in excisional group of patients
Passive Passive surgery Dynamic surgery
Botulinum toxin injection: 12
Facial physiotherapy
(exercises/ facial stimulator):
301
Gold weight: 15
Tarsorrhaphy: 9
Medial canthoplasty: 8
Brow lift: 4
Facial-hypoglossal
anastomosis: 10
Other dynamic procedures: 6
1. This figure records individuals for whom facial physiotherapy was a sole treatment modality: it does
not include those receiving physiotherapy as an adjunct to other rehabilitative treatment.
Follow-up imaging
Routine follow-up imaging (MRI) is performed either at two years following surgery or at one
year following surgery if there is thought to be a significant tumour residuum. Due to the short
duration of follow-up in the functional group, follow-up imaging is assessed with reference to
the degree of tumour excision, rather than to the groups used in analysis above.
Tumour recurrence in near-totally excised tumours
Near-totally excised tumours have been followed for a mean period of 69 months (range 18-152
months). Patients are routinely offered a post-operative scan at two years, and in 18 cases, this
scan is awaited. In the remaining 35 cases, a significant proportion do not have any detectable
tissue remnant seen on MRI (24 cases, 68%). A further 9 patients have fragments of residual
tumour seen on MRI, while in two cases, there is evidence of tumour growth: tumour was not
visible at the initial post-operative scan in one case, but measured 8mm at three years; in a
second case recurrent tumour was not detected until five years following surgery.

143
Tumour recurrence in sub-totally excised tumours
In those 15 cases where sub-total tumour excision was performed, 12 had attended for follow-
up scans, with a mean follow-up of 63 months (range 15-121). From this group, three patients
demonstrated significant re-growth of residual tumour and required further treatment.
Tumour recurrence in totally excised tumours
In this group of 147 patients, six are awaiting follow-up scans. In one case among the remaining
141 patients with a mean follow-up of 82 months (range 20-149), there has been recurrence. In
a further four patients, small fragments have been detected that have remained stable over time:
the remaining 136 cases (96%) have not shown evidence of tumour residuum or recurrence.
These data are presented in Table 33.
Table 33: Tumour recurrence in groups studied
No detectable tumour on MRI Scan
Residuum (stable)
Tumour re-growth
Awaiting first post-operative scan
Total excision (n. 141,1 follow-up 82 months mean)
136 (96%) 4 (3%) 1 (1%) 6
Near-total excision (n.35, follow-up 69 months mean)
24 (68%) 9 (26%) 2 (6%)2 18
Sub-total excision (n.12, follow-up 63 months mean)
1 (10%) 8 (67%) 3 (25%) 3
1. Follow-up and n. recorded refer to patients who have undergone follow-up scans.
2. Operative records did not suggest that the remnant of tumour left in situ was bulky: in one case, the
remnant was described as a ‘small nubbin’.
144
Discussion
The aim of this chapter has been to evaluate the effects of a ‘functional’ surgical approach
adopted in recent years. The effect of this approach is to favour the preservation of facial nerve
function over the resection of tumour tissue. Table 31 demonstrates that this approach has been
impressively successful in reducing the proportion of our patients that suffer with significant
facial nerve lesions at one year following surgery. These benefits are seen both at initial post-
operative follow-up, and sustained at later review after one year. Perhaps most significantly, we
have been able to demonstrate preservation of normal facial function (House Brackmann grade
I) in 61% of cases undergoing surgery for medium-large vestibular schwannomas. Furthermore,
we would anticipate that a considerable number of secondary rehabilitative procedures
(illustrated in Table 33) can be avoided as a result of this shift in practice.
The ‘cost’ of these benefits to our cohort of patients has been an increased rate of ‘less-than-
total’ tumour resections. Thus in the ‘excisional’ group, rates of total tumour removal are 79%
while in the ‘functional’ group they are only 23%. The obvious risk posed by this change in
practise is to lead to a significant growth in tumour recurrence over time: to date follow-up is
inadequate to accurately measure rates of tumour recurrence in the functional group.
A review of recurrence rates within the group as a whole would suggest that while recurrence is
more common in ‘near-total’ procedures than in ‘total’, the difference is small. Of 141 totally
excised tumours, only 1% have demonstrated recurrence: the equivalent proportion of near-
totally excised tumours is 6%. Recurrence in sub-totally excised tumours would appear to be at
a markedly higher rate (of 25%), although even in this group where a significant bulk of tumour

145
has been left in situ, there is a significant proportion of tumours that do not demonstrate further
growth. These findings echo the literature discussed above and suggest that the inconsistencies
in surgical assessment of intra-operative tumour residue demonstrated by Godefoy are happily
absent from our study.
If an increased rate of tumour recurrence is inevitable following ‘functional’ surgery, it is
important to assess the significance of this change. In the first place, patients undergoing less-
than-total tumour resection require regular follow-up with imaging surveillance. It is our current
practice to perform an initial MRI scan at one year following surgery and to repeat this every
two years: three scans demonstrating stability would allow a relaxation of this regime.
Secondly, recurrence in some cases will require further treatment (others may allow
surveillance): in the majority of cases this will take the form of radiosurgery, a treatment that is
generally well-tolerated by patients. It is our experience that when the risks and benefits of
functional surgery are explained to patients, they are happy to adopt the approach in preference
to excisional surgery.
Chapter Conclusion
This chapter has demonstrated that with a ‘functional’ approach to vestibular schwannoma
surgery, significant improvements can be made to facial nerve outcomes. In 77% of cases at one
year, normal or near-normal facial function is preserved in a cohort of patients with medium to
large vestibular schwannomas. This compares with our earlier results of 57% (when adjusted
for tumour size). This move towards functional surgery has presumed benefits in quality of life,
and reduced economic burdens in terms of rehabilitative procedures and therapies. The shift in

146
philosophy has led to an increased burden of post-operative surveillance and an elevated risk of
tumour recurrence, the effects of which are yet to be seen, but are not expected to outweigh the
benefits outlined above.

147
CHAPTER 7: THE REHABILITATION OF SINGLE-SIDED DEAFNESS WITH THE
BONE-ANCHORED HEARING AID
Single-sided deafness is the most common disability affecting patients with vestibular
schwannomas, whether treatment has been conservative, surgical or radiotherapeutic. This
study evaluates the success of the most commonly used intervention to treat single-sided
deafness: the bone-anchored hearing aid (BAHA). A version of this chapter has been published
in the journal ‘Clinical Otolaryngology’(Martin, 2010). The work presented here was awarded
a prize for the best trainee presentation at the British Skull Base Society Meeting (Cambridge,
2009).
Introduction
Single-sided deafness (SSD) is the most common disability to affect patients with vestibular
schwannomas. At presentation, some 13% of patients in the Birmingham Database have no
recordable hearing in the affected ear. As has been seen in previous chapters, a significant
proportion of those individuals treated conservatively will lose hearing progressively while
being watched, as do a significant number of patients treated with radiotherapy (see Chapter 3
for details). All those patients treated surgically with the translabyrinthine approach will lose
hearing as an inevitable consequence of the operation, which depends upon the functional (if
not physical) destruction of the inner ear in order to secure access to the internal auditory canal.
The handicap produced by SSD is threefold: ‘the head-shadow effect’, a loss of the ability to
localise sound, and a reduction in the discrimination of speech in a noisy environment (Welsh,

148
2004 and Douglas, 2007). The ‘head-shadow effect’ refers to the handicap produced by the loss
of perception of sounds that originate on the affected side. Thus a patient who has a left sided
deafness will struggle to hear somebody speaking on their left-hand side if they are looking
directly ahead (while driving a car, for example). The SSD individual will often be able to hear
sounds that originate on the deaf side with their hearing ear, but there is a degree of attenuation
of 10-20 dB that can be significant if the original sound intensity is low, or if there are
competing factors (such as noise) in the environment.
Sound localisation and the discrimination of speech in noise are both functions that depend
upon binaural input. In a normally functioning individual, auditory information from each
cochlea is processed in the brain-stem and auditory cortex in order to localise sound in space:
the effective localisation then allows for a discriminatory selection of either useful (i.e.
‘speech’) or useless (i.e. ‘noise’) sound, with the central up-regulation of the former and down-
regulation of the latter (‘squelch’). The process is dependent upon inter-aural time and volume
discrepancies, with considerable neural decussation at the brain-stem level (Grothe, 2010): the
loss of one cochlea profoundly limits an individual’s ability to perform these sophisticated
processes.
The effect of SSD upon individuals is demonstrated by these statements offered by patients
participating in the study described in this chapter:

149
‘...I have found hearing in monotone saddening to the point of depressing as I am a music
fan...It has been hardest to learn how to live with peoples’ attitude as they do not understand a
disability they cannot see...’
‘It is very difficult to hear people in crowded pubs. When people shout my name in the large
warehouse that I work I find it difficult to pin-point where the voice is coming from.’
‘I hate being deaf on the one side. My head hurts with all the sounds, in fact sometimes I stop
listening because of the concentration you have to do (sic) just to listen.’
‘It is a very strange experience! I can hear perfectly in some contexts but am completely
‘disabled’ in others. Not being able to locate sounds is a problem... Meetings which are social
in context...become extremely challenging, the effort involved in trying to hear is exhausting in
groups.’
These statements illustrate the functional problems experienced by patients with SSD, but also
demonstrate the difficulties (emotional, social and occupational) that accompany the condition.
Traditional rehabilitation of unilateral deafness has relied upon the ‘CROS’ (Contra-lateral
routing of signal) hearing aid: a device that consists of a microphone located on the deaf side of
the head that conveys sound to a conventional hearing aid at the hearing ear. While tolerated by
some, the CROS aid is often perceived as uncomfortable and cumbersome, and carries the

150
disadvantage of occluding the hearing ear. The aim of this chapter is to describe a study
assessing the success of a new device for the rehabilitation of SSD: the BAHA.
The BAHA is reliant upon the effective transmission of sound direct to the inner ear by bone-
conduction, with the bone-conducting device attached to a titanium implant that is fixed behind
the patient’s ear. Osseo-integration (the growth of bone into microscopic fissures in the surface
of the titanium) ensures a secure fixture of the abutment and allows for efficient transmission of
sound (Tjellstrom, 1995). Thus while traditional bone-conduction hearing aids are dependent
upon maintaining pressure upon the skin that is adequate to ensure a good contact with the
underlying bone (producing a device that can be uncomfortable and cumbersome), many
patients are able to use a BAHA without being aware of its presence (Bonding, 1992). Initially,
the BAHA was offered for otological conditions characterised by a conductive hearing loss (i.e.
congenital aural atresia) or infection precipitated by conventional hearing aids (i.e. in
problematic mastoid cavities). More recently, the device has been offered for the rehabilitation
of SSD. In this context, the BAHA is sited behind the patient’s affected ear, and the device
transmits sound via bone conduction to the contralateral cochlea.
Initial reports suggested that the BAHA offered a number of benefits: greater patient tolerance
than the CROS hearing aid, improved speech-in-noise comprehension, and patient satisfaction
(Vaneecloo, 2003, Niparko, 2003, Hol 2005, Lin 2006). An early report even suggested the
BAHA could offer improved sound localisation via ‘pseudo-stereophony’ (Vaneecloo, 2003)
although this claim was not substantiated by later publications (Hol 2005, Lin 2006).

151
In this chapter, data are presented detailing the experience of the first 58 patients treated for
SSD with BAHA in the Queen Elizabeth Medical Centre, and Selly Oak Hospital, Birmingham.
An analysis of surgical results and complications, patient satisfaction, spatial hearing and
speech discrimination in noise testing is undertaken. The study aims to answer two key
questions. Firstly, is the BAHA successful in the rehabilitation of the disability presented by
SSD? Secondly, is the BAHA when used for this indication successful when compared to its
use for other clinical indications?
Methods
Patient recruitment
Patients fitted with BAHA to treat SSD were identified from a database of 1250 patients fitted
with BAHA for all indications. All those treated for the indication of SSD and with at least 3
months BAHA use (58 patients including non-users) were invited to participate in the study.
Our first patient treated for SSD was fitted with a BAHA in 2002. Patients with SSD are usually
identified in general clinics or in referring hospitals and undergo full audiological assessment in
a specialised BAHA clinic. They are then offered a headband trial of the device, usually lasting
4 weeks. Thereafter, further audiological review takes place before a medical consultation: if
the patient is satisfied with the headband trial, surgery is offered. Patients were fitted with either
a Compact or Divino BAHA (Cochlea, Sydney, Australia). At the time of testing, 16 patients
were fitted with a Divino device, 37 with the Compact (there were 5 non-users). There were no
significant differences in outcomes between the two groups.

152
Table 34: Demographic details of fitted patients
Age Sex Cause of unilateral deafness
Duration of unilateral deafness
Contralateral hearing
Complications
Mean: 56 Range: 30-79
M: 19 F: 39
Vestibular schwannoma: 27 Post-surgery, other illness: 151 Childhood illness or congenital: 7 Sudden onset hearing loss in adulthood: 9
<10 years: 32 >10 years: 26
<20dB: 28 >20dB: 24 Unknown: 6
None: 37 Non-user/ abutment removed at patients’ request: 52
Fixture failure: 53
Soft tissue infection/ overgrowth: 124
1. In most cases, these individuals had undergone otological surgery.
2. These patients asked to have the abutment removed because they did not feel it offered any benefit.
3. The abutment failed in four individuals, and in one patient, the abutment failed on two occasions. Two
of the patients with abutment failure were patients who had undergone surgery for excision of an
acoustic neuroma.
4. In most cases, infection or soft tissue overgrowth was minor: in 2 cases, revision surgery was
necessary.
The research took place in two phases: an initial cohort of 45 patients were invited to attend for
speech discrimination testing (speech-in-noise), and to complete the speech and spatial qualities
of hearing scale (SSQ) questionnaire (Gatehouse, 2004). Later in the same year (2007), a further
13 patients were contacted who completed both the SSQ and the Glasgow Benefit Inventory
(Robinson, 1996) (postal survey). For logistical reasons, it was not possible to offer speech
discrimination testing to this cohort. Patients failing to respond to initial requests were sent the
questionnaires on two further occasions.
In total, 58 patients were contacted and asked to complete the questionnaires. The mean
duration of follow-up was 28.4 months (range 3-41 months). The demographic details, cause

153
and duration of unilateral deafness, and status of hearing in the contra-lateral ear are presented
in Table 34: it is important to recognise that not all patients studied with SSD are patients who
have vestibular schwannomas.
Controls
In order to provide normal comparisons for the SSQ instrument, a further 67 patients with SSD
without BAHA were asked to complete the questionnaire, with 49 responding. From this
group, the majority (n.=40) were patients with acoustic neuromas managed within our
department either surgically or conservatively. The remaining controls were patients with SSD
awaiting BAHA assessment. Responding control patients were of a similar age (mean 56, range
38-79 years) and sex mix (29 females, 20 males). In this group, 65% reported normal contra-
lateral hearing, 23% impaired and 13% poor.
Speech discrimination testing in noise
Testing was carried out following a standard protocol (UK Cochlear Implant Study Group:
POCIA protocol) using Bamford-Kowal-Bench (BKB) sentences in multi-talker babble
(‘noise’) in 3 conditions: presenting speech from the 0° position (i.e. in front of the subject),
with noise presented either from the 0° position, from a position ipsilateral to the BAHA or one
contralateral to the device. Noise was presented at two levels, initially at the same level as the
speech and then at 5 dB more intense (i.e. signal-to-noise ratios of 0 and -5dB, respectively). If
a patient scored less than 20% of sentences correctly identified with the first level, the more
difficult test was not attempted. The testing was carried out both with the BAHA switched on,
and with it turned off: the order being randomly allocated to counter any learning effect. The
154
results were analysed by comparing the differences in scores when the BAHA was turned on or
off (for statistical details, see below).
Glasgow Benefit Inventory (GBI)
The GBI is a validated measure of patient benefit consisting of 18 questions divided into 3
groupings assessing social, physical and general patient benefit from an intervention (Robinson,
1996). Each item gives a score of between 1 and 5 (with 3 representing ‘no change’), and results
are presented as figures around the neutral mark with a corrective calculation to create a
maximum score of +100 and a maximum negative score of -100. Previous reports of GBI scores
in BAHA usage (for varying indications, not solely for the rehabilitation of single-sided
deafness) have reported scores of +20 to +45 depending upon the indication for surgery
(McLarnon, 2004).
Speech, Spatial and Qualities of Hearing Scale (SSQ)
The SSQ was developed by Gatehouse and Noble in order to characterise disability in hearing
speech in competing contexts and assessing the directional, distance and movement components
of spatial hearing (Gatehouse, 2004). The questionnaire consists of 50 items scoring 1-10 and is
divided into three domains or ‘scales’: speech hearing rating (SHRS), spatial rating (SRS) and
sound qualities rating (SQRS). Three questions that refer to the use of two hearing aids (items
3.15,16 and 17) were omitted from the study.
155
Open questions
In addition to the formal instruments described above, patients were encouraged to offer open
comments about the BAHA. These were often extremely enlightening, although caution must
of course be exercised when drawing conclusions from such observations. Among other
questions, BAHA users were asked when they found the BAHA most useful, whether they used
the device every day, what they would change about the device and whether they would
recommend it to a friend with a similar condition.
Statistical analysis
The analyses were performed using SPSS version 16.0 for Mac and Minitab. SSQ results
showed a normal distribution, and therefore a parametric test (independent samples t-test) was
used to test for inter-group differences. A post hoc power calculation found a power of 84% to
detect a significant difference (95% confidence) of 1 mean point on the SSQ between cases and
controls. The GBI showed a skewed distribution, and therefore a median value for results is
offered, and sub-group analysis employs the Mann-Whitney U test. In order to assess intra-
individual differences in SiN testing, paired analyses were undertaken (paired t test of the
differences of means). A p-value of <0.05 is taken to be significant in all analyses.
Ethical considerations
The study is registered with the audit department of the Queen Elizabeth Medical Centre. At the
time of designing the study, it was felt that ethical approval was not required. Subsequently in
the review process, it was suggested that it would be appropriate to seek ethical approval for the
project. A consequent request for retrospective ethical assessment was rejected by the local

156
ethics research committee (no such mechanism exists within the United Kingdom). In response
to a description of the study, however, the South Birmingham Ethics Committee Chairman
judged that the work could be considered (for the purposes of publication) as ‘service
evaluation’.
Results
Speech discrimination testing in noise (SiN)
19 patients (42% of the 45 patients invited in the first phase of the study) attended for SiN
testing. In each testing position, for each patient, the most ‘challenging’ test was used for
analysis (i.e. with noise 5 dB more intense than speech, unless the patient was unable to carry
out this test). Of note, none of the differences detected between having the BAHA activated or
inactivated were significant. Results are presented in Table 35. There was a trend towards
benefit in wearing the BAHA when noise was presented to the hearing ear and speech from the
front. This benefit, however, was countered by a detrimental effect found when noise was
presented to the BAHA, and thus acted as a distracting intrusion. Both p-values approached
significance (p=0.06), but were equal, suggesting that the benefit offered to SiN hearing when
noise is presented to the hearing ear may be equal to the negative effect produced by
transmission of noise by the BAHA when speech is presented to the hearing ear.

157
Table 35: Results of Speech-in-Noise Testing (19 subjects, paired t test of differences)
Mean difference1 (SD)
p-value 95% confidence interval
S0N0 (noise and speech presented in front of subject)
-0.37 (12.5) 0.90 -6.4– 5.6
S0NB (speech in front, noise to BAHA side)
-5.3 (11.4) 0.06 -10.8 – 0.2
S0N-B (speech in front, noise to non-BAHA side)
8.1 (17.5) 0.06 -0.4 – 16.5
1. The mean difference is the difference between the mean scores for testing with the BAHA turned on
or off. Negative values reflect a reduced level of comprehension and vice versa.
Speech, Spatial and Qualities of Hearing Scale (SSQ)
Of 53 patients who were still BAHA users at the time of the study, 46 completed the SSQ
(87%). Results for the 3 sub-sections of the questionnaire are presented in Table 36.
Table 36: Results of SSQ questionnaire
Controls (n.=49)
Mean (1SD)
Cases (n.=46)
Mean (1SD)
Statistical difference
p.-value (95% CI)
Speech hearing rating scale (SHRS) 451 (19) 50 (18) 0.16 (-2.2 – 13)
Spatial rating scale (SRS) 33 (21) 32 (20) 0.71 (-6.8 – 9.8)
Sound qualities rating scale (SQRS) 67 (14) 65 (17) 0.56 (-4.6 – 8.4)
1. Scores represent a percentage of the total score available.

158
None of the differences between the cases and controls achieved statistical significance. A sub-
group analysis of BAHA users did not reveal any statistically significant difference in outcomes
in any domain of the SSQ (see Table 37), although analysis of the effect of duration of deafness
prior to fitting of the device gave a p-value very close to significance (p=0.053).
Glasgow Benefit Inventory
Of the 53 BAHA users at the time of data collection, 42 (79%) completed the GBI. There was
an overall score of +11 (range -61 - +64), with a score in the general domain of +10, a social
domain of 0 and a physical domain of 0. The median score of +11 was significantly different
from 0 (p<0.001). A sub-group analysis revealed a significantly higher satisfaction (+15
median, p=0.02) among patients with a longer duration of deafness, echoing a trend seen in the
SSQ. These data are presented in Table 37.
Open questions
These responses must be treated with circumspection, but we feel they can be revealing. In
general, most patients expressed approval of the BAHA, although the warmth of their approval
is tempered, and it must be remembered that a substantial proportion of those fitted, n.=5, (9%)
are non-users. These patients were implanted with an abutment, fitted with a BAHA and
subsequently asked to have the fixture removed, feeling that the device was not helpful and in
most cases (4/5) did not respond to the survey: we must assume that their responses to these
questions would have been negative. Of 45 patients who expressed an opinion, 32(71%) said
they would recommend the BAHA to a friend with a similar problem, 8(18%) were ambivalent,
while 5 (11%) were clear they would not.

159
Table 37: Sub-group analysis in BAHA users (SSQ and GBI)
SSQ Mean Total
Scores (SD) 1
SSQ p-value2 GBI Median GBI p-
value3
Aetiology:
V. Schwannoma n.=21
Others n.=25
48 (18)
50 (14)
0.72
11
11
0.99
Duration of deafness:
< 10 years n.=23
>10 years n.=23
44 (14)
53 (17)
0.053
5
15
0.02
Contralateral hearing
Normal4 n.=24
Impaired n.=20
49 (15)
50 (16)
0.80
8
15
0.11
Duration of BAHA
use:
Long (>29 mths) n=23
Short (<29 mths) n=23
48 (12)
48 (21)
0.96
11
11
0.91
1. Means and standard deviations refer to the total score for the SSQ and GBI.
2. T test employed.
3. Mann-Whitney U Test employed.
4. ‘Normal contralateral hearing’ is defined as <20 dB HL PTA.
Users were also asked when they found the device most helpful, whether they used it on a daily
basis and if there were any situations where they would remove the BAHA. 61% of patients
wore the device every day, 17% most days, and 9% ‘hardy ever’ or ‘never’. In general, patients
felt the BAHA most useful in ‘one-to-one conversation’ or in small groups of people. It can be
helpful to a driver who has a deaf ear aimed towards a passenger, or to individuals in meetings
who may find it difficult to position themselves to hear all those present. One patient
commented that the BAHA is ‘useful to me (when) I attend meetings and (when I) play a violin

160
on my ‘good’ side’, another that they would turn on the device: ‘in quieter surroundings where
conversation is coming from both sides.’
Less positively, many commented that they found the noise made by the BAHA in windy
situations irritating, and some felt cosmetically embarrassed, particularly in situations where the
device was exposed (at the hairdresser, for example). The BAHA was generally not found to be
useful in situations where patients felt there was excessive background noise. One patient
wrote: ‘I personally find that the BAHA has very marginally improved my hearing. [In]...areas
where I would have hoped of an improvement, i.e. ...talking and listening to people where there
is competing noise, it is of no use.”
Discussion
Synopsis of key findings
This is the first study to employ the SSQ to assess the functional benefit of the BAHA for the
rehabilitation of SSD. Douglas (2007) used this instrument to examine hearing disability in SSD
(comparing 44 cases with 128 controls), and found significantly poor scores for the SSD group
in the domains of speech (SHRS), and spatial hearing (SRS): the qualities of speech (SQRS)
subscale appeared to be less affected. The work presented here reflects these findings in that it
has demonstrated a similar trend towards impairment in the SRS and SHRS domains, with
sparing of the SQRS. Disappointingly, however, the study failed to identify any significant
difference in outcomes between control patients with SSD and those that have been
rehabilitated with the BAHA.

161
This is the largest study assessing patient satisfaction with the BAHA for SSD using the
Glasgow Benefit Inventory to date. Overall scores (+11), while positive (and significantly
different from 0), were disappointing, and lower than those reported for other BAHA
indications in the literature (see below). Interestingly, the study has identified a significant trend
towards benefit in those with a longer duration of deafness, and this is reflected in a non-
significant trend in the SSQ. It is possible to speculate that the cause for this finding is that the
rehabilitation offered by the BAHA (essentially the amplification of attenuated sound that
originates on the deaf side) is most appreciated by those with no memory of true stereophonic
hearing. A further interesting finding from sub-group analysis is that satisfaction and perceived
function would appear to be stable over time: a finding echoing a recent prospective study
evaluating a number of outcomes over time in 8 patients (Newman, 2008).
A cause for concern lies in the significant minority of patients who report dissatisfaction with
the device or who have asked for the device to be explanted. 5 patients asked to have their
BAHA abutment removed: perhaps significantly, all these patients had lost their hearing in
adulthood (although not all within the last ten years). None of this group suffered significant
complications related to surgery, although one did complain of pain in addition to a lack of
benefit from the device. Cause of SSD in this group reflects the group as a whole: 3 lost hearing
due to a vestibular schwannoma, 1 due to Menière’s disease, 1 as a complication of
stapedotomy. 4 of these patients did not respond to the survey: 1 patient responded and then
subsequently asked to have the BAHA explanted: this individual scored -8 on the GBI.
162
In addition to this group, 5 further patients would not have recommended their device to a
friend, and 8 others were ambivalent. Although 33% of patients described the intervention as a
‘great success’ 44% felt it was a partial success only and 17% described the device as a partial
failure. Two patients who responded to the questionnaire felt the device was a ‘complete
failure’, and it must be expected that those patients who asked for the device to be removed
would share this opinion.
Comparison with other studies
As outlined in the introduction to this chapter: the disability caused by SSD is three-fold: the
attenuation of sound originating on the deaf side (‘the head shadow’), failure to segregate
speech from noise, and an inability to localise sound. Initially, the BAHA seemed to promise an
answer to all three of these disabilities (Vaneecloo, 2000), but subsequent studies cast doubt
upon initial claims that the device could generate ‘pseudo-stereophonic hearing’ (Niparko,
2003, Hol 2005, Lin, 2006). While the latter studies were unable to demonstrate sound
localisation, they did claim improvements in speech-in-noise hearing using the BAHA – a
conclusion also drawn by a small (n.=7) prospective study published recently (Lindstrom,
2009).
This latter conclusion of improved speech-in-noise hearing warrants further examination. Hol
and Linstrom found that when speech was located anteriorly, and noise was directed to the
BAHA-wearing ear, the BAHA impaired hearing, although the results were reversed when the
noise was presented to the normal hearing ear. In our study, similar results were found for the
19 patients we were able to test. These findings shed light upon the rehabilitation offered by the

163
BAHA: the aid acts as a microphone to detect sound on the deaf side - and as such is successful
- but it is also detrimental if that sound is unwanted. It is this benefit detected most in our study
(through open questions and trends seen in the SHRS): patients report an improvement in
hearing in relatively quiet situations, or in those situations where their position is fixed (such as
in driving a car). Interestingly, this is the benefit suggested by a study examining the theoretical
benefit of bilateral BAHA use and the use of BAHA in SSD (Stenfeld, 2005). This capacity,
however, should not be confused with an ability to enhance ‘speech-in-noise hearing’: a more
sophisticated process than simply the ability to access all sound available in the periphery. The
distinction is important, because speech-in-noise hearing handicap is often the issue that most
exercises patients with a hearing loss.
The GBI has been used a number of times to assess benefit in BAHA usage (Arunachalam,
2001, Dutt, 2002, McLarnon, 2004). McLarnon surveyed 73% of 94 patients and analysed sub-
group scores grouped by indication for the device: patients with mastoid cavities, chronic active
otitis media, congenital atresia and otosclerosis scored +30, +37, +45 and +28 respectively.
Interestingly, the study included 3 patients with unilateral deafness after vestibular schwannoma
surgery: these scored +24. Our own results (+11) suggest that this indication offers less
satisfaction to patients than others, and this echoes Tringali’s recent survey of 118 patients with
BAHA fitted for SSD (Tringali, 2008).
Chapter Conclusions
Although the patients studied in this chapter are not exclusively patients who have been
diagnosed with vestibular schwannomas, this group forms the largest number of patients

164
studied. Furthermore, there has not been any significant difference demonstrated between
outcomes in patients with different SSD aetiologies (see Table 37), and it would seem
reasonable to draw conclusions about the efficacy of rehabilitation of SSD caused by vestibular
schwannomas from this study.
Regrettably, the findings presented here suggest caution rather than enthusiasm when
considering rehabilitation for SSD with BAHA. It is clear from this and other studies that while
some patients benefit from the BAHA, this is less than that derived from the BAHA when used
for other indications. Furthermore, it seems increasingly clear that while the BAHA is able to
rehabilitate one element of the handicap created by SSD (the ‘head-shadow’), this rehabilitation
is only beneficial if the sound transmitted is of use to the patient: if the sound is noise, this
transmission is unwanted. Finally, there is increasing evidence that those more sophisticated
functions lost in SSD (sound localisation and speech in noise discrimination) cannot be
rehabilitated with the BAHA. Those individuals who have known binaural hearing (such as
those who have lost hearing relatively recently due to a vestibular schwannoma) are likely to be
disappointed with the results of BAHA surgery if the extent of rehabilitation that they can hope
for is not clearly explained.

165
CONCLUSION
The aim of this thesis has been to explore issues relating to the natural history and management
of vestibular schwannomas with the resources offered by the Birmingham database. This
conclusion will attempt :
-to suggest appropriate management strategies for differing tumours based upon evidence
offered in the thesis and in the published literature.
-to propose avenues for future research in the field.
Suggested management for differing categories of vestibular schwannoma
Intracanicular and Tokyo 1 and 2 solid tumours without useful hearing
These small-medium sized tumours that measure up to a maximal size of 2cm in the
cerebellopontine angle should be managed with an initial period of conservative management to
determine whether tumour growth is persistent or has arrested. As demonstrated in chapter 1,
some 65% of watched tumours with a minimum of 5 years follow-up will not grow beyond the
dimensions with which they originally present. This data is not unique in the world literature, as
previously discussed (Introduction, literature search and Table 5), a number of case series have
documented tumour stasis over time. Nevertheless, this thesis does offer a solidity of data, in
particular due to the explicit documentation of follow-up. By excluding from analysis those
patients with follow-up of duration less than five years; an important confounding factor - the
inclusion of patients who may demonstrate growth, but have not to date – is eliminated from the
data.

166
The aim of detecting risk factors for growth in this group of tumours is undertaken in chapter 2.
The study identifies two clear risk factors for growth: tumour size and a short duration of
symptoms. Similar findings have been published by other groups (see Table 5), and our data
lends support to this work. As previously discussed, the suggestion that a patient is ‘high risk’
for growth does not always lead to a deviation in management away from that outlined above. It
has not been the practise of the Birmingham team to advocate a change in treatment strategy
based upon these findings to date, but it may possibly be advantageous to patients to suggest
primary radiosurgical treatment in cases with a short duration of symptoms and a large tumour.
If such tumours grow rapidly (the maximal rate of growth we have seen in our series is 2cm
annually), they can potentially loose the opportunity for stereotactic radiosurgery. There is
potential for further research to explore this area of study, in addition to the pursuit of other
markers of growth in vestibular schwannomas (see ‘Further avenues of research’ below).
Chapter 4 demonstrated that in terms of facial nerve outcomes, patients who are managed in this
manner enjoy better facial nerve outcomes than those who are managed with primary surgery.
This data counters arguments made by advocates of primary surgery (Meyer, 2006) who
suggests that conservative management should only be offered to selected patients because of
the risk of tumour growth leading to poorer facial nerve outcomes as larger tumours undergo
surgery. There is no doubt that a theoretically poorer outcome will be achieved in tumours that
are a little larger when coming to surgery because of a period of observation, but this small
deficit is outweighed by the benefit enjoyed by the group overall. To the author’s knowledge,
the publication associated with chapter 4 (Martin 2008) is the only study to employ an
intention-to-treat analysis to compare outcomes in the two treatment modalities studied.
167
Chapter 5 details the design of an evidence-based protocol for the timing of scans following
induction of patients into conservative management. Although other groups have proposed
strategies for surveillance (Stangerup, 2006), these have not been supported by evidence in the
manner presented here and in the publication associated with chapter 5 (Martin, 2009). This
protocol is novel in particular in stressing - and providing evidence for - the utility of a
surveillance scan performed six months after the initial diagnostic scan. This scan has been
successful in detecting a number of rapidly growing tumours and in their detection, allowing
their expeditious treatment. A further feature of this protocol is the reduction in scans demanded
over time in comparison to other authors who advocate surveillance on an annual basis
(Hajihoff, 2008). This reduction in scan frequency is both likely to be economically
advantageous (although no formal economic analysis has been undertaken (see below: ‘Further
avenues of research’), in addition to possibly enhancing patient compliance.
Intracanicular and Tokyo 1 and 2 cystic tumours without useful hearing
As has been demonstrated in both chapters 2 and 5, cystic tumours present a significant threat in
terms of both demonstrating growth and in terms of the speed of growth. The nature of ‘growth’
when referred to cystic vestibular schwannomas is of interest. As noted in the introduction to
this thesis (‘histopathology’), vestibular schwannomas are characterised histologically by two
tissue types: Antonini A and B. The latter tissue is loosely packed and prone to cystic micro
degeneration (Nager, 1993), and in some 5% (in our series) of cases, this degeneration becomes
macroscopic. This leads to a rapid expansion in dimension of the tumour, as we have
demonstrated. Hitherto, we have advised against conservative management for these tumours

168
(Martin, 2009), and this would seem to be reasonable. A caveat might be that results for
microsurgery are reported by some authors (Moon, 2007, Characid, 2000) – but not all
(Peccadillo, 2009) – to be less favourable in cystic tumours. The response of cystic tumours to
radiotherapy is reported to be favourable in terms of long-term tumour bulk reduction
(Sheraton, 2000), and it would seem appropriate to offer early radiotherapy to patients
presenting with cystic vestibular schwannomas.
Intracanicular and Tokyo 1 and 2 with useful hearing
This group of patients are of particular interest and probably represent the group for who
management poses the greatest controversy. In chapter 3 it has been demonstrated that a
significant proportion of patients (approximately one third) presenting with good hearing
maintain that hearing at the same level over medium term follow-up. Some 15% of patients will
lose hearing rapidly while under observation, the remaining 50% of patients losing hearing at a
mean rate of 4.1dB annually. The technique employed to measure hearing preservation (hearing
loss relative to the contralateral ear) is novel in the literature and is, the author argues, more
useful than the technique of preservation within class, particularly when follow-up is short.
Unfortunately, there are no reliable risk factors that may predict which patients are likely to lose
or preserve hearing beyond tumour growth: a ‘risk factor’ that effectively directs management.
Given the data presented in chapter 3 and summarised above, the author would argue that
observation probably offers the best opportunity for hearing preservation for patients presenting
with small-medium sized tumours. In our experience, hearing preservation surgery is successful
in approximately 50% of cases: those for who it is not successful will lose hearing suddenly and

169
will not compensate for that loss as well as patients who sustain a gradual erosion of hearing (as
will occur in a hearing loss that develops while under surveillance). Similarly, results of
radiosurgery are in our experience less successful than those often reported in the literature (see
Table 9). There are indicators that certain tumours may be less at risk of losing hearing due to
radiosurgery (in particular those located medially that can be treated with a cochlea-sparing
dose), but it is not clear that this should be offered to patients in whom growth has not been
demonstrated.
Tumours Tokyo Grade 3
These tumours measure between 2 and 3cm in greatest dimension in the cerebellopontine angle.
These tumours can be treated with either conservative, radiotherapeutic or surgical
management. In general, our approach has not been to offer conservative management as a first
line treatment for these tumours, principally because in the event of growth, there is a chance
that patients will no longer be eligible for radiotherapy treatment. Series have reported
outcomes from radiotherapy offered to patients with tumours larger than 3cm, but results are
generally poorer than those found when treating smaller tumours. Mandy (2010) reports a series
of 25 cases, in which 5 patients suffered new facial nerve injury, and there was a recurrence rate
of 16%. Our limited experience of managing tumours measuring >2cm in the cerebellopontine
angle conservatively has been to see growth in 6 tumours: 43% of the total. This small sample
would suggest that growth in these tumours is probably more likely than in the population as a
whole (rate 35%), but probably not inevitable.

170
Tumours Tokyo Grade 3,4 and 5 treated surgically
In cases where surgical treatment is undertaken, priority is given to the preservation of the facial
nerve, with an intra-operative assessment of adhesion of the tumour capsule to the nerve and the
degree of nerve attenuation to determine whether total or near-total tumour resection should be
undertaken. Chapter 6 assesses the outcomes achieved taking this approach, and suggests that
the technique is effective in preserving nerve function, with 61% preservation of normal facial
nerve function in a group of patients with a mean tumour dimension of 27mm. Importantly,
only 6% of patients sustained Grade IV facial nerve injuries, with no outcomes worse than this.
The cost of less-than-total tumour excision is an increased rate of recurrence (seen in 6% of
near-total excision procedures, comparing unfavourably with a rate of 1% in totally excised
tumours). This rate of recurrence is low, and we would anticipate treatment of recurrent
tumours with radiosurgery to be successful, although to date follow-up and experience is
lacking.
Rehabilitation of single-sided deafness
Chapter 7 assessed departmental experience with the bone-anchored hearing aid (BAHA) to
treat single-sided deafness, a significant handicap for patients with vestibular schwannomas.
Unfortunately, our experience with this device has been mixed. In cases where patients have
specific listening needs that respond to the lifting of the head shadow, the device is of benefit.
For other handicaps caused by single-sided deafness (speech-in-noise hearing, sound
localisation), the hearing aid is not helpful. Individuals who are not prepared for the benefit
offered (and the limits of that benefit) may feel that the BAHA is a disappointment. Such
patients can then feel acutely those negative factors inherent to the device (wound healing
171
issues, cosmetic embarrassment, noise from wind) that might otherwise be overlooked. The
research presented in chapter 7 has been useful in allowing effective counselling of our patients
and, it is to be hoped, enhancing their perceived benefit.
Further avenues of research
The management of mildly impaired hearing patients with small-medium sized tumours
As mentioned above, these patients present a dilemma for management. In many cases, the
tumours they harbour do not require treatment in order to halt tumour growth, but hearing loss
is progressive. In the United States, a jurisdiction with a more aggressive approach to
management of vestibular schwannomas, surgery would in many cases be offered, usually
employing a middle fossa surgical approach. Outcomes in the world literature for this surgery
are detailed in Table 8 and suggest hearing preservation rates at levels of 50%. Our own
experience of 36 patients operated upon via the retro-sigmoid route are presented in Table 27: 8
individuals have preserved useful hearing of grade A or B (24%). In contrast, radiotherapeutic
series detailing hearing report outcomes of 50-80% preservation.
While these outcomes appear impressive, our own experience is less positive: as detailed in
chapter 3, patients with serviceable hearing referred for radiotherapy for definitive treatment
have in all cases lost that hearing (although we would acknowledge that only 5 of 11 patients
treated in this manner had adequate data for analysis). To the authors’ knowledge, there is no
well-designed study comparing conservative with radiotherapeutic hearing preservation, and
such a study, designed prospectively to ensure adequate follow-up of conservatively-managed
patients, would be helpful in directing management of this group.
172
An economic analysis of the impact of increasingly conservative management of vestibular
schwannomas
This thesis has detailed a number of ways in which the management of vestibular schwannomas
is changing. In particular, there is a reduction in surgical management with an increase in both
conservative and radiotherapeutic management. Furthermore, the nature of surgery is changing
with an emphasis upon less-than-total tumour excision. The economic ramifications of these
changes are various, both for the health care system and also for patients undergoing treatment.
A thorough health economic study assessing these changes would be of value in planning
services needed to manage the condition in future years.

173
REFERENCES
A
Acoustic Neuroma. NIH Consensus Statement Online 1991 Dec 11-13 [cited 13/11/2009]; 9
(4): 1-24
American Academy of Otolaryngology-Head and Neck Surgery (1995) Committee on hearing
and equilibrium guidelines for the evaluation of hearing preservation in acoustic neuromas.
Otolaryngol Head Neck Surg, 113: 179-180
Andrews, D.W., Werner-Wasik, M., and Den, P.B. et al. Toward dose optimization for
fractionated stereotactic radiotherapy for acoustic neuromas: comparison of two cohorts. Int J
Radiat Oncol Biol Phys, 74(2): 419-426
Angeli, S. and Jackson C., (1997) “Neurotological evaluation.” In House, W.F., Luetje, C., and
Doyle, K. (eds.) Acoustic tumours diagnosis and management. San Diego: Singular
Publishing Group. pp. 85-91
Akhmametyeva E.M., Mihaylova M.M. and Luo, H. et al. (2006) Regulation of the
neurofibromatosis 2 gene promoter expression during embryonic development. Dev Dyn, 235
(10): 2771-2785
Acoustic Neuroma. NIH Consens Statement Online 1991 Dec 11-13 [cited 13/11/2009]; 9 (4):
1-24
Arunachalam P.S., Kilby D., Meikle et al. (2001) Bone-anchored hearing aid quality of life
assessed by Glasgow Benefit Inventory. Laryngoscope 111: 1260-3

174
Arts, H.A., Telian, S.A. and El-Kashlan, H. et al. (2006) Hearing preservation and facial nerve
outcomes in vestibular schwannoma surgery: results using the middle cranial fossa approach.
Otol Neurotol 27: 234-41
B
BAO-HNS. (2002) Clinical Effectiveness Guidelines: Acoustic Neuroma (Vestibular
Schwannoma) Document 5: London
Battalglia, A. Mastrodimos, B. and Cueva, Roberto. (2006) Comparison of growth patterns of
acoustic neuromas with and without radiosurgery. Otol Neurotol, 27: 705-712
Benech, F., Perez, R., Fontanella, M.M., et al. (2005) Cystic versus solid vestibular
schwannomas: a series of 80 grade II-IV patients. Neurosurg Rev, 28(3): 1437-2320
Bloch, D.C., Oghalai, J.S., Jackler, R.K., et al. (2004) The fate of the tumor remnant after less-
than-complete acoustic neuroma resection. Otolaryngol Head Neck Surg, 130(1): 104-12
Bonding, P., Holm Jonsson, M., and Ahlgren, P. (1992) The bone-anchored hearing aid:
osseointegration and audiological effect. Acta Oto-Laryngol 112(492): 42-45
Brackmann, D.E., Owens, R.M., and Friedman, R.A. et al. Prognostic factors for hearing
preservation in vestibular schwannoma surgery. Am J Otol, 21(3): 417-24
C
Charabi, S., Thomsen, J. and Tos, M. et al. (1998) Acoustic neuroma/vestibular schwannoma
growth: past, present and future. Acta Otolaryngol, 118 (3): 327-332
Charabi, S., Tos, M. and Thomsen, J. et al. (2000) Cystic vestibular schwannoma – clinical and
experimental studies. Acta Otolaryngol Suppl, 543: 11-13

175
Chopra, R., Kondziolka, D., and Nirnanjan, A. et al. (2007) Long-term follow-up of acoustic
schwannoma radiosurgery with marginal tumor doses of 12 to 13 Gy. Int J Radiat Oncol Biol
Phys, 68(3): 845-851
Combs, S.E., Wezel, T., and Schultz-Ertner, D. et al. (2009) Differences in clinical results after
LINAC-based single-dose radiosurgery versus fractionated stereotactic radiotherapy for patients
with vestibular schwannomas. Int J Radiat Oncol Biol Phys, Jul 13 (epub ahead of print)
Cushing, H. (1917) Tumours of the nervous acousticus and the syndrome of the
cerebellopontine angle. Philadelphia: WB Saunders
D
Dandy, W. (1941) Results of removal of acoustic tumors by the unilateral approach. Arch Surg
42: 1027-1033
Davis, A. (1995) Hearing in adults. London: John Wiley.
Dawes, P.J.D. and Jeannon, J.P. (1998) Audit of regional screening guidelines for vestibular
schwannoma. J Laryngol Otol, 112: 860-864
Deen, H.G., Ebershold, M.J. and Harner, S.G. et al. (1996) Conservative management of
acoustic neuroma: an outcome study. Neurosurgery, 39 (2): 260-266
Douglas, S.A., Yeung, P., Daudia, A., et al. (2007) Spatial hearing disability after acoustic
neuroma removal. Laryngoscope, 117: 1648-51
Driscoll, C.L.W. (2000) “Vestibular schwannoma (acoustic neuroma).” In Jackler, R.K., and
Driscoll C.L.W. (eds.) Tumors of the ear and temporal bone. Philadelphia: Lippincott
Williams and Wilkins. pp. 172-218

176
Dutt S.N., McDermott A.L., Jelbert A. et al. (2002) The Glasgow benefit inventory in the
evaluation of patient satisfaction with the bone-anchored hearing aid: quality of life issues. J.
Laryngol. Otol. (Suppl.) 28: 7-14
E
Eldridge, R. and Parry, D. (1992) Vestibular schwannoma (acoustic neuroma) consensus
development conference. Neurosurgery, 30 (6): 962-964
El Bakkouri, W., Romain, E.K and Guichard, J.-P. et al. (2009) Conservative management of
386 cases of unilateral vestibular schwannoma: tumor growth and consequences for treatment. J
Neurosurg, 110: 662-669
El-Kashlan, H.K., Zeitoun, H., Arts, H.A. et al. (2000) Recurrence of acoustic neuroma after
incomplete resection. Am J Otol, 21 (3): 389-392
Esquia-Medina, G.N., Grayeli, A.B., and Ferray, E. et al. (2009) Do facial nerve displacement
pattern and tumor adhesion influence the facial nerve outcome in vestibular schwannoma
surgery? Otol Neurotol, 30 (3): 392-397
F
Ferri, G.G., Modugno, G.C. and Pirodda, A. et al. (2008) Conservative management of
vestibular schwannomas: an effective strategy. Laryngoscope, 118: 951-957
Flint, D., Fagan, P. and Panarese, A. (2005) Conservative management of sporadic unilateral
acoustic neuromas. J Laryngol Otol, 119: 424-428

177
Fortnum, H., O’Neill, C. and Taylor, R. et al. (2009) The role of magnetic resonance imaging in
the identification of suspected acoustic neuroma: a systematic review of clinical and cost
effectiveness and natural history. Health Technol Assess, 13 (18): iii-iv, ix-xi, 1-154
Freeman, S.R., Ramsden, R.T., Saeed, S.R., et al. (2007) Revision surgery for residual or
recurrent vestibular schwannoma. Otol Neurotol, 28 (8): 1076-82
Fucci, M.J., Buchman, C.A. and Brackmann, D.E. et al. (1999) Acoustic tumor growth:
implications for treatment choices. Am J Otol, 20: 495-499
Fukuoka, S., Takanashi, M., and Hojyo, A. et al. (2009) Gamma knife radiosurgery for
vestibular schwannomas. Prog Neurol Surg, 22: 45-62
G
Gardner, G., Robertson, J.H. (1988) Hearing preservation in unilateral acoustic neuroma
surgery. Ann Otol Rhinol Laryngol, 97: 55-66
Gatehouse S. and Noble W. (2004) The speech, spatial and qualities of hearing scale (SSQ). Int
J Audiol 43: 85-99
Glasscock, M.E., Pappas, D.G. and Manolidis, S. et al. (1997) Management of acoustic
neuroma in the elderly population. Am J Otol, 18 (2): 236-242
Gjuric, M., Wigand, M.E. and Wolf, S.R. (2001) Enlarged middle fossa vestibular schwannoma
surgery: experience with 735 cases. Otol Neurotol, 22: 223-231
Godefroy, W.P., van de May, A.G., de Bruine, F.T. et al. (2009) Surgery for large vestibular
schwannoma: residual tumour and outcome. Otol Neurotol, 30 (5): 629-634
Gormley, W.B., Laligam, N., and Sekhar, N. et al. (1997) Acoustic neuromas; results of current
surgical management. Neurosurgery, 41 (1): 50-60

178
Grayeli, A.B., Kalamarides, M. and Ferrary, E. et al. (2005) Conservative management versus
surgery for small vestibular schwannomas. Acta Oto-Laryngologica, 125: 1063-1068
Grothe, B., Pecka, M., McAlpine, D. (2010) Mechanisms of sound localisation in mammals.
Physiol Rev, 90: 983-1012
H
Hajioff, D., Raut, V.V. and Walsh, R.M. et al. (2008) Conservative management of vestibular
schwannomas: third review of a ten-year prospective study. Clin Otoloaryngol, 33: 29-37
Hansen, M.R., Roehm, P.C. and Chatterjee, P. et al. (2006) Constitutive neuregulin-1/ErbB
signalling contributes to human vestibular schwannoma proliferation. Glia, 53 (6): 593-600
Harner, S.G. and Laws, E.R. (1981) Diagnosis of acoustic neurinoma. Neurosurgery, 9 (4):
373-379
Hasegawa, T., Fujitani, S. and Katsumata, S. et al. (2005) Stereotactic radiosurgery for
vestibular schwannomas: analysis of 317 patients followed more than 5 years. Neurosurgery,
57(2): 257-265
Harcourt, J., Vijaya-Sekaran, S. and Loney, E. et al. (1999) The incidence of symptoms
consistent with cerebellopontine angle lesions in a general ENT out-patient clinic. J Laryngol
Otol, 113: 518-522
Hardell, L., and Carlberg, M. (2009) Mobile phones, cordless phones and the risk for brain
tumours. Int J Oncol, 35 (1): 5-17
Hoistad, D.L., Melnick, G. and Mamikoglu, B. et al. (2001) Update on conservative
management of acoustic neuroma. Otol Neurotol, 22: 682-685

179
Hol M.K.S., Bosman A.J., Snik A.F. et al. (2005) Bone-anchored hearing aids in unilateral
inner ear deafness: an evaluation of audiometric and patient outcome measurements. Otol
Neurotol 26: 999-1006
House, J.W., and Brackmann, D.E. (1985) Facial nerve grading system. Otolaryngol Head
Neck Surg, 93: 146-147
I
Irving, R.M., Moffat, D.A. and Hardy, D.G. et al. (1997) A molecular, clinical, and
immunohistochemical study of vestibular schwannoma. Otolaryngol Head Neck Surg, 116:
426-430
Irving, R.M., Jackler, R.K., and Pitts, L.H. et al. (1998) Hearing preservation in patients
undergoing vestibular schwannoma surgery: comparison of middle fossa and retrosigmoid
approaches. J Neurosurg, 88(5): 840-845
K
Kanzaki, J., Tos, M. and Nielsen, M. et al. (2003) New and modified reporting systems from the
Consensus Meeting on Systems for Reporting Results in Vestibular Schwannoma. Otol
Neurotol, 24: 642-648
Kano, H., Kondziolka, D., and Khan, A. et al. (2009) Predictors of hearing preservation after
stereotactic radiosurgery for acustic neuroma. J Neurosurg, 111(4): 863-873
Kaylie, D.M., Gilbert, E. and Horgan, M.A. et al. (2001) Acoustic neuroma surgery outcomes.
Otol Neurotol, 22: 686-689

180
Kemnick, J.L., Langman, A.W., Niparko, J.K., et al. (1991) Operative management of acoustic
neuromas: the priority of neurologic function over complete resection. Otolaryngol Head Neck
Surg, 104(1): 96-99
Khrais, T., Romano, G. and Sanna, M. (2007) Nerve of origin of vestibular schwannoma: a
prospective study. J Laryngol Otol, 122: 128-131
Koutsimpelas, D., Stripf, T. and Heinrich, H.R. et al. (2007) Expression of vascular endothelial
growth factor and basic fibroblast growth factor in sporadic vestibular schwannomas correlates
to growth characteristics. Otol Neurotol, 28(8): 1094-1099
Kuo, T.C., Jackler R.K. and Wong, K. et al. (1997) Are acoustic neuromas encapsulated
tumors? Otolaryngol Head Neck Surg, 117 (6): 606-609
L
Leksell, L. (1951) The stereotactic method and radiosurgery of the brain. Acta Chir Scand,
102: 316-319
Lin L.M., Bowditch S., Amderson M.J. et al. (2006) Amplification in the rehabilitation of
unilateral deafness: speech in noise and directional hearing effects with bone-anchored hearing
and contralateral routing of signal amplification. Otol Neurotol 27: 172-182
Linskey, M.E. (2008) Hearing preservation in vestibular schwannoma stereotactic radiosurgery:
what really matters? J Neurosurg, 109: 129-136
Linstrom C.J., Silverman C.A. and Yu G.P. (2009) Efficacy of the bone-anchored hearing aid
for single-sided deafness. Laryngoscope 119(4): 713-20
Lobato-Polo, J., Kondziolka, D. and Zorro, O. et al. (2009) Gamma knife radiosurgery in
younger patients with vestibular schwannomas. Neurosurgery, 65(2): 294-300

181
M
Malhotra, P.S., Sharma, P. and Fishman, M.A. et al. (2009) Clinical, radiographic, and
audiometric predictors in conservative management of vestibular schwannoma. Otol Neurotol,
30 (4): 507-14
Mangham, C.A. (2004) Retrosigmoid versus middle fossa surgery for small vestibular
schwannomas. Laryngoscope, 114: 1455-1461
Mamikoglu, B., Wiet, R.J., and Esquivel, C.R. (2001) Translabyrinthine approach for the
management of large and giant vestibular schwannomas. Otol Neurotol, 23: 224-227
Mandl, E.S., Meijer, O.W. and Slotman, B.J. et al. (2010) Stereotactic radiation therapy for
large vestibular schwannomas. Radiother Oncol, 95(1): 94-98
Martin, T.P.C. (2005) Comment on: Conservative management of acoustic neuroma: a meta-
analysis and proposed treatment algorithm. Laryngoscope, 115 (9): 1704
Martin, T.P.C., Tzifa, K., and Kowalski, C. et al. (2008) Conservative versus primary surgical
treatment of acoustic neuromas: a comparison of rates of facial nerve and hearing preservation.
Clin Otolaryngol, 33: 228-235
Martin, T.P.C., Senthil, L. and Chavda, S.V. et al. (2009) A protocol for the conservative
management of vestibular schwannomas. Otol Neurotol, 30(3): 381-385
Martin, T.P.C., Lowther, R., and Cooper, H. et al. (2010) The bone-anchored hearing aid in the
rehabilitation of single-sided deafness: experience with 58 patients. Clin Otolaryngol, 35: 284-
290

182
Martin, T.P.C., Fox, H., and Ho, E.C. et al. (2012) Facial nerve outcomes in functional
vestibular schwannoma surgery: less than total tumour excision significantly improves results. J
Laryngol Otol, 126(2):120-124
Matthew, G.D., Facer, G.W. and Suh, K.W. et al. (1978) Symptoms, findings, and methods of
diagnosis in patients with acoustic neuroma. Laryngoscope, 88 (12): 1893-1903
Matthies C. and Samii, M. (1997) Management of 1000 vestibular schwannomas (acoustic
neuromas): clinical presentation. Neurosurgery, 40 (1): 1-9
McLarnon C.M., Davison T. and Johnson I.J.M. (2004) Bone-anchored hearing aid: comparison
of benefit by patient sub-groups. Laryngoscope 114: 942-4
Meyer, T.A., Canty, P.A., and Wilkinson, E.P. et al. (2006) Small acoustic neuromas: surgical
outcomes versus observation or radiation. Otol Neurotol, 27: 380-392
Messerli, S.M., Prabhakar, S., and Tang Y. et al. (2006) Treatment of schwannomas with an
oncolytic recombinant herpes simplex virus in murine models of neurofibromatosis type 2.
Hum Gene Ther, 17(1): 20-30
Moffat, D.A., Jones, S.E.M., and Mahendran, s. et al. (2004) Referral patterns in vestibular
schwannomas – 10 years on. Clin Otolaryngol, 29 (5): 515-517
Mohyuddin, A., Vokurka, E.A. and Evans, D.G.R. et al. Is clinical growth index a reliable
predictor of tumour growth in vestibular schwannoma? Clin Otolaryngol, 28: 85-90
Moon, K.S., Jung, S. and Seo, S.K. et al. (2007) Cystic vestibular schwannomas: a possible role
of matrix metalloproteinase-2 in cyst development and unfavourable surgical outcome. J
Neurosurg, 106(5): 866-871

183
N
Nager, G.T. (1993) Pathology of the ear and temporal bone. Baltimore: Williams and
Wilkins.
Nakai, Y., Zheng, Y. and MacCollin, M. et al. (2006) Temporal control of Rac in Schwann cell-
axon interaction is disrupted in NF2-mutant schwannoma cells. J Neurosci, 26: 3390-3395
National Institute of Health Consensus Statement on Acoustic Neuroma (1991) 9 (4): 1-24
Nedzelski, J.M., Canter, R.J. and Kassel, E.E. et al. (1986) Is no treatment good treatment in the
management of acoustic neuromas in the eldely? Laryngoscope, 96 (8): 825-829
Nedzelski, J.M., Schlessel, D.A. and Pfleiderer, A. et al. (1992) Conservative management of
acoustic neuromas. Otolaryngol Clin North Am, 25 (3): 691-705
Newman C.W., Sandridge S.A., and Wodzisz L.M. (2008) Longitudinal benefit from and
satisfaction with the BAHA system for patients with acquired unilateral sensorineural hearing
loss. Otol Neurotol, 29: 1123-31
Niranjan, A., Mathieu, D., and Flickinger, J.C. et al. (2008) Hearing preservation after
intracanalicular vestibular schwannoma radiosurgery. Neurosurgery, 63(6): 1054-1062
Niparko J.K., Cox K.M. and Lustig L.R. (2003) Comparison of the bone-anchored hearing aid
implantable hearing device with contralateral routing of offside signal amplification in the
rehabilitation of unilateral deafness. Otol Neurotol 24: 73-78
P
Piccirillo, E., Wiet, M.R., and Flanagan, S. et al. (2009) Cystic vestibular schwannoma:
classification, management, and facial nerve outcomes. Otol Neurotol, 30(6): 826-834

184
Prasher, D., Tun, T. and Brookes, G. et al. (1995) Mechanisms of hearing loss in acoustic
neuroma: an otoacoustic emission study. Acta Otolaryngol, 115: 375-381
Pollock, B.E., Link, M.J., and Foote, R.L. (2009) Failure rate of contemporary low-dose
radiosurgical technique for vestibular schwannoma. Neurosurgery, 111(4): 840-844
Plotkin, S.R., Stemmer-Rachamimov, A.O., Barker, F.G. 2nd et al. (2009) Hearing
improvement after bevicizumab in patients with neurofibromatosis type 2. N Engl J Med,
361(4):358-367
Pritchard C., Clapham L., Davis A. et al. (2003) Psycho-socio-economic outcomes in acoustic
neuroma patients and their carers related to tumour size. Clin Otolaryngol, 29: 324-330.
R
Raut VV, Walsh RM, Bath AP, et al. (2005) Conservative management of vestibular
schwannomas- second review of a prospective longitudinal study. Clin Otolaryngol, 29: 505-
514
Ryzenman J.M., Pensak M.L., Tew J.M. (2005) Facial paralysis and surgical rehabilitation: a
quality of life analysis in a cohort of 1,595 patients after acoustic neuroma surgery. Otol
Neurotol 26: 516-21
Régis, J., Tamura, M., Delsanti, C. et al. (2008) Hearing preservation in patients with unilateral
vestibular schwannoma after gamma knife surgery. Prog Neurol Surg, 21: 142-151
Robinson K., Gatehouse S. and Browning G. (1996) Measuring patient benefit from
otorhinolaryngological surgery and therapy. Ann Otol Rhinol Laryngol 105: 415-22
Rogg, J.M., Ahn, S.H. and Tung, G.A. et al. (2005) Prevalence of hydrocephalus in 157 patients
with vestibular schwannoma. Neuroradiology, 47(5): 344-351

185
Rouleau, G.A., Merel, P., Lutchman, M. et al. (1993) Alteration in a new gene encoding a
putative membrane-organising protein causes neurofibromatosis type 2. Nature, 363 (6429):
515-521
Rowe, J., Radatz, M. and Kemeny, A.A. “Gamma knife stereotactic radiosurgery.” In Gleeson,
M. (ed.) Scott-Brown’s Otorhinolaryngology, head and Neck Surgery. 7th ed. London:
Hodder Arnold. p. 3989-3991
S
Sakaki, S., Nakagawa, K., Hatakeyama, T. et al. (1991) Recurrence after incompletely resected
acousticus neurinomas. Med J Osaka Univ, 40 (1-4): 59-66
Saliba, I. Martineau, G. and Chagnon, M. (2009) Asymmetric hearing loss: rule 3,000 for
screening vestibular schwannoma. Otol Neurotol, 30 (4): 515-521
Sandooram D., Grunfeld EA., McKinney et al. (2004) Quality of life following microsurgery,
radiosurgery and conservative management for unilateral vestibular schwannoma. Clin
Otolaryngol Allied Sci 29(6): 621-627.
Seizinger, B.R., Martuza, R.L. and Gusella, J.F. (1986) Loss of genes on chromosome 22 in
tumorigenesis of human acoustic neuroma. Nature, 322: 644-647
Seol, H.J., Kim, C.H., Park, C.K., et al. (2006) Optimal extent of resection in vestibular
schwannoma surgery: relationship to recurrence and facial nerve preservation. Neurol Med
Chir (Tokyo) 46 (4): 176-180
Sheppard, I.J., Milford, C.A. and Anslow, P. (1996) MRI in the detection of acoustic neuromas
– a suggested protocol for screening. Clin Otol Allied Sci, 21(4): 301-304

186
Shirato, H., Sakamoto, T., Takeichi, N. et al. (2000) Fractionated stereotactic radiotherapy for
vestibular schwannoma (VS): comparison between cystic-type and solid-type VS. Int J Radiat
Oncol Biol Phys, 48(5): 1395-13401
Silverstein, H., McDaniel, A., Norrell, H. et al. (1985) Conservative management of acoustic
neuroma in the elderly patient. Laryngoscope, 95 (7): 766-70
Smouha, E.E., Yoo, M. and Mohr, K. (2005) Conservative management of acoustic neuroma: a
meta-analysis and proposed treatment algorithm. Laryngoscope, 115 (3): 450-454
Snelling, J.D., Krywawych, M. and Majithia, A. et al. (2008) The compliance, true positive and
false negative rates of the Charing Cross protocol for magnetic resonance imaging screening for
cerebellopontine angle lesions. J Laryngol Otol, 122 (3): 255-258
Shin, Y.J., Fraysse, B. and Cognard, C. et al. (2000) Effectiveness of conservative management
of acoustic neuromas. Am J Otol, 21: 857-862
Staecker, H., Nadol, J.B., and Ojeman, R. et al. (2000) Hearing preservation in acoustic
neuroma surgery: middle fossa versus retrosigmoid approach. Am J Otol, 21 (3): 399-404
Stangerup, S.E. ([email protected]) (15 November 2009). Re. Sex bias in demographics of
vestibular schwannoma. e-mail to T. Martin ([email protected])
Stangerup, S.E., Thomsen, J. and Tos, M. et al. (2009) Long-term hearing preservation in
vestibular schwannoma. Otol Neurotol, Oct 31 (Epub ahead of print)
Stangerup, S.E., Cayé-Thomasen, P. and Tos, M. et al. (2008) Change in hearing during ‘wait
and scan’ management of patients with vestibular schwannoma. J Laryngol Otol, 122: 673-681
Stangerup, S.E., Cayé-Thomasen, P. and Tos, M. (2006) The natural history of vestibular
schwannoma. Otol Neurotol 27 (4): 547-552

187
Stenfelt, S. (2005) Bilateral fitting of BAHAs and BAHA fitted in unilaterally deaf persons:
acoustical aspects. Int J Audiol 44, 178-189
Strasnick, B., Glasscock, M.E. and Haynes, D. (1994) The natural history of untreated acoustic
neuromas. Laryngoscope, 104 (9): 1115-1119
T
Tarlov, I.M. (1937) Structure of nerve root: differentiation of sensory from motor roots:
observation on identification of function on roots of mixed cranial nerves. Arch Neurol, 37:
1338-1355
Thomas, C., Di Maio, S., and Ma, R. et al. (2007) Hearing preservation following fractionated
stereotactic radiotherapy for vestibular schwannomas: prognostic implications of cochlea dose.
J Neurosurg, 107(5): 917-926
Timmer, F.C., Hanssens, P.E., and van Haren, A.E. et al. (2009) Gamma knife radiosurgery for
vestibular schwannomas: results of hearing preservation in relation to the cochlear radiation
dose. Laryngoscope, 119(6): 1076-1081
Tjellstrom, A., and Granstrom, G. (1995) One-stage procedure to establish osseointegration: a
zero to five years follow-up report. J Laryngol Otol, 109: 593-598
Tos, M. (2008) “Natural History of Vestibular Schwannoma.” In Gleeson, M. (ed.) Scott-
Brown’s Otorhinolaryngology, head and Neck Surgery. 7th ed. London: Hodder Arnold. p.
3959
Tos, M., Stangerup, S.E., and Cayé-Thomasen, P. et al. (2004) What is the real incidence of
vestibular schwannoma? Arch Otolaryngol Head Neck Surg, 130 (2): 216-220

188
Tringali S., Bozorg Grayeli A., and Bouccara D. et al. (2008) A survey of satisfaction and use
among patients fitted with a BAHA. Eur Arch Otolaryngol 265: 1461-4
Trofatter, J.A., Mac Collin, M.M., and Rutter, J.L., et al. (1993) A novel moesin-, ezrin-,
radixin-like gene is a candidate for the neurofibromatosis 2 tumor suppressor. Cell, 72 (5): 791-
800
Tschudi, D.C., Linder, T.E. and Fisch, U. (2000) Conservative management of unilateral
acoustic neuromas. Am J Otol, 21: 722-728
V
Van Dijk, J.E., Duijndam, J. and Graamans, K. (2000) Acoustic neuroma: deterioration of
speech discrimination related to thresholds in pure-tone audiometry. Acta Otolaryngol, 120
(5): 627-632
Vaneecloo F.M., Ruzza I., Hanson J.M. et al. (2003) Monoaural pseudo-stereophonic hearing
with BAHA in unilateral total deafness: a study of 29 patients. Rev Laryngol Otol Rhinol 122:
343-50
W
Walsh, R.M., Bath, A.P. and Bance, M.L., et al. (2000) Consequences to hearing during the
conservative management of vestibular schwannomas. Laryngoscope, 110: 250-255
Wang, E.M., Pan, L. and Wang, B.J. et al. (2009) Gamma knife for elderly patients with large
vestibular schwannomas: 11 year follow-up. Zhonghua Yi Xue Za Zhi, 89(17): 1189-1191
189
Warren, C., James, L.A. and Ramsden, R.T. (2003) Identification of recurrent regions of
chromosome loss and gain in vestibular schwannomas using comparative genomic
hybridisation. J Med Genet, 40: 802-806
Wazen, J., Silverstein, H. and Norrell, H. et al. (1985) Preoperative and postoperative growth
rates in acoustic neuromas documented with CT scanning. Otolaryngol Head Neck Surg,
93(2): 151-156
Welsh, L.W., Welsh, J.J., Rosen, L.F., et al. (2004) Functional impairments due to unilateral
deafness. Ann Otol Rhinol Laryngol, 113: 987-93
Wiet, R.J., Zappia, J.J. and Hecht, C.S. et al. (1995) Conservative management of patients with
small acoustic tumors. Laryngoscope, 105: 795-800
Welling, D.B., Packer, M.D., Chang, L-S. (2007) Molecular studies of vestibular schwannomas:
a review. Curr Opin Otolaryngol Head Neck Surg, 15: 341-346
Y
Yamakami, I., Yoshinori, H., and Saeki, N. et al. (2009) Hearing preservation and
intraoperative auditory brainstem response and cochlear nerve compound action potential
monitoring in the removal of small acoustic neurinoma via the retrosigmoid approach. J
Neurosurg Psychiatry, 80: 218-227
Yang, I., Aranda, D., and Han, S.J. et al. (2009) Hearing preservation after stereotactic
radiosurgery for vestibular schwannoma: a systematic review. J Clin Neurosci, 16(6): 742-747
Yang, I., Sughrue, M.E., and Han, S.J. et al. (2009) Facial nerve preservation after vestibular
schwannoma gamma knife radiosurgery. J Neurooncol, 93(1): 41-48

190
Yates, P.D., Jackler, R.K., and Satar, B et al. (2003) Is it worthwhile to attempt hearing
preservation in larger acoustic neuromas? Otol Neurotol, 24: 460-464
Z
Zülch, K.J., (1986) Brain tumours: their biology and pathology. 3rd ed. Berlin.

APPENDIX Contents Letter to Dr Bowman, Chair, South Birmingham Research Ethics Committee Reply to above [Not included in the digital version of this thesis]