the multi-cycle generalized verhulst model for making ... · verhulst model for making production...
TRANSCRIPT

The Multi-Cycle Generalized Verhulst Model for Making Production Projections for Nonrenewable Resources
from Past Production Data and Estimates of Ultimately
Recoverable Resources
Eric Sander, DOE May 29, 2011 202-586-5750,
1

2
Outline • The Hubbert Model – A Symmetric Model • Hubbert Model Derivation • Symmetric versus Asymmetric Models - Historic Observations • Regional Depletion Rates – Historic Observations • Generalized Verhulst Function - An Asymmetric Model • Multi-Cycle Hubbert Model • Application of Multi-Cycle Verhulst and Hubbert Models to World Conventional Oil Production for Comparison • Comparison of One-Cycle and Two Cycle Results • Application to Phosphate Rock Production

The Hubbert Model
The Hubbert Model is one of the most renowned statistical models for the prediction of oil and gas production. Initially presented in 1956, Hubbert fitted bell-shape curves to cumulative production and discoveries to forecast oil production in the United States (U.S.). He predicted that oil production in the U.S. lower 48 states would ultimately produce about 170 BSTB and that production would peak in 1970. At that time, these predictions were very pessimistic compared to those presented by famous forecasting agencies such as U.S. Geological Survey (USGS) and other Forecasters. However, oil production in the U.S. lower 48 states did indeed peak in 1970.
3

Since that time, the Hubbert Model has gained worldwide popularity because of its simplicity and availability of required data and was extensively tested and used to forecast oil production worldwide. He fitted historical production data by a normal or Gauss bell-shape curve by making two major assumptions: (i) initially the production rate must start at zero, increase to a maximum, then decline to zero and (ii) the area under the production curve is equal to the ultimate oil recovery as time approaches infinity. Later, Hubbert presented the mathematical foundation for his model where a logistic curve was used to fit cumulative oil production versus time.
4

Hubbert Model Derivation 1. The earth (or any portion of the earth) is a finite source of any mineral and as
a mineral is extracted from the earth it becomes steadily more difficult to extract the remainder.
2. In the earliest stage the mineral is relatively readily available, but the technology for its extraction and society’s need for it are undeveloped. However, its presence will generate more need for it and more advanced extraction technology. We assume the production rate P(t) at earliest times will be some increasing function of the amount already extracted at that time, [Q∞- Q(t)].
3. At the latest stage when the mineral is almost completely depleted, the principal limitation on the production rate P(t) will be the amount left to be extracted Q(t) at that time. The simplest assumption is that P(t)∝ Q(t) at the latest times.
4. At intermediate times there are no rational arguments that we can muster for any particular functional form for P(t) as a function of Q(t).
5
6
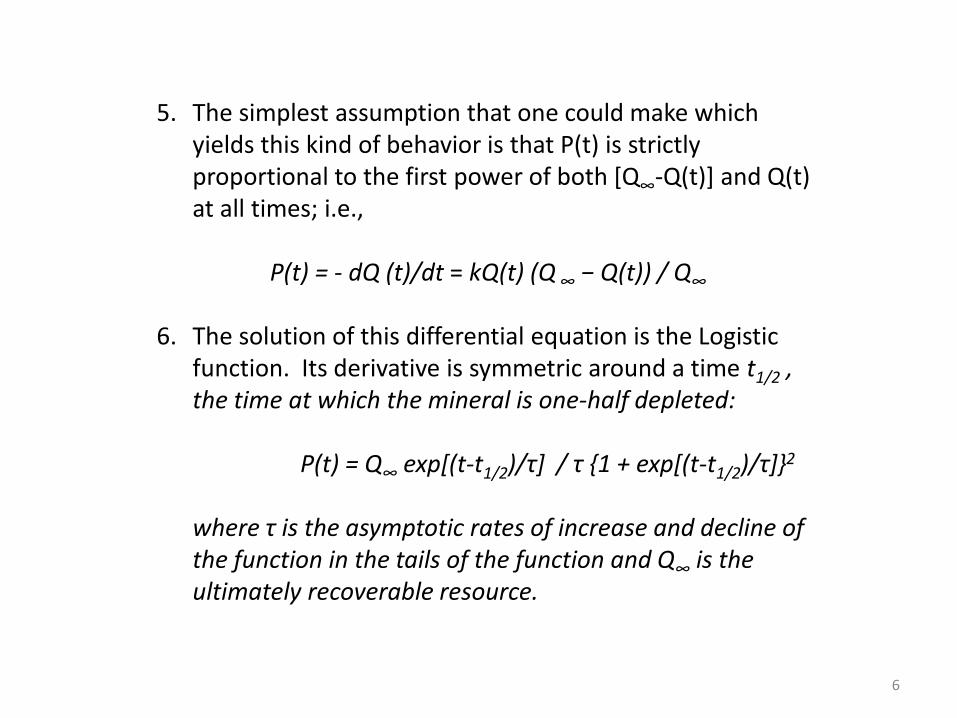
5. The simplest assumption that one could make which yields this kind of behavior is that P(t) is strictly proportional to the first power of both [Q∞-Q(t)] and Q(t) at all times; i.e.,
P(t) = - dQ (t)/dt = kQ(t) (Q ∞ − Q(t)) / Q∞ 6. The solution of this differential equation is the Logistic
function. Its derivative is symmetric around a time t1/2 , the time at which the mineral is one-half depleted:
P(t) = Q∞ exp[(t-t1/2)/τ] / τ {1 + exp[(t-t1/2)/τ]}2
where τ is the asymptotic rates of increase and decline of
the function in the tails of the function and Q∞ is the ultimately recoverable resource.

7
A logistic function or logistic curve is a common sigmoid curve, given its name in 1844 or 1845 by Pierre François Verhulst who studied it in relation to population growth. The logistic function finds applications in a range of fields, including artificial neural networks, biology, biomathematics, medicine, demography, economics, chemistry, physics, linguistics, mathematical psychology, probability, sociology, political science and statistics. http://en.wikipedia.org/wiki/Logistic_function
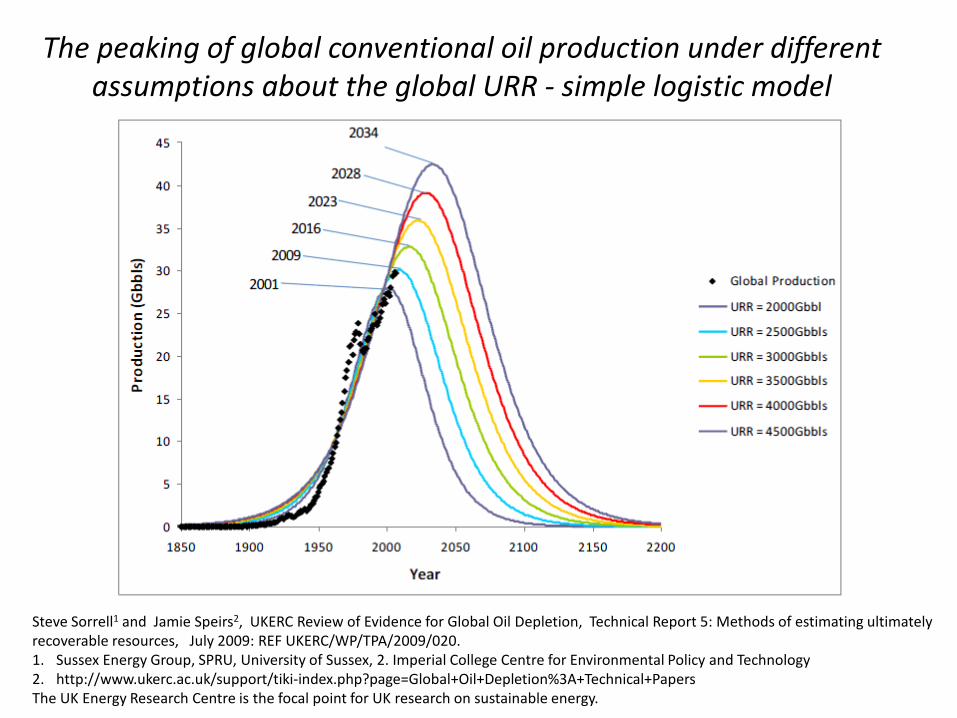
The peaking of global conventional oil production under different assumptions about the global URR - simple logistic model
Steve Sorrell1 and Jamie Speirs2, UKERC Review of Evidence for Global Oil Depletion, Technical Report 5: Methods of estimating ultimately recoverable resources, July 2009: REF UKERC/WP/TPA/2009/020. 1. Sussex Energy Group, SPRU, University of Sussex, 2. Imperial College Centre for Environmental Policy and Technology 2. http://www.ukerc.ac.uk/support/tiki-index.php?page=Global+Oil+Depletion%3A+Technical+Papers The UK Energy Research Centre is the focal point for UK research on sustainable energy.

9
Symmetric versus Asymmetric Models Testing Hubert
Least square fits were made on 74 sets of production curves for regions on United States state-level, United States regional-level (created by summing state-level data),national-level, and multi-national-level (such as continental or sub-continental) using symmetric Hubbert (Gaussian), linear, and exponential models and asymmetric Hubbert (two half-Gaussians), linear and exponential models .
First, the asymmetric models trump the symmetric models in most cases. This occurs even when accounting for the additional complexity of the asymmetric models. This, combined with the evidence of best-fitting rates of increase and decrease, suggest significant asymmetry of production. Conclusion: when attempting to understand past production, symmetric models are not satisfactory. Second, we note that production is significantly asymmetric in only one direction. In fact, the rate difference is positive in 67 of the 74 regions studied. The median rate of increase is 7.8% per year, while the median rate of decline is some 5% less at 2.6%. These data suggest that it is probable that future regions will have more gentle decline rates than rates of increase. We reiterate: there is simply no evidence in the historical data that rates of decline will be generally sharper than rates of increase.

10
Testing Hubbert Adam R. Brandt, Energy and Resources Group, University of California, Berkeley June 26th, 2006 http://www.iaee.org/en/students/best_papers/Adam_Brandt.pdf

11
Regional Depletion Rates Depletion and depletion rates can also be estimated at the regional level, although the uncertainty on the resource estimates will necessarily be greater. Of particular interest are the values at peak for the countries that have passed their peak of production. Estimates were made for 55 post-peak countries. The estimates of regional URR are taken from the authoritative and widely cited global study by the US Geological Survey (USGS, 2000).
“Using these estimates, we estimate a simple mean for depletion at peak of 25%, a production-weighted mean of 26% and a maximum of 55%. In other words, most countries appear to have reached their peak well before half of their recoverable resources have been produced.”
“Similarly, we estimate the mean depletion rate at peak for these countries to be 3.4%, the production-weighted mean to be 2.3% and the maximum to be 4.8% - for Argentina. However, the average depletion rate over the full production cycle is typically lower than the maximum rate. At present, the global average depletion rate is approximately 1.2%.”

12
“This analysis shows that there are constraints on both the rate of depletion for a field or region and the proportion of the URR that can be produced prior to the peak. Hence, both measures can provide a useful reality check on supply forecasts (Aleklett, et al., 2009). Specifically, a forecast that implies depletion rates that are significantly higher than experienced in other oil-producing regions will require careful justification. The same applies to forecasts that that delay the peak of production until significantly more than half of the URR has been produced. However, the usefulness of these ‘rules-of-thumb’ depends very much upon the accuracy of the estimated URR.”
UKERC Review of Evidence for Global Oil Depletion Technical Report 4: Decline rates and depletion rates July 2009: REF UKERC/WP/TPA/2009/019 Richard Miller1, Steve Sorrell2, Jamie Speirs3
1. Independent consultant 2. Sussex Energy Group, SPRU, University of Sussex 3. Imperial College Centre for Environmental Policy and Technology
“This analysis shows that there are constraints on both the rate of depletion for a field or region and the proportion of the URR that can be produced prior to the peak. Hence, both measures can provide a useful reality check on supply forecasts (Aleklett, et al., 2009). Specifically, a forecast that implies depletion rates that are significantly higher than experienced in other oil-producing regions will require careful justification. The same applies to forecasts that that delay the peak of production until significantly more than half of the URR has been produced. However, the usefulness of these ‘rules-of-thumb’ depends very much upon the accuracy of the estimated URR.”

13
7. The Generalized Verhulst function is a generalization of the Logistic function which is a solution to the differential function:
P(t) = - dQ (t)/dt = kQ(t) (1− [Q(t) / Q∞]n) is asymmetric around time t1/2. 8. The Generalized Verhulst function is a Hubbert function when n = 1.
The following curves are: (solid black: τ=1, t1/2=0, n=4), (dashed red: τ=1, t1/2=0, n=2),(dotted green: τ=1, t1/2=0, n=0.5), (dot-dash purple: τ=1, t1/2=0, n=0.1)
14
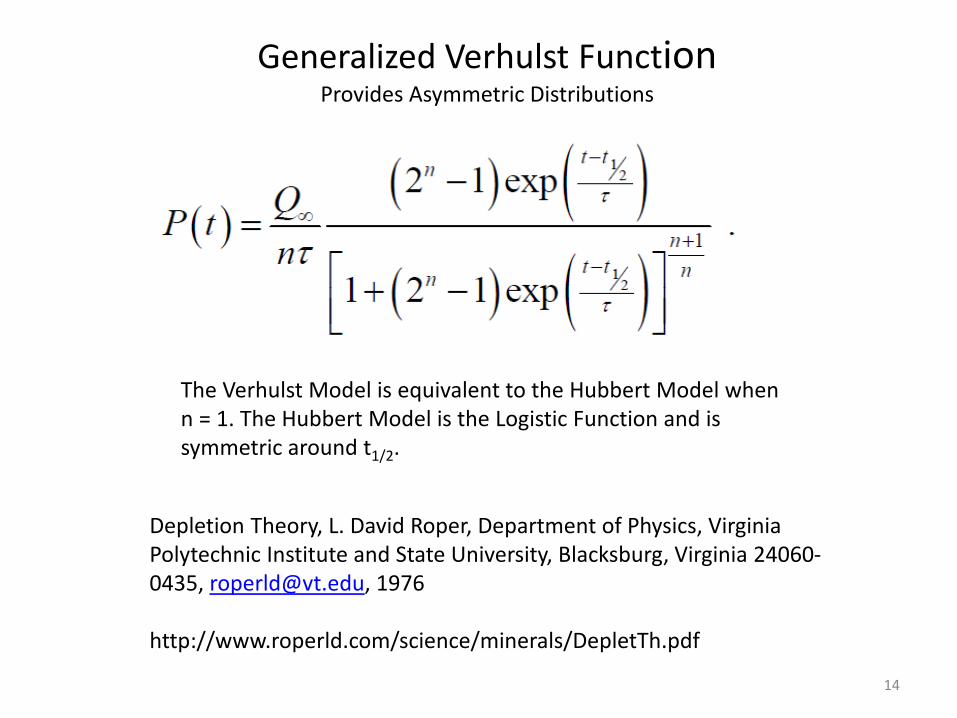
Generalized Verhulst Function Provides Asymmetric Distributions
Depletion Theory, L. David Roper, Department of Physics, Virginia Polytechnic Institute and State University, Blacksburg, Virginia 24060-0435, [email protected], 1976 http://www.roperld.com/science/minerals/DepletTh.pdf
The Verhulst Model is equivalent to the Hubbert Model when n = 1. The Hubbert Model is the Logistic Function and is symmetric around t1/2.
15
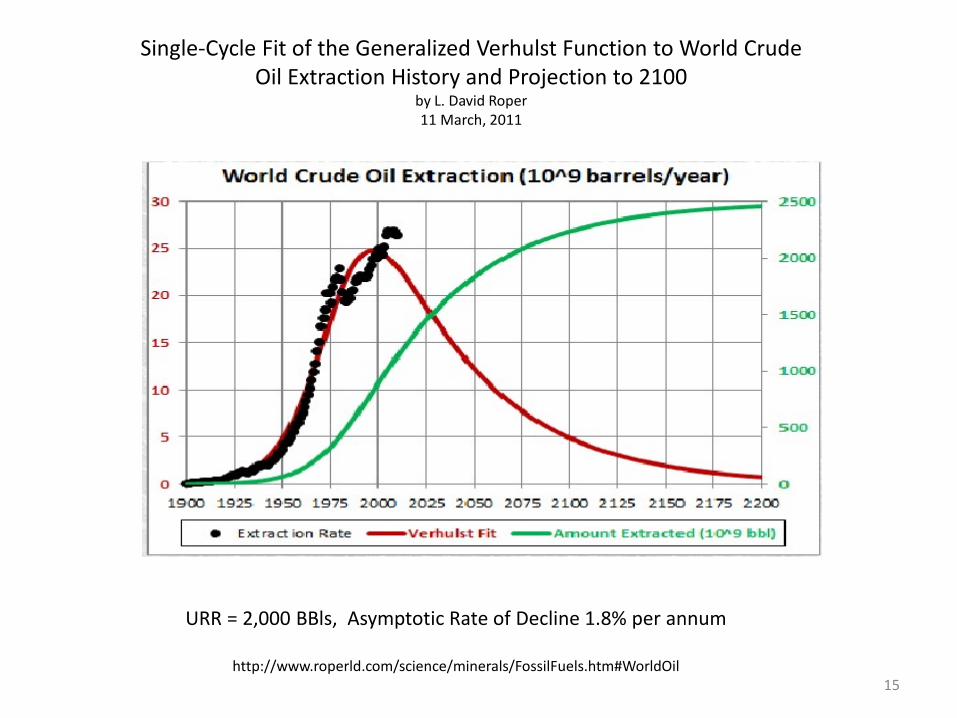
Single-Cycle Fit of the Generalized Verhulst Function to World Crude Oil Extraction History and Projection to 2100
by L. David Roper 11 March, 2011
URR = 2,000 BBls, Asymptotic Rate of Decline 1.8% per annum
http://www.roperld.com/science/minerals/FossilFuels.htm#WorldOil

16
Multi-Cycle Hubbert Model
In the past, several authors have illustrated that the Hubbert Model with only one full cycle is appropriate to forecast crude oil production for some countries, where the production trend does not exhibit many major fluctuations over time. However, recent studies have shown that most worldwide oil producing countries display more than one Hubbert production cycle. Therefore, the application of the conventional Hubbert model to these countries is not appropriate and does not yield good forecasting results. The additional production cycles are apparently the result of many factors, reflecting the state-of-the-art technological evolution in the oil industry, government regulations, economic conditions, and political events. The single-cycle Hubbert Model does not consider the effects of these factors.

17
Al-Fattah and Startzman were the first to modify Hubbert model to account for the various factors affecting production. They introduced what is called “multicyclic Hubbert” approach to forecast world natural gas production. Their model was highly accurate in generating past production history and providing accurate forecast.
Al-Fattah, S.M. and Startzman, R.A.: Analysis of Worldwide Natural Gas Production, paper SPE 57463 presented at the 1999 SPE Eastern Regional Meeting, Charleston, WV, 20-22 October.

18
World crude oil production Multicyclic Hubbert Model Ibrahim Sami Nashawi,*,† Adel Malallah,† and Mohammed Al-Bisharah‡, Forecasting World Crude Oil Production Using Multicyclic Hubbert Model, Energy Fuels 2010, 24, 1788–1800 : DOI:10.1021/ef901240p Published on Web 02/04/2010, http://pubs.acs.org/doi/abs/10.1021/ef901240p †Department of Petroleum Engineering, College of Engineering and Petroleum, Kuwait University, P.O. BOX 5969, Safat 13060, Kuwait, and ‡Kuwait Oil Company, P.O. Box 9758, Ahmadi 61008, Kuwait

19
The analysis of 47major oil producing countries estimates the world’s ultimate crude oil reserve by 2140 BSTB The world production is estimated to peak in 2014 at a rate of 79 MMSTB/D. OPEC has remaining reserve of 909 BSTB, which is about 78% of the world reserves. OPEC production is expected to peak in 2026 at a rate of 53 MMSTB/D. On the basis of 2005 world crude oil production and current recovery techniques, the world oil reserves are being depleted at an annual rate of 2.1%.
Ibrahim Sami Nashawi,*,† Adel Malallah,† and Mohammed Al-Bisharah‡, Forecasting World Crude Oil Production Using Multicyclic Hubbert Model, Energy Fuels 2010, 24, 1788–1800 : DOI:10.1021/ef901240p Published on Web 02/04/2010, http://pubs.acs.org/doi/abs/10.1021/ef901240p †Department of Petroleum Engineering, College of Engineering and Petroleum, Kuwait University, P.O. BOX 5969, Safat 13060, Kuwait, and ‡Kuwait Oil Company, P.O. Box 9758, Ahmadi 61008, Kuwait
20
Application of Multi- Cycle Verhulst and Hubbert Models
• Ultimately Recoverable Resources Estimates for Conventional oil Based on a USGS 2000 Petroleum Assessment
• Energy Information Administration (EIA) and British Petroleum (BP) world production data for conventional oil
• Applied a Multi-Cycle Verhulst Model using the solver non-linear least squares routine in Excel
• To our knowledge, we are the first to apply the Multi-Cycle Generalized Verhulst Model to production data.

21
Estimates of World and Exporter Ultimately Recoverable Resources Based on a USGS 2000 Petroleum Assessment
(Crude Oil, Lease Condensates and Natural Gas Liquids - Cumulative Production, Reserves and Undiscovered)
Conventional Oil Ultimately
Recoverable Resources (URR)
Pessimistic (< 5% chance it is
less than this)
Mean Estimate
Optimistic (<5% chance it is more than this)
World
(MMBls)
2,400,384
3,344,845
4,495,873
42 Exporters
(MMBls)
1,717,704
2,629,633
3,725,429
http://pubs.usgs.gov/dds/dds-060/

22
Oil Production Data Oil Production Data for World 1980-2009 Energy Information Administration (EIA) Website http://www.eia.doe.gov/cfapps/ipdbproject/IEDIndex3.cfm?tid=5&pid=53&aid=1
1965-1979 British Petroleum Website http://www.bp.com/sectiongenericarticle.do?categoryId=9023770&contentId=7044467
1950 -1964 Personal Communication, Patricia Smith, EIA

23 0
10
20
30
40
50
60
70
80
90
1900 1920 1940 1960 1980 2000 2020 2040 2060 2080 2100
Mill
ion
Barr
els D
aily
Four-Cycle Generalized Verhulst Projection for World
Conventional Oil Production Assuming Mean URR
Cycle 1
Cycle 2
Cycle 3
Cycle 4
Projection
Historic WorldProduction

24 0
10
20
30
40
50
60
70
80
90
100
1900 1920 1940 1960 1980 2000 2020 2040 2060 2080 2100
Mill
ion
Barr
els D
aily
Four-Cycle Hubbert Projection for World
Conventional Oil Production Assuming Mean URR
Cycle 1
Cycle 2
Cycle 3
Cycle 4
Projection
Historic WorldProduction

25 0
10
20
30
40
50
60
70
80
90
1900 1920 1940 1960 1980 2000 2020 2040 2060 2080 2100
Mill
ion
Barr
els D
aily
Four-Cycle Generalized Verhulst Projection for World Conventional Oil Production Assuming Optimistic URR
Cycle 1
Cycle 2
Cycle 3
Cycle 4
Projection
HistoricWorldProduction

26 0
10
20
30
40
50
60
70
80
90
100
110
120
130
1900 1920 1940 1960 1980 2000 2020 2040 2060 2080 2100
Mill
ion
Barr
els D
aily
Four-Cycle Hubbert Projection for World Conventional Oil Production Assuming Optimistic URR
Cycle 1
Cycle 2
Cycle 3
Cycle 4
Projection
Historic WorldProduction

27
0
10
20
30
40
50
60
70
80
90
100
110
120
130
1900 1920 1940 1960 1980 2000 2020 2040 2060 2080 2100
Mill
ion
Barr
els D
aily
World Conventional Oil Production Projections
Hubbert WorldOptimistic URR
Hubbert WorldMean URR
Verhulst WorldOptimistic URR
Verhulst WorldMean URR
Historic WorldProduction

28
Kernel URR (MMBls)
RMSE (MMBls/
Day) R2 Peak
Year Peak Production (MMBls/Day)
Depletion at Peak (%)
Depletion Rate at Peak
(%)
Asymptotic Decline Rate
(%)
Verhulst 3,344,845
0.897 0.999 2016 87.8 43 1.7 2.4 Mean
Verhulst 4,495,873
0.887 0.999 2019 89 34 1.1 1.3 Optimistic
Hubbert 3,344,845
1.029 0.998 2027 99.7 55 2.4 5 Mean
Hubbert 4,495,873
1.049 0.998 2042 124.8 56 2.3 4.8 Optimistic
Expected ~26, < 50 ~2.3, ~1.2 ~2.6
Summary of Results
29
0
10
20
30
40
50
60
70
80
1900 1920 1940 1960 1980 2000 2020 2040 2060 2080 2100
Mill
ion
Barr
els D
aily
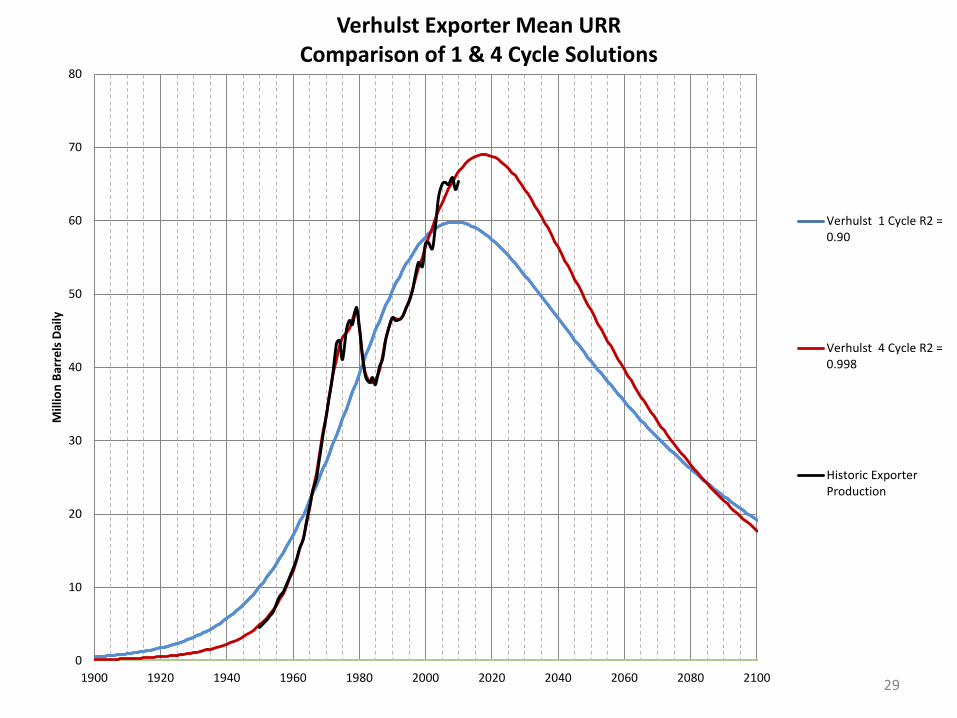
Verhulst Exporter Mean URR Comparison of 1 & 4 Cycle Solutions
Verhulst 1 Cycle R2 =0.90
Verhulst 4 Cycle R2 =0.998
Historic ExporterProduction

30 0
0.1
0.2
0.3
0.4
0.5
0.6
0.7
0.8
0.9
1
1900 1920 1940 1960 1980 2000 2020 2040 2060 2080 2100
Frac
tion
Extr
acte
d Verhulst Exporter Mean URR
Verhulst 1 Cycle Solution
Verhulst 4 Cycle Solution
31
-10
-5
0
5
10
15
1950 1960 1970 1980 1990 2000 2010
Mill
ion
Barr
els D
aily
Axis Title
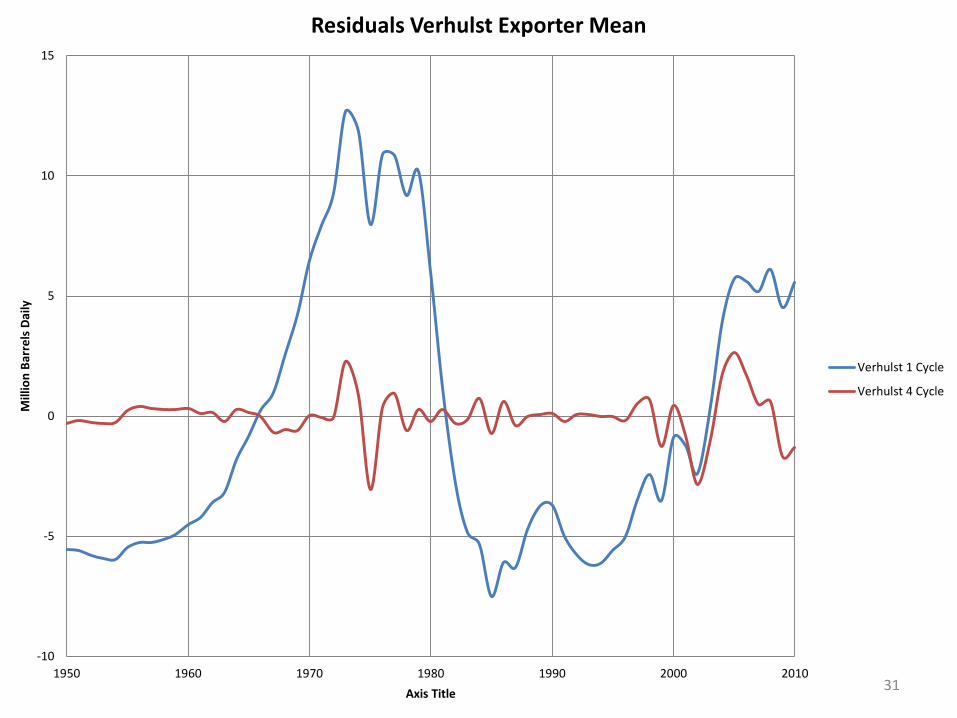
Residuals Verhulst Exporter Mean
Verhulst 1 Cycle
Verhulst 4 Cycle
32 -
100.00
200.00
300.00
400.00
500.00
600.00
700.00
800.00
900.00
1,000.00
1,100.00
1900 1950 2000 2050 2100 2150
Mill
ion
Met
ric T
ons A
nnua
lly
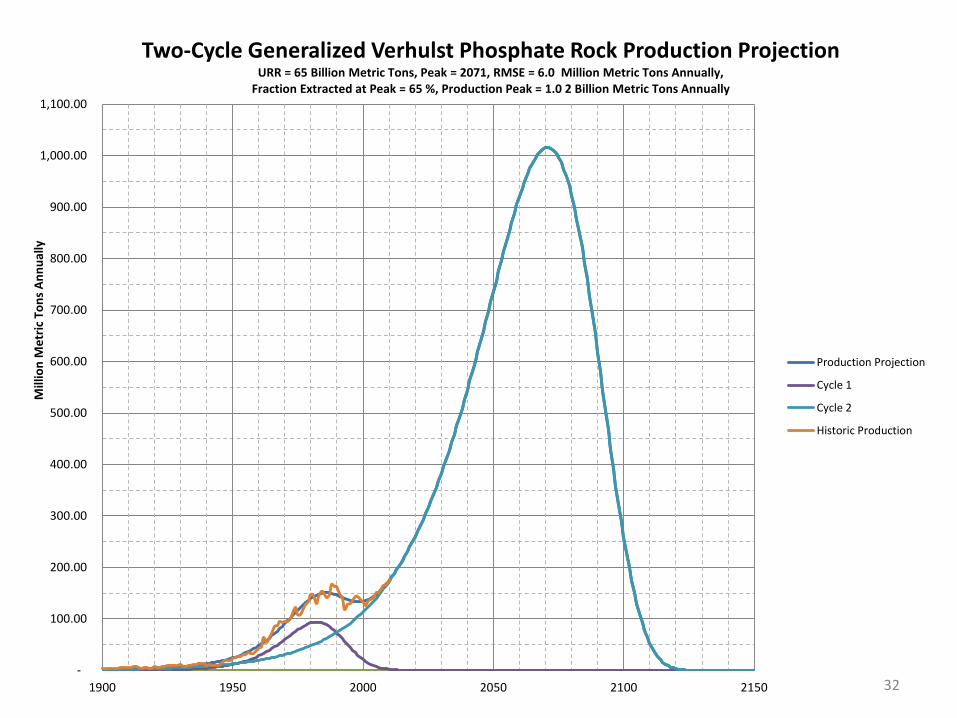
Two-Cycle Generalized Verhulst Phosphate Rock Production Projection URR = 65 Billion Metric Tons, Peak = 2071, RMSE = 6.0 Million Metric Tons Annually,
Fraction Extracted at Peak = 65 %, Production Peak = 1.0 2 Billion Metric Tons Annually
Production Projection
Cycle 1
Cycle 2
Historic Production

33
-
1,000,000,000
2,000,000,000
3,000,000,000
4,000,000,000
5,000,000,000
6,000,000,000
7,000,000,000
8,000,000,000
9,000,000,000
10,000,000,000
1950 1970 1990 2010 2030 2050 2070 2090
UN World Population Estimate - Medium Variant

34 0.0000
0.0050
0.0100
0.0150
0.0200
0.0250
0.0300
0.0350
0.0400
0.0450
0.0500
1950 1960 1970 1980 1990 2000 2010 2020 2030 2040 2050 2060 2070 2080 2090 2100
Met
ric T
ons p
er P
erso
n Phosphate Rock Production Per Capita
Medium Variant UN Population Projection

35
All models are wrong, But some are useful.
George Edward Pelham