the msfc solar activity future estimation (msafe) model · the msafe program • the msafe model...
TRANSCRIPT

The MSFC Solar Activity Future
Estimation (MSAFE) Model
Ron Suggs Natural Environments Branch MSFC/NASA15 May 2017
https://ntrs.nasa.gov/search.jsp?R=20170005301 2019-05-24T17:42:27+00:00Z
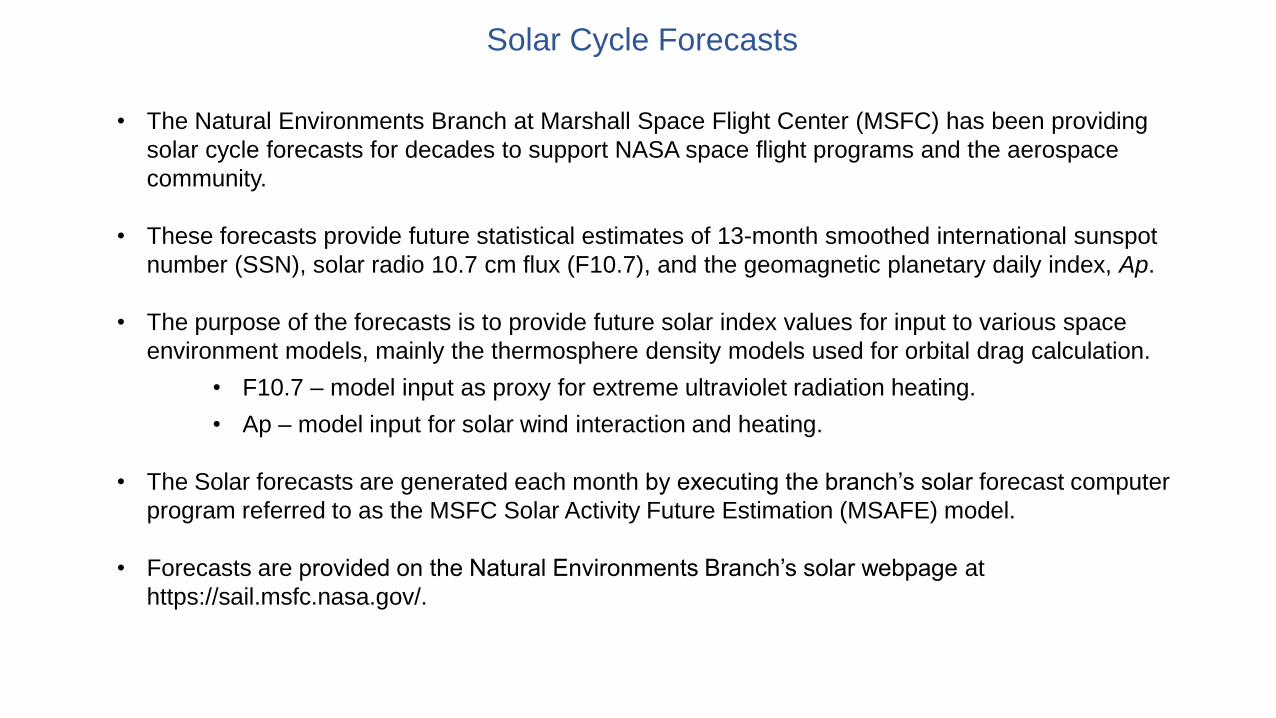
• The Natural Environments Branch at Marshall Space Flight Center (MSFC) has been providing
solar cycle forecasts for decades to support NASA space flight programs and the aerospace
community.
• These forecasts provide future statistical estimates of 13-month smoothed international sunspot
number (SSN), solar radio 10.7 cm flux (F10.7), and the geomagnetic planetary daily index, Ap.
• The purpose of the forecasts is to provide future solar index values for input to various space
environment models, mainly the thermosphere density models used for orbital drag calculation.
• F10.7 – model input as proxy for extreme ultraviolet radiation heating.
• Ap – model input for solar wind interaction and heating.
• The Solar forecasts are generated each month by executing the branch’s solar forecast computer
program referred to as the MSFC Solar Activity Future Estimation (MSAFE) model.
• Forecasts are provided on the Natural Environments Branch’s solar webpage at
https://sail.msfc.nasa.gov/.
Solar Cycle Forecasts

0
20
40
60
80
100
120
140
2007 2008 2009 2010 2011 2012 2013 2014 2015 2016 2017 2018 2019 2020
Su
nsp
ot N
um
be
r
Date
Sunspot Number
Actual Monthly Mean
Actual 13-Mon Smoothed
95 percentile
50 percentile
5 percentile
60
80
100
120
140
160
180
2007 2008 2009 2010 2011 2012 2013 2014 2015 2016 2017 2018 2019 2020
F10
.7
Date
Solar Radio Flux (10.7cm)
Actual Monthly Mean
Actual 13-Mon Smoothed
95 percentile
50 percentile
75 percentile
5 percentile
Current Solar Cycle 24 Progression & Forecast
• The forecasted solar indices represent the 13-month smoothed values consisting of a bestestimate value stated as a 50 percentile statistical value along with 95 and 5 percentilecumulative frequency bounds or approximately± 2 standard deviations (SD).
• A 75 percentile bound is also provided for the F10.7 index.
• Although the observed indices are on time scales of days, the MSAFE model is not able tocalculate forecasts of the indices on temporal scales such as daily or monthly.

Current Solar Cycle 24 Progression & Forecast
0
2
4
6
8
10
12
14
16
18
20
2007 2008 2009 2010 2011 2012 2013 2014 2015 2016 2017 2018 2019 2020
Ap
In
de
x
Date
Ap Geomagnetic Index
Actual Monthly Mean
Actual 13-Mon Smoothed
95 percentile
50 percentile
5 percentile

The MSAFE Program
• The MSAFE model employs a statistical method to predict future estimates of solar and
geomagnetic indices for the balance of the current solar cycle.
• MSAFE maintains a dataset of historical observed and reconstructed solar indices used by
the prediction algorithm and for the calculation of statistical uncertainty bounds of the
prediction.
• The prediction algorithm of MSAFE uses a regression method referred to as the MSFC
Lagrangian Linear Regression Technique (MLLRT).
• MSAFE is describe in NASA Technical Memorandum 4759, K. O. Niehuss, H. C. Euler, Jr.,
and W. W. Vaughan.
MSAFE Datasets
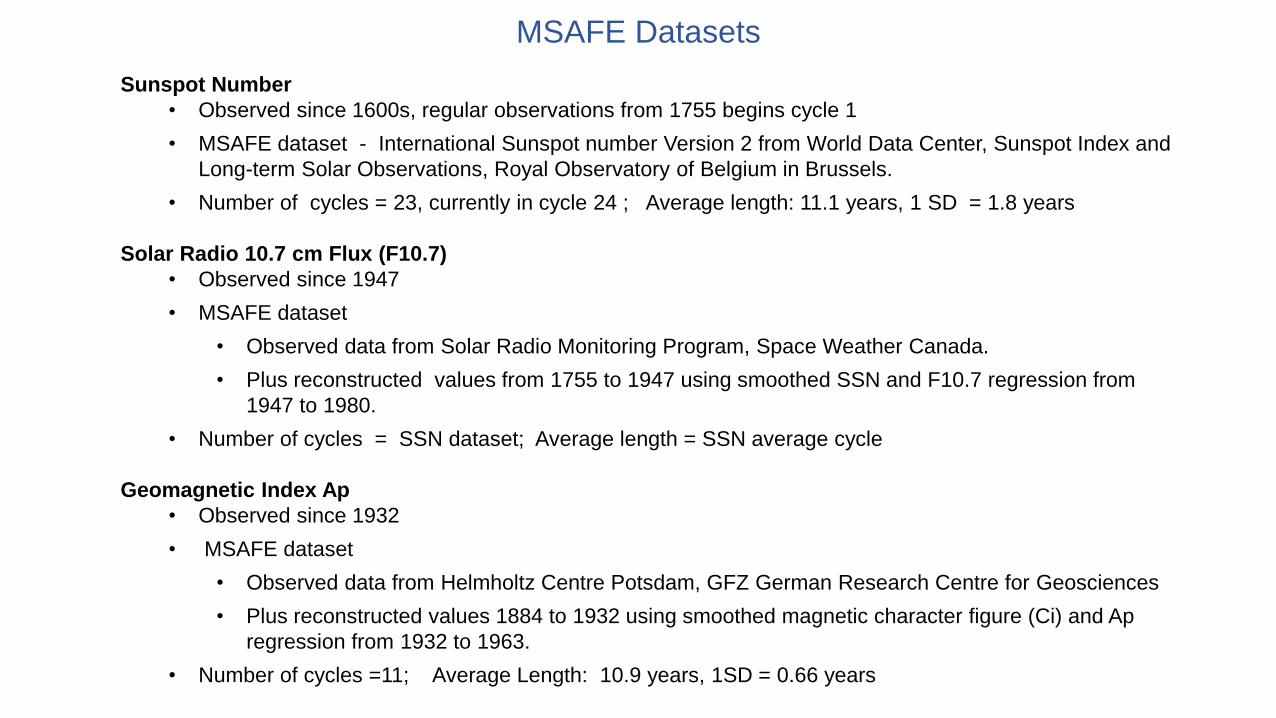
Sunspot Number
• Observed since 1600s, regular observations from 1755 begins cycle 1
• MSAFE dataset - International Sunspot number Version 2 from World Data Center, Sunspot Index and
Long-term Solar Observations, Royal Observatory of Belgium in Brussels.
• Number of cycles = 23, currently in cycle 24 ; Average length: 11.1 years, 1 SD = 1.8 years
Solar Radio 10.7 cm Flux (F10.7)
• Observed since 1947
• MSAFE dataset
• Observed data from Solar Radio Monitoring Program, Space Weather Canada.
• Plus reconstructed values from 1755 to 1947 using smoothed SSN and F10.7 regression from
1947 to 1980.
• Number of cycles = SSN dataset; Average length = SSN average cycle
Geomagnetic Index Ap
• Observed since 1932
• MSAFE dataset
• Observed data from Helmholtz Centre Potsdam, GFZ German Research Centre for Geosciences
• Plus reconstructed values 1884 to 1932 using smoothed magnetic character figure (Ci) and Ap
regression from 1932 to 1963.
• Number of cycles =11; Average Length: 10.9 years, 1SD = 0.66 years

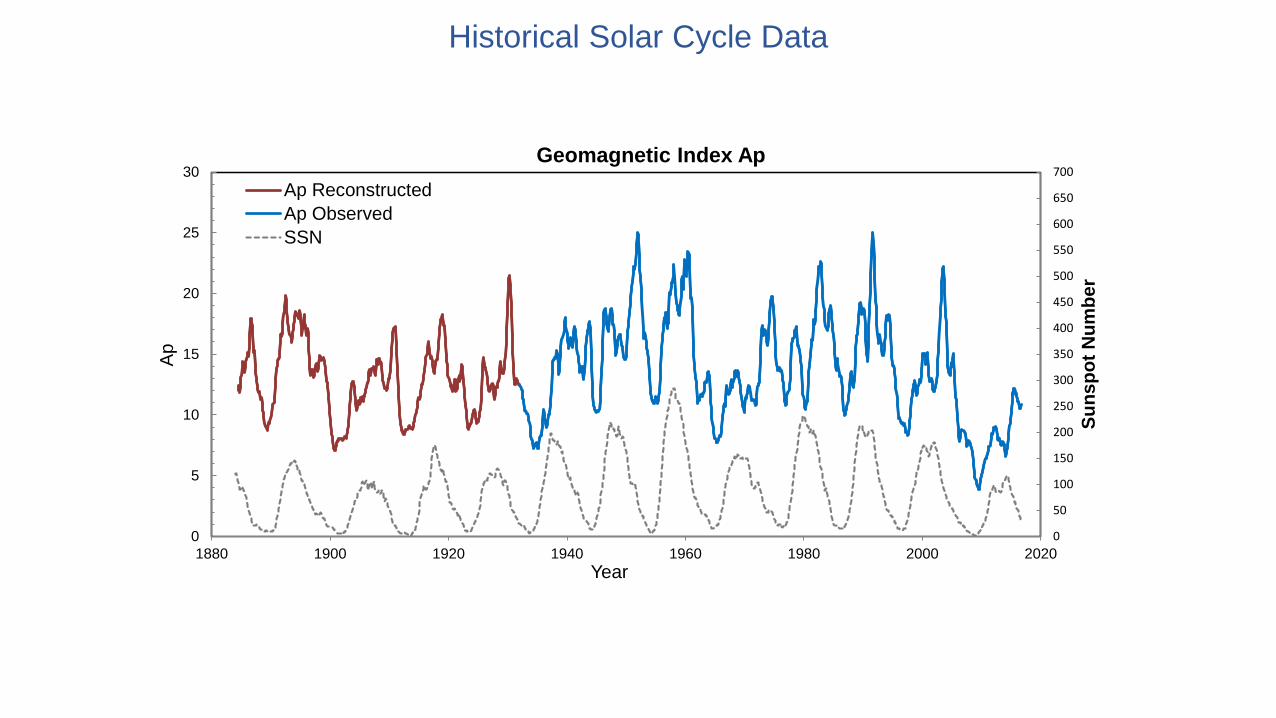
Historical Solar Cycle Data
0
50
100
150
200
250
300
350
1750 1770 1790 1810 1830 1850 1870 1890 1910 1930 1950 1970 1990 2010
SS
N
Year
Sunspot Number
50
100
150
200
250
300
1750 1770 1790 1810 1830 1850 1870 1890 1910 1930 1950 1970 1990 2010
F10.7
Year
Solar Radio Flux (10.7 cm)
Reconstructed Observed
0
50
100
150
200
250
300
350
400
450
500
550
600
650
700
0
5
10
15
20
25
30
1880 1900 1920 1940 1960 1980 2000 2020
Su
ns
po
t N
um
be
r
Ap
Year
Geomagnetic Index Ap
Ap Reconstructed
Ap Observed
SSN
Historical Solar Cycle Data

MLLRT Algorithm
• The MLLRT is a modification of the linear regression method applied by McNish and
Lincoln (1949). The algorithm uses a mean solar cycle calculated by averaging the
previous cycles at each time interval.
• The mean cycle is used in calculating the deviations between the mean cycle and each
of the previous cycle’s values at the current month’s observation and at the next
prediction month.
• The deviations are used to find regression coefficients that are used to calculate the
next month’s observation. The algorithm is applied recursively to each month
throughout the cycle.
• The prediction uncertainty bounds of 95 and 5 percent are based on cumulativefrequency distributions of the differences between the observed and predicted solarindex values obtained from applying the MLLRT to the historical solar cycle data (cycles1-23) in the same manner as in the current cycle prediction.

Mean Cycle Calculation
• Each solar index cycle is divided into 132 time intervals.
• At each interval the index value is interpolated using a
Lagrangian interpolation technique.
• The effect is to stretch or contract each cycle to the average
cycle length of 132 time intervals before averaging.
• The mean cycle is the average at each of the time intervals.
0
50
100
150
200
250
0 1 2 3 4 5 6 7 8 9 10 11 12
SS
N
Years
Sunspot Number Mean Cycle
Mean Cycle
+/- 2 SD of Mean Cycle
50
100
150
200
250
300
0 1 2 3 4 5 6 7 8 9 10 11 12
F1
0.7
Years
Solar Radio Flux Mean Cycle
Mean Cycle
+/- 2 SD of Mean Cycle
0
5
10
15
20
25
30
35
0 1 2 3 4 5 6 7 8 9 10 11 12
Ap
Years
Geomagnetic Ap Index Mean Cycle
Mean Cycle
+/- 2 SD of Mean Cycle

Cm = Slope of Regression Line
N
i
imim
N
i
imm RRRC
1
2,,1
1
,
General Equation for Slope and Intercept of Regression Line.
MSAFE Linear Regression Technique
y = 1.027x - 2E-15
-8.0
-6.0
-4.0
-2.0
0.0
2.0
4.0
6.0
8.0
-8.0 -6.0 -4.0 -2.0 0.0 2.0 4.0 6.0 8.0
R4
R3
F10.7 Regression Example Using Months 3 & 4
Plot of deviations from mean cycle for cycles 1 thru 23

Past Forecasts of the Current
Solar Cycle that Began Dec. 2008

Sept. 2009 Forecast
0
20
40
60
80
100
120
140
160
180
2008 2009 2010 2011 2012 2013 2014 2015 2016 2017 2018 2019 2020
Su
nsp
ot N
um
be
r
Date
Sunspot Number
Actual 13-Mon Smoothed
Forecast
+/- 2 SD of Forecast
Mean Cycle
60
80
100
120
140
160
180
200
220
2008 2009 2010 2011 2012 2013 2014 2015 2016 2017 2018 2019 2020
F1
0.7
(sfu
)
Date
Solar Radio Flux (10.7 cm)Actual 13-Mon Smoothed
Forecast
+/- 2 SD of Forecast
Mean Cycle
0
5
10
15
20
25
2008 2009 2010 2011 2012 2013 2014 2015 2016 2017 2018 2019 2020
Ge
om
agn
etic In
de
x A
p
Date
Ap Geomagnetic IndexActual 13-Mon Smoothed
Forecast
+/- 2 SD of Forecast
Mean Cycle• Forecast used last observed smoothed
value on March 2009
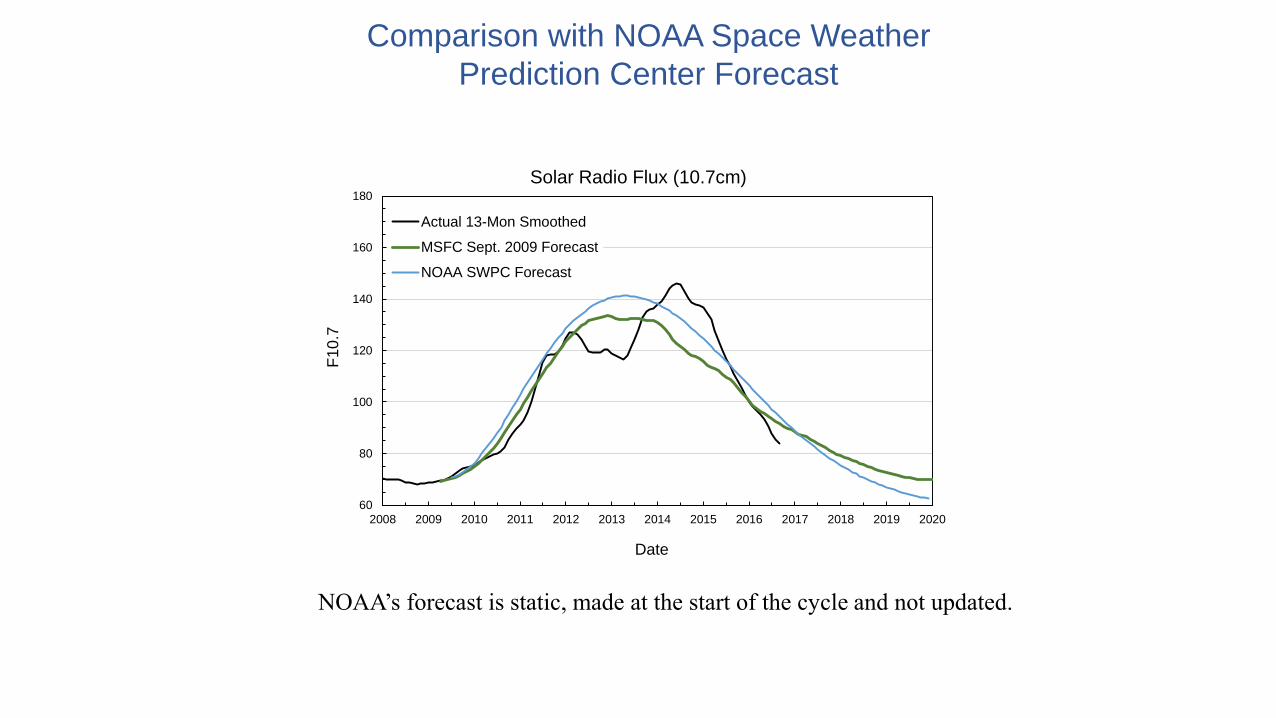
Comparison with NOAA Space Weather
Prediction Center Forecast
60
80
100
120
140
160
180
2008 2009 2010 2011 2012 2013 2014 2015 2016 2017 2018 2019 2020
F1
0.7
Date
Solar Radio Flux (10.7cm)
Actual 13-Mon Smoothed
MSFC Sept. 2009 Forecast
NOAA SWPC Forecast
NOAA’s forecast is static, made at the start of the cycle and not updated.

Jan. 2012 Forecast
0
20
40
60
80
100
120
140
2008 2009 2010 2011 2012 2013 2014 2015 2016 2017 2018 2019 2020
Su
nsp
ot N
um
be
r
Date
Sunspot Number
Actual 13-Mon Smoothed
Jan. 2012 Forecast
+/- 2SD of 2012 Forecast
Sept. 2009 Forecast
60
80
100
120
140
160
180
200
2008 2009 2010 2011 2012 2013 2014 2015 2016 2017 2018 2019 2020
F1
0.7
Date
Solar Radio Flux (10.7cm)
Actual 13-Mon Smoothed
Jan. 2012 Forecast
+/- 2SD of 2012 Forecast
Sept. 2009 Forecast
0
5
10
15
20
25
2009 2010 2011 2012 2013 2014 2015 2016 2017 2018 2019 2020
Ge
om
agn
etic In
de
x A
p
Date
Geomagnetic Index ApActual 13-Mon Smoothed
Jan. 2012 Forecast
+/- 2 SD of 2012 Forecast
Sept. 2009 Forecast• Forecast used last observed smoothed
value on July 2011
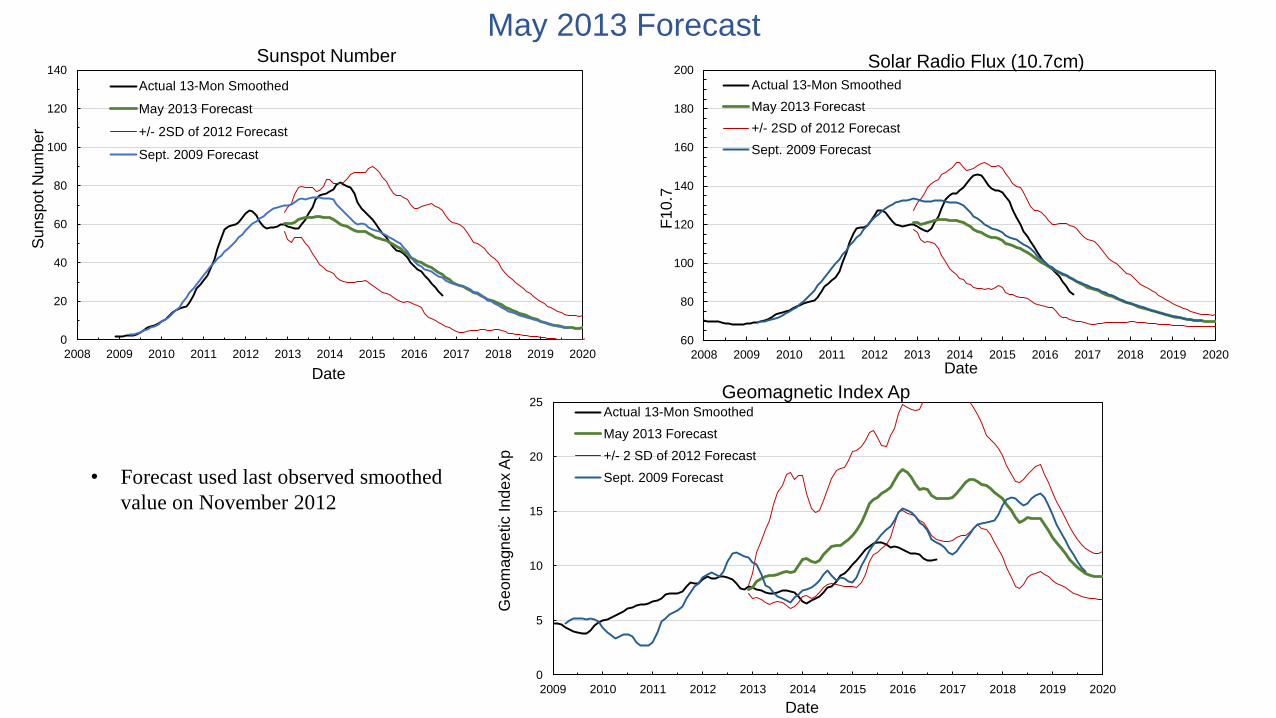
May 2013 Forecast
0
5
10
15
20
25
2009 2010 2011 2012 2013 2014 2015 2016 2017 2018 2019 2020
Ge
om
agn
etic In
de
x A
p
Date
Geomagnetic Index ApActual 13-Mon Smoothed
May 2013 Forecast
+/- 2 SD of 2012 Forecast
Sept. 2009 Forecast
0
20
40
60
80
100
120
140
2008 2009 2010 2011 2012 2013 2014 2015 2016 2017 2018 2019 2020
Su
nsp
ot N
um
be
r
Date
Sunspot Number
Actual 13-Mon Smoothed
May 2013 Forecast
+/- 2SD of 2012 Forecast
Sept. 2009 Forecast
60
80
100
120
140
160
180
200
2008 2009 2010 2011 2012 2013 2014 2015 2016 2017 2018 2019 2020
F1
0.7
Date
Solar Radio Flux (10.7cm)Actual 13-Mon Smoothed
May 2013 Forecast
+/- 2SD of 2012 Forecast
Sept. 2009 Forecast
• Forecast used last observed smoothed
value on November 2012
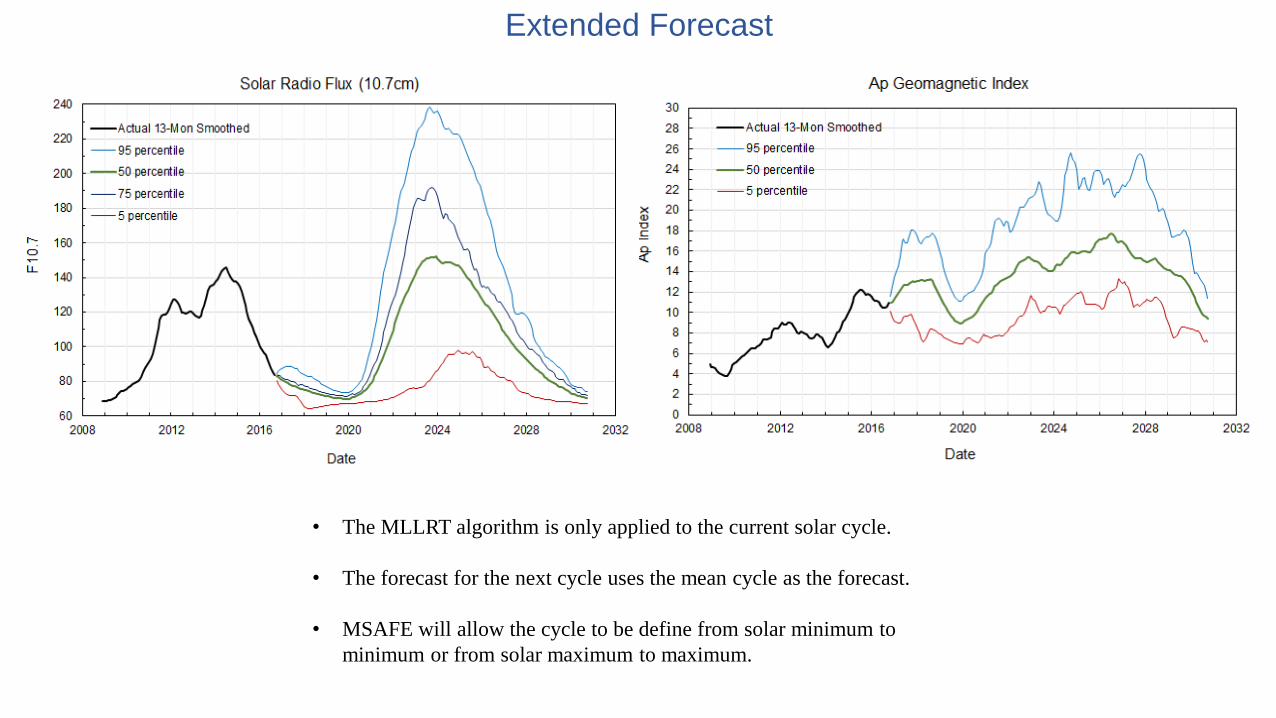
Extended Forecast
• The MLLRT algorithm is only applied to the current solar cycle.
• The forecast for the next cycle uses the mean cycle as the forecast.
• MSAFE will allow the cycle to be define from solar minimum to
minimum or from solar maximum to maximum.
• The MSAFE model provides forecasts for the solar indices SSN, F10.7, and Ap. These solar indices areused as inputs to space environment models used in orbital spacecraft operations and space missionanalysis.
• Forecasts from the MSAFE model are provided on the MSFC Natural Environments Branch’s solarwebpage and are updated as new monthly observations come available.
• The MSAFE prediction routine employs a statistical technique that calculates deviations of past solarcycles from the mean cycle and performs a regression analysis to calculate the deviation from the meancycle of the solar index at the next future time interval.
• The forecasts are initiated for a given cycle after about 8 to 9 monthly observations from the start of thecycle are collected.
• A forecast made at the beginning of cycle 24 using the MSAFE program captured the cycle fairly well withsome difficulty in discerning the double peak that occurred at solar cycle maximum.
Summary