the molybdenum isotope composition of modern and ancient
TRANSCRIPT

HAL Id: dumas-01206939https://dumas.ccsd.cnrs.fr/dumas-01206939
Submitted on 29 Sep 2015
HAL is a multi-disciplinary open accessarchive for the deposit and dissemination of sci-entific research documents, whether they are pub-lished or not. The documents may come fromteaching and research institutions in France orabroad, or from public or private research centers.
L’archive ouverte pluridisciplinaire HAL, estdestinée au dépôt et à la diffusion de documentsscientifiques de niveau recherche, publiés ou non,émanant des établissements d’enseignement et derecherche français ou étrangers, des laboratoirespublics ou privés.
Distributed under a Creative Commons Attribution - NonCommercial - NoDerivatives| 4.0International License
The molybdenum isotope composition of modern andancient stromatolites
Marie Thoby
To cite this version:Marie Thoby. The molybdenum isotope composition of modern and ancient stromatolites. Oceanog-raphy. 2015. �dumas-01206939�

MASTER SML SCIENCES DE LA MER ET DU LITTORAL
expérience MENTION
Géosciences SPÉCIALITÉ
Terre Externe
THOBY Marie La composition isotopique du molybdène des stromatolites
modernes et anciens
Mémoire de stage de Master 2 Année Universitaire 2014-2015
Structure d�accueil : Laboratoire Domaine Océanique Tuteur universitaire : GRAINDORGE David
Maître de stage : LALONDE Stefan


The molybdenum isotope composition of
modern and ancient stromatolites
Supervisor: LALONDE Stefan
University Supervisor: GRAINDORGE David
Master 2 2014-2015
IUEM-Geosciences- Geochemistry
Thoby Marie

The primitive Earth was characterized by an oxygen-poor ocean–atmosphere system, and
experienced a significant increase in oxygen concentrations during the Great Oxidation Event
(GOE) ca 2.45 Ga. This event is generally believed to be linked in some way to oxygenic
photosynthesis by bacteria. However, it is becoming commonly accepted that “whiffs” of oxygen
existed before the GOE. To shed new light on this emerging paradigm, here we present
molybdenum (Mo) isotopic data for modern stromatolites from Bacalar lagoon, Mexico, and
ancient stromatolites from Archean sediments deposited ca. 2.52 Ga (Ghaap Group, South Africa),
2.8 Ga (Steep Rock, Canada), and 2.96 Ga (Red Lake, Canada). Modern samples record a
molybdenum isotopic signature that appears related to the water from which they grew, supporting
the idea that the molybdenum isotopic composition of carbonates is a robust proxy for examining
paleo-redox conditions of environments where carbonates were precipitated. Ancient stromatolites
reveal evidence for oxygen in the environment at 2.96 Ga at 2.8 Ga, while stromatolites from the
Ghaap Group (2.52 Ga) appear to have grown under poorly-oxygenated conditions. My data
suggests that oxygenic photosynthesis existed yet at least 0.61 Ga before the rise of atmospheric
oxygen. Moreover, the consistent signal for oxygen in the environment at this time could be
indicative of a constant period of mild oxygenation, rather than local oases as previously proposed.
La Terre Primitive se distingue par l’absence d’oxygène dans l’atmosphère et les océans. La
croissance de la concentration en oxygène de l’atmosphère fut déterminée par le Grand Évènement
d’Oxydation (GEO) aux alentours de 2.45 Ga et aurait été influencée par l’augmentation de
l’utilisation de la photosynthèse oxygénique par les formes de vies primitives que sont les bactéries.
De plus, il est reconnu que des pulses d’oxygène ont existé avant le GOE. Nous présentons ici des
données d’isotopie du molybdène de stromatolites modernes provenant du lagon du Bacalar au
Mexique et de stromatolites anciens issus de formations archéennes à 2.52 Ga (Groupe Ghaap,
Afrique du Sud), à 2.8 Ga (Steep Rock, Canada) et à 2.96 Ga (Red Lake, Canada). Les échantillons
modernes montrent une signature isotopique du molybdène de l’eau dans laquelle ils ont été formés.
Cela justifie l’utilisation de la composition isotopique en molybdène des carbonates pour connaître
les conditions redox de l’environnement marin dans lequel ils ont précipité. Les stromatolites
anciens indiquent la présence d’environnements oxygénés dès 2.96 Ga et à 2.8 Ga tandis que les
échantillons du Groupe Ghaap (2.52 Ga) se sont formés en condition anoxique. Nous pensons que
la photosynthèse oxygénique existait déjà il y a plus de 0.61 Ga avant le GOE et que ces
environnements oxygénés pourraient correspondre à de longue période oxygénées plutôt qu’aux
oasis locaux suggérés précédemment.

Remerciements :
Je tiens à remercier chaleureusement Stefan Lalonde, qui m’a vu un jour débarquer dans son
bureau avec une idée précise en tête et qui m’a permis de la réaliser. Sa passion et son enthousiasme
si contagieux rendent l’échange et le travail captivant. Son perfectionnisme et son besoin de faire
les choses à la dernière minute ne font peut être pas partie de mes facultés mais je compte bien y
remédier dans les années à venir au cours de la thèse. Merci beaucoup Stefan de croire en mes
capacités scientifiques.
Merci aussi à Kurt Konhauser pour son soutient pour ce projet à court et à long terme en m’offrant
la possibilité de continuer en thèse. Merci aussi pour ses échantillons de stomatolite.
Merci à Olivier Rouxel qui m’a laisser utiliser ses standards, ses doubles-spikes et ses solutions
pour toute ma chimie.
Un Merci particulier à Manu pour ses conseils, sa passion pour la recherche analytique et pour avoir
bravé l’Apex défaillant et le 1er mai afin d’avoir des résultats pour ce stage !
Merci à Dawn Sumner et Philip Fralick pour m’avoir permis de travailler sur leurs échantillons de
stromatolites anciens et à Pierre SansJofre pour les carbonates sur lesquels j’ai pu effectuer le
développement analytique.
Merci à Clair, Marie Laure, Céline et Yohann pour leurs accueils et leurs patiences face à mes
petites boulettes de carbonate et mes éruptions d’échantillons !
Merci à toute l’équipe du LDO pour l’accueil au sein du laboratoire, pour croire en ce projet et pour
le soutient reçu dans notre « combat » de petit stagiaire.
Merci à toute l’équipe du LDO pour l’accueil au sein du laboratoire, pour croire en ce projet et pour
le soutient reçu dans notre « combat » de petit stagiaire.
Merci à mes collègues de salle blanche, Maxence et Arthur, avec leur bonne humeur, imitation du
Jurassique et les concerts ! Un merci particulier à Maxence pour m’avoir aidé dans la chimie et dans
la préparation des analyses.
Merci à Virgil pour son soutient, ses coups de main, ses coups de gueule et toutes les discussion
autour de cette passion qu’est la science!
Merci à Tyler pour sa bonne humeur, les corrections d’anglais qu’il a apporté à ce rapport et son
enseignement sur la rédaction d’article en anglais. On se revoie, je l’espère, bientôt au Canada !
Merci à mon collègue de bureau Mr Steven, sans qui je me serai pris la tête beaucoup plus souvent.
Longue vie aux craquages et aux hymnes Celtes !
Merci à Kroll sans qui les choses ne tourneraient pas rond ! Tu gères la fougère, on t’aime tous !
Merci Dominique pour te démener dans la recherche d’articles introuvables ! Je ne sais pas
comment vont faire les prochaines promos !

Merci à ma famille pour m’avoir accueilli afin que je rédige les pieds dans l’eau face à la petite mer
et à l’île Tristan.
Merci à Guillaume qui un soir de long week-end ma vu se réfugier chez lui pour pouvoir avance
l’écriture dans le calme !
Merci aux amis qui mon sortie l’esprit que ce moment de rédaction se face avec plaisir entre des
moments de natation, des week-end de sauvage à la sauvage et la construction de bateau en carton.
Ca va cartonner ce week-end Jean-Mi ! A l’abordage !
Merci à toute la promo avec qui j’ai passé d’excellents moments au long de ces deux années et vécu
des choses inoubliable tel le séisme de minuit dans une salle de court, un voyage formidable en
Italie, des conneries, des craquages, des passions. Alors tous à vos fossiles et bon vent !
En avant la Science !

1
Table of Contents
INTRODUCTION)..........................................................................................................................................................)4!
1.! GENERAL)CONTEXT)..........................................................................................................................................)6!! THE!EARLIEST!LIFE!ON!EARTH!.........................................................................................................................................!6!1.1! FROM!PHOTOSYNTHETIC!BACTERIA!TO!STROMATOLITES!............................................................................................!9!1.2! MOLYBDENUM!AS!A!REDOX!PROXY!................................................................................................................................!10!1.31.3.1! Molybdenum.geochemistry....................................................................................................................................10!1.3.2! Molybdenum.isotopes...............................................................................................................................................11!
2.)MATERIALS)AND)METHODS)...........................................................................................................................)16!2.1.! MATERIALS!.......................................................................................................................................................................!16!2.2.! PRINCIPLES!OF!MO!ISOTOPE!MEASUREMENT!.............................................................................................................!17!2.2.1.! MC:ICP:MS....................................................................................................................................................................17!2.2.2.! Sample.preparation..................................................................................................................................................17!2.2.3.! The.isotope.double.spike.method........................................................................................................................18!
2.3.! METHODS!OF!THIS!STUDY!..............................................................................................................................................!18!2.4.! MO!ISOTOPIC!MEASUREMENTS!.....................................................................................................................................!21!
3.! RESULTS)............................................................................................................................................................)23!
4.! DISCUSSION)......................................................................................................................................................)29!4.1.! MODERN!STROMATOLITES!.............................................................................................................................................!29!4.2.! 2.52!GA!STROMATOLITES,!GAMOHAAN!FORMATION,!SOUTH!AFRICA!..................................................................!30!4.3.! 2.8!GA!STROMATOLITES,!STEEP!ROCK,!CANADA!......................................................................................................!31!4.4.! 2.96!GA!STROMATOLITES,!RED!LAKE,!CANADA!........................................................................................................!31!4.5.! EVIDENCE!FOR!OXYGEN!AND!OXYGENIC!PHOTOSYNTHESIS!BEFORE!THE!GOE!....................................................!32!
CONCLUSION).............................................................................................................................................................)34!BIBLIOGRAPHY)........................................................................................................................................................)35!
ANNEXES)....................................................................................................................................................................)38!

2
Tables and Figures Figure.1:.Evolution.of.Earth’s.atmospheric.oxygen.content.through.geological.time..Purple.and.blue.shaded.zones.
represent.classic.and.emerging.views,.respectively..Arrows.represent.possible.‘whiffs’.of.O2.before.the.Great.
Oxidation.Event.(GOE).ca..2.45.Ga..From.Lyons.et.al..(2014)....................................................................................................................5!Figure.2.1.:.Carbon.isotope.signatures.in.a).Pilbara.sediments.(>3.250.Ga,.West.Australia);.b).Isua.BIF.(~3.8.Ga,.
West.Greenland).and.c).BIF.on.Akilia.island.(>3.85.Ga,.West.Greenland)..Characteristic.ranges.of.δ13C.in.organic.
and.inorganic.matter.are.presented.in.d..From.Mojzsis.et.al..(1996)....................................................................................................6!Figure.2.2:.Earth’s.earliest.fossil.records:.a).Microfossils;.Examples.of.hollow,.tubular,.sheath:like.microfossil.
Strelley.Pool.Chert,.Warrawoona.Group,.Western.Australia.(3.45.Ga;.from.Wacey.et.al.,.2011),.and.b).Oldest.known.
stromatolite.occurrence,.also.in.the.Strelley.Pool.Chert,.Warrawoona.Group,.Western.Australia.(photo.courtesy.S..
Lalonde).............................................................................................................................................................................................................................7!Figure.2.3:.Geobiological.clock.from.Konhauser.(2007),.adapted.from.Des.Marais.(2000)........................................................7!Figure.2.4:.Schematic.of.carbonate.biomineralization.by.cyanobacteria..From.Konhauser.(2007),.adapted.from.
Thompson.and.Ferris.(1990)....................................................................................................................................................................................9!Figure.2.5:.Compilation.of.Mo.isotopic.signature.of.Mo.sources.of.seawater..The.mean.of.modern.seawater.and.crust.
Mo.isotopic.signature.are.represented.by.respectively.a.dash.line.and.a.full.line.........................................................................14!Figure.2.6:.Compilation.of.Mo.isotopic.signature.of.Mo.sinks.of.seawater..The.mean.of.modern.and.Proterozoic.
seawater.and.crust.Mo.isotopic.signature.are.represented.by.respectively.two.dash.lines.and.a.full.line.........................15!Figure.3.1:.Measurement.of.Mo.concentration.by.double.spike.isotope.dilution.using.the.MC:ICP:MS.Neptune..Red.
columns:.measurement.after.a.total.attack.with.6N.HCl.according.to.the.protocol.of.Voegelin.et.al..(2009)..Blue.
columns:.measurement.after.a.weak.leach.by.5%.acetic.acid.according.Rongemaille.et.al..(2011)....................................19!Figure.3.2:.Elution.of.molybdenum.from.SDO:1,.SPEX,.and.SPEX:CAMIL32.column.tests..Measurements.were.
performed.by.HR:ICP:MS.........................................................................................................................................................................................20!Figure.3.3:..Mo.yields.through.both.chromatographic.columns.used.to.concentrate.and.purify.molybdenum...............21!Figure.3.4:.Elution.of.major.elements.in.the.SDO:1.and.Camil.elution.tests..Measurements.were.performed.by.ICP:
AES.....................................................................................................................................................................................................................................21!Figure.4.1:.Correlation.between.δ95/98Mo.and.δ97/.98Mo.with.a.slope.equal.to.the.relative.mass.differences.of.
97Mo/98Mo.(1).and.95Mo/98Mo.(3).support.an.isobaric.interference:free.measurement.of.all.these.isotopes...........23!Table.1:.Results.of.Mo.isotopic.analyses.of.modern.and.ancient.stromatolites..δ98MoSRM3134.values.were.obtained.
by.the.addition.of.0.34‰.to.the.RochMo2–normalized.values,.as.per.Goldberg.et.al..(2013)................................................24!Figure.4.2:.δ98Mo.and.Mo.concentrations.of.modern.stromatolites.from.Bacalar.lagoon,.Mexico........................................25!Figure.4.3:.δ98Mo.and.Mo.concentrations.of.ancient.stromatolites.from.the.Gamohaan.formation,.South.Africa,.
2.52Ga...............................................................................................................................................................................................................................25!Figure.4.4:.δ98Mo.and.Mo.concentrations.of.ancient.stromatolites.from.Steep.Rock,.Canada,.2.8Ga..................................26!Figure.4.5:.δ98Mo.and.Mo.concentrations.of.ancient.stromatolites.from.Red.Lake,.Canada,.2.96Ga...................................26!Figure.4.6:.δ98/95Mo.values.of.modern.and.ancient.stromatolites.examined.in.this.study.........................................................28!Figure.5.1:.Mo.isotopic.compositions.of.Bacalar.modern.stromatolites.from.this.study.(blue.points).appear.to.
overlap.with.the.modern.river.array.(grey.area;.Archer.and.Vance,.2008)..However,.a.mixing.model.based.on.the.
composition.of.continental.crust.(δ98Mo=0‰,.Siebert.et.al..(2003).and.Mo=1100ppb;.Rudnick.and.Gao.(2003)).and.

3
the.isotopically.heaviest.stromatolite.in.this.area.(δ98Mo.=1.55‰.and.Mo=6.15ppb).suggests.a.detrital.dependence.
.............................................................................................................................................................................................................................................29!Figure.5.2:.Selected.Mo.isotopic.data.throughout.geological.time..Mo.isotopic.compositions.of.the.different.types.of.
rocks.are.from.this.study.and.as.well.as.others.(see.legend)..These.results.suggest.a.new.emerging.picture.of.redox.
evolution.though.geological.time,.with.consistent.Mo.isotope.evidence.for.at.least.transient.oxygen.in.the.
environment.at.2.96.Ga.and.2.8.Ga..For.comparison,.data.for.modern.carbonates.and.seawater.are.shown.to.
present.to.represent.the.modern.oxygenated.environment.....................................................................................................................32!
4
Introduction
The concentration of oxygen in the oceans and atmosphere has evolved significantly over
geological time (Holland, 2006). Multiple studies using various mineralogical observations (e.g.,
occurrence of detrital pyrite and iron formation; Rasmussen and Buick, 1999; Klein, 2005) and
geochemical data (e.g., δ13C and Δ33S; Karhu and Holland, 1996; Farquhar et al., 2000) have
demonstrated that the quantity of oxygen in the atmosphere was 10-5 times lower than the present
atmospheric level (PAL) prior to about 2.5 Ga (Figure 1; Holland, 2006; Lyons et al., 2014; Pavlov
and Kasting, 2002). Nearly all of these studies have linked the rise of atmospheric oxygen to the
evolution and activity of microbial life (Holland, 2006; Lyons et al., 2014). The first sustained
increase in Earth’s atmospheric oxygen occurred around 2.4 Ga and is commonly know as the Great
Oxidation Event (GOE) (Bekker et al., 2004). While the GOE has traditionally been attributed to
the development of oxygenic photosynthesis by cyanobacteria (e.g., Awramik, 1992; Lyons et al.,
2014), the emerging picture is more nuanced. Recent studies have now shown that 1) local “oases”
or “whiffs” of oxygen may have been present before the GOE (Figure 1; see Anbar et al., 2007;
Crowe et al., 2013; Lalonde and Konhauser, 2015; Lyons et al., 2014; Planavsky et al., 2014), and
2) oxygenic photosynthesis may have existed as far back as 3.75 Ga (the oldest sedimentary
record), well before the GOE. Rosing and Frei (2004) considered low δ13Corg values in Earth’s oldest
sediments to be evidence of oxygenic photosynthesis at 3.75 Ga, whereas Awramik (1992)
considered the earliest appearance of oxygenic photosynthesis to be associated with the oldest
known stromatolite occurrence ca. 3.5 Ga. However, light carbon isotope enrichments and the
occurrence of stromatolites may both be explained by non-oxygenic photosynthesis. Organic
biomarkers have also been used to argue for oxygenic photosynthesis ca. 2.7 Ga (see review by
Buick, 2008), but this data has since been refuted as resulting from later contamination (Rasmussen
et al., 2008). In recent years, attention has turned to geochemical data (elemental and isotopic
enrichments) of metals whose cycling appears highly sensitive to the presence of free O2.
Planavsky et al. (2014) reported such evidence of oxygenic photosynthesis at 2.95 Ga by
inspecting the correlation between molybdenum (Mo) isotopic signatures and the ratio of iron to
manganese in deep-water sediments from the Pongola Supergroup, S. Africa. Molybdenum displays
a characteristically light isotope signature when adsorbed to manganese oxides, which themselves
require significant free O2 to form. However, the strong fractionation associated with Mo adsorption
to manganese oxides makes it difficult to extrapolate back to the Mo isotope composition of
seawater due to potential Ryleigh distillation effects. In the case of partial absorption of
molybdenum, its isotopic signature will be significantly lighter than seawater, whereas total

5
absorption would result in signatures closer to contemporaneous seawater. Recent work by
Voegelin et al. (2009) has shown the molybdenum isotope composition of carbonates better
represents the oceanic Mo reservoir without potential artefacts from partial absorption.
Figure.1:.Evolution.of.Earth’s.atmospheric.oxygen.content.through.geological.time..Purple.and.blue.shaded.zones.
represent. classic. and. emerging. views,. respectively.. Arrows. represent. possible. ‘whiffs’. of. O2. before. the. Great.
Oxidation.Event.(GOE).ca..2.45.Ga..From.Lyons.et.al..(2014)..
The main goals of my MSc project were twofold: (1) to use the molybdenum isotope
composition of Precambrian carbonates to shed new light on the origin of oxygenic photosynthesis,
and (2) determine the phototrophic pathway used by bacteria in building oldest macrofossil records
of Earth: stromatolites. Samples analysed in this study include ancient stromatolites from Red Lake,
Canada (2.96 Ga), Steep Rock, Canada (2.8 Ga), the Gamohaan formation, South Africa (2.52 Ga),
and modern freshwater stromatolites from Laguna Bacalar, Mexico.
This study was conducted under the supervision of Stefan Lalonde, CNRS researcher in the
Laboratoire Domaines Océaniques (LDO). It could not have been completed without the assistance
and co-funding of Professor Kurt Konhauser (University of Alberta), who also aided in the
collection of stromatolites samples. Professors Philip Fralick (Lakehead University) and Dawn
Sumner (University of California Davis) kindly provided Precambrian samples for this study.
Molybdenum isotope analyses was performed at the Pôle Spectrométrie Océan (PSO) Brest with the
assistance of IFREMER Research Scientist Olivier Rouxel. This work constitutes a preliminary
study of the transition metal isotope compositions in modern and ancient stromatolites, which will
be expanded upon during a subsequent PhD project.

6
1. General Context
The earliest life on Earth 1.1
The oldest potential records of life on Earth are isotopic signatures. Mojzsis et al. (1996)
reported that the Banded Iron Formation (BIF) and chert from West Greenland (Akilia Island, ~3.85
Ga and Isua, ~3.8Ga) contain potentially biogenic light carbon isotopic signatures (Figure 2.1).
Measurements were made on carbonaceous material inclusions in apatite minerals Ca5(PO4)3(OH,F).
Phosphate is an essential element for life, and this diagenetic mineral may have crystallised from a
P-rich biological source, as it often does today (Krajewshi et al., 2014). While metamorphism may
have led to degassing of isotopically heavy C and enrichment of the residue in the light isotope, it
remains difficult to explain the observed light C isotope composition of these rocks by
metamorphism alone (Mojzsis et al., 1996).
Figure. 2.1.:. Carbon. isotope. signatures. in. a). Pilbara. sediments. (>3.250.Ga,.West.Australia);. b).Isua.BIF. (~3.8.Ga,.
West.Greenland).and.c).BIF.on.Akilia.island.(>3.85.Ga,.West.Greenland)..Characteristic.ranges.of.δ13C.in.organic.
and.inorganic.matter.are.presented.in.d..From.Mojzsis.et.al..(1996)..
This early isotopic record is reinforced by microfossil evidence discovered in the Swaziland
Supergroup, South Africa (3.5 Ga; Walsh, 1992) and the Strelley Pool Chert, Western Australia (3.5
Ga; Wacey et al., 2011). Although they were formed very early in Earth’s history, these complex
microfossils (Figure 2.2a) were taken to reflect the proliferation of bacterial life to a relatively
advanced stage by this time.

7
. . .
Figure. 2.2:. Earth’s. earliest. fossil. records:. a). Microfossils;. Examples. of. hollow,. tubular,. sheath:like. microfossil.
Strelley.Pool.Chert,.Warrawoona.Group,.Western.Australia.(3.45.Ga;.from.Wacey.et.al.,.2011),.and.b).Oldest.known.
stromatolite.occurrence,.also. in.the.Strelley.Pool.Chert,.Warrawoona.Group,.Western.Australia.(photo.courtesy.S..
Lalonde)..
Molecular phylogenetic data provides further information on life’s first cells (for an
overview see Konhauser, 2007). The first life forms were likely anaerobic chemolithoautotrophs
(Figure 2.3); they depended on inorganic sources of essential elements for life (e.g., carbon,
nitrogen) and their energy was produced by catalysis of redox reactions using inorganic compounds
available in their environment. With the evolution of photosynthesis, bacteria gained independence
from local reductants, sourcing their reducing power from sunlight instead.
Figure.2.3:.Geobiological.clock.from.Konhauser.(2007),.adapted.from.Des.Marais.(2000)..

8
Photosynthesis permits synthesis of organic matter using light from the sun as a source of
reducing power. Sunlight is captured by light-harvesting pigments (chlorophyll,
bacteriochlorophyll), and depending on the radiative environment (e.g. at the surface vs. at depth in
a water column, under minerals or in a mat with other bacteria, or as a function of water opacity),
different phototrophic bacteria with different types of pigments thrive on specific wavelengths of
sunlight. The CO2 used for the reaction can come from inorganic sources (photoautotrophy) or
organic matter (photoheterotrophy). There two fundamental different kinds of photosynthesis: (i)
anoxygenic photosynthesis (no O2 production) and (ii) oxygenic photosynthesis (O2-producing). The
earliest phototrophic bacteria are thought to have grown in environments with abundant reductants,
namely H2S and Fe2+. Phylogenetic data indicate that the earliest photosynthesizers were dependent
on these sources of reducing power, and the process was anoxygenic. More specifically, anoxygenic
photosynthesizers are divided into two groups based on their source of reducing power:
1) phototrophic sulfur oxidizers (green-sulfur or purple-sulfur bacteria) that use hydrogen
sulphide (H2S) or elemental sulfur (S0) as their electron source (Kelly, 1974):
3H2S + 6CO2 + 6H2O → C6H12O6 + 3SO42- + 6H+ (1)
12S0 + 18CO2 + 30H2O → 3C6H12O6 + 12SO42- + 24H+ (2)
2) anoxygenic photoferrotrophs use Fe2+ as a reductant for the synthesis of organic matter.
Photoferrotrophic bacteria generate large amounts of Fe(III) minerals as a waste product, a
phenomena that has been implicated in the deposition of Precambrian BIF (Konhauser et al., 2002).
Heising et al. (1999) defined the photoferrotrophic reaction as:
24Fe2+ + 6CO2 + 66H2O → C6H12O6 + 24Fe(OH)3 + 48H+ (3)
Eventually, bacteria evolved the ability to oxidize water, giving rise to oxygenic
photosynthesis. Performed by modern cyanobacteria and plants, this photosynthesic pathway
produces free oxygen (O2) according to the follow reaction:
6H2O + 6CO2 → C6H12O6 + 6O2 (4)
9
From photosynthetic bacteria to stromatolites 1.2
Microbial communities form complex assemblages that are often found bound together by
biologically produced extracellular polymeric substances (EPS) to form a biofilm, and in more
favourable conditions, they may form a microbial mat visible to the naked eye. Under such
conditions, bacteria exert significant chemical control over their local environment, and can drive
the precipitation of different kinds of minerals, primarily carbonates, phosphates, sulfates, sulfides,
and metal oxides, in a process called biomineralisation (see Konhauser, 2007). As stromatolites are
formed almost exclusively by carbonate biomineralisation (combined with grain trapping), only this
biomineralisation mechanism is explained here.
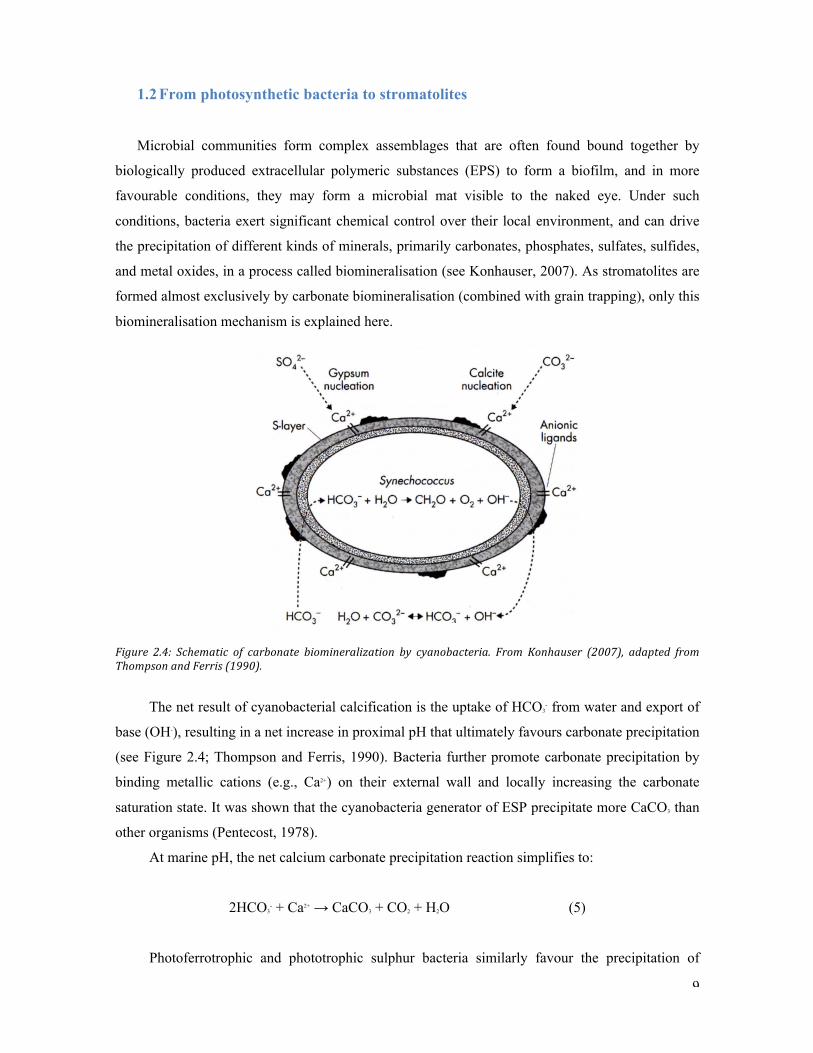
Figure. 2.4:. Schematic. of. carbonate. biomineralization. by. cyanobacteria.. From. Konhauser. (2007),. adapted. from.
Thompson.and.Ferris.(1990)..
The net result of cyanobacterial calcification is the uptake of HCO3- from water and export of
base (OH-), resulting in a net increase in proximal pH that ultimately favours carbonate precipitation
(see Figure 2.4; Thompson and Ferris, 1990). Bacteria further promote carbonate precipitation by
binding metallic cations (e.g., Ca2+) on their external wall and locally increasing the carbonate
saturation state. It was shown that the cyanobacteria generator of ESP precipitate more CaCO3 than
other organisms (Pentecost, 1978).
At marine pH, the net calcium carbonate precipitation reaction simplifies to:
2HCO3- + Ca2+ → CaCO3 + CO2 + H2O (5)
Photoferrotrophic and phototrophic sulphur bacteria similarly favour the precipitation of

10
carbonate minerals by Ca2+ adsorption and uptake of CO2 (c.f. reactions 1–3; e.g. Hegler et al. 2008).
The carbonate produced accumulates as an encrustation on the cell and can lead to a visible build–
up of calcite carbonate, and ultimately, to the formation of microbial carbonate structures such as
stromatolites. Photosynthetic activity is often associated with daily or seasonal variations, such that
precipitation of CaCO3 may be intense in spring and summer, and may wane during winter, perhaps
even leading to periods of dissolution (Thompson and Ferris, 1990). To maintain a favourable
environment for growth, phototrophic bacteria will continually migrate up the calcite layer (porous
or non-porous) that was most recently precipitated, producing the laminated form characteristic of
stromatolites. Such migration and upward growth may be modulated by different parameters,
including irradiance, tides, changes in salinity, and sedimentation rates (e.g. Chaftez et al., 1991,
Konhauser et al. 2001). Heterotrophic organisms are ubiquitous throughout and metabolize the
available organic matter, such as dead cells and abandoned EPS. Stromatolites exist in various
forms (e.g., millimetre to metre scale, domal, flat, etc), and are the most common type of
microbialite. Others include travertine, thrombolites, speleothems, and yet other morphologies that
remain poorly classified. In short, stromatolites are directly linked to photosynthetic bacterial
activity; this makes them ideally suited for capturing environmental signatures of oxygenic or
anoxygenic photosynthesis.
Molybdenum as a redox proxy 1.3
1.3.1 Molybdenum geochemistry
Molybdenum (Mo), transition metal number 42, has seven stable isotopes from mass 92 to
100, namely 92Mo, 94Mo, 95Mo, 96Mo, 97Mo, 98Mo, and 100Mo. Depending on environmental redox
conditions, Mo is present in different oxidation states. In oxic conditions (such as in modern
seawater), Mo is present in the highly stable molybdate oxyanion form, MoO42-. In water with free
HS- (euxinic conditions), sulfidation of MoO42- replaces O with S and forms a variety of
thiomolybdate ions with the general formula MoO4-xSx2- (Helz et al., 1996). These properties render
Mo highly sensitive to varying redox conditions. Helz et al. (1996) demonstrated total fixation of
Mo in marine sediments above a critical H2Saq concentration of 11 μM, a so-called “geochemical
switch”. Mo is also an essential micronutrient and is required for many biological activities and
metabolic processes (Mendel, 2005). It is one of most abundant transition metals in modern oceans
(~100 nM; Collier, 1985), and is well-mixed with a residence time of ~800ky (Emerson and
Huested, 1991). Seawater is thus a significant Mo reservoir on the modern Earth. The oxidative
weathering of sulfur minerals in the continental crust is an important source of Mo, which is carried

11
to the ocean by riverine transport with typical dissolved concentrations around 5 nM (Figure 2.5;
Morford and Emerson, 1999). Mo displays highly mobile behaviour during weathering, erosion,
and transport under oxidizing surface conditions (Siebert et al., 2003). Moreover, low-temperature
hydrothermal input is around only 10% of the riverine concentration (McManus et al., 2002). There
are two major sinks for Mo in the oceans. The largest sink in the modern oceans are manganese
(Mn) oxide minerals (and to a lesser extent, Fe oxide minerals), which bind and highly concentrate
Mo by adsorption (Barling et al., 2001; Goldberg, 1954). The second major sink is anoxic
sediments, which trap the Mo released by after Fe-Mn oxide reduction by the precipitation of MoS2.
Its concentration in anoxic sediments is typically around 100 ppm (Scott et al., 2008), whereas it
averages around 1.1 ppm in the continental crust (Rudnick and Gao, 2003). Anoxic sediments
precipitate more rapidly than Fe-Mn-oxide crusts, such that their expansion can easily perturb the
balance of Mo sinks. Finally, while molybdenum may be found in carbonates as a trace constituent,
carbonates represent only ≤1% of the total marine Mo sink (Morford and Emerson, 1999; Voegelin
et al., 2009).
1.3.2 Molybdenum isotopes
Over the past 50 years, the stable isotope compositions of light elements such as carbon and
oxygen have proven to be rich paleo-tracers. With the development of multiple collector plasma
source mass spectrometry (MC-ICP-MS), isotope geochemists were able to shift focus to transition
metals (McManus et al., 2002). Molybdenum isotopic compositions of modern and ancient samples
have received significant attention due to their strong potential for paleo-redox reconstruction
(Archer and Vance, 2008; Arnold et al., 2004; Barling et al., 2001; Barling and Anbar, 2004;
McManus et al., 2002; Planavsky et al., 2014b; Siebert et al., 2003; Voegelin et al., 2009; 2010).
Mo isotopic compositions are represented in the conventional δ notation:
! Mo!!/!" = !!"!!
!"!!"!"#$%&
!"!!!"!!"
!"#$%#&%− 1 !×!1000!!‰
Mo isotopic compositions have been primarily reported in two different ways in literature.
The most common reporting is δ98/95Mo with respect to the isotope standard “Bern-Mo” (Johnson
Matthey ICP standard, lot 602332B; McManus et al., 2002; Siebert et al., 2003; Voegelin et al.,
2009; 2010). The second one most common reporting is δ97/95Mo with respect to Roch-Mo2 (Johnson
Matthey Specpure Molybdenum Plasma Standard, lot 7024991; Barling et al., 2001; Barling and
12
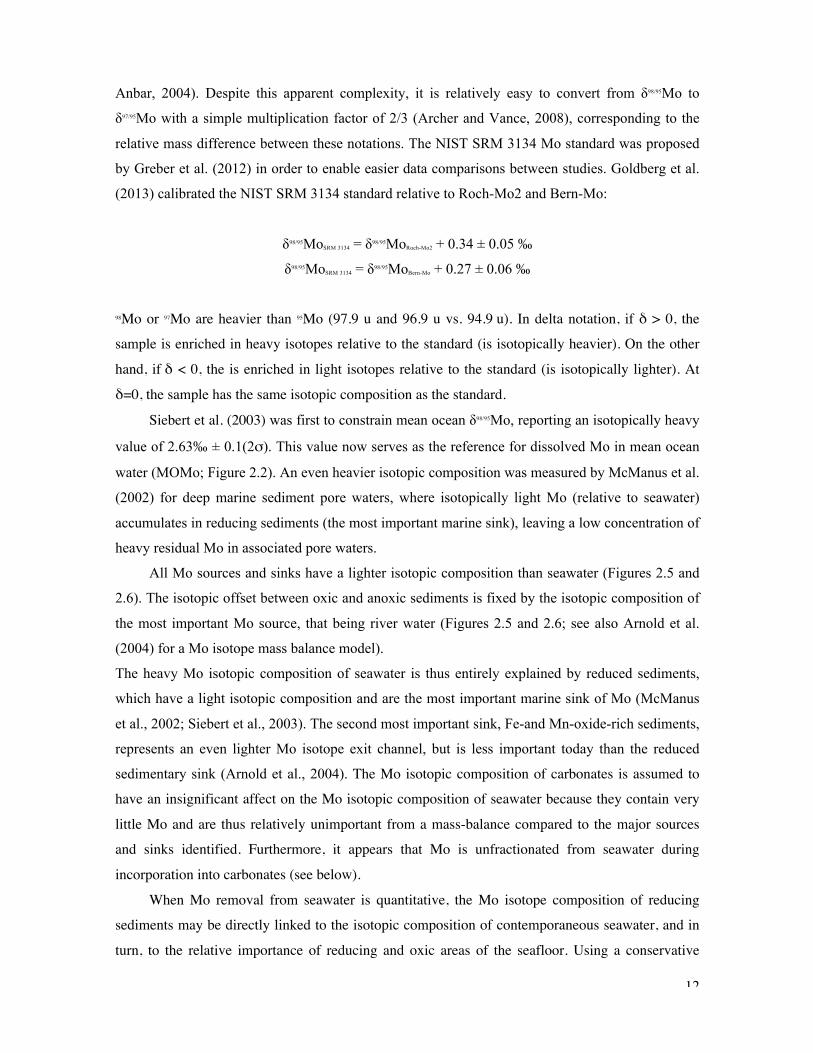
Anbar, 2004). Despite this apparent complexity, it is relatively easy to convert from δ98/95Mo to
δ97/95Mo with a simple multiplication factor of 2/3 (Archer and Vance, 2008), corresponding to the
relative mass difference between these notations. The NIST SRM 3134 Mo standard was proposed
by Greber et al. (2012) in order to enable easier data comparisons between studies. Goldberg et al.
(2013) calibrated the NIST SRM 3134 standard relative to Roch-Mo2 and Bern-Mo:
δ98/95MoSRM 3134 = δ98/95MoRoch-Mo2 + 0.34 ± 0.05 ‰
δ98/95MoSRM 3134 = δ98/95MoBern-Mo + 0.27 ± 0.06 ‰
98Mo or 97Mo are heavier than 95Mo (97.9 u and 96.9 u vs. 94.9 u). In delta notation, if δ > 0, the
sample is enriched in heavy isotopes relative to the standard (is isotopically heavier). On the other
hand, if δ < 0, the is enriched in light isotopes relative to the standard (is isotopically lighter). At
δ=0, the sample has the same isotopic composition as the standard.
Siebert et al. (2003) was first to constrain mean ocean δ98/95Mo, reporting an isotopically heavy
value of 2.63‰ ± 0.1(2σ). This value now serves as the reference for dissolved Mo in mean ocean
water (MOMo; Figure 2.2). An even heavier isotopic composition was measured by McManus et al.
(2002) for deep marine sediment pore waters, where isotopically light Mo (relative to seawater)
accumulates in reducing sediments (the most important marine sink), leaving a low concentration of
heavy residual Mo in associated pore waters.
All Mo sources and sinks have a lighter isotopic composition than seawater (Figures 2.5 and
2.6). The isotopic offset between oxic and anoxic sediments is fixed by the isotopic composition of
the most important Mo source, that being river water (Figures 2.5 and 2.6; see also Arnold et al.
(2004) for a Mo isotope mass balance model).
The heavy Mo isotopic composition of seawater is thus entirely explained by reduced sediments,
which have a light isotopic composition and are the most important marine sink of Mo (McManus
et al., 2002; Siebert et al., 2003). The second most important sink, Fe-and Mn-oxide-rich sediments,
represents an even lighter Mo isotope exit channel, but is less important today than the reduced
sedimentary sink (Arnold et al., 2004). The Mo isotopic composition of carbonates is assumed to
have an insignificant affect on the Mo isotopic composition of seawater because they contain very
little Mo and are thus relatively unimportant from a mass-balance compared to the major sources
and sinks identified. Furthermore, it appears that Mo is unfractionated from seawater during
incorporation into carbonates (see below).
When Mo removal from seawater is quantitative, the Mo isotope composition of reducing
sediments may be directly linked to the isotopic composition of contemporaneous seawater, and in
turn, to the relative importance of reducing and oxic areas of the seafloor. Using a conservative
13
assumption of 70% Mo removal by euxinic sediments in the mid-Proterozoic, Arnold et al. (2004)
used simple isotope mass balance to calculate the isotopic composition of mid-Proterozoic seawater
to be around 1.5‰. In the same manner, mid-Proterozoic riverine inputs have been estimated to be
around around 1‰ (Archer and Vance, 2008).
The above calculations require near quantitative Mo removal into the ancient sediments upon
which these estimates are based. Carbonate sediments appear to hold significant promise in this
regard. A recent study examining modern carbonate samples has shown that non-skeletal carbonates
present a δ98/95Mo close to seawater, whereas skeletal carbonates show a Mo isotopic composition
that is only slightly lighter (between 1.96 and 2.59‰; Voegelin et al., 2009). Contrary to modern
euxinic sediments, highly localized in basins, carbonate sediments appear better to record global
seawater Mo isotope compositions. Voegelin et al., (2010) demonstrated this assumption by the
examination of Archean shale and carbonate records. The maximal δ98/95Mo value measured on
Archean carbonates seems to be a reliable and direct reflection of the δ98/95Mo value of
contemporaneous seawater (determined by Voegelin et al. (2010) to be upwards of 1.3‰ ca. 2.52
Ga).
As all major isotope exchange reactions of Mo depend directly of the MoO42- molecule, any
isotope fractionation of Mo from crustal values requires the presence of oxygen.

14
Figure.2.5:.Compilation.of.Mo.isotopic.signature.of.Mo.sources.of.seawater..The.mean.of.modern.seawater.and.crust.
Mo.isotopic.signature.are.represented.by.respectively.a.dash.line.and.a.full.line..
-2 0 2 43-1 1
Modern seawaters(Siebert et al., 2003)
n=5, mean=2.63
Marine pore waters(McManus et al., 2002)
n=1,1 mean=2.73
Modern rivers(Archer and Vance, 2008)
n=11, mean=1.19
Hydrothermal fluids(McManus et al., 2002)
n=5, mean=1.41
Granite(Siebert et al., 2003)
n=2, mean=0.39
Continental material(Barling et al., 2001)
n=3, mean=-0.7
δ98/95Mo (‰)

15
Figure. 2.6:. Compilation. of.Mo. isotopic. signature. of.Mo. sinks. of. seawater.. The.mean. of.modern. and. Proterozoic.
seawater.and.crust.Mo.isotopic.signature.are.represented.by.respectively.two.dash.lines.and.a.full.line..
-1 0 1 2 3
Modern seawaters(Siebert et al., 2003)
n=5, mean=2.63
Modern carbonates(Voegelin et al., 2009)
n=4, mean=2.33
Modern suboxic sediments(Siebert et al., 2003)
n=5, mean=1.34
Modern anoxic sediments(Barling et al., 2001)
n=16, mean=1.07
Modern Fe-Mn crusts(Siebert et al., 2003)n=37, mean=-0.44
Proterozoic seawater(Arnold et al., 2004)
calculated by isotope mass balance
Proterozoic carbonates(Voegelin et al., 2010)
n=36, mean=1.23Proterozoic euxinic sediments
(Wille et al., 2007 and Arnold et al., 2004)
n=65, mean=0.8Proterozoic Fe-Mn crusts(Planavsky et a l ., 2014)
n=22, mean=0.39
δ98/95Mo (‰)

16
2. Materials and Methods
2.1. Materials
In order to compare the Mo isotopic signature of modern and ancient stromatolites and
microbialites, measurements of the Mo isotopic composition of 18 samples were realised: 5 modern
stromatolites, 11 ancient stromatolites, and 2 ancient microbialites.
Modern stromatolites (n=5) from the Bacalar Lagoon, Mexico, were provided by Dr. Kurt
Konhauser (University of Alberta). Bacalar is a marl lagoon, with sediment composed of >35%
carbonate, aragonite, and clay (LaBuhn et al., 2012). It’s clear freshwater is compositionally
homogenous except in the cenote, which is poor in dissolved oxygen. The majority of the
stromatolites growing there were built by cyanobacteria in the late Holocene following a rise in
carbonate concentration in the lagoon. This carbonate came from dissolution of the underlying
Cenozoic limestone karst system (Gischler et al., 2008). The stromatolites are growing even today
despite an invasion of mussels.
The ancient stromatolites come from two different Archean cratons. The oldest ones (n=3) are
from the Red Lake carbonate platform, Canada, and are 2.96 Ga years old. They were kindly
provided by Dr. Philip Fralick (Lakehead University). They grew in shallow carbonated water on a
felsic volcanic section (Thurston and Chivers, 1990). Two other stromatolites (one digitate and one
flat, also from Philip Fralick‘s collection) and two microbialites were also analyzed from the 2.8 Ga
years old Steep Rock locality. They belong to the Mosher Carbonate unit, which is composed of
calcite, ankerite, and dolomite, with minor quartz, pyrite, and kerogen. The Steep Rock
stromatolites were discovered in 1913 by Lawson and can be up to 16.5 meters tall (Wilks and
Nisbet, 1985). Multiple forms of stromatolites grew here in shallow tidal water environments,
perhaps lagoonal and/or shelf settings close to a shallow sea. A stratigraphic analysis of the Steep
Rock stromatolites and of their different forms suggests an environment with a subsiding basement,
or possibly a eustatically transgressed basement (Wilks and Nisbet, 1985). The other five ancient
stromatolite samples are from a second craton, specifically from the Gamohaan formation, South
Africa. Dated at 2.52 Ga by Sumner & Bowring (1997), this formation is in the Ghaap group,
Griqualand West Basin. They were kindly provided by Dawn Summer (UC Davis). These
stromatolites were built in deep subtidal water, in a sub-wave-base environment (Sumner, 1997).
17
2.2. Principles of Mo isotope measurement
2.2.1. MC-ICP-MS
Isotopic measurement of transition metals by multiple collector plasma source mass
spectrometry (MC-ICP-MS) has only been possible late in the last century (Halliday et al., 1995).
Its principle is straightforward (Annex 1): ions of the isotopes of interest are formed when the
sample is nebulised and carried in the form of a mist into a high-temperature plasma, usually argon
gas-based. They are separated from each other as a function of mass in two steps: a) an electric
sector that filters based on kinetic energy, and b) a magnetic sector that deflects isotopes based on
their mass, where the lighter isotopes are deflected more than the heavy ones. Once the isotopes are
separated, an array of multiple collectors captures all of the isotopes simultaneously and the signal
is measured.
2.2.2. Sample preparation
Mo, a transition metal, is everywhere around us (especially as a dopant in steel). That is why
all of the sample preparation for molybdenum isotope measurements should be performed in a clean
room with a particulate attention of metal contamination. The sample needs to be in solution to be
analysed. Rock samples are first powdered and then the powder is digested to extract the element
under investigation. The goal of this research was to study authigenic molybdenum in carbonates
and examine its isotopic signature. Accordingly, the digestion would ideally be delicate, e.g. as part
of a leaching procedure (e.g., in 5% acetic acid). However, Voegelin et al. (2009) showed that
seawater Mo isotope signatures are retrieved from carbonate even with a “pseudo-total” 6N HCl
attack.
The final solution to be passed through the spectrometer should be concentrated and purified
to eliminate potential interferences and remove potential matrix effects. Column chromatography is
a robust way to achieve this goal. Its principle is based on the solubilisation of mobile phases and
the retention of stationary phases as a function of their affinity to an exchange resin. Such resins are
generally composed of polymer beads with functional groups grafted to them. These groups should
retain or release ions as a function of solution chemistry. If the mobile ion is positive, the resin
undergoes a “cation exchange”, and if the mobile ion is negative, the resin undergoes an “anion
exchange”, which has a positive functional groups positive to attract negative mobile ions. With
elution, charged elements in the resin are separated due to different migration speeds.

18
2.2.3. The isotope double spike method
An isotope double spike method was used to correct for isotopic fractionation induced during
the sample preparation and MC-ICP-MS analysis (Rudge et al., 2009; Siebert et al., 2001). It
consists of an addition to the sample of two purified isotopes of the element interest at roughly the
same concentration as the natural isotopes in the sample. Both spiked isotopes should have
relatively little natural abundance and be free of isobaric interference (other potential signals of the
same mass). In the case of Mo, 97Mo and 100Mo have been used, which have relative natural
abundances of 9.55% and 9.63%, respectively. 97Mo has no major isobaric interferences, while 100Mo
may be interfered by 100Ru. This interference can easily be accounted for through correction using
measurement of 99Ru measurement. Contrary to unspiked methods, the double spike method can
offer superior precision and controls for any potential fractionation that might occur during sample
preparation.
Using the double spike method, δ98/95Mo values must be iteratively calculated from
measurements of the mixture (Siebert et al., 2001, Rudge 2009). Two different methods have been
suggested in the literature: a matrix solution as detailed by Rudge et al. (2009) and a geometrical
calculation as detailed by Siebert et al. (2001). These calculations yield multiple isotope ratios (in
this case, 100Mo/98Mo, 97Mo/98Mo, and 95Mo/98Mo) of the samples and standards, and permit the
determination, to a high precision, of instrumental and natural sample fractionation. Finally, δ98/95Mo
is expressed according to the following equation:
δ! Mo!!"/!" = !
Mo!!"
Mo!!" !"#$%&Mo!!"
Mo!!" !"#$%#&%
− 1 !×!1000!!‰
For international comparability, the standard used should be accepted by the wider research
community, for a δ98/95Mo standard value of 0 across all studies. In the case of δ98/95Mo, the standard
usually used is NIST SRM 3134 (Goldberg et al., 2013; Greber et al., 2012). Nevertheless, a
homemade (internal) standard may be used for measurements, as long as calculations to correct for
deviations from the international standard are also made.
2.3. Methods of this study
All experiments were conducted in the PSO class 1000 clean labs at IFREMER, Brest,
France. To determined the most effective method for sample dissolution, preliminary tests were

19
made on large quantities of 0.64 Ga carbonates from Brazil (courtesy of Pierre Sans Jofre): 1) a
weak leach attack and 2) a (“pseudo-“) total attack. The weak leach was completed using 5% acetic
acid, similar to the protocol used by Rongemaille et al. (2011). The abundance of Mo extracted
from the carbonates using this simple leaching technique was found to be too low for Mo isotope
analyses (Figure 3.1). Therefore, the total attack method was deemed more appropriated (Voegelin
et al., 2009). This method uses 6N HCl and a few drops of H2O2 to dissolve the carbonate and keep
Mo in its highly soluble Mo6+ oxidation state. The samples were then placed on a hot plate at 80°C
for 24 h in order to aid dissolution (Voegelin et al., 2009).
!Figure. 3.1:.Measurement. of.Mo. concentration. by. double. spike. isotope. dilution. using. the.MC:ICP:MS.Neptune. on.
different. carbonate. samples. (CRS)..Red. columns:.measurement.after.a. total.attack.with.6N.HCl.according. to. the.
protocol. of. Voegelin. et. al.. (2009).. Blue. columns:. measurement. after. a. weak. leach. by. 5%. acetic. acid. according.
Rongemaille.et.al..(2011)..
Once the total attack was completed, samples were centrifuged (4000 rpm, 6 min) in order to
isolate the liquid phase (residues were stored for future analyses). 200 μL of the total volume was
diluted in 8mL of 2% HNO3 doped with 2 ppb Indium for preliminary analysis of Mo
concentrations by the HR-ICP-MS Element 2 (PSO-Brest). Natural 97Mo concentrations (with no
isobaric interferences) were measured at high and medium resolution. These measurements were
drift-corrected using the 2 ppb Indium present in all solutions (samples standards, and rinses), and
concentrations were defined by the relation between detector counts and known concentrations of
in-house certified solutions prepared at different concentrations.
Once preliminary analyses determined approximate Mo concentrations, samples were double spiked
at the same concentration using a 97Mo+100Mo double spike (DS) in order to achieve a DS/natural Mo
concentration ratio of 1. Spiked samples were then passed through two chromatographic columns.
The first contained 1 ml of anion exchange resin (AG1-X8) and the second contained 1 ml of cation
0"
2"
4"
6"
8"
10"
12"
14"
16"
CRS01" CRS03" CRS13" CRS23" CRS32" CRS35"
Total&M
o&(ng)&
Ace/c&acid&leach&and&6N&HCl&diges/on&
5%"ace1c"acid"leach"
6N"HCl"+"H2O2"diges1on"

20
exchange resin (AG50W-X8). Samples were purified according to the protocol of Asael et al.
(2013) as detailed in Annex 2. To validate the Mo elution procedure, Mo from different certified
standards were isolated by column chromatography and concentrations at each column step were
evaluated using HR-ICP-MS Element 2 for Mo and using ICP-AES for major elements. Three
different samples were used for column calibration: SDO-1 (a Devonian shale from Ohio), Mo
SPEX at 1 ppm (in-house standard), and a mixture of SPEX+CAMIL32, a Neoproterozoïc
carbonate from Brazil doped with Mo to investigate the influence of the carbonate matrix on the
chromatographic procedures. Mo elution profiles for each standard are shown in Figure 3.3, and
confirm good recovery of Mo from both columns.
Figure. 3.2:. Elution. of. molybdenum. from. SDO:1,. SPEX,. and. SPEX:CAMIL32. column. tests.. Measurements. were.
performed.by.HR:ICP:MS.(see.Annex.2).!
The first column (anion exchange) was relatively effective with Mo yields between 64% and
93%, and the second one was better with yields between 97% and 107% (Figure 3.4). Instrumental
errors were estimated at 3.43% (2 RSD). Note that the poor yield in both cases was from the SPEX
standard, a solution without rock matrix.
sample 1ml(HCl(6Nmatrix 1 HCl(6N
2 (2X3ml)Mo 1 HNO3(2N
2 (3X3ml)3
0(
10(
20(
30(
40(
50(
60(
70(
80(
90(
100(
sample( matrix(1( matrix(2( Mo(1( Mo(2( Mo(3(
abon
dance((%
)(
Elu/on(de(la(colonne(A((
CAMIL(
SPEX(
SDOF1(
sample 1ml(HCl(0.24NMo 1 HCl(0.24N
2 (3X3ml)3
Fe 1 HCl(6N2 (2X3ml)
0(10(20(30(40(50(60(70(80(90(100(
sample( Mo(1( Mo(2( Mo(3( Fe(1( Fe(2(
abon
dance((%
)(
Elu/on(de(la(colonne(B((
CAMIL(
SPEX(
SDOD1(

21
Figure.3.3:..Mo.yields.through.both.chromatographic.columns.used.to.concentrate.and.purify.molybdenum..
Regarding major element elution profiles analyzed by ICP-AES, only the iron comes out in
the same fraction as the Mo in the first column, and is effectively separated during the second
column step (Figure 3.5). Thus the double column procedure effectively separates molybdenum
from carbonate matrices. Mo yields are not perfect, but the double-spike method inherently corrects
for any potential isotope fractionation that may occur on the columns.
!Figure.3.4:.Elution.of.major.elements.in.the.SDO:1.and.Camil.elution.tests..Measurements.were.performed.by.ICP:
AES.!
2.4. Mo isotopic measurements
After samples were passed through both columns, they were diluted with 2% HNO3 for
Abondance) Colonne)A Colonne)B 2σ
CAMIL 90)% 97)% 3.43
SPEX 64)% 107)% 3.43
SDOA1 93)% 107)% 3.43
!100$
100$
300$
500$
700$
900$
1100$
1300$
1500$
sample$ matrix$1$ matrix$2$ Mo$1$ Mo$2$ Mo$3$ sample$ Mo$1$ Mo$2$ Mo$3$ Fe$1$ Fe$2$
ug$
Major&element&elu-on&of&CAMIL&
Al$
Ca$
Co$
Fe$
Mg$
Mn$
P$
Ti$
0"
100"
200"
300"
400"
500"
600"
700"
sample" matrix"1" matrix"2" Mo"1" Mo"2" Mo"3" sample" Mo"1" Mo"2" Mo"3" Fe"1" Fe"2"
ug"
Major&element&elu-on&of&SDO21&
Al"
Co"
Fe"
Ti"

22
analysis on the MC-ICP-MS Neptune (IFREMER; Annex 1). A desolvating nebuliser with
temperature-controlled spray chamber (APEX–Q) was used for all measurements. Instrument
tuning was performed with 100 ppb SPEX-DS solutions. First, samples were analyzed to determine
their Mo concentrations after column separation. Samples were then diluted to a final Mo
concentration of 100 ppb, consistent with the concentration of the standard (100 ppb SPEX-DS).
Finally, every sample was analysed with 30–50 acquisitions on Mo masses 92, 94, 95, 96, 97, 98,
and 100.
The data points were subsequently broken into blocks of five, and the mean of all blocks was
determined. Blocks were considered as outliers if they differed by two standard deviations or more
from the mean. All signals were blank-subtracted. The final DS/Nat ratio was determined by double
spike calculation and only samples with DS/Nat ratios under 15 were considered further, although
isotope ratios appeared unaffected at high DS/Nat ratios (Annex3). Iterative double spike
calculations were performed according to the geometric system of Seibert (2001) using the isotope
ratios 95/98Mo, 97/98Mo and 100/98Mo (Siebert et al., 2001). δ98/95Mo is the determined in delta
notation by the equation:
Repeated SPEX measurements should be stable (Figure 3.4) and their daily averages were
used to in the final calculation of δ98Mo values. Repeated method blanks had Mo concentrations
between 0.5ng and 2.58 ng of Mo. To be universally comparable, results were transformed from
SPEX to SRM standardizations. According to Asael et al., (2013), the in-house SPEX standard is
indistinguishable within error from the Roch-Mo2 standard:
δ98/95MoSPEX= δ98/95Mo Roch-Mo2-0.05±0.06 ‰
No correction was made in this first step, but all results were then reported relative to
SRM3134 as per (Goldberg et al., 2013):
δ98/95MoSRM 3134=δ98/95MoRoch-Mo2+ 0.34±0.05 ‰

23
3. Results
Considering the potential for isobaric interference (e.g.,98Mo by 98Ru), a plot δ95/98Mo vs δ97/98Mo
(after double spike calculation) had to be checked in order to verify interference-free measurements
of all isotopes (e.g., as per Rouxel et al. (2006)). All data yield a straight line, indicating strictly
mass-dependant fractionation and interference-free measurement of molybdenum isotopes (Figure
4.1).
.
Figure.4.1:.Correlation.between.δ95/98Mo.and.δ97/.98Mo.with.a.slope.equal.to.the.relative.mass.differences.of.
97Mo/98Mo.(1).and.95Mo/98Mo.(3).support.an.isobaric.interference:free.measurement.of.all.these.isotopes.
No correlation was observed between δ98Mo and the DS/Nat ratio, suggesting reliable δ98Mo
measurement at DS/Nat<15 (Annex 3a). Moreover, no correlation exists for most samples between
δ98Mo and the Mo concentration (Annex 3b), implying a lack of detrital contamination. If detrital
contamination were prevalent, higher Mo concentrations would be accompanied increased detrital
Mo that would push δ98Mo towards the crustal isotope composition of 0.
Mo concentration and isotopic composition data for modern and ancient stromatolites are
listed in Table 1.
y"="0.3297x"R²"="1"
.1"
0"
1"
2"
3"
4"
5"
6"
.4" .2" 0" 2" 4" 6" 8" 10" 12" 14" 16"

24
.
.
.
..
.
Table.1:.Results.of.Mo.isotopic.analyses.of.modern.and.ancient.stromatolites..δ98MoSRM3134.values.were.obtained.
by.the.addition.of.0.34‰.to.the.RochMo2–normalized.values,.as.per.Goldberg.et.al..(2013)...
Descrip
tion
Age-(Ga)
Nam
eNature
Concen
tration-(ppb
)DS
/Nat
δ98/9
5 Mo S
PEX
2σδ98
/95 M
o SR
M 3
134
2σ
Bacalar,-Mexico
0Sed-Ba
calar-2
011
Stromatolite
6.15
6.29
1.21
±0.15
1.55
±0.15
110326/2-Top
Stromatolite
7.73
11.75
0.80
±0.15
1.14
±0.15
core1L21
Stromatolite
13.88
11.88
0.46
±0.08
0.80
±0.08
110326/2-M
iddle-A
Stromatolite
12.31
11.90
0.26
±0.11
0.60
±0.11
core1L27
Stromatolite
8.55
12.71
0.45
±0.07
0.79
±0.07
core1L29
Stromatolite
12.09
12.99
0.46
±0.11
0.80
±0.11
mean
10.12
0.61
±0.11
0.95
±0.11
Gamoh
aan,-Sou
th-Africa
2.52
KU9D
S01A
bis
Stromatolite
35.50
2.31
L0.25
±0.14
0.09
±0.14
KU100D
S01A
Stromatolite
51.30
2.64
L0.24
±0.12
0.10
±0.12
KU100D
S01B
Stromatolite
50.92
3.10
L0.10
±0.07
0.24
±0.07
ALILD
SL82D
Stromatolite
45.42
3.75
0.24
±0.07
0.58
±0.07
KU9D
S01A
Stromatolite
40.18
3.88
L0.09
±0.10
0.25
±0.10
KU9D
S01B
Stromatolite
25.08
6.98
0.52
±0.14
0.86
±0.14
mean
41.40
0.01
±0.11
0.35
±0.11
Steep-Ro
ck,-Canada
2.8
PL1
Microbialite
54.27
2.21
1.06
±0.14
1.40
±0.14
PL9
Microbialite
24.62
5.06
1.01
±0.23
1.35
±0.23
PL10
Stromatolite
32.72
3.78
0.82
±0.18
1.16
±0.18
PL7
Stromatolite
64.02
3.80
1.06
±0.11
1.40
±0.11
mean
40.35
0.75
±0.16
1.33
±0.16
Red-Lake,-Canada
2.96
PL33
Stromatolite
20.45
2.15
L0.91
±0.08
10.57
±0.08
PL35
Stromatolite
37.61
3.22
0.71
±0.16
1.05
±0.16
PL34
Stromatolite
14.06
7.26
0.38
±0.21
0.72
±0.21
mean
34.87
0.47
±0.15
0.40
±0.15
25
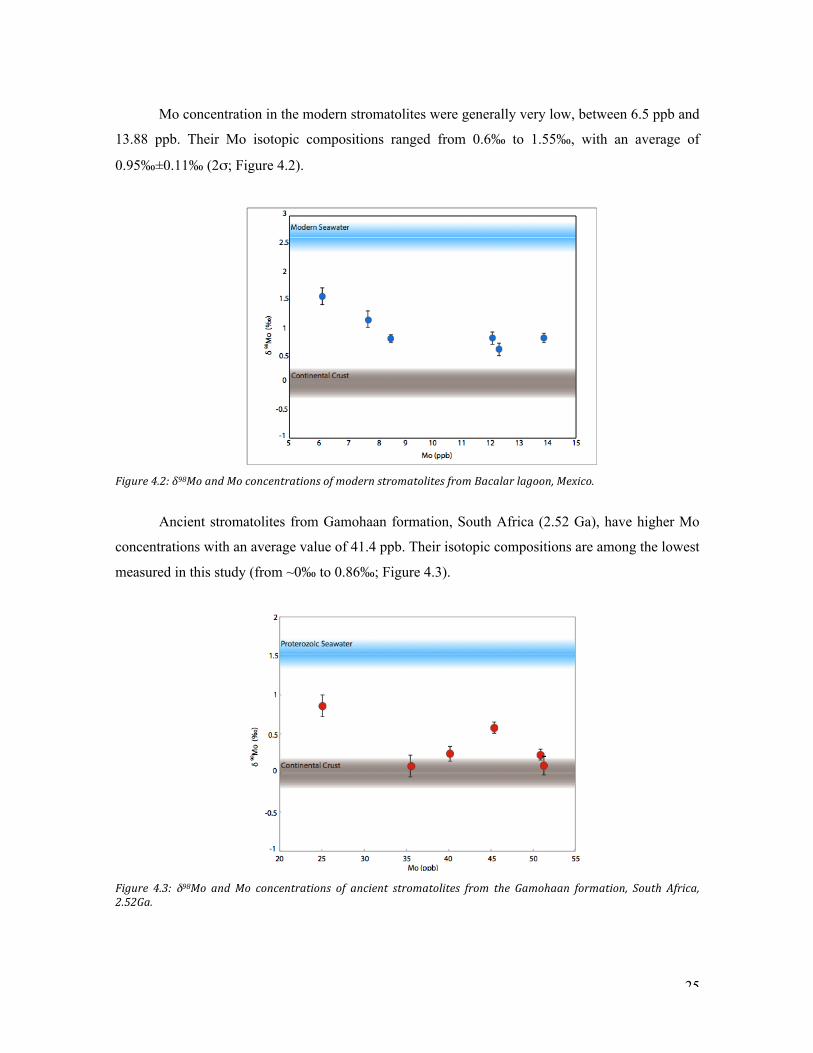
Mo concentration in the modern stromatolites were generally very low, between 6.5 ppb and
13.88 ppb. Their Mo isotopic compositions ranged from 0.6‰ to 1.55‰, with an average of
0.95‰±0.11‰ (2σ; Figure 4.2).
Figure.4.2:.δ98Mo.and.Mo.concentrations.of.modern.stromatolites.from.Bacalar.lagoon,.Mexico..
Ancient stromatolites from Gamohaan formation, South Africa (2.52 Ga), have higher Mo
concentrations with an average value of 41.4 ppb. Their isotopic compositions are among the lowest
measured in this study (from ~0‰ to 0.86‰; Figure 4.3).
Figure. 4.3:. δ98Mo. and. Mo. concentrations. of. ancient. stromatolites. from. the. Gamohaan. formation,. South. Africa,.2.52Ga..

26
The 2.8 Ga stromatolite samples from Steep Rock, Ontario, contained the highest Mo
concentrations of the sample set, yielding Mo concentrations between 32.72 ppb and 64.02 ppb
(Figure 4.4). Moreover, with isotopic compositions from 1.16‰ to 1.4‰, they are the isotopically
heaviest samples of the ancient stromatolites examined in this study. The measured microbialites
from Steep Rock show a similar isotopic composition of Mo (1.35‰ and 1.4‰).
Figure.4.4:.δ98Mo.and.Mo.concentrations.of.ancient.stromatolites.from.Steep.Rock,.Canada,.2.8Ga...
Finally, the 2.96 Ga stromatolites from Red Lake, Ontario, have the lowest Mo
concentrations of ancient stromatolites, with an average of 34.87 ppb (Figure 4.5). Their isotopic
compositions show a large variation, from -0.57‰ and 1.05‰. With the exception of sample P-33,
( δ98Mo = -0.57 ± 0.08‰, 2σ), the samples have a positive δ98Mo signature (Figure 4.5).
Figure.4.5:.δ98Mo.and.Mo.concentrations.of.ancient.stromatolites.from.Red.Lake,.Canada,.2.96Ga..

27
All of modern and ancient stromatolites have δ98Mo values below the contemporary Mo
isotopic composition of seawater (Figure 4.2 to 4.5). Except for P-33, with a light δ98Mo
composition of -0.57‰ ± 0.08‰ (2σ), all of the sample examined carry a positive δ98Mo signature
(Figure 4.6).

28
Figure.4.6:.δ98/95Mo.values.of.modern.and.ancient.stromatolites.examined.in.this.study..
. .

29
4. Discussion
4.1. Modern stromatolites
Voegelin et al. (2009) reported that the global ocean Mo isotope composition is preserved in
non-skeletal carbonates forming from seawater. Bacalar stromatolites, a non-skeletal sample grown
in freshwater, present isotopic compositions similar to the modern Mo isotope river array (Figure
5.1; Archer and Vance, 2008). Similar to hydrothermal Mo signature too, they are not springs inside
the lagoon; consequently, no relation could be effected between Mo isotopic signature of Bacalar
stromatolites and of hydrothermal water. This new example of carbonates from a freshwater lagoon
supports the idea that Mo isotope signatures of carbonates, and consequently stromatolites, are
unfractionated from their formation waters, and should serve as a good proxy for determining the
Mo isotope signature of the water from which they grew, as well as for understanding ancient
oxygen production and paleoredox.
Figure. 5.1:. Mo. isotopic. compositions. of. Bacalar. modern. stromatolites. from. this. study. (blue. points). appear. to.
overlap.with.the.modern.river.array.(grey.area;.Archer.and.Vance,.2008)..However,.a.mixing.model.based.on.the.
composition.of.continental.crust.(δ98Mo=0‰,.Siebert.et.al..(2003).and.Mo=1100ppb;.Rudnick.and.Gao.(2003)).and.
the.isotopically.heaviest.stromatolite.in.this.area.(δ98Mo.=1.55‰.and.Mo=6.15ppb).suggests.a.detrital.dependence..

30
There appears to be a relationship between δ98Mo and 1/[Mo], similar to the “the river water
array” (Archer and Vance, 2008), where lower concentrations of molybdenum yield heavier
isotopic compositions (Figure 5.1). For the river array, Archer and Vance (2008), proposed two
solutions to explain this correlation. The first one considered the role of detrital contributions,
whereby the higher concentrations of molybdenum could be induced by increased detrital Mo input
and, consequently, result in decreased riverine δ98Mo. The second theory involved the retention of
lighter Mo isotopes during transport after sulphide weathering, thereby producing heavy residual
waters. To examine for the Bacalar stromatolite data in light of these scenarios, a mixing model was
developed between the most Mo-poor Bacalar stromatolite of this study and the continental crust,
assuming a crustal Mo concentration of 1100 ppb (Rudnick and Gao, 2003). Even if Bacalar
stromatolites fortuitiously plot along modern « the river array », the mixing model reveals a likely
dilution of the Mo isotope signal by detrital contamination (Figure 5.1). Moreover, Siebert et al.
(2015) shown that the second argument is poorly supported at present and appears dependent of
many environmental effects (e.g., climate, organic matter, degree of weathering) that can cause to
either light or heavy isotopes of Mo to be retained during weathering. The Bacalar stromatolites
nonetheless record fractionated Mo from their environment, and the mixing calculation shows that
one can define a “minimum” molybdenum isotopic composition of the formation waters based on
the molybdenum isotope composition of the least-contaminated stromatolite grown in this water
body.
4.2. 2.52 Ga stromatolites, Gamohaan formation, South Africa
These stromatolites grew in a subtidal environment (Sumner, 1997) and represent the lightest
collection of Mo isotopic compositions measured in this study. Their Mo isotopic compositions
range from 0.09% to 0.86‰, suggesting a closer association with the continental crust Mo isotopic
signature (Figure 5.2). Their relatively unfractionated Mo isotope compositions indicates little free
oxygen and thus molybdate (MoO42-) production at this time. Bekker et al. (2004) reported an
intense sulfur MIF (mass independent fractionation) signal in diagenetic pyrite from the Gamohaan
formation, and also reported detrital pyrite and uraninite nearby in the basin. All of these arguments
support an anoxic Earth surface environment at this time. Moreover, a negative Ce anomaly in BIF
just overlying the Gamohaan formation, and a δ34S value near ≈0‰ for diagenetic pyrite (indicating
a small sulfate reservoir) in the Gamohaan formation support generally anoxic conditions.
Similarily, Kamber and Webb (2001) reported the absence of Ce anomalies in the Gamohaan
stromatolites. Voegelin et al. (2010) measured the δ98Mo of some Gamohaan carbonates and found

31
indications of a temporary oxic episode between two generally anoxic periods during Gamohaan
deposition (Figure 5.2).
4.3. 2.8 Ga stromatolites, Steep Rock, Canada
Contrary to the case of the 2.52 Ga Gamohaan stromatolites, the 2.8 Ga Steep rock samples
have a significantly heavier Mo isotopic composition (Figure 5.2). The difference between the Mo
signature of the 2.8 Ga stromatolites and the Mo signature of the crust implies significant
fractionation of molybdenum in the form of molybdate, a clear indicator of the presence of oxygen
in the environment. Different publications have suggested possible whiffs of oxygen before the
GOE at 2.5Ga (Anbar et al., 2007; Lyons et al., 2014), and this 2.8 Ga environment could be one of
them.
4.4. 2.96 Ga stromatolites, Red Lake, Canada
Although all of the 2.96 Ga Red Lake stromatolite samples recorded fractionation of
molybdenum, these sample have the largest range of Mo isotopic compositions, spanning positive
to negative (from -0.57‰ to 1.05‰; Figure 5.2). The fact that there is fractionation (positive or
negative) indicates the presence of free oxygen at some point in the environment. Moreover, sample
P-33 shows a light value close to those of modern Mn-crusts. Such a light isotopic composition is
best explained by the presence of manganese oxides in the environment, perhaps in the
stromatolites themselves. Planavsky et al. (2014b) observed a similar, isotopically light signature of
oxygen signature in 2.95 Ga BIF from the Pongola formation, also part of the South Africa craton
(Figure 5.2). The isotopic composition of the 2.96 Ga carbonates in this study and the 2.96 Ga BIF
studied by (Planavsky et al. (2014b) express the entire range of Mo isotopic signatures expected for
an oxygenated environment. The BIF samples represent the lightest end-member Mo sink, while the
carbonates appear to be capturing the Mo isotopic signature of residual seawater.

32
Figure.5.2:.Selected.Mo.isotopic.data.throughout.geological.time..Mo.isotopic.compositions.of.the.different.types.of.
rocks.are.from.this.study.and.as.well.as.others.(see.legend)..These.results.suggest.a.new.emerging.picture.of.redox.
evolution. though. geological. time,. with. consistent. Mo. isotope. evidence. for. at. least. transient. oxygen. in. the.
environment. at. 2.96. Ga. and. 2.8. Ga.. For. comparison,. data. for. modern. carbonates. and. seawater. are. shown. to.
present.to.represent.the.modern.oxygenated.environment.!
4.5. Evidence for oxygen and oxygenic photosynthesis before the GOE
After the rejection of biomarkers and stromatolite morphologies as proxies for the Precambrian
emergence of oxygenic photosynthesis (e.g., Rasmussen et al., 2008), elemental and isotopic
proxies have become the most promising tools for constraining the beginning of the oxygenic
photosynthesis on Earth.
Planavsky et al. (2014b) found evidence for this type of photosynthesis at 2.95 Ga using the
light Mo isotopic composition of Mn-rich BIF. My data provide compelling evidence, using a
different lithology and isotope signal (heavy vs. light), that oxygenic photosynthesis developed by
2.96 Ga. It would be interesting to investigate older stromatolites to try to find the limit between the
period characterized by only anoxygenic photosynthesis (little or no Mo isotope fractionation
3
0.5
1
1.5
2
2.5
0
-1
-0.5
2.5 2.60 32.92.82.72.4
δ98M
o (‰
)
Time (Ga)
Stromatolites from this study: Modern, Bacalar, Mexico: 2.52 Ga, Gamohaan, Ghaap Group, South Africa: 2.8 Ga, Steep Rock, Canada: 2.96 Ga, Red Lake, Canada
Crystal fans from this study
: 2.96 Ga, Red Lake, Canada: 2.8 Ga, Steep Rock, Canada
All published carbonate data : Modern, Voegelin et al., 2009: 2.52 Ga, Ghaap group, South Africa Voegelin et al. 2010
Published data for relevant units,
: 2.52 Ga black shales, Ghaap group, South Africa, Wille et al., 2007: 2.95 Ga BIF, Pongola supergroup, South Africa, Planavsky et al., 2014
non-carbonate lithologies

33
expected), and the beginning of oxygenic photosynthesis. It is important to note that anoxygenic
photosynthesis has continued to exist throughout geological time, and is still important in selected
environments (e.g., the Black Sea, certain hot springs; Repeta et al., 1989; Kulp et al., 2008). It
might be tempting to use the more crustal Mo isotopic signature of stromatolites grown in anoxia
environments, such as the 2.52 Ga stromatolites analysed in this study, to argue for the ancient
occurrence of anoxygenic photosynthesis. However, I consider this unlikely for the 2.52 Ga
stromatolites; rather, it appears that the kind of photosynthesis used by bacteria to build these
stromatolites cannot be clearly defined using Mo isotopic data alone. Further analyses of iron (and
perhaps sulphur) isotopes might help resolve exact photosynthetic pathways that built ancient
stromatolites, and will begin soon on the same samples analyzed in this study.
While not discussed above, preliminary Mo isotopic measurements were made on crystal fans
from the 2.8 Ga (Steep Rock) and 2.96 Ga (Red Lake) deposits. Contrary to the stromatolites, they
originally consisted of aragonite crystals formed in shallow water without biological intervention
(Pruss et al., 2008). Their Mo isotopic compositions are similar to their co-eval stromatolites
(Figure 5.2), suggesting that stromatolites don’t record any Mo isotope “vital effects”. Other abiotic
carbonate sediments (already in hand) will be explored by Mo isotopic analyses to understand the
relation between molybdenum isotopic signatures and carbonate precipitation in the Archean.
Finally, multiples studies have shown evidence for “whiffs” of oxygen before the GOE (Anbar et
al., 2007, Crowe et al., 2013; Planavsky et al., 2014b). This MSc project provides evidence for
oxygenated periods at 2.96 Ga and 2.8 Ga (Ontario, Canada), consistent with Mo isotope evidence
for oxygen by 2.95 Ga in the Pongola supergroup, South Africa (Planavsky et al., 2014b). This
discovery could be taken to reflect either local and transient oases of oxygen, or alternatively, a
period of mild constant oxygenation on Earth before the GOE. To better distinguish these scenarios,
more molybdenum isotopic measurements and redox proxy analyses will need to be performed on
Archean sediments that appear to be highly sensitive recorders of Earth’s oxygenation
(stromatolites, BIF).

34
Conclusion
Multiple studies have demonstrated the promise of sedimentary molybdenum concentrations
and isotopic compositions as a sensitive redox proxy for determining paleo-oxygen levels. Modern
stromatolites examined in this study appear to record Mo isotopic compositions that reflect the the
water from which they grew. Preliminary Mo isotopic measurements on seawater carbonates
(Voegelin et al., 2009) have demonstrated the same connection between Mo isotopic signatures of
sedimentary carbonates and seawater. Thus, the Mo isotopic composition of carbonates appears to
be an excellent proxy for the reconstruction of the past seawater Mo isotopic signatures, and
consequently, redox in ancient marine environment. Moreover, contrary to the light isotope sink
represented by Mn-crusts and BIF, carbonates record the residual heavy Mo isotope composition of
seawater. The high abundance of carbonate on Earth and their independence of partial absorption of
Mo make them an excellent tool for studying the Archean redox environment and for understanding
the progressive oxygenation of Earth’s surface environment.
This study strongly suggests that oxygenic photosynthesis could have existed since 2.96 Ga.
The apparent similarity between co-eval stromatolites and crystal fans indicates minimal biological
influence on Mo isotopic signatures during stromatolitic carbonate precipitation.
Various studies have suggested whiffs of oxygen at different times before the GOE, most notably in
the 2.5 Ga Hamersley basin, Australia (Anbar et al., 2007), and in the 2.95 Ga Pongola formation
(South Africa; Crowe et al., 2013; Planavsky et al., 2014b). In this study, 2.8 Ga and 2.96 Ga
stromatolites from Canada appear to also indicate oxygen in the environment around this time. This
could also be interpreted as representing pre-GOE oxygen oases, or alternatively, a long-lived
period of mild oxygenation on the early Earth. Distinguishing these possibilities will require further
investigation.

35
Bibliography Anbar, A.D., Duan, Y., Lyons, T.W., Arnold, G.L., Kendall, B., Creaser, R.A., Kaufman, A.J., Gordon, G.W., Scott, C.,
Garvin, J., Buick, R., 2007. A Whiff of Oxygen Before the Great Oxidation Event? Science 317, 1903–1906. doi:10.1126/science.1140325
Archer, C., Vance, D., 2008. The isotopic signature of the global riverine molybdenum flux and anoxia in the ancient oceans. Nature Geoscience 1, 597–600. doi:10.1038/ngeo282
Arnold, G.L., Anbar, A.D., Barling, J., Lyons, T.W., 2004. Molybdenum Isotope Evidence for Widespread Anoxia in Mid-Proterozoic Oceans. Science 304, 87–90. doi:10.1126/science.1091785
Asael, D., Tissot, F.L.H., Reinhard, C.T., Rouxel, O., Dauphas, N., Lyons, T.W., Ponzevera, E., Liorzou, C., Chéron, S., 2013. Coupled molybdenum, iron and uranium stable isotopes as oceanic paleoredox proxies during the Paleoproterozoic Shunga Event. Chemical Geology 362, 193–210. doi:10.1016/j.chemgeo.2013.08.003
Awramik, S.M., 1992. The oldest records of photosynthesis. Photosynthesis Research 33, 75–89. doi:10.1007/bf00039172
Barling, J., Anbar, A.D., 2004. Molybdenum isotope fractionation during adsorption by manganese oxides. Earth and Planetary Science Letters 217, 315–329. doi:10.1016/S0012-821X(03)00608-3
Barling, J., Arnold, G.L., Anbar, A.D., 2001. Natural mass-dependent variations in the isotopic composition of molybdenum. Earth and Planetary Science Letters 193, 447–457. doi:10.1016/s0012-821x(01)00514-3
Bekker, A., Holland, H.D., Wang, P.L., Rumble, D., Stein, H.J., Hannah, J.L., Coetzee, L.L., Beukes, N.J., 2004. Dating the rise of atmospheric oxygen. Nature 427, 117–120. doi:10.1038/nature02260
Buick, R., 2008. When did oxygenic photosynthesis evolve? Philosophical Transactions of the Royal Society B: Biological Sciences 363, 2731–2743. doi:10.1098/rstb.2008.0041
Buick, R., 2008. When did oxygenic photosynthesis evolve? Philosophical Transactions of the Royal Society B: Biological Sciences 363, 2731–2743. doi:10.1098/rstb.2008.0041
Chafetz, H.S., Utech, N.M., Fitzmaurice, S.P., 1991. Differences in the 18O and 13C signatures of seasonal laminae comprising travertine stromatolites. SEPM Journal of Sedimentary Research Vol. 61. doi:10.1306/d426782a-2b26-11d7-8648000102c1865d
Collier, R.W., 1985. Molybdenum in the Northeast Pacific Ocean. Limnology and Oceanography 30, 1351–1354. doi:10.4319/lo.1985.30.6.1351
Crowe, S.A., Døssing, L.N., Beukes, N.J., Bau, M., Kruger, S.J., Frei, R., Canfield, D.E., 2013. Atmospheric oxygenation three billion years ago. Nature 501, 535–538. doi:10.1038/nature12426
DesMarais, D.J., 2000. When Did Photosynthesis Emerge on Earth? Science 289, 1703–1705. Emerson, S.R., Huested, S.S., 1991. Ocean anoxia and the concentrations of molybdenum and vanadium in seawater.
Marine Chemistry 34, 177–196. doi:10.1016/0304-4203(91)90002-e Farquhar, J., Bao, H., Thiemens, M., 2000. Atmospheric Influence of Earth's Earliest Sulfur Cycle. Science 289, 756–
758. doi:10.1126/science.289.5480.756 Gischler, E., Gibson, M.A., Oschmann, W., 2008. Giant Holocene Freshwater Microbialites, Laguna Bacalar, Quintana
Roo, Mexico. Sedimentology 55, 1293–1309. doi:10.1111/j.1365-3091.2007.00946.x Goldberg, E.D., 1954. Marine Geochemistry 1. Chemical Scavengers of the Sea. The Journal of Geology 62, 249–265. Goldberg, T., Gordon, G., Izon, G., Archer, C., Pearce, C.R., McManus, J., Anbar, A.D., Rehkämper, M., 2013.
Resolution of inter-laboratory discrepancies in Mo isotope data: an intercalibration. Journal of Analytical Atomic Spectrometry 28, 724–12. doi:10.1039/c3ja30375f
Greber, N.D., Siebert, C., Nägler, T.F., Pettke, T., 2012. δ98/95Mo values and Molybdenum Concentration Data for NIST SRM 610, 612 and 3134: Towards a Common Protocol for Reporting Mo Data. Geostandards and Geoanalytical Research 36, 291–300. doi:10.1111/j.1751-908X.2012.00160.x
Halliday, A.N., Lee, D.-C., Christensen, J.N., Walder, A.J., Freedman, P.A., Jones, C.E., Hall, C.M., Yi, W., Teagle, D., 1995. Recent developments in inductively coupled plasma magnetic sector multiple collector mass spectrometry. International Journal of Mass Spectrometry and Ion Processes 146-147, 21–33. doi:10.1016/0168-1176(95)04200-5
Heising, S., Richter, L., Ludwig, W., Schink, B., 1999. Chlorobium ferrooxidans sp. nov., a phototrophic green sulfur bacterium that oxidizes ferrous iron in coculture with a “Geospirillum” sp. strain. Archives of Microbiology 172, 116–124. doi:10.1007/s002030050748
Helz, G.R., Miller, C.V., Charnock, J.M., Mosselmans, J.F.W., Pattrick, R.A.D., Garner, C.D., Vaughan, D.J., 1996. Mechanism of molybdenum removal from the sea and its concentration in black shales: EXAFS evidence. Geochimica et Cosmochimica Acta 60, 3631–3642. doi:10.1016/0016-7037(96)00195-0
Holland, H.D., 2006. The oxygenation of the atmosphere and oceans. Philosophical Transactions of the Royal Society B: Biological Sciences 361, 903–915. doi:10.1098/rstb.2006.1838
Kamber, B.S., Webb, G.E., 2001. The geochemistry of late Archaean microbial carbonate: implications for ocean chemistry and continental erosion history. Geochimica et Cosmochimica Acta 65, 2509–2525. doi:10.1016/s0016-7037(01)00613-5

36
Kelly, D.P., 1974. Growth and metabolism of the obligate phototroph Chlorobium thiosulfatophilum in the presence of added organic nutriemets. Archives of Microbiology, 100:163-178
Klein, C., 2005. Some Precambrian banded iron-formations (BIFs) from around the world: Their age, geologic setting, mineralogy, metamorphism, geochemistry, and origins. American Mineralogist 90, 1473–1499. doi:10.2138/am.2005.1871
Konhauser, K.O., 2007. Introduction to Geomicrobiology. Blackwell Publishing Konhauser, K.O., Hamade, T., Raiswell, R., Morris, R.C., Ferris, F.G., Southam, G., Canfield, D.E., 2002. Could
bacteria have formed the Precambrian banded iron formations? Geology 30, 1079. doi:10.1130/0091-7613(2002)030<1079:cbhftp>2.0.co;2
Konhauser, K.O., Phoenix, V.R., Bottrell, S.H., 2001. Microbial–silica interactions in Icelandic hot spring sinter: possible analogues for some Precambrian siliceous stromatolites. Sedimentology 48, 415–433. doi:10.1046/j.1365-3091.2001.00372.x
Krajewshi, K.P., VanCappellen, P., Trichet, J., Khun, O., Lucas, J., Martin-Algarra, A., Prevot, L., Tewari, V.C., Gaspar, L., Knight, R.I., Lamboy, M., 2014. Biological processes and apatite formation in sedimentary environments. Eclogea geology 771–818. doi:10.5169/seals-167475
Kulp, T.R., Hoeft, S.E., Asao, M., Madigan, M.T., Hollibaugh, J.T., Fisher, J.C., Stolz, J.F., Culbertson, C.W., Miller, L.G., Oremland, R.S., 2008. Arsenic(III) Fuels Anoxygenic Photosynthesis in Hot Spring Biofilms from Mono Lake, California. Science 321, 967–970. doi:10.1126/science.1160799
LaBuhn, S., Burrows, C., Groff, C., Neureuther, N., Schaal, S., Volk, J., Cupul, A.F., Dominguez, A.B.M., Poot, M.M., 2012. Chemistry and Preliminary Coliform Microbial Communities in Laguna Bacalar, Yucatan Peninsula, Mexico. 1–17.
Lalonde, S.V., Konhauser, K.O., 2015. Benthic perspective on Earth’s oldest evidence for oxygenic photosynthesis. Proceedings of the National Academy of Sciences 112, 995–1000. doi:10.1073/pnas.1415718112
Lyons, T.W., Reinhard, C.T., Planavsky, N.J., 2014. The rise of oxygen in Earth’s early ocean and atmosphere. Nature 506, 307–315. doi:10.1038/nature13068
McManus, J., Nägler, T.F., Siebert, C., Wheat, C.G., Hammond, D.E., 2002. Oceanic molybdenum isotope fractionation: Diagenesis and hydrothermal ridge-flank alteration. Geochemistry Geophysics Geosystems 3, 1–9. doi:10.1029/2002GC000356
Mendel, R.R., 2005. Molybdenum: biological activity and metabolism. The Royal Society of Chemistry . 3404–6. doi:10.1039/b505527j
Mojzsis, S.J., Arrhenius, G., McKeegan, K.D., Harrison, T.M., Nutman, A.P., Friend, C.R.L., 1996. Evidence for lfe on Earth before 3,800 million years ago. Nature 384, 55–59.
Morford, J.L., Emerson, S., 1999. The geochemistry of redox sensitive trace metals in sediments. Geochimica et Cosmochimica Acta 63, 1735–1750. doi:10.1016/s0016-7037(99)00126-xPentecost, A. "Blue-green algae and freshwater carbonate deposits." Proceedings of the Royal Society of London. Series B. Biological Sciences 200.1138 (1978): 43-61.
Pavlov, A.A., Kasting, J.F., 2002. Mass-Independent Fractionation of Sulfur Isotopes in Archean Sediments: Strong Evidence for an Anoxic Archean Atmosphere. Astrobiology 2, 27–41. doi:10.1089/153110702753621321
Planavsky, N.J., Asael, D., Hofmann, A., Reinhard, C.T., Lalonde, S.V., Knudsen, A., Wang, X., Ossa Ossa, F., Pecoits, E., Smith, A.J.B., Beukes, N.J., Bekker, A., Johnson, T.M., Konhauser, K.O., Lyons, T.W., Rouxel, O.J., 2014. Evidence for oxygenic photosynthesis half a billion years before the Great Oxidation Event. Nature Geoscience 7, 283–286. doi:10.1038/ngeo2122
Pruss, S.B., Corsetti, F.A., Fischer, W.W., 2008. Seafloor-precipitated carbonate fans in the Neoproterozoic Rainstorm Member, Johnnie Formation, Death Valley Region, USA. Sedimentary Geology 207, 34–40. doi:10.1016/j.sedgeo.2008.03.005
Rasmussen, B., Buick, R., 1999. Redox state of the Archean atmosphere: Evidence from detrital heavy minerals in ca. 3250–2750 Ma sandstones from the Pilbara Craton, Australia. Geology 27, 115. doi:10.1130/0091-7613(1999)027<0115:rsotaa>2.3.co;2
Rasmussen, B., Fletcher, I.R., Brocks, J.J., Kilburn, M.R., 2008. Reassessing the first appearance of eukaryotes and cyanobacteria. Nature 455, 1101–1104. doi:10.1038/nature07381
Repeta, D.J., Simpson, D.J., Jorgensen, B.B., Jannasch, H.W., 1989. Evidence for anoxygenic photosynthesis from the distribution of bacterio-chlorophylls in the Black Sea. Nature 342, 69–72. doi:10.1038/342069a0
Rongemaille, E., Bayon, G., Pierre, C., Bollinger, C., Chu, N.C., Fouquet, Y., Riboulot, V., Voisset, M., 2011. Rare earth elements in cold seep carbonates from the Niger delta. Chemical Geology 286, 196–206. doi:10.1016/j.chemgeo.2011.05.001
Rosing, M.T., Frei, R., 2004. U-rich Archaean sea-floor sediments from Greenland – indications of >3700 Ma oxygenic photosynthesis. Earth and Planetary Science Letters 217, 237–244. doi:10.1016/S0012-821X(03)00609-5
Rosing, M.T., Frei, R., 2004. U-rich Archaean sea-floor sediments from Greenland – indications of >3700 Ma oxygenic photosynthesis. Earth and Planetary Science Letters 217, 237–244. doi:10.1016/S0012-821X(03)00609-5
Rouxel, O., Galy, A., Elderfield, H., 2006. Germanium isotopic variations in igneous rocks and marine sediments. Geochimica et Cosmochimica Acta 70, 3387–3400. doi:10.1016/j.gca.2006.04.025
Rudge, J.F., Ben C Reynolds, Bourdon, B., 2009. The double spike toolbox. Chemical Geology 265, 420–431. doi:10.1016/j.chemgeo.2009.05.010

37
Rudnick, R.L., Gao, S., 2003. Composition of the continental crust. Treatise on Geochemistry 1–64. doi:10.1016/b0-08-043751-6/03016-4Scott, C., Lyons, T.W., Bekker, A., Shen, Y., Poulton, S.W., Chu, X., Anbar, A.D., 2008. Tracing the stepwise oxygenation of the Proterozoic ocean. Nature 452, 456–459. doi:10.1038/nature06811
Siebert, C., Nägler, T.F., Kramers, J.D., 2001. Determination of molybdenum isotope fractionation by double-spike multicollector inductively coupled plasma mass spectrometry. Geochemistry Geophysics Geosystems 2, n/a–n/a. doi:10.1029/2000gc000124
Siebert, G.A., Hung, D.Y., Chang, P., Robert, M.S., 2003. Ion-Trapping, Microsomal Binding, and Unbound Drug Distribution in the Hepatic Retention of Basic Drugs. Journal of Pharmacology and Experimental Therapeutics 308, 228–235. doi:10.1124/jpet.103.056770
Sumner, D.Y., Bowring, S.A., 1996. U-Pb geochronologic constraints on deposition of the Campbellrand Subgroup, Transvaal Supergroup, South Africa. Precambrian Research 79, 25–35. doi:10.1016/0301-9268(95)00086-0
Sumner, D.Y., 1997. Late Archean Calcite-Microbe Interactions: Two Morphologically Distinct Microbial Communities That Affected Calcite Nucleation Differently. PALAIOS 12, 302. doi:10.2307/3515333
Thompson, J.B., Ferris, F.G., 1990. Cyanobacterial precipitation of gypsum, calcite, and magnesite from natural alkaline lake water. Geology 18, 995. doi:10.1130/0091-7613(1990)018<0995:cpogca>2.3.co;2
Thurston, P.C., Chivers, K.M., 1990. Secular variation in greenstone sequence development emphasizing Superior Province, Canada. Precambrian Research 46, 21–58. doi:10.1016/0301-9268(90)90065-x
Voegelin, A.R., Nägler, T.F., Samankassou, E., Villa, I.M., 2009. Molybdenum isotopic composition of modern and Carboniferous carbonates. Chemical Geology 265, 488–498. doi:10.1016/j.chemgeo.2009.05.015
Voegelin, A.R., Nägler, T.F., Beukes, N.J., Lacassie, J.P., 2010. Molybdenum isotopes in late Archean carbonate rocks: Implications for early Earth oxygenation. Precambrian Research 182, 70–82. doi:10.1016/j.precamres.2010.07.001
Wacey, D., Kilburn, M.R., Saunders, M., Cliff, J., Brasier, M.D., 2011. Microfossils of sulphur-metabolizing cells in 3.4-billion-year-old rocks of Western Australia. Nature Geoscience 4, 698–702. doi:10.1038/ngeo1238
Walsh, M.W., 1992. Microfossils and possible microfossils from the early archean onverwacht group, Barberton mountain land, South Africa. Precambrian Research 54, 271–293. doi:10.1016/0301-9268(92)90074-x
Wilks, M.E., Nisbet, E.G., 1985. Archaean stromatolites from the Steep Rock Group, northwestern Ontario, Canada. Can. J. Earth Sci. 22, 792–799. doi:10.1139/e85-086

38
Annexes
Annex 1: MC-ICP-MS, Neptune
Annex 2: Protocol of purification of molybdenum by column chromatography according to Asael et al.
(2013). Annex 3: Verification of independence between:
a: δ98Mo and Double Spike/ Naturel
b : δ98Mo and [ Mo ]
)

39
Annex 1 : MC-ICP-MS, Neptune
Mul
ticol
ecto
r
Neb
ulisa
tor
Plas
ma
torc
h (a
rgon
)
Cone
sQ
uadr
ipol
Elec
tros
tatic
ana
lyse
r
Lam
inat
ed M
agne
t Zoom
lens

40
Annex 2 : Protocol of concentration of molybdenum by column chromatography according to Asael
et al. (2013).
1st$stage$of$Mo$separation/$anion$exchange$ $$ $$ $$1ml$AG$1$X8$–$200/400$mesh$ $$ $$ $$$$ $$ $$ $$wash$ H2O$ 18.2mQ$ 2Vol.$wash$ HNO3$ 3N$ 2Vol.$wash$ H2O$ 18.2mQ$ 2Vol.$conditioning$ HCl$ 6N$ 2Vol.$sample$ HCl$ 6N$ 1ml$matrix$ HCl$ 6N$ 2x3ml$Mo$ HNO3$ 2N$ 3x3ml$wash$ H2O$ 18.2mQ$ 2Vol.$wash$ HNO3$ 3N$ 2Vol.$wash$ H2O$ 18.2mQ$ 2Vol.$$$ $$ $$ $$2nd$stage$of$Mo$separation/$cation$exchange$ $$ $$ $$1ml$AG50W$X8$or$2ml$if$lot$of$iron$–$$200/400$mesh$ $$ $$ $$$$ $$ $$ $$wash$ H2O$ 18.2mQ$ 2Vol.$wash$ HCl$ 6N$ 2Vol.$wash$ H2O$ 18.2mQ$ 2Vol.$conditioning$ HCl$ 0.24N$ 2Vol.$sample$ HCl$ 0.24N$ 1ml$Mo$ HCl$ 0.24N$ 3x3ml$Fe$ HCl$ 6N$ 2x3ml$wash$ H2O$ 18.2mQ$ 2Vol.$wash$ HCl$ 6N$ 2Vol.$wash$ H2O$ 18.2mQ$ 2Vol.$$$ $$ $$ $$

41
Annex 3 : Verification of independence between :
a: δ98Mo and Double Spike / Naturel
b : δ98Mo and [ Mo ]
!1#
!1#
0#
1#
1#
2#
2#
0# 5# 10# 15# 20# 25#
Delta
&98M
o(pp
b)&
DS/Nat&
98Mo&and&DS/Nat&