the microstructure and the thermal expansion …...the microstructure and the thermal expansion...
TRANSCRIPT

The microstructure and the thermal expansion characteristics ofCu/SiCp composites
Kuen-Ming Shu *, G.C. Tu
Department of Materials Science and Engineering, National Chiao-Tung University, 1001 Ta Hsueh Road, Hsinchu 30050, Taiwan, ROC
Received 14 June 2002; received in revised form 30 September 2002
Abstract
Copper/silicon carbide composites (Cu/SiCp) were made by the powder metallurgy method. Electroless plating was employed to
deposit a copper film on SiCp powder before mixing with Cu powder in order to improve the bonding status between Cu and SiC
particles during sintering. Thermal expansion property of as-formed product was measured in the temperature range from 50 to
550 8C. The results showed that copper coating on silicon carbide particles could render uniform distribution of SiCp in the copper
matrix. The composites exhibited positive thermal hysteresis behavior when cooled down from the peak temperature to room
temperature, which can be explained in terms of the residual stresses and the interfacial bonding between copper and silicon carbide.
The magnitude of this strain was a function of the SiCp volume fraction and the number of thermal cycles. The thermal expansion
property of composites was measured and compared with those predicted from various theoretical models.
# 2002 Published by Elsevier Science B.V.
Keywords: Powder metallurgy; Electroless plating; Cu/SiCp composites; Microstructure; Coefficient of thermal expansion; Thermal hysteresis strain
1. Introduction
Metal matrix composites (MMC) are rapidly becom-
ing prime candidates as structural material in engineer-
ing application. For example, aluminum reinforced by
Al2O3 and SiO2 is used in the aerospace, aircraft and
automotive industries because of its excellent thermo-
physical properties such as low coefficient of thermal
expansion (CTE), high thermal conductivity, and im-
proved mechanical properties such as higher specific
strength, better wear resistance, and specific modulus.
Recently, metal�/ceramic composites with high ceramic
contents have become another focus for thermal man-
agement applications such as electronic packaging [1�/5].
The widespread use of these composites requires a deep
understanding of their thermal expansion and some
relative properties. For instance, the packaging materi-
als in microelectronics should have high thermal con-
ductivity to dissipate the heat, and low CTE to decreasethe thermal expansion mismatch among the devices.
Low and suitable CTE, together with good thermal
conductivity, can be achieved by blending appropriate
metallic and ceramic phases to form a composite.
Despite many theoretical and experimental studies [6�/
10] having been carried out on the subject of CTE of
particle-reinforced MMC, few of them are directed
toward the effect of particle surface coating on thethermal expansion behavior and other characteristics of
these composites. It was thus considered worthwhile to
fabricate the copper-based ceramic-reinforced compo-
sites and to study their thermal expansion character-
istics, in which the ceramic particles were pre-coated
with copper film through an electroless plating process
before mixing.
2. Experimental procedure
The reinforcements used in the present work wereangular-shaped silicone carbide particles (SiCp) with
nominal diameters of 5, 25 and 47 mm. The SiC particles
are available in hexagonal (a ) and cubic (b ) crystal
* Corresponding author. Tel.: �/86-65-632-9643; fax: �/88-65-631-
0824.
E-mail address: [email protected] (K.-M. Shu).
Materials Science and Engineering A349 (2003) 236�/247
www.elsevier.com/locate/msea
0921-5093/02/$ - see front matter # 2002 Published by Elsevier Science B.V.
PII: S 0 9 2 1 - 5 0 9 3 ( 0 2 ) 0 0 7 8 8 - 8

structures from inexpensive raw material sources. They
have low density, low CTE, high Young’s modulus, and
a commercially available particle size range of 1�/50 mm.
Electrolytic copper powder (99.7% purity) which assume
dendritic shape with average particle size of 16 mm was
used in this experiment. Table 1 shows the typical
properties of SiCp and Cu. The morphology of both
particles are shown in Fig. 1(a) and (b).
In order to obtain optimal bonding between ceramic
particles and Cu particles through a completely contin-
uous copper film on SiCp, the following electroless
plating steps were applied:
1) Surface treatment: Surface cleaning of SiCp was
accomplished by immersing in acetone under ultra-
sonic vibration for 30 min. After rinsing with de-ionized water, SiCp were heated at 600 8C for 3 h in
an air drying oven, and were subsequently ground
to break agglomerated particles.
2) Sensitizing and activating: The cleaned SiCp were
sensitized in a solution containing stannous chloride
(SnCl2 �/ 2H2O) and hydrochloric acid (HCl) for an
hour and then activated in a solution containing
palladium chloride (PdCl2) and hydrochloric acidfor an hour.
3) Electroless copper plating process: The cleaned and
activated SiCp (60 g l�1) were placed separately into
CuSO4 �/ 5H2O (20 g l�1) and KNaC4H4O6 (50 g
l�1) solutions, ultrasonically shaken, followed with
continuous stirring during mixing of the two solu-
tions. Then, HCOH (36%) solution was added to
the mixed solution. The pH of the solution wassubsequently adjusted by adding NaOH to pH 13;
at this stage, copper started to plate onto SiCp
surface.
The copper content was determined by dissolving the
plated copper film on SiCp in nitric acid, and the
measured copper film percent on SiCp was 79/0.5
wt.% in this experiment.
Copper coated SiCp was combined with adequate
copper powders to obtain the following Cu/SiCp mixes
with weight ratios of 1:1, 2:1, 3:1, 4:1 and 5:1, which
corresponding to 74, 58, 48, 41 and 35 vol.% SiCp,
respectively. Then these powders were dry mixed for 4 h
using Turbula† 3-D mixer in argon atmosphere. The
resulting powders were filled into a steel mold of 8 mm
Table 1
Typical properties of SiCp and Cu
Property Value Materials
SiCp Cu
Density g cm�3 3.20�/3.26 8.96
Young’s modulus GPa 400�/500 110
Melting temperature 8C 2600 1083
Tensile strength GPa �/3.2 0.20�/0.24
CTE 10�6 K�1 5.40 16.5
Poisson’s ratio 0.17 0.33
Shear modulus GPa 175 48.3
Thermal conductiv-
ity
W m�1 K�1 120 392
Fig. 1. The morphology of as-received powders: (a) SiCp, and (b) Cu.
K.-M. Shu, G.C. Tu / Materials Science and Engineering A349 (2003) 236�/247 237

diameter, and then a pressure of 760 MPa was applied
and maintained for 180 s to form a cylindrical green
compact. The green compact was sintered at 850 8C in
nitrogen for 8 h and then cold repressed in a steel moldof 8.1 mm diameter at a pressure of 1140 MPa for 10
min. Both end surfaces of repressed compacts were
finally polished by #2000 sandpaper for CTE test.
True densities of the composites were measured by
using the buoyancy (Archimedes’) method (ASTM
B328) and compared with theoretical densities to obtain
varying degree of densification.
The CTE at a particular temperature can be derivedusing the relationship:
CTE�@
@T
�DL
L
�(1)
where L is the length of the specimen at temperature T .
The mean linear CTE (/CTE) was calculated by theformula:
CTE�1
L0
�DL
DT
�(2)
where L0 is the original length of the specimen and DL is
the change in length over a temperature interval DT .The measurements of CTE and CTE of the specimens
were performed on a Thermal Analyst 2100 thermal
mechanical analyzer using inbuilt software, over a
temperature range from 50 to 550 8C at heating and
cooling rates of 15 8C min�1 in the atmosphere of
argon. Three specimens were tested for each condition,
and the average data were adopted for analysis. The
metallography of the product was accomplished usingan optical microscope and a scanning electron micro-
scope.
3. Results and discussion
3.1. Distribution of SiCp
The cross-section microstructure of the Cu-coated
SiCp powder is shown in Fig. 2, and this shows that the
coated copper film was homogeneous and continuous.
The results of X-ray diffraction analysis on SiCp coatedwith copper film are shown in Fig. 3, both Cu and SiC
were detected, indicating the presence of copper film on
the SiCp surface. Representative micrographs of the
fracture surface of the composite with 35 vol.% SiCp are
given in Fig. 4(a) and (b). It can be seen from Fig. 4(a)
that the non-coated SiCp in the composite appeared
angular in shape, and bad bonding existed between the
Cu matrix and the non-coated SiCp. In Fig. 4(b), thecopper film on the SiCp particle surface is still observed
on the fracture surface, and there was better bonding
status between the Cu matrix and the SiCp particles. The
fracture surfaces of both specimens exhibit plastic
behavior, the fracture is ductile showing extensive
dimple formation on the fracture surface, the major
dimples can be observed with SiC particles embedded in
them.
Optical microstructures of several Cu/SiCp compo-
sites are shown in Fig. 5(a) and (b). It can be seen from
Fig. 5(a) that the non-coated SiCp in the composite
appeared more clustering phenomena and the reinforce-
ment touching one another when the SiCp concentration
is up to 35 vol.%. While in Fig. 5(b), for Cu-coated SiCp,
particles are distributed uniformly in the Cu matrix, and
good bonding status appeared between copper and SiCp.
This status is required in order to achieve effective load
transfer from the matrix to the reinforcement.
Considering the role of phase continuity in determin-
ing the properties of the composite, three extreme cases
are shown in Fig. 6. Fig. 6(a) shows the arrangement
that individual SiCp particles are dispersed in contin-
uous Cu matrix; this model is henceforth referred as
continuous ductile phase model [11]. The Cu/SiCp
composite with 35 vol.% Cu-coated SiCp, as shown in
Fig. 5(b), belongs to this model. When SiCp concentra-
tion exceed approximately 0.5, the majority of the
Fig. 2. Cross-section microstructure of the Cu-coated SiCp composite
powders.
Fig. 3. The X-ray diffraction of Cu-coated SiCp particles.
K.-M. Shu, G.C. Tu / Materials Science and Engineering A349 (2003) 236�/247238

particles can begin to touch one another, here, a
continuous dispersion of SiCp particles encompasses
islands of ductile Cu phase. Fig. 6(b) shows the unit cell
for this continuous brittle phase model, these kind
composites are classified as ceramic matrix composite.
But, the Cu/SiCp composite with 35 vol.% non-coated
SiCp, as shown in Fig. 5(a), some Cu and SiCp are
entangled and touched each other, this kind model is
referred as interpenetrating model, as shown in Fig. 6(c).
When the composites are classified as continuous ductile
phase model, it can be imaged, owing to the difference
Fig. 4. The micrographs of the fracture surfaces: (a) non-coated
sample, 1 is decohesion of SiCp/Cu interface, 2 is SiCp cracked by
pressing or tensile test. (b) Copper coated electrode, 1 is cracked SiCp,
2 is copper coated SiCp.
Fig. 5. Optical micrographs showing the microstructure of Cu/SiCp
composites: (a) 35 vol.% 25 mm SiCp, non-coated, (b) 35 vol.% 47 mm
SiCp, Cu-coated.
Fig. 6. Schematic diagrams showing three models with different phase
configurations: (a) continuous ductile phase model [11], (b) continuous
brittle phase model [11], (c) interpenetrating model.
K.-M. Shu, G.C. Tu / Materials Science and Engineering A349 (2003) 236�/247 239

of CTE value of Cu and SiCp, the space volume
occupied by SiCp in copper matrix will expanded larger
than SiCp volume expansion when temperature in-
creases. Copper would dominate the composite CTEwhile there is no bonding force at the interface to restrict
copper expansion. On the contrary, both Cu and SiCp
would dominate the composite CTE if good bonding
exists at the interface. Under continuous brittle model
situation, the space volume occupied by copper particle
expands less than copper volume expansion; in this case,
even poor bonding exists at the Cu/SiCp interface, both
Cu and SiCp dominate the composite CTE. As in thepresent study, this brittle model is rarely occurred in
reality, due to the brittleness and the shape of reinforce-
ment particle. In the case of interpenetrating model,
copper would dominate composite CTE when no
bonding exists at the interface. However, the CTE
would be dominated by both Cu and SiCp since SiCp
restricted copper expansion in case that good bonding
exists at the interface.
3.2. Sintered density and porosity
The true densities of sintered and repressed specimens
obtained by Archimedes’ law and the theoretical values
are given in Table 2. It shows that the density of the
composite decreases as the amount of SiCp increases,
and when the particle size increases. Because of the less-
bonding status between SiCp and Cu, the composite
density of non-coated SiCp is lower than that of Cu-coated SiCp.
In the ceramic reinforced MMC system, the less-
bonding characteristic between metal and ceramic,
interfacial energy is required to enhance or induce the
bonding between metal and ceramic even in liquid phase
sintering. Composites fabricated by the coating method
do not have such a requirement and can be compacted
to higher densities. In composite with low SiCp volumefraction, less Cu/SiCp interface means less copper atom
diffusion barrier, copper atoms can diffuse readily and
fill the interstices between the SiCp, thus leading to a
higher densification of the composites.
For comparison, pure copper powder with the same
procedures to fabricate P/Med copper, was also pre-
pared and tested, and a higher than 96% of the
theoretical density was obtained.Porosity gives the fraction of the total void volume,
which can be determined by the equation [12]:
pf �1�r
r0
(3)
where pf is the pore volume fraction, r the measureddensity, and r0 the theoretical density.
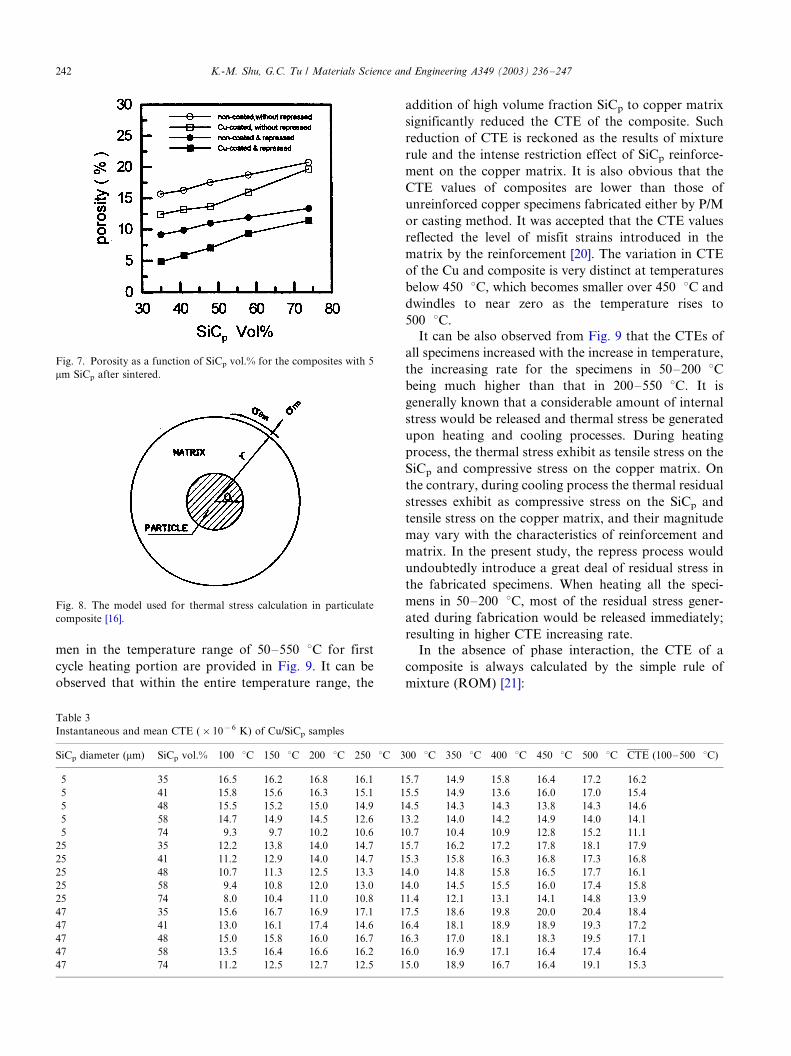
Fig. 7 shows the porosity as a function of vol.% SiCp
for various-processed composites, it apparently reveals
that the porosity of all composites increased markedly
with increasing SiCp volume fraction. For the composite
made by the coated copper method, the porosity
remained lower than that made by the non-coatedSiCp even at higher SiCp volume fraction such as 74
vol.% SiCp.
3.3. Influence of particle size on CTE of the composite
Of the possible thermal behavior characteristics, the
behavior of thermal expansion of MMCs has been one
of the most extensively studied, since it effects the
mechanical behavior of the composites in severe thermalenvironment, especially the application of composites in
engine components and space structures. The stability of
MMCs over a long period of time becomes the critical
design consideration. The stability can be described in
two aspects, geometrical changes and mechanical prop-
erty changes. In the former case the CTE of the MMC
plays a key role, while in the latter case the mismatch of
CTEs between the metal matrix and particles has adominant effect.
The currently available SiCp particles generally ex-
hibit a Young’s modulus of 450 GPa and a CTE of
about 5.40�/10�6 K�1 , while the compared values of
copper are 110 GPa and 16.5�/10�6 K�1 (20�/300 8C)
for young’s modulus and CTE, respectively, [13,14].
Therefore, it is expected that the CTE of the comp-
osite will be lowered with the addition of SiCp
volume fraction. Table 3 shows the instantaneous and
mean CTE of all specimens in this experiment
during first cycle heating stage. It can be observed
that within the entire temperature range investigated,
the CTE values increase apparently with increas-
ing SiCp size and decrease with increasing SiCp volume
fraction.
The mismatch of the CTE values between thereinforcement and the matrix causes the stress in the
matrix, as was reported by Masutti et al. [15]. The
thermal stresses arising in the matrix could possibly
exceed the yield stress of the copper matrix at a
particular temperature, thus resulting in plastic defor-
mation in the matrix. A mechanism is proposed to
determine the relationship between thermal stress and
particle size.Assuming the particle to be spherical, according to
Brooksbank et al. [16] and Vaidya et al. [17], the particle
was surrounded by a spherical shell of the matrix, as
shown in Fig. 8 .The radial and circumferential stress in
the matrix can be expressed as:
srm�p[(a3=r3) � Vp]
1 � Vp
(4)
sum�p[0:5(a3=r3) � Vp]
1 � Vp
(5)
K.-M. Shu, G.C. Tu / Materials Science and Engineering A349 (2003) 236�/247240
p�(am � ap)DT
[0:5(1 � nm) � (1 � 2nm)=Em(1 � Vp)] � [Vp(1 � 2np)=Ep]
(6)
where a is the radius of the spherical particle, r is the
distance from the center of spherical particle (r ]/a ), sr
is the radial stress, su is the circumferential stress, n is
the Poisson’s ratio, E is Young’s modulus, p is the
pressure at the interface (p �/0 during the heating stage),V is the volume fraction and the subscripts p and m
represent the particle and the matrix, respectively. The
values of interface pressure of Cu/SiCp composites at all
experimental temperature range estimated from Eq. (6)
are shown in Table 4, the SiCp particle is assumed with
spherical shape and copper CTE is temperature depen-
dent as shown in Fig. 9.
The difference between srm and sum is expressed by
s�srm�sum�p(0:5a3=r3 � 2Vp)
1 � Vp
(7)
Plastic deformation can be induced in the matrix at
the interface when s exceeds the yield stress of the
matrix [18]. In Table 5, it shows the absolute values of
sr�/su at the interface of Cu/SiCp, only at temperature
over certain values the stresses induced at interface arehigher than the copper yield stress, i.e. 60 MPa. In the
case of lower SiCp volume fraction, e.g. 35 vol.%, the
plastic deformation would not happen in the interface
matrix till 400 8C. It also demonstrates clearly that the
plastic deformation initiation temperature at interface
would decrease as SiCp volume fraction increases, e.g.
interface plastic deformation occurs at temperature as
lower as 150 8C for composite with 74 vol.% SiCp.When differentiating s with particle radius, the
following equation can be obtained:
ds
da�
1:5pa3=r3
1 � Vp
(8)
Eq. (8) demonstrates that s increases with increasing
particle size at a defined temperature [19]. Assumingsame SiCp volume fraction, larger SiCp size would, thus,
induced more stress accumulation in the matrix, and
more stress releasing would occur during heating and
cooling cycle, causing larger strain, i.e. larger CTE
value. The experimental data shown in Table 3 complies
well with the above ratiocination.
3.4. Influence of particle volume fraction and surface
coating on CTE of the composite
Comparisons of the CTE behaviors of the Cu/SiCp
composite (fabricated with copper coated 25 mm SiCp
under different volume fractions), unreinforced copper
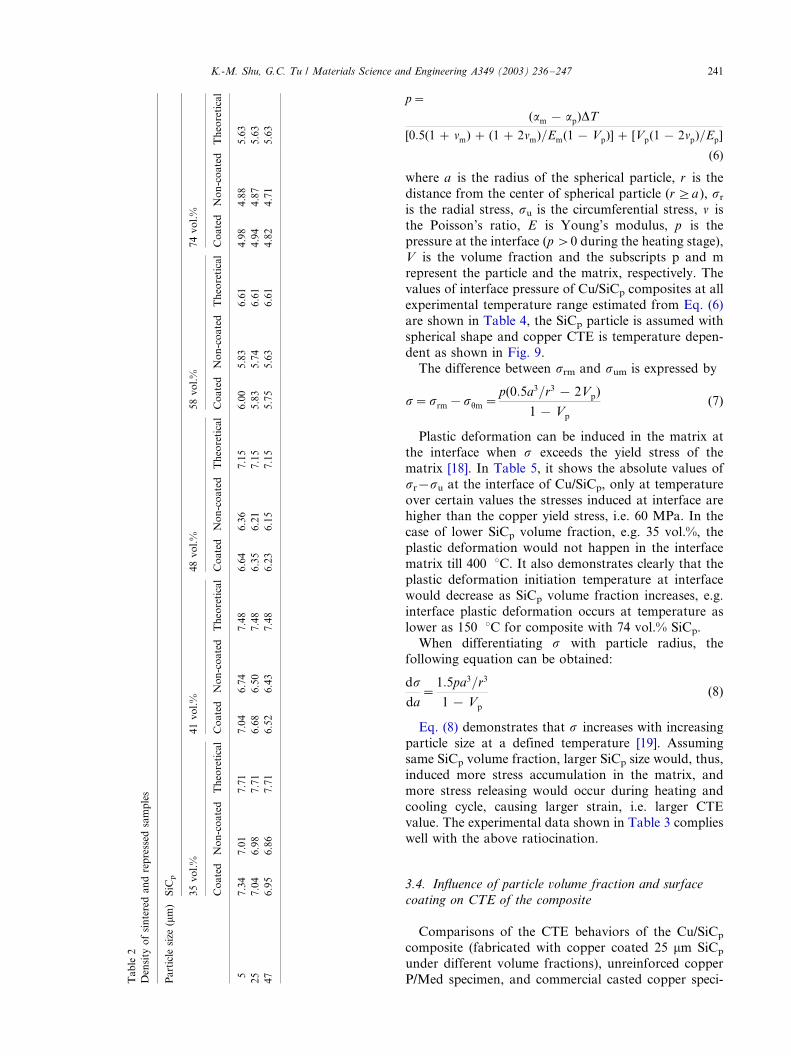
P/Med specimen, and commercial casted copper speci-Tab
le2
Den
sity
of
sin
tere
dan
dre
pre
ssed
sam
ple
s
Pa
rtic
lesi
ze(m
m)
SiC
p
35
vo
l.%
41
vo
l.%
48
vo
l.%
58
vo
l.%
74
vo
l.%
Co
ate
dN
on
-co
ate
dT
heo
reti
cal
Co
ate
dN
on
-co
ate
dT
heo
reti
cal
Co
ate
dN
on
-co
ate
dT
heo
reti
cal
Co
ate
dN
on
-co
ate
dT
heo
reti
cal
Co
ate
dN
on
-co
ate
dT
heo
reti
cal
57
.34
7.0
17
.71
7.0
46
.74
7.4
86
.64
6.3
67
.15
6.0
05
.83
6.6
14
.98
4.8
85
.63
25
7.0
46
.98
7.7
16
.68
6.5
07
.48
6.3
56
.21
7.1
55
.83
5.7
46
.61
4.9
44
.87
5.6
3
47
6.9
56
.86
7.7
16
.52
6.4
37
.48
6.2
36
.15
7.1
55
.75
5.6
36
.61
4.8
24
.71
5.6
3
K.-M. Shu, G.C. Tu / Materials Science and Engineering A349 (2003) 236�/247 241
men in the temperature range of 50�/550 8C for first
cycle heating portion are provided in Fig. 9. It can be
observed that within the entire temperature range, the
addition of high volume fraction SiCp to copper matrix
significantly reduced the CTE of the composite. Such
reduction of CTE is reckoned as the results of mixture
rule and the intense restriction effect of SiCp reinforce-
ment on the copper matrix. It is also obvious that the
CTE values of composites are lower than those of
unreinforced copper specimens fabricated either by P/M
or casting method. It was accepted that the CTE values
reflected the level of misfit strains introduced in the
matrix by the reinforcement [20]. The variation in CTE
of the Cu and composite is very distinct at temperatures
below 450 8C, which becomes smaller over 450 8C and
dwindles to near zero as the temperature rises to
500 8C.It can be also observed from Fig. 9 that the CTEs of
all specimens increased with the increase in temperature,
the increasing rate for the specimens in 50�/200 8Cbeing much higher than that in 200�/550 8C. It is
generally known that a considerable amount of internal
stress would be released and thermal stress be generated
upon heating and cooling processes. During heating
process, the thermal stress exhibit as tensile stress on the
SiCp and compressive stress on the copper matrix. On
the contrary, during cooling process the thermal residual
stresses exhibit as compressive stress on the SiCp and
tensile stress on the copper matrix, and their magnitude
may vary with the characteristics of reinforcement and
matrix. In the present study, the repress process would
undoubtedly introduce a great deal of residual stress in
the fabricated specimens. When heating all the speci-
mens in 50�/200 8C, most of the residual stress gener-
ated during fabrication would be released immediately;
resulting in higher CTE increasing rate.
In the absence of phase interaction, the CTE of a
composite is always calculated by the simple rule of
mixture (ROM) [21]:
Fig. 7. Porosity as a function of SiCp vol.% for the composites with 5
mm SiCp after sintered.
Table 3
Instantaneous and mean CTE (�/10�6 K) of Cu/SiCp samples
SiCp diameter (mm) SiCp vol.% 100 8C 150 8C 200 8C 250 8C 300 8C 350 8C 400 8C 450 8C 500 8C /CTE (100�/500 8C)
5 35 16.5 16.2 16.8 16.1 15.7 14.9 15.8 16.4 17.2 16.2
5 41 15.8 15.6 16.3 15.1 15.5 14.9 13.6 16.0 17.0 15.4
5 48 15.5 15.2 15.0 14.9 14.5 14.3 14.3 13.8 14.3 14.6
5 58 14.7 14.9 14.5 12.6 13.2 14.0 14.2 14.9 14.0 14.1
5 74 9.3 9.7 10.2 10.6 10.7 10.4 10.9 12.8 15.2 11.1
25 35 12.2 13.8 14.0 14.7 15.7 16.2 17.2 17.8 18.1 17.9
25 41 11.2 12.9 14.0 14.7 15.3 15.8 16.3 16.8 17.3 16.8
25 48 10.7 11.3 12.5 13.3 14.0 14.8 15.8 16.5 17.7 16.1
25 58 9.4 10.8 12.0 13.0 14.0 14.5 15.5 16.0 17.4 15.8
25 74 8.0 10.4 11.0 10.8 11.4 12.1 13.1 14.1 14.8 13.9
47 35 15.6 16.7 16.9 17.1 17.5 18.6 19.8 20.0 20.4 18.4
47 41 13.0 16.1 17.4 14.6 16.4 18.1 18.9 18.9 19.3 17.2
47 48 15.0 15.8 16.0 16.7 16.3 17.0 18.1 18.3 19.5 17.1
47 58 13.5 16.4 16.6 16.2 16.0 16.9 17.1 16.4 17.4 16.4
47 74 11.2 12.5 12.7 12.5 15.0 18.9 16.7 16.4 19.1 15.3
Fig. 8. The model used for thermal stress calculation in particulate
composite [16].
K.-M. Shu, G.C. Tu / Materials Science and Engineering A349 (2003) 236�/247242

ac�amVm�apVp (9)
where a is CTE, V is the volume fraction, and the
subscripts c, m, and p refer to the composite, matrix and
particle, respectively. The ROM model is often consid-ered inappropriate because it does not take account of
the microstructure and strain interaction.
However, it is known that micro stress often exists
between the phases, and these stresses influence the
thermal expansion behavior of the composite body.
Several researchers have given expressions for the CTE
of the particulate composites taking into account the
stress interaction between phases. According to Turner’smodel [22], the CTE of a particular composite is given
by:
ac�amVmKm � apVpKp
VmKm � VpKp
(10)
where K is the bulk modulus.
Turner’s model is based on the assumption that only
uniform hydrostatic stresses exist in the phases. Anothermodel for particulate composites is given by Kerner [23],
which accounts for both shear and isostatic stresses
developed in the component phases, and gives the CTE
for the composite as:
ac�am�(am�ap)
�Kp(3Km � 4Gm)Vp
Km(3Kp � 4Gm) � 4(Kp � Km)GmVp
(11)
where G is the shear modulus.
A comparison of the experimental and theoreticalCTE values obtained by using these three models is
presented in Fig. 10. In the calculation of the predictions
of the models, the CTE data for copper and SiC are
taken from commercial specimens measured at 100 8C(aSiC�/5.32�/10�6 K�1, aCu�/16.15�/10�6 K�1), the
bulk modulus of SiC is taken as 450 GPa. The Km and
Gm values of matrix, influenced by compact fractional
porosity, must be concerned. As reported by Lally et al.[24], both the yield and ultimate strengths of compacts
could be improved by high compact densities. It means
that the yield and ultimate strengths decreased with
increasing porosity. Several researches [25�/27] are also
focused on the relationship between the density and the
strength of sintered metal components. All of them
reached the same conclusion, that is, the ultimate tensile
strength of a powder compact decreased with increasingfractional porosity. The dependence of Poisson’s ratio of
powder compact on pore volume fraction is given as
[28]:
Table 4
Pressure at the interface of composite (unit: MPa)
SiCp vol.% 100 8C 150 8C 200 8C 250 8C 300 8C 350 8C 400 8C 450 8C 500 8C 550 8C
35 26.2 53.3 82.4 112.1 142.4 173.6 205.5 238.6 272.8 338.6
41 23.9 49.1 75.3 102.3 130.0 158.5 187.6 217.8 249.1 299.1
48 21.2 43.6 66.8 90.8 115.4 140.7 166.6 193.4 221.1 274.5
58 17.4 35.7 54.8 74.5 94.6 115.4 136.6 158.6 181.3 225.0
74 10.9 22.5 34.5 46.9 59.6 72.6 86.0 99.9 114.2 141.7
Fig. 9. Comparison of CTE behaviors of Cu/SiCp composites with 25
mm SiCp in different particle volume percents.
Table 5
jsr�/s0j value at the interface of composite (unit: MPa)
SiCp vol.% 100 8C 150 8C 200 8C 250 8C 300 8C 350 8C 400 8C 450 8C 500 8C 550 8C
35 8 16 25 34 44 53 63 73 84 104
41 12 26 41 55 71 86 102 118 135 168
48 18 38 59 80 102 125 147 171 196 243
58 27 56 86 117 149 181 215 249 285 354
74 41 84 130 177 225 274 324 377 430 534
K.-M. Shu, G.C. Tu / Materials Science and Engineering A349 (2003) 236�/247 243

nm�n(1�pf )a (12)
where n is the Poisson’s ratio of matrix, the exponent a
ranges from 1.92 for cold forging to 2.00 for hot forging
(1.92 was used in this study for calculating Turner’s and
Kerner’s model values).It is shown in Eq. (12), that thePoisson’s ratio would decrease with increasing fractional
porosity.
It is known that the bulk modulus of matrix (Km) is
given as
Km�E
3(1 � 2nm)(13)
and the shear modulus of matrix (Gm) is given as
Gm�E
2(1 � nm)(14)
Eqs. (12) and (13) show that the bulk modulus of
matrix would decrease with increasing fractional poros-
ity; on the contrary, Eqs. (12) and (14) show that the
shear modulus of matrix would increase with increasingfractional porosity. Taking account of Eqs. (12)�/(14)
into Eq. (11), the relationship of composite CTE as
functions of fractional porosity and SiCp volume frac-
tion is calculated and shown in Fig. 11. It is observed
from the figure that for pure copper, i.e. 0 vol.% SiCp,
porosity has little effect on CTE. As SiCp volume
fraction increase, the CTE tends to decrease linearly
with increase of porosity. However, until about 80%SiCp vol.%, the above tendency diminished gradually,
i.e. the porosity exerts only negligible effect on CTE.
Fig. 10 also shows that the CTE values of coated
composites are lower than those of non-coated SiCp
composites, this mainly stems from the fact that in the
former copper has undergone plastic flow during the
heating process, and the plastic flow was retarded by the
well bonded SiCp. For those with non-coated SiCp
composites, bad bonding between Cu matrix and SiCp
makes the major thermal expansion of composite being
contributed by copper matrix; therefore, the CTE ofcomposites approach the CTE of copper.
Sun et al. [29] reported that the experimental CTEs of
particulate composites are often found lying between the
predictions of Turner’s and Kerner’s models. However,
in Fig. 10, the experimental values approach most
closely the values estimated by ROM model, and agree
better with Kerner’s model as compared with Turner’s
model. This trend is not unexpected since the P/Medcomposites have more pores than those made by the
casting method that could obtain higher density. Both
Kerner’s and Turner’s models would give descended
CTE values if the porosity was introduced to Eqs. (11)
and (12) for calculating Km and Gm values.
3.5. The thermal hysteresis behavior of the composite
The measured thermal linear expansion curves ofdifferent Cu/SiCp composites, as a function of tempera-
ture, are presented in Fig. 12. The CTE values for the
individual composites have been given in Table 3. As
shown in Fig. 12, the percent linear change (PLC) versus
temperature curves of different Cu/SiCp composites
show similar characteristics, i.e. after a complete heating
and cooling cycle, the composite retain ca 0.1�/0.3%
positive residual strain, and with increasing SiCp volumefraction, the PLC of the 5 mm sample decreased, the
PLC of 25 mm sample converged to approximately
0.22%, while that of 47 mm diverged in a complex way.
The thermal hysteresis behavior can be explained in
terms of the weak interface between reinforcements and
matrix or large internal stress released in the composites.
Once the composite had undergone significant plastic
deformation during the heating process, the lack ofbonding force could not produce large enough stress to
deform the matrix back to its original size upon cooling.
As shown in Fig. 12, the 5 mm SiCp/Cu composites,
with exception of 35 vol.% sample, showed a relatively
smaller hysteresis values upon cooling as compared with
that of the 25 mm SiCp/Cu. This result can be stemmed
from that larger thermal hysteresis would be induced
while higher stress inherent in matrix was obtained whenlarger SiCp size composites were repressed using same
operating procedure. However, the hysteresis of 47 mm
SiCp/Cu are more diversified than others, more pores in
this composite and/or the possibly bonding deteriora-
tion, as larger thermal stress induced with larger particle
size (derived from Table 2), are reckoned as the possible
reasons. Since the thermal hysteresis behavior of a
material could be a problem in a real application, thethermal cycling test was carried out on composites and
commercial copper bar in order to determine if the
thermal hysteresis were matrix related. Fig. 13 shows the
Fig. 10. Comparison of experimental and theoretical values of CTE
for different particulate composites (temperature: 100 8C, SiCp
particle size: 25 mm, aSiC�/5.32 ppm, aCu�/16.15 ppm).
K.-M. Shu, G.C. Tu / Materials Science and Engineering A349 (2003) 236�/247244

thermal linear expansion curves for the 25 mm, 48 vol.%
SiCp/Cu sample obtained from four continuous thermal
cycles, and it can be found that the thermal hysteresis
behavior is observed in all thermal cycles. In each
subsequent thermal cycles, the thermal hysteresis beha-
vior is gradually lessened. This probably can be ascribed
to that the internal residual stress accumulated in the
repressing process is released gradually at each thermal
cycle. Besides, at the high temperature portion of each
cycle, like that at 550 8C, the specimens still have some
residual stress in the first heating cycle which was
gradually dissipated at each subsequent heating and
cooling cycle. In other words, the thermal expansion
behavior of composite is thermal history dependent,
thus, the CTE data are also dependent on the thermal
history.
The thermal expansion behavior of a copper sample
cut from a commercial copper bar was measured with
three thermal cycles and the results are given in Fig. 14.
The thermal hysteresis behavior can also be observed
during the first thermal cycle, and is removed from the
sample during the subsequent thermal cycles. It shows
that the specimen was stress-free at 550 8C. Comparing
with Fig. 13, the hysteresis strain of the commercial
copper bar after the thermal cycle was found to be much
smaller than that for the Cu/SiCp composite, this
indicated that lower internal residual stress is inherent
in copper bar than in composites.
High defect density and residual stresses in the
composites made by powder metallurgy could be the
reasons for the hysteresis behavior observed herein.
During the heating stage of thermal cycle, tensile stress
is developed on SiCp and compressive stress on copper
matrix, this is caused by larger Cu expansion than that
of SiCp reinforcement in the case that SiCp and Cu are
under well bonding status. It is obvious that the
Fig. 11. The relationship of CTE, fractional porosity and SiCp volume
fraction of composite
Fig. 12. Thermal linear expansion curves for Cu/SiCp composites for a
heating and cooling cycle with different particle sizes: (a) 5 um, (b) 25
um and (c) 47 um.
K.-M. Shu, G.C. Tu / Materials Science and Engineering A349 (2003) 236�/247 245

composite CTE would be lower than the values calcu-
lated by rule of mixture, and the experimental values of
non-coated specimen, these phenomena are proved in
Fig. 10. On the contrary, during the cooling stage of
thermal cycle, the thermal residual stresses might affect
the overall CTE of the Cu/SiCp composite in two ways.
The tensile portion upon the matrix could enlarge the
distance of the Cu atom and thus reduce the expansion
ability of the matrix. Meanwhile, the compressive
stresses on the reinforcement would enhance the restric-
tion effect of SiCp on the matrix and also lessen CTE of
the Cu/SiCp composite. The cooling portion curves
shown in Fig. 12 show lower slope than the heating
portion curves, i.e. the CTE values during heating stage
are larger than that during cooling stage, can be an
apparent proof of the above ratiocination. If the
difference of stress among heating and cooling stage is
large, i.e. more residual stress is released in the
composite, larger hystersis would be observed. In Cu
bar specimen, with smaller residual stress after first cycleand nil matrix/reinforcement interaction, same thermal
cycling behavior is expected as shown in Fig. 14.
4. Conclusions
The thermal expansion behavior of Cu/SiCp compo-
site fabricated by powder metallurgy method, with
different SiCp volume fraction and surface coating,
was studied in this paper in the temperature range of
50�/550 8C, and the following conclusions have been
drawn.
A completely continuous copper film on silicon
carbide particle can be obtained by electroless platingprocess to promote bonding between Cu and SiCp. The
Cu/SiCp composites prepared by the powder metallurgy
method show a uniform microstructure in which silicon
carbide particles are distributed evenly in the copper
matrix.
The MMC CTE could be decreased effectively
through well bonding between reinforcement phase
and metal matrix.The CTE and thermal hysteresis strain generally
increases with increasing SiCp particle size. The compo-
sites exhibited positive thermal strain when cooled down
from the peak temperature to room temperature, which
can be explained in terms of the residual stresses and the
interfacial bonding between copper and silicon carbide.
The magnitude of this thermal strain is a function of
SiCp volume fraction and number of thermal cycles.
References
[1] B. Ogel, R. Gurbuz, Mater. Sci. Eng. A301 (2001) 213.
[2] B.G. Kim, S.L. Dong, S.D. Park, Mater. Chem. Phys. 72 (2001)
42.
[3] G. Manchang, K.S. Bong, J. Mater. Lett. 46 (5) (2000) 296.
[4] K. Biswas, G.S. Upadhvy, Mater. Des. 9 (5) (1998) 231.
[5] Y.L. Shen, Mater. Sci. Eng. A152 (1998) 269.
[6] S.G. Konsowski, A.R. Helland, Electronic Packaging of High
Speed Circuitry, McGraw-Hill, New York, 1997, p. 60.
[7] H. Ledbetter, M. Austin, Int. J. Thermophys. 12 (1991) 731.
[8] K. Parasan, S. Palaniappan, S. Seshan, Composite 28 (1997) 1019.
[9] K. Premkumar, M.H. Hunt, P.R. Sawtell, J. Met. 44 (1992) 24.
[10] P. Yih, D.D.L. Chung, J. Mater. Sci. 31 (1996) 399.
[11] Y.L. Shen, M. Finot, A. Needleman, S. Suresh, Acta Metall.
Mater. 39 (1991) 735.
[12] P. Yih, D.D.L. Chung, J. Mater. Sci. 34 (1999) 359.
[13] F.P. Beer, E.R. Johnston, Mechanical Behavior of Materials,
second ed., McGraw-Hill, New York, 1996, p. 806.
[14] T.H. Courtney, Mechanical of Materials, McGraw-Hill, New
York, 1996, p. 46.
[15] D. Masutti, J.P. Lentzs, F. Delanny, J. Mater. Sci. Lett. 9 (1990)
340.
Fig. 13. Thermal linear expansion curves for the 25 mm, 48 vol.% SiCp/
Cu sample corresponding to four continuous thermal cycles.
Fig. 14. Thermal linear expansion curves for a commercial copper bar
from three continuous thermal cycles.
K.-M. Shu, G.C. Tu / Materials Science and Engineering A349 (2003) 236�/247246

[16] D. Brooksbank, K.W. Andrews, J. Iron Steel Inst. 208 (1970)
582.
[17] R.U. Vaidya, K.K. Chawla, Comp. Sci. Technol. 50 (1994) 13.
[18] K.K. Chawla, Metallography 6 (1973) 155.
[19] Y.Z. Wan, Y.L. Wang, H.L. Luo, X.H. Dong, G.X. Cheng, J.
Mater. Sci. Lett. 18 (1999) 1059.
[20] Y. Takao, M. Taya, J. Appl. Mech. 52 (1985) 806.
[21] ASM Handbook, vol. 2, American Society for Metals, Metals
Park, OH, 1991, p. 401.
[22] P.S. Turner, J. Res. NBS 37 (1946) 239.
[23] E.H. Kerner, Proc. Phys. Soc. 69 (1956) 808.
[24] F.T. Lally, I.J. Toth, J. Dibenedetto, Forging of Steel Powder
Products, Metal Powder Industries Federation, Princeton, NJ,
1973, p. 103.
[25] A. Salk, V. Miskovic, E. Dudrova, E. Rudnayova, Powder
Metall. Int. 6 (1974) 128.
[26] N.A. Fleck, R.A. Smith, Powder Metall. 24 (1981) 121.
[27] V.T. Troshchenko, Soviet Powder Metall. Metal Ceram. 2 (1963)
179.
[28] R.M. German, Powder Metallurgy Science, second ed., Metal
Powder Industries Federation, Princeton, NJ, 1994, p. 323.
[29] Q. Sun, O.T. Inal, Mater. Sci. Eng. B41 (1996) 261.
K.-M. Shu, G.C. Tu / Materials Science and Engineering A349 (2003) 236�/247 247