investigation of microstructure, physical and thermal
TRANSCRIPT

International Journal of Scientific and Technological Research wwwiisteorg ISSN 2422-8702 (Online) Vol 1 No10 2015
1 | P a g e wwwiisteorg
Investigation of Microstructure Physical and Thermal
Properties of Al-Si-Sb Ternary Alloy
A Aker (Corresponding author)
Department of Physics Institute of Science and Technology Erciyes University Kayseri Turkey
E-mail aynurakerhotmailcom
H Kaya
Department of Science Education Faculty of Education Erciyes University Kayseri Turkey
Abstract
Al-126wt Si-2wt Sb alloy was directionally solidified with different growth rates (833-16545
ms) at a constant temperature gradient of 804 Kmm using by Bridgman type growth apparatus The
values of interflake spacing (was measured from transverse sections of the samples The dependence
of interflake spacing on the growth rate (V) was measured Measurements of microhardness (HV)
ultimate tensile strength () and electrical resistivity () of the directionally solidified samples were
carried out The dependence of microhardness ultimate tensile strength and electrical resistivity on
growth rate (V) and interflake spacing ( was also analyzed According to these results it has been
found that for increasing values of V the values of HV and are increase for increasing values of
but values of HV and are descrease Variations of electrical resistivity () for casting Al-Si-Sb
alloy were also measured at the temperature in range 300450 K The enthalpy of fusion (H) and
specific heat (Cp) are calculated to be 28260 Jg and 0326 J(gK) respectively by means of
differential scanning calorimeter (DSC) from heating trace during the transformation from liquid to
solid The results obtained in this work were compared with the similar experimental results in the
literature
Keywords Al-Si-Sb alloy Microstructures Microhardness Tensile Stress Electrical resistivity
Enthalpy Specific heat
1 Introduction
Aluminum based alloys are widely employed in numerous automotive and industrial weight sensitive
applications such as gas turbine aeronautics and space flight because of their low density and
excellent cast ability Actually in most cases high-level mechanical properties are needed for
industrial applications so the performance of these alloys has been the subject of many
micromechanical investigations [1] Since the strength and hardness of alloys mainly depend on their
microstructure a lot of efforts have been made to refine the microstructure of the castings in order to
enhance the mechanical properties of aluminum-based alloys While research in the field of composite
materials has yielded very exciting results aluminum has remained at the centre of attention due to its
attractive manufacturing costs its extensive previous use in aircraft structures and the availability of
aluminum manufacturing facilities [2] It is known that the mechanical properties of metallic materials
are affected by their morphology The mechanical properties of directionally solidified Aluminum
alloys which are an important commercial material have been reported in several investigations [3-10]
but the results differ from each other
The automotive and aircraft industrial needs led to increasing application of Al-Si based alloys thanks
to the great potential of these materials as replacements for heavier materials (steel cast iron or copper)
[1112] The AlndashSi alloy system which is characterized by high specific strength excellent corrosion
resistance as well as good thermal and electrical conductivities is widely used to supplant other alloys
in the areas of transportation packaging construction and machinery to achieve great weight reduction
[13]
International Journal of Scientific and Technological Research wwwiisteorg ISSN 2422-8702 (Online) Vol 1 No10 2015
2 | P a g e wwwiisteorg
It is known that the mechanical and electrical properties of metallic materials are affected by theirs
morphology The mechanical and electrical properties of directional solidified Albase alloys which
are important commercial materials have been reported in several investigations [14 15] but the results
differ from each other The microstructure evolution during solidification depends on the alloy
characteristics and primarily is a function of the temperature profiles at the solidification interface
When a eutectic or near-eutectic alloy is solidified the most frequently observed solid morphology is
regular or irregular lamellar eutectic microstructures [16] Microstructures are characterized by the
microstructure parameters Numerous solidification studies have been reported with a view to
characterizing the microstructure parameters as a function of growth rate (V) [17 18] Thus one of the aims of present work was to experimentally investigate the dependence of the flake spacings on the growth rate in the Al-Si-Sb ternary alloy and compare the results with the previous
experimental results for similar alloys The other aim of this work was to investigate the physical
properties of the Al-Si-Sb ternary alloy such as microhardness electrical resistivity enthalpy of fusion
and the specific heat
2 Experimental procedure
21 Sample production and microstructure observation
Alndash126wt Si-2wt Sb samples were prepared by melting weighed quantities of Al Si and Sb
(puritygt9999) in a graphite crucible placed into a vacuum melting furnace After allowing time for
melting homogeneously the molten alloy was poured into seven graphite crucibles (250 mm in length
4 mm inner diameter and 635 mm outer diameter) in a hot filling furnace Then each specimen was
positioned in a Bridgman-type furnace in a graphite cylinder (300 mm in length 10 mm inner diameter
and 40 mm outer diameter) After stabilizing the thermal conditions under argon atmosphere the
specimen was grown by pulling downwards at a constant rate by means of a synchronous motor
Samples were solidified under steady-state conditions with a constant temperature gradient of 804
Kmm in a wide range of growth rates (833-16545 ms) The quenched sample was removed from the graphite crucible and cut into lengths typically of 8 mm
The longitudinal and transverse sections were ground flat with SiC paper (180 500 1000 and 2500
grit) then grinded samples were cold mounted with epoxy-resin After polishing the samples were etched with 10vol HF+90vol H2O for 10-15 s After metallographic process the microstructures of
the samples were revealed The microstructures of samples were photographed from transverse section
with a LEO scanning electron microscopy (SEM) for different growth rates Typical images of growth
morphologies of directionally solidified Al-Si-Sb alloy were shown in Figure 1
22 Measurement of solidification parameters and interflake spacing
The temperature in the specimen was measured by using three K-type insulated thermocouples (025
mm in diameter) fixed within the sample with spacing of 10-20 mm All the thermocouplesrsquo ends were
connected to a measurement unit consisting of a data-logger and a computer The cooling rates were
recorded by using the data-logger via the computer during growth When the solid-liquid interface was
at the second thermocouple the temperature difference (T) between the first and the second
thermocouples was read from the data-logger record The temperature gradient (G =Tx) for each
sample was determined using the measured values of T and the known value of x (distance
difference of the thermocouples ends from buttom of the sample) The time (t) taken for the solid-
liquid interface passed through the thermocouples separated by known distances (x) was read from
data-logger record Thus the value of growth rate (V=xt) for each sample was determined using the
measured values of x and t The measurements of λ were made from the photographs of microstructures with a linear intersection method [19-22] The λ values on the transverse section were
more reliable than the longitudinal section of the sample So the λ values were measured from
transverse sections of the samples So the λ values were measured from transverse sections of the
samples The values of measured G V and are given in Table 1 and Figures1-2
23 Measurement of microhardness
The mechanical properties of any solidified material are usually determined by hardness test tensile
test etc Since true tensile strength testing of solidified alloys gave inconsistent results with a wide
scatter due to the strong dependence on the surface quality of solidified sample the mechanical
International Journal of Scientific and Technological Research wwwiisteorg ISSN 2422-8702 (Online) Vol 1 No10 2015
3 | P a g e wwwiisteorg
properties were monitored by hardness testing which was one of the easiest and most straightforward techniques
Figure 1 Micrographs of the directionally solidified Al-126wt Si-2wt Sb ternary alloy with a
constant temperature gradient of 804 Kmm showing the eutectic microstructure (a) V=833 ms
(b) 4185ms (c) V=16545 ms
International Journal of Scientific and Technological Research wwwiisteorg ISSN 2422-8702 (Online) Vol 1 No10 2015
4 | P a g e wwwiisteorg
5 6 8 15 20 30 40 50 60 80 150 20010 100
2
3
4
5
6
7
8
9
15
10
Inte
rfla
ke
spac
ings
(
m)
Growth rate V(ms)
=2369 V-043
Figure 2 Variation of interflakes spacings a function growth rate
The Vickers hardness (HV) is the ratio of a load applied to the indenter to the surface area of the
indentation This is given by
HV= 2Psin(θ2)d2
(1)
Microhardness measurements in this work were carried out using a DuraScan hardness measuring test
device using a 10-50 g load and dwell time of 10 s giving a typical indentation depth of 40-60 microm
which was significantly smaller than the original solidified samples Microhardness (HV) was
measured for at least 300 different regions on transverse The measured values of HV are also given in
Table 1 and the variations of microhardness with the solidification processing parameters are plotted and given in Figures 3a and 3b
Table 1 The values of solidification processing parameters microstructures microhardness ultimate
tensile strength and electrical resistivity for directionally solidified Al-Si-Sb ternary alloy and
relationships between them
G
(Kmm)
V
(ms)
(m)
HV
(kgmm2)
(MPa)
x10-5
( mm)
804
833 912 6022 7360 696
1623 724 6330 8020 735
4185 478 6704 8647 775
8235 342 6980 10210 820
16545 257 7202 11678 856
Relationships Constant (k) Correlation
coefficients (r)
International Journal of Scientific and Technological Research wwwiisteorg ISSN 2422-8702 (Online) Vol 1 No10 2015
5 | P a g e wwwiisteorg
=k1V-046
HV=k2V005
HV=k3
=k4V015
=k5-034
=k6V006
=k7-015
k1=2369(m146s-046)
k2=8073 (kg mm-205sn005)
k3=3208 (kg mm-187)
k4=14884(MPa mm-015 s015)
k5=15926(MPa mm034)
k6=969m094s006
k7=336mm115
r1 =0998
r2 =0996
r3 =0993
r4 =0980
r5=0984
r6=0998
r7=0996
International Journal of Scientific and Technological Research wwwiisteorg ISSN 2422-8702 (Online) Vol 1 No10 2015
6 | P a g e wwwiisteorg
Figure 3 (a) Variation of microhardness Hv and tensile strength σ as a function growth rate
(b) Variation of microhardness Hv and tensile strength σ as a function interflakes spacings
24 Determination of ultimate tensile strength (UTS)
Another aim of this work was to obtain the relationship between ultimate tensile strength (UTS) the
growth rate and interflake spacings in the Al-Si-Sb ternary alloy
The tests of tensile strength were performed at room temperature at a strain rate of 10-3 s-1 with a
Shimadzu AG-XD universal testing machine The data collected from the tensile test can be analysed
using the following formula to determine the strength ()
σ=FA (2)
where is the strength in N mm2 (or MPa) F is the applied force (N) A is the original cross sectional
area (mm2) of the sample The round rod tensile samples with diameter of 4 mm and gauge length of 50
mm were prepared from directionally solidified rod samples with different growth rates (V=833-
16545 ms) at a constant G (804 Kmm)
The tensile axis was chosen parallel to the growth direction of the sample UTS () values of Al-Si-Sb
alloy are shown in Figures 3a and 3b for V and values
25 Measurement of electrical resistivity
Another purpose of this investigation was to obtain the relationships among the growth rate dendritic
microstructures and electrical resistivity for the Al-Si-Sb samples The electrical resistivity of
directionally solidified samples was measured by the dc four-point probe method The four-point
probe method is the most widely used technique for electrical profile measurement of materials The method has proven to be a convenient tool for the resistivity measurement In this method the
materialrsquos resistivity can be expressed as
I
VRCF (3)
where RCF is resistivity correction factor V is the potential difference measured across the probes and
I is the current through the probes The geometry of the sample determines the correction factors that
must be used additionally the position of the probes on the sample and the spacings between the
probes The need for correction factors is caused by the proximity of a boundary which limits the
possible current paths in the sample The number of RCF is calculated by diameter of sample divided
by probe spacing (probe spacing being the distance between any two adjacent probes) In this study a
4mm diameter sample probed with a four point probe with 1mm tip spacing would have a correction
factor of 065
When a constant current was applied on the sample with a Keithley 2400 sourcemeter the potential
drops on the samples were measured with a Keithley 2700 multimeter connected to a computer
Platinum wire 05 mm in diameter was used to be the probes of current and potential
Two of the probes are used to source current and the other two probes are used to measure voltage
using four probes eliminates measurement errors due to the probe resistance the spreading resistance
under each probe and the contact resistance between each metal probe and material [23] The sizes of
samples were measured by using a digital micrometer has an accuracy of 1 μm The error in the
electrical resistivity measurements is calculated about 5 This error is due to current voltage and
temperature measurements
26 Determination of enthalpy and specific heat
International Journal of Scientific and Technological Research wwwiisteorg ISSN 2422-8702 (Online) Vol 1 No10 2015
7 | P a g e wwwiisteorg
The enthalpy of fusion (H) and the specific heat (Cp) of Al-Si-Sb alloy were determined because they
are very important parameters for industrial applications Differential scanning calorimeter (DSC)
thermal analysis (Perkin-Elmer Diamond model) was performed at 300-1200 K with a heating rate of
10 Kmin under a constant stream of nitrogen at atmospheric pressure
A reference material (a sapphire disk) was used in determining specific heat This reference data was
used to ldquocorrectrdquo sample data at every temperature The size of the signal which was used to calculate
the specific heat was proportional to the heating rate so it follows that faster heating rates will produce
larger signals which will give more accurate data However if the heating rate was too high the
temperature gradients in the sample would be large and this may introduce other errors in the
measurement It was normal to use heating rates between 5 and 20 Kmin The heating rate in this study
was 10 Kmin which was mostly recommended
The difference between the sample curve and the baseline curve was measured in milliwatts and
converted to specific heat as follows
Cp=(dQdt)(1MR) (4)
where dQdt is the heat flow M (g) the mass of the sample and R the heating rate Kmin
The DSC curve obtained for Al-Si-Sb alloy is shown in Figure 6 A sharp peak is clearly observed for
melting process as shown in Figure 6 The enthalpy of fusion (H) and specific heat (Cp) were
calculated as the area under the peak by numerical integration
3 Results and discussion
31 Effect of growth rate on the inter flake spacing
Variations of inter flake spacings ()with the growth rate (V) at a constant G (804 Kmm) is given in
Figure 2 and Table 1 The variation of versus V can be given the proportionality equation as
n
kV
(5)
where k is a constant and n an exponent value of growth rate The relationships between the flakes
spacing and growth rates were determined as λ=2369 V-043
by using linear regression analysis The
exponent value 043 is in good agreement with the range values of 039-047 obtained by different
researchers [61014172425]
32 Dependence of microhardness and ultimate tensile strength on growth rate
One of the purposes of this investigation is to obtain the dependence of HV on V and It can be seen
from Table 1 that an increase in the temperature gradient and growth rate leads to an increase in the
microhardness Dependence of the HV on the V and were determined by using linear regression
analysis and the relationship between them can be expressed by the following equations as
bVHV2
k
(6)
cHV
3k
(7)
where k2 and k3 are constant b and c are the exponent values of the growth rate and flake spacing
respectively As can be seen from Figures 3a and 3b the microhardness values increase with the
increasing V values and decreasing with the increasing values
Linear regression analysis yields
HV =8073V005 (8)
HV = 3208 λ-013 (9)
The average exponent values of V and for HV in the directionally solidified Al-Si-Sb alloy were
found to be 005 and 013 respectively in this work These exponent values relating to V and
obtained in present work is generally in a good agreement with the exponent values obtained in
previous experimental works [17 21-22 26] under similar solidification conditions
International Journal of Scientific and Technological Research wwwiisteorg ISSN 2422-8702 (Online) Vol 1 No10 2015
8 | P a g e wwwiisteorg
Typical strength-strain curves of Al-Si-Sb alloy are shown in Figure 3 for V and values As can bee
seen from Figure 3 ultimate tensile strengthUTS ) values are increased with increasing V but
eutectic spacings values are increased ultimate tensile strengthdecreased
Figures 3a and 3b show the variation of the UTS () with the growth rate (V) and interflake spacings
The dependence of on V and can be represented as
σ = k4Vd (10)
σ = k5e (11)
As can be seen from Figure 3a the values of increase with increasing growth rate The exponent
value of V is found to be 016 and value of is found to be 037 (Figure 3b)
34 Electrical properties of Al-Si-Sb ternary alloy
It can be seen from Table 1 temperature gradient and growth rate lead to an increase in the electrical
resistivity Dependence of the electrical resistivity on growth rate and interflake spacings can be
expressed as
=k6Vf (12)
=k7g (13)
where k6 and k7 are constants which can be experimentally determined and given in Table 1 The value
of the exponent relating to the growth rate and eutectic spacings were obtained to be 006 and 015
respectively (Figure 4)
International Journal of Scientific and Technological Research wwwiisteorg ISSN 2422-8702 (Online) Vol 1 No10 2015
9 | P a g e wwwiisteorg
Figure 4 (a) Variation of electrical resistivity as a function growth rate
(b) Variation of electrical resistivity as a function interflake spacings
The variation of electrical resistivity with the temperature in the range of 300ndash450 K was measured
(see Figure 5) It is observed that an increase in the temperature (300ndash450 K) values lead to increase in
the electrical resistivity values (639ndash992)10-5 mm
As can be seen from Figure 5 the electrical resistivity values (639ndash99210-5 mm) in this work are
some higher than the values (275ndash87510-5 mm) for pure aluminum and smaller than the values
(413ndash11010-5 mm) for pure antimony [27]
Figure 5 Variation of electrical resistivity as a function temperature for Al-Si-Sb ternary alloy
35 The thermal properties of Al-Si-Sb alloy
The AlndashSi-Sb alloy was heated with a heating rate of 10 Kmin from room temperature to 1200 K by
using a Perkin Elmer Diamond model DSC and the heat flow versus temperature is given in Figure 6
As can be seen from Figure 6 the melting temperature of Al-Si-Sb eutectic was found to be 86637 K
The values of the enthalpy of fusion and the specific heat were also calculated to be 28260 Jg and
0326 J(gK) respectively from the graph of the heat flow vs temperature The recommended values of
the enthalpy of fusion for pure Al Si Sb and Al-Si eutectic are 39696 Jg 29783 Jg 161 Jg and
4682 Jg respectively and also the specific heat values for pure Al Si Sb and Al-Si eutectic are 0879
JgK 0210 JgK 021 JgK and 00563 JgK in respectively [28 29] at the melting temperature The
International Journal of Scientific and Technological Research wwwiisteorg ISSN 2422-8702 (Online) Vol 1 No10 2015
10 | P a g e wwwiisteorg
H value (28260 Jg) is smaller and the Cp values (0326 JgK) is same higher than the values of pure
Al Si Sb and Al-Si eutectic
Figure 6 Heat flow curve vs the temperature for Al-Si-Sb ternary alloy at heating rate of 10 Kmin
4 Conclusions
The principal results in this work can be summarized as follows
1 Experimental observations show that the values of flake spacings () decreases as growth rate (V)
increases The relationships between and V have been obtained to be λ=2369 V-043
2 It was found that the values of HV increase with increasing the values of V but the values of the HV
descrease with increasing the values of The establishment of the relationships among HV V and
can be given as HV=5336V015 and HV= 8219 λ -013
3 The experimental expressions correlating the values of ultimate tensile strength) with the values
of V and shows that the values of the tensile stresses increase with increasing the values of V and
the values of the tensile stresses descrease with increasing the values of The establishment of the
relationships among stresses () and solidification parameters (V and G) can be given as σ
=5220(V) 015 and σ =15656(λ) -034
4 Experimental results show that the values of electrical resistivity () increases with increasing V
values but the values of descrease with increasing the values of The relationships between
and V and have been obtained to be ρ=603x10-8 (V)006 and ρ=989x10-8 ()-015
5 The electrical resistivity of Al-Si-Sb alloy increases (639ndash992)10-5 mm with increasing
temperature (300-450 K)
6 From the plot of heat flow vs temperature the melting temperature enthalpy of fusion and
specific heat are found to be 86637 K 28260 Jg and 0326 J(gK) respectively
References
[1] Yang F Peng L and Okazaki K 2004 Microindentation of aluminum MetMat
Trans 35A p3323
[2] Ping Wu S Liu DR Guo JJ Su YQ and Fu H Z 2007 Influence of process
parameters on CET in TindashAl alloy ingot with consideration of shrinkage cavity
formation A computer simulation J Alloys and Comp 441 p 267
International Journal of Scientific and Technological Research wwwiisteorg ISSN 2422-8702 (Online) Vol 1 No10 2015
11 | P a g e wwwiisteorg
[3] Yang F Peng L and Okazaki K 2004 Microindentation of aluminum Met Mat
Trans A35 p3323
[4] Goulart P R Spinelli J E Osoacuterio W R Garcia A 2006 Mat Sci Eng A 421
p245
[5] Goumlgebakan M Uzun O Karaaslan T Keskin M 2003 Rapidly solidified Alndash65
wt Ni alloy J Mat Proc Tech 142 p87
[6] Kaya H Guumlnduumlz M Ccediladırlı E Uzun O 2004 Effect of growth rate and lamellar
spacing on microhardness in the directionally solidified Pb-Cd Sn-Zn and Bi-Cd
eutectic alloys JMat Sci 39 p6571
[7] Kaya H Ccediladırlı E Guumlnduumlz M Uumllgen A 2003 Effect of the temperature gradient growth
rate and the interflake spacing on the microhardness in the directionally solidified Al-
Si eutectic alloy JMatEng Perf 12 p 544
[8] Kaya H Ccediladırlı E Boumlyuumlk U and Maraşlı N 2008 Variation of microindentation
hardness with solidification and microstructure parameters in the Al based alloys Appl
Surf Sci 255 p3071
[9] Engin S Boumlyuumlk U Kaya H Maraşlı N 2011 Directional solidification and
phiycsal properties measurements of the zinc-aluminum eutectic alloy I J Min Met
Mat 18(6) p 659
[10] Boumlyuumlk U Maraşlı N Ccediladırlı E Kaya H Keşlioğlu K 2012 Variations of
microhardness with solidification parameters and electrical resistivity with temperature
for Al-Cu-Ag eutectic alloy Current Applied Physics 12 p7
[11] Wang E R Hui X D Wang S S Zhao Y F Chen G L 2010 Improved
mechanical properties in cast Al-Si alloys by combined alloying of Fe and Cu
Materials Science and Engineering A 527 pp 7878-7884
[12] Samuel A M Samuel F H Doty H W 1996 Observation on the formation szlig-
Al5FeSi phase in 319 type Al-Si alloys Journal of Materials Science 31 pp 5529-
5539
[13] Lu L Dahle AK 2006 Mater Sci Eng A 435ndash436 pp 288ndash296
[14] Kaya H 2012 Dependency Of Electrical Resistivity On The Temperature And
Composition Of Al-Cu Alloys Materials Research Innovations 16 (1) pp 224-229
[15] Kaya H Ccediladirli E Uumllgen A 2011 Investigation Of The Effect Of Composition On
Microhardness And Determination Of Thermo-Physical Properties In The Zn-Cu Alloys
Materialsamp Design 32 pp 900-906
[16] Trivedi R and Kurz W 1994 Int Mat Rev 39 pp49
[17] Yilmazer M İ Kaya H Aker A Engin S 2013 Influence Of The Growth Rate On
Physical Properties In The Aluminum-Antimony Eutectic Alloy International Journal of
Materials Engineering and Technology 9 pp 59-76
[18] Aker A Kaya H 2013 Measurements of Microstructural Mechanical Electrical and
Thermal Properties of an Al-Ni Alloy International Journal of Thermophyscics 34 (1)
pp 267-283
[19] Ourdjini A Liu J and Elliott R 1994 Eutectic spacing selection in the Al-Cu
system Mater Sci Tech-Lond 10 p312
[20] Kaya H Ccediladırlı E and Guumlnduumlz M 2007 Eutectic growth of unidirectionally solidified
bismuth-cadmium alloy J Mat Process Tech 183 p310
[21] Kaya H Ccediladırlı E and Guumlnduumlz M 2003 Effect of growth rates and temperature
gradients on the spacing and undercooling in the broken-lamellar eutectic growth (Sn-Zn
eutectic system) J Mat Eng Perf 12(4) p456
International Journal of Scientific and Technological Research wwwiisteorg ISSN 2422-8702 (Online) Vol 1 No10 2015
12 | P a g e wwwiisteorg
[22] Sergeev A and Mitin V 2000 Electron-phonon interaction in disordered conductors
Static and vibrating scattering potentialsPhys RevB 61 p6041
[23] Boekelheide Z Cooke DW Helgren E and Hellman F 2009 Resonant impurity
scattering and electron-phonon scattering in the electrical resistivity of Cr thin films
Phys Rev B p 80134426
[24] Rudnev V Loveless D Cook R Black M 2003 Handbook of Induction Heating
Markel Dekker Inc New York p 119
[25] Hultgren R Orr R L Anderson PD and Kelley KK 1963 Selected Values of
Thermodynamic Properties of Metals and Alloys (University of California Berkeley
Wiley p318-322
[26] Fan J Li X Su Y Guo J and Fu H 2010 The microstructure parameters and
microhardness of directionally solidified Ti-43Al-3Si alloy Journal of Alloys and
Compounds 506 593-599
[27] Steinbach S Ratke L 2007 Experimental study on interaction of fluid flow and
solidification in Al-Si-Cu alloys International Journal of Cast Metals Research 20 140-
144
[28] Boumlyuumlk U 2012 Physical and mechanical properties of AlndashSindashNi eutectic alloy Metals
and Materials International 18 (6) 933-938
International Journal of Scientific and Technological Research wwwiisteorg ISSN 2422-8702 (Online) Vol 1 No10 2015
2 | P a g e wwwiisteorg
It is known that the mechanical and electrical properties of metallic materials are affected by theirs
morphology The mechanical and electrical properties of directional solidified Albase alloys which
are important commercial materials have been reported in several investigations [14 15] but the results
differ from each other The microstructure evolution during solidification depends on the alloy
characteristics and primarily is a function of the temperature profiles at the solidification interface
When a eutectic or near-eutectic alloy is solidified the most frequently observed solid morphology is
regular or irregular lamellar eutectic microstructures [16] Microstructures are characterized by the
microstructure parameters Numerous solidification studies have been reported with a view to
characterizing the microstructure parameters as a function of growth rate (V) [17 18] Thus one of the aims of present work was to experimentally investigate the dependence of the flake spacings on the growth rate in the Al-Si-Sb ternary alloy and compare the results with the previous
experimental results for similar alloys The other aim of this work was to investigate the physical
properties of the Al-Si-Sb ternary alloy such as microhardness electrical resistivity enthalpy of fusion
and the specific heat
2 Experimental procedure
21 Sample production and microstructure observation
Alndash126wt Si-2wt Sb samples were prepared by melting weighed quantities of Al Si and Sb
(puritygt9999) in a graphite crucible placed into a vacuum melting furnace After allowing time for
melting homogeneously the molten alloy was poured into seven graphite crucibles (250 mm in length
4 mm inner diameter and 635 mm outer diameter) in a hot filling furnace Then each specimen was
positioned in a Bridgman-type furnace in a graphite cylinder (300 mm in length 10 mm inner diameter
and 40 mm outer diameter) After stabilizing the thermal conditions under argon atmosphere the
specimen was grown by pulling downwards at a constant rate by means of a synchronous motor
Samples were solidified under steady-state conditions with a constant temperature gradient of 804
Kmm in a wide range of growth rates (833-16545 ms) The quenched sample was removed from the graphite crucible and cut into lengths typically of 8 mm
The longitudinal and transverse sections were ground flat with SiC paper (180 500 1000 and 2500
grit) then grinded samples were cold mounted with epoxy-resin After polishing the samples were etched with 10vol HF+90vol H2O for 10-15 s After metallographic process the microstructures of
the samples were revealed The microstructures of samples were photographed from transverse section
with a LEO scanning electron microscopy (SEM) for different growth rates Typical images of growth
morphologies of directionally solidified Al-Si-Sb alloy were shown in Figure 1
22 Measurement of solidification parameters and interflake spacing
The temperature in the specimen was measured by using three K-type insulated thermocouples (025
mm in diameter) fixed within the sample with spacing of 10-20 mm All the thermocouplesrsquo ends were
connected to a measurement unit consisting of a data-logger and a computer The cooling rates were
recorded by using the data-logger via the computer during growth When the solid-liquid interface was
at the second thermocouple the temperature difference (T) between the first and the second
thermocouples was read from the data-logger record The temperature gradient (G =Tx) for each
sample was determined using the measured values of T and the known value of x (distance
difference of the thermocouples ends from buttom of the sample) The time (t) taken for the solid-
liquid interface passed through the thermocouples separated by known distances (x) was read from
data-logger record Thus the value of growth rate (V=xt) for each sample was determined using the
measured values of x and t The measurements of λ were made from the photographs of microstructures with a linear intersection method [19-22] The λ values on the transverse section were
more reliable than the longitudinal section of the sample So the λ values were measured from
transverse sections of the samples So the λ values were measured from transverse sections of the
samples The values of measured G V and are given in Table 1 and Figures1-2
23 Measurement of microhardness
The mechanical properties of any solidified material are usually determined by hardness test tensile
test etc Since true tensile strength testing of solidified alloys gave inconsistent results with a wide
scatter due to the strong dependence on the surface quality of solidified sample the mechanical
International Journal of Scientific and Technological Research wwwiisteorg ISSN 2422-8702 (Online) Vol 1 No10 2015
3 | P a g e wwwiisteorg
properties were monitored by hardness testing which was one of the easiest and most straightforward techniques
Figure 1 Micrographs of the directionally solidified Al-126wt Si-2wt Sb ternary alloy with a
constant temperature gradient of 804 Kmm showing the eutectic microstructure (a) V=833 ms
(b) 4185ms (c) V=16545 ms
International Journal of Scientific and Technological Research wwwiisteorg ISSN 2422-8702 (Online) Vol 1 No10 2015
4 | P a g e wwwiisteorg
5 6 8 15 20 30 40 50 60 80 150 20010 100
2
3
4
5
6
7
8
9
15
10
Inte
rfla
ke
spac
ings
(
m)
Growth rate V(ms)
=2369 V-043
Figure 2 Variation of interflakes spacings a function growth rate
The Vickers hardness (HV) is the ratio of a load applied to the indenter to the surface area of the
indentation This is given by
HV= 2Psin(θ2)d2
(1)
Microhardness measurements in this work were carried out using a DuraScan hardness measuring test
device using a 10-50 g load and dwell time of 10 s giving a typical indentation depth of 40-60 microm
which was significantly smaller than the original solidified samples Microhardness (HV) was
measured for at least 300 different regions on transverse The measured values of HV are also given in
Table 1 and the variations of microhardness with the solidification processing parameters are plotted and given in Figures 3a and 3b
Table 1 The values of solidification processing parameters microstructures microhardness ultimate
tensile strength and electrical resistivity for directionally solidified Al-Si-Sb ternary alloy and
relationships between them
G
(Kmm)
V
(ms)
(m)
HV
(kgmm2)
(MPa)
x10-5
( mm)
804
833 912 6022 7360 696
1623 724 6330 8020 735
4185 478 6704 8647 775
8235 342 6980 10210 820
16545 257 7202 11678 856
Relationships Constant (k) Correlation
coefficients (r)
International Journal of Scientific and Technological Research wwwiisteorg ISSN 2422-8702 (Online) Vol 1 No10 2015
5 | P a g e wwwiisteorg
=k1V-046
HV=k2V005
HV=k3
=k4V015
=k5-034
=k6V006
=k7-015
k1=2369(m146s-046)
k2=8073 (kg mm-205sn005)
k3=3208 (kg mm-187)
k4=14884(MPa mm-015 s015)
k5=15926(MPa mm034)
k6=969m094s006
k7=336mm115
r1 =0998
r2 =0996
r3 =0993
r4 =0980
r5=0984
r6=0998
r7=0996
International Journal of Scientific and Technological Research wwwiisteorg ISSN 2422-8702 (Online) Vol 1 No10 2015
6 | P a g e wwwiisteorg
Figure 3 (a) Variation of microhardness Hv and tensile strength σ as a function growth rate
(b) Variation of microhardness Hv and tensile strength σ as a function interflakes spacings
24 Determination of ultimate tensile strength (UTS)
Another aim of this work was to obtain the relationship between ultimate tensile strength (UTS) the
growth rate and interflake spacings in the Al-Si-Sb ternary alloy
The tests of tensile strength were performed at room temperature at a strain rate of 10-3 s-1 with a
Shimadzu AG-XD universal testing machine The data collected from the tensile test can be analysed
using the following formula to determine the strength ()
σ=FA (2)
where is the strength in N mm2 (or MPa) F is the applied force (N) A is the original cross sectional
area (mm2) of the sample The round rod tensile samples with diameter of 4 mm and gauge length of 50
mm were prepared from directionally solidified rod samples with different growth rates (V=833-
16545 ms) at a constant G (804 Kmm)
The tensile axis was chosen parallel to the growth direction of the sample UTS () values of Al-Si-Sb
alloy are shown in Figures 3a and 3b for V and values
25 Measurement of electrical resistivity
Another purpose of this investigation was to obtain the relationships among the growth rate dendritic
microstructures and electrical resistivity for the Al-Si-Sb samples The electrical resistivity of
directionally solidified samples was measured by the dc four-point probe method The four-point
probe method is the most widely used technique for electrical profile measurement of materials The method has proven to be a convenient tool for the resistivity measurement In this method the
materialrsquos resistivity can be expressed as
I
VRCF (3)
where RCF is resistivity correction factor V is the potential difference measured across the probes and
I is the current through the probes The geometry of the sample determines the correction factors that
must be used additionally the position of the probes on the sample and the spacings between the
probes The need for correction factors is caused by the proximity of a boundary which limits the
possible current paths in the sample The number of RCF is calculated by diameter of sample divided
by probe spacing (probe spacing being the distance between any two adjacent probes) In this study a
4mm diameter sample probed with a four point probe with 1mm tip spacing would have a correction
factor of 065
When a constant current was applied on the sample with a Keithley 2400 sourcemeter the potential
drops on the samples were measured with a Keithley 2700 multimeter connected to a computer
Platinum wire 05 mm in diameter was used to be the probes of current and potential
Two of the probes are used to source current and the other two probes are used to measure voltage
using four probes eliminates measurement errors due to the probe resistance the spreading resistance
under each probe and the contact resistance between each metal probe and material [23] The sizes of
samples were measured by using a digital micrometer has an accuracy of 1 μm The error in the
electrical resistivity measurements is calculated about 5 This error is due to current voltage and
temperature measurements
26 Determination of enthalpy and specific heat
International Journal of Scientific and Technological Research wwwiisteorg ISSN 2422-8702 (Online) Vol 1 No10 2015
7 | P a g e wwwiisteorg
The enthalpy of fusion (H) and the specific heat (Cp) of Al-Si-Sb alloy were determined because they
are very important parameters for industrial applications Differential scanning calorimeter (DSC)
thermal analysis (Perkin-Elmer Diamond model) was performed at 300-1200 K with a heating rate of
10 Kmin under a constant stream of nitrogen at atmospheric pressure
A reference material (a sapphire disk) was used in determining specific heat This reference data was
used to ldquocorrectrdquo sample data at every temperature The size of the signal which was used to calculate
the specific heat was proportional to the heating rate so it follows that faster heating rates will produce
larger signals which will give more accurate data However if the heating rate was too high the
temperature gradients in the sample would be large and this may introduce other errors in the
measurement It was normal to use heating rates between 5 and 20 Kmin The heating rate in this study
was 10 Kmin which was mostly recommended
The difference between the sample curve and the baseline curve was measured in milliwatts and
converted to specific heat as follows
Cp=(dQdt)(1MR) (4)
where dQdt is the heat flow M (g) the mass of the sample and R the heating rate Kmin
The DSC curve obtained for Al-Si-Sb alloy is shown in Figure 6 A sharp peak is clearly observed for
melting process as shown in Figure 6 The enthalpy of fusion (H) and specific heat (Cp) were
calculated as the area under the peak by numerical integration
3 Results and discussion
31 Effect of growth rate on the inter flake spacing
Variations of inter flake spacings ()with the growth rate (V) at a constant G (804 Kmm) is given in
Figure 2 and Table 1 The variation of versus V can be given the proportionality equation as
n
kV
(5)
where k is a constant and n an exponent value of growth rate The relationships between the flakes
spacing and growth rates were determined as λ=2369 V-043
by using linear regression analysis The
exponent value 043 is in good agreement with the range values of 039-047 obtained by different
researchers [61014172425]
32 Dependence of microhardness and ultimate tensile strength on growth rate
One of the purposes of this investigation is to obtain the dependence of HV on V and It can be seen
from Table 1 that an increase in the temperature gradient and growth rate leads to an increase in the
microhardness Dependence of the HV on the V and were determined by using linear regression
analysis and the relationship between them can be expressed by the following equations as
bVHV2
k
(6)
cHV
3k
(7)
where k2 and k3 are constant b and c are the exponent values of the growth rate and flake spacing
respectively As can be seen from Figures 3a and 3b the microhardness values increase with the
increasing V values and decreasing with the increasing values
Linear regression analysis yields
HV =8073V005 (8)
HV = 3208 λ-013 (9)
The average exponent values of V and for HV in the directionally solidified Al-Si-Sb alloy were
found to be 005 and 013 respectively in this work These exponent values relating to V and
obtained in present work is generally in a good agreement with the exponent values obtained in
previous experimental works [17 21-22 26] under similar solidification conditions
International Journal of Scientific and Technological Research wwwiisteorg ISSN 2422-8702 (Online) Vol 1 No10 2015
8 | P a g e wwwiisteorg
Typical strength-strain curves of Al-Si-Sb alloy are shown in Figure 3 for V and values As can bee
seen from Figure 3 ultimate tensile strengthUTS ) values are increased with increasing V but
eutectic spacings values are increased ultimate tensile strengthdecreased
Figures 3a and 3b show the variation of the UTS () with the growth rate (V) and interflake spacings
The dependence of on V and can be represented as
σ = k4Vd (10)
σ = k5e (11)
As can be seen from Figure 3a the values of increase with increasing growth rate The exponent
value of V is found to be 016 and value of is found to be 037 (Figure 3b)
34 Electrical properties of Al-Si-Sb ternary alloy
It can be seen from Table 1 temperature gradient and growth rate lead to an increase in the electrical
resistivity Dependence of the electrical resistivity on growth rate and interflake spacings can be
expressed as
=k6Vf (12)
=k7g (13)
where k6 and k7 are constants which can be experimentally determined and given in Table 1 The value
of the exponent relating to the growth rate and eutectic spacings were obtained to be 006 and 015
respectively (Figure 4)
International Journal of Scientific and Technological Research wwwiisteorg ISSN 2422-8702 (Online) Vol 1 No10 2015
9 | P a g e wwwiisteorg
Figure 4 (a) Variation of electrical resistivity as a function growth rate
(b) Variation of electrical resistivity as a function interflake spacings
The variation of electrical resistivity with the temperature in the range of 300ndash450 K was measured
(see Figure 5) It is observed that an increase in the temperature (300ndash450 K) values lead to increase in
the electrical resistivity values (639ndash992)10-5 mm
As can be seen from Figure 5 the electrical resistivity values (639ndash99210-5 mm) in this work are
some higher than the values (275ndash87510-5 mm) for pure aluminum and smaller than the values
(413ndash11010-5 mm) for pure antimony [27]
Figure 5 Variation of electrical resistivity as a function temperature for Al-Si-Sb ternary alloy
35 The thermal properties of Al-Si-Sb alloy
The AlndashSi-Sb alloy was heated with a heating rate of 10 Kmin from room temperature to 1200 K by
using a Perkin Elmer Diamond model DSC and the heat flow versus temperature is given in Figure 6
As can be seen from Figure 6 the melting temperature of Al-Si-Sb eutectic was found to be 86637 K
The values of the enthalpy of fusion and the specific heat were also calculated to be 28260 Jg and
0326 J(gK) respectively from the graph of the heat flow vs temperature The recommended values of
the enthalpy of fusion for pure Al Si Sb and Al-Si eutectic are 39696 Jg 29783 Jg 161 Jg and
4682 Jg respectively and also the specific heat values for pure Al Si Sb and Al-Si eutectic are 0879
JgK 0210 JgK 021 JgK and 00563 JgK in respectively [28 29] at the melting temperature The
International Journal of Scientific and Technological Research wwwiisteorg ISSN 2422-8702 (Online) Vol 1 No10 2015
10 | P a g e wwwiisteorg
H value (28260 Jg) is smaller and the Cp values (0326 JgK) is same higher than the values of pure
Al Si Sb and Al-Si eutectic
Figure 6 Heat flow curve vs the temperature for Al-Si-Sb ternary alloy at heating rate of 10 Kmin
4 Conclusions
The principal results in this work can be summarized as follows
1 Experimental observations show that the values of flake spacings () decreases as growth rate (V)
increases The relationships between and V have been obtained to be λ=2369 V-043
2 It was found that the values of HV increase with increasing the values of V but the values of the HV
descrease with increasing the values of The establishment of the relationships among HV V and
can be given as HV=5336V015 and HV= 8219 λ -013
3 The experimental expressions correlating the values of ultimate tensile strength) with the values
of V and shows that the values of the tensile stresses increase with increasing the values of V and
the values of the tensile stresses descrease with increasing the values of The establishment of the
relationships among stresses () and solidification parameters (V and G) can be given as σ
=5220(V) 015 and σ =15656(λ) -034
4 Experimental results show that the values of electrical resistivity () increases with increasing V
values but the values of descrease with increasing the values of The relationships between
and V and have been obtained to be ρ=603x10-8 (V)006 and ρ=989x10-8 ()-015
5 The electrical resistivity of Al-Si-Sb alloy increases (639ndash992)10-5 mm with increasing
temperature (300-450 K)
6 From the plot of heat flow vs temperature the melting temperature enthalpy of fusion and
specific heat are found to be 86637 K 28260 Jg and 0326 J(gK) respectively
References
[1] Yang F Peng L and Okazaki K 2004 Microindentation of aluminum MetMat
Trans 35A p3323
[2] Ping Wu S Liu DR Guo JJ Su YQ and Fu H Z 2007 Influence of process
parameters on CET in TindashAl alloy ingot with consideration of shrinkage cavity
formation A computer simulation J Alloys and Comp 441 p 267
International Journal of Scientific and Technological Research wwwiisteorg ISSN 2422-8702 (Online) Vol 1 No10 2015
11 | P a g e wwwiisteorg
[3] Yang F Peng L and Okazaki K 2004 Microindentation of aluminum Met Mat
Trans A35 p3323
[4] Goulart P R Spinelli J E Osoacuterio W R Garcia A 2006 Mat Sci Eng A 421
p245
[5] Goumlgebakan M Uzun O Karaaslan T Keskin M 2003 Rapidly solidified Alndash65
wt Ni alloy J Mat Proc Tech 142 p87
[6] Kaya H Guumlnduumlz M Ccediladırlı E Uzun O 2004 Effect of growth rate and lamellar
spacing on microhardness in the directionally solidified Pb-Cd Sn-Zn and Bi-Cd
eutectic alloys JMat Sci 39 p6571
[7] Kaya H Ccediladırlı E Guumlnduumlz M Uumllgen A 2003 Effect of the temperature gradient growth
rate and the interflake spacing on the microhardness in the directionally solidified Al-
Si eutectic alloy JMatEng Perf 12 p 544
[8] Kaya H Ccediladırlı E Boumlyuumlk U and Maraşlı N 2008 Variation of microindentation
hardness with solidification and microstructure parameters in the Al based alloys Appl
Surf Sci 255 p3071
[9] Engin S Boumlyuumlk U Kaya H Maraşlı N 2011 Directional solidification and
phiycsal properties measurements of the zinc-aluminum eutectic alloy I J Min Met
Mat 18(6) p 659
[10] Boumlyuumlk U Maraşlı N Ccediladırlı E Kaya H Keşlioğlu K 2012 Variations of
microhardness with solidification parameters and electrical resistivity with temperature
for Al-Cu-Ag eutectic alloy Current Applied Physics 12 p7
[11] Wang E R Hui X D Wang S S Zhao Y F Chen G L 2010 Improved
mechanical properties in cast Al-Si alloys by combined alloying of Fe and Cu
Materials Science and Engineering A 527 pp 7878-7884
[12] Samuel A M Samuel F H Doty H W 1996 Observation on the formation szlig-
Al5FeSi phase in 319 type Al-Si alloys Journal of Materials Science 31 pp 5529-
5539
[13] Lu L Dahle AK 2006 Mater Sci Eng A 435ndash436 pp 288ndash296
[14] Kaya H 2012 Dependency Of Electrical Resistivity On The Temperature And
Composition Of Al-Cu Alloys Materials Research Innovations 16 (1) pp 224-229
[15] Kaya H Ccediladirli E Uumllgen A 2011 Investigation Of The Effect Of Composition On
Microhardness And Determination Of Thermo-Physical Properties In The Zn-Cu Alloys
Materialsamp Design 32 pp 900-906
[16] Trivedi R and Kurz W 1994 Int Mat Rev 39 pp49
[17] Yilmazer M İ Kaya H Aker A Engin S 2013 Influence Of The Growth Rate On
Physical Properties In The Aluminum-Antimony Eutectic Alloy International Journal of
Materials Engineering and Technology 9 pp 59-76
[18] Aker A Kaya H 2013 Measurements of Microstructural Mechanical Electrical and
Thermal Properties of an Al-Ni Alloy International Journal of Thermophyscics 34 (1)
pp 267-283
[19] Ourdjini A Liu J and Elliott R 1994 Eutectic spacing selection in the Al-Cu
system Mater Sci Tech-Lond 10 p312
[20] Kaya H Ccediladırlı E and Guumlnduumlz M 2007 Eutectic growth of unidirectionally solidified
bismuth-cadmium alloy J Mat Process Tech 183 p310
[21] Kaya H Ccediladırlı E and Guumlnduumlz M 2003 Effect of growth rates and temperature
gradients on the spacing and undercooling in the broken-lamellar eutectic growth (Sn-Zn
eutectic system) J Mat Eng Perf 12(4) p456
International Journal of Scientific and Technological Research wwwiisteorg ISSN 2422-8702 (Online) Vol 1 No10 2015
12 | P a g e wwwiisteorg
[22] Sergeev A and Mitin V 2000 Electron-phonon interaction in disordered conductors
Static and vibrating scattering potentialsPhys RevB 61 p6041
[23] Boekelheide Z Cooke DW Helgren E and Hellman F 2009 Resonant impurity
scattering and electron-phonon scattering in the electrical resistivity of Cr thin films
Phys Rev B p 80134426
[24] Rudnev V Loveless D Cook R Black M 2003 Handbook of Induction Heating
Markel Dekker Inc New York p 119
[25] Hultgren R Orr R L Anderson PD and Kelley KK 1963 Selected Values of
Thermodynamic Properties of Metals and Alloys (University of California Berkeley
Wiley p318-322
[26] Fan J Li X Su Y Guo J and Fu H 2010 The microstructure parameters and
microhardness of directionally solidified Ti-43Al-3Si alloy Journal of Alloys and
Compounds 506 593-599
[27] Steinbach S Ratke L 2007 Experimental study on interaction of fluid flow and
solidification in Al-Si-Cu alloys International Journal of Cast Metals Research 20 140-
144
[28] Boumlyuumlk U 2012 Physical and mechanical properties of AlndashSindashNi eutectic alloy Metals
and Materials International 18 (6) 933-938

International Journal of Scientific and Technological Research wwwiisteorg ISSN 2422-8702 (Online) Vol 1 No10 2015
4 | P a g e wwwiisteorg
5 6 8 15 20 30 40 50 60 80 150 20010 100
2
3
4
5
6
7
8
9
15
10
Inte
rfla
ke
spac
ings
(
m)
Growth rate V(ms)
=2369 V-043
Figure 2 Variation of interflakes spacings a function growth rate
The Vickers hardness (HV) is the ratio of a load applied to the indenter to the surface area of the
indentation This is given by
HV= 2Psin(θ2)d2
(1)
Microhardness measurements in this work were carried out using a DuraScan hardness measuring test
device using a 10-50 g load and dwell time of 10 s giving a typical indentation depth of 40-60 microm
which was significantly smaller than the original solidified samples Microhardness (HV) was
measured for at least 300 different regions on transverse The measured values of HV are also given in
Table 1 and the variations of microhardness with the solidification processing parameters are plotted and given in Figures 3a and 3b
Table 1 The values of solidification processing parameters microstructures microhardness ultimate
tensile strength and electrical resistivity for directionally solidified Al-Si-Sb ternary alloy and
relationships between them
G
(Kmm)
V
(ms)
(m)
HV
(kgmm2)
(MPa)
x10-5
( mm)
804
833 912 6022 7360 696
1623 724 6330 8020 735
4185 478 6704 8647 775
8235 342 6980 10210 820
16545 257 7202 11678 856
Relationships Constant (k) Correlation
coefficients (r)
International Journal of Scientific and Technological Research wwwiisteorg ISSN 2422-8702 (Online) Vol 1 No10 2015
5 | P a g e wwwiisteorg
=k1V-046
HV=k2V005
HV=k3
=k4V015
=k5-034
=k6V006
=k7-015
k1=2369(m146s-046)
k2=8073 (kg mm-205sn005)
k3=3208 (kg mm-187)
k4=14884(MPa mm-015 s015)
k5=15926(MPa mm034)
k6=969m094s006
k7=336mm115
r1 =0998
r2 =0996
r3 =0993
r4 =0980
r5=0984
r6=0998
r7=0996
International Journal of Scientific and Technological Research wwwiisteorg ISSN 2422-8702 (Online) Vol 1 No10 2015
6 | P a g e wwwiisteorg
Figure 3 (a) Variation of microhardness Hv and tensile strength σ as a function growth rate
(b) Variation of microhardness Hv and tensile strength σ as a function interflakes spacings
24 Determination of ultimate tensile strength (UTS)
Another aim of this work was to obtain the relationship between ultimate tensile strength (UTS) the
growth rate and interflake spacings in the Al-Si-Sb ternary alloy
The tests of tensile strength were performed at room temperature at a strain rate of 10-3 s-1 with a
Shimadzu AG-XD universal testing machine The data collected from the tensile test can be analysed
using the following formula to determine the strength ()
σ=FA (2)
where is the strength in N mm2 (or MPa) F is the applied force (N) A is the original cross sectional
area (mm2) of the sample The round rod tensile samples with diameter of 4 mm and gauge length of 50
mm were prepared from directionally solidified rod samples with different growth rates (V=833-
16545 ms) at a constant G (804 Kmm)
The tensile axis was chosen parallel to the growth direction of the sample UTS () values of Al-Si-Sb
alloy are shown in Figures 3a and 3b for V and values
25 Measurement of electrical resistivity
Another purpose of this investigation was to obtain the relationships among the growth rate dendritic
microstructures and electrical resistivity for the Al-Si-Sb samples The electrical resistivity of
directionally solidified samples was measured by the dc four-point probe method The four-point
probe method is the most widely used technique for electrical profile measurement of materials The method has proven to be a convenient tool for the resistivity measurement In this method the
materialrsquos resistivity can be expressed as
I
VRCF (3)
where RCF is resistivity correction factor V is the potential difference measured across the probes and
I is the current through the probes The geometry of the sample determines the correction factors that
must be used additionally the position of the probes on the sample and the spacings between the
probes The need for correction factors is caused by the proximity of a boundary which limits the
possible current paths in the sample The number of RCF is calculated by diameter of sample divided
by probe spacing (probe spacing being the distance between any two adjacent probes) In this study a
4mm diameter sample probed with a four point probe with 1mm tip spacing would have a correction
factor of 065
When a constant current was applied on the sample with a Keithley 2400 sourcemeter the potential
drops on the samples were measured with a Keithley 2700 multimeter connected to a computer
Platinum wire 05 mm in diameter was used to be the probes of current and potential
Two of the probes are used to source current and the other two probes are used to measure voltage
using four probes eliminates measurement errors due to the probe resistance the spreading resistance
under each probe and the contact resistance between each metal probe and material [23] The sizes of
samples were measured by using a digital micrometer has an accuracy of 1 μm The error in the
electrical resistivity measurements is calculated about 5 This error is due to current voltage and
temperature measurements
26 Determination of enthalpy and specific heat
International Journal of Scientific and Technological Research wwwiisteorg ISSN 2422-8702 (Online) Vol 1 No10 2015
7 | P a g e wwwiisteorg
The enthalpy of fusion (H) and the specific heat (Cp) of Al-Si-Sb alloy were determined because they
are very important parameters for industrial applications Differential scanning calorimeter (DSC)
thermal analysis (Perkin-Elmer Diamond model) was performed at 300-1200 K with a heating rate of
10 Kmin under a constant stream of nitrogen at atmospheric pressure
A reference material (a sapphire disk) was used in determining specific heat This reference data was
used to ldquocorrectrdquo sample data at every temperature The size of the signal which was used to calculate
the specific heat was proportional to the heating rate so it follows that faster heating rates will produce
larger signals which will give more accurate data However if the heating rate was too high the
temperature gradients in the sample would be large and this may introduce other errors in the
measurement It was normal to use heating rates between 5 and 20 Kmin The heating rate in this study
was 10 Kmin which was mostly recommended
The difference between the sample curve and the baseline curve was measured in milliwatts and
converted to specific heat as follows
Cp=(dQdt)(1MR) (4)
where dQdt is the heat flow M (g) the mass of the sample and R the heating rate Kmin
The DSC curve obtained for Al-Si-Sb alloy is shown in Figure 6 A sharp peak is clearly observed for
melting process as shown in Figure 6 The enthalpy of fusion (H) and specific heat (Cp) were
calculated as the area under the peak by numerical integration
3 Results and discussion
31 Effect of growth rate on the inter flake spacing
Variations of inter flake spacings ()with the growth rate (V) at a constant G (804 Kmm) is given in
Figure 2 and Table 1 The variation of versus V can be given the proportionality equation as
n
kV
(5)
where k is a constant and n an exponent value of growth rate The relationships between the flakes
spacing and growth rates were determined as λ=2369 V-043
by using linear regression analysis The
exponent value 043 is in good agreement with the range values of 039-047 obtained by different
researchers [61014172425]
32 Dependence of microhardness and ultimate tensile strength on growth rate
One of the purposes of this investigation is to obtain the dependence of HV on V and It can be seen
from Table 1 that an increase in the temperature gradient and growth rate leads to an increase in the
microhardness Dependence of the HV on the V and were determined by using linear regression
analysis and the relationship between them can be expressed by the following equations as
bVHV2
k
(6)
cHV
3k
(7)
where k2 and k3 are constant b and c are the exponent values of the growth rate and flake spacing
respectively As can be seen from Figures 3a and 3b the microhardness values increase with the
increasing V values and decreasing with the increasing values
Linear regression analysis yields
HV =8073V005 (8)
HV = 3208 λ-013 (9)
The average exponent values of V and for HV in the directionally solidified Al-Si-Sb alloy were
found to be 005 and 013 respectively in this work These exponent values relating to V and
obtained in present work is generally in a good agreement with the exponent values obtained in
previous experimental works [17 21-22 26] under similar solidification conditions
International Journal of Scientific and Technological Research wwwiisteorg ISSN 2422-8702 (Online) Vol 1 No10 2015
8 | P a g e wwwiisteorg
Typical strength-strain curves of Al-Si-Sb alloy are shown in Figure 3 for V and values As can bee
seen from Figure 3 ultimate tensile strengthUTS ) values are increased with increasing V but
eutectic spacings values are increased ultimate tensile strengthdecreased
Figures 3a and 3b show the variation of the UTS () with the growth rate (V) and interflake spacings
The dependence of on V and can be represented as
σ = k4Vd (10)
σ = k5e (11)
As can be seen from Figure 3a the values of increase with increasing growth rate The exponent
value of V is found to be 016 and value of is found to be 037 (Figure 3b)
34 Electrical properties of Al-Si-Sb ternary alloy
It can be seen from Table 1 temperature gradient and growth rate lead to an increase in the electrical
resistivity Dependence of the electrical resistivity on growth rate and interflake spacings can be
expressed as
=k6Vf (12)
=k7g (13)
where k6 and k7 are constants which can be experimentally determined and given in Table 1 The value
of the exponent relating to the growth rate and eutectic spacings were obtained to be 006 and 015
respectively (Figure 4)
International Journal of Scientific and Technological Research wwwiisteorg ISSN 2422-8702 (Online) Vol 1 No10 2015
9 | P a g e wwwiisteorg
Figure 4 (a) Variation of electrical resistivity as a function growth rate
(b) Variation of electrical resistivity as a function interflake spacings
The variation of electrical resistivity with the temperature in the range of 300ndash450 K was measured
(see Figure 5) It is observed that an increase in the temperature (300ndash450 K) values lead to increase in
the electrical resistivity values (639ndash992)10-5 mm
As can be seen from Figure 5 the electrical resistivity values (639ndash99210-5 mm) in this work are
some higher than the values (275ndash87510-5 mm) for pure aluminum and smaller than the values
(413ndash11010-5 mm) for pure antimony [27]
Figure 5 Variation of electrical resistivity as a function temperature for Al-Si-Sb ternary alloy
35 The thermal properties of Al-Si-Sb alloy
The AlndashSi-Sb alloy was heated with a heating rate of 10 Kmin from room temperature to 1200 K by
using a Perkin Elmer Diamond model DSC and the heat flow versus temperature is given in Figure 6
As can be seen from Figure 6 the melting temperature of Al-Si-Sb eutectic was found to be 86637 K
The values of the enthalpy of fusion and the specific heat were also calculated to be 28260 Jg and
0326 J(gK) respectively from the graph of the heat flow vs temperature The recommended values of
the enthalpy of fusion for pure Al Si Sb and Al-Si eutectic are 39696 Jg 29783 Jg 161 Jg and
4682 Jg respectively and also the specific heat values for pure Al Si Sb and Al-Si eutectic are 0879
JgK 0210 JgK 021 JgK and 00563 JgK in respectively [28 29] at the melting temperature The
International Journal of Scientific and Technological Research wwwiisteorg ISSN 2422-8702 (Online) Vol 1 No10 2015
10 | P a g e wwwiisteorg
H value (28260 Jg) is smaller and the Cp values (0326 JgK) is same higher than the values of pure
Al Si Sb and Al-Si eutectic
Figure 6 Heat flow curve vs the temperature for Al-Si-Sb ternary alloy at heating rate of 10 Kmin
4 Conclusions
The principal results in this work can be summarized as follows
1 Experimental observations show that the values of flake spacings () decreases as growth rate (V)
increases The relationships between and V have been obtained to be λ=2369 V-043
2 It was found that the values of HV increase with increasing the values of V but the values of the HV
descrease with increasing the values of The establishment of the relationships among HV V and
can be given as HV=5336V015 and HV= 8219 λ -013
3 The experimental expressions correlating the values of ultimate tensile strength) with the values
of V and shows that the values of the tensile stresses increase with increasing the values of V and
the values of the tensile stresses descrease with increasing the values of The establishment of the
relationships among stresses () and solidification parameters (V and G) can be given as σ
=5220(V) 015 and σ =15656(λ) -034
4 Experimental results show that the values of electrical resistivity () increases with increasing V
values but the values of descrease with increasing the values of The relationships between
and V and have been obtained to be ρ=603x10-8 (V)006 and ρ=989x10-8 ()-015
5 The electrical resistivity of Al-Si-Sb alloy increases (639ndash992)10-5 mm with increasing
temperature (300-450 K)
6 From the plot of heat flow vs temperature the melting temperature enthalpy of fusion and
specific heat are found to be 86637 K 28260 Jg and 0326 J(gK) respectively
References
[1] Yang F Peng L and Okazaki K 2004 Microindentation of aluminum MetMat
Trans 35A p3323
[2] Ping Wu S Liu DR Guo JJ Su YQ and Fu H Z 2007 Influence of process
parameters on CET in TindashAl alloy ingot with consideration of shrinkage cavity
formation A computer simulation J Alloys and Comp 441 p 267
International Journal of Scientific and Technological Research wwwiisteorg ISSN 2422-8702 (Online) Vol 1 No10 2015
11 | P a g e wwwiisteorg
[3] Yang F Peng L and Okazaki K 2004 Microindentation of aluminum Met Mat
Trans A35 p3323
[4] Goulart P R Spinelli J E Osoacuterio W R Garcia A 2006 Mat Sci Eng A 421
p245
[5] Goumlgebakan M Uzun O Karaaslan T Keskin M 2003 Rapidly solidified Alndash65
wt Ni alloy J Mat Proc Tech 142 p87
[6] Kaya H Guumlnduumlz M Ccediladırlı E Uzun O 2004 Effect of growth rate and lamellar
spacing on microhardness in the directionally solidified Pb-Cd Sn-Zn and Bi-Cd
eutectic alloys JMat Sci 39 p6571
[7] Kaya H Ccediladırlı E Guumlnduumlz M Uumllgen A 2003 Effect of the temperature gradient growth
rate and the interflake spacing on the microhardness in the directionally solidified Al-
Si eutectic alloy JMatEng Perf 12 p 544
[8] Kaya H Ccediladırlı E Boumlyuumlk U and Maraşlı N 2008 Variation of microindentation
hardness with solidification and microstructure parameters in the Al based alloys Appl
Surf Sci 255 p3071
[9] Engin S Boumlyuumlk U Kaya H Maraşlı N 2011 Directional solidification and
phiycsal properties measurements of the zinc-aluminum eutectic alloy I J Min Met
Mat 18(6) p 659
[10] Boumlyuumlk U Maraşlı N Ccediladırlı E Kaya H Keşlioğlu K 2012 Variations of
microhardness with solidification parameters and electrical resistivity with temperature
for Al-Cu-Ag eutectic alloy Current Applied Physics 12 p7
[11] Wang E R Hui X D Wang S S Zhao Y F Chen G L 2010 Improved
mechanical properties in cast Al-Si alloys by combined alloying of Fe and Cu
Materials Science and Engineering A 527 pp 7878-7884
[12] Samuel A M Samuel F H Doty H W 1996 Observation on the formation szlig-
Al5FeSi phase in 319 type Al-Si alloys Journal of Materials Science 31 pp 5529-
5539
[13] Lu L Dahle AK 2006 Mater Sci Eng A 435ndash436 pp 288ndash296
[14] Kaya H 2012 Dependency Of Electrical Resistivity On The Temperature And
Composition Of Al-Cu Alloys Materials Research Innovations 16 (1) pp 224-229
[15] Kaya H Ccediladirli E Uumllgen A 2011 Investigation Of The Effect Of Composition On
Microhardness And Determination Of Thermo-Physical Properties In The Zn-Cu Alloys
Materialsamp Design 32 pp 900-906
[16] Trivedi R and Kurz W 1994 Int Mat Rev 39 pp49
[17] Yilmazer M İ Kaya H Aker A Engin S 2013 Influence Of The Growth Rate On
Physical Properties In The Aluminum-Antimony Eutectic Alloy International Journal of
Materials Engineering and Technology 9 pp 59-76
[18] Aker A Kaya H 2013 Measurements of Microstructural Mechanical Electrical and
Thermal Properties of an Al-Ni Alloy International Journal of Thermophyscics 34 (1)
pp 267-283
[19] Ourdjini A Liu J and Elliott R 1994 Eutectic spacing selection in the Al-Cu
system Mater Sci Tech-Lond 10 p312
[20] Kaya H Ccediladırlı E and Guumlnduumlz M 2007 Eutectic growth of unidirectionally solidified
bismuth-cadmium alloy J Mat Process Tech 183 p310
[21] Kaya H Ccediladırlı E and Guumlnduumlz M 2003 Effect of growth rates and temperature
gradients on the spacing and undercooling in the broken-lamellar eutectic growth (Sn-Zn
eutectic system) J Mat Eng Perf 12(4) p456
International Journal of Scientific and Technological Research wwwiisteorg ISSN 2422-8702 (Online) Vol 1 No10 2015
12 | P a g e wwwiisteorg
[22] Sergeev A and Mitin V 2000 Electron-phonon interaction in disordered conductors
Static and vibrating scattering potentialsPhys RevB 61 p6041
[23] Boekelheide Z Cooke DW Helgren E and Hellman F 2009 Resonant impurity
scattering and electron-phonon scattering in the electrical resistivity of Cr thin films
Phys Rev B p 80134426
[24] Rudnev V Loveless D Cook R Black M 2003 Handbook of Induction Heating
Markel Dekker Inc New York p 119
[25] Hultgren R Orr R L Anderson PD and Kelley KK 1963 Selected Values of
Thermodynamic Properties of Metals and Alloys (University of California Berkeley
Wiley p318-322
[26] Fan J Li X Su Y Guo J and Fu H 2010 The microstructure parameters and
microhardness of directionally solidified Ti-43Al-3Si alloy Journal of Alloys and
Compounds 506 593-599
[27] Steinbach S Ratke L 2007 Experimental study on interaction of fluid flow and
solidification in Al-Si-Cu alloys International Journal of Cast Metals Research 20 140-
144
[28] Boumlyuumlk U 2012 Physical and mechanical properties of AlndashSindashNi eutectic alloy Metals
and Materials International 18 (6) 933-938
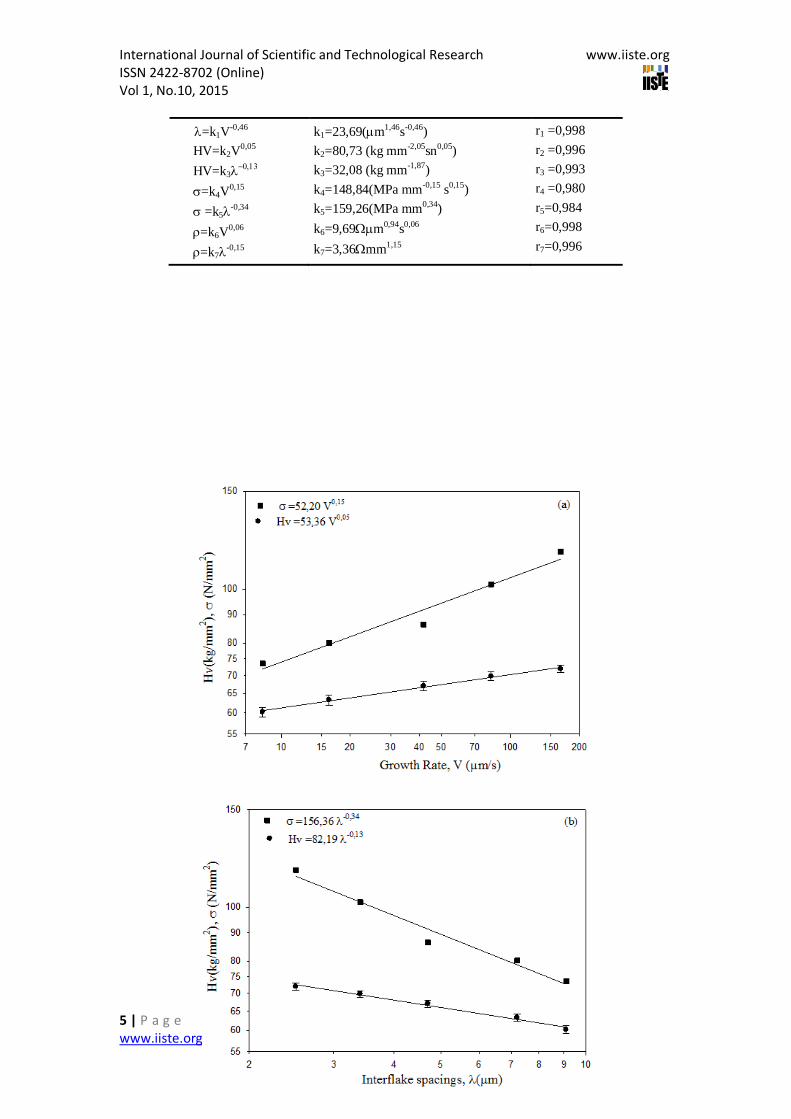
International Journal of Scientific and Technological Research wwwiisteorg ISSN 2422-8702 (Online) Vol 1 No10 2015
5 | P a g e wwwiisteorg
=k1V-046
HV=k2V005
HV=k3
=k4V015
=k5-034
=k6V006
=k7-015
k1=2369(m146s-046)
k2=8073 (kg mm-205sn005)
k3=3208 (kg mm-187)
k4=14884(MPa mm-015 s015)
k5=15926(MPa mm034)
k6=969m094s006
k7=336mm115
r1 =0998
r2 =0996
r3 =0993
r4 =0980
r5=0984
r6=0998
r7=0996
International Journal of Scientific and Technological Research wwwiisteorg ISSN 2422-8702 (Online) Vol 1 No10 2015
6 | P a g e wwwiisteorg
Figure 3 (a) Variation of microhardness Hv and tensile strength σ as a function growth rate
(b) Variation of microhardness Hv and tensile strength σ as a function interflakes spacings
24 Determination of ultimate tensile strength (UTS)
Another aim of this work was to obtain the relationship between ultimate tensile strength (UTS) the
growth rate and interflake spacings in the Al-Si-Sb ternary alloy
The tests of tensile strength were performed at room temperature at a strain rate of 10-3 s-1 with a
Shimadzu AG-XD universal testing machine The data collected from the tensile test can be analysed
using the following formula to determine the strength ()
σ=FA (2)
where is the strength in N mm2 (or MPa) F is the applied force (N) A is the original cross sectional
area (mm2) of the sample The round rod tensile samples with diameter of 4 mm and gauge length of 50
mm were prepared from directionally solidified rod samples with different growth rates (V=833-
16545 ms) at a constant G (804 Kmm)
The tensile axis was chosen parallel to the growth direction of the sample UTS () values of Al-Si-Sb
alloy are shown in Figures 3a and 3b for V and values
25 Measurement of electrical resistivity
Another purpose of this investigation was to obtain the relationships among the growth rate dendritic
microstructures and electrical resistivity for the Al-Si-Sb samples The electrical resistivity of
directionally solidified samples was measured by the dc four-point probe method The four-point
probe method is the most widely used technique for electrical profile measurement of materials The method has proven to be a convenient tool for the resistivity measurement In this method the
materialrsquos resistivity can be expressed as
I
VRCF (3)
where RCF is resistivity correction factor V is the potential difference measured across the probes and
I is the current through the probes The geometry of the sample determines the correction factors that
must be used additionally the position of the probes on the sample and the spacings between the
probes The need for correction factors is caused by the proximity of a boundary which limits the
possible current paths in the sample The number of RCF is calculated by diameter of sample divided
by probe spacing (probe spacing being the distance between any two adjacent probes) In this study a
4mm diameter sample probed with a four point probe with 1mm tip spacing would have a correction
factor of 065
When a constant current was applied on the sample with a Keithley 2400 sourcemeter the potential
drops on the samples were measured with a Keithley 2700 multimeter connected to a computer
Platinum wire 05 mm in diameter was used to be the probes of current and potential
Two of the probes are used to source current and the other two probes are used to measure voltage
using four probes eliminates measurement errors due to the probe resistance the spreading resistance
under each probe and the contact resistance between each metal probe and material [23] The sizes of
samples were measured by using a digital micrometer has an accuracy of 1 μm The error in the
electrical resistivity measurements is calculated about 5 This error is due to current voltage and
temperature measurements
26 Determination of enthalpy and specific heat
International Journal of Scientific and Technological Research wwwiisteorg ISSN 2422-8702 (Online) Vol 1 No10 2015
7 | P a g e wwwiisteorg
The enthalpy of fusion (H) and the specific heat (Cp) of Al-Si-Sb alloy were determined because they
are very important parameters for industrial applications Differential scanning calorimeter (DSC)
thermal analysis (Perkin-Elmer Diamond model) was performed at 300-1200 K with a heating rate of
10 Kmin under a constant stream of nitrogen at atmospheric pressure
A reference material (a sapphire disk) was used in determining specific heat This reference data was
used to ldquocorrectrdquo sample data at every temperature The size of the signal which was used to calculate
the specific heat was proportional to the heating rate so it follows that faster heating rates will produce
larger signals which will give more accurate data However if the heating rate was too high the
temperature gradients in the sample would be large and this may introduce other errors in the
measurement It was normal to use heating rates between 5 and 20 Kmin The heating rate in this study
was 10 Kmin which was mostly recommended
The difference between the sample curve and the baseline curve was measured in milliwatts and
converted to specific heat as follows
Cp=(dQdt)(1MR) (4)
where dQdt is the heat flow M (g) the mass of the sample and R the heating rate Kmin
The DSC curve obtained for Al-Si-Sb alloy is shown in Figure 6 A sharp peak is clearly observed for
melting process as shown in Figure 6 The enthalpy of fusion (H) and specific heat (Cp) were
calculated as the area under the peak by numerical integration
3 Results and discussion
31 Effect of growth rate on the inter flake spacing
Variations of inter flake spacings ()with the growth rate (V) at a constant G (804 Kmm) is given in
Figure 2 and Table 1 The variation of versus V can be given the proportionality equation as
n
kV
(5)
where k is a constant and n an exponent value of growth rate The relationships between the flakes
spacing and growth rates were determined as λ=2369 V-043
by using linear regression analysis The
exponent value 043 is in good agreement with the range values of 039-047 obtained by different
researchers [61014172425]
32 Dependence of microhardness and ultimate tensile strength on growth rate
One of the purposes of this investigation is to obtain the dependence of HV on V and It can be seen
from Table 1 that an increase in the temperature gradient and growth rate leads to an increase in the
microhardness Dependence of the HV on the V and were determined by using linear regression
analysis and the relationship between them can be expressed by the following equations as
bVHV2
k
(6)
cHV
3k
(7)
where k2 and k3 are constant b and c are the exponent values of the growth rate and flake spacing
respectively As can be seen from Figures 3a and 3b the microhardness values increase with the
increasing V values and decreasing with the increasing values
Linear regression analysis yields
HV =8073V005 (8)
HV = 3208 λ-013 (9)
The average exponent values of V and for HV in the directionally solidified Al-Si-Sb alloy were
found to be 005 and 013 respectively in this work These exponent values relating to V and
obtained in present work is generally in a good agreement with the exponent values obtained in
previous experimental works [17 21-22 26] under similar solidification conditions
International Journal of Scientific and Technological Research wwwiisteorg ISSN 2422-8702 (Online) Vol 1 No10 2015
8 | P a g e wwwiisteorg
Typical strength-strain curves of Al-Si-Sb alloy are shown in Figure 3 for V and values As can bee
seen from Figure 3 ultimate tensile strengthUTS ) values are increased with increasing V but
eutectic spacings values are increased ultimate tensile strengthdecreased
Figures 3a and 3b show the variation of the UTS () with the growth rate (V) and interflake spacings
The dependence of on V and can be represented as
σ = k4Vd (10)
σ = k5e (11)
As can be seen from Figure 3a the values of increase with increasing growth rate The exponent
value of V is found to be 016 and value of is found to be 037 (Figure 3b)
34 Electrical properties of Al-Si-Sb ternary alloy
It can be seen from Table 1 temperature gradient and growth rate lead to an increase in the electrical
resistivity Dependence of the electrical resistivity on growth rate and interflake spacings can be
expressed as
=k6Vf (12)
=k7g (13)
where k6 and k7 are constants which can be experimentally determined and given in Table 1 The value
of the exponent relating to the growth rate and eutectic spacings were obtained to be 006 and 015
respectively (Figure 4)
International Journal of Scientific and Technological Research wwwiisteorg ISSN 2422-8702 (Online) Vol 1 No10 2015
9 | P a g e wwwiisteorg
Figure 4 (a) Variation of electrical resistivity as a function growth rate
(b) Variation of electrical resistivity as a function interflake spacings
The variation of electrical resistivity with the temperature in the range of 300ndash450 K was measured
(see Figure 5) It is observed that an increase in the temperature (300ndash450 K) values lead to increase in
the electrical resistivity values (639ndash992)10-5 mm
As can be seen from Figure 5 the electrical resistivity values (639ndash99210-5 mm) in this work are
some higher than the values (275ndash87510-5 mm) for pure aluminum and smaller than the values
(413ndash11010-5 mm) for pure antimony [27]
Figure 5 Variation of electrical resistivity as a function temperature for Al-Si-Sb ternary alloy
35 The thermal properties of Al-Si-Sb alloy
The AlndashSi-Sb alloy was heated with a heating rate of 10 Kmin from room temperature to 1200 K by
using a Perkin Elmer Diamond model DSC and the heat flow versus temperature is given in Figure 6
As can be seen from Figure 6 the melting temperature of Al-Si-Sb eutectic was found to be 86637 K
The values of the enthalpy of fusion and the specific heat were also calculated to be 28260 Jg and
0326 J(gK) respectively from the graph of the heat flow vs temperature The recommended values of
the enthalpy of fusion for pure Al Si Sb and Al-Si eutectic are 39696 Jg 29783 Jg 161 Jg and
4682 Jg respectively and also the specific heat values for pure Al Si Sb and Al-Si eutectic are 0879
JgK 0210 JgK 021 JgK and 00563 JgK in respectively [28 29] at the melting temperature The
International Journal of Scientific and Technological Research wwwiisteorg ISSN 2422-8702 (Online) Vol 1 No10 2015
10 | P a g e wwwiisteorg
H value (28260 Jg) is smaller and the Cp values (0326 JgK) is same higher than the values of pure
Al Si Sb and Al-Si eutectic
Figure 6 Heat flow curve vs the temperature for Al-Si-Sb ternary alloy at heating rate of 10 Kmin
4 Conclusions
The principal results in this work can be summarized as follows
1 Experimental observations show that the values of flake spacings () decreases as growth rate (V)
increases The relationships between and V have been obtained to be λ=2369 V-043
2 It was found that the values of HV increase with increasing the values of V but the values of the HV
descrease with increasing the values of The establishment of the relationships among HV V and
can be given as HV=5336V015 and HV= 8219 λ -013
3 The experimental expressions correlating the values of ultimate tensile strength) with the values
of V and shows that the values of the tensile stresses increase with increasing the values of V and
the values of the tensile stresses descrease with increasing the values of The establishment of the
relationships among stresses () and solidification parameters (V and G) can be given as σ
=5220(V) 015 and σ =15656(λ) -034
4 Experimental results show that the values of electrical resistivity () increases with increasing V
values but the values of descrease with increasing the values of The relationships between
and V and have been obtained to be ρ=603x10-8 (V)006 and ρ=989x10-8 ()-015
5 The electrical resistivity of Al-Si-Sb alloy increases (639ndash992)10-5 mm with increasing
temperature (300-450 K)
6 From the plot of heat flow vs temperature the melting temperature enthalpy of fusion and
specific heat are found to be 86637 K 28260 Jg and 0326 J(gK) respectively
References
[1] Yang F Peng L and Okazaki K 2004 Microindentation of aluminum MetMat
Trans 35A p3323
[2] Ping Wu S Liu DR Guo JJ Su YQ and Fu H Z 2007 Influence of process
parameters on CET in TindashAl alloy ingot with consideration of shrinkage cavity
formation A computer simulation J Alloys and Comp 441 p 267
International Journal of Scientific and Technological Research wwwiisteorg ISSN 2422-8702 (Online) Vol 1 No10 2015
11 | P a g e wwwiisteorg
[3] Yang F Peng L and Okazaki K 2004 Microindentation of aluminum Met Mat
Trans A35 p3323
[4] Goulart P R Spinelli J E Osoacuterio W R Garcia A 2006 Mat Sci Eng A 421
p245
[5] Goumlgebakan M Uzun O Karaaslan T Keskin M 2003 Rapidly solidified Alndash65
wt Ni alloy J Mat Proc Tech 142 p87
[6] Kaya H Guumlnduumlz M Ccediladırlı E Uzun O 2004 Effect of growth rate and lamellar
spacing on microhardness in the directionally solidified Pb-Cd Sn-Zn and Bi-Cd
eutectic alloys JMat Sci 39 p6571
[7] Kaya H Ccediladırlı E Guumlnduumlz M Uumllgen A 2003 Effect of the temperature gradient growth
rate and the interflake spacing on the microhardness in the directionally solidified Al-
Si eutectic alloy JMatEng Perf 12 p 544
[8] Kaya H Ccediladırlı E Boumlyuumlk U and Maraşlı N 2008 Variation of microindentation
hardness with solidification and microstructure parameters in the Al based alloys Appl
Surf Sci 255 p3071
[9] Engin S Boumlyuumlk U Kaya H Maraşlı N 2011 Directional solidification and
phiycsal properties measurements of the zinc-aluminum eutectic alloy I J Min Met
Mat 18(6) p 659
[10] Boumlyuumlk U Maraşlı N Ccediladırlı E Kaya H Keşlioğlu K 2012 Variations of
microhardness with solidification parameters and electrical resistivity with temperature
for Al-Cu-Ag eutectic alloy Current Applied Physics 12 p7
[11] Wang E R Hui X D Wang S S Zhao Y F Chen G L 2010 Improved
mechanical properties in cast Al-Si alloys by combined alloying of Fe and Cu
Materials Science and Engineering A 527 pp 7878-7884
[12] Samuel A M Samuel F H Doty H W 1996 Observation on the formation szlig-
Al5FeSi phase in 319 type Al-Si alloys Journal of Materials Science 31 pp 5529-
5539
[13] Lu L Dahle AK 2006 Mater Sci Eng A 435ndash436 pp 288ndash296
[14] Kaya H 2012 Dependency Of Electrical Resistivity On The Temperature And
Composition Of Al-Cu Alloys Materials Research Innovations 16 (1) pp 224-229
[15] Kaya H Ccediladirli E Uumllgen A 2011 Investigation Of The Effect Of Composition On
Microhardness And Determination Of Thermo-Physical Properties In The Zn-Cu Alloys
Materialsamp Design 32 pp 900-906
[16] Trivedi R and Kurz W 1994 Int Mat Rev 39 pp49
[17] Yilmazer M İ Kaya H Aker A Engin S 2013 Influence Of The Growth Rate On
Physical Properties In The Aluminum-Antimony Eutectic Alloy International Journal of
Materials Engineering and Technology 9 pp 59-76
[18] Aker A Kaya H 2013 Measurements of Microstructural Mechanical Electrical and
Thermal Properties of an Al-Ni Alloy International Journal of Thermophyscics 34 (1)
pp 267-283
[19] Ourdjini A Liu J and Elliott R 1994 Eutectic spacing selection in the Al-Cu
system Mater Sci Tech-Lond 10 p312
[20] Kaya H Ccediladırlı E and Guumlnduumlz M 2007 Eutectic growth of unidirectionally solidified
bismuth-cadmium alloy J Mat Process Tech 183 p310
[21] Kaya H Ccediladırlı E and Guumlnduumlz M 2003 Effect of growth rates and temperature
gradients on the spacing and undercooling in the broken-lamellar eutectic growth (Sn-Zn
eutectic system) J Mat Eng Perf 12(4) p456
International Journal of Scientific and Technological Research wwwiisteorg ISSN 2422-8702 (Online) Vol 1 No10 2015
12 | P a g e wwwiisteorg
[22] Sergeev A and Mitin V 2000 Electron-phonon interaction in disordered conductors
Static and vibrating scattering potentialsPhys RevB 61 p6041
[23] Boekelheide Z Cooke DW Helgren E and Hellman F 2009 Resonant impurity
scattering and electron-phonon scattering in the electrical resistivity of Cr thin films
Phys Rev B p 80134426
[24] Rudnev V Loveless D Cook R Black M 2003 Handbook of Induction Heating
Markel Dekker Inc New York p 119
[25] Hultgren R Orr R L Anderson PD and Kelley KK 1963 Selected Values of
Thermodynamic Properties of Metals and Alloys (University of California Berkeley
Wiley p318-322
[26] Fan J Li X Su Y Guo J and Fu H 2010 The microstructure parameters and
microhardness of directionally solidified Ti-43Al-3Si alloy Journal of Alloys and
Compounds 506 593-599
[27] Steinbach S Ratke L 2007 Experimental study on interaction of fluid flow and
solidification in Al-Si-Cu alloys International Journal of Cast Metals Research 20 140-
144
[28] Boumlyuumlk U 2012 Physical and mechanical properties of AlndashSindashNi eutectic alloy Metals
and Materials International 18 (6) 933-938
International Journal of Scientific and Technological Research wwwiisteorg ISSN 2422-8702 (Online) Vol 1 No10 2015
6 | P a g e wwwiisteorg
Figure 3 (a) Variation of microhardness Hv and tensile strength σ as a function growth rate
(b) Variation of microhardness Hv and tensile strength σ as a function interflakes spacings
24 Determination of ultimate tensile strength (UTS)
Another aim of this work was to obtain the relationship between ultimate tensile strength (UTS) the
growth rate and interflake spacings in the Al-Si-Sb ternary alloy
The tests of tensile strength were performed at room temperature at a strain rate of 10-3 s-1 with a
Shimadzu AG-XD universal testing machine The data collected from the tensile test can be analysed
using the following formula to determine the strength ()
σ=FA (2)
where is the strength in N mm2 (or MPa) F is the applied force (N) A is the original cross sectional
area (mm2) of the sample The round rod tensile samples with diameter of 4 mm and gauge length of 50
mm were prepared from directionally solidified rod samples with different growth rates (V=833-
16545 ms) at a constant G (804 Kmm)
The tensile axis was chosen parallel to the growth direction of the sample UTS () values of Al-Si-Sb
alloy are shown in Figures 3a and 3b for V and values
25 Measurement of electrical resistivity
Another purpose of this investigation was to obtain the relationships among the growth rate dendritic
microstructures and electrical resistivity for the Al-Si-Sb samples The electrical resistivity of
directionally solidified samples was measured by the dc four-point probe method The four-point
probe method is the most widely used technique for electrical profile measurement of materials The method has proven to be a convenient tool for the resistivity measurement In this method the
materialrsquos resistivity can be expressed as
I
VRCF (3)
where RCF is resistivity correction factor V is the potential difference measured across the probes and
I is the current through the probes The geometry of the sample determines the correction factors that
must be used additionally the position of the probes on the sample and the spacings between the
probes The need for correction factors is caused by the proximity of a boundary which limits the
possible current paths in the sample The number of RCF is calculated by diameter of sample divided
by probe spacing (probe spacing being the distance between any two adjacent probes) In this study a
4mm diameter sample probed with a four point probe with 1mm tip spacing would have a correction
factor of 065
When a constant current was applied on the sample with a Keithley 2400 sourcemeter the potential
drops on the samples were measured with a Keithley 2700 multimeter connected to a computer
Platinum wire 05 mm in diameter was used to be the probes of current and potential
Two of the probes are used to source current and the other two probes are used to measure voltage
using four probes eliminates measurement errors due to the probe resistance the spreading resistance
under each probe and the contact resistance between each metal probe and material [23] The sizes of
samples were measured by using a digital micrometer has an accuracy of 1 μm The error in the
electrical resistivity measurements is calculated about 5 This error is due to current voltage and
temperature measurements
26 Determination of enthalpy and specific heat
International Journal of Scientific and Technological Research wwwiisteorg ISSN 2422-8702 (Online) Vol 1 No10 2015
7 | P a g e wwwiisteorg
The enthalpy of fusion (H) and the specific heat (Cp) of Al-Si-Sb alloy were determined because they
are very important parameters for industrial applications Differential scanning calorimeter (DSC)
thermal analysis (Perkin-Elmer Diamond model) was performed at 300-1200 K with a heating rate of
10 Kmin under a constant stream of nitrogen at atmospheric pressure
A reference material (a sapphire disk) was used in determining specific heat This reference data was
used to ldquocorrectrdquo sample data at every temperature The size of the signal which was used to calculate
the specific heat was proportional to the heating rate so it follows that faster heating rates will produce
larger signals which will give more accurate data However if the heating rate was too high the
temperature gradients in the sample would be large and this may introduce other errors in the
measurement It was normal to use heating rates between 5 and 20 Kmin The heating rate in this study
was 10 Kmin which was mostly recommended
The difference between the sample curve and the baseline curve was measured in milliwatts and
converted to specific heat as follows
Cp=(dQdt)(1MR) (4)
where dQdt is the heat flow M (g) the mass of the sample and R the heating rate Kmin
The DSC curve obtained for Al-Si-Sb alloy is shown in Figure 6 A sharp peak is clearly observed for
melting process as shown in Figure 6 The enthalpy of fusion (H) and specific heat (Cp) were
calculated as the area under the peak by numerical integration
3 Results and discussion
31 Effect of growth rate on the inter flake spacing
Variations of inter flake spacings ()with the growth rate (V) at a constant G (804 Kmm) is given in
Figure 2 and Table 1 The variation of versus V can be given the proportionality equation as
n
kV
(5)
where k is a constant and n an exponent value of growth rate The relationships between the flakes
spacing and growth rates were determined as λ=2369 V-043
by using linear regression analysis The
exponent value 043 is in good agreement with the range values of 039-047 obtained by different
researchers [61014172425]
32 Dependence of microhardness and ultimate tensile strength on growth rate
One of the purposes of this investigation is to obtain the dependence of HV on V and It can be seen
from Table 1 that an increase in the temperature gradient and growth rate leads to an increase in the
microhardness Dependence of the HV on the V and were determined by using linear regression
analysis and the relationship between them can be expressed by the following equations as
bVHV2
k
(6)
cHV
3k
(7)
where k2 and k3 are constant b and c are the exponent values of the growth rate and flake spacing
respectively As can be seen from Figures 3a and 3b the microhardness values increase with the
increasing V values and decreasing with the increasing values
Linear regression analysis yields
HV =8073V005 (8)
HV = 3208 λ-013 (9)
The average exponent values of V and for HV in the directionally solidified Al-Si-Sb alloy were
found to be 005 and 013 respectively in this work These exponent values relating to V and
obtained in present work is generally in a good agreement with the exponent values obtained in
previous experimental works [17 21-22 26] under similar solidification conditions
International Journal of Scientific and Technological Research wwwiisteorg ISSN 2422-8702 (Online) Vol 1 No10 2015
8 | P a g e wwwiisteorg
Typical strength-strain curves of Al-Si-Sb alloy are shown in Figure 3 for V and values As can bee
seen from Figure 3 ultimate tensile strengthUTS ) values are increased with increasing V but
eutectic spacings values are increased ultimate tensile strengthdecreased
Figures 3a and 3b show the variation of the UTS () with the growth rate (V) and interflake spacings
The dependence of on V and can be represented as
σ = k4Vd (10)
σ = k5e (11)
As can be seen from Figure 3a the values of increase with increasing growth rate The exponent
value of V is found to be 016 and value of is found to be 037 (Figure 3b)
34 Electrical properties of Al-Si-Sb ternary alloy
It can be seen from Table 1 temperature gradient and growth rate lead to an increase in the electrical
resistivity Dependence of the electrical resistivity on growth rate and interflake spacings can be
expressed as
=k6Vf (12)
=k7g (13)
where k6 and k7 are constants which can be experimentally determined and given in Table 1 The value
of the exponent relating to the growth rate and eutectic spacings were obtained to be 006 and 015
respectively (Figure 4)
International Journal of Scientific and Technological Research wwwiisteorg ISSN 2422-8702 (Online) Vol 1 No10 2015
9 | P a g e wwwiisteorg
Figure 4 (a) Variation of electrical resistivity as a function growth rate
(b) Variation of electrical resistivity as a function interflake spacings
The variation of electrical resistivity with the temperature in the range of 300ndash450 K was measured
(see Figure 5) It is observed that an increase in the temperature (300ndash450 K) values lead to increase in
the electrical resistivity values (639ndash992)10-5 mm
As can be seen from Figure 5 the electrical resistivity values (639ndash99210-5 mm) in this work are
some higher than the values (275ndash87510-5 mm) for pure aluminum and smaller than the values
(413ndash11010-5 mm) for pure antimony [27]
Figure 5 Variation of electrical resistivity as a function temperature for Al-Si-Sb ternary alloy
35 The thermal properties of Al-Si-Sb alloy
The AlndashSi-Sb alloy was heated with a heating rate of 10 Kmin from room temperature to 1200 K by
using a Perkin Elmer Diamond model DSC and the heat flow versus temperature is given in Figure 6
As can be seen from Figure 6 the melting temperature of Al-Si-Sb eutectic was found to be 86637 K
The values of the enthalpy of fusion and the specific heat were also calculated to be 28260 Jg and
0326 J(gK) respectively from the graph of the heat flow vs temperature The recommended values of
the enthalpy of fusion for pure Al Si Sb and Al-Si eutectic are 39696 Jg 29783 Jg 161 Jg and
4682 Jg respectively and also the specific heat values for pure Al Si Sb and Al-Si eutectic are 0879
JgK 0210 JgK 021 JgK and 00563 JgK in respectively [28 29] at the melting temperature The
International Journal of Scientific and Technological Research wwwiisteorg ISSN 2422-8702 (Online) Vol 1 No10 2015
10 | P a g e wwwiisteorg
H value (28260 Jg) is smaller and the Cp values (0326 JgK) is same higher than the values of pure
Al Si Sb and Al-Si eutectic
Figure 6 Heat flow curve vs the temperature for Al-Si-Sb ternary alloy at heating rate of 10 Kmin
4 Conclusions
The principal results in this work can be summarized as follows
1 Experimental observations show that the values of flake spacings () decreases as growth rate (V)
increases The relationships between and V have been obtained to be λ=2369 V-043
2 It was found that the values of HV increase with increasing the values of V but the values of the HV
descrease with increasing the values of The establishment of the relationships among HV V and
can be given as HV=5336V015 and HV= 8219 λ -013
3 The experimental expressions correlating the values of ultimate tensile strength) with the values
of V and shows that the values of the tensile stresses increase with increasing the values of V and
the values of the tensile stresses descrease with increasing the values of The establishment of the
relationships among stresses () and solidification parameters (V and G) can be given as σ
=5220(V) 015 and σ =15656(λ) -034
4 Experimental results show that the values of electrical resistivity () increases with increasing V
values but the values of descrease with increasing the values of The relationships between
and V and have been obtained to be ρ=603x10-8 (V)006 and ρ=989x10-8 ()-015
5 The electrical resistivity of Al-Si-Sb alloy increases (639ndash992)10-5 mm with increasing
temperature (300-450 K)
6 From the plot of heat flow vs temperature the melting temperature enthalpy of fusion and
specific heat are found to be 86637 K 28260 Jg and 0326 J(gK) respectively
References
[1] Yang F Peng L and Okazaki K 2004 Microindentation of aluminum MetMat
Trans 35A p3323
[2] Ping Wu S Liu DR Guo JJ Su YQ and Fu H Z 2007 Influence of process
parameters on CET in TindashAl alloy ingot with consideration of shrinkage cavity
formation A computer simulation J Alloys and Comp 441 p 267
International Journal of Scientific and Technological Research wwwiisteorg ISSN 2422-8702 (Online) Vol 1 No10 2015
11 | P a g e wwwiisteorg
[3] Yang F Peng L and Okazaki K 2004 Microindentation of aluminum Met Mat
Trans A35 p3323
[4] Goulart P R Spinelli J E Osoacuterio W R Garcia A 2006 Mat Sci Eng A 421
p245
[5] Goumlgebakan M Uzun O Karaaslan T Keskin M 2003 Rapidly solidified Alndash65
wt Ni alloy J Mat Proc Tech 142 p87
[6] Kaya H Guumlnduumlz M Ccediladırlı E Uzun O 2004 Effect of growth rate and lamellar
spacing on microhardness in the directionally solidified Pb-Cd Sn-Zn and Bi-Cd
eutectic alloys JMat Sci 39 p6571
[7] Kaya H Ccediladırlı E Guumlnduumlz M Uumllgen A 2003 Effect of the temperature gradient growth
rate and the interflake spacing on the microhardness in the directionally solidified Al-
Si eutectic alloy JMatEng Perf 12 p 544
[8] Kaya H Ccediladırlı E Boumlyuumlk U and Maraşlı N 2008 Variation of microindentation
hardness with solidification and microstructure parameters in the Al based alloys Appl
Surf Sci 255 p3071
[9] Engin S Boumlyuumlk U Kaya H Maraşlı N 2011 Directional solidification and
phiycsal properties measurements of the zinc-aluminum eutectic alloy I J Min Met
Mat 18(6) p 659
[10] Boumlyuumlk U Maraşlı N Ccediladırlı E Kaya H Keşlioğlu K 2012 Variations of
microhardness with solidification parameters and electrical resistivity with temperature
for Al-Cu-Ag eutectic alloy Current Applied Physics 12 p7
[11] Wang E R Hui X D Wang S S Zhao Y F Chen G L 2010 Improved
mechanical properties in cast Al-Si alloys by combined alloying of Fe and Cu
Materials Science and Engineering A 527 pp 7878-7884
[12] Samuel A M Samuel F H Doty H W 1996 Observation on the formation szlig-
Al5FeSi phase in 319 type Al-Si alloys Journal of Materials Science 31 pp 5529-
5539
[13] Lu L Dahle AK 2006 Mater Sci Eng A 435ndash436 pp 288ndash296
[14] Kaya H 2012 Dependency Of Electrical Resistivity On The Temperature And
Composition Of Al-Cu Alloys Materials Research Innovations 16 (1) pp 224-229
[15] Kaya H Ccediladirli E Uumllgen A 2011 Investigation Of The Effect Of Composition On
Microhardness And Determination Of Thermo-Physical Properties In The Zn-Cu Alloys
Materialsamp Design 32 pp 900-906
[16] Trivedi R and Kurz W 1994 Int Mat Rev 39 pp49
[17] Yilmazer M İ Kaya H Aker A Engin S 2013 Influence Of The Growth Rate On
Physical Properties In The Aluminum-Antimony Eutectic Alloy International Journal of
Materials Engineering and Technology 9 pp 59-76
[18] Aker A Kaya H 2013 Measurements of Microstructural Mechanical Electrical and
Thermal Properties of an Al-Ni Alloy International Journal of Thermophyscics 34 (1)
pp 267-283
[19] Ourdjini A Liu J and Elliott R 1994 Eutectic spacing selection in the Al-Cu
system Mater Sci Tech-Lond 10 p312
[20] Kaya H Ccediladırlı E and Guumlnduumlz M 2007 Eutectic growth of unidirectionally solidified
bismuth-cadmium alloy J Mat Process Tech 183 p310
[21] Kaya H Ccediladırlı E and Guumlnduumlz M 2003 Effect of growth rates and temperature
gradients on the spacing and undercooling in the broken-lamellar eutectic growth (Sn-Zn
eutectic system) J Mat Eng Perf 12(4) p456
International Journal of Scientific and Technological Research wwwiisteorg ISSN 2422-8702 (Online) Vol 1 No10 2015
12 | P a g e wwwiisteorg
[22] Sergeev A and Mitin V 2000 Electron-phonon interaction in disordered conductors
Static and vibrating scattering potentialsPhys RevB 61 p6041
[23] Boekelheide Z Cooke DW Helgren E and Hellman F 2009 Resonant impurity
scattering and electron-phonon scattering in the electrical resistivity of Cr thin films
Phys Rev B p 80134426
[24] Rudnev V Loveless D Cook R Black M 2003 Handbook of Induction Heating
Markel Dekker Inc New York p 119
[25] Hultgren R Orr R L Anderson PD and Kelley KK 1963 Selected Values of
Thermodynamic Properties of Metals and Alloys (University of California Berkeley
Wiley p318-322
[26] Fan J Li X Su Y Guo J and Fu H 2010 The microstructure parameters and
microhardness of directionally solidified Ti-43Al-3Si alloy Journal of Alloys and
Compounds 506 593-599
[27] Steinbach S Ratke L 2007 Experimental study on interaction of fluid flow and
solidification in Al-Si-Cu alloys International Journal of Cast Metals Research 20 140-
144
[28] Boumlyuumlk U 2012 Physical and mechanical properties of AlndashSindashNi eutectic alloy Metals
and Materials International 18 (6) 933-938

International Journal of Scientific and Technological Research wwwiisteorg ISSN 2422-8702 (Online) Vol 1 No10 2015
11 | P a g e wwwiisteorg
[3] Yang F Peng L and Okazaki K 2004 Microindentation of aluminum Met Mat
Trans A35 p3323
[4] Goulart P R Spinelli J E Osoacuterio W R Garcia A 2006 Mat Sci Eng A 421
p245
[5] Goumlgebakan M Uzun O Karaaslan T Keskin M 2003 Rapidly solidified Alndash65
wt Ni alloy J Mat Proc Tech 142 p87
[6] Kaya H Guumlnduumlz M Ccediladırlı E Uzun O 2004 Effect of growth rate and lamellar
spacing on microhardness in the directionally solidified Pb-Cd Sn-Zn and Bi-Cd
eutectic alloys JMat Sci 39 p6571
[7] Kaya H Ccediladırlı E Guumlnduumlz M Uumllgen A 2003 Effect of the temperature gradient growth
rate and the interflake spacing on the microhardness in the directionally solidified Al-
Si eutectic alloy JMatEng Perf 12 p 544
[8] Kaya H Ccediladırlı E Boumlyuumlk U and Maraşlı N 2008 Variation of microindentation
hardness with solidification and microstructure parameters in the Al based alloys Appl
Surf Sci 255 p3071
[9] Engin S Boumlyuumlk U Kaya H Maraşlı N 2011 Directional solidification and
phiycsal properties measurements of the zinc-aluminum eutectic alloy I J Min Met
Mat 18(6) p 659
[10] Boumlyuumlk U Maraşlı N Ccediladırlı E Kaya H Keşlioğlu K 2012 Variations of
microhardness with solidification parameters and electrical resistivity with temperature
for Al-Cu-Ag eutectic alloy Current Applied Physics 12 p7
[11] Wang E R Hui X D Wang S S Zhao Y F Chen G L 2010 Improved
mechanical properties in cast Al-Si alloys by combined alloying of Fe and Cu
Materials Science and Engineering A 527 pp 7878-7884
[12] Samuel A M Samuel F H Doty H W 1996 Observation on the formation szlig-
Al5FeSi phase in 319 type Al-Si alloys Journal of Materials Science 31 pp 5529-
5539
[13] Lu L Dahle AK 2006 Mater Sci Eng A 435ndash436 pp 288ndash296
[14] Kaya H 2012 Dependency Of Electrical Resistivity On The Temperature And
Composition Of Al-Cu Alloys Materials Research Innovations 16 (1) pp 224-229
[15] Kaya H Ccediladirli E Uumllgen A 2011 Investigation Of The Effect Of Composition On
Microhardness And Determination Of Thermo-Physical Properties In The Zn-Cu Alloys
Materialsamp Design 32 pp 900-906
[16] Trivedi R and Kurz W 1994 Int Mat Rev 39 pp49
[17] Yilmazer M İ Kaya H Aker A Engin S 2013 Influence Of The Growth Rate On
Physical Properties In The Aluminum-Antimony Eutectic Alloy International Journal of
Materials Engineering and Technology 9 pp 59-76
[18] Aker A Kaya H 2013 Measurements of Microstructural Mechanical Electrical and
Thermal Properties of an Al-Ni Alloy International Journal of Thermophyscics 34 (1)
pp 267-283
[19] Ourdjini A Liu J and Elliott R 1994 Eutectic spacing selection in the Al-Cu
system Mater Sci Tech-Lond 10 p312
[20] Kaya H Ccediladırlı E and Guumlnduumlz M 2007 Eutectic growth of unidirectionally solidified
bismuth-cadmium alloy J Mat Process Tech 183 p310
[21] Kaya H Ccediladırlı E and Guumlnduumlz M 2003 Effect of growth rates and temperature
gradients on the spacing and undercooling in the broken-lamellar eutectic growth (Sn-Zn
eutectic system) J Mat Eng Perf 12(4) p456
International Journal of Scientific and Technological Research wwwiisteorg ISSN 2422-8702 (Online) Vol 1 No10 2015
12 | P a g e wwwiisteorg
[22] Sergeev A and Mitin V 2000 Electron-phonon interaction in disordered conductors
Static and vibrating scattering potentialsPhys RevB 61 p6041
[23] Boekelheide Z Cooke DW Helgren E and Hellman F 2009 Resonant impurity
scattering and electron-phonon scattering in the electrical resistivity of Cr thin films
Phys Rev B p 80134426
[24] Rudnev V Loveless D Cook R Black M 2003 Handbook of Induction Heating
Markel Dekker Inc New York p 119
[25] Hultgren R Orr R L Anderson PD and Kelley KK 1963 Selected Values of
Thermodynamic Properties of Metals and Alloys (University of California Berkeley
Wiley p318-322
[26] Fan J Li X Su Y Guo J and Fu H 2010 The microstructure parameters and
microhardness of directionally solidified Ti-43Al-3Si alloy Journal of Alloys and
Compounds 506 593-599
[27] Steinbach S Ratke L 2007 Experimental study on interaction of fluid flow and
solidification in Al-Si-Cu alloys International Journal of Cast Metals Research 20 140-
144
[28] Boumlyuumlk U 2012 Physical and mechanical properties of AlndashSindashNi eutectic alloy Metals
and Materials International 18 (6) 933-938