the measurement of the rydberg constant - university of utah
TRANSCRIPT

The Measurement of
The Rydberg Constant By Alex Gibbs

Background In 1913, Niels Bohr proposed
his “Bohr Model”; a working
model of the hydrogen atom.
Supported his model by
deriving the Rydberg
Formula:
What is the Rydberg
Constant R?
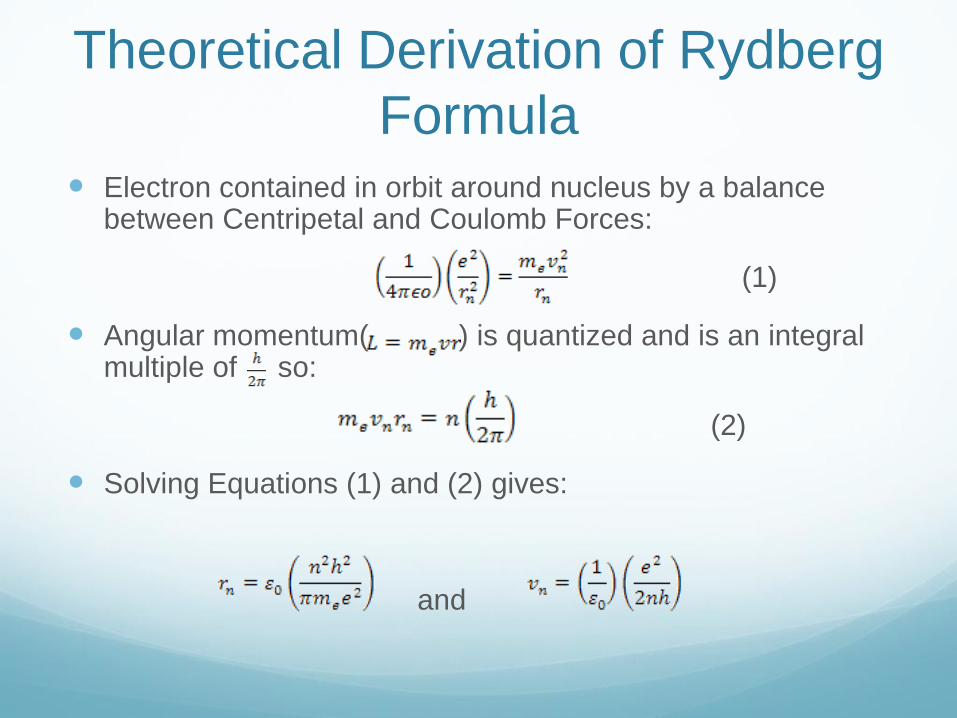
Theoretical Derivation of Rydberg
Formula Electron contained in orbit around nucleus by a balance
between Centripetal and Coulomb Forces:
(1)
Angular momentum( ) is quantized and is an integral multiple of so:
(2)
Solving Equations (1) and (2) gives:
and
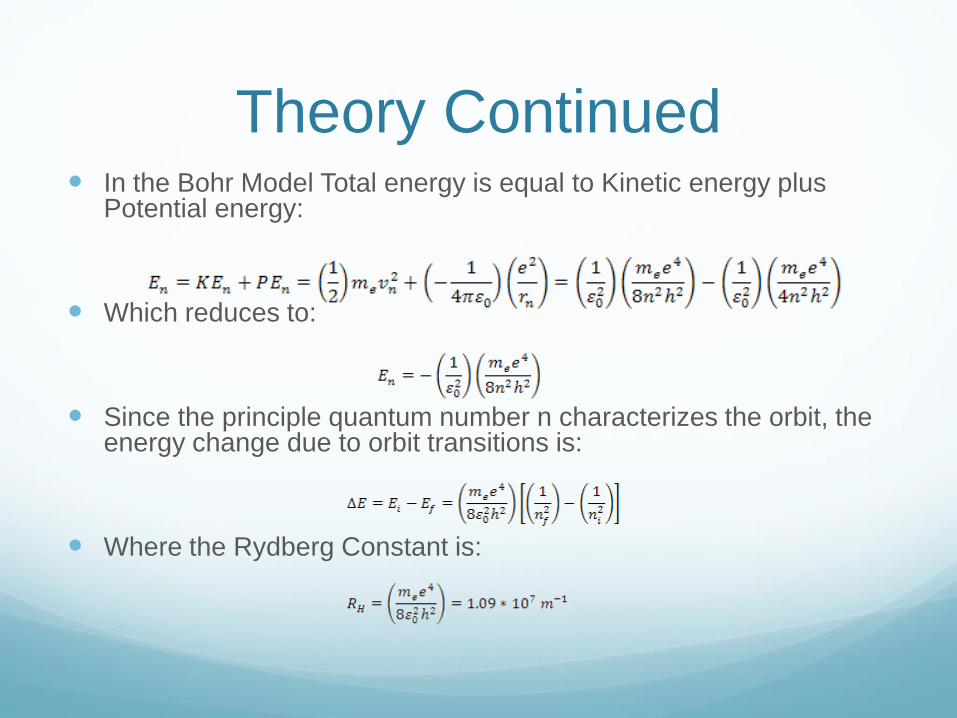
Theory Continued In the Bohr Model Total energy is equal to Kinetic energy plus
Potential energy:
Which reduces to:
Since the principle quantum number n characterizes the orbit, the energy change due to orbit transitions is:
Where the Rydberg Constant is:

Experimental Methods A Hydrogen Discharge lamp is
used to excite atoms to make transitions between energy states producing light.
The light is collimated and sent through a diffraction grating
The diffraction grating separates the light into its spectrum
A telescope is attached to view the spectrum and measure the angle of diffraction
Plan of Analysis Calibration of apparatus
Hydrogen Visible Wavelengths Derivation
Rydberg Constant Derivation

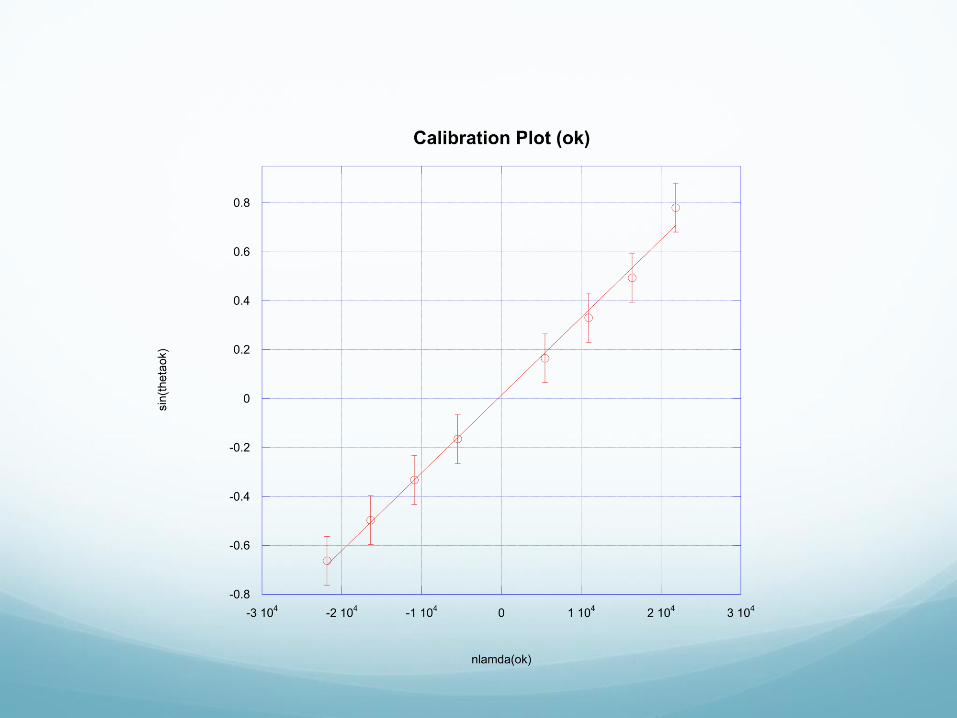
Calibration A good calibration is crucial when conducting this
experiment with this apparatus
Diffraction angles are a “finger print” of the element so
must be correct and not distorted
Good calibration is achieved when diffraction angles
are symmetric about =0
Calibration is done using mercury lamp of known
wavelength: λ (green)= 5460.74 Å

Calibration Data
n*λ (angstoms) sin[Θr(bad)] sin[Θr(ok)] sin[Θr(good)]
5460.74 0.16 0.165 0.165
10921.5 0.326 0.331 0.331
16382.2 0.491 0.494 0.495
21843 0.721 0.78 0.707
-5460.74 -0.163 -0.165 -0.165
-10921.5 -0.35 -0.332 -0.332
-16382.2 -0.591 -0.497 -0.497
-21843 -0.856 -0.663 -0.663
n Θr(bad) Θr(ok) Θr(good)
1 9.2±0.1 9.2±0.1 9.5±0.1
2 19.0±0.1 19.3±0.1 19.3±0.1
3 29.4±0.1 29.6±0.1 29.7±0.1
4 46.1±0.1 51.3±0.1 45.0±0.1
-1 -9.4±0.1 -9.5±0.1 -9.5±0.1
-2 -20.5±0.1 -19.4±0.1 -19.4±0.1
-3 -36.2±0.1 -29.8±0.1 -29.8±0.1
-4 -58.9±0.1 -41.5±0.1 -41.5±0.1


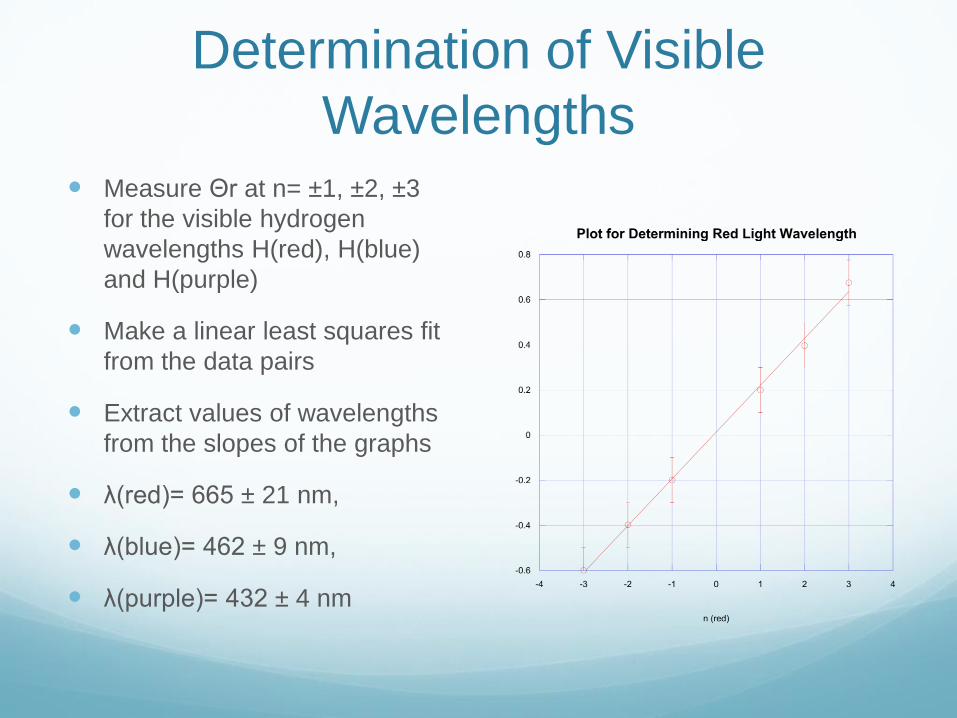
Determination of Visible
Wavelengths Measure Θr at n= ±1, ±2, ±3
for the visible hydrogen
wavelengths H(red), H(blue)
and H(purple)
Make a linear least squares fit
from the data pairs
Extract values of wavelengths
from the slopes of the graphs
λ(red)= 665 ± 21 nm,
λ(blue)= 462 ± 9 nm,
λ(purple)= 432 ± 4 nm

Determination of Rydberg
Constant Make a linear least squares
fit of the data pairs:
Determine Rydberg Constant
from slope.
Best Fit gives:
RH=1.17x10^7 ± .03 m^-1

Final Result & Discussion Ok agreement between experimental and expected
data.
Corresponds to a percentage probability of 8.2%.
Greater than 5% level but not by much.
7.5% error relative to theoretical value.
Conclusion The hydrogen spectrometer can be used to obtain an
ok value of the Rydberg constant,
RH=1.17x10^7 ± .03 m^-1
Further calibration can lead to a Really Good value for
the Rydberg constant: Bad Calibration gives:
RH=1.21x10^7 ± .05 m^-1
2.4% improvement in accuracy