spectroscopy of rydberg atoms in non-neutral cold plasmas · the stark effect of rydberg atoms...
TRANSCRIPT
Spectroscopy of Rydberg Atoms in Non-NeutralCold Plasmas
D. Feldbaum, N. V. Morrow, S. K. Dutta, G. Raithel
Department of Physics, University of MichiganAnn Arbor, MI 48109-1120
Abstract. The electric field in mm-sized one-component non-neutral plasmas is measured usingthe Stark effect of Rydberg atoms embedded in them. The plasmas are clouds of cold Rb+-ions,which are produced by UV photoionization of laser-cooled Rb atoms in a magneto-optic trap.The dependence of the electric field on the number of ions and the Coulomb explosion of the ionclouds have been studied.
INTRODUCTION
Highly excited Rydberg atoms [1] are very sensitive to static and AC electric andmagnetic fields, and can be used for the spectroscopic detection and compensation ofsuch fields. Rydberg atoms have been used to detect microwave and FIR radiation [2],to measure and to compensate weak static electric fields [3], and to study QED levelshifts and cavity-QED effects involving only few microwave photons [4]. Thespectroscopy of Rydberg atoms has been employed to diagnose electric fields in DCand high-frequency discharge plasmas [5]. In this report, we use Rydberg atomspectroscopy to determine the electric field in millimeter-sized, strongly coupledplasmas that since recently can be generated by the laser excitation of laser-cooledclouds of atoms [6]. The field-measurement method described in this report will havefuture applications in the characterization of these plasmas and the study of theirevolution.
EXPERIMENT
Our experiment has recently been described in Ref. [7]. In a two-step opticalexcitation, laser-cooled rubidium atoms confined in a volume of order 1mm3 are firstexcited from the ground state 5S1/2 to the 5P3/2 state using a 780nm diode laser pulseof a few µs duration. A short UV laser pulse (λUV = 355nm, duration < 10ns, pulseenergy up to 10mJ) fired during the diode laser pulse partially ionizes the 5P3/2-atoms,which have an ionization wavelength of λion = 479.1nm. The resultant photoelectronshave 0.9eV initial kinetic energy and mostly escape on a time scale of a few ns,leaving behind a cloud of slow Rb+-ions. At a variable delay time after the UV pulse
and while the 780nm-laser is still on, the remaining 5P3/2-atoms that are embedded inthe ion plasma are excited by a blue dye laser pulse (λ §����QP, duration < 10ns,bandwidth §���*+]���7KH�EOXH�SXOVH�H[FLWHV�ERXQG�Rydberg states, the Stark effect ofwhich we use to measure the electric fields of the non-neutral Rb+-plasma.
The Rydberg atoms are detected as follows. The ion plasma represents an electron trapwith a depth U0 given by the ion number, the cloud size and the profile of the chargedistribution [6]. In most of our experiments U0 < 0.9eV, in which case no or only fewUV-generated photoelectrons are retained in the electron trap. The blue laser pulse,which is introduced shortly after the UV pulse and mostly excites bound Rydbergatoms, contains a small portion of ASE (amplified spontaneous emission) with λ <λion. This above-threshold ASE directly photoionizes of order 103 5P3/2-atoms,producing electrons with about 10meV energy. These electrons are trapped in the ionplasma. Thermal ionization of a small percentage of the bound Rydberg atoms excitedby the blue pulse may add some more trapped electrons [7]. Within a few µs, l-changing collisions between the trapped electrons and the Rydberg atoms efficientlypromote the latter into long-lived high-l states. During the Coulomb expansion of theion plasma, the depth U0 of the plasma electron trap approaches zero. During thattime, the electrons trapped in the plasma are gradually released, producing a plasmadecay signal in our microchannel-plate (MCP) electron detector, which is locatedabout 10cm from the atomic cloud. The high-l Rydberg atoms, which are not affectedby the plasma expansion, thermally ionize with a probability of order 50% on a timescale of order 10ms [7]. This time scale exceeds the plasma decay time by a factor ofabout 104. The delayed thermal electrons originating in the high-l Rydberg atoms arecounted by the MCP detector in a gate that starts well after the plasma decay, yieldinga noise-free signal of the Rydberg atom excitation. The Rydberg excitation spectraused to determine the plasma electric field are obtained by recording the delayedelectron counts as a function of the wavelength of the blue laser.
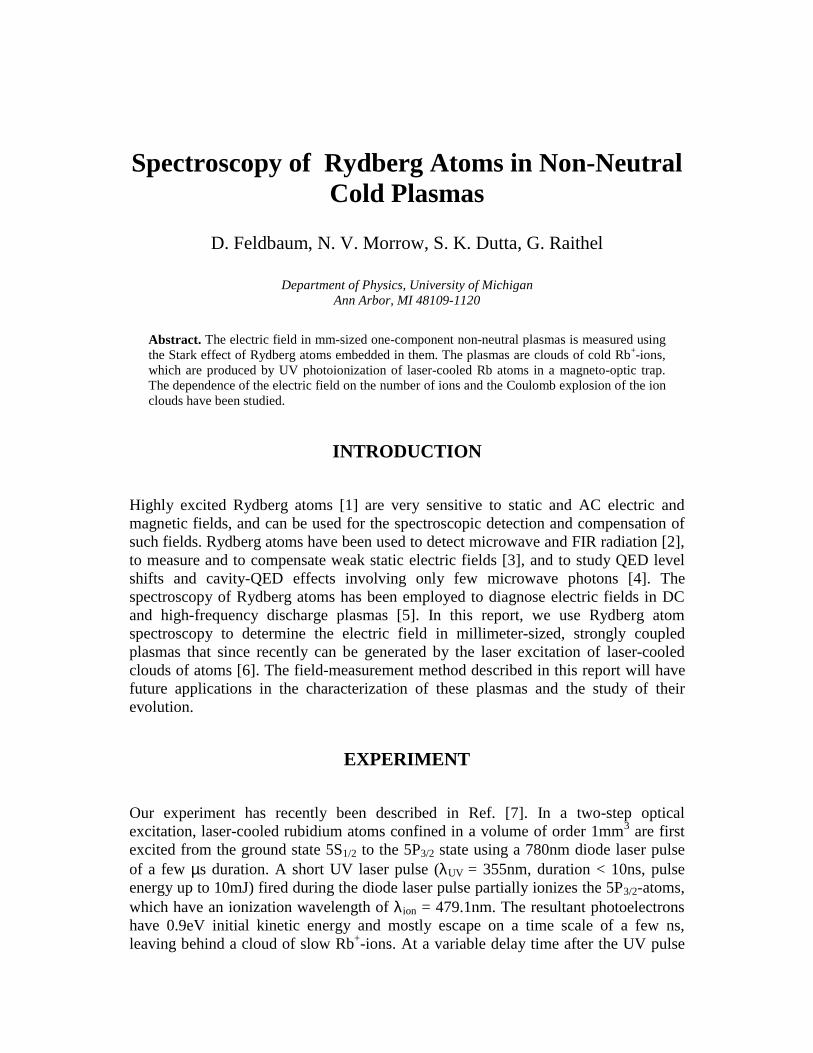
Fig.1 shows a typical experimental Rydberg excitation spectrum of atoms in anelectric-field-bearing plasma. Moving through the spectrum displayed in the upperpanel of Fig.1 from right to left, we observe that the electric field first manifests itselfin the appearance of p -lines and of triangular-shaped “h -features”, both caused byelectric-field-induced state mixing. Each triangular h -feature reflects one manifold ofhydrogenic states with the same principal quantum number n , which - due to thelinear Stark effect - fan out over an energy range En23 (atomic units) [1]. Asn increases, the h -features progressively expand and acquire more and more overalloscillator strength. Eventually, they fill in all spectral regions of originally zerooscillator strength between the discrete non-hydrogenic s-, p - and d -lines. Thelower three panels of Fig.1 highlight the fact that there are three types of such spectralgaps, which we label hs-, mid - and pd -gaps. The gaps become filled in exactly inthat order, at quite well defined critical wavelengths. Those wavelengths can bereadily converted into critical effective quantum numbers hsn , midn , and pdn . The in
are robust indicators for the electric field, because they are solely determined by the
general spreading behavior of the quasi-continuous h -features. No absolute linestrength or line-strength ratio needs to be determined. Near the ionization threshold,the electric field leads to a termination of the Rydberg series at a low value of n (45 inFig. 1) and to continuum lowering.
FIGURE 1 Experimental Rydberg excitation spectrum of 87Rb 5P3/2-atoms embedded in a laser-generated ion plasma. There exist three types of spectral gaps with low oscillator strength, which wedenote hs-, mid- and pd-gaps. Due to the Stark effect, the spectral gaps become filled in at certaincritical wavelengths that depend on the strength of the plasma electric field. The detail plots in thelower row show how we determine the critical wavelengths.
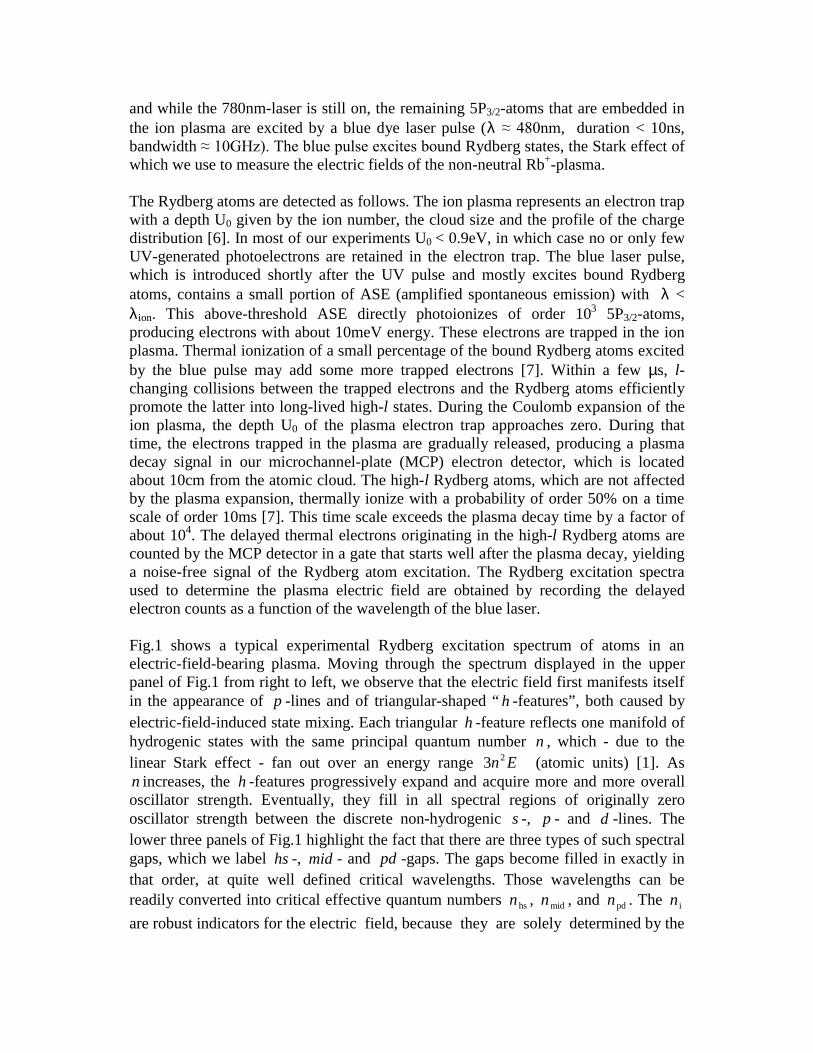
The origin of the closing of the spectral gaps becomes evident by a consideration ofthe Stark map of rubidium. Fig.2 shows that the hs-gap below the hydrogenic levelswith principal quantum number n disappears when the energy shift 2/3 2En− of themost red-shifted hydrogenic state equals the splitting 313.0 −n between the unshifted
hydrogenic energy )2/(1 2n− and the energy of next-lower s-state, ( ){ }213.02/1 +− n .There, the numerical value 0.13 is the non-integer part of the s-quantum defect of Rb.The gaps between the states sn )3( + and dn )1( + and between the hydrogenic states
)1( −n and the states pn )2( + close at practically identical electric fields; we labelthose gaps mid -gaps. Finally, the pd -gaps disappear when neighboring hydrogenic
manifolds meet, i.e. when 323 −= nEn . Thus, the knowledge of the quantum defects is
sufficient to find approximate relations between electric-field strength and the aboveintroduced critical quantum numbers hsn , midn , and pdn .
The electric field in our approximately Gaussian ion clouds follows a probabilitydistribution, which we have calculated and found to be strongly dominated by a peakaround a most probable electric field maxE . Using a large set of isotropic excitation
spectra of Rydberg atoms in fixed electric fields, and employing the electric-fieldprobability distributions of Gaussian ion clouds as weighting functions, we havecalculated model spectra of Rydberg atoms embedded in Gaussian ion clouds. Themodel spectra, which qualitatively appear identical to the experimental spectrum inFig.1, have been used to establish the following relationships between the mostprobable electric field maxE and the values of hsn , midn , and pdn :
5pdmax
5midmax
5hsmax
260.0
145.0
050.0
−
−
−
===
nE
nE
nE
(1)
(field in atomic units).
FIGURE 2 Stark map of Rb for magnetic quantum number m=0 in the vicinity of the n=19 and n=20hydrogenic manifolds.
We have used Eqs.1 to experimentally determine the values of maxE in ion clouds with
diameters of ~ 1mm and various ion numbers. The delay time between the UV-pulsesused to produce the ions and the blue pulses that excite Rydberg atoms embedded inthe ion clouds is 23ns, which is long enough for the UV-generated photoelectrons to
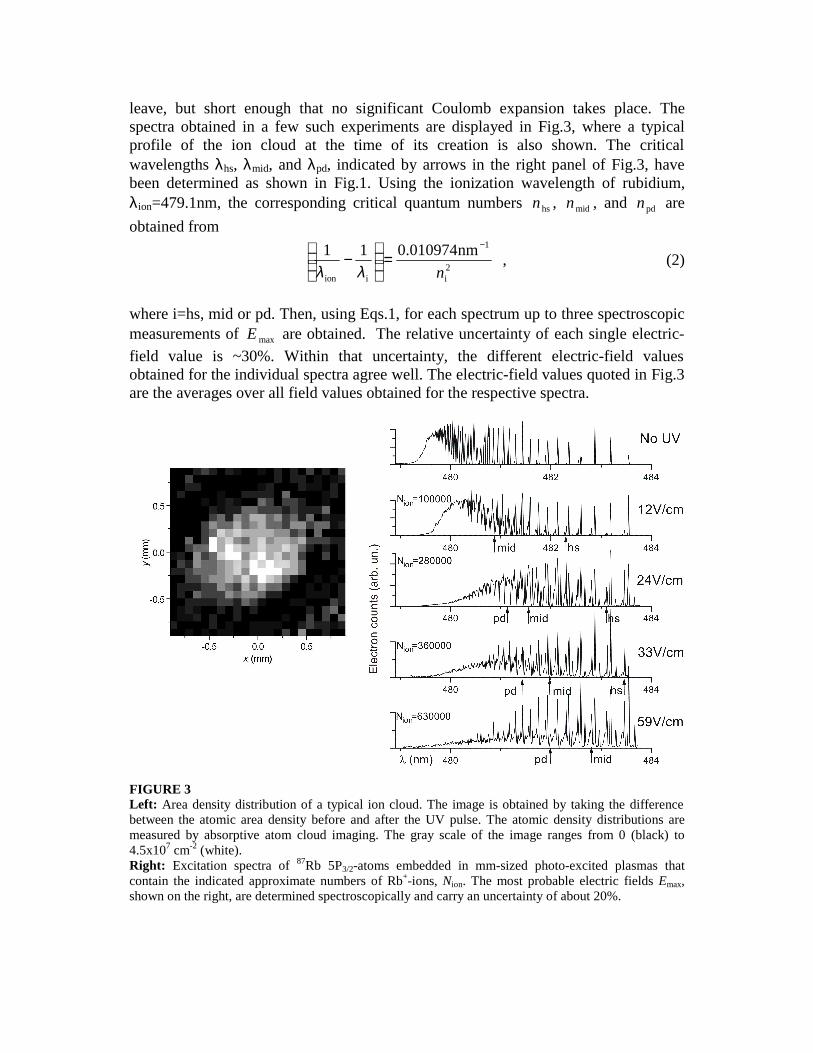
leave, but short enough that no significant Coulomb expansion takes place. Thespectra obtained in a few such experiments are displayed in Fig.3, where a typicalprofile of the ion cloud at the time of its creation is also shown. The criticalwavelengths λhs, λmid, and λpd, indicated by arrows in the right panel of Fig.3, havebeen determined as shown in Fig.1. Using the ionization wavelength of rubidium,λion=479.1nm, the corresponding critical quantum numbers hsn , midn , and pdn are
obtained from
2i
1
iion
nm010974.011
n
−
=
−
λλ , (2)
where i=hs, mid or pd. Then, using Eqs.1, for each spectrum up to three spectroscopicmeasurements of maxE are obtained. The relative uncertainty of each single electric-
field value is ~30%. Within that uncertainty, the different electric-field valuesobtained for the individual spectra agree well. The electric-field values quoted in Fig.3are the averages over all field values obtained for the respective spectra.
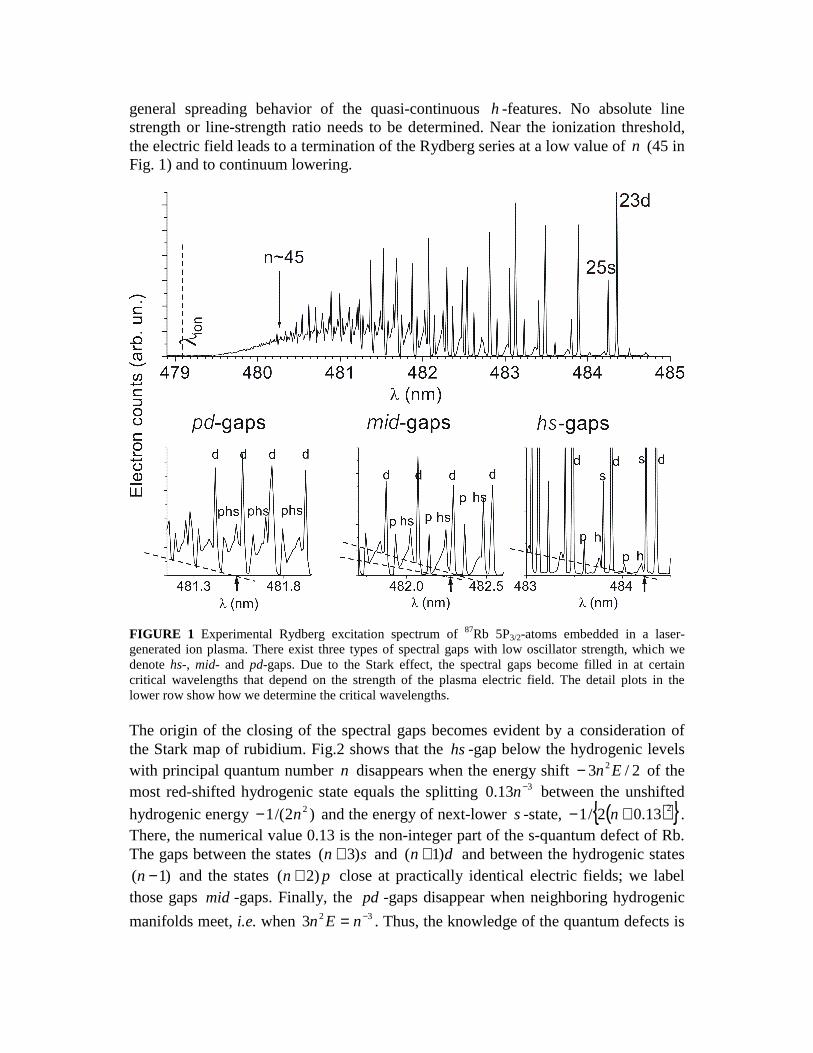
FIGURE 3Left: Area density distribution of a typical ion cloud. The image is obtained by taking the differencebetween the atomic area density before and after the UV pulse. The atomic density distributions aremeasured by absorptive atom cloud imaging. The gray scale of the image ranges from 0 (black) to4.5x107 cm-2 (white).Right: Excitation spectra of 87Rb 5P3/2-atoms embedded in mm-sized photo-excited plasmas thatcontain the indicated approximate numbers of Rb+-ions, Nion. The most probable electric fields Emax,shown on the right, are determined spectroscopically and carry an uncertainty of about 20%.
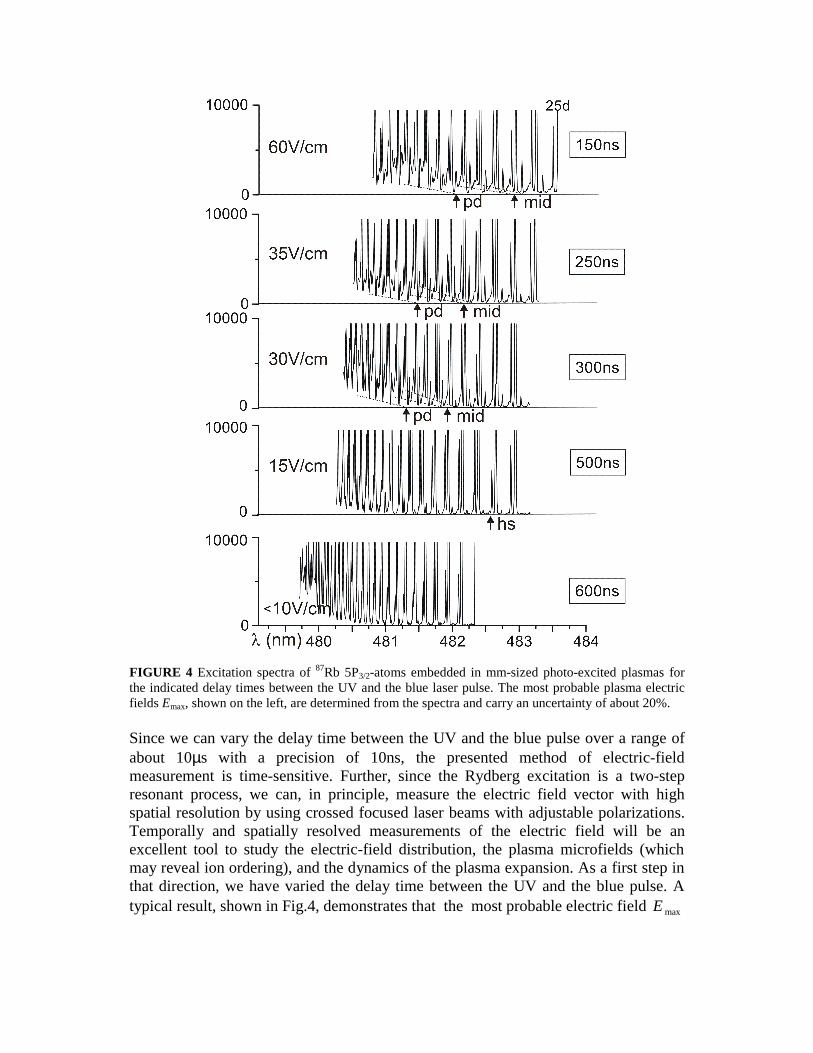
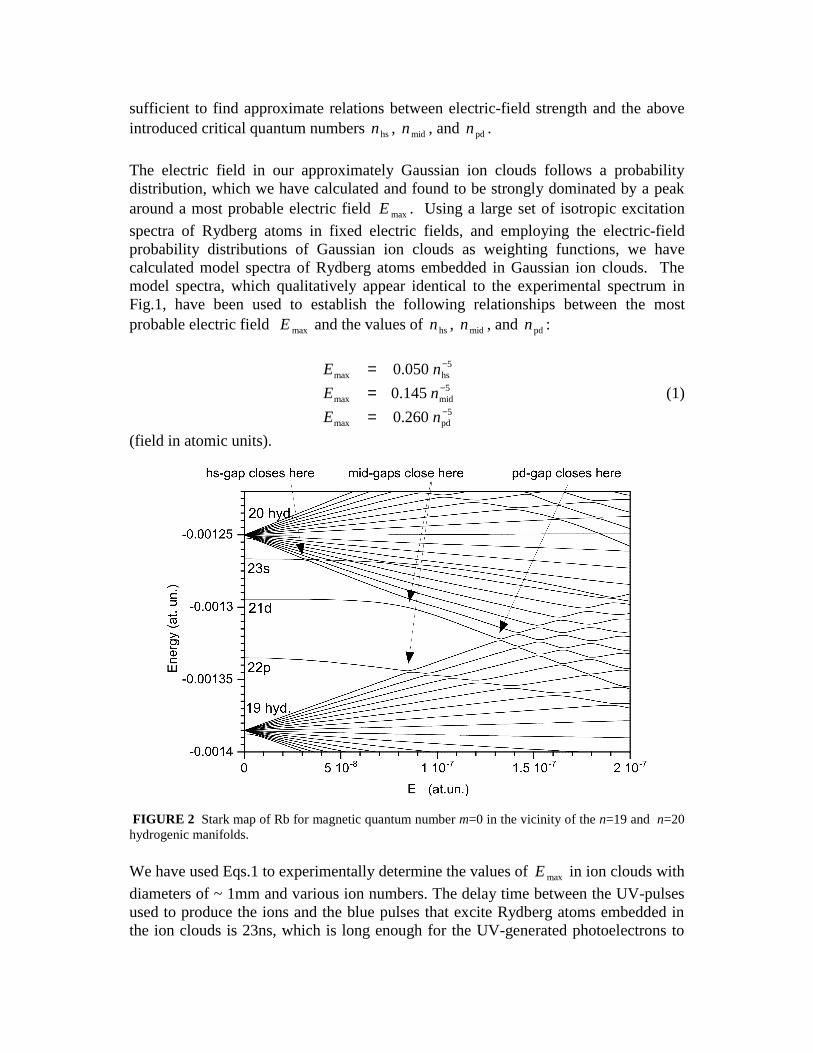
FIGURE 4 Excitation spectra of 87Rb 5P3/2-atoms embedded in mm-sized photo-excited plasmas forthe indicated delay times between the UV and the blue laser pulse. The most probable plasma electricfields Emax, shown on the left, are determined from the spectra and carry an uncertainty of about 20%.
Since we can vary the delay time between the UV and the blue pulse over a range ofabout 10µs with a precision of 10ns, the presented method of electric-fieldmeasurement is time-sensitive. Further, since the Rydberg excitation is a two-stepresonant process, we can, in principle, measure the electric field vector with highspatial resolution by using crossed focused laser beams with adjustable polarizations.Temporally and spatially resolved measurements of the electric field will be anexcellent tool to study the electric-field distribution, the plasma microfields (whichmay reveal ion ordering), and the dynamics of the plasma expansion. As a first step inthat direction, we have varied the delay time between the UV and the blue pulse. Atypical result, shown in Fig.4, demonstrates that the most probable electric field maxE
decays over a time of order 500ns, which shows that the Coulomb explosion of theplasma cloud takes about 500ns.
ACKNOWLEDGMENTS
We acknowledge support by the NSF (Grant PHY-9875553) and partial support by theChemical Sciences, Geosciences and Biosciences Division of the Office of BasicEnergy Sciences, Office of Science, U.S. Department of Energy. Support has alsobeen provided by the Optical Physics Interdisciplinary Laboratory (OPIL) and theFOCUS Physics Frontier Center at the University of Michigan. We further thank Prof.P. Bucksbaum for generous loaning of equipment, and B. K. Teo for assistance withthe experiment.
REFERENCES
1. Gallagher, T. F., Rydberg Atoms, Cambridge University Press, Cambridge 1994.2. Ducas, T. W., Spencer, W. P., Vaidyanathan, A. G., Hamilton, W. H., Kleppner, D., App. Phys. Lett. 35, 382
(1979), Figger, H., Straubinger, R., Walther, H., Leuchs, G., Opt. Comm. 33, 37 (1980), Gross, M., Goy, P.,Fabre, C., Haroche, S., Raimond, J. M., Phys. Rev. Lett. 43, 343 (1979).
3. Neukammer, J., Rinneberg, H., Vietzke, K., Koenig, A., Hieronymus, H., Kohl, M., Grabka, H.-J., Wunner,G., Phys. Rev. Lett. 59, 2947 (1987).
4. Cavity Quantum Electrodynamics, edited by P. R. Berman, Academic Press, Inc., San Diego 1994.5. Ganguly, B. N., J. Appl. Phys. 6, 571 (1986), Shoemaker, J. R., et al., Appl. Phys. Lett. 52, 2019 (1988),
Hebner, G. A., et al., J. Appl. Phys. 76, 4036 (1994).6. Killian, T. C., et al., Phys. Rev. Lett. 83, 4776 (1999).7. Dutta, S. K., Feldbaum, D., Walz-Flannigan, A., Guest, J. R., Raithel, G., Phys. Rev Lett. 86, 3993 (2001).