the marsh monitoring program - bird studies canada · data analysis ... b7 instrument calibration...
TRANSCRIPT

THE MARSH MONITORING PROGRAM
QUALITY ASSURANCE PROJECT PLAN
Prepared for:
U.S. Environmental Protection Agency Great Lakes National Program Office
West Jackson Boulevard Chicago, Illinois 60604-3590
GLNPO ASISTANCE ID # GL975139-01-0
Prepared by:
Marsh Monitoring Program
Bird Studies Canada P.O. Box 160
Port Rowan, Ontario NOE 1M0 Canada
Phone: (519)586-3531 FAX: (519)586-3532
Email: [email protected] Web: www.bsc-eoc.org
Approved March 2, 2000

MMP Quality Assurance Project Plan, Page 1
TABLE OF CONTENTS SECTION A.............................................................................................................................................................. 2 A3 Distribution List for Quality Assurance Project Plan......................................................................................... 2 A4 Project/Task Organization.................................................................................................................................. 2
Project Personnel .................................................................................................................................................. 2 Advisory Committee ............................................................................................................................................. 3
A5 Problem Definition/Background ........................................................................................................................ 3 A6 Project/Task Description and Schedule.............................................................................................................. 4 A7 Quality Objectives and Criteria for Measurement Data ..................................................................................... 5
Trend Estimates .................................................................................................................................................... 5 Site-specific Assessments ..................................................................................................................................... 6 Habitat Associations ............................................................................................................................................. 7
A8 Special Training Requirements .......................................................................................................................... 8 A9 Documentation and Records .............................................................................................................................. 9
SECTION B.................................................................................................................................................................. 9 B1 Sampling Process Design (Experimental Design) .............................................................................................. 9
Route and Survey Type Selection ......................................................................................................................... 9 Amphibian Surveys............................................................................................................................................. 10 Bird Surveys........................................................................................................................................................ 10 Habitat Descriptions............................................................................................................................................ 11
B2 Sampling Method Requirements ...................................................................................................................... 11 B3 Sample Handling and Custody Requirements .................................................................................................. 11 B4 Analytical Methods Requirements ................................................................................................................... 11 B5 Quality Control Requirements........................................................................................................................... 11
Data Entry ........................................................................................................................................................... 11 Data Analysis ...................................................................................................................................................... 12
B6 Instrument/Equipment Testing, Inspection, and Maintenance Requirements ................................................... 12 B7 Instrument Calibration and Frequency ............................................................................................................. 13 B8 Inspection/Acceptance Requirements for Supplies and Consumables ............................................................. 13 B9 Data Acquisition Requirements (Non-direct Measurements)........................................................................... 13 B10 Data Management........................................................................................................................................... 13
SECTION C................................................................................................................................................................ 13 C1 Assessments and Response Actions ................................................................................................................. 13 C2 Reports to Management.................................................................................................................................... 13
SECTION D................................................................................................................................................................ 14 D1 Data Review, Validation, and Verification Requirements ............................................................................... 14 D2 Validation and Verification Methods ............................................................................................................... 14 D3 Reconciliation with Data Quality Objectives ................................................................................................... 14
REFERENCES ........................................................................................................................................................... 14 FIGURES.................................................................................................................................................................... 19 APPENDIX 1.............................................................................................................................................................. 21

MMP Quality Assurance Project Plan, Page 2
SECTION A
A3 Distribution List for Quality Assurance Project Plan
• John P. Schneider, USEPA – Great Lakes National Program Office, Project Officer • Louis Blume, USEPA – Great Lakes National Program Office, Quality Assurance Manager • Michael S.W. Bradstreet, Bird Studies Canada, Executive Director • Russ C. Weeber, Bird Studies Canada, Aquatic Surveys Coordinator & Project Manager • Donna Stewart, Manager, Environment Canada, Environmental Conservation Branch – Ontario
Region • Margaret Wooster, Great Lakes United, Executive Director • Marsh Monitoring Program Science and Technical Advisory Committee
A4 Project/Task Organization
Project Personnel Russ C. Weeber, Aquatic Surveys Coordinator & Project Manager Bird Studies Canada, P.O. Box 160, Port Rowan, Ontario, Canada N0E 1M0 Phone: (519)586-3531, Email: [email protected] Mr. Weeber is responsible for the overall management of the Marsh Monitoring Program (MMP) including preparing the QAPP, acquiring and supervising staff, conducting and coordinating data analysis, and ensuring QA/QC, reporting and other targets are met. Mr. Weeber will be the primary contact for program partners and supporters. He has served as Coordinator since 1997. In addition, Mr. Weeber has extensive experience in wetland ecology, and data collection, analysis and reporting. Kathy E. Jones, Aquatic Surveys Officer Bird Studies Canada, P.O. Box 160, Port Rowan, Ontario, Canada N0E 1M0 Phone: (519)586-3531, Email: [email protected] Ms. Jones is responsible for communicating and servicing MMP participants, managing and entering to computer all incoming data, and implementing QA/QC procedures. Ms. Jones is the primary contact for MMP volunteers and for inquiries from prospective participants. She has served in this position since 1995 and has several years experience maintaining large and complex databases. Aquatic Surveys Assistant Coordinator Bird Studies Canada, P.O. Box 160, Port Rowan, Ontario, Canada N0E 1M0 This position concept is currently under development; placement of an individual in this position is anticipated for spring 2000. The Assistant Coordinator will help develop the MMP with respect to specific program initiatives which will include a comprehensive analysis and reporting of MMP data, enhanced participant recruitment and special conservation-research projects. He or she will be expected to take the lead on specific development efforts and to collaborate with colleagues on other efforts. Dr. Charles M. Francis, Senior Scientist Bird Studies Canada, P.O. Box 160, Port Rowan, Ontario, Canada N0E 1M0 Phone: (519)586-3531, Email: [email protected]

MMP Quality Assurance Project Plan, Page 3
Dr. Francis provides scientific oversight to all BSC programs and will review and advise on QA/QC procedures, data management, and statistical analyses with respect to the MMP. Dr. Francis has extensive experience in research and analysis, and has a strong background in computer programming, data management and manipulation, statistical data analysis, and sample survey design. Advisory Committee In addition, input to the MMP regarding scientific matters is provided by the MMP Scientific and Technical Advisory Committee (STAC). The STAC consists of project staff (Weeber and Jones), other BSC staff (Francis and Jon D. McCracken (Program Manager)) and Environment Canada staff (Dr. Christine Bishop (Wildlife Toxics Biologist), Mike Cadman (Songbird Biologist) and Lesley Dunn (Wetland Biologist)). The STAC conducts formal meetings annually with periodic updates and consultations done throughout the year as needed. A5 Problem Definition/Background
The Great Lakes are one of the most prominent features of the North American landscape and provide immeasurable services that extend far beyond the basin’s boundary. Despite the impacts associated with the expansion of intensive urban, agricultural, and industrial development over the last century, Great Lakes ecosystems still provide important benefits to the region’s inhabitants. Through several bi-national initiatives, most notably the Great Lakes Water Quality Agreement (GLWQA), the governments of the United States and Canada have made public their commitment to the conservation and restoration of Great Lakes ecosystem functions. The two governments, through the State of the Lakes Ecosystem Conference (SOLEC), have recently begun to define a coordinated approach to monitoring progress toward meeting the objectives of the GLWQA. Initiatives such as Lakewide Management Plans (LaMPs), Areas of Concern (AOCs), the North American Waterfowl Management Plan (NAWMP), the North American Bird Conservation Initiative (NABCI) and others are helping to coordinate the protection, restoration and management of a wide range of ecosystems and their inhabitants. Wetlands, one of the most productive systems in the Great Lakes basin and zones of transition between lake and upland habitats, are critical to sustaining and rehabilitating both open lake and terrestrial systems. Flood water storage, groundwater filtering and recharge, nutrient uptake and shoreline stabilization are only a few of the physical and chemical functions provided by healthy wetlands. As host to a wide array of both common and rare plants and animals, wetlands serve as important repositories of Great Lakes biodiversity. Wetlands provide breeding habitat for invertebrates, fish, amphibians, birds and mammals, and intact wetlands are necessary for the sustenance and recovery of these communities. As sites of natural beauty and scenery, wetlands are also inherently valuable components of the region’s landscape. Unfortunately, the values of healthy wetlands have not always been recognized. Obvious impacts to wetlands such as draining and filling, and the more subtle degradations due to water level stabilization, sedimentation, eutrophication, and exotic species invasions have combined to dramatically reduce the area and function of Great Lakes wetlands. Groups ranging from local citizen committees to provincial, state and federal agencies are coordinating efforts to restore damaged wetland habitats and to reduce the impacts to those few high quality wetlands that still remain. Monitoring their progress and identifying gaps in these efforts are two of the primary motivations for the development, through the SOLEC process, of tools with which to measure the status and trends of Great Lakes coastal wetland health. Tools developed for basin-wide monitoring must provide information on wetland functions in an efficient, understandable and geographically extensive manner. The status and trends of wetland-dependent
MMP Quality Assurance Project Plan, Page 4
wildlife, particularly those of birds and amphibians, can serve as a tool for assessing the health of both inland and coastal Great Lakes wetlands. Wetland-dependent wildlife rely on the physical, chemical and biological health of their habitats and, through the integration of these wetland functions, provide an opportunity to measure the status of these attributes indirectly. Because these relationships are particularly strong during the breeding season, the presence and abundance of breeding individuals can provide a source of information on the status of these functions. Wetland birds require an appropriate mix and density of vegetation, sufficient food resources, and freedom from predation and other disturbances to successfully attract mates and to hatch and raise their young. Many amphibian species require access to wetland areas for egg laying and larval development and several species depend on wetland habitats for their entire life cycle. Because these sensitive life history stages are so strongly aquatic, amphibians are also sensitive indicators of many water quality characteristics (e.g. contaminant or nutrient loadings, dissolved oxygen availability). Effective monitoring and conservation of Great Lakes resources requires not only the best possible science but also the commitment and involvement of the region’s citizens, those with the greatest stake in the health of the basin’s ecosystems. The recent growth in nature-oriented recreational pursuits (birding in particular) has helped develop strong natural history and identification skills in a significant portion of the basin’s citizens. The strong connections between wetland functions and breeding birds and amphibians, and the potential for skilled citizen involvement in monitoring, provide an important opportunity to gather cost-effective information on the health of Great Lakes wetlands. A6 Project/Task Description and Schedule
The MMP is designed to address the monitoring needs identified above by coordinating annual volunteer-based surveys of birds and amphibians breeding in emergent wetlands (i.e. marshes) of the Great Lakes. The MMP is delivered by BSC in partnership with Environment Canada and with considerable support from the USEPA’s Great Lakes National Program Office (GLNPO) and Lake Erie Team. After one year of protocol development and field testing, the bird survey component of the MMP was initiated in Ontario in 1994; the program expanded to the entire Great Lakes basin and a calling amphibian survey was added in 1995. Since that time, the program has involved approximately 250-300 volunteers annually, with survey routes established throughout the basin. The MMP is unique in being the only large scale, ongoing program specifically designed to monitor breeding marsh birds and amphibians. The objectives of the MMP are to:
• Monitor populations of marsh birds and amphibians over time on a variety of spatial scales. • Investigate habitat associations of marsh birds and amphibians. • Contribute to the assessment of Great Lakes AOCs with respect to marsh bird and amphibian
presence and abundance. • Increase awareness of marsh bird, amphibian and wetland conservation issues through volunteer
participation and communication to the public, scientists and regulators. Participants are recruited to the MMP through a variety of means including press releases to newspapers, radio and other media, and networking with birding, other naturalist’s clubs and with other groups (e.g. Remedial Action Plan Committees). Marsh Monitoring Program staff field inquiries from interested participants who then register with the program. New participants receive a full MMP Training Kit containing: written instructions for surveying marsh birds, amphibians and their habitats (Long Point Bird Observatory and Environment Canada 1997); data forms; an instructional tape with examples of the songs and calls of the birds and amphibians most likely to be encountered in the Great Lakes basin; and, for bird surveyors, an additional cassette tape to be used in a playback fashion to elicit calls from secretive bird

MMP Quality Assurance Project Plan, Page 5
species. Returning participants receive new materials to replace those submitted after the previous year’s survey season. All Training Kits are accompanied by a cover letter welcoming the volunteer to (or back to) the program and highlighting elements of the protocol needing reinforcement. Participants also receive an annual newsletter that summarizes survey results and includes articles on marsh ecology, amphibians and marsh birds. Data are periodically analyzed in support of a wide variety of reporting that includes but is not limited to: an annual MMP newsletter; progress reports to funding sources; articles for BSC and other newsletters; MMP web pages; and scientific manuscripts and presentations. Along with sharing data directly, these communications are designed to provide information to agencies and organizations concerned with conserving and restoring the health of Great Lakes wetlands and to contribute to the conservation initiatives outlined above (e.g. LaMPs, AOCs). As an ongoing monitoring program, there are a several activities conducted by staff that occur on an annual basis in support of the MMP. Those activities are summarized in Table 1. A7 Quality Objectives and Criteria for Measurement Data
To meet the objectives of the program, MMP data must be of sufficient quantity and quality to: 1. provide relevant and reliable trend estimates, 2. contribute to site-specific assessments, and 3. serve as the foundation for habitat association models.
Each of these can be assessed with respect to accuracy, precision, bias, representativeness, comparability, and completeness. Trend Estimates Accuracy True population trends require complete counts of all individuals in the sample units. True population trends of wetland amphibians and birds are unknown for spatial and temporal scales relevant to regional conservation management planning; exhaustive counts for even single sites are very rare. Monitoring programs such as the MMP are needed to provide reliable estimates of population trends. The reliability of those estimates depends to a large degree on their associated precision and bias. Precision As with many other geographically and temporally extensive monitoring programs, trend estimates derived from MMP data rely on measures of species relative abundance for a large number of sites rather than exhaustive counts at a small number of sites. Known relationships between indices of relative abundance and actual numbers of individuals are desirable, but not necessary, for reliable trend estimates. These relationships have been demonstrated for some amphibian species (Shirose et al. 1997). Useful trend estimates based upon relative abundance have been well documented for large-scale, long-term monitoring programs similar to the MMP (e.g. Breeding Bird Survey, Link and Sauer 1998) and good trend resolution has been demonstrated using MMP data (Francis and Chabot 1997). Measures of relative abundance must be of sufficient precision to provide trends with reasonable statistical power. The statistical power of trend estimates depends on the number of sample points (years and survey stations), species’ detection frequency, the precision of species counts, and the analytical technique employed. The precision data quality indicator can therefore be evaluated through estimates of the power of MMP data to detect trends. Francis and Chabot (1997) used 1995 and 1996 MMP data to evaluate whether the data were sufficient to provide population trend estimates for marsh birds and amphibians. The ability of MMP data to detect changes in species abundance improved with increasing numbers of years and routes (Table 2). Francis and Chabot (1997) concluded:

MMP Quality Assurance Project Plan, Page 6
“. . . the power of the surveys appears to be fairly good for many species, at least for
detecting longer term trends. With 50 routes for a species, the survey could potentially detect population changes of as little as 2% per year over a 10-year interval (i.e. 11 years of surveys). This represents about a 20% cumulative change over that period. With 100 routes, the survey could detect even smaller changes (about a third less).”
There have been approximately 300 routes surveyed each year since 1995, suggesting the power to detect population changes should be at least as good as the estimates in the 5-year, 100 route scenario (Table 2). Bias Estimates of population change are possible based upon presence/absence data (e.g. Strayer 1999). Given the detailed training materials provided and the identification skills of MMP surveyors, bias associated with measures of presence should be minimal. Amphibians and birds may be present but undetected at a given survey station or may be temporarily absent from the site. For these and other reasons, measures of absence are more subject to bias. Repeated visits and broadcast tapes are commonly used to reduce the bias associated with absence measures (e.g., Gibbs and Melvin 1993, Shirose et al. 1997). Three and two visits are made for MMP amphibian and bird surveys respectively and the broadcast tape is used to reduce the incidence of biased conclusions of absence for a set of normally elusive bird species. Representativeness Routes are selected with respect to the accessibility of wetlands and their proximity to an interested surveyor rather than through a strictly random selection scheme. Extrapolations of trend estimates are therefore made to the surveyed routes and to wetlands which can reasonably be judged to be similar to surveyed routes (e.g. stratified by wetland type, size and geographic region). Comparability Protocols for the MMP were derived from established surveys (e.g. Ontario Amphibian Road Call Count) and previous studies (e.g. Gibbs and Melvin 1993) which have also been influential in the development of other monitoring programs in other states and provinces. This common basis improves the potential for results to be compared across programs. Despite minor alterations to the MMP protocol following the first couple years of implementation, MMP data is internally comparable both through time and across routes. Completeness The quantity of data submitted must be sufficient to resolve trends with reasonable statistical power. As indicated in Table 2, at least 100 routes monitored for 5-years are required to identify trends of 2-5% annually for many species. Data from at least this many routes will be available for future trend analysis work. Site-specific Assessments Accuracy True counts of the number of amphibians and birds are not available for wetlands within AOCs or for most other sites for which management planning is required. Relative abundance and patterns of presence/absence are therefore necessary to estimate the status and trends of amphibians and birds in AOCs and other sites. The accuracy of these estimates depend upon the associated precision and bias.

MMP Quality Assurance Project Plan, Page 7
Precision The precision of relative abundance estimates for a specific site depends upon the number of stations surveyed and the number of visits made to those stations. Precision can be limited with the minimum number of stations and visits required by the MMP protocol. Surveyors interested in intensive assessments of the numbers of amphibians and birds using a particular site are encouraged by MMP staff to maximize the number of stations and survey visits. Bias Pre-disturbance (baseline) data is usually lacking for most sites which have been heavily damaged (e.g. AOCs). In some circumstances, this absence of baseline data may introduce the potential for bias in site-specific estimates of species occurrence and abundance trends. Even for circumstances in which MMP data is not sufficiently free of bias to meet statistical requirements, MMP data can provide a useful baseline of quantitative data and is sufficiently reliable to support many management-related decision A significant and positive relationship has been documented for two species (Fowler’s Toad, (Bufo fowleri) and Bullfrog (Rana catesbiana)) between the number of individuals counted (Call Level Codes 1 and 2) and the number of individuals captured through intensive sampling of calling choruses (Shirose et al. 1997). This relationship suggests that, at least for these species, trends in indices of relative abundance are in fact related in a predictable fashion to population changes. As described above, presence/absence data can be useful in assessing status and trends, and MMP Training Kit materials are designed to reduce the bias associated with measures of presence/absence. s. Representativeness Substantial efforts are made to ensure that sampling intensity is as high as possible in appropriate marsh habitat in AOCs. Because almost all marshes in AOCs are surveyed, results of MMP surveys are expected to be representative within AOCs. Similar survey intensity in other sites is expected to also provide representative sampling. Comparability At minimum, standard MMP protocols are used in all AOCs and in other sites of interest. The only deviation recommended from the standard protocol is an increase in the number of survey stations and survey visits. Through simple analytical techniques, results from these more intensive surveys can be easily compared with those from standard protocol applications. Completeness The quantity of data submitted must be sufficient to support assessments of restoration and other management efforts. In most circumstances concerning specific sites, data are insufficient to meet rigorous statistical thresholds but are of a quantity and quality required to meet most management-oriented thresholds. Habitat Associations Accuracy As mentioned above, exhaustive counts of the number of amphibians and birds making use of a large number of wetlands are extremely difficult to obtain. Many useful models of habitat associations do not require exhaustive counts but rely instead on presence/absence information. As discussed in previous sections, measures of presence are likely to be very accurate and MMP Training Kit materials help improve the accuracy of measures of absence.

MMP Quality Assurance Project Plan, Page 8
Precision Both relative abundance and presence/absence data from the MMP have been shown to be of sufficient precision to resolve statistically significant differences in relative abundance or frequency of occurrence in relation to habitat characteristics. Francis and Chabot (1997) employed simple and multiple regressions (linear and quadratic) to characterize habitat relationships based on MMP data. Results of the multiple regressions are presented in Table 3. In addition, analyses currently underway provide evidence that presence/absence MMP data are sufficiently precise to construct meaningful and reliable (as measured by a cross-validation derived concordance value) habitat association models (Figure 1). Bias Habitat associations are constructed on a station level basis. Because species occurrence, counts and habitat characterizations are done at the same station, are based on a detailed protocol, and are conducted by the same observer, bias associated with habitat associations is likely to be low. For reasons similar to those mentioned above, bias should be particularly low for habitat association models based upon presence/absence data. Representativeness To the extent habitat relationships in surveyed wetlands are similar to those in wetlands with similar vegetation, size and other characteristics, the habitat associations derived from MMP data should be representative of both surveyed wetlands and comparison wetlands. For this reason, extrapolations of habitat associations are made to wetland types similar to those surveyed. Comparability As described above, MMP protocols are closely related to other monitoring programs in other states and provinces. Protocols ensure MMP data is internally comparable both through time and within years. Completeness The quantity of data submitted must be sufficient to resolve habitat associations with reasonable statistical and predictive power. Quantities of data comparable to those used for the examples provided (Table 3, Figure 1) are expected to be sufficient for this purpose. A8 Special Training Requirements
Participants with the MMP must be able to detect (visually and aurally) and identify to species the marsh birds and amphibians at their survey stations. In addition, MMP surveyors must be able to identify common wetland plants to genus and to estimate the percent cover of general habitat types (e.g. emergent vegetation, open water). The Training Kit is designed to augment prior experience to ensure that MMP participants are sufficiently skilled to provide high quality data. Training workshops are also conducted periodically by MMP staff. Amphibian surveys are well suited to beginning naturalists but bird surveys require volunteers to have moderately developed bird identification skills. Before registering with the program, prospective volunteers are guided by written and verbal communications with MMP staff in making their selection of which group to monitor. Training Kit materials provide figures and text descriptions of common wetland plants of sufficient detail to instruct even those with limited botanical expertise in the completion of the habitat assessment forms. The instructional tape provided to all participants provides surveyors with examples of the calls of all Great Lakes frogs and toads and includes a detailed description, with examples, of how to apply the three Call Level Codes. The calls and songs of commonly encountered wetland birds are also included on the instructional tape and are intended as a refresher for species already familiar to the surveyor and to help fill gaps in identification skills.

MMP Quality Assurance Project Plan, Page 9
A9 Documentation and Records
Several standardized forms are used by MMP surveyors to record and report their data. An example of each of the following forms are included in Appendix 1. Each year, the following data forms are provided to MMP volunteers prior to the survey season, are completed by surveyors during or after their survey visits, and then returned to Bird Studies Canada:
Amphibian Data Form – a heavy weight paper card, folded accordion-style, used in the field to record survey conditions and to map amphibians detected during a survey visit. The card includes recording sections for eight survey stations.
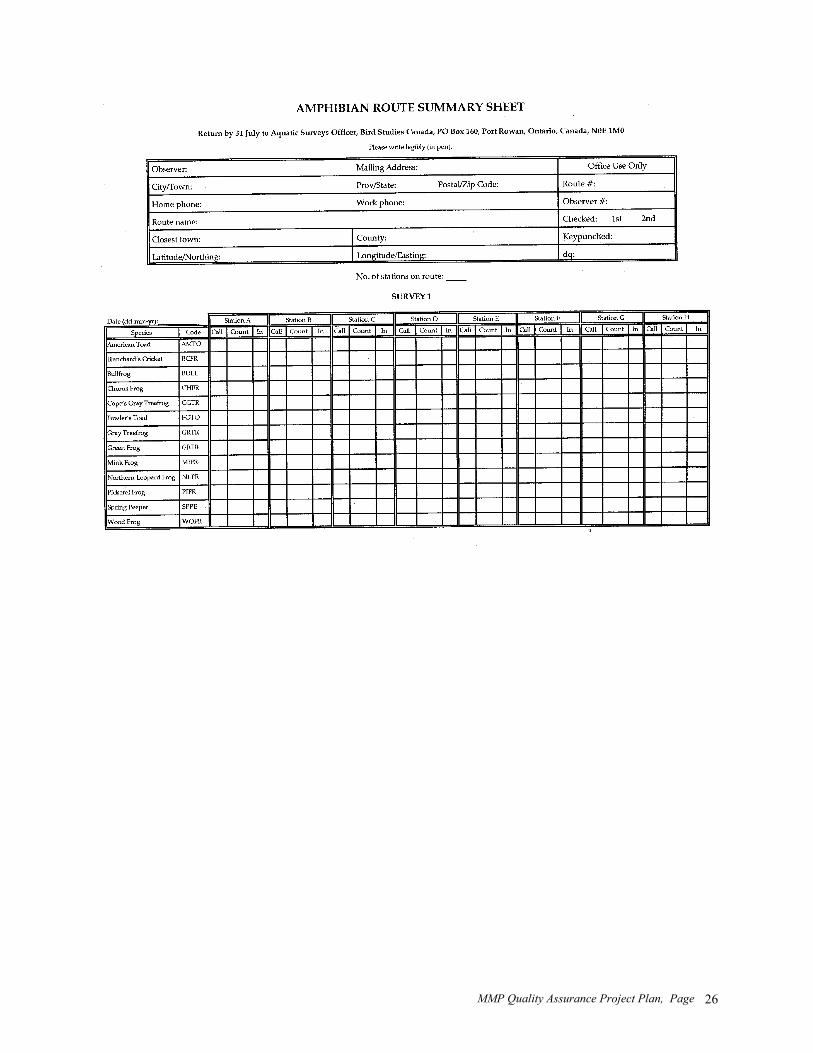
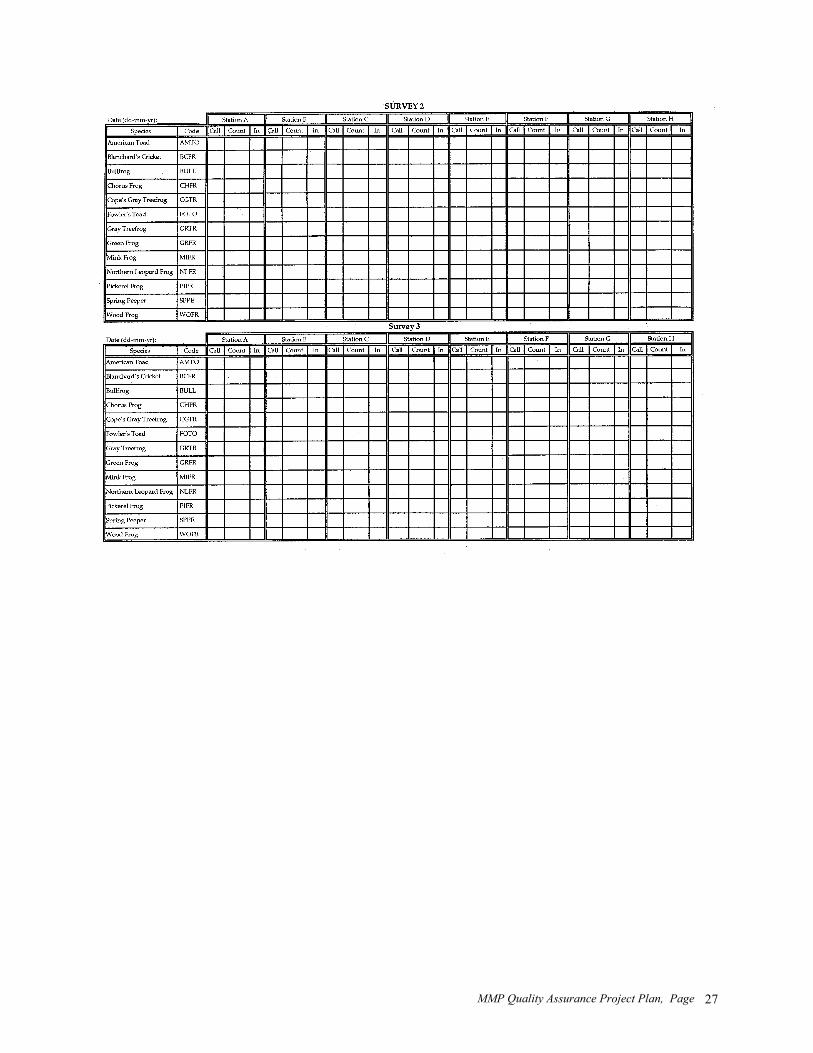
Amphibian Route Summary Sheet – a standardized form onto which MMP surveyors transcribe their observations for each amphibian station visited.
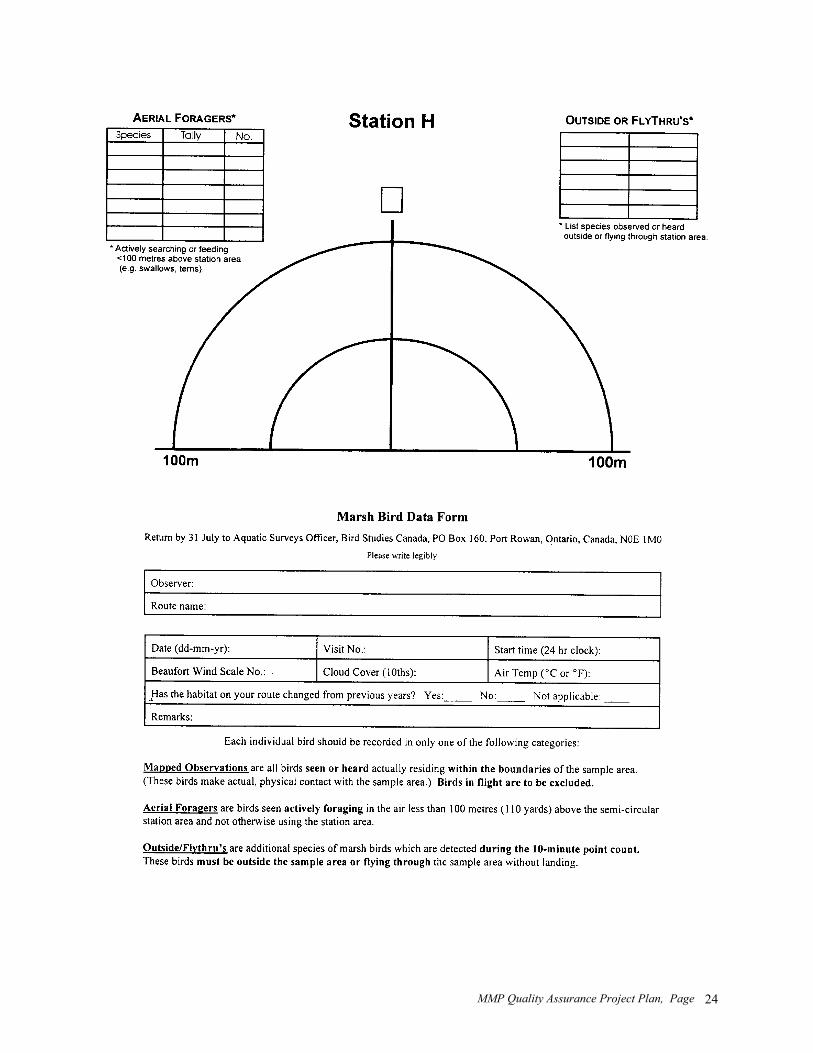
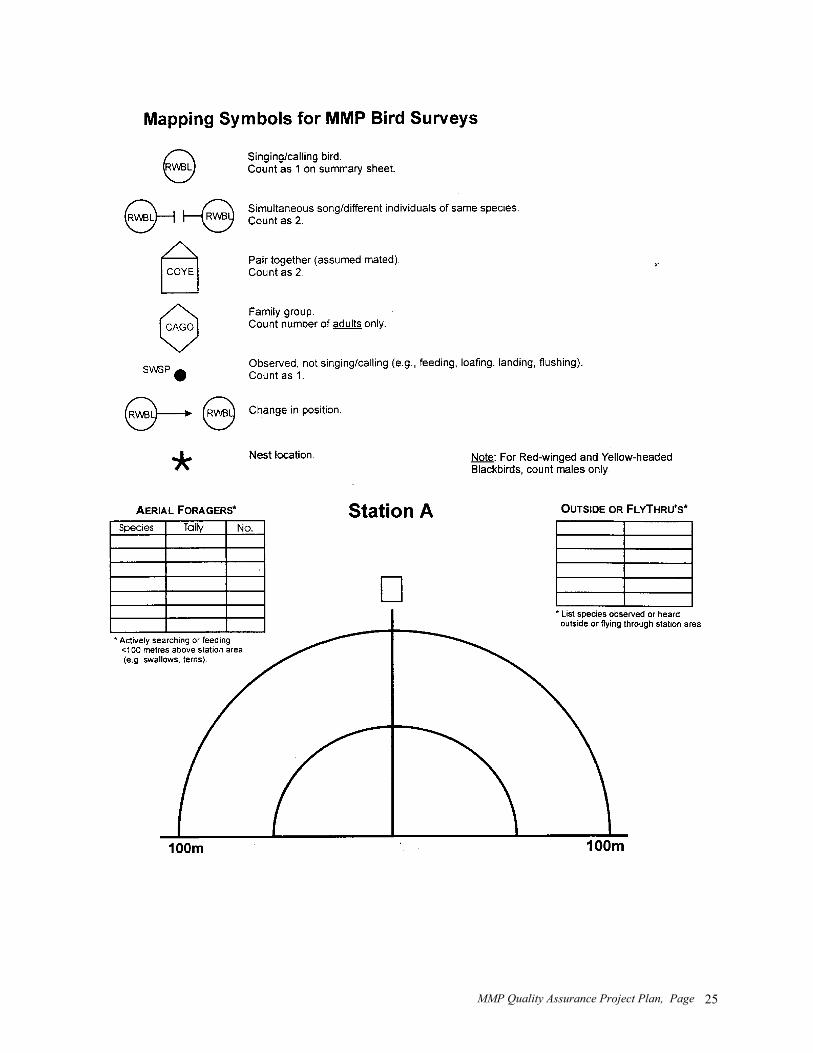
Bird Data Form – similar to the amphibian field card, this form is used in the field to record survey conditions and to map birds detected during a survey visit. The card includes recording sections for eight survey stations.
Marsh Bird Route Summary Sheet – a standardized form onto which MMP surveyors transcribe their observations for each bird station visited.
Habitat Description Form – a standardized form, submitted at the end of each survey season, used by MMP surveyors to record the vegetation and other habitat characteristics of each station surveyed.
All data forms and summary sheets are returned to Bird Studies Canada and directed to MMP staff. MMP staff manage and organize incoming data to ensure that, as they come in, all forms for a given route and year are kept together. Amphibian and marsh bird summary sheets, and habitat description forms, include a section for MMP staff use only. The following is recorded in this section (see section B5 for additional details): unique identifiers for the route and the observer; whether the data has been through each of the first two quality control steps; if the data has been entered to computer; and a data quality code associated with the data sheet. SECTION B
B1 Sampling Process Design (Experimental Design)
Route and Survey Type Selection In coordination with MMP staff, volunteers select wetland sites for their surveys and establish a survey route. Efforts are made to match new participants with abandoned routes and to fill known gaps in other ways. Although a particular effort is made to ensure that AOCs and other coastal wetlands are surveyed, building and maintaining a network of survey routes in inland marshes throughout Ontario and the Great Lakes states is also a priority. Each MMP survey route consist of from one to eight semi-circular sample stations, each with a radius of 100-metres (110 yards). Sample stations must face areas of emergent marsh vegetation — small numbers of trees or shrubs can occur within the station but more than half of the area within the semi-circle must be dominated by non-woody, emergent plants such as cattail, bulrush, reed, grasses or sedges. Both the marsh bird and amphibian surveys are conducted facing the curved portion of the semi-circle and from a focal point located at the centre of the 200-metre (220 yard) long base of the semi-circle. Stations are usually accessed along the edge of marshes, on a dike or trail. However, volunteers interested in monitoring a route accessible only by boat or canoe are encouraged to do so. In very large marshes, it may be possible for several different routes to be established by one or more volunteers. In smaller, or less accessible marshes, it may be feasible to establish only one or two stations.

MMP Quality Assurance Project Plan, Page 10
Surveys are conducted in the spring and early summer, and participants may choose to survey amphibians, marsh birds, or both. Because only 13 species of frogs and toads occur in the Great Lakes basin and their calls are well described in the Training Kit materials, the amphibian survey is most suitable for novice naturalists. Although volunteers do not need to have exceptional birding skills to conduct the marsh bird survey, the bird survey is not suited to beginning birders. As a general guideline, MMP staff ask that bird surveyors be able to correctly identify at least 50 species of common birds by sight and sound, especially those living in and around marshes. The training tape provided in the Training Kit is intended to help volunteers refresh their memory and fine-tune their identification skills. Amphibian Surveys Each amphibian survey station is visited on three nights, no less than 15 days apart, during the spring and early summer. Training materials guide volunteers in scheduling their survey visits. Amphibian survey visits begin one half hour after sunset and end before midnight. Amphibian calling intensity and the species composition of calling frogs and toads are strongly linked with season, time of day, and weather conditions; therefore, the appropriate weather conditions (i.e. moist nights with little or no wind) are strongly emphasized in training materials. Different species begin calling at different times of the season and these times are typically associated with air and water temperature. In consultation with amphibian monitoring experts, three "temperature thresholds" have been designed to help cover the calling initiation period of most Great Lakes frogs and toads. The first visit should coincide with minimum night-time air temperatures of at least 5° C (41° F) and the first or second warm spring shower. The second survey visit should occur with night-time air temperatures of at least 10° C (50° F) and the third visit should coincide with night-time air temperatures of at least 17° C (63° F). Amphibian surveyors are asked to conduct their survey visits on one of the first evenings (after mid-March) with appropriate temperatures. Each amphibian station is surveyed for three minutes and one of three Call Level Codes is used to categorize the intensity of calling activity for each species. The Call Level Codes, adapted from the Ontario Amphibian Road Call Count (see Bishop et al., 1997), are as follows:
Code 1: Calling individuals can be counted and calls are not simultaneous. In this instance, exact counts can be made of the number of calling individuals and surveyors are asked to record both the code and their count.
Code 2: Calls of individuals can be distinguished but some calling is simultaneous. Under these conditions, an exact count is not possible or expected but the surveyor should be able to make a reliable estimate of the number of individuals calling. Surveyors are asked to record both the code and their count estimate.
Code 3: A full calling chorus with calls continuous and overlapping. Reliable counts and even estimates are unrealistic at this level of calling intensity and no counts are requested.
Amphibian stations are separated by at least 500 metres (550 yards) in order to minimize the possibility that individuals or choruses are sampled twice. On routes established through the middle of a marsh, the semi-circular sample areas may be arranged back to back, so that stations face in opposite directions. Bird Surveys Each station surveyed for marsh birds is to be surveyed twice each year between May 20 and July 5 and no less than 10 days apart. Routes are to be surveyed in their entirety, in the same station sequence, at about the same time on both visits. As with calling amphibians, detection of marsh birds is strongly associated with season, time of day and weather. Surveys should begin in the evening, after 1800 h, and must end at or before sunset. Each station is surveyed for 10 minutes. A 5-minute broadcast tape, containing the territorial calls of some typically elusive bird species, is played during the first half of the each survey to help elicit calls from these normally undetected marsh birds.
MMP Quality Assurance Project Plan, Page 11
Individual birds heard or seen within the semi-circle sample area are counted and their locations are mapped on field data cards. Birds observed actively foraging above the station area (to a height of 100 metres) are counted and recorded separately. Birds detected from outside the station area are recorded as being present and are also tallied separately. Marsh bird survey stations are at least 250 metres (275 yards) apart to help avoid double counting. Unlike the amphibian surveys, these stations can not be arranged back to back because the broadcast tape will be heard by birds located within a full circle around the focal point, not just within the semi-circle. Habitat Descriptions In addition to monitoring their stations for marsh birds or amphibians, MMP volunteers are asked to use standard habitat description forms to describe the habitat in and around each sample station. Surveyors estimate the percent cover of major habitat types and floating plants within the station area; characterize the wetland in terms of permanency, size, and landscape context; and estimate the percentage of the emergent vegetation covered by up to four dominant genera of emergent vegetation (e.g. cattail (Typha) and bulrushes (Scirpus)). B2 Sampling Method Requirements
Call level codes and counts or estimated counts are required for amphibian surveys, counts are required for bird surveys and estimates of percent cover are needed for habitat descriptions. All counts and estimates can be done aurally and visually from the survey station’s focal point. Additional information such as sex and breeding evidence (e.g. nests) are not required data for this project. B3 Sample Handling and Custody Requirements
MMP participants record their names and a name they have selected for their route on all MMP data forms. Through these identifiers, MMP staff associate a code for each observer and a unique route identifier which indicates both the route number and the state/province in which the route is located (e.g. ON134). The summary sheets sent to returning MMP surveyors include a mailing label with full mailing address, route name and identifier, and the name of the town or city closest to the route (to aid in finding the route location on maps). All forms and summary sheets include a mailing address for the MMP (care of BSC). Following the survey season, MMP participants mail their completed forms to BSC. Upon arrival at BSC, all forms are transferred directly to the Aquatic Surveys Officer who stamps an arrival date for each set of forms, secures forms together for each route, and files the forms for the next stages of processing. B4 Analytical Methods Requirements
Not applicable to this project. B5 Quality Control Requirements
Quality control measures are broadly classified as those pertaining to entry of the data to computer (data entry) and those conducted during the preliminary phases of data analysis. Data Entry The data entry process involves three levels of quality control: pre-data entry checking, computer-based data entry forms with error screening, and post-data entry checking. Pre-data entry checking is conducted by the Aquatic Surveys Officer who:
• assigns unique route and observer identifier codes if needed; • checks all forms and summary sheets to ensure all required materials have been submitted;

MMP Quality Assurance Project Plan, Page 12
• screens all forms and summary sheets for some common problems (e.g. sequence of stations visited varies from alphabetical); and
• generally ensures all forms are ready for the data entry phase. All MMP data is entered and stored in Paradox (version 7, Borland) in a system of relational databases linked by route and observer identifiers, survey year, and other keyed fields (see Figure 2). Data entry is facilitated by customized data entry forms (computer screens) appropriate to each of the MMP summary sheets (amphibians and birds) and to the habitat description form. Certain fields (e.g. year) are set prior to the initiation of data entry, other fields are restricted to a range or a selected set of values (e.g. state/province), and other restrictions are put on some fields (e.g. a count cannot be entered in association with an amphibian Call Code of 3). Upon leaving a data cell in a given Paradox form, data is immediately stored in the appropriate database. Following a detailed series of decision rules designed for implementation during data entry, a data quality code is assigned for each summary sheet (amphibians and birds) and for the habitat descriptions. Data codes are as follows:
A. No problems encountered during data entry. B. Some problems encountered but they can be corrected with high confidence (e.g. field cards
allow unambiguous interpretation). C. Some or several problems encountered but most problems can be corrected with moderate to high
confidence (e.g. field cards demonstrate pattern and pattern allows interpretation). D. Several problems encountered but corrections cannot be made with confidence (e.g. no pattern
detectable from field cards, unambiguous interpretation not possible). The post-data entry checking phase is conducted after all MMP data has been entered to the Paradox database through the data entry forms. For this phase of quality control, staff identify and correct all typographical errors made during the process of data entry and ensure that all entered data matches that reported on the summary sheets and habitat description forms. Except for small portions of the data (e.g. mailing address information) which are checked by the Aquatic Surveys Officer, this phase of checking is conducted by two staff people. Typically, one person reads values from each submitted sheet while another staff member verifies those values on the data entry form (which reads directly from the MMP database). Discrepancies are identified and corrections are made immediately. Data Analysis Data analysis is conducted using the SAS software for statistical analysis (SAS Institute 1997). A wide variety of quality control measures are applied prior to all analyses. Many of these procedures are tailored to the specific type of analysis conducted. Examples of those steps common to all analyses are described here. Unusual numbers or occurrences of species are identified through an examination of tables of frequency of occurrence, and high and low counts. Rare species, species outside their normal geographic range, and unusually high counts of individuals are flagged for investigation or, if unessential to specific analyses, are eliminated from further consideration. Characterizations of habitat are compared to assessments at the same station in previous years. Unusually large deviations in habitat assessments are flagged for further follow up. Finally, data is screened according to the data quality codes assigned during the data entry phase. Cut-off values depend in part on particular reporting needs but data quality codes of “D” are almost always eliminated from further consideration. B6 Instrument/Equipment Testing, Inspection, and Maintenance Requirements
MMP participants conducting bird surveys are provided with a broadcast cassette tape to be used to encourage calls from several normally elusive bird species (Virginia Rail, Sora, Least Bittern, Pied-billed Grebe, Common Moorhen, and American Coot). Because tapes may degrade after use and storage, a new broadcast tape is supplied to each bird surveyor prior to each survey season. Volunteers are allowed to
MMP Quality Assurance Project Plan, Page 13
use their own broadcast equipment but are instructed in the Training Kit materials to test their broadcast equipment to be sure the tape can be heard to a distance of 100 metres (110 yards). B7 Instrument Calibration and Frequency
Not applicable to this project. B8 Inspection/Acceptance Requirements for Supplies and Consumables
All materials supplied by printers or other vendors are inspected by MMP staff upon their arrival. Broadcast tapes are professionally duplicated from a digital master version. B9 Data Acquisition Requirements (Non-direct Measurements)
Not applicable to this project. B10 Data Management
Completed data forms are submitted to BSC where MMP staff organize all forms, enter data to computer, and implement the quality control measures outlined above (B5). The Aquatic Surveys Officer signs off on each form following the data entry associated quality control steps. The Aquatic Surveys Coordinator, who is primarily responsible for data analysis and reporting, further screens the data before proceeding with analysis. All data are stored on the BSC network in Paradox (Borland) relational databases (Figure 2). The BSC network undergoes a regular backup and archive procedure which includes a daily storage to tape. Data analysis is conducted using the SAS statistical software (SAS Institute 1997). SECTION C
C1 Assessments and Response Actions
Working with the personnel indicated in section A4, the Aquatic Surveys Coordinator will lead periodic and ongoing assessments of quality assurance and control procedures. Problems identified from data forms submitted by MMP participants, issues identified prior to data analysis and reporting, and input from MMP staff involved in data management will be regularly incorporated into these procedures. Most data collection issues will be addressed through cover letters accompanying Training Kit materials. These letters will highlight problems observed from the data returns of previous years and will emphasize some protocol elements which require reinforcement. The protocol booklet, or portions of the manual, will be revised when necessary. C2 Reports to Management
Quarterly progress reports will be submitted to the designated USEPA – GLNPO Project Officer within 30 days of the end of each reporting period. Progress reports are also submitted periodically to USEPA – Lake Erie Team. Periodic reporting is also required by Environment Canada and includes progress, work-plan, and financial reports. Reports will include a summary of project progress, assessments of data quality objectives, and a description of problems encountered and corrective actions taken. Reports summarizing program status (e.g. distribution and numbers of routes) are made annually (at minimum) to the MMP STAC, and to BSC’s Board of Directors. The annual MMP newsletter is the primary tool for reporting results back to MMP volunteers but other BSC newsletters and other media
MMP Quality Assurance Project Plan, Page 14
also serve this purpose. Periodically, special reports are produced which provide comprehensive summaries of MMP data. The two volume report on 1995-1996 data is an example (Weeber et al. 1997, Chabot et al. 1998). SECTION D
D1 Data Review, Validation, and Verification Requirements
All MMP data are reviewed by the Aquatic Surveys Officer and the Coordinator to determine if they meet data quality objectives. Decisions to reject or qualify data are made by the Aquatic Surveys Coordinator. D2 Validation and Verification Methods
As described above (B5), all data are validated on an annual basis against the summary sheets and field forms submitted by MMP participants. Data from summary sheets will only be revised if other submitted materials (e.g. field survey forms) allow an unambiguous identification and correction of errors. For each surveyed route, each set of data (amphibian, bird, and habitat) received is assigned a four level data quality code. After data have been entered to computer databases, they will be screened for unacceptable data quality codes (e.g. “D”), and for outlying or otherwise anomalous values as described above (B5). An overall review of quality assurance (e.g. Training Kit materials) and control (e.g. data entry procedures) materials and procedures is done annually after the above steps are completed. D3 Reconciliation with Data Quality Objectives
Periodic reporting of MMP data require that analyses be performed which address on one or more of the program’s objectives. Along with the guidance provided by the scientific evaluation (Francis and Chabot 1997), MMP data quality will be assessed with respect to the specific analysis and reporting planned. For example, data of sufficient quantity and precision is necessary for statistically differentiating declining, increasing and stable trends. For a given set of analyses, data will be removed from consideration only for the reasons described previously (B5, D2) or for other pertinent and scientifically defensible reasons. REFERENCES
Bart, J. M. Hofschen, and B. G. Peterjohn. 1995. Reliability of the breeding bird survey: effects of restricting surveys to roads. Auk 112:758-761.
Bishop, C.A., K.E. Petit, M.E. Gartshore, and D.A. MacLeod. 1997. Extensive monitoring of anuran
populations using call counts and road transects in Ontario (1992 to 1993). Herpetological Conservation 1:149-160.
Chabot, A.A., J.D. McCracken, R.C. Weeber, C.M. Francis, and K.E. Jones. 1998. Marsh Monitoring
Program volume 2: Areas of Concern 1995-1996. Unpublished report to the Great Lakes Protection Fund. Long Point Bird Observatory (Bird Studies Canada). 277 pp.
Francis, C.M. and A. Chabot. 1997. Scientific evaluation of the Marsh Monitoring Program.
Unpublished report by Long Point Bird Observatory to Environment Canada. 42 pp. Gibbs, J.P. and S.M. Melvin. 1993. Call-response surveys for monitoring breeding waterbirds. J. Wildl.
Manage. 57:27-34.

MMP Quality Assurance Project Plan, Page 15
Link, W.A. and J.R. Sauer. 1998. Estimating population change from count data: application to the North American Breeding Bird Survey. Ecol. Applic. 8:258-268.
Long Point Bird Observatory and Environment Canada. 1997. Marsh Monitoring Program Training Kit
and Instructions for Surveying Marsh Birds, Amphibians and Their Habitats. 40 pp. (Note: Long Point Bird Observatory is now formally Bird Studies Canada. Next revised edition is planned for release prior to the 2001 survey season.)
SAS Institute. 1997. SAS/STAT Software: Changes and Enhancements Through Release 6.12. SAS
Institute Inc., Cary, NC, USA. Shirose, L. J., C.A. Bishop, D. M. Green, C.J. MacDonald, R. J. Brooks and N. J. Helferty. 1997.
Validation tests of an amphibian call count survey technique in Ontario, Canada. Herpetologica 53(3): 312-320.
Strayer, D.L. 1999. Statistical power of presence-absence data to detect population declines. Conserv.
Biol. 13:1034-1038. Weeber, R. C., A.A. Chabot, J.D. McCracken, C.M. Francis, and K.E. Jones. 1997. Marsh Monitoring
Program volume 1: 1995-1996 technical report. Unpublished report to the Great Lakes Protection Fund. Long Point Bird Observatory (Bird Studies Canada). 133 pp.

MMP Quality Assurance Project Plan, Page 16
Table 1. Anticipated annual work plan for in support of delivery and management of MMP. The work plan is expected to apply for the years 2000 through 2002. Presentation at SOLEC 2000 is planned for October 2000 and other presentations of MMP results will occur as opportunities arise.
Quarter Activities
1 January through 31
March
• Finish computer entry and checking of previous year’s data • Produce and distribute annual MMP Newsletter • Prepare and mail survey MMP protocol and other kit materials • Promote and fundraise for program • Recruit new volunteers (most intensive recruitment period for current year) • Produce articles for newsletters and other media • Conduct budgeting and reporting for fiscal year-end (Bird Studies Canada, Environment
Canada)
1 April through 30 June
• Recruit volunteers (final phase for current year) • Compile data for analysis and distribution • Conduct analyses of MMP data • Amphibian surveys begin in April, bird surveys end of May • Service volunteers (e.g. answer questions, address problems) • Program promotion through interview and presentations • Progress reports to funders and partners • Produce articles on MMP for BSC newsletters and other media
1 July through 30 September
• Receive data from program participants, update database structure for incoming data • Send letters reminding volunteers to submit data or thanking them for doing so • Progress reports to funders and partners • Produce and distribute summary report of MMP data • Promote and fundraise for program • Produce articles on MMP for BSC newsletters and other media
1 October through 31 December
• Begin computer entry of data • Send second reminder letter to volunteers who have not yet returned data • MMP Scientific and Technical Advisory Committee meeting • Program promotion, fundraising • Produce articles on MMP for BSC newsletters and other media

MMP Quality Assurance Project Plan, Page 17
Table 2. Power of the MMP surveys for detecting changes over time in mean species richness and mean numbers (birds) or calling codes (amphibians) of indicator species. Table shows means and observed changes from 1995 to 1996, the number of routes on which each species was detected, and an estimate of the percentage annual change in the mean count/calling code that could be detected ($ = 0.8, " = 0.05) after 1, 5, or 10 years with 50 or 100 routes. None of the observed changes was statistically significant. Species Observed Change in Mean/Station % Annual change that could be detected
50 routes 100 routes
1995 1996 % Change # Routes 1 yr 5 yr 10 yr 1 yr 5 yr 10 yr
Birds
American Bittern 0.167 0.274 64 19 119 15 6 84 11 5
American Coot 0.511 0.422 -17 9 66 9 4 46 7 3
Black Tern 2.856 2.081 -27 23 35 5 2 25 4 2
Blue!winged Teal 0.496 0.319 -36 24 32 5 2 22 4 1
Common Moorhen 0.606 0.436 -28 36 44 6 3 30 5 2
Common Snipe 0.379 0.288 -24 15 66 9 4 47 7 3
Least Bittern 0.267 0.198 -26 21 52 8 3 36 6 2
Marsh Wren 1.508 1.391 -8 53 26 4 2 18 3 1
MOOT* 1.611 1.261 -22 39 32 5 2 22 3 1
Pied!billed Grebe 0.430 0.444 3 31 52 8 3 36 6 2
Sora 0.254 0.303 19 42 85 11 5 60 9 3
Virginia Rail 0.731 0.661 -10 65 29 5 2 21 3 1
# Marsh Nesters 5.207 5.242 1 91 10 2 1 7 1 0
# Indicator Species 1.629 1.659 2 81 21 3 1 15 2 1
Amphibians
Bullfrog 0.819 1.016 24 34 36 5 2 25 4 2
Chorus Frog 0.742 0.641 -14 30 51 7 3 36 5 2
Mink Frog 0.667 0.000 -100 1 - - - - - -
N. Leopard Frog 0.557 0.758 36 50 62 9 4 43 6 3
Spring Peeper 1.924 2.082 8 49 18 3 1 13 2 1
# All Species 3.526 3.740 6 60 15 2 1 10 2 1
# Indicator Species 1.807 1.844 2 57 19 3 1 14 2 1
*MOOT = undifferentiated American Coot and Common Moorhen due to similarity in vocalizations.

MMP Quality Assurance Project Plan, Page 18
Table 3. Multivariate associations between species richness of marsh birds and amphibians, abundance of indicator bird species, and presence of amphibian indicator species, with various measures of habitat and other attributes of each marsh. The signs indicate the direction of relationships in the most parsimonious multiple regression models (selected using AIC, treating stations as independent samples): “+” indicates a positive linear association, “!” indicates a negative linear association, “+,!” indicates a positive linear association and a negative quadratic association, and “!,+” indicates a negative linear association and a positive quadratic association. Note that in many cases several other models, sometimes with quite different variables included, were nearly as good a fit as the model selected (based on AIC) so the models presented here should not be treated as indications of “significant” relationships.
Species % Emergent
% Grass/ Sedge
% Rush % Purple Loosestrife
% Cattail % Reed Latitude Longitude Size Permanence # Trees # Shrubs R2
Birds
American Bittern +,! +,! + .03
American Coot ! ! !,+ +,! + .09
Black Tern ! + + +,! + .12
Blue!winged Teal ! ! ! +,! +,! + ! ! .05
Common Moorhen +,! ! + ! + ! .10
Common Snipe + +,! ! + +,! !,+ + .09
Least Bittern + + +,! + ! .05
Marsh Wren +,! + + + ! !,+ + + ! ! .20
Pied!billed Grebe ! !,+ + !,+ +,! +,! + + .09
Sora +,! + +,! + ! .04
Virginia Rail +,! + !,+ +,! ! + ! + .09
# Marsh nesters +,! +,! +,! +,! !,+ + ! .16
# Indicator Species +,! ! + + +,! + + ! ! .22
Amphibians
Bullfrog ! ! ! ! !,+ !,+ + + ! ! .24
Chorus Frog ! ! !,+ ! ! .10
Mink Frog +,! !,+ .16
N. Leopard Frog +,! +,! !,+ ! !,+ + ! ! .08
Spring Peeper + + + !,+ +,! ! + + .13
# All Species +,! + ! ! ! ! !,+ .13
# Indicator Species + ! !,+ !,+ .08

MMP Quality Assurance Project Plan, Page 19
FIGURES
Figure 1. Predicted probability of occurrence for four wetland-dependent bird species detected on Marsh Monitoring Program routes. Probability curves are presented in relation to habitat characteristics provided by MMP participants. Mean values are shown for habitat characteristics in the lower and upper ten percent of surveyed stations (stations are ranked by increasing probability of species occurrence). Concordance values (C) were calculated using a cross-validation technique and represent the proportion of paired observations for which the predicted probabilities agreed with observed presence/absence values (e.g. ProbabilityA>ProbabilityB and PresentA>AbsentB). Example models are from draft analyses (R. Weeber, January 2000).

MMP Quality Assurance Project Plan, Page 20
Figure 2. Database structure for relational Paradox files used to enter and store Marsh Monitoring Program data.
Route IDMarsh/Route NameClosest TownCounty/MunicipalityProv./StateCountryTopo Map #
LatitudeLongitudeLocation accuracyLocation typeZoneEastingNorthing
AOC (Y/N)AOC codeDistance to nearest Great LakeRegion (s, c, n)Recent Map YearBasin (O, E, M, H, S)Important Notes
Route Master FileVolunteer IDLast NameFirst NameSpouse Last nameSpouse First nameBusiness OrganizationBusiness PositionBusiness Address 1Business Address 2
Business Address 3Business CityBusiness Prov/StateBusiness CountryBusiness Postal CodeBusiness phonePrimary Address 1Primary Address 2Primary Address 3
Primary Address 4Primary CityPrimary Prov/StatePrimary CountrPrimary Postal CodePrimary PhoneFax or E-Mail 1Fax or E-Mail 2Language
y
Route IDYearVolunteer ID# Bird Stations
# Amphibian StationsData Quality Amphibians Data Quality BirdsData Quality Habitat
Route IDYearVolunteer IDVisit #Station LetterSurvey DateStart Time
WindCloudAir TempPrecipitationComment 1Remarks
Route IDYearVolunteer IDStation LetterType of Surveys (amphibs,birds, both)% Emergent Veg% Open Water% Exposed Mud/Sand/Rock
% Trees % Shrubs Floating Plant CoverWetland PermanencyMarsh SizeArea around marsh/edgeLand Use/Human influence
Route IDYearVolunteer IDSpecies CodeA1(Station A, first visit)B1C1D1E1F1
G1H1A2B2C2D2E2F2G2H2
(Station A, second visit)
Route IDYearVolunteer IDVisit #Station LetterSurvey Date
Start TimeWindCloudAir TempComment 1
Route IDYearVolunteer IDSurvey NumberStation Letter
Species CodeCodeCountIn
Route IDYearVolunteer IDStation LetterType of Survey (a, b, ab)Wild RiceBur-ReedGrasses and SedgesRushes/BulrushesPickerel WeedArrowhead
SmartweedPurple LoosestrifeWater WillowCattailCommon ReedOther #1Other #1 TypeOther #2Other #2 TypeOther #3Other #3 Type
Volunteer Master File
Annual Route Status
Amphibian Visits
Amphibian Data
Emergent VegetationBird Data
Bird Visits
Wetland Characteristics

MMP Quality Assurance Project Plan, Page 21
APPENDIX 1
Appendix 1 contains copies of the following data forms used by MMP participants:
• Amphibian Data Form • Amphibian Route Summary Sheet • Bird Data Form • Marsh Bird Route Summary Sheet • Habitat Description Form

MMP Quality Assurance Project Plan, Page 22

MMP Quality Assurance Project Plan, Page 23
MMP Quality Assurance Project Plan, Page 24
MMP Quality Assurance Project Plan, Page 25
MMP Quality Assurance Project Plan, Page 26
MMP Quality Assurance Project Plan, Page 27

MMP Quality Assurance Project Plan, Page 28

MMP Quality Assurance Project Plan, Page 29

MMP Quality Assurance Project Plan, Page 30

MMP Quality Assurance Project Plan, Page 31