the macroeconomic effects of oil shocks … · the macroeconomic effects of oil shocks in three...
TRANSCRIPT

145
Abstract:
In this paper we study the impact of oil price shocks on real economic activity and inflation rates in three Latin American economies (Brazil, Colombia and Peru) using a Vector AutoRegressive (VAR) model over the period 1991:M01-2014:M01. We also consider different oil shock specifications. We find a strong and prolonged increase in inflation in Brazil after an oil price shock and a negative effect with respect to economic growth. We find less significant results for Colombia and Peru that can be explained by the distorted pass-through of oil price shocks to domestic prices.
Keywords: oil price shocks, economic growth, inflation, Brazil, Colombia, Peru, VARJEL CODE: F31, F41, Q43
THE MACROECONOMIC EFFECTS OF OIL SHOCKS IN THREE LATIN AMERICAN ECONOMIES*
Juan Carlos Alarcon Galarza* Juan Carlos Molero García** Fernando Pérez de Gracia***
* Catedrático de Economía de la Universidad de Navarra (España), Departamento de Economía.
** Licenciado en Economía, Máster en Economía y Finanzas por la Universidad de Navarra, se desempeña como profesor en la Universidad de los Hemisferios.
*** Profesor Asociado de Economía en la Facultad de Economía y Administración de Empresas de la Universidad de Navarra en Pamplona (España).
CUESTIONES ECONÓMICAS Vol. 26, No. 2:2, 2016

Juan Carlos Alarcon - Juan Carlos Molero - Fernando Pérez de GraciaCuestiones Económicas Vol. 26, No. 2:2, 2016
146
I. INTRODUCTION
Non-OECD countries in 2014 accounted for more than half of total world oil consumption. Consumption of oil in South and Central America have increased almost 20% in the last 5 years, from 2010 until 2015 oil consumption increased by 1 million of barrels per day, reaching around 7 million of barrels per day in 2014 (Annual Energy Outlook, 2014). Production has experienced as well an increase but of a smaller amount: 0.6 million of barrels per day, an increase of around 13% in 5 years, reaching approximately 8.5 million of barrels per day in 2014 (Annual Energy Outlook, 2014).
According to the World Bank, in recent years GDP average growth rates in Latin-American economies have been around 2% and 2.5%, far from the rates of 5% growth in the period 2003-2012 (World Bank, 2015). Among others, the main reasons are the decreasing commodities prices, the slower Chinese economy and lower investments. There is strong evidence of poor growth in resource-rich countries called sometimes the “natural resource curse”. The experience shows that in Latin-America this has been a big issue in the post-world war II period and nowadays is a major structural problem (Sachs and Warner, 2001). There is an imperious need for countries understand and deal with this dependence problem in order to attain a more sustainable development (World Bank, 2006).
Developing countries oil demand is steadily increasing and exporters often face a hidden but important problem that arises by focusing too much on the production of oil and not letting other important industries mature. The volatility of oil prices is increasing and price shocks are becoming more and more common, leaving countries severely exposed to these variations. Due to the importance of oil for the global economy, oil shocks are a topic that should be carefully addressed by both oil importing and exporting countries.
In this paper we study the impact of oil price shocks on the real economic activity and the inflation rates in three relevant economies in Latin America (Brazil, Colombia and Peru). Brazil was the largest oil producer in South America in 2014, while Colombia was the third. Peru in 2014 was the sixth oil exporter economy in South America. These three countries together accounted in 2014 for 37% of the total oil production of Central and South America (Annual Energy Outlook, 2014). On the consumption side in 2013 Brazil was the largest consumer of oil in Central and South America, accounting alone for 42.3% of total oil consumption in Central and South America. Colombia and Peru were the fifth and sixth oil
The macroeconomic effects of oil shocks in three Latin American economies
147
consumers, respectively. The three countries together accounted for 50.1% of total oil consumption in Central and South America (Annual Energy Outlook, 2014). We analyze three of the most important oil producers and consumers in Latin America; therefore we can have a broad view of how oil shocks affect the region. Previous empirical literature has tried to address oil shocks effects in South-American countries (Hausmann, 1997; Maghyereh, 2004; Sanchez and Villamil, 2012; Calvacanti and Jalles, 2013 and Casselli, 2013). Hausmann (1997) analyzes negative shocks in the Venezuelan case. Maghyereh (2004) deals with 22 developing countries, using 3 South American small economies explores the relationship of oil shocks with the stock markets. Sanchez and Villamil (2012) use a VAR framework to analyze the effect of shocks for macroeconomic variables only for Colombia. Calvacanti and Jalles (2013) analyze the case of Brazil and the US without allowing for nonlinear oil shocks specifications. Casselli (2013) studies the impact of oil shocks on growth in Brazil at a municipal level. We are therefore the first study that analyzes three major oil exposed countries including net oil importers and net oil exporters, focusing in South America and allowing for nonlinearities in the oil shocks specifications. We apply a Vector AutoRegressive (VAR) model over the period 1991:M01–2014:M01. The contribution of the paper we present is the study of the economic effect of oil shocks to three of the most important oil consuming economies Latin America, having in our sample the largest producer and consumer in Central and South America such as Brazil. We use a VAR model to analyze, using a long time span and monthly data (which includes periods with largest oil volatility in history) the effects of oil price shocks on macroeconomic variables such as inflation and economic growth. The methodology applied involves the use a VAR model to measure the consequences of an oil price shock to two main economic factors: inflation and economic growth. We take into account interest rates and exchange rates; the intuition behind this is that changes in commodities prices, which will lead to an inflationary pressure (a case of an increase in the oil price), will affect output through a reduction in the productivity of any given amount of capital. At the same time, an increase in the volatility of shocks will also have an adverse impact on the economy as shown in Ferderer (1996).
We propose different oil measures transformations in order to allow for nonlinear relationships as shown in Cunado and Perez de Gracia (2005). We proceed to apply a cointegration and Granger causality tests on the oil, inflation and economic growth relationships using monthly data from 1991-2014. To our knowledge, this is the first study which analyzes the impact of oil price shocks in these countries taking into account the severe shock suffered in late 2008, and how these countries were affected afterwards. With respect to previous literature we differentiate from previous studies by allowing nonlinear oil specifications as

Juan Carlos Alarcon - Juan Carlos Molero - Fernando Pérez de GraciaCuestiones Económicas Vol. 26, No. 2:2, 2016
148
proposed firstly in Hamilton (1996); using a broad data set our analysis is made in light of the changes these countries have suffered from respect to their position as net oil exporters and importers.
The main results of our analysis are as follows. First, we find a significant positive effect of an oil price shock to inflation in Brazil and a significant negative effect with respect to economic growth. This goes in accordance with the literature where in net oil-importing countries higher oil prices lead to inflation, increase input costs, reduce non-oil demand and diminish investment. Second, for Colombia we find an increase in economic growth after an oil shock when we allow for nominal specifications, and also a decrease in inflation. Finally, for Peru with respect to inflation we obtain a positive and persistent relationship, and for economic growth we find as well a significant positive relationship.
The paper is structured as follows. In section 2 we review the literature on oil shocks, economic growth, and inflation. In section 3 we describe the data set, and we present the proxy variables of oil shocks that we will use. In section 4 we present the methodology and the empirical analysis. Section 5 includes the concluding remarks and some policy recommendations.
II. LITERATURE REVIEW ON OIL PRICES AND ECONOMIC ACTIVITY
There is vast literature covering the relationship between oil price shocks and macroeconomic variables. Rasche and Tatom (1981) analyze the theoretical mechanisms by which aggregate supply will be affected raising prices and declining output. The effect on the aggregate demand, differentiating by oil exporter or importer position is also analyzed. Hamilton (1983) shows that small disruptions in the supply of primary commodities, such as energy, could be the source of fluctuations in aggregate employment and can have large effects on real output. Davis and Haltiwanger (2001) show how employment growth responds asymmetrically to oil price shocks, and they trigger considerable job reallocation activity. According to Killian (2008a), the traditional view of oil price shocks has been that they act as aggregate supply shocks in a traditional textbook model or as technology shocks in a modern dynamic stochastic general equilibrium model. All in all, and despite some important advances, the nature of this supply channel of transmission and its quantitative importance remains an open issue.
Nevertheless, some authors (e.g., Lee et al., 1995; Hooker, 1996; and Hamilton, 1996) find strong evidence that oil prices no longer Granger cause many US
The macroeconomic effects of oil shocks in three Latin American economies
149
macroeconomic variables using data after 1973. A number of potential explanations are explored in Hooker (1996) sample stability issues, oil prices endogeneity and the fact that linear and symmetric specifications misrepresent the form of the oil price interaction. These results had potentially important implications for the large body of research which utilize oil prices as an instrumental or explanatory variable. Finally, Hamilton (1996) proposes that a non-linear relation is present and applies transformations to deal with this issue.
Later, Hooker (2002) finds that, since around 1980, oil price changes seem to affect inflation only through their direct share in a price index, with little or no pass-through into core measures, while before 1980 oil shocks contributed substantially to core inflation.
Accordingly, the empirical theory is broad and various studies find that oil shocks affect inflation and output. Starting by finding evidence of a nonlinear relationship between oil price changes and GDP growth, Hamilton (2003) states that oil price increases are much more important than oil price decreases, and increases have significantly less predictive content if they simply correct earlier decreases.
Cologni and Manera (2008) use a structural cointegrated VAR model for the G-7 countries in order to study the direct effects of oil price shocks on output and prices, and the reaction of monetary variables to external shocks. They find that according to the estimated coefficients of the structural part of the model, for all countries, except Japan and the UK, the null hypothesis of an influence of oil prices on the inflation rate cannot be rejected. Inflation rate shocks are transmitted to the real economy by increasing interest rates. Their impulse response analysis suggests, for most countries, the existence of an instantaneous, temporary effect of oil price innovations on prices. Impulse response functions indicate different monetary policy reactions to inflationary and growth shocks. The simulation exercises, directed to estimate the total impact of the 1990 oil price shock, indicate that for some countries a significant part of the effects of the oil price shock is due to the monetary policy reaction function. In the cause of the US, Killian (2008b) finds that exogenous oil supply shocks caused a sharp drop in US real GDP growth after five quarters, rather than an immediate and sustained reduction in economic growth. They also find an increase in inflation measured by CPI after three quarters. Hamilton and Herrera (2004) find evidence in favor of the longer lag length employed by previous research. They show that under this specification, even the aggressive Federal Reserve policies proposed by Bernanke et al. (1997) would not have succeeded in averting an economic downturn. Hamilton (2009) analyzes the relationship between oil shocks and recessions stating that the experience of 2007-08 should be added to the list of
Juan Carlos Alarcon - Juan Carlos Molero - Fernando Pérez de GraciaCuestiones Económicas Vol. 26, No. 2:2, 2016
150
recessions to which oil prices appear to have made a material contribution, specially caused by a strong demand confronting stagnating world production.
Blanchard and Gali (2007) utilize a VAR framework to analyze the effect of an oil price shock containing six variables: the dollar price of oil (expressed in log differences), CPI inflation, GDP deflator inflation, wage inflation, the log changes in GDP, and employment. Estimates are reported for two different sample periods: 1970:1-1983:4 (1960:1–1983:1 for the United States) and 1984:1–2005:4. Blanchard and Gali (2007) find that for the pre-1984 period, where oil price experienced the highest increase until then, CPI inflation shifts up immediately, and remains positive for a protracted period. The response of GDP deflator inflation and wage inflation is similar, though more gradual. Output and employment decline persistently, albeit with a lag. Finally, the responses of the same variables in the post-1984 period are considerably more muted, thus suggesting a weaker impact of oil price shocks on the economy.
Regarding works focused on Latin American economies, Alaimo and Lopez (2008) analyze potential causal link from oil prices to oil and energy intensities, using a simple trivariate panel VAR model for 13 Latin American countries. They find that behind the lack of a causal relationship from oil prices to oil and energy efficiency, there is a limited pass through from oil prices to retail price at the pump. They suggest that indeed in most Latin American countries the pass-through is not complete, and hence that oil price increases may not be creating the appropriate incentives in the region (World Bank, 2006).
Sanchez and Villamil (2012) analyzed in a VAR framework the effect of oil shock in macroeconomics variables in Colombia finding little evidence that oil shocks affect growth measured using GDP and inflation. Uribe and Ulloa (2011) find also a significant increase of inflation more than growth for Colombia using a SVAR framework. Nunnenkamp (1982) find insignificant effects of oil price rises in growth in the long run for non-oil developing countries during 1970´s (NOPECs)1. Kim and Willet (2000) find that oil supply shocks have substantial effects on inflation and growth for industrial countries, while lower effects for developing countries. Mendoza and Vera (2010) analyze the case of a net oil exporter such as Venezuela finding results that suggest that oil shocks have had positive and significant effects on output growth in Venezuela during the period 1984:1-2008:3. In line with previous findings for other countries, they suggest that the Venezuelan economy is more responsive to
1 NOPECs comprise those Third World economies which are either net oil importers or whose oil exports constitute only a minor share in their external trade.

The macroeconomic effects of oil shocks in three Latin American economies
151
increases in oil prices than to unexpected decreases. Hausmann (1997) also analyzed the Venezuelan case focusing on the negative shocks. Calvacanti and Jalles (2013) find for Brazil that oil import dependence rate has decreased substantially, oil shocks do not seem to have a clear impact on output growth and they account for a very small fraction of the Brazilian inflation and output growth rate volatility.
Within the wide literature on oil shocks, the novelty of the paper we present is the application of a VAR model to analyze, using a long time span and monthly data, the effects of oil price shocks on macroeconomic variables such as inflation and economic growth in 3 large Latin American countries: Brazil, Colombia and Peru. The use of 3 of the largest countries in the region by population and GDP gives our analysis a robust significance.
III. DESCRIPTION OF THE DATASET
3.1 Countries selection
Several factors were taking into account when selecting the countries for our study. The first and most important were data availability. The second factor was the comparability of the selected countries in terms of oil production and oil consumption. According to Annual Energy Outlook (2014), the comparison between the countries relating oil production and consumption is as follows. Oil’s production in thousands of barrels per day in 2014 was 1016 for Colombia, 180 for Peru and 2950 for Brazil. Respectively, oil consumption was 324, 226, and 3003 thousands of barrels per day in that year. According to these results, we have a big net oil exporter (Colombia) and 2 net oil importers (Brazil and Peru) for our research which will give us a deep analysis of how the oil shocks affect three different countries in Latin America.
3.2 Sampleperiod
As we mentioned before, one of the most important issues with Latin-American countries is the availability of the data. In our data set, all variables start in January 1991 and ends on April 2014 for all the variables. All variables are taken from the International Financial Statistics from the International Monetary Fund and Federal Reserve Bank of St. Louis. The sample period of the variables and the sources of them are summarized in Table 1.

Juan Carlos Alarcon - Juan Carlos Molero - Fernando Pérez de GraciaCuestiones Económicas Vol. 26, No. 2:2, 2016
152
3.3 Variables
Ø Industrial production: We use industrial production as a proxy for real economic activity,2 following Sadorsky (1999) and Park and Ratti (2008).
Ø Inflation rate: We use CPI as a measure of the increase in prices of the economy.
Ø Interest rates: We include the nominal interest’s rates for each country based on Bernanke et al. (1997) to take into account the indirect effect of oil price shocks on real economic activity due to the Central Bank’s response to higher oil prices. We use money market interest rates and short term interest rates.
Ø Oil prices: We use both West Texas Intermediate (WTI) expressed in $ US per barrel and UK Brent also in $ US per barrel in nominal and real terms. We define real oil prices for each country as nominal oil prices multiplied by the exchange rate (local currency units per $US) and deflated by the CPI of every country.
2 For Colombia and Peru we use proxies of Manufacturing Index for Brazil Industrial Production Index available.
Table 1: Variable description and sources
Variable State Source
Crude oil price ( UK Brent) Logs Fed. Res of Bank of St. Louis
Crude oil price (WTI) Logs Fed. Res of Bank of St. Louis
Peru–Exchange rate Logs International Financial Statistics
Peru -Interest rate Levels International Financial Statistics
Peru – CPI Levels International Financial Statistics
Peru – IPI Logs International Financial Statistics
Colombia–Exchange rate Logs International Financial Statistics
Colombia -Interest rate Levels International Financial Statistics
Colombia – CPI Levels International Financial Statistics
Colombia IPI Logs International Financial Statistics
Brazil–Exchange rate Logs International Financial Statistics
Brazil -Interest rate Levels International Financial Statistics
Brazil – CPI Levels International Financial Statistics
Brazil – IPI Logs International Financial Statistics
Notes: CPI stands for Consumer Price Index and IPI stands for Index of Industrial Production.

The macroeconomic effects of oil shocks in three Latin American economies
153
Following Hamilton (1996, 2003), we propose the following oil shock net oil price increases (NOPI), defined as the monthly percentage change in real oil price levels from the past 12 and 36 months high:
))], (1)
))] (2)
where oil is the logarithm of oil prices. In this paper, we define oil in both nominal and real terms and also using WTI and UK brent. Hamilton (1996, 2003) argues that if one wants a measure of how unsettling an increase in the price of oil is likely to be for the spending decisions of consumers and firms, it seems more appropriate to compare the current price of oil with where it has been over the previous years, rather than during the previous quarter alone. A significant relationship between this variable and economic activity implies that a “certain” oil price increase will cause a decrease in economic activity, while a price increase in a period of high volatility is less likely to cause it.
IV. METHODOLOGY AND EMPIRICAL ANALYSIS
4.1 Unit root tests
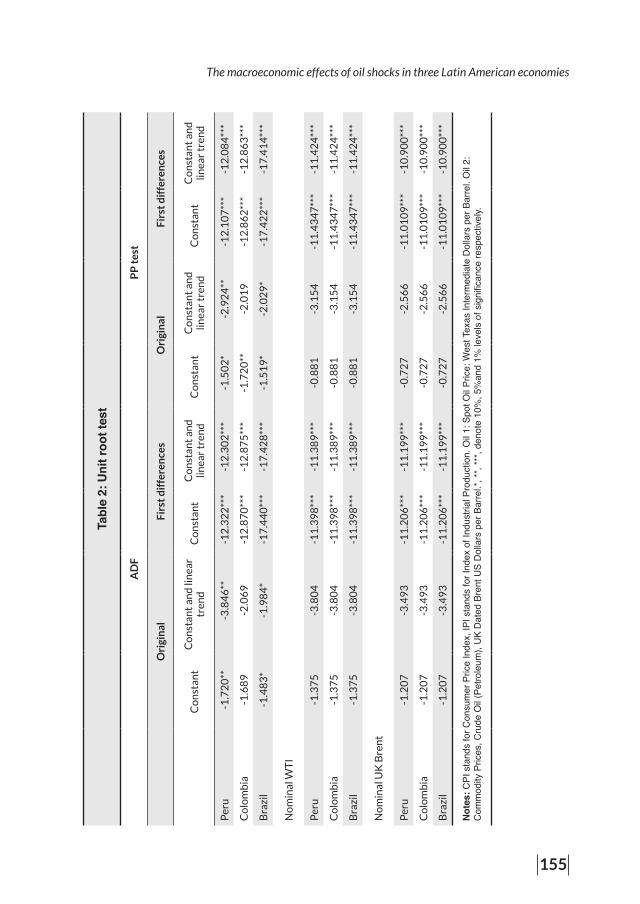
The results of unit root tests for the IPI, interest rates and oil prices for the South American economies are presented in this section. Consumer Price Index (CPI) and interest rates are expressed in levels, the rest of the variables are expressed in logs. We use two alternative unit root tests: Augmented Dickey-Fuller (ADF, Dickey and Fuller, 1981) test, and the Phillips-Perron (Phillips and Perron, 1988) test using the Bartlett Kernell spectral estimation.
The test is in levels and in first differences. The results are included in Table 2, they suggest that all series, IPI, nominal short term interest rates and oil prices do not reject the null hypothesis, and are therefore integrated of order I(1). The ADF test is the classical unit root test, widely used in the economic but with some drawbacks; it has been proven to be ineffective when there is a negative and large Moving Average component (Schwert, 1987). Therefore, we also perform the Phillips Perron test in levels and in first differences. The results, shown in Table 2, suggest that all series, IPI, nominal short term interest rates and oil prices do not reject the null hypothesis, and hence are integrated at I(1). In summary, the results show that all the three variables: IPI, interest rates and oil prices are integrated of order one I(1) (i.e., stationary in first differences). There are some previous related studies that

Juan Carlos Alarcon - Juan Carlos Molero - Fernando Pérez de GraciaCuestiones Económicas Vol. 26, No. 2:2, 2016
154
Tabl
e 2:
Uni
t roo
t tes
t
A
DF
PP
tes
t
Ori
gin
alF
irst
dif
fere
nce
sO
rigi
nal
Fir
st d
iffe
ren
ces
Co
nst
ant
Co
nst
ant
and
lin
ear
tren
dC
on
stan
tC
on
stan
t an
d
linea
r tr
end
Co
nst
ant
Co
nst
ant
and
lin
ear
tren
dC
on
stan
tC
on
stan
t an
d
linea
r tr
end
Rea
l IP
I
Per
u0
.57
4-1
.77
9-5
.29
6**
*-5
.39
8**
*-0
.69
3-4
.36
2-3
8.4
31
***
-45
.68
1**
*
Co
lom
bia
-0.3
69
-1.0
36
-8.1
64
***
-8.1
74
***
-1.0
29
-2.1
81
-31
.26
1**
*-3
1.2
56
***
Bra
zil
-1.3
18
-3.8
96
-18
.22
2**
*-1
8.2
03
***
-1.3
01
-4.1
52
-18
.17
0**
*-1
8.1
51
***
Inte
rest
rat
e
Per
u-3
.13
9**
-4.1
06
***
-6.0
73
***
-6.2
45
-4.9
39
***
-5.2
03
***
-32
.63
3**
*-3
6.9
87
***
Co
lom
bia
-1.4
14
-2.2
71
-11
.81
9**
*-1
1.8
16
***
-1.4
94
-2.3
95
-12
.05
2**
*-1
2.0
45
***
Bra
zil
-4.6
18
***
-5.0
18
***
-19
.15
8**
*-1
9.1
24
***
-4.5
19
***
-4.9
76
***
-20
.81
7**
*-2
0.7
72
***
Rea
l WT
I
Per
u-1
.96
7**
-3.8
65
**-1
2.1
40
***
-12
.11
9**
*-1
.56
6*
-3.2
32
*-1
2.1
05
***
-12
.08
3**
*
Co
lom
bia
-1.6
89
**-2
.06
9*
-12
.87
1**
*-1
2.8
75
***
-1.7
20
-2.0
19
*-1
2.8
62
***
-12
.86
3**
*
Bra
zil
-1.4
83
*-1
.98
3*
-17
.44
0**
*-1
7.4
28
***
-1.5
19
*-2
.02
9*
-17
.42
2**
*-1
7.4
14
***
Rea
l UK
Bre
nt
The macroeconomic effects of oil shocks in three Latin American economies
155
Tabl
e 2:
Uni
t roo
t tes
t
A
DF
PP
tes
t
Ori
gin
alF
irst
dif
fere
nce
sO
rigi
nal
Fir
st d
iffe
ren
ces
Co
nst
ant
Co
nst
ant
and
lin
ear
tren
dC
on
stan
tC
on
stan
t an
d
linea
r tr
end
Co
nst
ant
Co
nst
ant
and
lin
ear
tren
dC
on
stan
tC
on
stan
t an
d
linea
r tr
end
Per
u-1
.72
0**
-3.8
46
**-1
2.3
22
***
-12
.30
2**
*-1
.50
2*
-2.9
24
**-1
2.1
07
***
-12
.08
4**
*
Co
lom
bia
-1.6
89
-2.0
69
-12
.87
0**
*-1
2.8
75
***
-1.7
20
**-2
.01
9-1
2.8
62
***
-12
.86
3**
*
Bra
zil
-1.4
83
*-1
.98
4*
-17
.44
0**
*-1
7.4
28
***
-1.5
19
*-2
.02
9*
-17
.42
2**
*-1
7.4
14
***
No
min
al W
TI
Per
u-1
.37
5-3
.80
4-1
1.3
98
***
-11
.38
9**
*-0
.88
1-3
.15
4-1
1.4
34
7**
*-1
1.4
24
***
Co
lom
bia
-1.3
75
-3.8
04
-11
.39
8**
*-1
1.3
89
***
-0.8
81
-3.1
54
-11
.43
47
***
-11
.42
4**
*
Bra
zil
-1.3
75
-3.8
04
-11
.39
8**
*-1
1.3
89
***
-0.8
81
-3.1
54
-11
.43
47
***
-11
.42
4**
*
No
min
al U
K B
ren
t
Per
u-1
.20
7-3
.49
3-1
1.2
06
***
-11
.19
9**
*-0
.72
7-2
.56
6-1
1.0
10
9**
*-1
0.9
00
***
Co
lom
bia
-1.2
07
-3.4
93
-11
.20
6**
*-1
1.1
99
***
-0.7
27
-2.5
66
-11
.01
09
***
-10
.90
0**
*
Bra
zil
-1.2
07
-3.4
93
-11
.20
6**
*-1
1.1
99
***
-0.7
27
-2.5
66
-11
.01
09
***
-10
.90
0**
*
Not
es: C
PI s
tand
s fo
r Con
sum
er P
rice
Inde
x, IP
I sta
nds
for I
ndex
of I
ndus
trial
Pro
duct
ion.
Oil
1: S
pot O
il Pr
ice:
Wes
t Tex
as In
term
edia
te D
olla
rs p
er B
arre
l. O
il 2:
C
omm
odity
Pric
es, C
rude
Oil
(Pet
role
um),
UK
Dat
ed B
rent
US
Dol
lars
per
Bar
rel.*
, **,
***,
deno
te 1
0%, 5
%an
d 1%
leve
ls o
f sig
nific
ance
resp
ectiv
ely.

Juan Carlos Alarcon - Juan Carlos Molero - Fernando Pérez de GraciaCuestiones Económicas Vol. 26, No. 2:2, 2016
156
confirm the unit root in oil prices and macroeconomics variables as Cologni et al. (2008), Cunado and Perez de Gracia (2005), Park and Ratti (2008) among others.
4.2 Cointegration tests
Once we proved that all the relevant variables contained a unit root, we tested for cointegration (Johansen and Juselius, 1990), using both the trace and the maximum eigenvalue tests. The results reported in Table 3 show no strong evidence for the rejection of the null of no cointegration for Brazil and Colombia, whereas for Peru evidence for rejection of the null can be found. Similar results found in (Lescaroux and Mignon, 2008).
Following Clements and Hendry (1995) and Hoffman and Rasche (1996) where unrestricted VAR is superior in terms of forecast variance to a restricted VECM at short horizons, and by Naka and Tufte (1997) that the performance of unrestricted VARs and VECMs for impulse response analysis over short-run is nearly identical, we will run unrestricted VARs for each countries of study.
4.3 Model and results
The empirical model estimated in this paper has already been used in the context of oil prices and economic activity by Hamilton (1983), Mork (1989), Bernanke et al. (1997) and Cunado and Perez de Gracia (2013) among many others, and it is based on the VAR methodology proposed by Sims (1980).
Table 3. Cointegration tests r = 0 r ≤ 1 r ≤ 2
(i) (ii) (i) (ii) (i) (ii)
BrazilTrace Statistic 53.572 76.371 20.048 35.652 4.7314 11.206
Max- Eigen Stat 33.523** 40.719** 15.317 24.445 3.41 7.796
ColombiaTrace Statistic 58.482*** 69.366* 28.372 38.935 7.6745 17.066
Max- Eigen Stat 30.113** 30.431 21.131 21.868 4.627 12.461
PeruTrace Statistic 323.960*** 342.244*** 52.186*** 70.434*** 11.953 25.872**
Max- Eigen Stat 271.777*** 271.81*** 40.232*** 40.491*** 14.264 19.387**
Notes: Selected variables are crude oil prices, CPI, Consumer Price Index; IPI, Index of Industrial Production and interest rates. R= number of cointegrating vectors. *, **, *** denote the level of rejection of the null hypothesis at the 10%, 5% and 1% levels of significance, respectively. The tests are perform using the null of no cointegration against the alternative of cointegration. Akaike Criterion used to determine lags. We allow for deterministic trend in the data, (i) allow for intercept and no trend, (ii) allows for intercept and trend in CE.

The macroeconomic effects of oil shocks in three Latin American economies
157
A VAR model of order p, where the order p represents the number of lags, that includes k variables, can be expressed as:
(3)
where is a column vector of observation on the current values of all variables in the model (exchange rates, interest rates and oil prices); is k x k matrix of unknown coefficients; is a column vector of deterministic constant terms; is a column vector of errors with the following properties,
where is not serially correlated but may be contemporaneously correlated and is the variance-covariance matrix with non-zero off-diagonal elements. Given a VAR(p) model of I(1) variables, there always exists an error correction representation of the form:
(4)
where Δ is the first difference operator; yt-i is a vector of error correction terms; П is the matrix denoting the speed of adjustment toward the equilibrium and rank (П) = r, the number of cointegration vectors, which in our case, and based on the previous results, we assume it is equal to 1, β0 is a column vector of deterministic constant terms and the column vector of errors, satisfy the same conditions as the
in equation (1).
We analyze the impact of oil shocks on economic growth and inflation rates by examining impulse response functions. The ordering of the variables in the basic VAR implies that monetary policy shocks are independent of contemporaneous disturbances to the other variables as in Park and Ratti (2008).
Figures 1-4 show the impulse response functions (IRFs) of the IPI and CPI to a one standard deviation structural innovation in oil price and interest rates. The dashed line indicates two standard deviation confidence interval of the estimated impulse response function while the black line indicates the impulse response functions to a one-standard deviation structural innovation in oil price to IPI and CPI.

Juan Carlos Alarcon - Juan Carlos Molero - Fernando Pérez de GraciaCuestiones Económicas Vol. 26, No. 2:2, 2016
158
It is important to analyze these results considering two main effects. (a) Supply side effect: As an input in the production function of firms, a sharp increase in crude oil prices will lead to rising production costs which, in turn, would lower output. (b) Demand side effect: Higher oil prices would affect the disposable income of agents and hence their consumption. If the country is a net oil importer (exporter), its disposable income declines (increases) in the face of higher crude oil prices, thus lowering (raising) its consumption. In addition, oil prices may lower investment by raising the production cost of firms, World Bank (2006).
We can observe that the effect of an oil shock on inflation seems to have a positive effect for Brazil that lasts around 6 to 12 months when we use real oil prices, we then observe a mean reverting process, especially noticeable is the case when we use nominal $US prices. When we allow for 36 month lags we find that effect on impact is much larger than in the other cases but the shock permanence is shorter of around 8 months. This goes in accordance with World Bank (2006). For Colombia, there is a negative effect with oil shock and then a reverting process especially noticeable when we allow for 12 lags in both nominal and standard oil specifications. This may be caused because of the lack of a proper process of pass-through of increase in oil prices to gasoline prices shown in the CPI. This happens because of subsidies and government pricing decisions for domestic gasoline prices when oil prices are high as in Alaimo and Lopez (2008). This fits perfectly the literature as in Pinzon (2011) where they measure using WTI oil price shocks to CPI using a VAR framework and find that there is a slight negative effect until the second moth to then experience and increase to return to the mean at the sixth month. For Peru, we have a negative effect when we measure it in 12 lags as in the previous case. When we allow for 36 lags the effect is not clear. The same explanation will apply for the degree to which higher oil prices translate into higher consumer prices is a key policy decision for governments as shown in World Bank (2006). Salas (2009) shows that the majority of changes to inflation are explained by internal demand shocks.
Noticeable is the case of Brazil fitting conventional wisdom rather well and in accordance with studies such as Cunado and Perez de Gracia (2005). Because one of the effects of a monetary shock given by the interest rates is to cause an appreciation of the exchange rate, it is important to observe the effect of the monetary policy shock on exchange rates and therefore on the inflation, we perceive the importance of the role of the interest rates, as noted in Cologni and Manera (2008). Oil price regulation along with monetary policy play a key role in this relationship. In the absence of regulation, a positive US monetary disturbance, for example, would be expected to raise the nominal dollar price of oil and US consumer prices to the

The macroeconomic effects of oil shocks in three Latin American economies
159
same extent, leaving the real price of oil unaffected as shown in Gillman and Nakov (2009).
Figure 1: Generalized impulse response functions to oil price shocks using WTI
Note: Black line represents impulse response functions of economic activity to oil price. Dotted lines indicate two-standard deviation confidence interval of the estimated impulse response functionactivity to oil price. Dotted lines indicate two-standard deviation confidence interval of the estimated impulse response function.
Economic activity BRAZIL COLOMBIA PERU
REAL NOPI 12 LAGS
REAL NOPI 36 LAGS
NOMINAL NOPI 12 LAGS
NOMINAL NOPI 36 LAGS
Juan Carlos Alarcon - Juan Carlos Molero - Fernando Pérez de GraciaCuestiones Económicas Vol. 26, No. 2:2, 2016
160
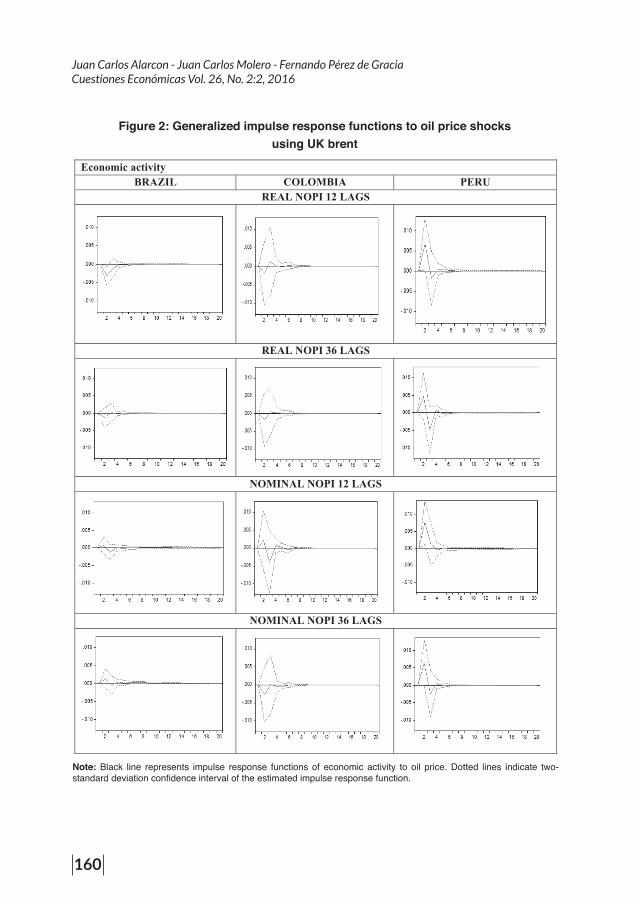
Figure 2: Generalized impulse response functions to oil price shocks using UK brent
Note: Black line represents impulse response functions of economic activity to oil price. Dotted lines indicate two-standard deviation confidence interval of the estimated impulse response function.
Economic activity UREP AIBMOLOC LIZARB
REAL NOPI 12 LAGS
REAL NOPI 36 LAGS
NOMINAL NOPI 12 LAGS
NOMINAL NOPI 36 LAGS

The macroeconomic effects of oil shocks in three Latin American economies
161
Figure 3: Generalized impulse response functions to oil price shocks using WTI
Note: Black line represents impulse response functions of economic activity to oil price. Dotted lines indicate two-standard deviation confidence interval of the estimated impulse response function.
Inflation rate BRAZIL COLOMBIA PERU
REAL NOPI 12 LAGS
REAL NOPI 36 LAGS
NOMINAL NOPI 12 LAGS
NOMINAL NOPI 36 LAGS

Juan Carlos Alarcon - Juan Carlos Molero - Fernando Pérez de GraciaCuestiones Económicas Vol. 26, No. 2:2, 2016
162
Figure 4: Generalized impulse response functions to oil price shocks using UK brent
Note: Black line represents impulse response functions of economic activity to oil price. Dotted lines indicate two-standard deviation confidence interval of the estimated impulse response function.
Inflation rate BRAZIL COLOMBIA PERU
REAL NOPI 12 LAGS
REAL NOPI 36 LAGS
NOMINAL NOPI 12 LAGS
NOMINAL NOPI 36 LAGS

The macroeconomic effects of oil shocks in three Latin American economies
163
Concerning the economic growth, in the case of Brazil we can observe that for real definitions of the IPI we detect a decrease of the IPI on impact when we use the standard oil specification, which lasts around 3 months. Higher oil prices would lead to a decline in the volume of imports. At the household level, higher oil prices would lead to real income losses and, hence, to a drop of the domestic demand.
For Colombia we also observe a negative reaction the first 3 months, returning afterwards to the mean, and there is a light increase in the IPI before converging. This may be because of not perfect pass-through of the increase in oil prices to IPI measured by manufacturing. In Peru we can observe an increase at the hit that lasts around 2 to 4 months until returning to the mean, the downfall is significant when we use standard oil specifications, to then return to the mean around the fourth month. The same distorted pass-through of oil price increases to IPI may arise in the opposite way as in Colombia not allowing the increase in gasoline prices to affect economic growth (Alaimo and Lopez, 2008). Studies find asymmetric effects for economic growth in Colombia the evidence shows that the net impact on the price shocks has been positive in terms of reduction of costs in the imported components for national production but negative impacts where generated in terms of energy costs, productive activities replacement and sectorial exports as shown in Perilla (2010). Gonzales (2006) shows that economic growth depends mainly on private investment and abundance of natural resources and the dependence of these has been reducing gradually. The small size of the shocks coincides with the small impact of oil shocks on economic activity and growth as in Curcio and Vilker (2014).
As we argued before, Peru and Brazil are net oil importers; analyzing the impulse response functions, using the framework of Koop et al. (1996) of the respective countries, we observe a similar behavior firstly with respect to the economic growth measured by the IPI. Brazil being a net oil importer country shows that a price shock in oil will allow a slight decrease of the IPI in the short run, if we allow for nonlinearities, although the magnitude is not too big. This goes in accordance with the literature. Mory (1993) showed that increases and decreases in real oil prices have asymmetric effects on output and other macroeconomic variables from 1951 to 1990. Peru being a net importer as Brazil suffers a slight increase in the IPI, to then return to the mean as in Lee et al (1995). Historical structure of the country can explain this behavior as well as the presence of subsidies that don’t allow the transmission to the Industrial Production Index, measured by the Manufacturing Index can also disturb this relationship. Gately and Huntington (2002) and Dargay et al. (2007) find that energy demand in OECD countries responds to changes in oil prices but

Juan Carlos Alarcon - Juan Carlos Molero - Fernando Pérez de GraciaCuestiones Económicas Vol. 26, No. 2:2, 2016
164
find mixed effects for non-OECD countries. They argue that the low response to crude oil prices in most Non-OECD countries may reflect government interventions designed to avoid pass-through to final consumers. The use of clean energy has been a considerable change in Latin American countries and this reduces a large portion of the use of fossil fuels and their exposure to shocks and indeterminacy as in Wen and Aguiar-Conraria (2006). Therefore, since also a relationship between GDP and oil prices has been diminishing as shown in Hamilton and Herrera (2004) our results fit what is expected in the literature.
In the case of Colombia, a net oil exporter, we found as well an increase in the IPI after the shock and allowing for nominal oil specifications. Having a peak at around 3 months, corresponding with the finding obtained by Uribe and Ulloa (2011). The slight negative effect may be due to the difficulty of transmission of gains to the Industrial Production Index measured by the Manufacturing Index as well. These results go in accordance with the results shown in Mork (1989), Berument et al. (2010). Rahman and Serletis (2010) also show that monetary policy reinforces the effects of oil shocks on output and contributes also to the asymmetric response of output to oil price shocks.
In sum, the results obtained in this paper show that the oil price shocks have an important effect on real economic variables in the short run as noticed in Cunado and Perez de Gracia (2005) although the effects are differently significant among countries. We find a positive and significant effect on inflation in Brazil whereas for Peru and Colombia we find significant effects on economic growth. These results go in accordance to the sectorial composition dimensions of each country. They are consequent as well with the reduction of use of fossil fuels in the provision of ener-gy. They are in conformity with government policies that regulate gasoline prices in order to avoid the pass through to consumers to regulate inflationary pressures. This regulation deters the increase of costs related to oil to the industries as shown in World Bank (2006), therefore, companies are more competitive in international markets and this will encourage an increase in exports.
V. CONCLUDING REMARKS
The main contribution of this paper it to have studied three of the major oil exposed economies in South and Central America and obtain consistent results with the literature and allowing for nonlinear specification of oil shocks. These three countries account for 37% of the total oil production of Central and South America. The case of Brazil that alone accounts for 42.3% of oil consumption in the region is of special interest since it is a major player and shown reactions to oil shocks in

The macroeconomic effects of oil shocks in three Latin American economies
165
accordance to what has been analyzed in the literature. Inflationary pressure will be an issue when we observe oil price increases. Governments should be able to control in an optimal way how this prolonged and significant increase in prices is handled. The extent to which Brazil is exposed to oil price shocks and how commodities are affected can create negative spillovers to the region since Brazil is the main exporter of manufactured products. Peru and Colombia are strong emerging economies where the oil price regulation is an important issue to analyze.
In line with Calvacanti and Jalles (2013) we find a strong significant and prolonged result that shows an increase in inflation in Brazil after an oil price shock, a consistent result for net oil importers as in Blanchard and Gali (2007). Higher oil prices would affect the disposable income of agents and hence their consumption. Its disposable income declines in the face of higher crude oil prices, thus lowering its consumption. In addition, oil prices may lower investment by raising the production cost of firms as in World Bank (2006).
For Colombia and Peru, the result is not very significant in accordance with Uribe and Ulloa (2011) and Blanchard and Gali (2007). In the case of Peru, also a net oil importer, the transmission or pass-through of an increase of oil price to core CPI shown as an increase in the price of gasoline is limited because of the presence of subsidies as explained in World Bank (2006), although a gradual elimination was implemented in 2012 still this explains why the consumer does not seem affected by oil price increases.
Regarding economic growth, measured using IPI, we observe significant negative results for Brazil this is in accordance with seeing oil as an input in the production function of firms, a sharp increase in crude oil prices will lead to rising production costs which, in turn, would lower output. The size of the drops is in accordance to what is found in World Bank (2006). The results of IPI are not significant for Colombia, in line with Killian (2008b). We do not observe a strong increase in Colombia, this lack of the expected behavior may be due to the measure we used as a proxy of IPI: Manufacturing Index. This may create distortions in the measure and may not allow, together with monetary policies that control domestic demand, the correct pass-through of oil increase to IPI measures as stated in World Bank (2006). For Peru we observe an increase in the economic growth, we can find that this relationship holds because of domestic oil price control that is used as a protectionary measure as explained above. This allows industries not to be severally affected by oil price shocks, because of the subsidy their prices are more competitive in world markets and this encourages an increase in exports. We should not forget that the three countries are oil producers and the variation on the level of consumption

Juan Carlos Alarcon - Juan Carlos Molero - Fernando Pérez de GraciaCuestiones Económicas Vol. 26, No. 2:2, 2016
166
has changed and will change but also that these three countries account for more than half of oil consumption in South and Central America.
In sum, this paper shows that oil price shocks have an important effect on real economic variables in the short run as noticed in Cunado and Perez de Gracia (2005). The sectorial composition and the share of the economy dependent directly and indirectly of oil, and it should be analyzed in more depth, in order to attain a better understanding of economic alterations caused by oil shocks.
We expect to analyze in future research the issue of non-stationarity of interest rates. It is important to take into account price stickiness and how commodities prices react more rapidly to oil increases than decreases as in Lee et al (1995). Moreover, the correct diversification of the economy, regarding oil production dependency, still continuous to be a necessary issue to attain in the medium-long run.
Documento recibido: 30/08/2015 Documento aceptado: 18/11/2016

The macroeconomic effects of oil shocks in three Latin American economies
167
REFERENCES
Alaimo, V., & Lopez, H. (2008). Oil intensities and oil prices: evidence for Latin America. World Bank Policy Research Working Paper Series, Vol.
Annual Energy Outlook (2014). Energy Information Administration (EIA)., Inter-national Energy Statistics database, www.eia.gov/ies. DOE/EIA-0383(2014) (Washington, DC: May 2014).
Bernanke, B. S., Gertler, M., Watson, M., Sims, C. A., & Friedman, B. M. (1997). Systematic monetary policy and the effects of oil price shocks. Brookings papers on economic activity, 1997(1), 91-157.
Berument, M. H., Ceylan, N. B., & Dogan, N. (2010). The impact of oil price shocks on the economic growth of selected MENA countries. The Energy Journal, 149-176.
Blanchard, O. J., & Gali, J. (2007). The Macroeconomic Effects of Oil Shocks: Why are the 2000s so different from the 1970s? (No. w13368). National Bureau of Economic Research.
Cavalcanti, T., & Jalles, J. T. (2013). Macroeconomic effects of oil price shocks in Brazil and in the United States. Applied Energy, 104, 475-486.
Caselli, F., & Michaels, G. (2013). Do oil windfalls improve living standards? Evidence from Brazil. American Economic Journal: Applied Economics, 5(1), 208-238.
Clements, M. P., & Hendry, D. F. (1995). Forecasting in cointegrated systems. Journal of Applied Econometrics, 10(2), 127-146.
Cologni, A., & Manera, M. (2008). Oil prices, inflation and interest rates in a structural cointegrated VAR model for the G-7 countries. Energy economics, 30(3), 856-888.
Cunado, J., & De Gracia, F. P. (2005). Oil prices, economic activity and inflation: evidence for some Asian countries. The Quarterly Review of Economics and Finance, 45(1), 65-83.
Curcio, S., & Vilker, A. (2014). Impacto de las variaciones de precios de las commodities expor-tadas en la economía real de los países de América Latina. Revista de investigación en modelos financieros, 1.

Juan Carlos Alarcon - Juan Carlos Molero - Fernando Pérez de GraciaCuestiones Económicas Vol. 26, No. 2:2, 2016
168
Davis, S. J., & Haltiwanger, J. (2001). Sectoral job creation and destruction responses to oil price changes. Journal of monetary economics, 48(3), 465-512.
Dargay, J. M., Gately, D., & Huntington, H. G. (2007, August). Price and income responsiveness of world oil demand, by product. In Energy Modeling Forum Working Paper EMF OP (Vol. 61).
Dickey, D. A., & Fuller, W. A. (1981). Likelihood ratio statistics for autoregressive time series with a unit root. Econometrica: Journal of the Econometric Society, 1057-1072.
Federal Reserve Bank of St. Louis (2015). FRED Economic Data. https://research.stlouisfed.org/fred2/. Last access: 24 August, 2015.
Ferderer, J. P. (1997). Oil price volatility and the macroeconomy. Journal of macroeconomics, 18(1), 1-26.
Gately, D., & Huntington, H. G. (2002). The asymmetric effects of changes in price and income on energy and oil demand. The Energy Journal, 19-55.
Gillman, M., & Nakov, A. (2009). Monetary effects on nominal oil prices. The North American Journal of Economics and Finance, 20(3), 239-254.
Gonzales, E. J. R., & de Proyectos breves, C. Crecimiento económico y desarrollo sustentable: el rol de los recursos naturales en la economia peruana: 1970-2005.
Hamilton, J. D. (1983). Oil and the macroeconomy since World War II. The Journal of Political Economy, 228-248.
Hamilton, J. D. (1996). This is what happened to the oil price-macroeconomy relationship. Journal of Monetary Economics, 38(2), 215-220.
Hamilton, J. D. (2003). What is an oil shock?. Journal of econometrics, 113(2), 363-398.
Hamilton, J. D., & Herrera, A. M. (2004). Oil shocks and aggregate macroeconomic behavior: the role of monetary policy: a comment. Journal of Money, Credit, and Banking, 36(2), 265-286.
Hamilton, J. D. (2009). Causes and Consequences of the Oil Shock of 2007-08 (No. w15002). National Bureau of Economic Research.

The macroeconomic effects of oil shocks in three Latin American economies
169
Hausmann, R. (1995). Dealing with negative oil shocks: the Venezuelan experience in the eighties.
Hoffman, D. L., & Rasche, R. H. (1996). Assessing forecast performance in a cointegrated system. Journal of Applied Econometrics, 11(5), 495-517.
Hooker, M. A. (1996). What happened to the oil price-macroeconomy relationship?. Journal of monetary Economics, 38(2), 195-213.
Hooker, M. A. (2002). Are oil shocks inflationary?: Asymmetric and nonlinear specifications versus changes in regime. Journal of Money, Credit, and Banking, 34(2), 540-561.
International Monetary Fund (2015). International Financial Statistics (IFS), http://elibrary-data.imf.org/DataExplorer. Last Acces: 24 August, 2015
Johansen, S., & Juselius, K. (1990). Maximum likelihood estimation and inference on cointegration—with applications to the demand for money. Oxford Bulletin of Economics and statistics, 52(2), 169-210.
Kilian, L. (2008a). The economic effects of energy price shocks. Journal of Economic Literature, 46(4), 871-909.
Kilian, L. (2008b). Exogenous oil supply shocks: how big are they and how much do they matter for the US economy?. The Review of Economics and Statistics, 90(2), 216-240.
Kim, S., & Willett, T. D. (2000). Is the negative correlation between inflation and growth real? An analysis of the effects of the oil supply shocks. Applied Economics Letters, 7(3), 141-147.
Koop, G., Pesaran, M. H., & Potter, S. M. (1996). Impulse response analysis in nonlinear multivariate models. Journal of econometrics, 74(1), 119-147.
Lee, K., Ni, S., & Ratti, R. A. (1995). Oil shocks and the macroeconomy: the role of price variability. The Energy Journal, 39-56.
Lescaroux, F., & Mignon, V. (2008). On the influence of oil prices on economic activity and other macroeconomic and financial variables. OPEC Energy Review, 32(4), 343-380.
Maghyereh, A. (2006). Oil price shocks and emerging stock markets: A generalized VAR approach. In Global Stock Markets and Portfolio Management (pp. 55-68). Palgrave Macmillan UK.

Juan Carlos Alarcon - Juan Carlos Molero - Fernando Pérez de GraciaCuestiones Económicas Vol. 26, No. 2:2, 2016
170
Mendoza, O., & Vera, D. (2010). The asymmetric effects of oil shocks on an oil-exporting economy. Cuadernos de economía, 47(135), 3-13.
Mork, K. A. (1989). Oil and the macroeconomy when prices go up and down: an extension of Hamilton’s results. Journal of political Economy, 97(3), 740-744.
Mory, J. F. (1993). Oil prices and economic activity: is the relationship symmetric?. The Energy Journal, 151-161.
Naka, A., & Tufte, D. (1997). Examining impulse response functions in cointegrated systems. Applied economics, 29(12), 1593-1603.
Nunnenkamp, P. (1982). The impact of rising oil prices on economic growth in developing countries in the seventies. Kyklos, 35(4), 633-647.
Park, J., & Ratti, R. A. (2008). Oil price shocks and stock markets in the US and 13 European countries. Energy economics, 30(5), 2587-2608.
Perilla, J. (2010). El impacto de los precios del petróleo sobre el crecimiento económico en Colom-bia. Revista de Economía del Rosario, 13(1).
Phillips, P. C., & Perron, P. (1988). Testing for a unit root in time series regression. Biometrika, 75(2), 335-346.
Pinzón, H. Y. R. (2011). Estudio del fenómeno de inflación importada vía precios del petróleo y su aplicación al caso colombiano mediante el uso de modelos var para el periodo 2000-2009. Estudios Gerenciales, 27(121), 79-97.
Rahman, S., & Serletis, A. (2010). The asymmetric effects of oil price and monetary policy shocks: A nonlinear VAR approach. Energy Economics, 32(6), 1460-1466.
Rasche, R. H., & Tatom, J. A. (1981, January). Energy price shocks, aggregate supply and monetary policy: the theory and the international evidence. In Carnegie-Rochester Conference Series on Public Policy (Vol. 14, pp. 9-93). North-Holland.
Sachs, J. D., & Warner, A. M. (2001). The curse of natural resources. European economic review, 45(4), 827-838.
Sadorsky, P. (1999). Oil price shocks and stock market activity. Energy Economics, 21(5), 449-469.

The macroeconomic effects of oil shocks in three Latin American economies
171
Salas, J. (2009). ¿Qué explica las fluctuaciones de la inflación en el Perú en el periodo 2002-2008?: Evidencia de un análisis VAR estructural. Banco Central de Reserva del Perú, Revista Estudios Económicos, 16, 9-36.
Sánchez Villamil, E. Shocks del precio del petróleo y su impacto en el crecimiento y la inflación de la economía colombiana/Shocks of oil prices and its impact in the growth and inflation of the colombian economy (Doctoral dissertation, Universidad Nacional de Colombia).
Sims, C. A. (1980). Macroeconomics and reality. Econometrica: Journal of the Econometric Society, 1-48.
Uribe Gil, J., & Ulloa Villegas, I. M. (2011). Otro País Exportador Neto de Petróleo y sus Reacciones Macroeconómicas ante Cambios del Precio: Colombia. Universidad del Va-lle-CIDSE.
Schwert, G. W. (1987). Effects of model specification on tests for unit roots in macroeconomic data. Journal of Monetary Economics, 20(1), 73-103.
Wen, Y., & Aguiar-Conraria, L. (2008). A note on oil dependence and economic instability. Macroeconomic Dynamics, 12(05), 717-723.
World Bank (2006). Assessing the Impact of Higher Oil Prices in Latin America.Jointly prepared with the Latin American and the Caribbean Region, Office of the Chief Economist and Economic Policy Sector.
World Bank (2015). Latin America and Caribbean Overview: http://www.worldbank.org/en/region/lac/overview. Last access: August 10, 2015.