the long and winding road of nutrient criteria development
TRANSCRIPT

The Long and Winding Roadof Nutrient Criteria Development
SoutheastStormwaterAssociation
Louisville, KyOctober 2017
Doug DurbinChief Scientist

A Race Between the States

Brown and Caldwell 3
In 1998, EPA began a nationwide push for states and tribes to develop Numeric Nutrient Criteria to replace their narrative criteria
A primary justification was that NNC would make assessment, permitting, compliance and enforcement easier and more defensible
And they’re off…..
is better than
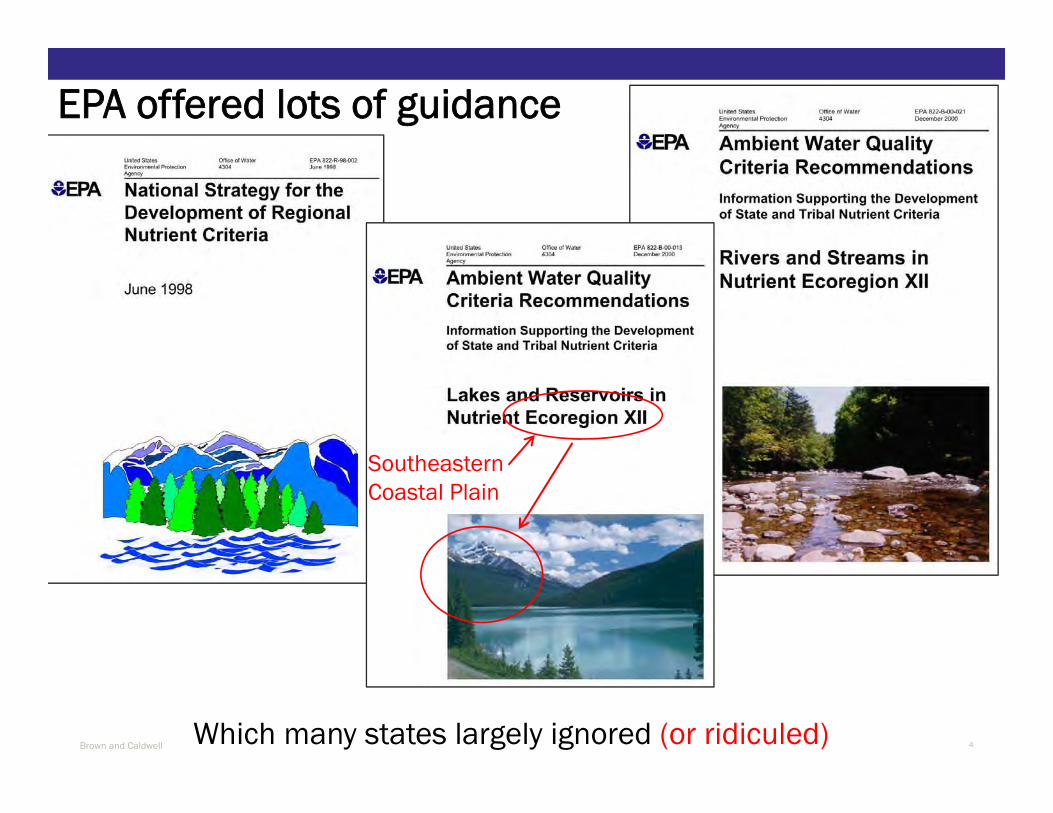
Brown and Caldwell 4Which many states largely ignored (or ridiculed)
EPA offered lots of guidance
Southeastern Coastal Plain

Brown and Caldwell 5
Like any good unfunded Federal mandate, the response by states and tribes was not so uniform
And the race had a choppy start
So here we are nearly 20 years later….

Brown and Caldwell 6
EPA has a groovy interactive map on its NNC website(https://www.epa.gov/nutrient-policy-data/state-progress-toward-developing-numeric-nutrient-water-quality-criteria)
Just click a year and it shows the status of the states toward developing Nitrogen and Phosphorus criteria in that year
Click on any state and it takes you to more information than you could ever want about its N and P standards
Let’s look at just a few of the states to check on how the NNC race is going on that long, winding road

Brown and Caldwell 7
Someone at EPA has good organizational skills…

Brown and Caldwell 8
How About a Trip to Hawaii ?!
Brown and Caldwell 9
Hawaii was the first state with a complete set of NNC
And they have a lot of people out testing the water every day…
Interesting side story . . . . .

Brown and Caldwell 10
Cliff Kapono (UC San Diego student researcher):
Humans are so often concerned with the impact they're having on the environment – but we should be thinking about it from the opposite angle. When people realize their own recreational environment — the ocean — has a major effect on their health, they will become more motivated to keep the ocean clean for the sake of their own well-being.

Brown and Caldwell 11
Back to NNC…
Even the cover of Hawaii’s 305(b) Report looks like a travel brochure !

Brown and Caldwell 12
• Full set of NNC in place since at least 1998• Streams, Embayments, Open Ocean• No chl a criteria for streams (they are mostly torrential mountain
streams)• They have many water segments impaired for N, P and/or Chl a• Have only a few approved TMDLs in place• Many impaired segments are ranked as High priority for TMDL
development• 2014 Integrated Report says only a small proportion of the state’s
waters can even be assessed with current data
So – a quick start in the NNC race doesn’t necessarily get you across the finish line of flawless water quality.
But everything is not perfect in this tropical paradise

Brown and Caldwell 13
Some NNC things happened way before 1998
The EPA NNC website also has a map showing states’ status toward developing Chlorophyll a criteria
North Carolina has had statewide Chl a standards on the books since the Clean Water Act was a baby (late 1970’s)
Brown and Caldwell 14
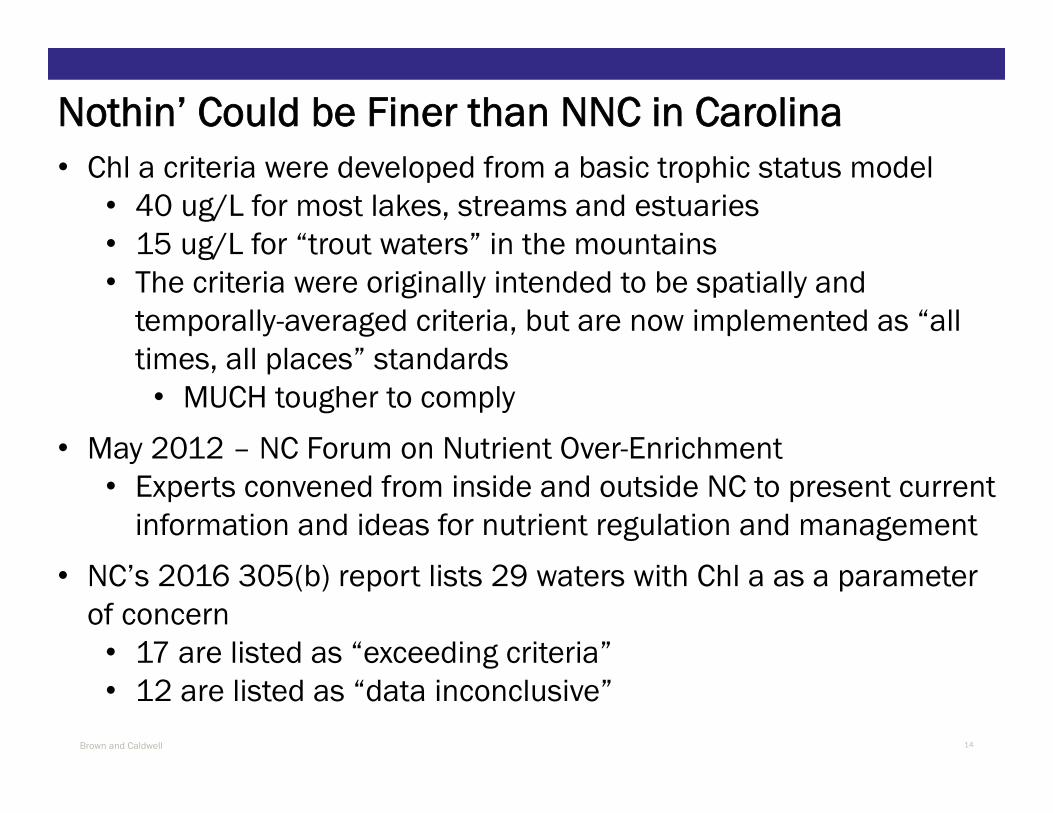
• Chl a criteria were developed from a basic trophic status model• 40 ug/L for most lakes, streams and estuaries• 15 ug/L for “trout waters” in the mountains• The criteria were originally intended to be spatially and
temporally-averaged criteria, but are now implemented as “all times, all places” standards• MUCH tougher to comply
• May 2012 – NC Forum on Nutrient Over-Enrichment• Experts convened from inside and outside NC to present current
information and ideas for nutrient regulation and management• NC’s 2016 305(b) report lists 29 waters with Chl a as a parameter
of concern• 17 are listed as “exceeding criteria”• 12 are listed as “data inconclusive”
Nothin’ Could be Finer than NNC in Carolina

Brown and Caldwell 15
• NC has a sub-classification of “Nutrient Sensitive Waters”• 5 lakes/watersheds have Nutrient Strategies (similar to a TMDL)
• Most strategies have been in place for 10-20 years now.• Each strategy is unique to the water body• Each is “managed” independently, with varying degrees of economic
and political pressure.• There is uncertainty and disagreement over whether the strategies
are improving water quality.
Nothin’ Could be Finer than NNC in Carolina

Brown and Caldwell 16
• NC has no statewide N or P criteria• Some see the Chl a standard as supplanting the need for N & P
criteria• If you regulate Chl a, why the need to regulate N & P?
• NCDEQ recently updated its NNC Development Plan• Convened Scientific Advisory Committee and Criteria Implementation
Committee to review information and offer recommendations.• Working toward adopting NNC for a few specific waters
• High Rock Lake (targeted for NNC adoption in July 2018)• Albemarle Sound estuary (Dec 2020)• Middle Cape Fear River (Dec 2021)
• After these three efforts, the plan calls for prioritizing all other lakes, rivers and estuaries• NNC adoption dates for that process extend out to 2025. • There are those who think these deadlines will never be met.
Nothin’ Could be Finer than NNC in Carolina
Brown and Caldwell 17
Politics and budget cuts in NC in recent years have led to far fewer and far less experienced resource managers at NCDEQ, which hampers its ability to lead this process.
So – even if your state got a long head start before the NNC race officially began in 1998, you may still be far from the finish line.
Nothin’ Could be Finer than NNC in Carolina

Brown and Caldwell 18
And now, back to N and P
Zooming ahead on the time-travel NNC map…
But first – look at 1998 again, to appreciate the difference that 15 years made nationally
Here is 1998

Brown and Caldwell 19
And now, back to N and P
And here is 2013
So, 10 states went from “nothing” to “a little bit”
And, 2 states went from “nothing” to “pretty good”

Brown and Caldwell 20
A Look at WisconsinIn 2010, Wisconsin adopted – and EPA approved -numeric phosphoruscriteria for rivers and streams, lakes and reservoirs, and nearshore and open waters of the Great Lakes.

Brown and Caldwell 21
In fact, WI adopted a lot of numeric phosphorus criteria :
Wisconsin
Phosphorus Criteria:
Most rivers: 100 ug/LAll other streams: 75 ug/LStratified reservoirs: 30 ug/LNon-stratified reservoirs: 40 ug/LStratified “two-story” fishery lakes: 15 ug/LStratified drainage lakes: 30 ug/LNon-stratified (shallow) drainage lakes: 40 ug/LStratified seepage lakes: 20 ug/LNon-stratified (shallow) lakes: 40 ug/LLake Michigan open and nearshore waters: 7 ug/LLake Superior open and nearshore waters: 5 ug/L

Brown and Caldwell 22
More than seven years after adopting its phosphorus criteria, nearly half of the state’s water quality impairments reported are for . . . Yep, phosphorus exceedances
Wisconsin
You are what you measure….?

Brown and Caldwell 23
NNC Sidebar: Let’s swing by Chesapeake BayAfter a decade of work, a TMDL was finalized by EPA at the end of 2010
Largest TMDL footprint ever established – 64,000 square miles
Includes parts of Delaware, Maryland, New York, Pennsylvania, Virginia, West Virginia and the District of Columbia
Identifies pollution reduction needs for nitrogen, phosphorus and sediment.

Brown and Caldwell 24
Chesapeake BayIndividual reduction requirements for 92 watershed segments
Load reductions were developed using models to determine when Chl a, dissolved oxygen, seagrass and water clarity targets would be met
TMDL goal is to have all reduction measures in place by 2025, with 60% in place by 2017
Each jurisdiction has 2-year milestones to demonstrate load reductions

Brown and Caldwell 25
Chesapeake Bay EPA’s 2017 bi-annual evaluations metrics just came out this summer
Every jurisdiction was found to be “off track” for at least one parameter:
DE - N DC - N and sedimentMD - NNY - N and sedimentPA - N, P and sedimentVA - sedimentWV – P
But then – they didn’t start out by establishing NNC, so what did they expect, right?

Brown and Caldwell 26
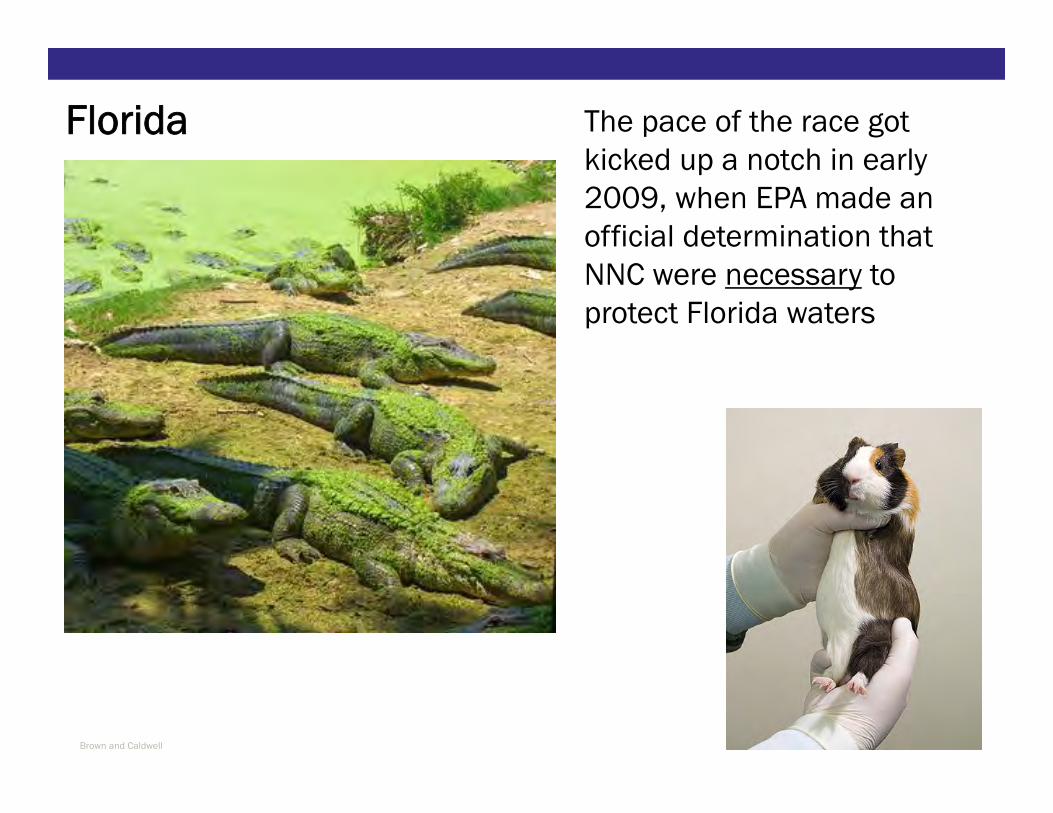
Florida started the NNC race in earnest in 2001, entering into an agreement with EPA in 2002 to work together
Then, EPA got sued in 2008, and Florida became NNC litigation Exhibit A….
Florida: NNC Goes to Court
Brown and Caldwell 27
The pace of the race got kicked up a notch in early 2009, when EPA made an official determination that NNC were necessary to protect Florida waters
Florida

Brown and Caldwell 28
About five years later (2014), after a ton of data, a dose of science, dozens of lawyers, a few hundred meetings, and more than 20 million dollars, Florida had adopted – and EPA approved – comprehensive statewide NNC
In a creative attempt to maintain some flexibility in implementation, FL declared that its NNC are “numerical interpretations of the narrative standard”
And everyone lived happily ever after! (not really)
Florida

Brown and Caldwell 29
Just having NNC doesn’t mean the race is over!
• Remember, EPA pushed for NNC to make assessment, permitting, compliance and enforcement easier• But EPA acknowledged that the CWA only has jurisdiction over
permitted outfalls, and most nutrient loading in the U.S. is from non-point sources
• NNC must be “implemented” into every applicable permit as part of the 5-year renewal cycle
• Florida’s NNC rely heavily on biological data, and there was suddenly a dearth of data to make NNC impairment determinations (or at least to solidly support them)
• Application of the NNC rule was inconsistent with prior determinations of nutrient impairment
Florida

Brown and Caldwell 30
Florida

Brown and Caldwell 31
FloridaNutrient Impairments
• Florida must re-assess its waters pursuant to NNC• Done in five groups in a perpetual annual rotation
• Only 3 groups completed so far:• Groups 2, 3, and 4
• 383 water body segments now listed for nutrient impairment
• 358 formerly impaired waters delisted• So NNC could be generating a few more impairment
listings

Brown and Caldwell 32
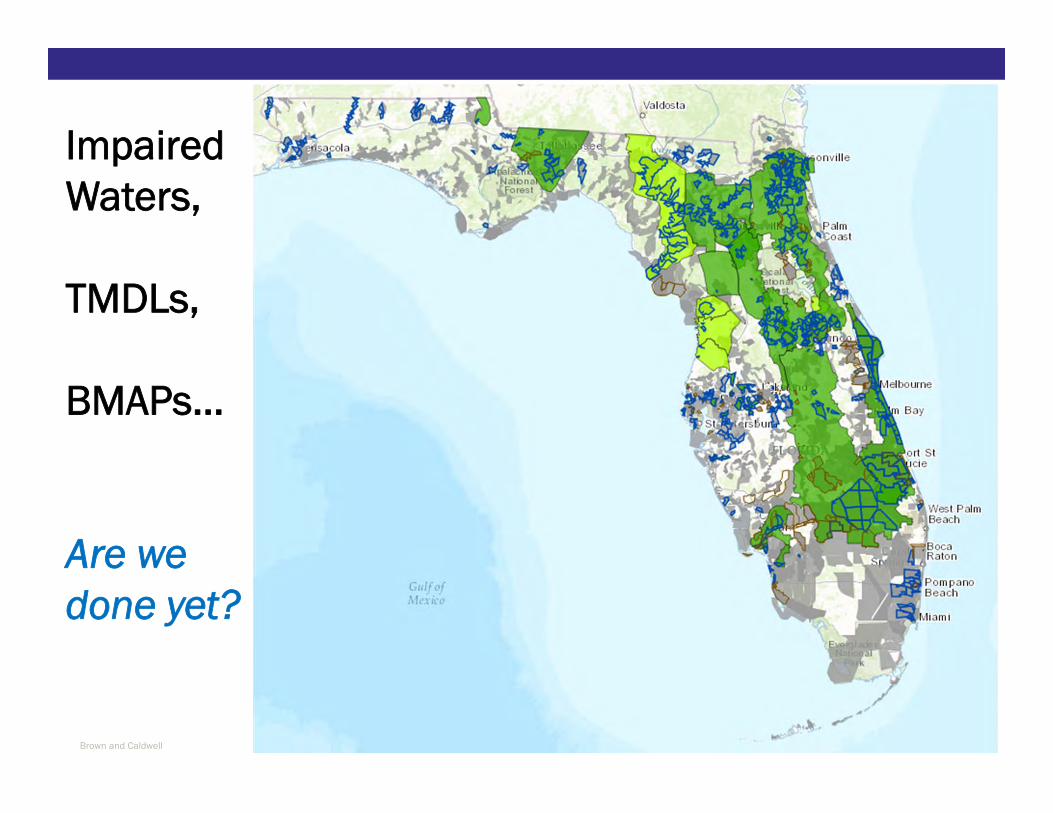
FloridaImpairedWaters• Nutrients have several “Bases for Listing”:
• Algal mats• Chlorophyll a• Historic Chlorophyll a• Macrophytes• Trophic State Index • Historic Trophic State Index• Nitrate-nitrite• Total Nitrogen• Total Phosphorus• Stream Condition Index• Other
• Note: this map shows all types of impairments, not just nutrients

Brown and Caldwell 33
FloridaImpairedWaters
And there are ten different assessment categories for nutrient impairment

Brown and Caldwell 34
FloridaTMDLs
353 WBIDs have Final TMDLs for nutrient impairments
Of those, only about 25 have been adopted based on NNC (i.e., since late 2014).

Brown and Caldwell 35
FloridaTMDLs
FDEP has been deeply engaged in looking back at WBIDs that were Impaired or had TMDLs before NNC. This has kept them from making much progress on new TMDLs.
TMDL schedule extends through 2022

Brown and Caldwell 36
FloridaBMAPs
Basin Management Action Plans generally take a few years to develop
But at least they cover a lot of territory !
NNC have had little influence on existing BMAPs
Brown and Caldwell 37
Impaired Waters,
TMDLs,
BMAPs…
Are we done yet?

Brown and Caldwell 38
No shading doesn’t have to mean no NNC progress!
And finally back to
Kentucky
The Sun Shines Bright on My Old
Kentucky Home…

Brown and Caldwell 39
Kentucky has a plan.
Recently updated even!

Brown and Caldwell 40
Kentucky – NNC Development Progress
Update Date Type/ SubType Nitrogen or
Phosphorus
1. Planning for Criteria
Development
2. Collection of
Information & and Data
3. Analysis of Information
& Data
4. Proposal of Criteria
5. Adoption of Criteria by
EPA
8/9/2017 Lakes/ Reservoirs – All N completed No Date
ProvidedNo Date Provided
No Date Provided
No Date Provided
8/9/2017 Lakes/ Reservoirs – All P completed No Date
ProvidedNo Date Provided
No Date Provided
No Date Provided
8/9/2017Rivers/ Streams - Non-Wadeable
N completed Collection Underway
No Date Provided
No Date Provided
No Date Provided
8/9/2017Rivers/ Streams - Non-Wadeable
P completed Collection Underway
No Date Provided
No Date Provided
No Date Provided
8/9/2017Rivers/ Streams –Wadeable
N completed Collection Underway
No Date Provided
No Date Provided
No Date Provided
8/9/2017Rivers/ Streams –Wadeable
P completed Collection Underway
No Date Provided
No Date Provided
No Date Provided
8/9/2017

Brown and Caldwell 41
Kentucky – Next Steps

Brown and Caldwell 42
Kentucky – The good news?
Maybe go with the chicken at dinner….

Brown and Caldwell 43
Observations• It takes a lot of time, data, effort and money to establish
defensible NNC, and implementation is complicated too
• Establishing NNC early on doesn’t seem to mean nutrient impairments are brought under control sooner
• NNC might result in identifying more waters as Impaired• Wisconsin now has a lot of P-impaired waters• Florida’s 1998 303(d) list had 540 WBIDs listed for nutrients
• Current list has 585 (8% increase)
• Even with NNC, TMDLs and NPDES permits cannot force nutrient reductions from non-point sources, which are seen as the predominant contributors of nutrients in most watersheds

Brown and Caldwell 44
Observations• Having NNC does not necessarily make it easier to determine
when a water body is in compliance• e.g., Florida uses several biological indicators to determine
whether nutrient impairment exists, and has 10 different assessment categories for assigning impairment status
• EPA generally stays engaged with states during NNC development, but hasn’t shown much interest or ability in ending up with uniform NNC values or policies among the states
• In some cases, NNC requires looking backward as much as forward (i.e., to bring prior assessments and plans up to date)
• Politics and economics can be at least as important as science in the establishment and the implementation of NNC

Brown and Caldwell 45
Observations• It may be difficult to see the effect of having NNC in many cases, because
so many other programs and projects have already been addressing water quality improvement. • Continued tightening of individual NPDES permits (independent of
including NNC limits)• Refinements to MS4 permits and stormwater management actions by
local governments• Improved agricultural technologies that reduce nutrient losses to
waterways• Grants from EPA and others to fund projects in various watersheds• Springs and watershed protection programs• Septic-to-sewer conversions• Land conversion from agriculture to developed, with requirements for
quantity and quality management• Fertilizer and water management ordinances at the local level

Brown and Caldwell 46
And The Future….
Looks a lot like The Present…..
Watch Kentucky Go!!
Brown and Caldwell 47
And the race goes on…..