rationale for missouri numeric nutrient criteria for lakes · rationale for missouri numeric...
TRANSCRIPT
1
Rationale for Missouri Numeric Nutrient
Criteria for Lakes
September, 2015
Table of Contents Introduction .................................................................................................................................................. 2
Setting Criteria .............................................................................................................................................. 4
Designated Uses and Criteria ........................................................................................................................ 9
Public Drinking Water Supply ................................................................................................................. 10
Protection of Aquatic Habitat ................................................................................................................. 12
Calculation of Screening Values .................................................................................................................. 16
Discussion.................................................................................................................................................... 17
References .................................................................................................................................................. 19
2
Introduction
In August 2011, the United States Environmental Protection Agency (EPA) disapproved the majority of
Missouri’s numeric nutrient criteria (NNC) for lakes at 10 CSR 20-7.031(3)(N), citing concerns in regard to
scientific rigor, reproducibility, and connection to designated uses (DU) (US EPA, 2011). The Missouri
Department of Natural Resources, with the input of stakeholders, is proposing revised NNC for lakes and
providing improved scientific rationale for criteria development while strengthening the link between
the criteria and the DU of lake waters. This document outlines the rationale and scientific basis for
these revised NNC and provides information to the public and interested parties from which to provide
comments.
All lakes in Missouri’s Water Quality Standards regulation have DU for aquatic habitat protection (AQL),
human health protection (HHP), whole body contact recreation (WBC), secondary contact recreation
(SCR), and livestock and wildlife watering (LWW). A number of lakes also have an additional DU of
drinking water supply (DWS) (Missouri Secretary of State, 2014). The scope of DU to be considered by
the revised NNC was decided through a series of stakeholder discussions that were part of the
department’s Water Protection Forum. It was decided through this forum that the focus of revised NNC
development would concentrate on the AQL and DWS designated uses, as sufficient data and
information exist from which to establish criteria for these DU. Research and information continue to
develop at the national level with respect to nutrient impacts and criteria for the protection of
recreational uses. Missouri intends to pursue NNC for recreational DU (i.e., WBC and SCR) during a
future rulemaking, likely within the 5 – 10 year timeframe. This will allow studies currently underway by
EPA and others on the effects of cyanotoxins on recreational uses to mature, and for the state to
conduct user perception surveys of algae by the recreating public.
Regional EPA Section 304(a) criteria for nutrients are currently available in the form of Regional Ambient
Water Quality Benchmarks for the protection of aquatic life (RTAG, 2011), and as Ambient Water Quality
Criteria Recommendations for Lakes in Nutrient Ecoregion VI, Ecoregion IX, and Ecoregion XI (US EPA,
2000a,b,and c). These benchmarks and recommendations reflect a regional, reference condition
approach to NNC development that is not representative of Missouri lakes due to differences in
hydrology, landscape and other factors. Missouri lakes, with the exception of oxbow lakes in the
Missouri and Mississippi River floodplains, are not natural hydrologic features, but rather are reservoirs
that have been created through local, state or federal programs and efforts. These man-made
3
impoundments render reference approaches to nutrient criteria development moot, as the water-
bodies are themselves a significant human influence on the landscape. Also, the relatively recent
construction of these reservoirs precludes the use of approaches to NNC development that focus on
historic conditions (Kennedy, 2001).
EPA regional nutrient benchmarks and recommendations were developed to represent nutrient levels
that protect against adverse over-enrichment of the water body. In its Ambient Water Quality Criteria
Recommendations (e.g., USEPA 2000 a,b, and c), the agency recommended that states “critically
evaluate this information in light of the specific designated uses that need to be protected.” EPA rightly
recognizes that optimal lake nutrient, or trophic, conditions for a specific DU do not necessarily coincide
with optimal conditions for other uses. In particular, AQL favors a relatively high availability of nutrients
to supply the food chain (Michaletz, Obrecht, & Jones, 2012; Downing & Plante, 1993; Ney, 1996). In
contrast, DWS and WBC are optimal at lower nutrient content, which enhances water transparency and
reduces the production of taste and odor compounds, disinfection byproduct precursors, and algal
toxins (Falconer, et al., 1999; Knowlton & Jones, 2003). With these NNC revisions, Missouri critically
evaluated the DU for which NNC were to be developed and regional differences in nutrient
requirements for these DU. The proposed NNC and implementation framework are anticipated to
ensure appropriate protection of all DU within a given ecoregion.
Trophic state refers to the biological production, both plant and animal life, that occurs in a lake or
reservoir. All trophic classification is based on a division of the trophic continuum, of which there are no
clear delineation of divisions (Carlson, 1977). Lakes with low nutrient concentrations and low levels of
algal production are referred to as oligotrophic. Water-bodies with high nutrient levels and productivity
are termed eutrophic. Mesotrophic lakes fall in between this continuum. Hypereutrophic lakes fall on
the extreme high end of this continuum, and are characterized by excessive nutrients and are extremely
productive in terms of algal growth. In these systems algal blooms may be frequent and severe. These
blooms can lead to oxygen deficits when the bloom dies off and bacterial decomposition of the organic
matter is maximized. Low oxygen concentrations can in turn negatively affect the aquatic life within the
lake, causing reduced reproduction or lethality (i.e., fish kills) depending on the duration and intensity of
dissolved oxygen decrease.
There is a relationship between geographical location and the occurrence of trophic conditions in
Missouri lakes (Jones & Knowlton, 1993, Jones, Knowlton et al, 2008, Jones et al, 2009). Lakes in the
4
northern and western parts of the state (Central Dissected Plains and Osage Plain ecoregions) tend to be
more eutrophic and hypereutrophic, while lakes in the Ozark Highlands ecoregion are generally
mesotrophic and oligotrophic. Lakes in the Ozark Border ecoregion have a range of trophic states that
are generally lower than the Plains ecoregions, but higher than the Ozark Highlands (Jones, Obrecht et
al., 2008). These regional differences in water quality reflect geological, topographical and cultural land
use differences across the state.
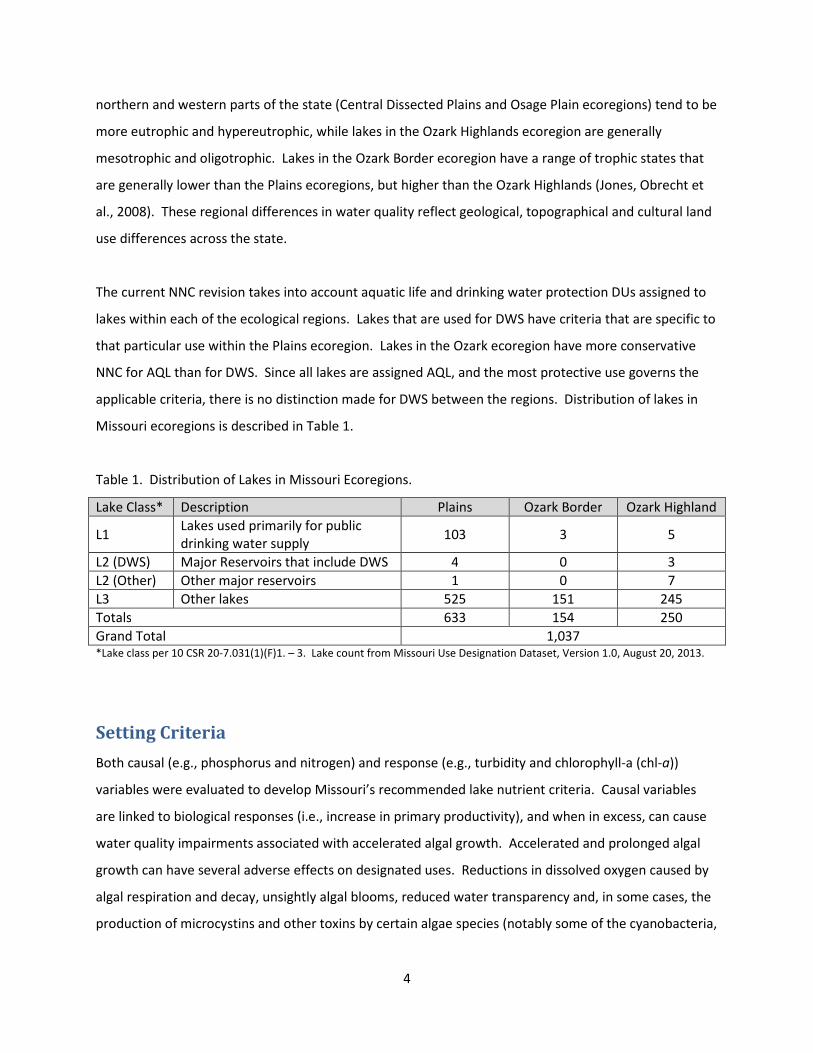
The current NNC revision takes into account aquatic life and drinking water protection DUs assigned to
lakes within each of the ecological regions. Lakes that are used for DWS have criteria that are specific to
that particular use within the Plains ecoregion. Lakes in the Ozark ecoregion have more conservative
NNC for AQL than for DWS. Since all lakes are assigned AQL, and the most protective use governs the
applicable criteria, there is no distinction made for DWS between the regions. Distribution of lakes in
Missouri ecoregions is described in Table 1.
Table 1. Distribution of Lakes in Missouri Ecoregions.
Lake Class* Description Plains Ozark Border Ozark Highland
L1 Lakes used primarily for public
drinking water supply 103 3 5
L2 (DWS) Major Reservoirs that include DWS 4 0 3
L2 (Other) Other major reservoirs 1 0 7
L3 Other lakes 525 151 245
Totals 633 154 250
Grand Total 1,037 *Lake class per 10 CSR 20-7.031(1)(F)1. – 3. Lake count from Missouri Use Designation Dataset, Version 1.0, August 20, 2013.
Setting Criteria
Both causal (e.g., phosphorus and nitrogen) and response (e.g., turbidity and chlorophyll-a (chl-a))
variables were evaluated to develop Missouri’s recommended lake nutrient criteria. Causal variables
are linked to biological responses (i.e., increase in primary productivity), and when in excess, can cause
water quality impairments associated with accelerated algal growth. Accelerated and prolonged algal
growth can have several adverse effects on designated uses. Reductions in dissolved oxygen caused by
algal respiration and decay, unsightly algal blooms, reduced water transparency and, in some cases, the
production of microcystins and other toxins by certain algae species (notably some of the cyanobacteria,
5
also known as blue-green algae) can all occur and in varying degrees. While eutrophication (i.e.,
nutrient enrichment) of lakes is a natural process in the landscape, anthropogenic inputs of nutrients, as
well as changes in hydrology and climate, can accelerate and exacerbate the natural processes.
Minimizing and eliminating the frequency and occurrence of these adverse effects, and attainment of
DU, is the driver for Missouri’s NNC efforts.
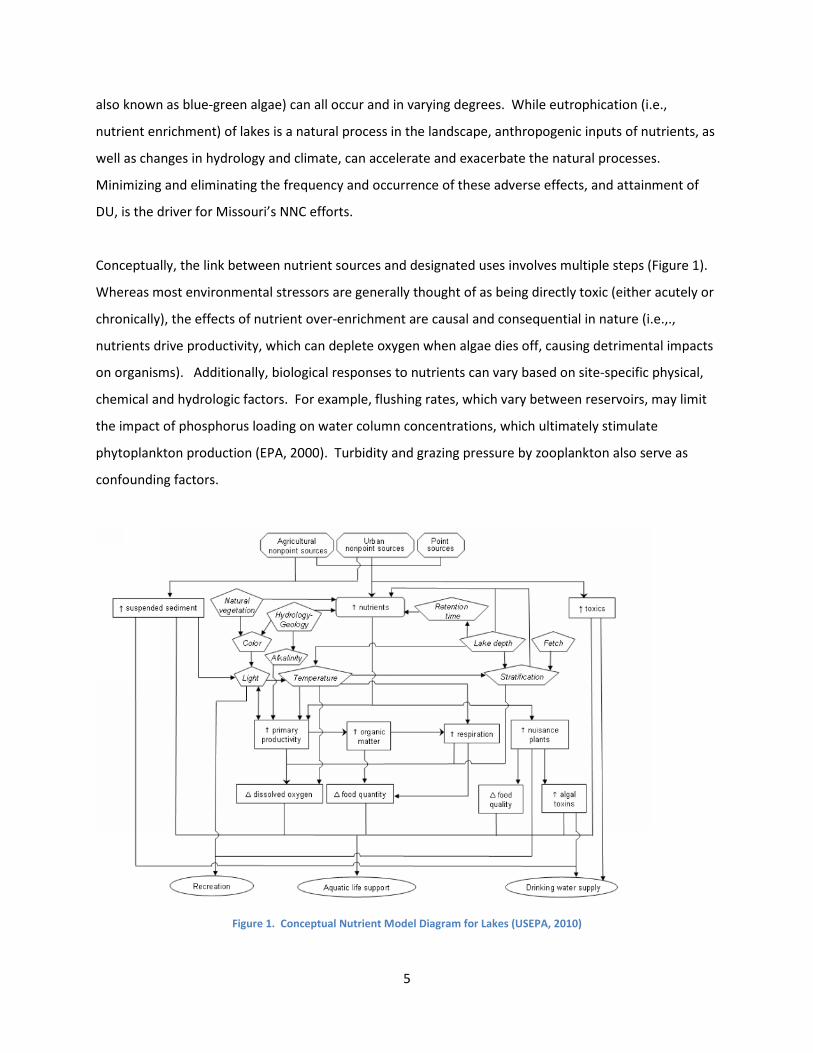
Conceptually, the link between nutrient sources and designated uses involves multiple steps (Figure 1).
Whereas most environmental stressors are generally thought of as being directly toxic (either acutely or
chronically), the effects of nutrient over-enrichment are causal and consequential in nature (i.e.,.,
nutrients drive productivity, which can deplete oxygen when algae dies off, causing detrimental impacts
on organisms). Additionally, biological responses to nutrients can vary based on site-specific physical,
chemical and hydrologic factors. For example, flushing rates, which vary between reservoirs, may limit
the impact of phosphorus loading on water column concentrations, which ultimately stimulate
phytoplankton production (EPA, 2000). Turbidity and grazing pressure by zooplankton also serve as
confounding factors.
Figure 1. Conceptual Nutrient Model Diagram for Lakes (USEPA, 2010)
6
Missouri is establishing revised NNC for lakes using methods and considerations established in guidance
by the EPA (US EPA, 2000d). In evaluating existing data and the types of lake features represented in
those data, it becomes clear that few natural lakes exist in Missouri. Most lake features are man-made
impoundments of surface waters for which the primary purpose is other than recreation (e.g.,
swimming, boating or fishing). (US EPA, 2000d) Many were constructed for flood control, drinking water
supply or hydropower generation. Reservoirs differ from natural lakes in that they exhibit a trophic
gradient as they lose nutrients through settling in the downstream direction. A reservoir may naturally
range from eutrophic in its upper reaches to oligotrophic near the dam. Reservoirs also tend to have
lower chl-a levels at the same phosphorus concentrations than natural lakes due to higher inorganic
turbidity and flushing rates (Soballe & Kimmel, 1987). Lake features covered by NNC remain those with
a surface area greater than 10 acres, the minimum size feature likely to have mean residence times and
flushing rates where nutrient enrichment can be an issue.
Empirical links between chlorophyll and phosphorus have been extensively studied and are well
established, particularly in Missouri. In Missouri reservoirs, total phosphorous (TP) accounts for 79% of
the cross-system variation in chlorophyll and there is a 5-fold range of Chl-a:TP ratios among long-term
means. Residual variation is likely due to lake-specific conditions including sediment influx (Jones &
Knowlton, 2005). A more recent analysis of water quality data within each of the ecological regions,
conducted by the department, also indicates significant correlations between TP and chl-a (Figure 2).
Correlations between total nitrogen (TN) and chl-a are generally not as strong, but are nevertheless
significant.

7
Figure 2. Chlorophyll-a - Total Phosphorus Plot of Annual Geomean Reservoir Data in the Ozark Highlands Region
While the biotic response to nutrient enrichment at specific concentration levels is relatively well
established in reservoirs, the department is not recommending use of traditional fixed-threshold
nutrient (phosphorus and nitrogen) criteria. Because the effects of nutrient over-enrichment are causal
(i.e., nutrients, themselves, are generally not toxic), linking causal variables (i.e., phosphorus and
nitrogen) to adverse impacts involves greater uncertainty and site-specific considerations than linking
response variables (chl-a). Less uncertainty and ecoregional applicability can be gained by utilizing
response variable correlations to protect and prevent against adverse impacts. For this reason, the
department is recommending that a biological variable, chl-a, serve as the basis for establishing nutrient
criteria. Chl-a is the most common method of measurement of the abundance of algae in a water body
and can be related to a number of factors directly impacting DU (e.g., algal blooms, low dissolved
oxygen and algal toxins). Additionally, adopting chl-a resolves the issue that reservoirs exhibit variable
sensitivity to nutrient enrichment based on their flushing rate, critical depth, sediment influx, and other
factors. Most importantly, chl-a provides nutrient criteria based on a biological variable directly
indicative of the health and status of a lake system and its DU.
Although a biological endpoint is being recommended as Missouri’s NNC, the department recognizes the
importance of including causal nutrient variables, like TP and TN, and other candidate variables (e.g.,
Sechhi depth and dissolved oxygen) in a holistic approach to lake nutrient management. To this end, the
0.1
1.0
10.0
100.0
1 10 100 1000
Ch
l-a
(µ
g/L
)
TP (µg/L)
OLS Regression
log (Chl-a) = 1.25707*log(TP) - 0.74164
R2 = 77.6%
log(P.I.) = ±0.147146
8
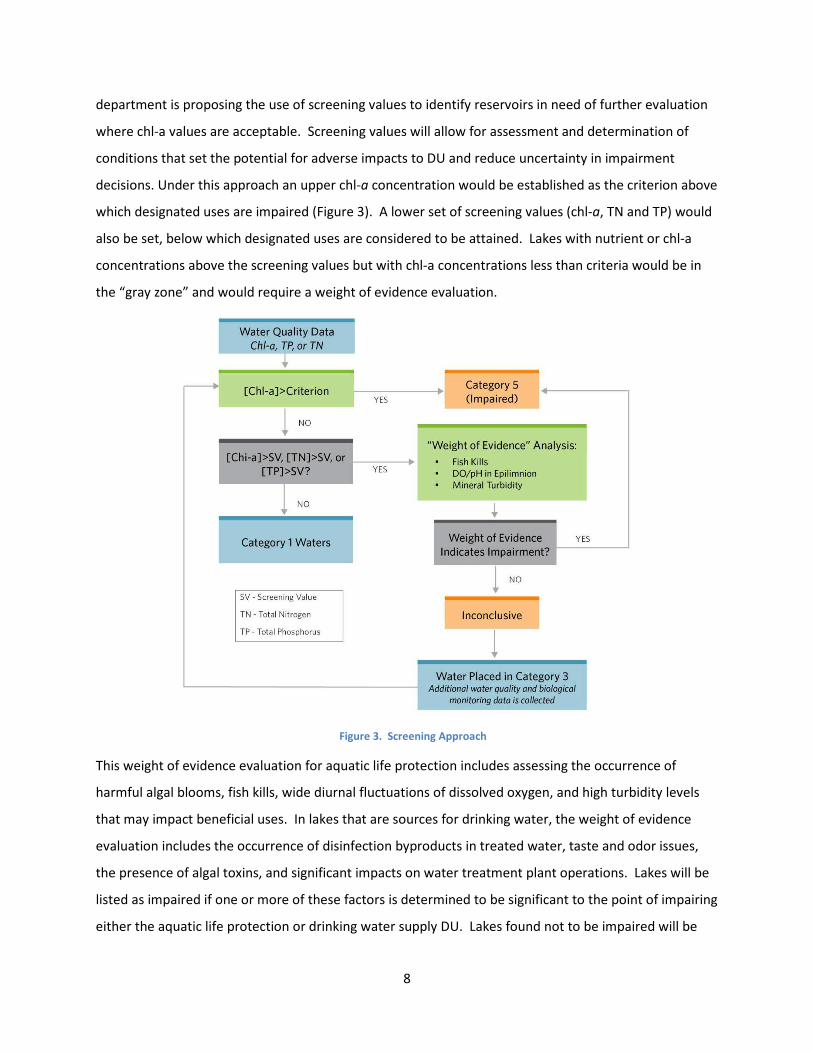
department is proposing the use of screening values to identify reservoirs in need of further evaluation
where chl-a values are acceptable. Screening values will allow for assessment and determination of
conditions that set the potential for adverse impacts to DU and reduce uncertainty in impairment
decisions. Under this approach an upper chl-a concentration would be established as the criterion above
which designated uses are impaired (Figure 3). A lower set of screening values (chl-a, TN and TP) would
also be set, below which designated uses are considered to be attained. Lakes with nutrient or chl-a
concentrations above the screening values but with chl-a concentrations less than criteria would be in
the “gray zone” and would require a weight of evidence evaluation.
This weight of evidence evaluation for aquatic life protection includes assessing the occurrence of
harmful algal blooms, fish kills, wide diurnal fluctuations of dissolved oxygen, and high turbidity levels
that may impact beneficial uses. In lakes that are sources for drinking water, the weight of evidence
evaluation includes the occurrence of disinfection byproducts in treated water, taste and odor issues,
the presence of algal toxins, and significant impacts on water treatment plant operations. Lakes will be
listed as impaired if one or more of these factors is determined to be significant to the point of impairing
either the aquatic life protection or drinking water supply DU. Lakes found not to be impaired will be
Figure 3. Screening Approach
9
placed in Category 3 of Missouri’s Integrated Report (i.e., Missouri’s 305(b) report) where water quality
data are not adequate to properly assess the designated use. Lakes in Category 3 would then be
prioritized for additional chemical and biological monitoring by the department.
The concept of a “gray zone” was widely discussed during EPA’s expert workshop on nutrient
enrichment in streams convened in April 2013 (US EPA, 2014). Some experts believed a “grey zone” is
necessary, noting the uncertainty associated with establishing a single threshold value (USEPA, 2013).
Such a concept has also been proposed by other states, including Virginia and Arizona. The department
concurs with the findings from the expert workshop and asserts that this approach provides a sound
scientific rationale for protecting designated uses.
Applicable water quality criteria must be expressed in the terms of magnitude, duration and frequency.
The department recommends that chl-a criteria and nutrient screening values be expressed as
geometric mean values. Geometric means will be used because nutrient concentrations have a log-
normal distribution. The chl-a criteria will be based on a long-term duration as defined by at least 3
years of data. A long-term duration of three or more years is necessary to account for natural variations
in nutrient levels due to climatic variability. (Knowlton & Jones, 2006). Additionally, two sets of
screening values for chl-a, total phosphorus (TP) and total nitrogen (TN),) based on a long-term (i.e.,
minimum of 3 years) and short-term (i.e., 1 year) periods, provide additional opportunities to screen
reservoirs for potential impairments. Potential lake impairment is more clearly associated with chl-a
concentration than TP or TN concentration, and the short-term chl-a screening value represents a
maximum acceptable concentration. Therefore, the magnitude of the short-term chl-a screening value is
proposed to be equal to the magnitude of the chl-a criterion. The magnitude of the long-term chl-a
screening value will be set to a lower value based on rationale provided in the following section. Short-
term and long-term TP and TN screening values are based on regional regressions and the magnitude of
the respective chl-a screening values as described in the “Calculation of Screening Values” section.
Designated Uses and Criteria
Rationale for the magnitude of chl-a criteria and nutrient screening values are provided below for public
drinking water supply and aquatic habitat protection DU.
10
Public Drinking Water Supply
Eutrophication in lakes that serve as public drinking water supply can give rise to several issues,
including taste and odor problems, higher treatment costs, and potential health hazards. The last
impact may come in the form of cyanotoxins or disinfection byproducts, notably trihalomethanes(THM).
One potential approach for setting criteria protective of drinking water supplies is to target nutrient
concentrations that limit algal blooms, which are closely linked to algal toxins and high levels of organic
carbon that may be disinfection byproduct precursors. Algal bloom frequency is thought to be a better
indicator of potential use impairment than trophic status alone (Heiskary and Walker, 1988). Some
studies have suggested that algal bloom frequency increases exponentially when mean chl-a levels
exceed 10 µg/L (Walker, 1985; Falconer, 1999; Downing et al., 2001). However, these findings are based
on interpretations of relatively poorly defined relationships. Additionally, these studies may be more
applicable to lakes than reservoirs. Downing et al. (2001) excluded reservoirs from their study of algal
blooms; potentially due to the fact that reservoirs typically respond differently to nutrient enrichment
than natural lakes.
Another potential approach to setting criteria is to target chl-a levels that minimize compounds
responsible for taste and odor issues. Two such compounds, geosmin (trans-1, 10 dimethyl-trans-9-
decalol) and MIB (2-methyl isoborneol), have been strongly associated with blue-green algae blooms.
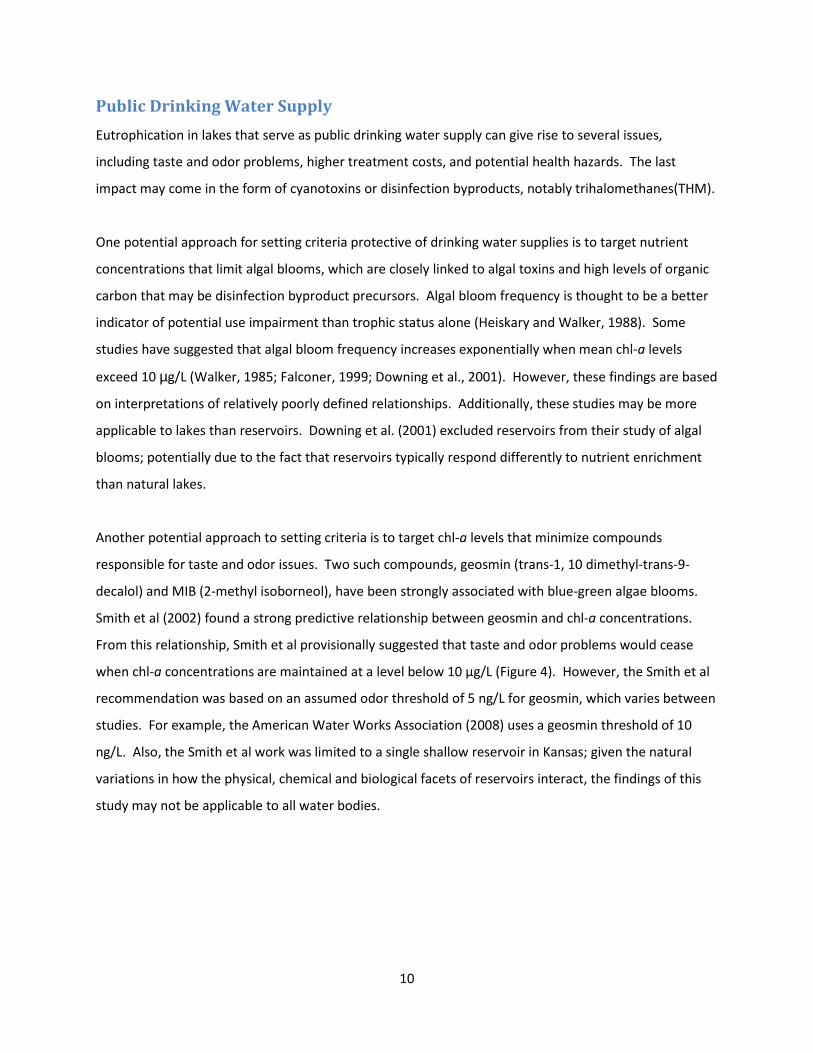
Smith et al (2002) found a strong predictive relationship between geosmin and chl-a concentrations.
From this relationship, Smith et al provisionally suggested that taste and odor problems would cease
when chl-a concentrations are maintained at a level below 10 µg/L (Figure 4). However, the Smith et al
recommendation was based on an assumed odor threshold of 5 ng/L for geosmin, which varies between
studies. For example, the American Water Works Association (2008) uses a geosmin threshold of 10
ng/L. Also, the Smith et al work was limited to a single shallow reservoir in Kansas; given the natural
variations in how the physical, chemical and biological facets of reservoirs interact, the findings of this
study may not be applicable to all water bodies.
11
Figure 4. Relationship between station mean concentrations of geosmin and chlorophyll-a in Cheney Reservoir, USA. (From
Smith et al (2002). The horizontal dotted line indicates an approximate threshold concentration of geosmin for human
detection.)
For purposes of establishing a drinking water criterion, Missouri is targeting a chl-a criterion to control
microcystin1. Microcystin is the most common toxin produced by cyanobacteria within algal blooms. A
hepatotoxin, microcystin has been documented to pose chronic and acute health risks to livestock, pets,
and humans. The World Health Organization (WHO) has adopted a provisional guideline value for
lifetime exposure of 1,000 ng/L (1.0 µg/L) for microcystin2 (Falconer, et al., 1999). In a study of 241 lakes
in Missouri, Iowa, northeastern Kansas, and southern Minnesota, Graham et al (2004) found that
microcystin is common in lakes, but generally at low levels. Reported median microcystin-LR
concentrations in Missouri regions were at or below 2 ng/L (Table 2). Graham and Jones (2009),
following up on the 2004 study, found that relatively few lakes in Missouri had microcystin
concentrations greater than the WHO finished drinking water guideline of 1 µg/L. The mean chl-a
concentrations associated with microcystin-LR levels ranging from the detection limit (0.1 µg/L) to the
WHO guideline (1 µg/L) was reported as 26 µg/L (Table 3).
1 Microcystins are a family of compounds. The most extensively studied member is microcystin-LR
(5R,8S,11R,12S,15S,18S,19S,22R)-15-[3-(diaminomethylideneamino)propyl]-18-[(1E,3E,5S,6S)-6-methoxy-3,5-
dimethyl-7-phenylhepta-1,3-dienyl]-1,5,12,19-tetramethyl-2-methylidene-8-(2-methylpropyl)-3,6,9,13,16,20,25-
heptaoxo-1,4,7,10,14,17,21-heptazacyclopentacosane-11,22-dicarboxylicacid. 2 The guideline value is based on the following assumptions: Average adult body weight (bw) is 60 kg, a provisional
total daily intake (TDI) set at 0.04 µg kg-1
, of which a proportion (P) of 0.8 is allocated to drinking water, and water
consumption of 2 L d-1
. It is calculated as follows: ������������ =� �∗��∗�
� ,which comes to 0.96 µg L
-1, and is
rounded up to 1.0 µg L-1
.
12
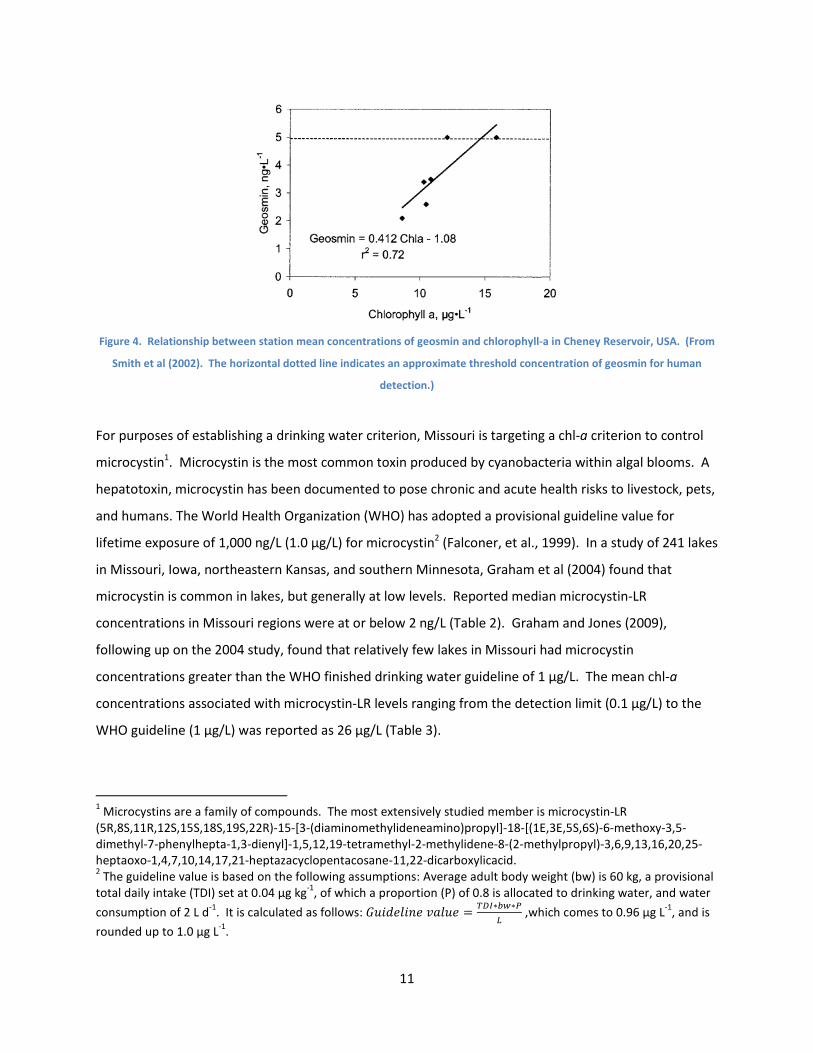
Based on these findings, the magnitude of the chl-a criteria and screening values for drinking water
supply DU are summarized in Table 4. Long-term and short-term screening values for TP and TN are
based on regional regressions and the chl-a screening values as summarized in the “Calculation of
Screening Values” section.
Table 2. Regional Medians and Ranges of Microcystin Values (Adapted from Graham and Jones (2004)).
Region Microcystin-LR (ng/L)
n Median Range
Ozark Highlands 92 0a 0-43
Osage Plains 111 0a 0-189
Dissected Till Plains 439 2b 0-2,933
n indicates the number of lake visits in each region. Letters indicate significant differences in median
concentrations (Kruskal-Wallis, p<0.01).
Table 3. Comparison of Chlorophyll Levels Among Three Microcystin Concentration Categories (Adapted
from Graham and Jones (2009)).
Microcystin-LR (ng/L) Chlorophyll (µg/L)
n Mean Range
nd 1,082 11a 1-342
0.1 - 1 271 26b 1-306
>1 49 46c 3-140
n indicates the number of lake visits in each region. Letters indicate significant differences in mean values.
Table 4. Chlorophyll-a Criterion and Screening Values for Drinking Water Supplies
Magnitude
(µg/L) Rationale
Criterion 26 Protects for WHO microcystin-LR guideline of 1.0 µg/L based on
Graham and Jones (2009)
Long-Term
Screening Value 10
Conservative literature based value protective of algal blooms and
taste and odor issues
Short-Term
Screening Value 26 Same value as criterion with more conservative averaging period
Protection of Aquatic Habitat
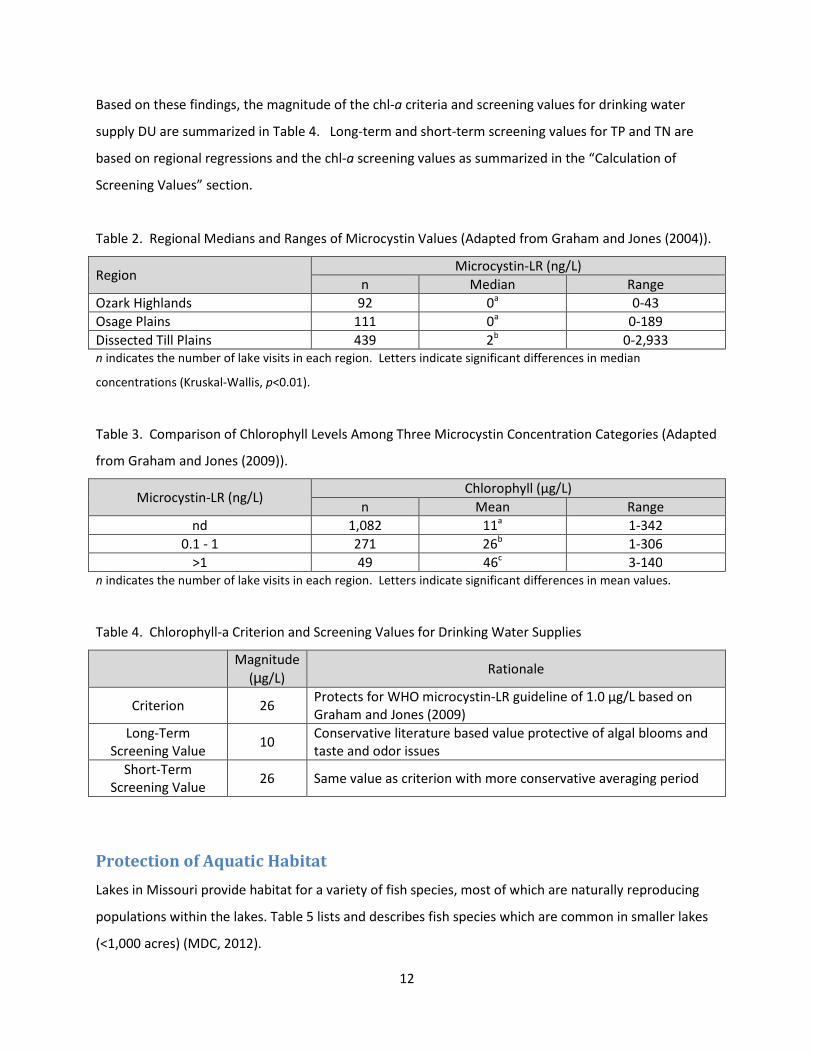
Lakes in Missouri provide habitat for a variety of fish species, most of which are naturally reproducing
populations within the lakes. Table 5 lists and describes fish species which are common in smaller lakes
(<1,000 acres) (MDC, 2012).
13
Table 5. Common fish species found in small lakes of Missouri.
Common Name Scientific Name Habitat and other comments3
Common Carp Cyprinus carpio Invasive species. Introduced from Asia in 1879.
Abundant in man-made impoundments that are
highly productive as a result of runoff from
heavily fertilized farmlands or other pollutants.
Often compete for food with more desirable
species. Feeding habits result in deterioration of
habitat through increased turbidity and
destruction of aquatic vegetation. Feeding
activity may result in increased nutrient loading.
Gizzard Shad Dorosoma cepedianum Appears in clear and turbid waters, prefers those
where fertility and productivity are high.
Channel Catfish Ictalurus punctatus Common in large rivers. Hatchlings have low
survival rate in clear waters, higher in turbid
waters. Therefore they need periodic restocking
in some lakes.
Green Sunfish Lepomis cyanellus Tolerates wide range of conditions, including
extremes of turbidity, dissolved oxygen and
temperature. Among the first to repopulate
prairie streams following droughts.
Bluegill Lepomis macrochirus Intolerant of continuous high turbidity. Thrives in
clear water where aquatic plants or other cover is
present.
Redear Sunfish Lepomis microlophus Does best in warm, clear waters with no
noticeable current and an abundance of aquatic
plants.
Largemouth Bass Micropterus salmoides Thrives in warm, moderately clear waters with no
current.
White Crappie Promoxis annularis Commonly in areas with standing timber or other
cover. Spring spawning in shallow water near
upper ends of coves.
Black Crappie Promoxis nigromaculatus Sporadic distribution, most prevalent in large
Ozark reservoirs. Less common and less tolerant
of turbidity and siltation than White Crappie.
While the ideal physical habitats for these species vary considerably, they generally have in common a
requirement for some degree of aquatic productivity to thrive. Most of these species do well in
eutrophic conditions and there is substantial literature that describes a need for higher nutrient
concentrations to support healthy fisheries (Knowlton & Jones, 2003). Jones and Hoyer (1982) found a
3 Summarized from descriptions by Pflieger (1975).
14
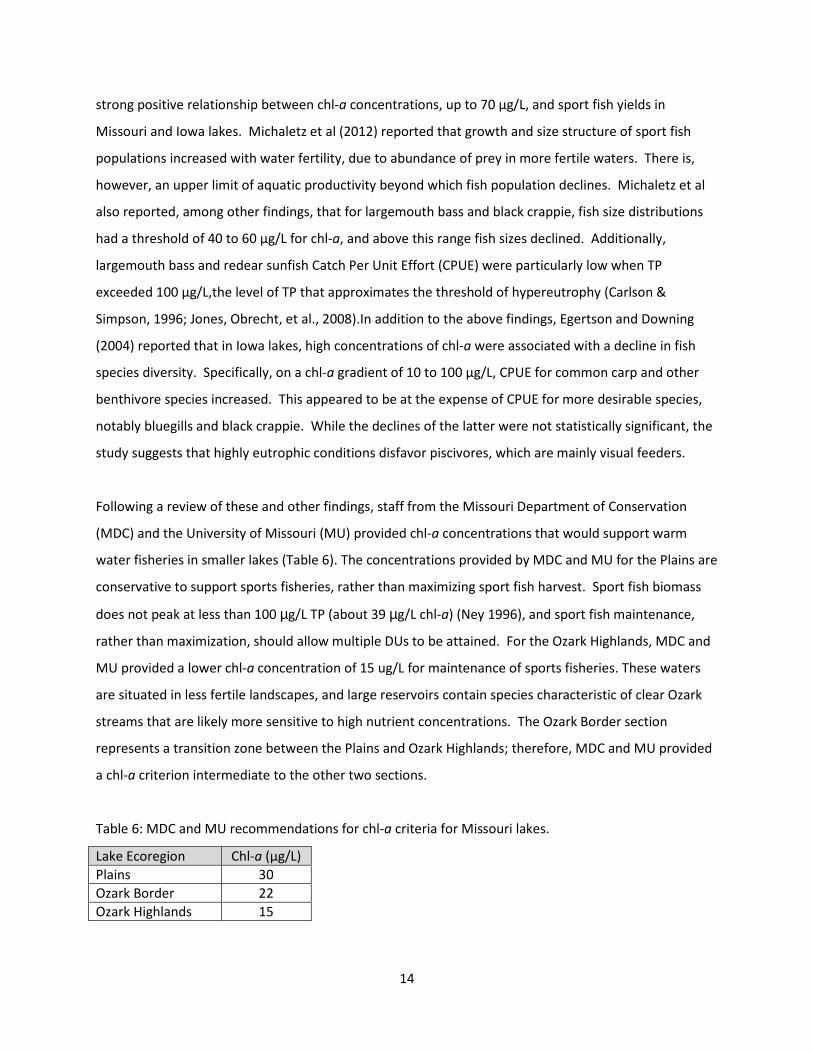
strong positive relationship between chl-a concentrations, up to 70 µg/L, and sport fish yields in
Missouri and Iowa lakes. Michaletz et al (2012) reported that growth and size structure of sport fish
populations increased with water fertility, due to abundance of prey in more fertile waters. There is,
however, an upper limit of aquatic productivity beyond which fish population declines. Michaletz et al
also reported, among other findings, that for largemouth bass and black crappie, fish size distributions
had a threshold of 40 to 60 µg/L for chl-a, and above this range fish sizes declined. Additionally,
largemouth bass and redear sunfish Catch Per Unit Effort (CPUE) were particularly low when TP
exceeded 100 µg/L,the level of TP that approximates the threshold of hypereutrophy (Carlson &
Simpson, 1996; Jones, Obrecht, et al., 2008).In addition to the above findings, Egertson and Downing
(2004) reported that in Iowa lakes, high concentrations of chl-a were associated with a decline in fish
species diversity. Specifically, on a chl-a gradient of 10 to 100 µg/L, CPUE for common carp and other
benthivore species increased. This appeared to be at the expense of CPUE for more desirable species,
notably bluegills and black crappie. While the declines of the latter were not statistically significant, the
study suggests that highly eutrophic conditions disfavor piscivores, which are mainly visual feeders.
Following a review of these and other findings, staff from the Missouri Department of Conservation
(MDC) and the University of Missouri (MU) provided chl-a concentrations that would support warm
water fisheries in smaller lakes (Table 6). The concentrations provided by MDC and MU for the Plains are
conservative to support sports fisheries, rather than maximizing sport fish harvest. Sport fish biomass
does not peak at less than 100 µg/L TP (about 39 µg/L chl-a) (Ney 1996), and sport fish maintenance,
rather than maximization, should allow multiple DUs to be attained. For the Ozark Highlands, MDC and
MU provided a lower chl-a concentration of 15 ug/L for maintenance of sports fisheries. These waters
are situated in less fertile landscapes, and large reservoirs contain species characteristic of clear Ozark
streams that are likely more sensitive to high nutrient concentrations. The Ozark Border section
represents a transition zone between the Plains and Ozark Highlands; therefore, MDC and MU provided
a chl-a criterion intermediate to the other two sections.
Table 6: MDC and MU recommendations for chl-a criteria for Missouri lakes.
Lake Ecoregion Chl-a (µg/L)
Plains 30
Ozark Border 22
Ozark Highlands 15
15
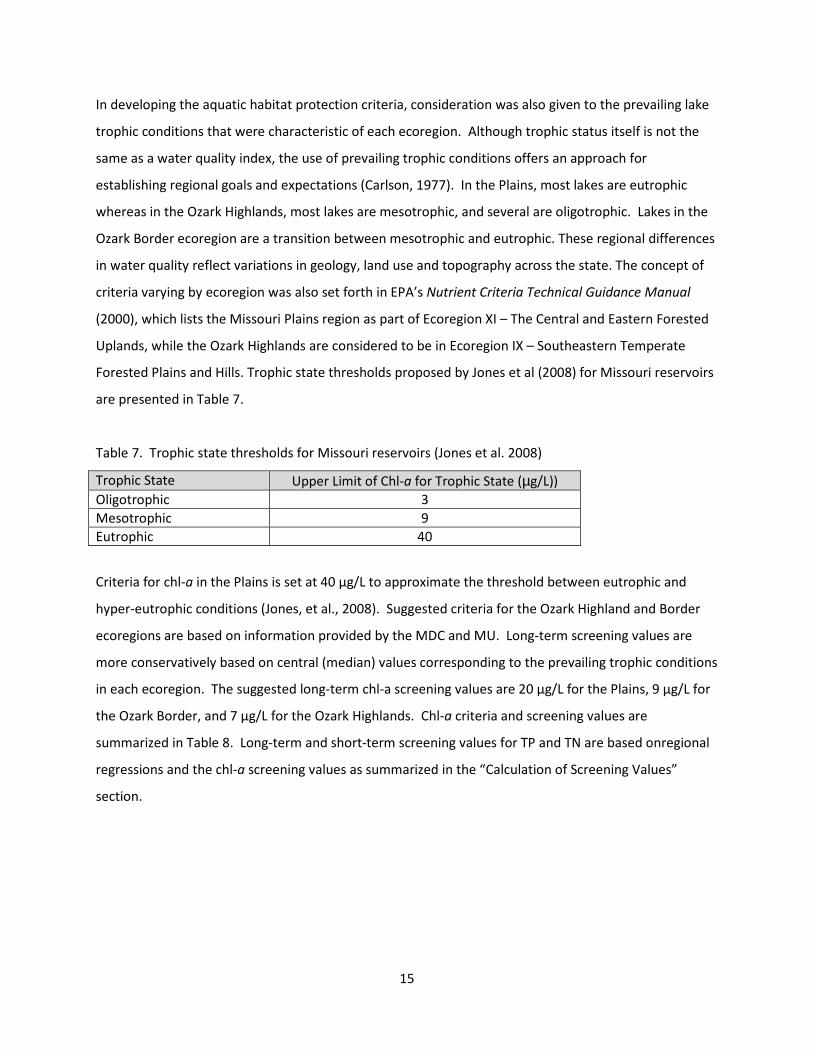
In developing the aquatic habitat protection criteria, consideration was also given to the prevailing lake
trophic conditions that were characteristic of each ecoregion. Although trophic status itself is not the
same as a water quality index, the use of prevailing trophic conditions offers an approach for
establishing regional goals and expectations (Carlson, 1977). In the Plains, most lakes are eutrophic
whereas in the Ozark Highlands, most lakes are mesotrophic, and several are oligotrophic. Lakes in the
Ozark Border ecoregion are a transition between mesotrophic and eutrophic. These regional differences
in water quality reflect variations in geology, land use and topography across the state. The concept of
criteria varying by ecoregion was also set forth in EPA’s Nutrient Criteria Technical Guidance Manual
(2000), which lists the Missouri Plains region as part of Ecoregion XI – The Central and Eastern Forested
Uplands, while the Ozark Highlands are considered to be in Ecoregion IX – Southeastern Temperate
Forested Plains and Hills. Trophic state thresholds proposed by Jones et al (2008) for Missouri reservoirs
are presented in Table 7.
Table 7. Trophic state thresholds for Missouri reservoirs (Jones et al. 2008)
Trophic State Upper Limit of Chl-a for Trophic State (µg/L))
Oligotrophic 3
Mesotrophic 9
Eutrophic 40
Criteria for chl-a in the Plains is set at 40 µg/L to approximate the threshold between eutrophic and
hyper-eutrophic conditions (Jones, et al., 2008). Suggested criteria for the Ozark Highland and Border
ecoregions are based on information provided by the MDC and MU. Long-term screening values are
more conservatively based on central (median) values corresponding to the prevailing trophic conditions
in each ecoregion. The suggested long-term chl-a screening values are 20 µg/L for the Plains, 9 µg/L for
the Ozark Border, and 7 µg/L for the Ozark Highlands. Chl-a criteria and screening values are
summarized in Table 8. Long-term and short-term screening values for TP and TN are based onregional
regressions and the chl-a screening values as summarized in the “Calculation of Screening Values”
section.

16
Table 8. Chlorophyll-a Criteria and Screening Values for Aquatic Habitat Protection
Limit Type Region Chl-a
(µg/L) Rationale
Criterion
Plains 40 Protects sports fisheries and reflects prevailing trophic conditions
within the region Ozark Border 22
Ozark Highland 15
Short-Term
Screening
Value
Plains 40
Same value as criterion with more conservative averaging period Ozark Border 22
Ozark Highland 15
Long-Term
Screening
Value
Plains 20
Central values corresponding to prevailing trophic conditions within
the region Ozark Border 9
Ozark Highland 7
Calculation of Screening Values
Data for nutrient screening value analyses were collected by the Lakes of Missouri Volunteer Program
(LMVP) and the Statewide Lake Assessment Program (SLAP). The data used were from the years 2003 –
2013. A brief statistical description of these data is in Table 9.
Table 9: General statistics for lake data employed for criteria derivation.
Region Number of
Lakes
Yearly
Geomeans (n)
Parameter Concentration Averages (Ranges)
TP (µg/L) TN (µg/L) Chl-a (µg/L)
Plains 140 611 61
(9 – 302)
909
(305 – 2660)
25 .1
(0.3 – 133.2)
Ozark Border 31 87 59
(5 – 291)
834
(243 – 2781)
21.7
(0.9 – 100.4)
Ozark
Highlands 48 228
21
(4 – 107)
450
(75 – 1279)
10.0
(0.0 – 58.7)
To derive long-term and short-term screening values for TN and TP, regressions were conductedwith
chl-a as the response variable. To account for seasonal variation of chl-a response, and to ensure
sufficiency of data for each ecoregion, yearly geometric means of TN, TP, and chl-a concentrations for
individual lakes were treated as the data points. This approach is consistent with criteria derivation
methodology published by EPA (2010).
Each of the regression equations was recalculated using iterative weighted least squares one time
(Helsel & Hirsch, 2002). TN and TP screening values were then derived by back calculating the
17
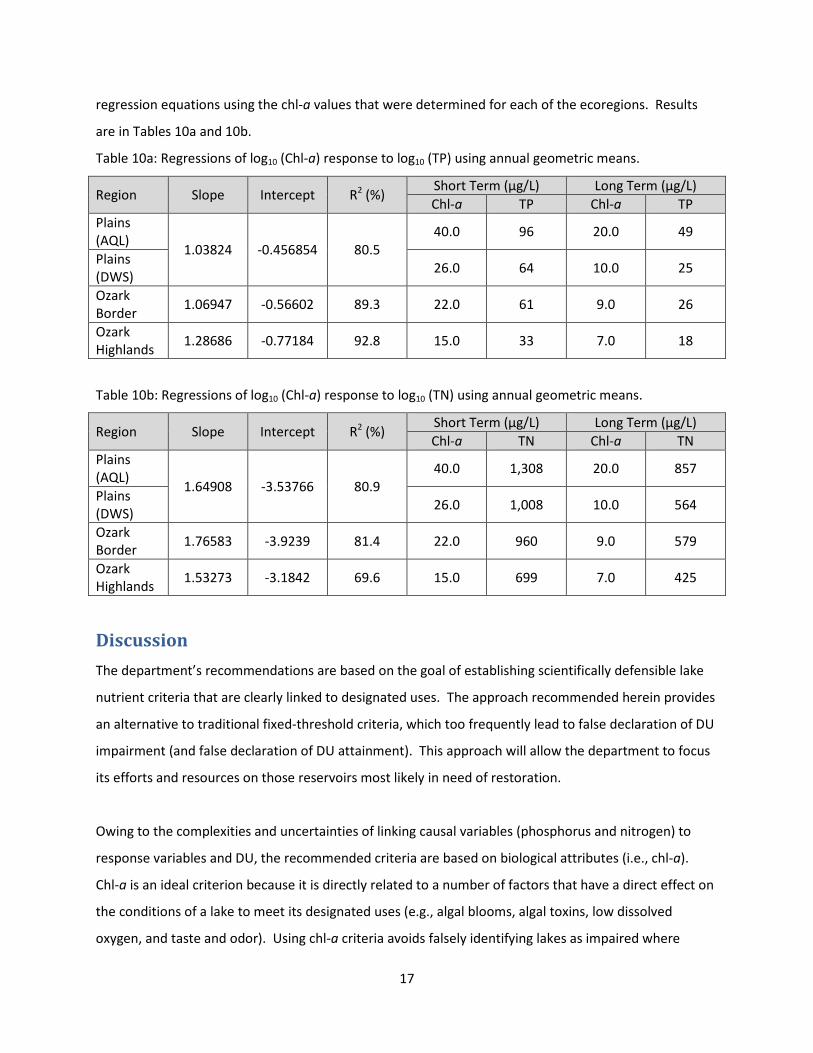
regression equations using the chl-a values that were determined for each of the ecoregions. Results
are in Tables 10a and 10b.
Table 10a: Regressions of log10 (Chl-a) response to log10 (TP) using annual geometric means.
Region Slope Intercept R2 (%)
Short Term (µg/L) Long Term (µg/L)
Chl-a TP Chl-a TP
Plains
(AQL) 1.03824 -0.456854 80.5
40.0 96 20.0 49
Plains
(DWS) 26.0 64 10.0 25
Ozark
Border 1.06947 -0.56602 89.3 22.0 61 9.0 26
Ozark
Highlands 1.28686 -0.77184 92.8 15.0 33 7.0 18
Table 10b: Regressions of log10 (Chl-a) response to log10 (TN) using annual geometric means.
Region Slope Intercept R2 (%)
Short Term (µg/L) Long Term (µg/L)
Chl-a TN Chl-a TN
Plains
(AQL) 1.64908 -3.53766 80.9
40.0 1,308 20.0 857
Plains
(DWS) 26.0 1,008 10.0 564
Ozark
Border 1.76583 -3.9239 81.4 22.0 960 9.0 579
Ozark
Highlands 1.53273 -3.1842 69.6 15.0 699 7.0 425
Discussion
The department’s recommendations are based on the goal of establishing scientifically defensible lake
nutrient criteria that are clearly linked to designated uses. The approach recommended herein provides
an alternative to traditional fixed-threshold criteria, which too frequently lead to false declaration of DU
impairment (and false declaration of DU attainment). This approach will allow the department to focus
its efforts and resources on those reservoirs most likely in need of restoration.
Owing to the complexities and uncertainties of linking causal variables (phosphorus and nitrogen) to
response variables and DU, the recommended criteria are based on biological attributes (i.e., chl-a).
Chl-a is an ideal criterion because it is directly related to a number of factors that have a direct effect on
the conditions of a lake to meet its designated uses (e.g., algal blooms, algal toxins, low dissolved
oxygen, and taste and odor). Using chl-a criteria avoids falsely identifying lakes as impaired where

18
nutrient levels may be high, but algal production is constrained by low autotrophic potential (e.g., fast
flushing and low critical depth).
To limit the possibility of false negatives, the department is further recommending the use of screening
values. Proposed screening values were conservatively established such that a high degree of
confidence exists that reservoirs with nutrient concentrations below these levels are not impaired by
nutrients. Where screening values are exceeded but the chl-a criterion is not, the department is
recommending a weight of evidence evaluation. Such an evaluation would consider additional factors,
such as the occurrence of harmful algal blooms and fish kills, to more definitively determine whether or
not the DU is being attained.
19
References
American Water Works Association. (2008). Reservoir Management Strategies for Control and
Degradation of Algal Toxins. AWWA Research Foundation.
Carlson, R. (1977). A trophic state index for lakes. Limnology and Oceanography, 22(2)361-369.
Carlson, R., & Simpson, J. (1996). A Coordinator's Guide to Volunteer Lake Monitoring Methods.
Madison, WI: North American Lake Management Society.
Dillon, P., & Rigler, F. (1974). The phosphorus-chlorophyll relationship in lakes. Limnology and
Oceanography, 19(5)767-773.
Downing, J. A., Watson, S. B., & McCauley, E. (2001). Predicting Cyanobacteria dominance in lakes. Can.
J. Fish. Auat. Sci., 58: 1905-1908.
Downing, J., & Plante, C. (1993). Production of Fish Populations in Lakes. Can. J. Fish. Aquat. Sci. ,
50:110-120.
Egertson, C., & Downing, J. (2004). Relationship of fish catch and composition to water quality in a suite
of agricuturally eutrophic lakes. Can. J. Fish. Aquat. Sci., 61: 1784-1796.
Falconer, I., Bartram, J., Chorus, I., Kuiper-Goodman, T., Utkilen, H., Burch, M., et al. (1999). In I. Chorus,
& J. Bartram (Eds.), Toxic cyanobacteria in water: A guide to their public health consequences,
monitoring and management. London, England: World Health Organization: E & FN Spon.
Graham, J., & Jones, J. (2009). Microcystin in Missouri Reservoirs. Lake and Reservoir Management, 25:3
253-263.
Graham, J., Jones, J., Jones, S., Downing, J., & Clevenger, T. (2004). Environmental factors influencing
microcystin distribution and concentration in the Midwestern United States. Water Research,
38(2004)4395-4404.
Helsel, D., & Hirsch, R. (2002). Statistical Methods in Water Resources. U.S. Geological Survey.
Iowa Department of Natural Resources. (2011, February 23). Informal Regulatory Analysis of
Amendment to Chapter 61 "Water Quality Standards" Nutrient Water Quality Standard for Lakes
to Support Recreational Uses. Retrieved May 12, 2014, from iowadnr.gov:
http://www.iowadnr.gov/Portals/idnr/uploads/water/standards/files/lakecriteria_reganalysis.p
df
Jones, J., & Hoyer, M. (1982). Sportfish Harvest Predicted by Summer Chlorophyll-a Concentration in
Midwestern Lakes and Reservoirs. Transactions of the American Fisheries Society, 176-179.
Jones, J., & Knowlton, M. (1993). Limnology of Missouri Reservoirs: An Analysis of Regional Patterns.
Lake and Reservoir Management, 8: 17-30.
20
Jones, J., & Knowlton, M. (2005). Chlorophyll Response to Nutrients and Non-algal Seston in Missouri
Reservoirs and Oxbow Lakes. Lake and Reservoir Management, 21(3):361-371.
Jones, J., Knowlton, M., & Obrecht, D. (2008). Role of land cover and hydrology in determining nutrients
in mid-continent reservoirs: implications for nutrient criteria and management. Lake and
Reservoir Management, 24:1-9.
Jones, J., Knowlton, M., Obrecht, D., Thorpe, A., & Harlan, J. (2009). Role of contemporary and historic
vegetation on nutrients in Missouri reservoirs: Implications for developing nutrient criteria. Lake
and Reservoir Management, 25:111-118.
Jones, J., Obrecht, D., Perkins, B., Knowlton, M., Thorpe, A., Watanabe, S., et al. (2008). Nutrients,
seston, and transparency of Missouri reservoirs and oxbow lakes: an analysis of regional
limnology. Lake and Reservoir Management, 24: 155-180.
Kennedy, R. (2001). Considerations for establishing nutrient criteria for reservoirs. Lake and Reservoir
Management, 17: 175-187.
Knowlton, M. F., & Jones, J. R. (2003). Developing nutrient criteria for Missouri lakes. Columbia, MO:
University of Missouri.
Knowlton, M., & Jones, J. (2006). Natural Variability in Lakes and Reservoirs Should be Recognized in
Setting Nutrient Criteria. Lake and Reservoir Management, 22:161-166.
Michaletz, P., Obrecht, D., & Jones, J. (2012). Influence of Environmental Variables and Species
Interactions on Sport Fish Communities in Small Missouri Impoundments. Jefferson City, MO:
Missouri Department of Conservation.
Missouri Department of Conservation. (2012). MDC response to DNR request for impoundment fish
community, chlorophyll and Secchi depth information for Missouri lake nutrient criteria.
Columbia, MO: Missouri Department of Conservation.
Missouri Secretary of State. (2014, Jan. 29). Missouri Code of State Regulations: Title 10, Missouri
Department of Natural Resources. Retrieved May 13, 2014, from 20-7.031:
http://sos.mo.gov/adrules/csr/current/10csr/10c20-7a.pdf
Ney, J. (1996). Oligotrophication and Its Discontents: Effects of Reduced Nutrient Loading on Reservoir
Fisheries. American Fisheries Society Symposium (pp. 16: 285-295). American Fisheries Society.
Pflieger, W. (1975). The Fishes of Missouri. Jefferson City, MO: Missouri Department of Conservation.
Regional Technical Advisory Group (EPA Region 7). (2011). Nutrient Reference Condition Identification
and Ambient Water Quality Benchmark Develpment Process: Freshwater Lakes and Reservoirs
within USEPA Region 7.
21
Soballe, D., & Kimmel, B. (1987). A Large-Scale Comparison of Factors Influencing Phytoplankton
Abondance in Rivers, Lakes, and Impoundments. Ecology, 68(6) 1943-1954.
US Environmental Protection Agency. (2000a). Ambient Water Quality Criteria Recommendations,
Information Supporting the Development of State and Tribal Nutrient Criteria, Lakes and
Reservois in Nutrient Ecoregion VI.
US Environmental Protection Agency. (2000b). Ambient Water Quality Criteria Recommentations,
Information Supporting the Development of State and Tribal Nutrient Criteria, Lakes and
Reservoirs in Nutrient Ecoregion IX.
US Environmental Protection Agency. (2000c). Ambient Water Quality Criteria Recommendations,
Information Supporting the Development of State and Tribal Nutrient Criteria, Lakes and
Reservoirs in Nutrient Ecoregion XI.
US Environmental Protection Agency. (2000d). Nutrient Criteria Technical Guidance Manual: Lakes and
Reservoirs. Washington, DC: Office of Water, Office of Science and Technology.
US Environmental Protection Agency. (2010). Using Stressor-response Relationships to Derive Numeric
Nutrient Criteria; EPA-820-S-10-001. Washington, DC: Office of Science and Technology, Office
of Water, US Environmental Protection Agency.
US Environmental Protection Agency. (2011, August 16). Letter: EPA Action on Missouri's 2009 Water
Quality Standards.
US Environmental Protection Agency. (2014). US EPA Expert Workshop: Nutrient Enrichment Indicators
in Streams: Proceedings April 16 - 18, 2013. Office of Water.
Walker, W. (1985). Statistical Bases for Mean Chlorophyll A Criteria. Lake and Reservoir Management -
Practical Applications, 57-62.
World Health Organization. (2003). Guidelines for Safe Recreational Water Environments - Volume 1:
Coastal and Fresh Waters. Geneva, Switzerland.