overview of numeric nutrient criteria development and implementation in montana michael suplee, phd...
TRANSCRIPT

Overview of Numeric Nutrient Criteria Development and
Implementation in Montana
Michael Suplee, PhDWater Quality Standards Section
Montana Department of Environmental Quality
Presented to the Water Pollution Control Advisory CouncilFebruary 17, 2012

Presentation Outline• Brief timeline of criteria development in Montana• Why numeric nutrient criteria?• Criteria derivation: methods overview– Wadeable streams, Large rivers, Lakes/reservoirs
• Trends on the Clark Fork River• Implementation: Meeting the standards over time– Senate bills 95 and 367
• Nutrient Work Group • Draft Circular DEQ-12 and new rules• USEPA acceptance of Montana’s approach• Timeline: adoption of statewide nutrient criteria
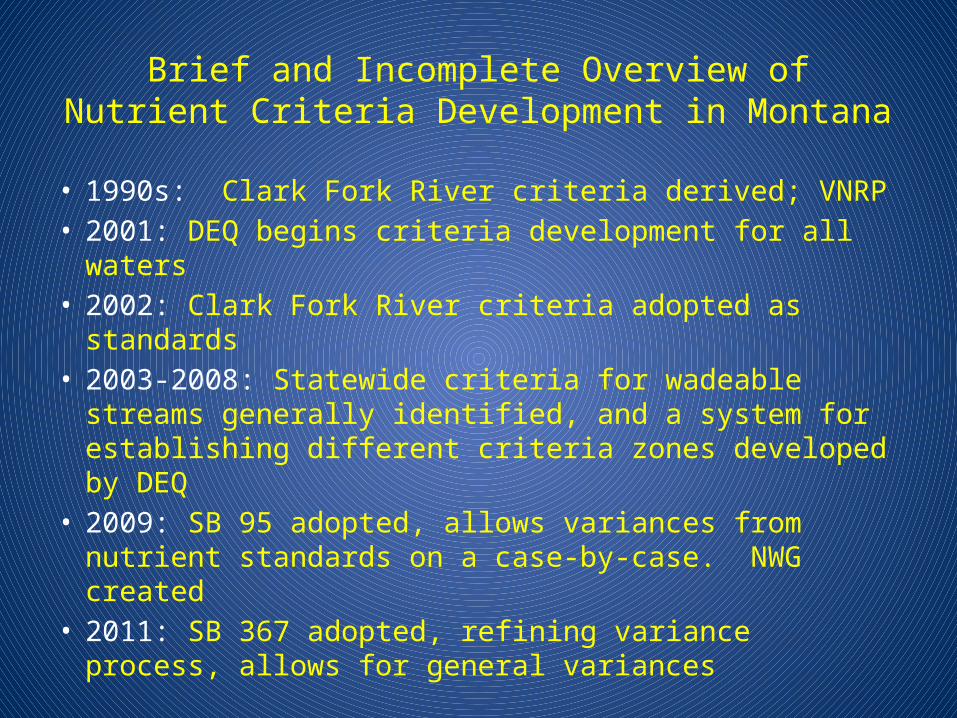
Brief and Incomplete Overview of Nutrient Criteria Development in Montana
• 1990s: Clark Fork River criteria derived; VNRP• 2001: DEQ begins criteria development for all waters• 2002: Clark Fork River criteria adopted as standards• 2003-2008: Statewide criteria for wadeable streams
generally identified, and a system for establishing different criteria zones developed by DEQ
• 2009: SB 95 adopted, allows variances from nutrient standards on a case-by-case. NWG created
• 2011: SB 367 adopted, refining variance process, allows for general variances

Why Numeric Nutrient Criteria?• Existing standards are narrative (“no nuisance aquatic
life”, etc.)– Intent fairly clear, application inconsistent
• Nutrient (i.e., nitrogen and phosphorus) over-enrichment directly and indirectly impacts other, existing numeric WQ standards:– Dissolved oxygen, pH, nuisance algal growth, etc.
Better to address root cause via nutrient standards
• Allows for more consistent permitting and TMDL application
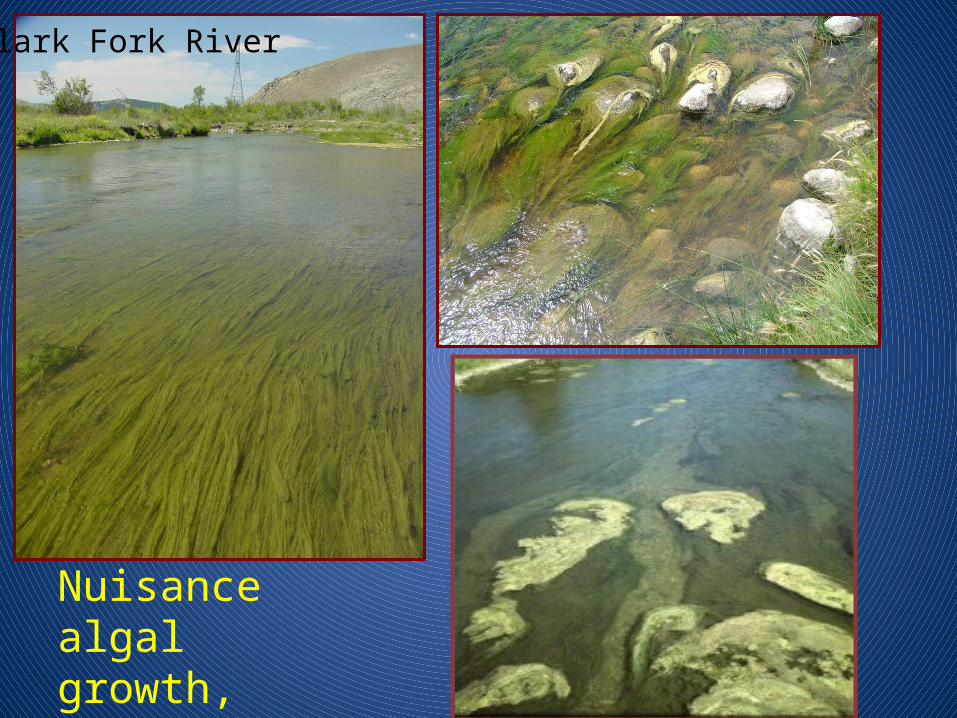
Clark Fork River
Nuisance algal growth, rivers & streams

0 50 100 150 200 250 300 350 400 450 500Benthic algae level (mg Chla/m2)
Actual/likely affects on stream uses at varying algae levels (wadeable streams)
Recreation acceptable Recreation unacceptable
Increasing salmonid growth & survival
Salmonid growth & Survival high
Salmonid growth & Survival possibly reduced
Salmonid growth & survival very likely impaired
No DO problems DO problems very likelyPossible DO problems
Stonefly, mayfly caddis-fly dominant
Shift in biomass & community structure
Midges, worms, mollusks, scuds dominant
?

Nutrient Criteria Derivation: Wadeable Streams
3 major parts:
1) Identification of appropriate geographic zones in which specific nutrient criteria (total P, total N) would apply
2) Understanding of cause-effect (i.e., stressor-response) relationships between nutrients and beneficial uses • Requires determining “harm to use”• Different expectations for different regions of the state
3) Water quality data from reference sites Data from 2 and 3 above can (and should) be considered together

Montana Ecoregions (level III, IV)
Mountainous Prairie
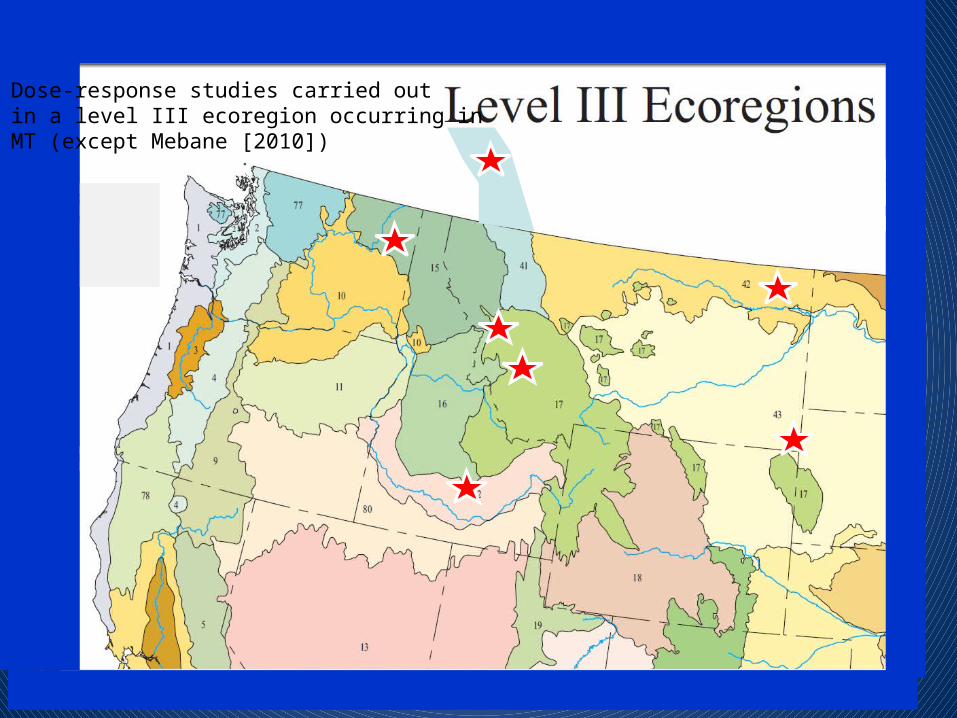
Dose-response studies carried out in a level III ecoregion occurring in MT (except Mebane [2010])

Reference Stream SitesNutrient concentration data from reference streams — which support all their beneficial uses and have minimal impacts — are compiled for each ecoregion (III, and IV if possible)
Western MT reference stream site
Eastern MT prairie-streamreference site

Comparing reference data and dose-response study results
Freq
uenc
y
Regional Reference-stream Nutrient Concentrations
50th percentile (median)
75th percentile
25th Range of nutrient concentrations acrosswhich impacts to beneficial stream uses are
likely to begin to occur
99th percentile

Coming Soon: Ecoregion-by-ecoregion discussion of how criteria were established(addendum to Suplee et al. 2008)

– No comparable reference available, as for wadeables
– Large rivers much deeper/faster than wadeable streams; changes light regime and other factors
Solution: Use mechanistic water-quality models
– Can vary nutrient inputs in model and observe effects on other water quality parameters/standards, like• DO• Nuisance benthic algae growth• pH• Total organic carbon (TOC)• Total dissolved gas (TDG)
Nutrient Criteria Derivation: Large RiversTable F-4. Large river segments within the state of Montana.
River Name Segment Description
Big Horn River Yellowtail Dam to mouth
Clark Fork River Bitterroot River to state-line
Flathead River Origin to mouth
Kootenai River Libby Dam to state-line
Madison River Ennis Lake to mouth
Missouri River Origin to state-line
South Fork Flathead River Hungry Horse Dam to mouth
Yellowstone River State-line to state-line

Lower Yellowstone River
– Used QUAL2K model to derive criteria • Steady state• Simulates benthic algae
– Study reach 232.9 km or 145 miles
– Low flows near 100 m3/sec (3,280 cfs) ; free flowing
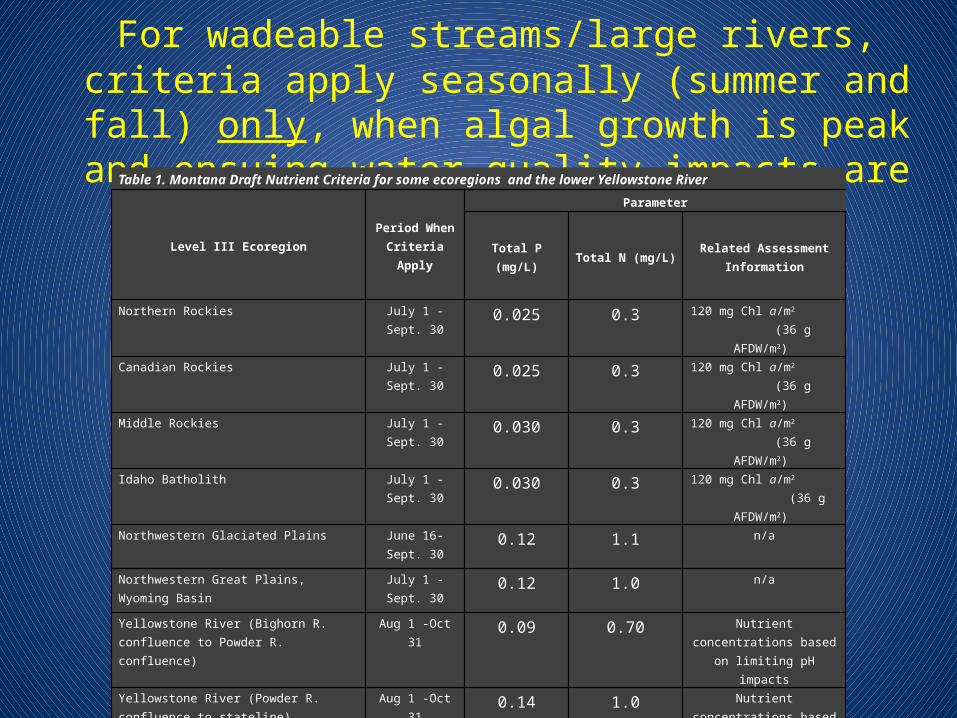
For wadeable streams/large rivers, criteria apply seasonally (summer and fall) only, when algal growth is peak and
ensuing water quality impacts are maximalTable 1. Montana Draft Nutrient Criteria for some ecoregions and the lower Yellowstone River
Level III Ecoregion Period When Criteria Apply
Parameter
Total P (mg/L) Total N (mg/L) Related Assessment Information
Northern Rockies July 1 -Sept. 30 0.025 0.3 120 mg Chl a/m2 (36 g AFDW/m2)
Canadian Rockies July 1 -Sept. 30 0.025 0.3 120 mg Chl a/m2 (36 g AFDW/m2)
Middle Rockies July 1 -Sept. 30 0.030 0.3 120 mg Chl a/m2 (36 g AFDW/m2)
Idaho Batholith July 1 -Sept. 30 0.030 0.3 120 mg Chl a/m2 (36 g AFDW/m2)
Northwestern Glaciated Plains June 16-Sept. 30 0.12 1.1 n/a
Northwestern Great Plains, Wyoming Basin July 1 -Sept. 30 0.12 1.0 n/a
Yellowstone River (Bighorn R. confluence to Powder R. confluence)
Aug 1 -Oct 31 0.09 0.70 Nutrient concentrations based on limiting pH impacts
Yellowstone River (Powder R. confluence to stateline)
Aug 1 -Oct 31 0.14 1.0 Nutrient concentrations based on limiting nuisance algal
growth

Nutrient impacts to lakes• Loss of water clarity; reduction of recreation and aesthetic quality and
property value• Increased frequency of noxious algae blooms
• Changes in fish species composition• Loss of macrophytes, replaced by dense phytoplankton• Taste and odor problems (drinking water source)
Nutrient Criteria Derivation: Lakes and Reservoirs
• Under development. Data collection in Montana lakes was completed between 2003-2008
• Reservoirs pending. Plan to use a modeling approach– Canyon Ferry Reservoir first project; 2013-14
• No lake or reservoir criteria will be recommended for rule making this year except perhaps Flathead Lake
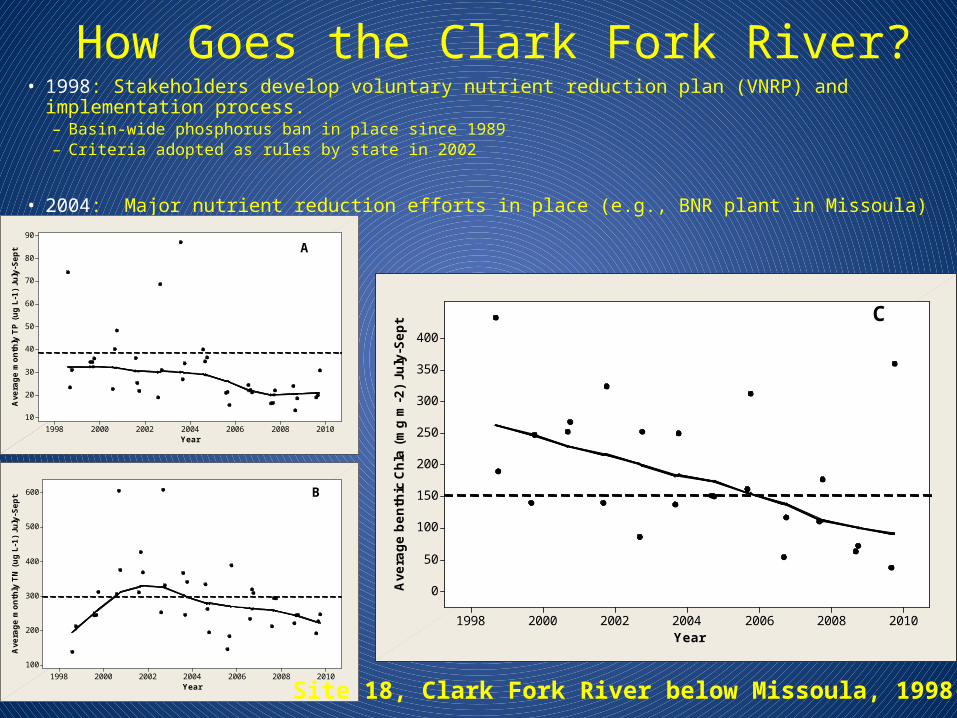
How Goes the Clark Fork River?• 1998: Stakeholders develop voluntary nutrient reduction plan (VNRP) and implementation
process.– Basin-wide phosphorus ban in place since 1989 – Criteria adopted as rules by state in 2002
• 2004: Major nutrient reduction efforts in place (e.g., BNR plant in Missoula)
2010200820062004200220001998
90
80
70
60
50
40
30
20
10
Year
Ave
rage m
onth
ly T
P (
ug L
-1)
July
-Sept A
2010200820062004200220001998
600
500
400
300
200
100
Year
Ave
rage m
onth
ly T
N (
ug L
-1)
July
-Sept B
2010200820062004200220001998
400
350
300
250
200
150
100
50
0
Year
Ave
rage b
enth
ic C
hla
(m
g m
-2)
July
-Sept C
Site 18, Clark Fork River below Missoula, 1998-2009

Implementation: Statewide approach to meet the standards over time

Implementation: Economic Considerations
• Option are available for communities to receive temporary relief from the requirements based on:– Ability to pay for treatment (affordability)– Availability of treatment technology (limits of
technology)
• These options apply only to wastewater treatment beyond the federally mandated technology-based regulations (i.e., National Secondary Standards)

Senate bills 95 (2009 Legislature) and 367 (2011 Legislature) (now §75-5-313, MCA)
• Give DEQ authority to grant variances from nutrient criteria, based on substantial & widespread economic harm that would result from immediate implementation of the standards– Variances up to 20 years, subject to 3-year reviews
– General Variance: If permittee can’t meet criteria, but can treat effluent to statute-defined levels, they will receive a gen. variance, by groups:
– > 1 MGD: 1 mg TP/L, 10 mg TN/L– < 1 MGD: 2 mg TP/L, 15 mg TP/L– Lagoons: Maintain current performance (implies monitoring
requirements)
– Individual Variance: Permittee may apply for these if meeting the general variance is difficult. Requires case-by-case economic hardship analysis

OVERALL: Law allows Montana to implement numeric nutrient criteria in a staged manner over ~ 20 years, allowing critical time to better address all sources
of nutrient pollution (point and nonpoint) and for treatment technology
to improve/come down in cost
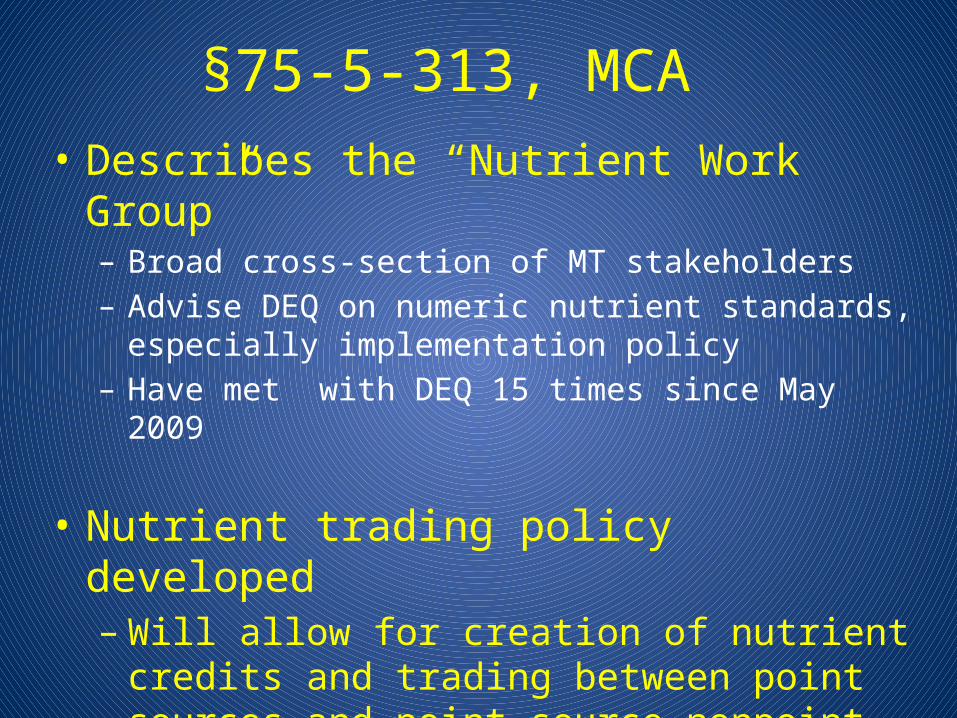
§75-5-313, MCA • Describes the “Nutrient Work Group”– Broad cross-section of MT stakeholders– Advise DEQ on numeric nutrient standards, especially
implementation policy– Have met with DEQ 15 times since May 2009
• Nutrient trading policy developed– Will allow for creation of nutrient credits and trading
between point sources and point source-nonpoint sources

Draft Circular DEQ-12 and New Rules
Contain:• Criteria• General variance
procedures• Individual variances• Permitting
requirements• Non-degradation
http://deq.mt.gov/wqinfo/NutrientWorkGroup/default.mcpx
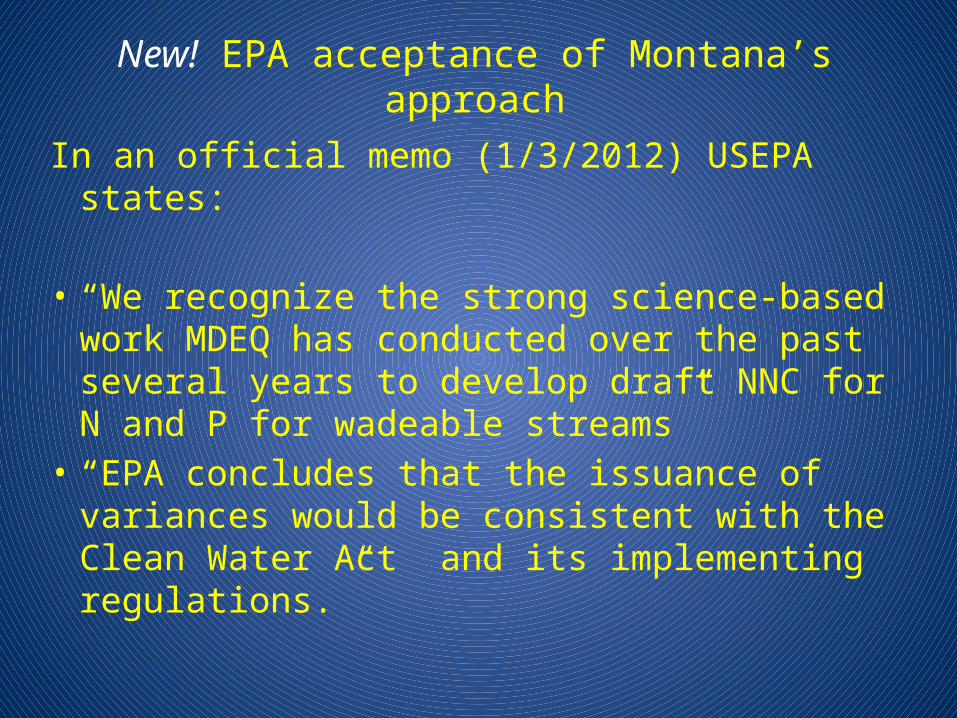
New! EPA acceptance of Montana’s approach
In an official memo (1/3/2012) USEPA states:
• “We recognize the strong science-based work MDEQ has conducted over the past several years to develop draft NNC for N and P for wadeable streams”
• “EPA concludes that the issuance of variances would be consistent with the Clean Water Act and its implementing regulations.”
Timeline: Adoption of Statewide Nutrient Criteria
• Next NWG Meeting: 2/27/2012 (Helena, MT)• More NWG meetings to follow (~ monthly)
Assuming details get worked out:• Board package in July or September, 2012– Public hearings, response to comments,
modifications, etc.• So…Need to get rule package to WPCAC this
Spring
Thank YouContact Information:• (406) 444-0831• [email protected]