the lima declaration on biodiversity and climate … · the lima declaration on biodiversity and...
TRANSCRIPT
Secretariat of the Convention on Biological Diversity
89CBD Technical Series No. 89
THE LIMA DECLARATION ON BIODIVERSITY AND CLIMATE CHANGE: Contributions from Science to Policy for Sustainable Development


The Lima Declaration on Biodiversity and Climate Change:
Contributions from Science to Policy for Sustainable Development
February 2017
CBD Technical Series No. 89
Published by the Secretariat of the Convention on Biological Diversity ISBN: 978-9292256531 (Print version)ISBN: 978-9292256548 (Web version)
Copyright © 2017, Secretariat of the Convention on Biological Diversity
The designations employed and the presentation of material in this publication do not imply the expression of any opinion whatsoever on the part of the Secretariat of the Convention on Biological Diversity concerning the legal status of any country, territory, city or area or of its authorities, or concerning the delimitation of its frontiers or boundaries.
The views reported in this publication do not necessarily represent those of the Convention on Biological Diversity.
This publication may be reproduced for educational or non-profit purposes without special permission from the copyright holders, provided acknowledgement of the source is made. The Secretariat of the Convention would appreciate receiving a copy of any publications that use this document as a source.
Citation
Secretariat of the Convention on Biological Diversity (2017) The Lima Declaration on Biodiversity and Climate Change: Contributions from Science to Policy for Sustainable Development. Technical Series No.89. (Eds L. Rodríguez & I. Anderson) Secretariat of the Convention on Biological Diversity, Montreal, 156 pages.
For further information, please contact:
Secretariat of the Convention on Biological Diversity413 St. Jacques Street, Suite 800Montreal, Quebec, Canada H2Y 1N9Phone: 1(514) 288 2220Fax: 1(514) 288 6588E-mail: [email protected]: http://www.cbd.int
Typesetting: Em Dash Design
Cover photos courtesy of : Franz Dejon, centre photo courtesy of CIMA-Cordillera Azul
3
FOREWORD
Addressing climate change and the loss of biodiversity are key challenges for humanity in the 21st Century.
They are also closely interlinked. Climate change is already impacting biodiversity, and is projected to become a major cause of biodiversity loss, causing shifts in the distribution of species and ecosystems, and increased risk of extinctions. But biodiversity is not simply a victim of climate change; it must also be part of the solution: biodiversity enhances ecosystem resilience, contributing to both climate change mitigation and adaptation.
This calls for mutually supportive implementation of the nationally determined contributions under the Paris Agreement on Climate Change and the national biodiversity strategies and action plans under the Convention on Biological Diversity and its Strategic Plan for Biodiversity 2011-2020.
The scientific basis of these linkages, and their policy implications, are considered in this volume. The various contributions are based on the presentations at the Symposium on Biodiversity and Climate Change, contributions from science to policy, held in Lima, Peru in November 2014.
The CBD Secretariat expresses its appreciation to the IAI and Contributions to the environmental objectives of Peru (ProAmbiente)" from the German Cooperation, implemented by the deutsche Gesellschaft für internationale Zusammenarbeit (GIZ), co-organizers of the Symposium, to all participants and authors, and to our host, Peru. As President of the 20th session of the UNFCCC Conference of the Parties, Peru played a pivotal role not only in supporting negotiations towards the Paris Agreement, but also in highlighting the crucial role of biodiversity in efforts to combat climate change.
David CooperDeputy Executive SecretaryConvention on Biological Diversity

4
PREFACE
It is evident that the worsening of climate change and its impact on all forms of life on earth demand for both, science and policy, boosting cooperation mechanisms and fluid and timely communication. This will allow society to address the negative effects, adapt to the changes that will inevitably affect our life quality, and to weigh the benefits that may result from such changes. Cooperation between science and policy should take place both in the design of measures to promote science, in the design of regulatory frameworks and economic, social and environmental policy, seeking to change the behavior of individuals.
The Symposium “Biodiversity and Climate Change, Contributions from Science to Policy”, organized prior to the 20th United Nations Framework Convention on Climate Change (UNFCCC) Conference of the Parties (COP 20), held in Lima, offered an extraordinary opportunity to share different perspectives about the implications of climate change on biodiversity. It not only discussed the
nature of the threat, but also identified common challenges, alternative solutions and potential partnerships which can contribute to developing joint measures of mitigation and adaptation to climate change, as well as the conservation and sustainable use of biodiversity.
The Symposium was attended by prominent scientists from Europe, the Americas and Peru, who had the opportunity to exchange information and disseminate their latest findings on biodiversity and climate change.
The event was particularly helpful to share the results of prominent research on the characteristics, vulnerability and potential for resilience found in Amazonian Rainforest, Andean Mountains and marine ecosystems with the international scientific community and Peruvian government representatives.
The German Cooperation, implemented by GIZ, through its programme “Contribution to the Environmental Objectives of Peru (ProAmbiente)”, found in this meeting an enabling environment for a dialogue between scientists and policy makers, and to improve the general conditions for the application of research results in the sustainable use and future conservation of forest, mountain, marine ecosystems and environmental gradients, in face of climate change.
As an output of this fruitful meeting, organized in collaboration with the Inter-American Institute for Global Change Research (IAI) and the United Nations Convention on Biological Diversity (CBD), this document offers the contributions from the scientific community to the understanding of biodiversity and carbon flux in tropical ecosystems; the impact of climate change on biodiversity and the local populations, the methodologies to understand them, as well as some ecosystem-based solutions and other approaches to cope with climate change.
Silke Spohn, GIZ – Pro Ambiente Deutsche Gesellschaft für Internationale Zusammenarbeit, GmbH, ProAmbiente

5
Global changes are impacting societies in ways that are largely unknown and may have irreversible consequences for the survival of many species in the wild and the health and well-being of human communities. The timeliness of this publication, which presents new insights on the mechanisms aligning science to policy for sustainable development, should not be underestimated. National policy grounded in science provides for effective regulatory frameworks, the conservation and sustainable use of biological resources and more security for local communities and indigenous peoples whose livelihoods most depend on biological resources.
Discussions held at the Symposium on Biodiversity and Climate Change, Contributions from Science to Policy, which took place on the margins of the 20th Session of the Conference of the Parties (COP) to the United Nations Framework Convention on Climate Change (UNFCCC) from 27 to 28 November
2014 in Lima, Peru, focused on how science can provide the information needed to understand the impacts of climate change on biodiversity and how biodiversity can influence the vulnerability or resilience of ecosystems to those changes.
The Symposium, organized by the Peruvian Ministry of the Environment (MINAM), the National Council for Science, Technology and Technological Innovation (CONCYTEC) and the Secretariat of the Convention on Biological Diversity (CBD), in collaboration with the Inter-American Institute for Global Change Research (IAI) and the programme “Contributions to the environmental objectives of Peru (ProAmbiente)” from the German Cooperation, implemented by the deutsche Gesellschaft für internationale Zusammenarbeit (GIZ), brought together an international group of scientists who provided insights into possible solutions posed by these global changes, especially in the design and implementation of national regulatory frameworks which take into account the need to reduce vulnerability and understand the need to adapt to and mitigate climate change impacts, particularly on biodiversity and ecosystems.
The results of discussions presented in this volume are an invaluable resource in information and data urgently needed for actions at the national, regional and international levels to adapt and mitigate the effects of climate change on ecosystems and their services and ensure that the richness of biological resources are conserved for future generations to come.
The IAI is grateful to its Peruvian partners, the CBD Secretariat, the GIZ, all Symposium participants and contributing authors of this CBD Technical Series publication. Such collaboration among many academic researchers and environmental organizations is uniquely beneficial and offers the scientific and policy making communities the opportunity to develop a greater understanding of how scientific inquiry can result in better decisions and outcomes.
Marcos Regis da SilvaExecutive DirectorInter-American Institute for Global Change Research
6
ACKNOWLEDGEMENTS
The Secretariat of the Convention on Biological Diversity would like to thank all the authors for their contribution and revisions of the papers presented here. We also acknowledge with appreciation the Peruvian Ministry of Environment (MINAM), the National Council for Science, Technology and Technological Innovation (CONCYTEC), the German development cooperation, through its ProAmbiente programme implemented by the Gesellschaft and the Inter-American Institute for Global Change Research (IAI).
The Secretariat also wishes to thank peer reviewers Dan Bausch, Robin Chazdon, Rodolfo Dirzo, Pierre Ibisch, Cristina Romanelli, John Terborgh and Holm Tiessen. Franz Dejon for the cover photo; Tim Baker, Thelma Krug, Yadvinder Mahli, Kristel Hergoualc´h, Enrique Martinez Meyer, Manuel Maass, Miguel Equihua, Sebastian Herzog, Daniel Ruiz Carrascal, Sven Günter, Yuri Hooker, Hector Soldi, for their contributions to the discussions during the symposium; Veronique Allain, Connor Anderson, Andres Hildebrandt and Manuel Rojas for facilitating in many ways the development of the symposium; Sonia Gonzáles (MINAM) and Luis Rosa-Pérez (GIZ) for being instrumental in the local organization of the symposium; Lily Rodríguez, Ione Anderson and David Cooper for their efforts in the organization of the International Symposium on Biodiversity and Climate Change, preparation of the Lima Declaration on Biodiversity and Climate Change and preparation of this CBD Technical Series publication. The editorial work provided by Lily Rodriguez and Ione Anderson is also greatly appreciated.
7
TABLE OF CONTENTS
THE FRAMEWORK
Biodiversity and climate change. David Cooper . . . . . . . . . . . . . . . . . . . . . . . . . . . . . . . . . . . . . . . . . . . . . . . . . . . . . . . . . 9Consideration of the IPCC 5° report on mitigation. Gabriel Blanco . . . . . . . . . . . . . . . . . . . . . . . . . . . . . . . . . . . . . . . 17
1. BIODIVERSITY AND CARBON FLUX IN TROPICAL ECOSYSTEMS
Biodiversity increases the resilience of tropical forests to climate change: implications for conservation policy. Tim Baker . . . . . . . . . . . . . . . . . . . . . . . . . . . . . . . . . . . . . . . . . . . . . . . . . . . . . . . . . . . . . . . . . . . . . . . . . . . . . . . . . . . 24
Recent changes in Amazon Forest Biomass. Oliver Phillips . . . . . . . . . . . . . . . . . . . . . . . . . . . . . . . . . . . . . . . . . . . . . . 32Variability of Ocean Ecosystems around South America (VOCES). Sara Purca et al. . . . . . . . . . . . . . . . . . . . . . . . . 42
2. IMPACT OF CLIMATE CHANGE ON BIODIVERSITY, SOCIAL-ECOLOGICAL-SYSTEMS AND ITS MEASUREMENTS
A monitoring network to detect the impact of climate change on tree biodiversity and carbon in Amazonian floodplain forests. Euridice Honorio and Frederick Draper . . . . . . . . . . . . . . . . . . . . . . . . . . . . . . . . . . . . . . . . . 49
Effects of climate change on a temperate low range mountain Forest (National Park Bavarian Forest), outputs from monitoring. Claus Bäsler . . . . . . . . . . . . . . . . . . . . . . . . . . . . . . . . . . . . . . . . . . . . . . . . . . . . . . . . . . . . . . . . . . 55
IUCN’s Trait-based Assessment of Climate Change Vulnerability of the World’s Birds and Amphibians: A Focus on the Amazon. Wendy Foden . . . . . . . . . . . . . . . . . . . . . . . . . . . . . . . . . . . . . . . . . . . . . . . . . . . . . . . . . . . . . . . . . . 62
Predicting the impacts of climate change on biodiversity: the need for a global open data infrastructure. Tim Hirsch . . . . . . . . . . . . . . . . . . . . . . . . . . . . . . . . . . . . . . . . . . . . . . . . . . . . . . . . . . . . . . . . . . . . . . . . . . . . . . . . . . . 69
Wireless sensor networks and analytics as emerging tools for a paradigm shift on Environmental monitoring. Arturo Sánchez-Azofeifa . . . . . . . . . . . . . . . . . . . . . . . . . . . . . . . . . . . . . . . . . . . . . . . . . . . . . . . . . . . . . . . . . . . . . . . 77
Impact of Climate Change on Wildlife and Indigenous Communities in Flooded Forests of the Peruvian Amazon. Richard Bodmer et al. . . . . . . . . . . . . . . . . . . . . . . . . . . . . . . . . . . . . . . . . . . . . . . . . . . . . . . . . . . . . . . . . . . . . . . . . . 81
Overview of the panel on biodiversity and health under climate change. Doreen Montag et al. . . . . . . . . . . . . . . . . 91
3. ECOSYSTEM-BASED SOLUTIONS AND OTHER APPROACHES TO COPE WITH CLIMATE CHANGE
Integrated territorial management, as a mechanism for mitigation and adaptation to climate change. Lilian Painter et al. . . . . . . . . . . . . . . . . . . . . . . . . . . . . . . . . . . . . . . . . . . . . . . . . . . . . . . . . . . . . . . . . . . . . . . . . . . .109
A socio-ecological perspective on change driven by both social and climatic factors: the Santa River in Peru. Kenneth Young et al. . . . . . . . . . . . . . . . . . . . . . . . . . . . . . . . . . . . . . . . . . . . . . . . . . . . . . . . . . . . . . . . . . . . . . . . . .116
The importance of genetic considerations in ecosystem restoration for enhancing resilience against climate change. Evert Thomas et al. . . . . . . . . . . . . . . . . . . . . . . . . . . . . . . . . . . . . . . . . . . . . . . . . . . . . . . . . . . . . . . . . . . . .122
Effective adaptation strategies and Risk Reduction to Global Changes in Small Farmers in Mesoamerica. Ana Lucía Solano et al. . . . . . . . . . . . . . . . . . . . . . . . . . . . . . . . . . . . . . . . . . . . . . . . . . . . . . . . . . . . . . . . . . . . . . . .133
4. CONCLUSIONS, FURTHER RESEARCH AND GENERAL RECOMMENDATIONS . . . . . . . . . . . .139
ANNEX. The Lima Declaration on Biodiversity and Climate Change. . . . . . . . . . . . . . . . . . . . . . . . . . . . . . . . . .147


9
Biodiversity and Climate Change
THE FRAMEWORK
BIODIVERSITY AND CLIMATE CHANGE
David CooperCBD, Convention on Biolofical Diversity secretariat
Climate changes and the loss of biodiversity are twin challenges. Each threatens to undermine efforts to achieve sustainable development. This paper, drawing upon the fourth edition of the Global Biodiversity Outlook, the fifth assessment report of the Intergovernmental Panel on Climate Change and other recent scientific assessments on biodiversity and climate change, argues that these challenges must be addressed together through coordinated action at global, national and local levels, under the United Nations Framework Convention on Climate Change and the Convention on Biological Diversity.
Biodiversity underpins the functioning of ecosystems and the provision of ecosystem services essential for human well-being such as food, clean water, pest control and protection against erosion (Millennium Ecosystem Assessment, 2005; GBO-2, 2006). Important reservoirs of carbon are stored in forests, wetlands and other ecosystems (see, for example Phillips, this volume). By contributing to ecosystem resilience, biodiversity can help both ecosystems and people to adapt to climate change (see, for example Baker, this volume). Thus protecting biodiversity and restoring ecosystems are important parts of both climate change mitigation and adaptation. But biodiversity is also vulnerable to climate change. Without taking action to address both biodiversity loss and climate change in parallel, we risk promoting a vicious cycle of ecosystem degradation leading to even greater loss of species and habitats, further increased greenhouse gas emissions and a weakening capacity to adapt.
Peru’s forests provide an example of the substantial carbon sink of forests. LIDAR-based analyses commissioned by Peru’s Ministry of the Environment show that 6.9 Pg C is sequestered. But this carbon store is vulnerable to potential destruction linked to logging, informal gold mining and fossil fuel extraction. (Asner et al, 2013).
More generally, the IPCC reports of substantial tree mortality in many places around the world, driven by drought and heat (see figure 1, source IPCC).
Figure 1: Locations of reports of substantial tree mortality (source: IPCC-AR5)
10
Biodiversity and Climate Change
INTERACTING DRIVERS, CLIMATE CHANGE AND BIODIVERSITY LOSS
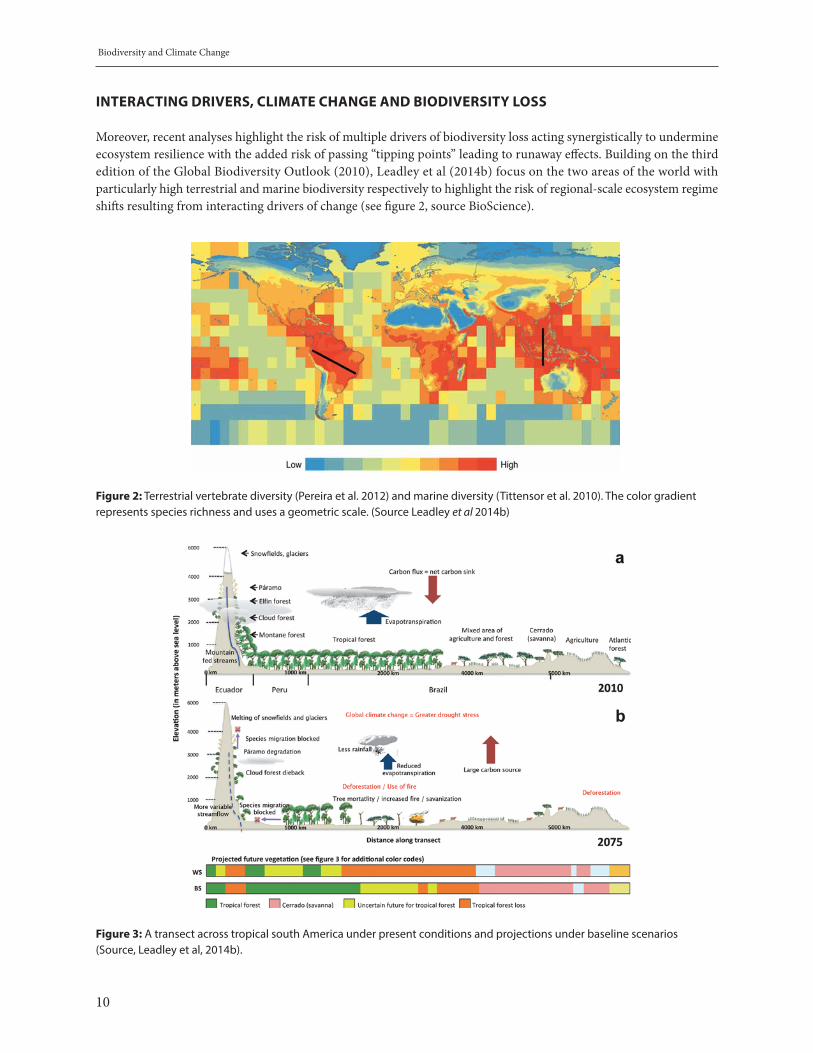
Moreover, recent analyses highlight the risk of multiple drivers of biodiversity loss acting synergistically to undermine ecosystem resilience with the added risk of passing “tipping points” leading to runaway effects. Building on the third edition of the Global Biodiversity Outlook (2010), Leadley et al (2014b) focus on the two areas of the world with particularly high terrestrial and marine biodiversity respectively to highlight the risk of regional-scale ecosystem regime shifts resulting from interacting drivers of change (see figure 2, source BioScience).
Figure 2: Terrestrial vertebrate diversity (Pereira et al. 2012) and marine diversity (Tittensor et al. 2010). The color gradient represents species richness and uses a geometric scale. (Source Leadley et al 2014b)
Figure 3: A transect across tropical south America under present conditions and projections under baseline scenarios (Source, Leadley et al, 2014b).

11
Biodiversity and Climate Change
A transect across tropical south America crosses a set of biomes with especially rich terrestrial biodiversity including the unique highland páramo ecosystems of Ecuador and Peru, cloud forest and montane forest ecosystems of the Andes, the great Amazon rainforest, the savannah-like cerrado and the Atlantic rain-forest (see figure 3, source BioScience). Besides harboring globally unique biodiversity, these systems are important in regulating the climate system at global, continental and regional levels, contributing significantly to the global carbon sink and providing the rainfall that supports agriculture in the sub-tropical and temperate parts of the continent further south. These ecosystems thus are of immense importance in supporting agriculture for food security and export and the survival and livelihoods of indigenous peoples and local communities throughout the region.
However, these systems are threatened by multiple interacting drivers of degradation. Deforestation and forest degradation weakens ecosystem resilience, rendering the forests more fire-prone. Melting snowfields lessens downstream flow exacerbating the risk of degradation and the loss of ecosystem services with major impacts, locally, regionally and globally. Changes in temperature and precipitation would tend to cause species to migrate, including towards higher altitudes. Yet habitat destruction would prevent the movement of species to adapt to longer-term climate change in this way. Such damage can only be prevented by combined action to address climate change and the other drivers of biodiversity loss.
A transect across tropical south-east Asia shows an analogous scenario in a region of especially high marine biodiversity (see figure 4, source BioScience). The coral reefs and associated ecosystems, including mangroves, of this region provide habitat for an extremely wide diversity of species, supporting fisheries for local communities and providing coastal protection for all. Coral reefs and the services they provide, however, are under threat from a number of climate related pressures: warming, sea-level rise and acidification, which interact with a number of other drivers including overfishing and destructive fishing practices, inappropriate coastal development, and eutrophication from the excess nutrients of land-based pollution. Again concerted action is needed to address all of these drivers of biodiversity loss: action at local, national and regional levels to address drivers that are tractable at these scales (through control of fishing, development and pollution) must be accompanied by global action on climate change.
Figure 4: A transect across tropical south-east Asia under present conditions and projections under baseline scenarios (Source, Leadley et al, 2014b).

12
Biodiversity and Climate Change
GLOBAL FRAMEWORKS FOR ACTION
The need for action to address all these drivers in concert, considering also the interactions among them, requires coordinated implementation of the UNFCCC and the CBD.
The Strategic Plan for Biodiversity 2011–2020 is an overarching framework on biodiversity adopted at the 10th meeting of the Parties to the CBD, in 2010 in Nagoya, Japan, after more than 2 years of consultation among Governments and stakeholders based on the earlier experience of implementation of the Convention. It has been supported by the other biodiversity related conventions and United Nations General Assembly.
The Strategic Plan is comprised of a shared vision, a mission, and five strategic goals under which 20 ambitious yet achievable targets, known as the Aichi Biodiversity Targets, are organized (see figure 5, source GBO-4). The goals and targets comprise both aspirations for achievement at the global level, and a flexible framework for the establishment of national or regional targets. In adopting the Plan, Parties committed themselves to setting their own targets within this flexible framework, taking into account national needs and priorities, while also bearing in mind national contributions to the achievement of the global targets. A summary of all the plan and targets is provided in Box A.
Figure 5: The Strategic Plan for Biodiversity 2011-2020 (Source: CBD, GBO-4).
Aichi Targets under Goal B address the interacting direct drivers of biodiversity loss, such as those reviewed in the case studies of South America and South-east Asia above. For example, Aichi target 5 addresses deforestation and other land use change and degradation1, while target 8 addresses pollution2. Aichi target 10 specifically addresses the multiple drivers of loss of vulnerable ecosystems such as coral reefs3. At its twelfth meeting in 2014, the Conference of the Parties to the Convention adopted Priority actions to achieve Aichi Biodiversity Target 10 for coral reefs and closely associated
1 Target 5: By 2020, the rate of loss of all natural habitats, including forests, is at least halved and where feasible brought close to zero, and degradation and fragmentation is significantly reduced.
2 Target 8: By 2020, pollution, including from excess nutrients, has been brought to levels that are not detrimental to ecosystem function and biodiversity.
3 Target 10: By 2015, the multiple anthropogenic pressures on coral reefs, and other vulnerable ecosystems impacted by climate change or ocean acidification are minimized, so as to maintain their integrity and functioning.
13
Biodiversity and Climate Change
ecosystems4. These include, among other things, actions to reduce the impacts of multiple stressors, in particular by addressing those stressors that are more tractable at the regional, national and local levels.
There have been some notable successes towards some of the Aichi Targets. In the Brazilian Amazon for example a mix of policies, including regulatory and incentives measures, backed up by public awareness and investments in monitoring and enforcement, has been effective in reducing the rate of deforestation by some 80%. However, forest degradation continues. Moreover, the loss of habitat has increased in the Cerrado, highlighting the need for further action in this biome.
An overall evaluation of progress made in the fourth edition of the Global Biodiversity Outlook demonstrated progress, but a rates that are general insufficient to achieve the targets by 2020. Increased efforts are required.
PATHWAYS TO A SUSTAINABLE FUTURE; MAKING SENSE OF CLIMATE AND BIODIVERSITY SCENARIOS
Models and scenarios are useful tools for informing policy discussions on both biodiversity and climate change. They have played a key role in assessments of climate change under the IPCC and are increasingly used in the Global Biodiversity Outlook series and assessments under the CBD, and now also in the context of the Intergovernmental Science-Policy Platform on Biodiversity and Ecosystem Services (IPBES). There is need however to develop models and scenarios that allow for climate and biodiversity objectives to be pursued together, in a broader context of sustainable development.
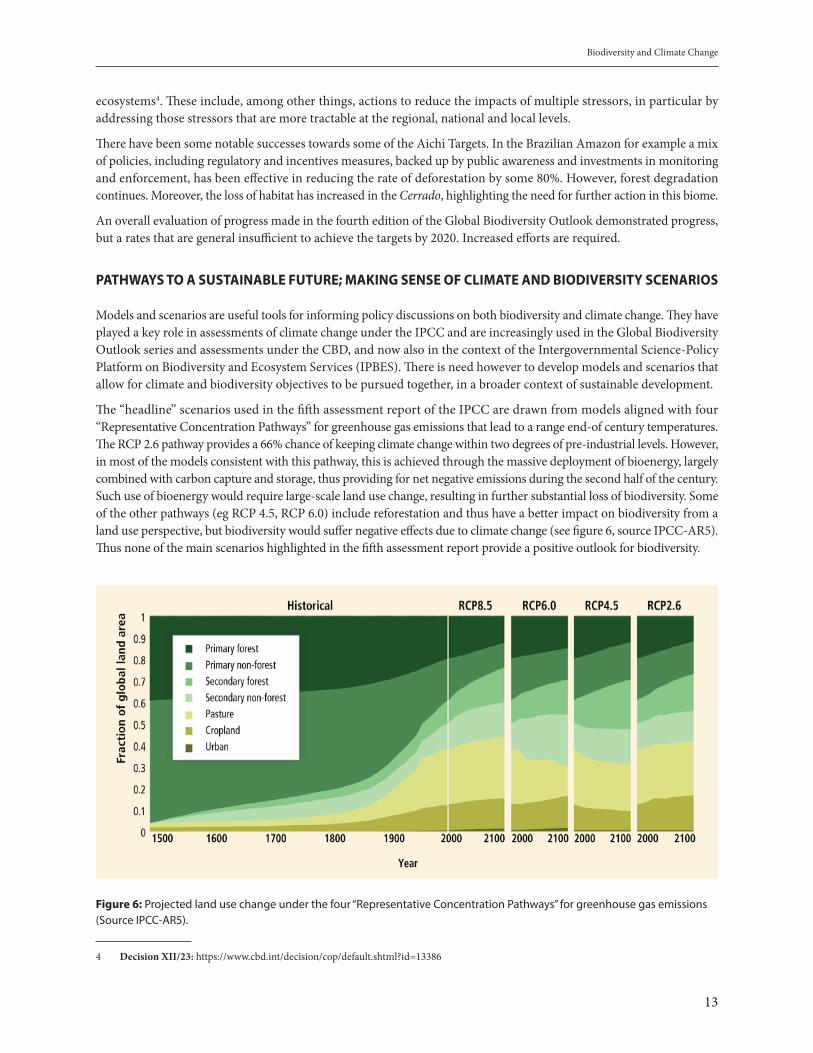
The “headline” scenarios used in the fifth assessment report of the IPCC are drawn from models aligned with four “Representative Concentration Pathways” for greenhouse gas emissions that lead to a range end-of century temperatures. The RCP 2.6 pathway provides a 66% chance of keeping climate change within two degrees of pre-industrial levels. However, in most of the models consistent with this pathway, this is achieved through the massive deployment of bioenergy, largely combined with carbon capture and storage, thus providing for net negative emissions during the second half of the century. Such use of bioenergy would require large-scale land use change, resulting in further substantial loss of biodiversity. Some of the other pathways (eg RCP 4.5, RCP 6.0) include reforestation and thus have a better impact on biodiversity from a land use perspective, but biodiversity would suffer negative effects due to climate change (see figure 6, source IPCC-AR5). Thus none of the main scenarios highlighted in the fifth assessment report provide a positive outlook for biodiversity.
Figure 6: Projected land use change under the four “Representative Concentration Pathways” for greenhouse gas emissions (Source IPCC-AR5).
4 Decision XII/23: https://www.cbd.int/decision/cop/default.shtml?id=13386

14
Biodiversity and Climate Change
A set of scenarios developed for the third and fourth editions of the Global Biodiversity Outlook demonstrate, however, that it is possible to reduce and eventually halt global biodiversity loss consistent with the 2050 Vision of the Strategic Plan, while also making progress towards climate change and other societal objectives. Pathways towards this longer term goal require a combination of actions including investment in agricultural productivity, reduced food waste and moderation of meat consumption, and strategic development of interconnected protected areas, other efforts to reduce greenhouse gas emissions from other sectors (see figure 7, source GBO-4). Such transformational changes require behavioral changes by governments, private companies and individuals, including by millions of farmers and billions of consumers.
Work is now underway to develop scenarios consistent with the goals of both conventions and the broader set of Sustainable Development Goals (Leadley et al., pers. comm.).
Figure 7: Scenarios and pathways towards the 2050 Vision if the Strategic Plan for Biodiversity 2011-2020. (Source, GBO-4).
CONCLUSIONS AND RECOMMENDATIONS
The following points may be made in summary:
• The conservation of biodiversity and the restoration of ecosystems contribute to climate change mitigation and adaption. But biodiversity is vulnerable to climate change. Concerted action is needed therefore to protect the climate and biodiversity;
• Drivers of biodiversity loss and ecosystem degradation include those related to climate change (changes in the magnitude and distribution of temperature and precipitation, sea level rise, ocean acidification, etc) which need to be addressed through global level action, and others, such as land-use change, pollution and overfishing which are more tractable at national and local levels;

15
Biodiversity and Climate Change
• Efforts to address climate change, must take into account land use change in forests and other ecosystems and its impacts on biodiversity;
• Transformational changes are needed to reduce and halt biodiversity loss while also meeting goals for climate change and sustainable development.
REFERENCES
Asner GP et al. (2013) Targeted carbon conservation at national scales with high-resolution monitoring. Preceeding of the National Academy of Sciences.
Convention on Biological Diversity (2010) Global Biodiversity Outlook 3, Montréal, Quebec, Canada
Convention on Biological Diversity (2014) Global Biodiversity Outlook 4, Montréal, Quebec, Canada
Leadley, P. W., Krug, C. B., Alkemade, R., Pereira, H. M., Sumaila, U. R., et al. (2014a).Progress towards the Aichi Biodiversity Targets: an assessment of biodiversity trends, policy scenarios and key actions. Technical Series 78. Montreal, Quebec, Canada: Secretariat of the Convention on Biological Diversity
Leadley, P. et al. (2014b) Interacting-Regional Scale Regime Shifts for Biodiversity and Ecosystem services. BioScience (2014) 64 (8): 665-679.

16
Biodiversity and Climate Change
BOX A THE STRATEGIC PLAN FOR BIODIVERSITY 2011–2020 AND THE AICHI BIODIVERSITY TARGETS
Vision The vision for the new plan is: ‘‘Living in Harmony with Nature’’ where ‘‘By 2050, biodiversity is valued, conserved, restored and wisely used, maintaining ecosystem services, sustaining a healthy planet and delivering benefits essential for all people.’’
Mission The mission of the new plan is to ‘‘take effective and urgent action to halt the loss of biodiversity in order to ensure that by 2020 ecosystems are resilient and continue to provide essential services, thereby securing the planet’s variety of life, and contributing to human well-being, and poverty eradication. To ensure this, pressures on biodiversity are reduced, ecosystems are restored, biological resources are sustainably used and benefits arising out of utilization of genetic resources are shared in a fair and equitable manner; adequate financial resources are provided, capacities are enhanced, biodiversity issues and values mainstreamed, appropriate policies are effectively implemented, and decision-making is based on sound science and the precautionary approach.’’
Aichi Biodiversity Targets (The text of the targets in this box has been abridged. For the full official text, please refer to www.cbd.int/sp)
Strategic Goal A: Address the Underlying Causes of Biodiversity Loss
Target 1 – People are aware of the values of biodiversity and the steps they can take to conserve and use it sustainably.Target 2 – Biodiversity values have been integrated into national and local development and poverty reduction strategies and planning processes.Target 3 – Incentives, including subsidies, harmful to biodiversity are eliminated, phased out or reformed and positive incentives are developed and applied. Target 4 – Governments, business and stakeholders at all levels have taken steps to achieve or have implemented plans for sustainable production and consumption.
Strategic Goal B: Reduce the Direct Pressures on Biodiversity and Promote Sustainable Use
Target 5 – The rate of loss of all natural habitats is at least halved and where feasible brought close to zero.Target 6 – Overfishing is avoided and fisheries have no significant adverse impacts on threatened species and vulnerable ecosystems.Target 7 – Areas under agriculture, aquaculture, and forestry are managed sustainably.Target 8 – Pollution, including from excess nutrients, has been brought to levels that are not detrimental to ecosystem function and biodiversity.Target 9 – Invasive alien species and pathways are identified, priority species are controlled or eradicated, and measures are in place to manage pathways. Target 10 – The multiple anthropogenic pressures on vulnerable ecosystems impacted by climate change or ocean acidification are minimized.
Strategic Goal C: To improve the Status of Biodiversity by Safeguarding Ecosystems, Species and Genetic Diversity
Target 11 – At least 17% of terrestrial and inland water, and 10% of coastal and marine areas are conserved through effective, ecologically representative and well connected systems of protected areas.Target 12 – The extinction of known threatened species has been prevented and their conservation status, particularly of those most in decline, has been improved and sustained. Target 13 – The genetic diversity of cultivated plants and farmed and domesticated animals and of wild relatives is maintained. Strategic Goal D: Enhance the Benefits to All from Biodiversity and Ecosystem Services Target 14 – Ecosystems that provide essential services are restored and safeguarded.Target 15 – Ecosystem resilience and the contribution of biodiversity to carbon stocks has been enhanced, through conservation and restoration, including restoration of at least 15% of degraded ecosystems.Target 16 – The Nagoya Protocol on Access and Benefit Sharing is in force and operational.
Strategic Goal E: Enhance Implementation through Participatory Planning, Knowledge Management and Capacity Building
Target 17 – Each Party has developed, adopted as a policy instrument, and has commenced implementing an effective, participatory and updated national biodiversity strategy and action plan.Target 18 – Traditional knowledge, innovations and practices of indigenous and local communities, and their customary use of biological resources, are respected. Target 19 – Knowledge relating to biodiversity is improved, shared and transferred, and applied. Target 20 – The mobilization of financial resources for implementing the Strategic Plan for Biodiversity 2011–2020 increased substantially from the current levels.

17
Consideration of the IPCC 5th Report on Mitigation
CONSIDERATION OF THE IPCC 5th REPORT ON MITIGATION
Gabriel BlancoCentro de Tecnologías Ambientales y Energía, Facultad de Ingeniería, Universidad Nacional del Centro de la Provincia de Buenos Aires
INTRODUCTION
The 5th Assessment Report (AR5) on Climate Change, prepared by the Intergovernmental Panel on Climate Change (IPCC) and made it public in 2014, has a number of bold findings on the changes in the climate systems, both observed and future, as well as on the adverse impacts these changes are causing and on possible pathways to mitigate greenhouse gas emissions that drive climate change. These findings reinforce previous ones introduced in past reports but with a level of evidence and agreement among scientists never seen before.
One of the main findings in the AR5 states that “Human influence on the climate system is clear, and recent anthropogenic emissions of greenhouse gases are the highest in history.” (IPCCa, 2014). In fact, total anthropogenic CO2 emissions have continued to increase steadily over since 1950, as shown in Figure 1.
Figure 1: Left panel: Global anthropogenic CO2 emissions from burning of fossil fuel, cement production and flaring as well as from forestry and other land use. Right panel: Cumulative CO2 emissions from the same sources; uncertainties in both sources are shown as whiskers.
Source: Synthesis Report. Contribution of Working Groups I, II and III to the Fifth Assessment Report of the Intergovernmental Panel on Climate Change.
The second bold finding says that “Anthropogenic greenhouse gas emissions have increased since the pre-industrial era, driven largely by economic and population growth, and are now higher than ever.”(IPCCa, 2014). These emissions, in turn, have led to atmospheric concentrations of carbon dioxide, methane and nitrous oxide that are unprecedented in, at least, the last 800,000 years.” Figure 2 shows atmospheric concentrations of the main greenhouse gases since 1850.

18
Consideration of the IPCC 5th Report on Mitigation
Figure 2: Globally averaged concentrations of carbon dioxide (CO2), methane (CH4) and nitrous oxide (N2O) determined from ice core data (dots) and from direct atmospheric measurements (lines).
Source: Synthesis Report. Contribution of Working Groups I, II and III to the Fifth Assessment Report of the Intergovernmental Panel on Climate Change.
The effects of this GHG concentration, together with those of other anthropogenic drivers, have been detected throughout the climate system and, according to the AR5, are extremely likely to have been the dominant cause of the observed warming since the mid-20th century. This, in turn, led to a third bold finding in the AR5: “Warming of the climate system is unequivocal, and since the 1950s, many of the observed changes are unprecedented over decades to millennia.” (IPCCa, 2014). These climate changes have had widespread impacts on human and natural systems such as land and ocean surface temperature and sea level. Figure 3 shows the change in these two parameters since 1850.
Figure 3: Observations of a changing global climate system. (a) Globally averaged combined land and ocean surface temperature anomalies relative to the average over the period 1986 to 2005. Colours indicate different data sets. (b) Globally averaged sea level change relative to the average over the period 1986 to 2005 in the longest-running dataset. Shades indicate different data sets. All datasets are aligned to have the same value in 1993.
Source: Synthesis Report. Contribution of Working Groups I, II and III to the Fifth Assessment Report of the Intergovernmental Panel on Climate Change.

19
Consideration of the IPCC 5th Report on Mitigation
MULTIPLE PERSPECTIVES ON GHG EMISSIONS TRENDS
In order to analyze GHG emissions trends, the AR5 has taken multiple perspectives since each one has a different story to tell. This is not only important for how to approach mitigation actions or what economic sectors or type of GHG should be prioritized, but also for how the mitigation burden could be shared among regions and countries. Figure 4 shows two different perspectives of GHG emissions trends: per region and per capita from 1970 to 2010 period. Emissions shown are territorial or production based, they include all sectors, sources and gases, and are aggregated using 100-year GWP values (IPCCb, 2014).
Figure 4: Left panel: GHG emissions per region from 1970 to 2010. Emissions are territorial, include all sectors, sources and gases, and are aggregated using 100-year GWP values. Right panel: The same data presented as per capita GHG emissions.
Source: AR5, WGIII, Chapter 5: Drivers, Trends and Mitigation. Climate Change 2014: Mitigation of Climate Change. Contribution of Working Group III to the Fifth Assessment Report of the Intergovernmental Panel on Climate Change.
These two perspectives on GHG emissions trends shown in Figure 4 indicate the importance of how the data is presented. For instance, when total territorial emissions are considered then Asia and the OECD countries seem to have similar relevance; however, when per capita GHG emissions are pondered then the same two groups of countries look very different, with OECD countries having almost three times as many per capita GHG emissions as countries in Asia. This latter perspective is critical for the discussion on equity issues and burden sharing in terms of mitigation actions.
Regarding GHG emissions trends by sector, the AR5 founded that CO2 emissions from fossil fuel combustion and industrial processes contributed about 78% of the total GHG emission increase from 1970 to 2010. Agriculture, deforestation, and other land use changes (AFOLU) have been the second-largest contributor sector whose GHG emissions have reached 12 GtCO2eq/yr in 2010, roughly 24% of global GHG emissions in 2010.
When the type of GHG is analyzed, then methane from enteric fermentation in cattle production, rice fields and organic waste disposal sites follows CO2 in importance. Methane has a shorter lifetime in the atmosphere but it is a more powerful GHG than CO2 in terms of global warming potential; therefore reduction of methane emissions may have strong and immediate benefits. This applies also to nitrous oxide and other short-lived gases.

20
Consideration of the IPCC 5th Report on Mitigation
THE CAUSES OF EMISSIONS
Once the observed GHG emissions trends are described under multiple perspectives, the AR5 looks into the causes of these trends. For doing this, a decomposition of GHG emissions is done to identify the immediate factors that cause GHG emissions. This allows, in the first place, organizing the analysis although this is not straightforward. In fact, the decomposition factors are related to each other in ways that are not always clear. As an example, the CO2 emissions from fossil energy sources can be decomposed in four factors: population, GDP per capita, energy intensity, and carbon intensity. Figure 5 shows the trends of these four factors from 1970 to 2010.
Figure 5: Trends in population, GDP per capita, energy intensity, and carbon intensity at a global level (left panel) and for Latin America and the Caribbean (right panel) from 1970 to 2010.
Source: AR5, WGIII, Chapter 5: Drivers, Trends and Mitigation. Climate Change 2014: Mitigation of Climate Change. Contribution of Working Group III to the Fifth Assessment Report of the Intergovernmental Panel on Climate Change.
Figure 5 shows that the improvements in energy intensity over this period have not been sufficient to offset the effect on the emissions of the increase in GDP per capita and the population growth over the same period. As a result, at a global level, CO2 emissions from fossil fuels increased by a factor of 2 between 1970 and 2010, and by a factor greater than 3 in Latin America and the Caribbean region for the same period. (IPCCb, 2014).
As said, these factors are not independent to each other; as a critical example of this the improvements in energy intensity, which are related to improvements in technology and overall efficiency in the production of goods and services, have driven, at least in part, the increase in the GDP per capita in the last four decades. This poses a question about what technological changes have being used for in the past and how these changes should be used in the future.
This leads to the second level in the analysis of the causes of GHG emissions. This second level of analysis allows for looking into the drivers of the immediate factors, or the “underlying drivers” as they are named in the AR5. The underlying drivers are defined as “the processes, mechanisms, and characteristics of society that influence emissions through the immediate factors” (IPCCb, 2014). The main underlying drivers of GHG emissions identified are fossil fuels endowment and availability, consumption and production patterns, structural and technological changes, and behavioural choices at both individual and societal levels.

21
Consideration of the IPCC 5th Report on Mitigation
The effect of immediate drivers on GHG emissions can be quantified through a straight decomposition analysis; the effect of underlying drivers, however, is not straightforward and, therefore, difficult to quantify in terms of their ultimate effects on GHG emissions.
Underlying drivers are subject to policies and measures that can be applied to, and act upon them, although in so doing an integral perspective should be observed since the interlinkages among underlying drivers are not fully understood and actions on one of them may modify others in a non-desirable direction. (IPCCb, 2014).
Finally, even policies that eventually and effectively reduce GHG emissions may create new burdens in other environmental, social or economic systems. This emphasizes the need for a holistic approach in the decision making process and in the design and implementation of policies and measures, where sustainable development goals should be at the center of his process.
EMISSIONS SCENARIOS
The AR5 elaborated and analyzed a large number of emissions scenarios and mitigation pathways into the future. These scenarios and pathways include a range of technological and behavioral options with different characteristics and implications for sustainable development. Mitigation scenarios in which it is likely that the temperature change caused by anthropogenic GHG emissions can be kept to less than 2°C relative to pre-industrial levels are characterized by atmospheric concentrations of about 450 ppm CO2eq in 2100. (IPCCc, 2014). In addition, the modeling of these mitigation pathways showed that delaying mitigation efforts through 2030 is estimated to substantially increase the difficulty of the transition to low longer-term emissions levels and narrow the range of options consistent with maintaining temperature change below 2°C relative to pre-industrial levels. Figure 6 shows the relationship between GHG emissions, cumulative emissions, GHG concentrations in the atmosphere, and the global temperature change.
Figure 6: (a) Annual anthropogenic CO2 emissions in the Representative Concentration Pathways (RCPs) (lines) and the associated scenario categories used in WGIII (shaded areas show 5 to 95% range). The WGIII scenario categories summarize the wide range of emission scenarios published in the scientific literature and are defined on the basis of CO2-eq concentration levels (in ppm) in 2100. (b) Warming vs. cumulative CO2 emissions: Global mean surface temperature increase at the time global CO2 emissions reach a given net cumulative total, plotted as a function of that total, from various lines of evidence.
Source: Synthesis Report. Contribution of Working Groups I, II and III to the Fifth Assessment Report of the Intergovernmental Panel on Climate Change.
It is observed in Figure 6 that only one emissions scenario (RCP2.6) would reach the goal, within a certain probability, of keeping the global mean temperature increase below 2°C with respect to pre-industrial levels.

22
Consideration of the IPCC 5th Report on Mitigation
GHG MITIGATION PATHWAYS
There are multiple GHG mitigation pathways that are likely to limit warming to below 2°C relative to pre-industrial levels. All these pathways require substantial emissions reductions over the next few decades and near zero emissions of CO2 and other long-lived greenhouse gases by the end of the century. Implementing such reductions poses substantial technological, economic, social and institutional challenges, which increase with delays in additional mitigation and if key technologies are not available (IPCCa, 2014).
From a technological perspective, at the global level, scenarios reaching 450 ppm CO2eq are characterized by more rapid improvements of energy efficiency, a tripling to nearly a quadrupling, of the share of zero- and low-carbon energy supply by 2050, including: renewables, nuclear energy, fossil energy with carbon dioxide capture and storage (CCS), and bioenergy with CCS.
As an example, Figure 7 shows the effort needed to transform the current global primary energy mix for different emission scenarios during this century.
Figure 7: Requirements of low-carbon energy share (as % of primary energy) for 2030, 2050 and 2100 compared to 2010 levels in mitigation scenarios.
Source: Summary for Policy Makers. Contribution of Working Groups III to the Fifth Assessment Report of the Intergovernmental Panel on Climate Change.
In the only scenario with chances to reach the 2°C goal, the percentage of low-carbon energy in the global primary energy mix required by 2050 is in the range of 45% and 75%, an increase of 310% with respect to low-carbon energy contributions in 2010.
However, from the analysis of the immediate drivers and the role of technological changes in the past and, even more relevant, from the analysis of the underlying drivers, other approaches to the mitigation of climate change are necessary. Changes in cultures, lifestyles, and social values are also required. This includes individual and public awareness, community and societal capacities to adapt to changes, institutions, policies, incentives, strategic spatial planning, social norms, rules and regulations of the marketplace, behavior of market actors, and societies’ ability to introduce through the political and institutional systems measures to reflect externalities. (IPCCb, 2014).
23
Consideration of the IPCC 5th Report on Mitigation
CONCLUSIONS
When looking at both immediate and underlying drivers of GHG emissions, climate change emerges then as just one symptom of the development model adopted since the Industrial Revolution by western societies, and more recently by eastern societies as well; a model defined, inter alia, by production and consumption patterns, technological development, and individual and societal choices.
Therefore, when plotting mitigation pathways as part as the so-called “solution space”, a broader perspective should be used; a perspective that includes not only solutions based on technology development and accessibility, but also solutions that include the revision of how societies are evolving and developing in terms of their interaction with natural resources, the way they produce and consume goods and services that include decisions around technological and infrastructural choices, and the way societies and individual define prosperity (Jackson, 2009).
New methodologies are now emerging to take care of this more holistic approach to appraise our activities (Rifkin, 1980). This integrated analysis is part of a new paradigm where society and the environment are seen as an indivisible whole.
REFERENCES
(IPCCa, 2014) (IPCC, 2014: Climate Change 2014: Synthesis Report. Contribution of Working Groups I, II and III to the Fifth Assessment Report of the Intergovernmental Panel on Climate Change [Core Writing Team, R.K. Pachauri and L.A. Meyer (eds.)]. IPCC, Geneva, Switzerland, 151 pp.)
(IPCCb, 2014) (Blanco G., R. Gerlagh, S. Suh, J. Barrett, H. C. de Coninck, C. F. Diaz Morejon, R. Mathur, N. Nakicenovic, A. Ofosu Ahenkora, J. Pan, H. Pathak, J. Rice, R. Richels, S. J. Smith, D. I. Stern, F. L. Toth, and P. Zhou, 2014: Drivers, Trends and Mitigation. In: Climate Change 2014: Mitigation of Climate Change. Contribution of Working Group III to the Fifth Assessment Report of the Intergovernmental Panel on Climate Change [Edenhofer, O., R. Pichs-Madruga, Y. Sokona, E. Farahani, S. Kadner, K. Seyboth, A. Adler, I. Baum, S. Brunner, P. Eickemeier, B. Kriemann, J. Savolainen, S. Schlömer, C. von Stechow, T. Zwickel and J.C. Minx (eds.)]. Cambridge University Press, Cambridge, United Kingdom and New York, NY, USA.)
(IPCCc, 2014) (IPCC, 2014: Summary for Policymakers. In: Climate Change 2014: Mitigation of Climate Change. Contribution of Working Group III to the Fifth Assessment Report of the Intergovernmental Panel on Climate Change [Edenhofer, O., R.Pichs-Madruga, Y. Sokona, E. Farahani, S. Kadner, K. Seyboth, A. Adler, I. Baum, S. Brunner, P. Eickemeier, B. Kriemann, J.Savolainen, S. Schlömer, C. von Stechow, T. Zwickel and J.C. Minx (eds.)]. Cambridge University Press, Cambridge, United Kingdom and New York, NY, USA)
(Jackson, 2009) (Jackson, 2009. Prosperity Without Growth. Tim Jackson. ISBN: 978-1-84407-894-3. Earthscan in the UK and USA. 2009)
(Rifkin, 1980) (Rifkin, 1980. Entropy: A New World View. Jeremy Rifkin and Ted Howard. ISBN 0-670-29717-8. The Viking Press, New York in 1980)

24
Biodiversity Increases the Resilience of Tropical Forests to Climate Change: Implications for Conservation Policy
1. BIODIVERSITY AND CARBON FLUX IN TROPICAL ECOSYSTEMS
BIODIVERSITY INCREASES THE RESILIENCE OF TROPICAL FORESTS TO CLIMATE CHANGE: IMPLICATIONS FOR CONSERVATION POLICY
Tim Baker, School of GeographyUniversity of Leeds, UK
ABSTRACT
Understanding how biodiversity affects ecosystem functions such as carbon storage and productivity is a major research field with potentially important implications for conservation policy. However, studies of the links between biodiversity and ecosystem function (BEF) in carbon-rich and diverse moist tropical forests are only just emerging. Here, I therefore review the findings of large-scale, field-based and modelling studies of BEF in tropical forests and identify how the results might best inform conservation policy.
BEF relationships comprise the effect of variation in both composition (the identity and traits of different species) and diversity (the number of species and their relative abundances) among sites, on processes such as carbon storage and productivity. Variation in the tree composition of tropical forests has an important role in determining aboveground carbon stocks and productivity at continental and pan-tropical scales. These relationships are mediated by variation in community-level average trait values for wood density and maximum height. The presence of species with different traits also increases the resilience of the carbon stocks of tropical forests to environmental changes, such as drought, over decadal and centennial time-scales. However, tree diversity is less strongly related to patterns of carbon cycling than variation in composition and may only be important at small, sub-hectare, spatial scales. These findings suggest that the strongest justification for conserving the biodiversity of tropical forests in terms of carbon cycling is that higher biodiversity increases the resilience of forest structure and biomass to environmental change. More practically, this view suggests that connected networks of protected areas that encompass wide environmental gradients will be most valuable for maintaining ecosystem function under climate change by allowing shifts in tree species distributions. Although the idea of such ecological corridors is not a new policy measure, the new evidence on how biodiversity promotes the resilience of carbon stocks to climate change may help to promote conservation amid the shrinking opportunities for protecting intact tropical forest.
INTRODUCTION
The intensive search for convincing relationships between biodiversity and ecosystem function over the last twenty five years has been stimulated by the desire to understand the impacts of species loss due to human activities, including climate change, on the services that ecosystems provide (Chapin et al., 1998, Schulze and Mooney, 1994). The findings of experimental studies, for example, indicate that extinction can lead to reductions in the delivery of ecosystem services that are similar to the direct effect of many pollutants (Hooper et al., 2012). However, BEF research in the highest diversity terrestrial ecosystem and arguably the greatest global conservation priority - tropical forests - remains scarce. Studies at landscape scales, which are most relevant to informing management decisions, are particularly rare: for example, a previous policy-facing review of BEF relationships in forest ecosystems contained no large-scale, observational studies from tropical forests of how biodiversity affects ecosystem function or resilience (Thompson et al., 2009). As a result, the integration of BEF relationships within arguments for conservation in the tropics is poorly articulated. The purpose of this chapter is to review recent studies concerning the importance of biodiversity for ecosystem function in tropical forests and reflect on the implications for future research and conservation policy. I emphasise large-scale, field-based

25
Biodiversity Increases the Resilience of Tropical Forests to Climate Change: Implications for Conservation Policy
and modelling BEF studies, which have the most relevance for informing management decisions, as they explore the role of biodiversity in the context of wide spatial and temporal environmental gradients. My focus is on aboveground carbon biomass (AGB) and wood productivity as ecosystem functions, as they are the cornerstone of efforts to generate payments for ecosystem services to support conservation in tropical forests (Baker et al., 2010).
HOW BIODIVERSITY PROMOTES ECOSYSTEM FUNCTION IN TROPICAL FORESTS
BEF relationships comprise the effect of variation in both composition (the identity and traits of different species) and diversity (the number of species and their relative abundances) among sites, on processes such as carbon storage and productivity. Variation in composition undoubtedly has an important role for determining spatial variation in carbon stocks and aboveground wood production at both continental and pan-tropical scales (Baker et al., 2004, Banin et al., 2014). These relationships are mediated by variation in community-level average trait values for wood density and maximum height among forests. For example, above ground carbon stocks are approximately 15 % higher in forest plots in central compared to western Amazonia, because they comprise species that have denser wood which contains more carbon per unit volume (Baker et al., 2004). Variation in the abundance of species which have different allometric relationships – achieve greater or lesser height for a given diameter - also affects aboveground carbon stocks. The clearest example of this mechanism is found in forests in SE Asia where dominance of forests by very tall-statured individuals of the Dipterocarpaceae (Banin et al., 2012) leads to wood productivity which is 49 % higher than forests growing in similar environmental conditions in Amazonia (Banin et al., 2014). Less well-appreciated is that this process is also important within some tropical forest regions: many upland forests on clay-rich soils in the Guianas in South America are dominated by a group of caesalpinoid legumes which achieve higher statures than many other species found in Amazonia (ter Steege et al., 2006). The forests in this region therefore have high canopy heights (Feldpausch et al., 2011), and this distinctive composition is one reason for the particularly high (>400 Mg ha-1) AGB values in this region (Feldpausch et al., 2012, Johnson et al., 2016). Finally, as variation in the maximum diameter that different species attain is strongly related to their contribution to forest biomass and woody productivity (Fauset et al., 2015), the abundance of tree species and individuals that reach large diameters is strongly related to variation in AGB (Baker et al., 2004, Slik et al., 2013). As a result of all these patterns, it is simple to demonstrate that changes in species composition, particularly losses of large diameter, tall-statured, heavy wooded species, can lead to substantial reductions in aboveground biomass of tropical forests (e.g. Bunker et al., 2005): species composition matters for patterns of biomass and woody productivity in tropical forests.
The underlying reasons for the variation in species composition that leads to such differences in ecosystem structure and function include both current ecological processes, as well as the legacy of historical events. For example, differences in mean wood density between western and central Amazonian forests is associated with underlying differences in soil physical and chemical properties that favour either fast-growing species with high mortality rates and low wood density, or slow-growing species with low mortality rates and high wood density (Baker et al., 2004, Quesada et al., 2012, Baker et al., 2014). However, variation in the distribution of species with different height diameter allometries may be due to the legacy of historical processes that have resulted in the dominance of certain families in certain tropical regions (Banin et al., 2012, Johnson et al., 2016).
A second way in which biodiversity is related to ecosystem service delivery within tropical forests is by increasing their resilience to environmental change. Over decadal timescales, resilience (the ability of ecosystem function to resist and bounce back from perturbation; Oliver et al., 2015) relies on the presence of a wide range of species with different characteristics within the regional species pool. Larger species pools are more likely to contain taxa that have adaptations that allow them to persist and thrive as a result of changing environmental conditions. A simple example is how Amazonian forests transitioned to an alternative, but still tree-dominated, state during the last glacial maximum despite cooler and drier conditions (Colinvaux et al., 2000). Such resilience has also been demonstrated in tropical forests over recent decades (Fauset et al., 2012): in Ghana, a long term reduction in rainfall since the 1970s has led to an increase in the abundance of species characteristic of drier tropical forests, and the AGB of these forests has actually increased during the same period (Fig. 1; Fauset et al., 2012). In this case, alterations in species composition have contributed to maintaining a stable forest structure, despite a shift in climate. Similarly, modelling studies have demonstrated how greater diversity could help to maintain high carbon stocks in the face of predicted climate change over coming centuries

26
Biodiversity Increases the Resilience of Tropical Forests to Climate Change: Implications for Conservation Policy
(Sakschewski et al., 2016). Of course, the resilience that biodiversity offers for maintaining forests in the face of climate change should not be overstated. Substantial changes in climate, or strong interactions between climate change with direct human degradation will doubtless cause major biome shifts: areas at the fringe of Amazonia became open habitats during the last glacial maximum (Anhuf et al., 2006) and strong drought in 1982/3 in Ghana coupled with human-caused fire, caused the savannisation of large areas of forest (Swaine et al., 1997). However, biodiversity can clearly increase the resilience of tropical forest structure to environmental change.
WHERE BIODIVERSITY HAS LIMITED IMPORTANCE FOR ECOSYSTEM FUNCTION IN TROPICAL FORESTS
In contrast to the importance of composition, variation in diversity is a weaker correlate of aboveground carbon stocks in tropical forests. An analysis of 360, one hectare forest plots from all three tropical continents that accounted for variation in environmental factors and spatial auto-correlation, indicated that there was no significant relationship between diversity and carbon stocks across tropical forests (Sullivan et al., in review). This result contrasts with prior studies of 58 sites in the neotropics (Poorter et al., 2015), and 59, one hectare plots across the tropics (Cavanaugh et al., 2014) which hinted at a positive relationship between diversity and AGB, using similar plot sizes. However, the larger scale study indicates that the results at a one hectare scale from these previous analyses cannot be generalised across the moist tropical forest biome (Sullivan et al., in review). In contrast, positive relationships between diversity and AGB are more consistently significant at small scales (e.g. 0.1 ha plots, Poorter et al. (2015); 0.04 ha plots Sullivan et al. (in review)). These relationships are consistent with how mechanisms such as selection effects and niche differentiation might operate (Sullivan et al., in review, Poorter et al., 2015). However, as these relationships have only been detected at very small scales where there is little environmental variation and few species interact, it is unlikely that these mechanisms are important determinants of variation in biomass at landscape and regional scales.
The effect of biodiversity on forest productivity has been less well studied than relationships with AGB. At large spatial scales, variation in composition may be an important control of productivity, in addition to the effect of environmental variables, such as rainfall and soil physical and chemical properties, which control tree growth (Quesada et al., 2012, Baker et al., 2003). However, the importance of environmental variables may be far stronger than any effect of composition and/or diversity. For example, variation in the functional composition of western and central Amazon forests does not cause the higher productivity of western Amazon forests: within the same functional group of tree, higher productivity is observed in western compared to central Amazon forests, suggesting that environmental factors play a more important role than variation in composition (Baker et al., 2009).
Figure 1: Changes in (left) aboveground biomass and (right) tree species composition in relation to the abundance of species with preferences for wet or dry forests, quantified as ‘Dry Forest Score’ (Fauset et al., 2012), over a 20 year period in 19 intact forest plots in Ghana. For most plots, aboveground biomass increased and forest composition shifted to favour more drought-tolerant species, shown by the increase in ‘Dry Forest Score’ over time. Redrawn from Fauset et al. (2012).
27
Biodiversity Increases the Resilience of Tropical Forests to Climate Change: Implications for Conservation Policy
OPPORTUNITIES FOR STUDYING BIODIVERSITY AND ECOSYSTEM FUNCTION RELATIONSHIPS IN TROPICAL FORESTS
Current knowledge of BEF relationships in intact tropical forests demonstrates how variation in composition defines spatial patterns of carbon stocks and the importance of biodiversity for the resilience of these ecosystems. However, there are many opportunities for further research. As noted above, studies of the effect of biodiversity on productivity are largely lacking in tropical forests. In addition, the role of phylogenetic diversity for determining ecosystem function (Cadotte, 2013) may reveal useful relationships in ecosystems where high diversity precludes easy measurement of the functional properties of thousands of species. In general terms, there is also much work to be done understanding the species, community and landscape-scale mechanisms that underpin the role of biodiversity in augmenting the resilience of ecosystem function in tropical forests (Oliver et al., 2015). For example, we know that rare species in tropical forests may have unusual combinations of functional traits, but we do not understand how that links to their performance and therefore their overall importance for ecosystem function and resilience (Mouillot et al., 2013). In particular, we need to understand the nature (e.g. which ecosystem functions are most resilient and which are most sensitive?) and limits (e.g. what are the thresholds where biome collapse is unavoidable?) of the resilience that biodiversity affords tropical forests in much more detail. For example, there is compelling evidence for upward altitudinal shifts in species distributions in the Andes as a result of warming temperatures (Feeley et al., 2011, Duque et al., 2015), but we do not know how these shifts are related to changes in forest structure or function. High-quality, standardised forest plot datasets with information on the identity, traits, sizes and population dynamics of tropical trees, linked with measurements using LiDAR and hyperspectral remote sensing technology (e.g. Asner et al., 2015) that provide a landscape-scale perspective, will be essential for understanding the role that biodiversity will play in the future trajectory of ecosystem function in this biome.
BEF AND CONSERVATION IN TROPICAL FORESTS
The first way in which the BEF research described above links to conservation policy is related to the design of carbon-based payments for ecosystem services. This topic has been particularly prominent in debates about the design of REDD+ (Reducing Emissions from Deforestation and Degradation) schemes which aim to reduce carbon emissions from land-use change (Angelsen, 2008). One aspect of the debate is whether biodiversity conservation should be an integral part of carbon-based conservation because there are mechanistic reasons that lead higher biodiversity to generate greater carbon stocks in tropical forests (Poorter et al., 2015). However, the lack of a relationship between diversity and carbon storage among a comprehensive sample of one hectare plots (Sullivan et al., in review) indicates that such mechanisms may, at best, only operate at very small spatial scales. At landscape-scales relevant to conservation, there is therefore no evidence that tropical forest landscapes containing thousands of tree species have higher carbon stocks than landscapes with a few hundred different taxa. A second related aspect of the debate is whether effective biodiversity conservation can be achieved with a carbon-based approach, because spatial patterns of both parameters are broadly correlated rather than because there is a direct mechanistic link between biodiversity and carbon storage (Cavanaugh et al., 2014). However, again, the lack of correlation between diversity and carbon stocks among tropical forests suggests the conservation of carbon and species require, broadly-speaking, independent strategies (Sullivan et al., in review). In general, this finding emphasises the importance of including substantial incentives within carbon-based strategies to optimise the contribution they make to biodiversity conservation (Venter et al., 2009, Grainger et al., 2009, Miles and Kapos, 2008). Overall, the lack of consistent ‘win-win’ outcomes for both carbon and biodiversity if conservation policy solely focuses on just one of these parameters is exemplified by considering that the most carbon-dense tropical ecosystems in the neotropics – the peatlands of northwest Amazonia – contain some of the least diverse tree communities (Draper et al., 2014, Pitman et al., 2014) and that the remarkable beta diversity of neotropical dry forests is associated with generally low carbon stocks (DRYFLOR, 2016, Becknell et al., 2012). Conservation strategies will need to value carbon and biodiversity independently to protect both of these vegetation types.

28
Biodiversity Increases the Resilience of Tropical Forests to Climate Change: Implications for Conservation Policy
A second, perhaps more compelling, way in which BEF research could strengthen conservation policy is through the increased resilience that biodiversity provides for forest structure, and therefore the ecological functions that forests perform, in the face of environmental change. Biodiversity provides this resilience because species can change in abundance depending on changing environmental conditions (Fauset et al., 2012, Sakschewski et al., 2016). Realising this resilience depends on conserving a connected protected area network that encompasses the regional species pool. The idea of connected networks of protected areas is not a new idea; ecological networks and corridors are well established as a key conservation strategy in response to land-use change which can be beneficial for both biodiversity and carbon (Jantz et al., 2014, Bennett and Mulongoy, 2006). The idea that such networks might allow species to persist in the face of the interacting effects of changes in both land-use and climate is also now widely appreciated (Bennett and Mulongoy, 2006, Brodie et al., 2012) and the concept has been influential in the design of a range of specific, large-scale conservation initiatives in tropical forest landscapes such as the Vilcabamba-Amboró corridor in Bolivia and Peru (Bennett and Mulongoy, 2006, Ibisch et al., 2007). However, the idea that both biodiversity and carbon conservation is ensured over time by the existence of such networks because biodiversity increases the resilience of carbon stocks to environmental change is not well integrated within existing conservation planning in the tropics. For example, the designation of the Sierra del Divisor as a National Park in Peru in 2015 acknowledged the role that these forests have for supplying ecosystem services - their overall large carbon stocks and protection of watersheds - as well as the presence of high-profile species and their importance as ancestral lands of indigenous groups (SERNANP, 2012). However, the importance of biodiversity conservation to increase the resilience of the ecosystem services provided by the protected area network in Peru, or across Amazonia, was not used as a reason to protect this region. The Sierra del Divisor National Park is located along a key north-south precipitation gradient, between a set of other protected areas in Peru and Brazil. Conserving this area therefore ensures connectivity along an environmental gradient that is highly likely to be affected by climate change, and where species migration is likely. Overall, the greater resilience that biodiversity gives to forest carbon stocks is considered an important link between biodiversity conservation and ecosystem service provision (Thompson et al., 2009). Firm evidence now exists to support this argument from the tropical forest biome. Overall, this concept shows the importance of integrating the impact of climate change fully within conservation planning (cf Freudenberger et al., 2013) and the new evidence potentially provides powerful support to use this argument for justifying the protection of networks of intact tropical forest in the face of increasing threats from land-use and climate change.
ACKNOWLEDGEMENTS
I thank Lily Rodriguez and Ione Anderson for their tireless efforts to organise the pre-UNFCCC COP conference ‘Biodiversity and Climate Change: from science to policymakers’ in Lima, Peru and bring this volume to publication. I also thank two anonymous reviewers for their helpful comments and acknowledge the project ‘Monitoring Protected Areas in Peru to Increase Forest Resilience to Climate Change’ funded by the Gordon and Betty Moore Foundation (grant number 5349) which has been influential in the development of the ideas presented in this manuscript.
REFERENCES
Angelsen, A. (2008) Moving ahead with REDD: issues, options and implications. Bogor, Indonesia.
Anhuf, D., Ledru, M. P., Behling, H., Da Cruz, F. W., Cordeiro, R. C., Van Der Hammen, T., Karmann, I., Marengo, J. A., De Oliveira, P. E., Pessenda, L., Siffedine, A., Albuquerque, A. L. & Dias, P. L. D. (2006) Paleo-environmental change in Amazonian and African rainforest during the LGM. Palynology, Palaeogeography & Palaeoclimatology, 239, 510-527.
Asner, G. P., Anderson, C. B., Martin, R. E., Tupayachi, R., Knapp, D. E. & Sinca, F. (2015) Landscape biogeochemistry reflected in shifting distributions of chemical traits in the Amazon forest canopy. Nature Geoscience, 8, 567-573.
Baker, T. R., Swaine, M.D. & Burslem, D.F.R.P. (2003) Variation in tropical forest growth rates: combined effects of functional group composition and resource availability. Perspectives in Plant Ecology, Evolution and Systematics 6, 21-36.
29
Biodiversity Increases the Resilience of Tropical Forests to Climate Change: Implications for Conservation Policy
Baker, T. R., Jones, J. P. G., Rendón Thompson, O. R., Román Cuesta, R. M., del Castillo, D., Chan Aguilar, I., Torres, J. & Healey, J. R. (2010) How can ecologists help realise the potential of payments for carbon in tropical forest countries? Journal of Applied Ecology, 47, 1159-1165.
Baker, T. R., Pennington, R. T., Magallon, S., Gloor, E., Laurance, W. F., Alexiades, M., Alvarez, E., Araujo, A., Arets, E. J., Aymard, G., Alves de Oliveira, A., Amaral, I., Arroyo, L., Bonal, D., Brienen, R. J. W., Chave, J., Dexter, K. D., Di Fiore, A., Eler, E., Feldpausch, T. R., Ferreira, L., Lopez-Gonzalez, G., van der Heijden, G., Higuchi, N., Honorio, E., Huamantupa, I., Killeen, T., Laurance, S., Leano, C., Lewis, S. L., Malhi, Y., Schwantes Marimon, B., Marimon Junior, B. H., Monteagudo Mendoza, A., Neill, D., Penuela-Mora, C., Pitman, N., Prieto, A., Quesada, C. A., Ramírez, F., Ramírez Angulo, H., Rudas, A., Ruschel, A. R., Salomao, R. P., Segalin de Andrade, A., Silva, N. M., Silveira, M., Simon, M. F., Spironello, W., ter Steege, H., Terborgh, J., Toledo, M., Torres-Lezama, A., Vasquez, R., Vieira, I. C. G., Vilanova, E., Vos, V. A. & Phillips, O. L. (2014) Fast demographic traits promote high diversification rates of Amazonian trees. Ecology Letters, 17, 527-536.
Baker, T. R., Phillips, O. L., Laurance, W. F., Pitman, N. C. A., Almeida, S., Arroyo, L., DiFiore, A., Erwin, T., Higuchi, N., Killeen, T. J., Laurance, S. G., Nascimento, H., Monteagudo, A., Neill, D. A., Silva, J. N. M., Malhi, Y., Gonzalez, G. L., Peacock, J., Quesada, C. A., Lewis, S. L. & Lloyd, J. (2009) Do species traits determine patterns of wood production in Amazonian forests? Biogeosciences, 6, 297-307.
Baker, T. R., Phillips, O. L., Malhi, Y., Almeida, S., Arroyo, L., Di Fiore, A., Erwin, T., Killeen, T. J., Laurance, S. G., Laurance, W. F., Lewis, S. L., Lloyd, J., Monteagudo, A., Neill, D. A., Patino, S., Pitman, N. C. A., Silva, J. N. M. & Martinez, R. V. (2004) Variation in wood density determines spatial patterns in Amazonian forest biomass. Global Change Biology, 10, 545-562.
Banin, L., Feldpausch, T., Phillips, O., Baker, T., Lloyd, J., Affum‐Baffoe, K., Arets, E., Berry, N., Bradford, M. & Brienen, R. (2012) What controls tropical forest architecture? Testing environmental, structural and floristic drivers. Global Ecology and Biogeography, 21, 1179-1190.
Banin, L., Lewis, S. L., Lopez Gonzalez, G., Baker, T. R., Quesada, C. A., Chao, K. J., Burslem, D. F., Nilus, R., Abu Salim, K. & Keeling, H. C. (2014) Tropical forest wood production: a cross‐continental comparison. Journal of Ecology, 102, 1025-1037.
Becknell, J. M., Kucek, L. K. & Powers, J. S. (2012) Aboveground biomass in mature and secondary seasonally dry tropical forests: A literature review and global synthesis. Forest Ecology and Management, 276, 88-95.
Bennett, G. & Mulongoy, K. J. (2006) Review of experience with ecological networks, corridors and buffer zones. Technical Series no. 23, pp. 100. Secretariat of the Convention on Biological Diversity, Montreal.
Brodie, J., Post, E. & Laurance, W. F. (2012) Climate change and tropical biodiversity: a new focus. Trends in Ecology & Evolution, 27, 145-150.
Bunker, D. E., DeClerck, F., Bradford, J. C., Colwell, R. K., Perfecto, I., Phillips, O. L., Sankaran, M. & Naeem, S. (2005) Species loss and aboveground carbon storage in a tropical forest. Science, 310, 1029-1031.
Cadotte, M. W. (2013) Experimental evidence that evolutionarily diverse assemblages result in higher productivity. Proceedings of the National Academy of Sciences, 110, 8996-9000.
Cavanaugh, K. C., Gosnell, J. S., Davis, S. L., Ahumada, J., Boundja, P., Clark, D. B., Mugerwa, B., Jansen, P. A., O’Brien, T. G. & Rovero, F. (2014) Carbon storage in tropical forests correlates with taxonomic diversity and functional dominance on a global scale. Global Ecology and Biogeography, 23, 563-573.
Chapin, F. S., Sala, O. E., Burke, I. C., Grime, J. P., Hooper, D. U., Lauenroth, W. K., Lombard, A., Mooney, H. A., Mosier, A. R. & Naeem, S. (1998) Ecosystem consequences of changing biodiversity. Bioscience, 45-52.
Colinvaux, P. A., de Oliveira, P. E. & Bush, M. B. (2000) Amazonian and neotropical plant communities on glacial timescales: the failure of the aridity and refuge hypothesis. Quaternary Science Reviews, , 19, 141-169.

30
Biodiversity Increases the Resilience of Tropical Forests to Climate Change: Implications for Conservation Policy
Draper, F. C., Roucoux, K. H., Lawson, I. T., Mitchard, E. T., Coronado, E. N. H., Lähteenoja, O., Montenegro, L. T., Sandoval, E. V., Zaráte, R. & Baker, T. R. (2014) The distribution and amount of carbon in the largest peatland complex in Amazonia. Environmental Research Letters, 9, 124017.
DRYFLOR (2016) Plant diversity patterns in neotropical dry forests and their conservation implications. Science, 353, 1383-1387.
Duque, A., Stevenson, P. R. & Feeley, K. J. (2015) Thermophilization of adult and juvenile tree communities in the northern tropical Andes. Proceedings of the National Academy of Sciences, 112, 10744-10749.
Fauset, S., Baker, T. R., Lewis, S. L., Feldpausch, T. R., Affum‐Baffoe, K., Foli, E. G., Hamer, K. C. & Swaine, M. D. (2012) Drought‐induced shifts in the floristic and functional composition of tropical forests in Ghana. Ecology Letters, 15, 1120-1129.
Fauset, S., Johnson, M. O., Gloor, M., Baker, T. R., Monteagudo, A., Brienen, R. J., Feldpausch, T. R., Lopez-Gonzalez, G., Malhi, Y. & ter Steege, H. (2015) Hyperdominance in Amazonian forest carbon cycling. Nature Communications, 6, 6857.
Feeley, K. J., Silman, M. R., Bush, M. B., Farfan, W., Cabrera, K. G., Malhi, Y., Meir, P., Revilla, N. S., Quisiyupanqui, M. N. R. & Saatchi, S. (2011) Upslope migration of Andean trees. Journal of Biogeography, 38, 783-791.
Feldpausch, T., Banin, L., Phillips, O., Baker, T., Lewis, S., Quesada, C., Affum-Baffoe, K., Arets, E., Berry, N. & Bird, M. (2011) Height-diameter allometry of tropical forest trees. Biogeosciences, 8, 1081-1106.
Feldpausch, T. R., Lloyd, J., Lewis, S. L., Brienen, R. J., Gloor, M., Monteagudo Mendoza, A., Lopez-Gonzalez, G., Banin, L., Abu Salim, K. & Affum-Baffoe, K. (2012) Tree height integrated into pantropical forest biomass estimates. Biogeosciences, 9, 3381-3403.
Freudenberger, L., Hobson, P., Schluck, M., Kreft, S., Vohland, K., Sommer, H., Reichle, S., Nowicki, C., Barthlott, W. & Ibisch, P. L. (2013) Nature conservation: priority-setting needs a global change. Biodiversity and Conservation, 22, 1255-1281.
Grainger, A., Boucher, D. H., Frumhoff, P. C., Laurance, W. F., Lovejoy, T., McNeely, J., Niekisch, M., Raven, P., Sodhi, N. S. & Venter, O. (2009) Biodiversity and REDD at Copenhagen. Current Biology, 19, R974-R976.
Hooper, D. U., Adair, E. C., Cardinale, B. J., Byrnes, J. E. K., Hungate, B. A., Matulich, K. L., Gonzalez, A., Duffy, J. E., Gamfeldt, L. & O/’Connor, M. I. (2012) A global synthesis reveals biodiversity loss as a major driver of ecosystem change. Nature, 486, 105-108.
Ibisch, P. L., Araujo, N. & Nowicki, C. (2007) Visión de Conservación de la Biodiversidad del Corredor Amboró - Madidi. FAN/WWF/TNC/CI. Editorial FAN, Santa Cruz de la Sierra - Bolivia.
Jantz, P., Goetz, S. & Laporte, N. (2014) Carbon stock corridors to mitigate climate change and promote biodiversity in the tropics. Nature Climate Change, 4, 138-142.
Johnson, M. O., Galbraith, D., Gloor, M., De Deurwaerder, H., Guimberteau, M., Rammig, A., Thonicke, K., Verbeeck, H., Randow, C., Monteagudo, A., Phillips, O. L., Brienen, R. J. W., Feldpausch, T. R., G., L. G., Fauset, S., Quesada, C. A., Christoffersen, B., Ciais, P., Gilvan, S., Kruijt, B., Meir, P., Moorcroft, P., Zhang, K., Alvarez, E., Alves de Oliveira, A., Amaral, I., Andrade, A., L.E.O.C., A., Araujo-Murakami, A., Arets, E. J. M. M., Arroyo, L., Aymard, G. A., Baraloto, C., Barroso, J., Bonal, D., Boot, R., Camargo, J., Chave, J., Cogollo, A., Cornejo Valverde, F., da Costa, L., di Fiore, A., Ferreira, L., Higuchi, N., Honorio, E., Killeen, T. J., Laurance, W. G., Laurance, S. F., Licona, J., Lovejoy, T., Malhi, Y., Marimon, B., Marimon Junior, B. H., Matos, D. C. L., Mendoza, C., Neill, D. A., Pardo, G., Peña-Claros, M., Pitman, N. C. A., Poorter, L., Prieto, A., Ramirez-Angulo, H., Roopsind, A., Rudas, A., Salomao, R. P., Silveira, M., Stropp, J., ter Steege, H., Terborgh, J., Thomas, R., Toledo, M., Torres, A., van der Heijden, G. M. F., Vasquez, R., Vieira, I., Vilanova, E., Vos, V. A. & Baker, T. R. (2016) Variation in stem mortality rates determines patterns of aboveground biomass in Amazonian forests: implications for dynamic global vegetation models. Global Change Biology.

31
Biodiversity Increases the Resilience of Tropical Forests to Climate Change: Implications for Conservation Policy
Miles, L. & Kapos, V. (2008) Reducing greenhouse gas emissions from deforestation and forest degradation: global land-use implications. Science, 320, 1454-1455.
Mouillot, D., Bellwood, D. R., Baraloto, C., Chave, J., Galzin, R., Harmelin-Vivien, M., Kulbicki, M., Lavergne, S., Lavorel, S., Mouquet, N., Paine, C. E. T., Renaud, J. & Thuiller, W. (2013) Rare species support vulnerable functions in high-diversity ecosystems. PLoS Biology, 11, e1001569.
Oliver, T. H., Heard, M. S., Isaac, N. J., Roy, D. B., Procter, D., Eigenbrod, F., Freckleton, R., Hector, A., Orme, C. D. L. & Petchey, O. L. (2015) Biodiversity and resilience of ecosystem functions. Trends in Ecology & Evolution, 30, 673-684.
Pitman, N. C., Andino, J. E. G., Aulestia, M., Cerón, C. E., Neill, D. A., Palacios, W., Rivas‐Torres, G., Silman, M. R. & Terborgh, J. W. (2014) Distribution and abundance of tree species in swamp forests of Amazonian Ecuador. Ecography, 37, 902-915.
Poorter, L., Sande, M., Thompson, J., Arets, E., Alarcón, A., Álvarez‐Sánchez, J., Ascarrunz, N., Balvanera, P., Barajas‐Guzmán, G. & Boit, A. (2015) Diversity enhances carbon storage in tropical forests. Global Ecology and Biogeography, 24, 1314-1328.
Quesada, C. A., Phillips, O. L., Schwarz, M., Czimczik, C. I., Baker, T. R., Patiño, S., Fyllas, N. M., Hodnett, M., Herrera, R., Almeida, S., Alvarez Dávila, E., Arneth, A., Arroyo, L., Chao, K.-J., Dezzeo, N., Erwin, T., di Fiore, A., Higuchi, N., Honorio Coronado, E., Jiménez, E. M., Killeen, T., Lezama, A. T., Lloyd, G., López-González, G., Luizão, F. J., Malhi, Y., Monteagudo, A., Neill, D. A., Núñez Vargas, P., Paiva, R., Peacock, J., Peñuela, M. C., Peña Cruz, A., Pitman, N. C. A., Priante Filho, N., Prieto, A., Ramírez, H., Rudas, A., Salomão, R., Santos, A. J. B., Schmerler, J., Silva, N., Silveira, M., Vásquez, R., Vieira, I., Terborgh, J. & Lloyd, J. (2012) Basin-wide variations in Amazon forest structure and function are mediated by both soils and climate Biogeosciences, 9, 2203-2246.
Sakschewski, B., von Bloh, W., Boit, A., Poorter, L., Peña-Claros, M., Heinke, J., Joshi, J. & Thonicke, K. (2016) Resilience of Amazon forests emerges from plant trait diversity. Nature Climate Change.
Schulze, E.-D. & Mooney, H. A. (1994) Ecosystem function of biodiversity: a summary. Biodiversity and ecosystem function (eds E.-D. Schulze & H. A. Mooney), pp. 497-510. Springer.
SERNANP (2012) Expediente tecnico Zona Reserva Sierra del Divisor. pp. 125. SERNANP, Lima.
Slik, J., Paoli, G., McGuire, K., Amaral, I., Barroso, J., Bastian, M., Blanc, L., Bongers, F., Boundja, P. & Clark, C. (2013) Large trees drive forest aboveground biomass variation in moist lowland forests across the tropics. Global Ecology and Biogeography, 22, 1261-1271.
Sullivan, M. J. P., Talbot, J., Lewis, S. L. & Phillips, O. L. (in review) Diversity and carbon storage across the tropical forest biome. Scientific Reports.
Swaine, M. D., Agyeman, V. K., Kyereh, B., Orgle, T. K., Thompson, J. & Veenendaal, E. M. (1997) Ecology of Forest Trees in Ghana. ODA, London, U.K.
ter Steege, H., Pitman, N., Phillips, O. L., Chave, J., Sabatier, D., Duque, A., Molino, J.-F., Prévost, M.-F., Spichiger, R., Castellanos, H., von Hildebrand, P. & R., V. (2006) Continental scale patterns of canopy tree composition and function across Amazonia. Nature, 443, 444-447.
Thompson, I., Mackey, B., McNulty, S. & Mosseler, A. (2009) Forest Resilience, Biodiversity, and Climate Change. A synthesis of the biodiversity/resilience/stability relationship in forest ecosystems. Technical Series no. 43, pp. 67. Secretariat of the Convention on Biological Diversity, Montreal.
Venter, O., Laurance, W. F., Iwamura, T., Wilson, K. A., Fuller, R. A. & Possingham, H. P. (2009) Harnessing carbon payments to protect biodiversity. Science, 326, 1368.

32
Recent Changes in Amazon Forest Biomass and Dynamics
RECENT CHANGES IN AMAZON FOREST BIOMASS AND DYNAMICS
Oliver L. PhillipsRAINFOR (Red Amazónica de Inventarios Forestales)
Abstract: RAINFOR has led field-based monitoring of forests across Amazonia since the turn of the millenium, and incorporated colleagues work since 1980. This unique long-term, large-scale perspective has yielded many surprising findings. Even far from the impacts of deforestation and degradation, the remote Amazon forests are changing. They have gained biomass, trees are growing faster, and they are dying faster. These changes are affected by climate change, and the accelerating carbon fluxes are themselves feeding back on the rate of global climate change. Neither has biodiversity been untouched by these changes. As an Amazon nation, Peru is a key part of this fascinating story which shows the unique ability of long-term, science-based monitoring to reveal how our world is changing.
1.1 Overview
There is a major planet-wide experiment underway. Changes to the atmosphere-biosphere system mean that all ecosystems on Earth are now affected by human activities. While outright deforestation is physically obvious, other subtler processes, such as hunting and surface fires, impact forests in ways less evident to the casual observer. Anthropogenic atmospheric change is intensifying: by the end of our century carbon dioxide concentrations may reach levels unprecedented for at least 20 million years, inducing rapid climate change. Further, these atmospheric changes are coinciding with probably the greatest changes in land cover and species’ distributions since at least the last mass extinction at ~65 million years ago. The collective evidence points to conditions with no clear past analogue. We have entered the Anthropocene, a new geological epoch dominated by human action.
In this chapter I focus on the changes occurring within remaining tropical forests, with an emphasis on Amazonia. Most forest vegetation carbon stocks lie within the tropics. Tropical forest ecosystems store 460 billion tonnes of carbon in their biomass and soil (Pan et al. 2011). They have other planetary influences via the hydrological cycle, and emit aerosols and trace gases, and are also characterised by their exceptional variety and diversity of life. Changes here therefore matter for several key reasons. First, the critical role that tropical forests play in the global carbon and hydrological cycles affects the rate and nature of climate change. Second, as tropical forests are home to at least half of all Earth’s species, changes affect global biodiversity and the cultures, societies, and economies that are bound to this diversity. Finally, as different plant species vary in their ability to store and process carbon, climate and biodiversity changes are linked by feedback mechanisms. The identities of the ‘winner’ species under environmental changes might exacerbate, or perhaps mitigate, human-driven climate change.
That remaining forests globally are now changing fast there is no doubt. Simple ‘top-down’ analysis of the global carbon cycle shows that after accounting for known atmospheric and oceanic fluxes there is a large carbon sink in the terrestrial biosphere, reaching >3 Gt carbon a year now. An independent ground-up analysis by foresters suggests that forests in every vegetated continent are implicated in this terrestrial sink, even after accounting for the separate dynamics of deforestation and secondary forest recovery (Pan et al. 2011). One critical question is therefore: how should scientists go about documenting and monitoring the changing behaviour of tropical forests?
Of the many approaches and technologies available it is careful, persistent, on-the-ground monitoring at fixed locations on Earth that can provide reliable long-term evidence of ecosystem behaviour, and this is the focus of this chapter. On-the-ground measurements provide information on subtle changes in species composition, biomass and carbon storage – none of which has been successfully done using satellites in mature lowland tropical forests, as signals saturate at high biomass and cannot currently detect the density of each tree’s wood, which substantially drives forest biomass. Yet, permanent sample plot work in the tropics has until quite recently been very sparse and mostly focussed on a few well-known locations, leaving most of the ~10 million km2 expanse of the world’s richest ecosystems unstudied.
33
Recent Changes in Amazon Forest Biomass and Dynamics
1.2 A Networked Approach
A robust approach to monitoring change needs to more synoptic, and integrated hundreds of sample sites. The first attempts to do this (Phillips and Gentry 1994; Phillips et al. 1994, 1998) were inspired by the macroecological work of Gentry. Gentry had used intensive floristic inventories across hundreds of forest locations to reveal the major geographic gradients in diversity and composition. But, unlike Gentry’s floristic work, these first macroecological analyses of tropical forest dynamics lacked methodological standardisation. We relied heavily on published data from different teams worldwide, and had limited sample sizes. To try to eliminate these weaknesses, since 2000 with many colleagues I have focussed on developing standardised, international, long-term networks of permanent plots in mature forests across Amazonia and elsewhere. These first draw together the existing efforts of local foresters and ecologists, who had often worked hitherto largely in isolation. Then, by analysing the gaps in geographical and environmental space, we have extended the network to fill the gaps, and built support for long-term spatially-extensive monitoring. The network of Amazonian-forest researchers, known as RAINFOR (Red Amazónica de Inventarios Forestales, www.geog.leeds.ac.uk/projects/rainfor/), now represents the long-term ecological monitoring efforts of 43 institutions worldwide including many from Amazonia. Here I synthesise some published results from RAINFOR to assess how mature Amazon forests have changed recently.
2 METHODOLOGY
For these analyses, I define a monitoring plot as an area of old-growth, physiognomically mature forest where all trees >10 cm diameter at breast height (dbh, measured at 1.3m height or above any deformity) are tracked over time. All trees are marked with a unique number, measured, mapped, and identified. Periodically (generally every 1-5 years) the plot is revisited, all surviving trees are re-measured, dead trees are noted, and trees recruited to 10 cm dbh are numbered, measured, mapped, and identified. This allows calculation of (i) the cross-sectional area that tree trunks occupy (basal area), which can be used with allometric equations to estimate tree biomass; (ii) tree growth (the sum of all basal-area increments for surviving and newly recruited stems over a census interval); (iii) the total number of stems present; (iv) stem recruitment (number of stems added to a plot over time); and (v) mortality (either the number or basal area of stems lost from a plot over time).
Most plots are 1 ha in size and comprise ~500 trees of ≥10 cm dbh. Most plots were established using randomised or systematic sampling protocols to locate plots in apparently old-growth forest landscape. Many have been monitored for more than a decade, although they range in age from 2 to 35 years (mean ~12 yrs). Here I analyse results of censuses completed up to 2007, but for Amazonia I first report results prior to the intense drought of 2005, and then also summarize the impact of the drought and briefly review the latest findings from RAINFOR (Brienen et al 2015). Details of exact plot locations, inventory and monitoring methods, and the challenges involved in collating and analysing plot data are discussed elsewhere (e.g., Phillips et al. 2009; Baker et al. 2004; Lewis et al. 2004; Lopez-Gonzalez et al. 2011). It is important to point out that the samples are not evenly distributed over Amazonia because they use historical plot data, where possible, and also because considerations of access can limit where it is practical to work, nor are census intervals always regular, because of uneven funding, yet a wide range of environmental space is captured by the samples. The general distribution and sampling density of plots is indicated in Figure 1.
Scaling from individual tree to Amazon plot biomass is based on the diameter-based allometric equations detailed in Baker et al. 2004. I summarize findings from mature forests in terms of (a) structural change, (b) dynamic-process change, and (c) functional and compositional change, over the past two to three decades, including taking account of recent droughts in Amazonia.
3 RESULTS AND DISCUSSION
3.1 Structural Change
For 123 long-term mature forest Amazonian plots with tree-by-tree data there was a significant increase in above-ground biomass between the first measurement (median date 1991) and the last measurement before the 2005 drought (median
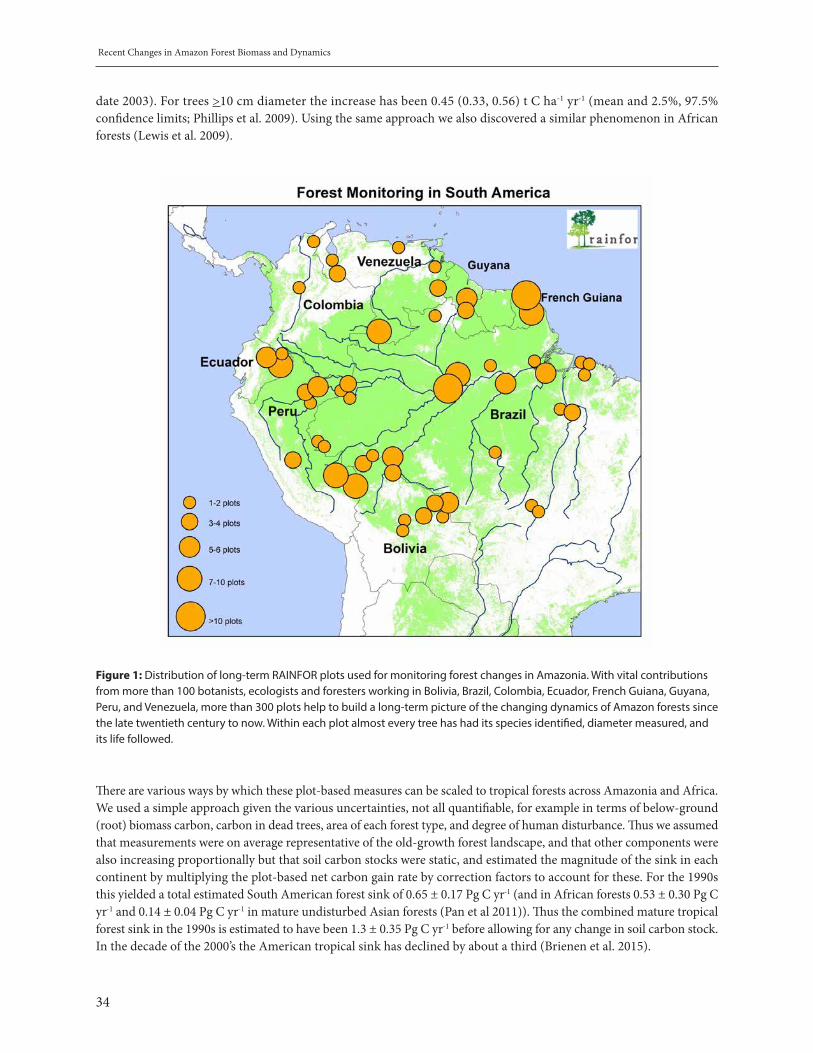
34
Recent Changes in Amazon Forest Biomass and Dynamics
date 2003). For trees >10 cm diameter the increase has been 0.45 (0.33, 0.56) t C ha-1 yr-1 (mean and 2.5%, 97.5% confidence limits; Phillips et al. 2009). Using the same approach we also discovered a similar phenomenon in African forests (Lewis et al. 2009).
Figure 1: Distribution of long-term RAINFOR plots used for monitoring forest changes in Amazonia. With vital contributions from more than 100 botanists, ecologists and foresters working in Bolivia, Brazil, Colombia, Ecuador, French Guiana, Guyana, Peru, and Venezuela, more than 300 plots help to build a long-term picture of the changing dynamics of Amazon forests since the late twentieth century to now. Within each plot almost every tree has had its species identified, diameter measured, and its life followed.
There are various ways by which these plot-based measures can be scaled to tropical forests across Amazonia and Africa. We used a simple approach given the various uncertainties, not all quantifiable, for example in terms of below-ground (root) biomass carbon, carbon in dead trees, area of each forest type, and degree of human disturbance. Thus we assumed that measurements were on average representative of the old-growth forest landscape, and that other components were also increasing proportionally but that soil carbon stocks were static, and estimated the magnitude of the sink in each continent by multiplying the plot-based net carbon gain rate by correction factors to account for these. For the 1990s this yielded a total estimated South American forest sink of 0.65 ± 0.17 Pg C yr-1 (and in African forests 0.53 ± 0.30 Pg C yr-1 and 0.14 ± 0.04 Pg C yr-1 in mature undisturbed Asian forests (Pan et al 2011)). Thus the combined mature tropical forest sink in the 1990s is estimated to have been 1.3 ± 0.35 Pg C yr-1 before allowing for any change in soil carbon stock. In the decade of the 2000’s the American tropical sink has declined by about a third (Brienen et al. 2015).

35
Recent Changes in Amazon Forest Biomass and Dynamics
The validity of these estimates depend on (i) measurement techniques; (ii) how representative the plots are of mature forests; and (iii) assumptions about the extent of mature forest remaining. However, they are consistent with independent evidence from recent inversion-based studies, showing the tropics are either carbon neutral or sink regions, despite widespread deforestation (Denman et al. 2007), and the large net sink in the terrestrial biosphere after accounting for other sources and sinks. Potentially unobserved large disturbances are much too rare to affect the inference from the plot network of a sustained, widespread biomass carbon sink into mature Amazon forests (Espirito-Santo et al. 2014).
3.2 Dynamic Changes
An alternative way of examining forest change is to look for changes in the processes (growth, recruitment, death), as well as the structure: have these forests simply gained mass, or have they become more or less dynamic too? For Amazonia we have measured the dynamics of forests in two ways. Firstly, we examined changes in stem population dynamics. By convention we estimated stem turnover between any two censuses as the mean of annual mortality and recruitment rates for the population of trees > 10 cm diameter (Phillips and Gentry 1994, Phillips et al. 1994, Phillips 1996). Secondly, we examined changes in biomass fluxes of the forest – in terms of growth of trees and the biomass lost with mortality events.
Among 50 mature forest plots across tropical South America with at least three censuses to 2002 (and therefore at least two consecutive monitoring periods that can be compared), we found that these key ecosystem processes - stem recruitment, mortality, and turnover, and biomass growth, loss, and turnover – all increased significantly when the first monitoring period is compared with the second (Lewis et al. 2004). Thus, over the 1980s and 1990s these forests on average became faster-growing and more dynamic, as well as bigger. The increases in the rate of the dynamic stem fluxes (growth, recruitment, mortality) were about an order of magnitude greater than the increases in the structural pools (above-ground biomass and stem density).
For the plots which have two consecutive census intervals we can separate them into two groups, one fast-growing and more dynamic (mostly in western Amazonia), and one slow-growing and much less dynamic (mostly in eastern and central Amazonia), which reflects the dominant macroecological gradient across Amazonia. Both groups showed increased stem recruitment, stem mortality, stand basal-area growth, and stand basal-area mortality, with greater absolute increases in rates in the faster-growing and more dynamic sites than in the slower-growing and less dynamic sites (Lewis et al. 2004), but proportional increases in rates were similar among forest types. It should be stressed that these results represent the mean response of all mature forests measured. Within the dataset naturally there are many individual plots showing different, individual responses. But when viewed as whole the permanent plot record from Neotropical mature forests shows increasing growth, recruitment, and mortality for at least two decades across different forest types and geographically widespread areas.
3.3 Biodiversity Compositional Changes
Changes in the structure and dynamics of tropical forests are unlikely to leave species and functional composition unchanged. Phillips et al. (2002) studied woody climbers (structural parasites on trees, also called lianas), which typically contribute 10-30% of forest leaf productivity, but are ignored in most stem monitoring studies. Across the RAINFOR plots of western Amazonia there was a concerted increase in the density, basal area, and mean size of lianas. Over the last two decades of the twentieth century, the density of large lianas relative to trees roughly doubled over the period, albeit from a low base. This was the first direct evidence that mature tropical forests are changing in terms of their life form composition. A few other studies have also considered whether there have been consistent changes in tree species composition in forests over the past two decades. Laurance et al. (2004) for example, working with a large cluster of plots north of Manaus, found that many faster-growing genera of canopy and emergent stature trees increased in basal area or density, and some slow-growing trees of the subcanopy and understory declined. Further studies are needed to determine whether comparable shifts in tree communities are occurring throughout Amazonia, and indeed to update the Amazon liana trajectory over the early 21st century.
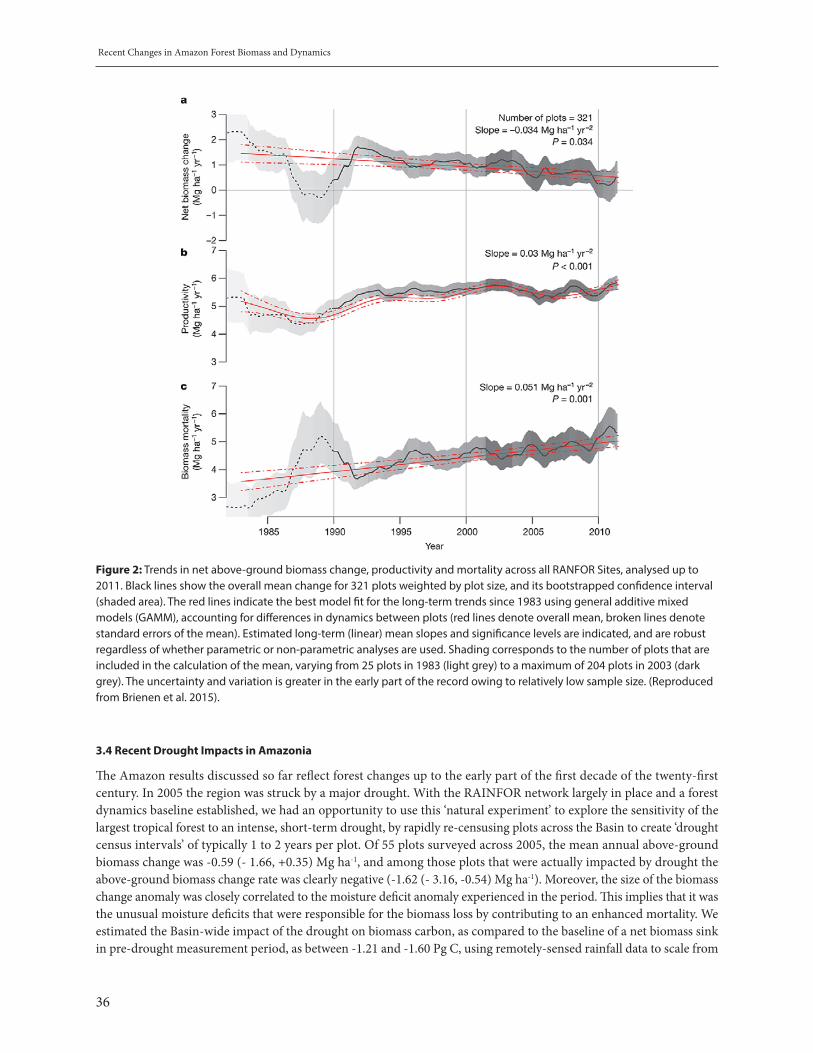
36
Recent Changes in Amazon Forest Biomass and Dynamics
Figure 2: Trends in net above-ground biomass change, productivity and mortality across all RANFOR Sites, analysed up to 2011. Black lines show the overall mean change for 321 plots weighted by plot size, and its bootstrapped confidence interval (shaded area). The red lines indicate the best model fit for the long-term trends since 1983 using general additive mixed models (GAMM), accounting for differences in dynamics between plots (red lines denote overall mean, broken lines denote standard errors of the mean). Estimated long-term (linear) mean slopes and significance levels are indicated, and are robust regardless of whether parametric or non-parametric analyses are used. Shading corresponds to the number of plots that are included in the calculation of the mean, varying from 25 plots in 1983 (light grey) to a maximum of 204 plots in 2003 (dark grey). The uncertainty and variation is greater in the early part of the record owing to relatively low sample size. (Reproduced from Brienen et al. 2015).
3.4 Recent Drought Impacts in Amazonia
The Amazon results discussed so far reflect forest changes up to the early part of the first decade of the twenty-first century. In 2005 the region was struck by a major drought. With the RAINFOR network largely in place and a forest dynamics baseline established, we had an opportunity to use this ‘natural experiment’ to explore the sensitivity of the largest tropical forest to an intense, short-term drought, by rapidly re-censusing plots across the Basin to create ‘drought census intervals’ of typically 1 to 2 years per plot. Of 55 plots surveyed across 2005, the mean annual above-ground biomass change was -0.59 (- 1.66, +0.35) Mg ha-1, and among those plots that were actually impacted by drought the above-ground biomass change rate was clearly negative (-1.62 (- 3.16, -0.54) Mg ha-1). Moreover, the size of the biomass change anomaly was closely correlated to the moisture deficit anomaly experienced in the period. This implies that it was the unusual moisture deficits that were responsible for the biomass loss by contributing to an enhanced mortality. We estimated the Basin-wide impact of the drought on biomass carbon, as compared to the baseline of a net biomass sink in pre-drought measurement period, as between -1.21 and -1.60 Pg C, using remotely-sensed rainfall data to scale from
37
Recent Changes in Amazon Forest Biomass and Dynamics
the relationship of biomass change data with relative drought intensity. This suggests a large regional impact (confirmed now by new, independent analyses, Gatti et al. 2014). The total carbon impact of the 2005 drought exceeds the annual net C emissions due to land-use change across the neotropics (0.5-0.7 Pg C) (Pan et al. 2011). Fuller understanding of the impacts of drought will require monitoring of forests through post-drought recovery and repeated droughts, such as the strong 2015-16 El Niño event.
3.5 What is Driving these Changes?
What could have caused the continent-wide increases in tree growth, recruitment, mortality, and biomass? Many factors could be invoked but overall the results show a clear fingerprint of increasing growth across tropical South America, probably caused by a long-term increase in resource availability (Lewis et al. 2004). According to this explanation, increasing resource availability stimulates growth. This accounts for the increase in stand basal-area growth. Because of increased growth, competition for limiting resources, such as light, water, and nutrients, increases. Over time some of the faster-growing, larger trees die, as do some of the ‘extra’ recruits, as the accelerated growth percolates through the system. This accounts for the increased losses from the system: mortality rates increase. Thus, the system gains biomass, while the losses lag some years behind, causing an increase in carbon storage.
The changes in biodiversity composition may also be related to increasing resource availability, as the rise in liana density may be either a direct response to rising resource supply rates, or a response to greater disturbance caused by higher tree-mortality rates. The changing tree composition in central-Amazonian plots (Laurance et al. 2004) is also consistent with increasing resource supply rates, as experiments show that faster-growing species are often the most responsive, in absolute terms, to increases in resource levels.
What environmental changes could increase the productivity of tropical forests? While there have been many changes in the tropical environment, the increase in atmospheric CO2 is the leading candidate, because of the clear long-term increase in CO2 concentrations, the key role of CO2 in photosynthesis, and the positive effects of CO2 fertilization on plant growth. However, some role for increased insolation, or aerosol-induced increased diffuse fraction of radiation, or rising temperatures increasing soil nutrient mineralization rates, cannot be ruled out (Malhi and Phillips 2004). The carbon dioxide explanation remains somewhat controversial still (c.f. discussion in Phillips and Lewis 2014), in part because of the great challenge in conducting ecosystem experiments of the impacts of CO2 fertilization at sufficient spatial and temporal scale. This process should not be confined to tropical forests - given the global nature of the CO2 increase and ubiquitous biochemistry of the plant response involved, we may expect to see the same phenomenon in other biomes. Indeed, increases in biomass and growth have indeed now been reported from every continent where foresters make measurements in enough sites (Pan et al. 2011).
3.6 The Future: How Vulnerable is Amazonia to Environmental Stress and Compositional Changes?
Our long-term observations show that mature forests in Amazonia, the world’s largest tract of tropical forest, experienced concerted changes in dynamics in recent decades. Such rapid alterations - regardless of the cause - were not anticipated by ecologists and raise concerns about other possible surprises that might arise as global changes accelerate in coming decades. On current evidence tropical forests are sensitive to changes in resource levels and will show further structural and dynamic changes in the future, as resource levels alter further, temperatures continue to rise, and precipitation patterns shift. The implications of such rapid changes for the world’s most biodiverse region could be substantial.
Mature Amazonian forests have evidently helped to slow the rate at which CO2 has accumulated in the atmosphere, so acting as a buffer to global climate change. The concentration of atmospheric CO2 has risen recently at an annual rate equivalent to ~4 Pg C; this would have been significantly greater without the tropical South American biomass carbon sink of 0.4-0.7 Pg C per year (and an African sink of 0.3-0.5 Pg C per year). This subsidy from nature could be a relatively short-lived phenomenon. Given that a 0.3% annual increase in Amazonian forest biomass roughly compensates for the entire fossil-fuel emissions of western Europe (or the deforestation in Amazonia), a switch of mature tropical forests from a moderate carbon sink to even a moderate carbon source would impact on global climate and human welfare. The ~0.3% annual increase in carbon storage represents the difference between two much larger values: stand-level growth (averaging ~2%) and mortality (averaging ~1.7%), so a small decrease in growth or a sustained increase in mortality

38
Recent Changes in Amazon Forest Biomass and Dynamics
would shut the sink down. There are several mechanisms by which such a switch could occur, apart from the obvious and immediate threats posed by land use change and associated disturbances by fragmentation and fire. I discuss these briefly.
Moisture Stress: Climate change alters rainfall patterns. There are critical thresholds of water availability below which tropical forests cannot persist and are replaced by savanna systems, and these thresholds will respond to rising temperatures which increase evaporation. How sensitive tropical forests are to extreme temperatures, particularly in the context of rising atmospheric CO2 concentration, is a subject of active research, reviewed elsewhere (Lloyd and Farquhar 2008).
The 2005 drought provides direct evidence of the potential for intense dry periods to impact rainforest vegetation. However, it remains to be seen whether droughts are powerful and frequent enough to permanently shift the dominant regime of biomass gains witnessed across mature tropical forests wherever they have been extensively monitored. The 1998 El Niño drought was equally strong in parts of Amazonia, but its impacts are not distinguishable from the signal of increased biomass and growth over the ~5 year mean interval length available for plots at that time (Fig. 2), implying a rapid recovery. We expect therefore that only frequent, multiple droughts would cause the sustained increases in mortality needed to turn the long-term carbon sink in mature forest into a source. This may now be happening.
In 2010 a new drought affected the Amazon forest, again dropping some rivers to record lows. Our recent, long-term analysis from an even larger RAINFOR plot dataset (Brienen et al. 2015) found evidence of a progressive decline in the net Amazon sink (Fig. 2), in spite of the long-term growth gains. The impacts of the 2015-16 El Niño event are yet to be measured.
Photosynthesis/ respiration changes: Forests remain sinks as long as carbon uptake associated with photosynthesis exceeds the losses from respiration. Under the simplest scenario of a steady rise in forest productivity over time, it is predicted that even mature forests would remain a carbon sink for decades (e.g. Lloyd and Farquhar 1996). However, the recent increases in productivity, apparently caused by continuously improving conditions for tree growth, cannot continue indefinitely: if CO2 is the cause, trees will become CO2-saturated (limited by another resource) sooner or later.
Rising temperatures could also reduce the sink, or cause forests to become a source. Warmer temperatures increase the rates of virtually all chemical and biological processes in plants and soils, until temperatures reach inflection-points where enzymes and membranes lose functionality. There is some evidence that the temperatures of leaves at the top of the canopy, on hot days, may be reaching such inflection-points around midday at some locations. Canopy-to-air vapour deficits and stomatal feedback effects may also be paramount in any response of tropical forest photosynthesis to future climate change (Lloyd et al. 1996). Simulations suggest that the indirect effect of rising temperatures on photosynthesis via stomatal closure is the dominant negative impact on tropical forest growth (Lloyd & Farquhar 2008), but that this is currently more than offset by increases in photosynthesis from increasing atmospheric CO2. Warmer temperatures also mean higher respiration costs, which will also impact on the ability of plants to maintain a positive carbon balance in the future. Understanding these complex relationships between temperature changes and their impacts on respiration and photosynthesis, plus the impact of rising atmospheric CO2 on tree growth is critical, and are areas of very active research (and debate).
Carbon losses from respiration will almost certainly increase as air temperatures continue to increase. The key question is what form this relationship takes. Carbon gains from photosynthesis cannot rise indefinitely, and will almost certainly reach an asymptote. Thus, I conclude that the sink in mature tropical forests is bound to diminish, and possibly even reverse. The more catastrophic outcomes of large-scale biomass collapse indicated in some models appear very unlikely, but cannot be ruled out.
Compositional change: Biodiversity change has inevitable consequences for climate change because different plant species vary in their ability to store and process carbon and different plant species will benefit and decline as global environmental changes unfold. Yet most models that project the future carbon balance in Amazonia (and future climate-change scenarios) make no allowance for changing forest composition. Representing biodiversity is challenging, because of the computational complexities in integrating ecological processes into ecophysiology-driven models, and because the ecological data themselves are sparse. Representing composition better, and its potential for change, is important. Large changes in tree communities could lead to net losses of carbon from tropical forests (Phillips & Gentry 1994). One way this could happen is a shift to faster-growing species, driven by increasing tree mortality rates and gap formation

39
Recent Changes in Amazon Forest Biomass and Dynamics
(Phillips & Gentry 1994). Fast-growing species have less dense wood, and hence less carbon. The potential scope for such impacts of biodiversity changes on carbon storage is highlighted by Bunker et al. (2005), who explored various biodiversity scenarios based on the tree species at Barro Colorado Island: if slower-growing tree taxa were lost from an accelerated, liana-dominated forest, as much as one-third of the carbon storage capacity of the forest could be lost. In Amazonia a small and sustained basin-wide annual decrease in mean wood specific gravity could potentially cancel out the carbon sink effect. Currently, the more dynamic forests in the west of Amazonia have ~20% less dense wood than the slower-growing forests of the east; because these faster-growing western forests also have lower basal area, the differences in terms of biomass carbon stored are somewhat greater still. Concerted compositional changes driven by greater resource supply, increased mortality rates, and gains in the proportion of faster-growing trees which escape lianas, could therefore shut down the carbon sink function of tropical forests earlier than ecophysiological analyses predict.
4 CONCLUSION
Long-term, high-quality, tree-centred monitoring is critical for any nation wanting to understand the behaviour of forests, to report it to the wider world, and to respond to it with actions including in terms of protected area strategy. The dominant monitoring challenge now is to understand how biodiversity and ecosystem processes are responding to climate change. Some changes may be slow and gradual, some will be rapid. We may predict some with high confidence (eg more montane species will become progressively reduced and restricted), but many surprises are likely. What then would a nation-wide forest monitoring system look like fit for purpose in a hyper-diverse, carbon-rich country with a major share of the Amazon, such as Peru?
How to work? Such a network needs to embrace science-led monitoring to work. This requires a long-term funding commitment, fully open-access with data-sharing built in from the start, and an emphasis on hands-on training in field and lab and international exchanges (into Peru, out of Peru, exchanges with Amazon countries, exchanges with Europe). International help can be intense at first, but a growing level of scientific leadership by the country should be built-in to the plan. Rigorous data quality is essential. Standard botanical and forestry approaches are needed, always well integrated, as are careful soil inventory and analysis. The single biggest challenge is timely, accurate species identification of trees, and thus herbaria need to be involved too, and young taxonomists trained. Selected plots should become ‘long-term living laboratories’ – many other exciting and important work can be added on, such as ethnobotanical surveys, intensive carbon cycle studies, soil mycorrhizae, remote sensing calibration/validation, plant and animal DNA sampling, invertebrate surveys, training sites for students, etc.
Nations like Peru can benefit directly from involvement in international collaborations like RAINFOR, but current efforts are insufficient. Much greater sampling in the vast difficult-to-access regions of Amazonia is clearly needed in the future to reduce uncertainty due to incomplete spatial coverage, with a purposeful effort to fill the large spatial gaps. Additionally, better integration with LiDAR approaches (which measure forest height) is clearly also desirable. I expect that the most cost-effective strategy for monitoring the more remote remaining tropical forests will combine (1) gap-filling the monitoring networks where possible - with locally randomised plots -, with (2) extensive remote sensing (viz LiDAR, radar), with the potential power of remote sensing techniques for scaling-up very clear. The need for careful ground-based assessments to permit calibrating and validating forests’ remotely-sensed canopy properties in terms of productivity, biomass, and biodiversity, and change, is equally obvious.
Where to work? Establishing quality, repeat census plots along the key geographic gradients is essential – thus in Peru, replicated sampling of the elevation gradients from high Andes to low Amazon, and the precipitation seasonality gradient from North to South. These need to be tied to protected areas – thus the monitoring network helps Peru fulfil CBD obligations of assessing the effectiveness of its protected areas. Finally, researchers need to co-ordinate efforts too for long-term monitoring of directly impacted forests, and of key resources for livelihoods – e.g. swamps of aguaje (Mauritia flexuosa), and stands of castaña (Bertholletia excelsa). A skeleton framework for much of this already exists with RAINFOR and colleagues (eg RC Sira, PN Yanachaga-Chemillen, PN Manu). But many new plots will need to be established to fill environmental and spatial gaps.
40
Recent Changes in Amazon Forest Biomass and Dynamics
In Sum: By carefully tracking the lives, deaths, and identities of trees at hundreds of plots it has been possible over the past three decades to build a preliminary understanding of how the world’s mature tropical forests have been changing. The picture that emerges is at once both surprising but, with the benefit of hindsight perhaps not unexpected. Thus, in experiencing accelerated growth, mortality, and generally increasing biomass, the tropical biome has been responding for many years to the large-scale but slow-acting drivers that until recently were unfamiliar to ecologists. Gaining an authoritative understanding of how and why forest biodiversity and carbon are changing in the Anthropocene remains a huge challenge. Repeated, standardised, careful, and adequately replicated on-the-ground measurements will be a key contributor to making significant progress toward this goal.
5 ACKNOWLEDGMENTS
The results summarized here depended on contributions from numerous research partners, assistants and rural communities, as well as funding agencies, most of whom are acknowledged specifically in Brienen et al. (2015). I thank them all.
6 REFERENCES
Baker TR, OL Phillips, Y Malhi et al. (2004) Increasing biomass in Amazonian forest plots. Philosophical Transactions of the Royal Society, Series B 359: 353-365.
Brienen T, OL Phillips et al. (2015) Long-term decline of the Amazon carbon sink. Nature 519: 344-8.
Butt, N, Malhi, Y, New M, et al. (2012) Shifting dynamics of climate-functional groups in old-growth Amazonian forests. Plant Ecology & Diversity 7: 267-279
Denman K, G Brasseur, A Chidthaisong et al. (2007) Couplings Between Changes in the Climate System and Biogeochemistry. In: Climate Change 2007: The Physical Science Basis. Contribution of Working Group I to the Fourth Assessment Report of the Intergovernmental Panel on Climate Change (S Solomon, D Qin, M Manning et al. (eds)). CUP, Cambridge, UK and New York, NY, USA
Doughty C & Goulden M (2008) Are tropical forests near a high temperature threshold? Journal of Geophysical Research-Biogeosciences, 113, G00B07.
Espírito-Santo F, M Gloor, M Keller et al. (2014) Size and frequency of natural forest disturbances and the Amazon forest carbon balance. Nature Communications 5.
Fauset S, Baker T, Lewis S et al. (2013) Drought induced shifts in the floristic and functional composition of tropical forests in Ghana. Ecology Letters 15: 1120-1129.
Gatti L, Gloor M, Miller J et al. (2014) Drought sensitivity of Amazonian carbon balance revealed by atmospheric measurements. Nature 506: 76-80.
Laurance W (2004) Forest–climate interactions in fragmented tropical landscapes. Philosophical Transactions of the Royal Society, Series B 359: 345-352.
Laurance W, A Oliveira, S Laurance et al. (2004) Pervasive alteration of tree communities in undisturbed Amazonian forests. Nature 428: 171-174.
Lewis SL, OL Phillips, T Baker et al. (2004) Concerted changes in tropical forest structure and dynamics: evidence from 50 South American long-term plots. Phil. Trans. Roy. Soc., Ser. B 359: 421-436.
Lewis SL, G Lopez-Gonzalez, B Sonké et al. (2009) Increasing carbon storage in intact African tropical forests. Nature 477: 1003-1006.

41
Recent Changes in Amazon Forest Biomass and Dynamics
Lloyd J, G Farquhar (1996) The CO2 dependence of photosynthesis, plant growth responses to elevated atmospheric CO2 concentrations & their interaction with plant nutrient status. Functional Ecology 10: 4-32.
Lloyd J, J Grace, AC Miranda et al. (1996) A simple calibrated model of Amazon rainforest productivity based of leaf biochemical properties. Plant Cell & Environment 18: 1129-1145.
Lloyd J, Farquhar GD (2008) Effects of rising temperatures and (CO2) on the physiology of tropical forest trees. Phil. Trans. Roy. Soc., Ser. B 363: 1811-1817.
Lopez-Gonzalez G, Lewis S, Burkitt M, Phillips O (2011) ForestPlotsnet: a web application & research tool to manage and analyse tropical forest plot data. Journal of Vegetation Science 22: 610-3.
Malhi Y & OL Phillips (2004) Tropical forests and global atmospheric change: a synthesis. Philosophical Transactions of the Royal Society, Series B 359: 549-55.
Pan Y, R Birdsey, J Fang et al. (2011) A large and persistent carbon sink in the world’s forests. Science 333: 988-93.
Phillips OL (1996) Long-term environmental change in tropical forests: increasing tree turnover. Environmental Conservation 23: 235-48.
Phillips OL, L Aragão et al (2009) Drought sensitivity of the Amazon rainforest. Science 323:1344-7.
Phillips OL and AH Gentry (1994) Increasing turnover through time in tropical forests. Science 263: 954-8.
Phillips OL, P Hall, AH Gentry et al. (1994) Dynamics and species richness of tropical forests. Proceedings of the National Academy of Sciences (USA) 91: 2805-9.
Phillips OL & S Lewis (2014) Evaluating the tropical forest carbon sink. Gl. Change Biol. 7: 2039–41.
Phillips OL, Y Malhi, N Higuchi et al. (1998) Changes in the carbon balance of tropical forest: evidence from long-term plots. Science 282: 439-42.
Phillips OL, RV Martínez, L Arroyo et al. (2002) Increasing dominance of large lianas in Amazonian forests. Nature 418: 770-774.
42
Variability of Ocean Ecosystem Around South America (VOCES)
VARIABILITY OF OCEAN ECOSYSTEM AROUND SOUTH AMERICA (VOCES)
Sara Purca1, Jose H. Muelbert2, Alberto R. Piola3
1. Instituto del Mar del Perú (IMARPE), [email protected], 2. Universidade Federal do Rio Grande (FURG), [email protected], 3. Servicio de Hidrografía Naval (SHN), Universidad de Buenos Aires, and UMI/IFAECI-CONICET, [email protected]
ABSTRACT
The Large Marine Ecosystems (LME) around South America are highly productive, and diverse, and play an important role in the economy and society of the surrounding countries. These environments are under the effect of climate change, but little is known about how variability at different scales influences their biodiversity and the abundance of the exploited populations. Our work suggests that biodiversity can enhance the resilience of ecosystem structure to environmental trends around South America three Large Marine Ecosystems (LMEs).
INTRODUCTION
Coastal marine ecosystems are significant contributors of the total global carbon sequestration by the ocean (Bauer et al., 2013) and also contribute to more than 80% of the global fish catch (Agardy & Alder. 2005). Thus, coastal marine ecosystems are a critically important component of the living planet. Marine ecosystems are under the increasing stress of natural and anthropogenic climate variability (Malone et al., 2014). The goal of the IAI-CNR3070 project is to assess the impact of climate variability- both natural and anthropogenic- on the Humboldt, Patagonia, and South Brazil Large Marine ecosystems (Figure 1). These ecosystems are among the most productive of the Southern hemisphere, sustain more than 20% of the global fish catch, host unique biodiversity and absorb CO2 at rates comparable with the most significant uptake regions in the World Ocean. The work presented at the Symposium Biodiversity and Climate Change, contributions from science to policy for sustainable development held in Lima, 27th and 28th November 2014 suggested the biodiversity can enhance the resilience of ecosystem structure to environmental trends around South America three Large Marine Ecosystems (LMEs). Furthermore, habitat modifications and management practices that change functional diversity and functional composition are likely to have large impacts on ecosystem processes (Tilman et al. 1997), particularly in coastal areas (Diaz and Rosenberg, 2008).
THE LARGE MARINE ECOSYSTEMS AROUND SOUTH AMERICA
The continental shelf regions surrounding South America can be divided in 3 Large Marine Ecosystems (LMEs): the Humboldt Current, the Patagonian Shelf, and the South Brazil Shelf (Figure 1). The VOCES project focuses on the interaction between these ecosystems and their interaction with the adjacent oceans. Combined, these regions are significant contributors to biodiversity and to the global primary production, and exceed 20% of the global fish catch, most of which is used for direct human consumption. We have scant understanding of how these regions will respond to predicted changes of the climate system and, in turn, how they will feed back onto the global climate system. Changes in these ecosystems should be particularly important because South America is the only land mass in direct contact with the Southern Ocean and hence the only source of continental and sediment-derived material for the fertilization of the upper layer in this component of the global circulation (Piola et al. 2013). Furthermore, these ecosystems span from tropical to sub-Antarctic regions and yield considerable diverse environments. The energy flux to upper trophic levels along the west coast eventually leads to the largest fishery in the global ocean. Equatorward flows of nutrient-rich subantarctic waters along the west and east coasts of the continent, namely the Humboldt Current, and the Malvinas Current are major sources of subpolar nutrients to lower latitudes. Along the Pacific margin, nutrients are drawn into

43
Variability of Ocean Ecosystem Around South America (VOCES)
the photic layer by coastal wind driven upwelling (e.g. Chavez and Messié, 2009) while along the Atlantic coast, shelf break upwelling (Matano and Palma, 2008; Matano et al., 2010) and tidal and wind stirring (Palma et al., 2004; 2008) near shore are thought to be the main nutrient flux drivers (Acha et al. 2004; Romero et al., 2006).
Figure 1: The large marine ecosystems (LMEs) off southern South America: Humboldt (HLME), Patagonia (PLME) and Southern Brazil (SBLME). The background colors depict the austral spring satellite derived surface chlorophyll-a concentration (in mg/m3) from SeaWiFS. The surface and subsurface (dashed) ocean circulation is shown schematically by arrows as follows: ACC: Antarctic Circumpolar Current, BC: Brazil Current, CHC: Cape Horn Current, EUC: Equatorial Undercurrent, MC: Malvinas Current, PCC: Peru-Chile Current or Humboldt Current, SEC: South Equatorial Current, SESC: South Equatorial Subsurface Current, SECC: South Equatorial Counter Current, SPC: South Pacific Current. Also indicated are the straits of Le Maire (LM) and Magellan (MS) and the Subtropical Shelf Front (STSF).
THE HIGH PRODUCTIVITY ALONG HUMBOLDT LME
The offshore circulation in the west is characterized by the poleward flow of the Peru-Chile undercurrent, which is the main source for upwelled waters in northern Chile and Peru. Evidence of recent decrease trends in sea surface temperature (SST) in the Humboldt Current LME suggests coastal upwelling intensification as a response to global warming (Gutierrez et al. 2011), in addition, the chlorophyll-a positive trends remained along Peruvian coast, all over the continental shelf and slightly beyond in central Peru (Demarcq 2009). As a result, a conceptual model of temporal
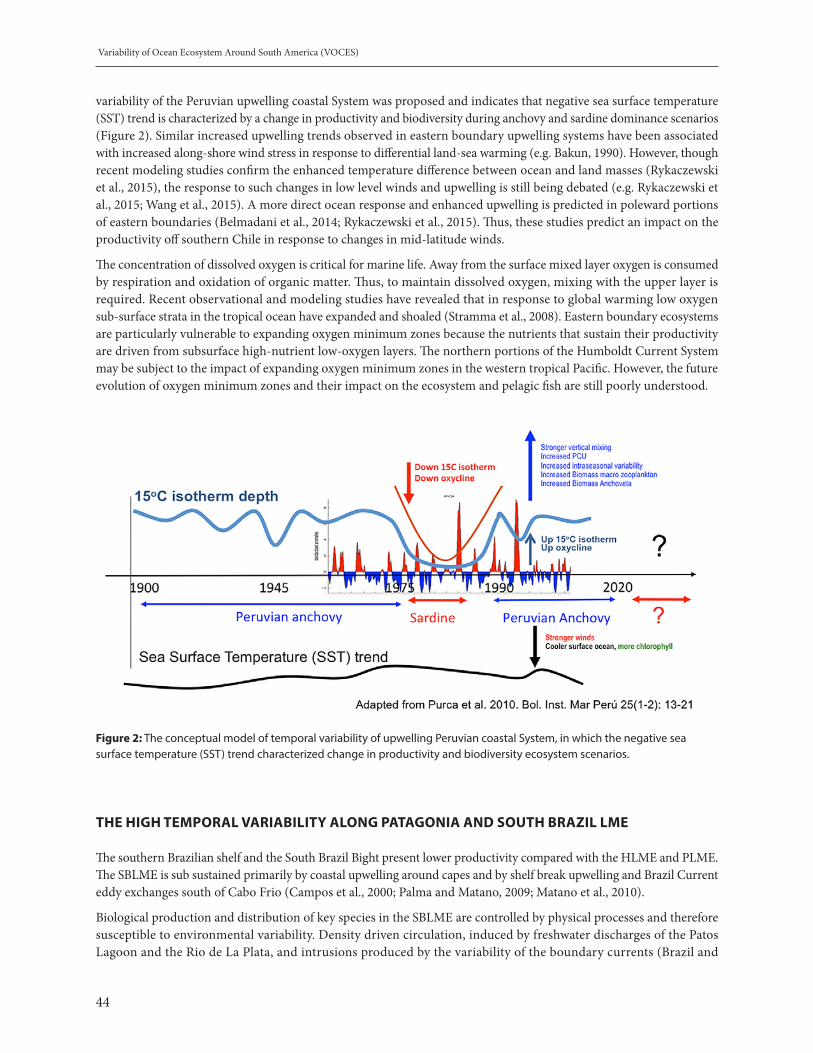
44
Variability of Ocean Ecosystem Around South America (VOCES)
variability of the Peruvian upwelling coastal System was proposed and indicates that negative sea surface temperature (SST) trend is characterized by a change in productivity and biodiversity during anchovy and sardine dominance scenarios (Figure 2). Similar increased upwelling trends observed in eastern boundary upwelling systems have been associated with increased along-shore wind stress in response to differential land-sea warming (e.g. Bakun, 1990). However, though recent modeling studies confirm the enhanced temperature difference between ocean and land masses (Rykaczewski et al., 2015), the response to such changes in low level winds and upwelling is still being debated (e.g. Rykaczewski et al., 2015; Wang et al., 2015). A more direct ocean response and enhanced upwelling is predicted in poleward portions of eastern boundaries (Belmadani et al., 2014; Rykaczewski et al., 2015). Thus, these studies predict an impact on the productivity off southern Chile in response to changes in mid-latitude winds.
The concentration of dissolved oxygen is critical for marine life. Away from the surface mixed layer oxygen is consumed by respiration and oxidation of organic matter. Thus, to maintain dissolved oxygen, mixing with the upper layer is required. Recent observational and modeling studies have revealed that in response to global warming low oxygen sub-surface strata in the tropical ocean have expanded and shoaled (Stramma et al., 2008). Eastern boundary ecosystems are particularly vulnerable to expanding oxygen minimum zones because the nutrients that sustain their productivity are driven from subsurface high-nutrient low-oxygen layers. The northern portions of the Humboldt Current System may be subject to the impact of expanding oxygen minimum zones in the western tropical Pacific. However, the future evolution of oxygen minimum zones and their impact on the ecosystem and pelagic fish are still poorly understood.
Figure 2: The conceptual model of temporal variability of upwelling Peruvian coastal System, in which the negative sea surface temperature (SST) trend characterized change in productivity and biodiversity ecosystem scenarios.
THE HIGH TEMPORAL VARIABILITY ALONG PATAGONIA AND SOUTH BRAZIL LME
The southern Brazilian shelf and the South Brazil Bight present lower productivity compared with the HLME and PLME. The SBLME is sub sustained primarily by coastal upwelling around capes and by shelf break upwelling and Brazil Current eddy exchanges south of Cabo Frio (Campos et al., 2000; Palma and Matano, 2009; Matano et al., 2010).
Biological production and distribution of key species in the SBLME are controlled by physical processes and therefore susceptible to environmental variability. Density driven circulation, induced by freshwater discharges of the Patos Lagoon and the Rio de La Plata, and intrusions produced by the variability of the boundary currents (Brazil and

45
Variability of Ocean Ecosystem Around South America (VOCES)
Malvinas Currents) are efficient mechanisms for retention of Engraulis anchoita larvae (Vaz et al., 2007). The inflow of low salinity water increases primary productivity and the occurrence of anchovies within the area (Costa et al., 2016). Mesoscale physical processes influence the distribution and composition of ichthyoplankton on the southern Brazilian shelf break (Franco et al., 2006), and both cross-shelf and latitudinal gradients are important to determine the large-scale distribution of larval fish species (Macedo-Soares et al., 2014). Changes in sea surface temperature seem to control life cycle patterns and species migration timing and routes (Muelbert and Sinque, 1996; Lemos et al., 2014). Recent studies have indicated that the southern Brazilian shelf LME is influenced by the Pacific Decadal Oscillation (PDO) and by the Antartic Oscillation (AAO) (Soares et al., 2014) suggesting that climate change could have a significant impact on biological processes in this ecosystem.
The salinity distribution around southern South America suggests a strong interaction between the SE Pacific and SW Atlantic shelves. The ocean currents and mixing that mediate this interaction are still not well understood. The South Atlantic waters appear to be derived primarily from the Le Maire Strait and the region east of Burdwood Bank. However, the lowest salinity waters require a direct influence of the melt and runoff waters from southern coast of the SE Pacific through the Straits of Magellan. A low salinity plume originated in the eastern mouth of the Straits extends northeastward on the Atlantic side reaching beyond 43°S (e.g. Palma and Matano, 2009). These inter-ocean fluxes between the Pacific and Atlantic shelves suggest that the southernmost portions of the HLME and the PLME may form an integrated ecoregion around the southern tip of South America.
In contrast with the Pacific coast, the Atlantic side of southern South America is characterized by a wide continental shelf occupying about a million squared kilometers. Also in contrast with the ecosystems off Chile and Peru, the intense biological productivity of the Atlantic shelf is sustained by a variety of processes. The sources of nutrients to the upper layer are associated with tidal mixing near shore, relatively intense wind mixing throughout the shelf, and shelf break upwelling along the shelf offshore edge. All these forcings are significant south of about 40°S, but decay further north (e.g. Palma et al., 2008). The shelf productivity presents a sharp spring bloom (e.g. Acha et al., 2004; Romero et al. 2006), and a moderate decay later in the season as nutrients are consumed by the growth of phytoplankton. However, near the tidal fronts and along the shelf break the plant growth is high until late fall in response to the quasi-permanent nutrient injection. The shelf productivity expands from phytoplankton to top predators, including commercially significant fisheries, marine birds and mammals.
The significant biological productivity over the Patagonia shelf feeds from dissolved carbon in the upper ocean layer and therefore promotes substantial uptakes of atmospheric carbon dioxide (e.g. Bianchi et al., 2005; 2009). As a result of the so-called biological pump of CO2, on an annual mean the Patagonia continental shelf acts a net sink of atmospheric CO2. The fate of the carbon absorbed over the shelf is not known, but it is hypothesized that a fraction is stored in the sediments and a fraction is exported offshore. Both these processes combine to prevent the increase of total inorganic carbon concentration in the PLME. The future evolution of this process critically depends on the water temperature, which determines the CO2 solubility. In addition, the efficiency of the ocean uptake process is strongly dependent on the intensity of the low level winds. Thus, it is necessary to better understand the CO2 uptake to project its future evolution.
In the Atlantic, around 34oS the subantarctic shelf waters encounter subtropical shelf waters off Uruguay and southern Brazil, creating a sharp transition and both cores presumably veer offshore. It is unclear how these productive ecosystems exchange mass, nutrients and species among them and with the neighboring deep ocean and the way they will respond to changes in circulation and the wind field (Piola et al., 2000, 2008). This front, referred to as the Subtropical Shelf Front (STSF, Figure 1), marks the natural boundary between the Patagonia and Southern Brazil LMEs. Numerical models indicate that the location of the STSF is set by the latitude of northernmost penetration of the Malvinas Current (e.g. Palma et al., 2008), thus, the separation of the Malvinas and Brazil Currents from the continental shelf break. Theoretical arguments and observations indicate this latitude is set by a complex combination of the large-scale wind forcing and the relative strength of the currents. These large-scale forcings may therefore also set the location of the shelf front. The southern Brazilian shelf is also profoundly influenced by freshwater outflow from the Rio de La Plata and Patos Lagoon Estuary (see Campos et al., 2008). The outflow of continental freshwater creates a nutrient favorable environment constrained by the Rio de la Plata Plume Front that influences primary production, distribution of zooplankton species and occurrence and abundance of larval fish (Muelbert et al., 2008). Long term discharge changes from these systems will

46
Variability of Ocean Ecosystem Around South America (VOCES)
have a profound impact on biological production and biodiversity in the southern Brazilian Shelf. The STSF separates planktonic groups and influences biological production during summertime when the presence of freshwater over the shelf decreases (Muelbert et al., 2008). The STSF is probably a barrier to the along-shore dispersion of organisms since it is marked by a strong environmental gradient, and it is not clear yet how long term changes due to climate variability will impact biodiversity. Moreover, recent studies suggest that the STSF also influences the distribution of marine megafauna, such as turtles, sea lions and seabirds (Gonzalez Carman et al., 2016).
THE FUTURE SCENARIOS OCEAN ECOSYSTEMS AROUND SOUTH AMERICA IN THE CONTEXT OF BIODIVERSITY AND CLIMATE CHANGE
At least some of the most important commercial species take advantage of high biological production at the shelves, and at the same time avoid being exported to the biologically poorer oceanic environment. The larvae and plankton export mechanisms to the oceanic realm and their influence on the interannual variability in the recruitment of keystone species are unknown. Near surface salinity distributions derived from recent satellite observations and numerical simulations revealed that a substantial fraction of low salinity Patagonia shelf waters are exported to the deep ocean close to the separation of the Brazil and Malvinas currents from the slope (Guerrero et al., 2014; Matano et al., 2014; Strub et al., 2015). This transfer of shelf to deep ocean waters may have a strong impact on the survival of planktonic stages of marine organisms and may also be a conduit to drive shelf dissolved organic and inorganic carbon to the deep ocean. Once shelf waters are driven towards these swift offshore flows the return to the shelf is unlikely since the mean flow is mostly towards the ocean interior. Thus, the large-scale circulation over the productive PLME that emerges from our studies can be summarized by a net inflow from the south around 54°S and a net export around 38-33°S.
The surface winds play a key role in the control of productivity and biodiversity of the LME around South America. Winds control the intensity and seasonality of the eastern boundary upwelling, modulate the vertical mixing, determine horizontal transport in surface waters, the circulation and the uptake of atmospheric carbon over the southwest Atlantic shelf. Regions subject to weaker winds will most likely be associated with warmer surface waters, increased stratification, decreased in horizontal transport, lower primary production and reduced carbon uptake. In contrast, increased wind intensity will reduce vertical stratification, increase the nutrient fluxes from subsurface layers, increase horizontal transport, enhance primary productivity and carbon uptake.
In addition, an improved knowledge of the exchange processes between continents and these continental shelves and the deep ocean is essential to better understand, model and predict the future evolution of productivity and biodiversity of the marine environment in response to climate change.
REFERENCES
Acha E.M., Mianzan, H., Guerrero R., Favero M., Bava, J. (2004) Marine fronts at the continental shelves of austral South America. Physical and ecological processes. Journal of Marine Systems, 44, 83-105.
Agardy, T., Alder J. (2005) Coastal Systems, Chapter 19, Millennium Ecosystem Assessment. Current State & Trends Assessment, 513-549
Bakun, A. (1990) Global climate change and intensification of coastal ocean upwelling. Science, 247(4939), 198-201.
Belmadani, A., Echevin, V., Codron, F., Takahashi, K., and Junquas, C. (2014) What dynamics drive future wind scenarios for coastal upwelling off Peru and Chile?. Climate Dynamics, 43(7-8), 1893-1914.
Bianchi, A.A., D. Ruiz-Pino, H. Isbert Perlender, A. Osiroff, V. Segura, V. Lutz, M. Luz Clara, C.F. Balestrini, & A.R. Piola, (2009) Annual balance and seasonal variability of sea-air CO2 fluxes in the Patagonia Sea: Their relationship with fronts and chlorophyll distribution, Journal of Geophysical Research, 114, C03018, doi:10.1029/2008JC004854.
Bianchi, A. A., L. Bianucci, A. R. Piola, D. R. Pino, I. Schloss, A. Poisson, & C. F. Balestrini, (2005) Vertical stratification and air-sea CO2 fluxes in the Patagonian shelf, Journal of Geophysical Research, 110, C07003, doi: 10.1029/2004JC002488.
47
Variability of Ocean Ecosystem Around South America (VOCES)
Bauer, J. E., W.-J. Cai, P. A. Raymond, T. S. Bianchi, C. S. Hopkinson, & P.A.G. Regnier, (2013) The changing carbon cycle of the coastal ocean, Nature, 504, 61–70.
Campos, E. J., Velhote, D., and da Silveira, I. C., (2000) Shelf break upwelling driven by Brazil Current cyclonic meanders. Geophysical Research Letters, 27(6), 751-754.
Campos, E. J., Piola, A.R., & Matano, R.P. (2008) Synoptic characterization of the Southeastern South American Continental shelf: The NICOP/Plata Experiment. Continental Shelf Research, 28, doi: 10.1016/j.csr.2008.03.007.
Chavez, F. P., & Messié, M. (2009) A comparison of eastern boundary upwelling ecosystems. Progress in Oceanography, 83(1), 80-96.
Costa, P. L., P.R. C. Valderrama, & L. A. S. P. Madureira. (2016) Relationships between environmental features, distribution and abundance of the Argentine anchovy, Engraulis anchoita, on the South West Atlantic Continental Shelf. Fisheries Research, 173: 229–235, doi: 10.1016/j.fishres.2015.07.008.
Demarcq, H. (2009) Trends in primary production, sea surface temperature and wind upwelling systems (1998-2007) Progress in Oceanography, 83(1), 376-385.
Diaz, R.J. & R. Rosenberg. (2008) Spreading Dead Zones and Consequences for Marine Ecosystems. Science 321, 926. DOI: 10.1126/science.1156401.
Franco, B.C., Muelbert, J. H. & Mata, M.M. (2006) Mesoscale physical processes and the distribution and composition of ichthyoplankton on the southern Brazilian shelf break. Fisheries Oceanography, 15(1): 37-43.
González Carman, V., Mandiola, A., Alemany, D., Dassis,M., Seco Pon, J.P., Prosdocimi, L., Ponce de León, A.,Mianzan, H., Acha, E.M., Rodríguez, D., Favero,M., & Copello, S., (2016) Distribution of megafaunal species in the Southwestern Atlantic: key ecological areas and opportunities for marine conservation, ICES Journal of Marine Science, doi: 10.1093/icesjms/fsw019, in press.
Guerrero R.A., A.R. Piola, H. Fenco, R.P. Matano, V. Combes, Yi Chao, C. James, E.D. Palma, M. Saraceno & P.T. Strub, (2014) The salinity signature of the cross-shelf exchanges in the Southwestern Atlantic Ocean: Satellite observations, J. Geophys. Res. Oceans, 119, 7794-7810, doi: 10.1002/2014JC010113.
Gutiérrez, D., I. Bouloubassi, A. Sifeddine, S. Purca, K. Goubanova, M Graco, D. Field, L Mejanelle, F Velazco, A Lorre, R. Salvatteci, D. Quispe, G. Vargas, B Dewitte, and L. Ortlieb. (2011) Coastal cooling and increased productivity in the main upwelling zone off Peru since the mid-twentieth century. Geophys. Res. Lett., 38, L07603, doi:10.1029/2010GL046324.
Lemos, V. M., Varela, A. S., Schwingel, P. R., Muelbert, J. H. and Vieira, J. P. (2014) Migration and reproductive biology of Mugil liza (Teleostei: Mugilidae) in south Brazil. Journal of Fish Biology, 85, 671-687.
Macedo-Soares, L. C. P., Garcia, C. A. E., Freire, A. S. and Muelbert, J. H. (2014) Large-Scale Ichthyoplankton and Water Mass Distribution along the South Brazil Shelf. Plos One, 9: e91241.
Malone, T.C., DiGiacomo, P.M., Gonçalves, E., Knap, A.H., Talaue–McManus, L., de Mora, S., (2014) A global ocean observing system framework for sustainable development, Marine Policy, 43, 262-272.
Matano, R. P. & Palma, E. D., (2008) On the upwelling of downwelling currents. Journal of Physical Oceanography, 38(11), 2482-2500.
Matano, R.P., E.D. Palma & A.R. Piola, (2010) The influence of the Brazil and Malvinas Currents on the southwestern Atlantic shelf circulation, Ocean Science, 6, 983-995, doi:10.5194/os-6-983-2010.
Matano, R.P., V. Combes, A.R. Piola, R.A. Guerrero, E.D. Palma, P.T. Strub, C. James, H. Fenco, Yi Chao, & M. Saraceno, (2014) The salinity signature of the cross-shelf exchanges in the Southwestern Atlantic Ocean: Numerical simulations, J. Geophys. Res. Oceans, 119, 7949–7968, doi: 10.1002/2014JC010116.
48
Variability of Ocean Ecosystem Around South America (VOCES)
Muelbert, J.H., M. Acha, H. Mianzan, R. Guerrero, R. Reta, E. S. Braga, V. M.T. Garcia, A. Berasategui, M. Gomez-Erache & F. Ramirez. (2008) Biological, physical and chemical properties at the Subtropical Shelf Front Zone in the SW Atlantic Continental Shelf. Continental Shelf Research, 28, 1662–1673, doi:10.1016/j.csr.2007.08.011.
Muelbert, J.H. & Sinque, C. (1996) Distribution of bluefish (Pomatomus saltatrix) larvae along the continental shelf off southern Brazil. Marine and Freshwater Research, 47, 311-314.
Palma, E.D., R.P. Matano & A.R. Piola, (2004) A numerical study of the Southwestern Atlantic Shelf circulation: Barotropic response to tidal and wind forcing, Journal of Geophysical Research, 109, C08014, doi:10.1029/2004JC002315
Palma, E. D., R. P. Matano, & A. R. Piola, (2008) A numerical study of the Southwestern Atlantic Shelf circulation: Stratified ocean response to local and offshore forcing, J. Geophys. Res., 113, C11010, doi:10.1029/2007JC004720.
Palma, E.D., & Matano, R.P., (2009) Disentangling the upwelling mechanisms of the South Brazil Bight. Continental Shelf Research, 29(11), 1525-1534.
Piola, A.R., E.J.D. Campos, O.O. Moller, M. Charo & C. Martinez, (2000) Subtropical shelf front off eastern South America, Journal of Geophysical Research, 105, C3, 6566-6578.
Piola, A.R., O.O. Möller Jr., R.A. Guerrero & E.J.D. Campos, (2008) Variability of the Subtropical Shelf front off eastern South America: winter 2003 and summer 2004, Continental Shelf Research, 28, 1639-1648, doi: 10.1016/j.csr.2008.03.013.
Piola, A.R., R.B. C. Franco, E. D. Palma, and M. Saraceno (2013) Multiple jets in the Malvinas Current, J. Geophys. Res. Oceans., 118, 2107-2117, doi:10.1002/jgrc.20170.
Piola A. (2011) Ocean, Climate and fisheries: The Patagonia Shelf case. United Nations Climate Change Conference (COP17), Durban, South Africa, 28th Nov- 9th Dec, Green Economy: Powering Climate Solutions.
Purca S., M Graco, D Gutiérrez, B. Dewitte, J Tam, A. Bertrand, F Chavez, R Flores, J. Ledesma, L. Vasquez, M. Messie, K. Goubanova, O. Moron, C. Nakazaki, S. Peraltilla, & S. Sanchez (2010) Relación entre anchoveta y ambiente a diferentes escalas temporales. V Panel de la Anchoveta. Boletín del IMARPE, 25, 1-2:20-35.
Romero, S.I., A.R. Piola, M. Charo & C.A.E. Garcia, (2006) Chlorophyll-a variability off Patagonia based on SeaWiFS data, Journal of Geophysical Research, 111, C05021, doi:10.1029/2005JC003244.
Rykaczewski, R. R., Dunne, J. P., Sydeman, W. J., García‐Reyes, M., Black, B. A., & Bograd, S. J., (2015) Poleward displacement of coastal upwelling‐favorable winds in the ocean’s eastern boundary currents through the 21st century. Geophysical Research Letters, 42(15), 6424-6431.
Soares, H.C., D. F. M. Gherardi, L. P. Pezzi, M. T. Kayano & E. T. Paes. (2014) Patterns of interannual climate variability in large marine ecosystems. Journal of Marine Systems, 134: 57–68, doi: 10.1016/j.jmarsys.2014.03.004.
Stramma, L., Johnson, G. C., Sprintall, J., and Mohrholz, V., (2008) Expanding oxygen-minimum zones in the tropical oceans. Science, 320(5876), 655-658.
Strub, P.T., C. James, V. Combes, R. Matano, A. Piola, E. Palma, M. Saraceno, R. Guerrero, H. Fenco & L. Ruiz Etcheverry (2015) Altimeter-Derived Seasonal Circulation on the SW Atlantic Shelf: 27° – 43°S, J. Geophys. Res. Oceans, 120, 3391–3418, doi:10.1002/2015JC010769.
Tilman, D., J. Knops, D. Wedin, P. Reich, M. Ritchie, E. Siemann, (1997) The influence of functional diversity and composition on ecosystem processes. Science (277) 1300-1302
Vaz, A. C., Parada C., Palma, E. D., Muelbert, J. H. & Campos, E. (2007) Modeling transport and retention of Engraulis anchoita Hubbs & Marini, 1935 (Clupeiformes, Engraulidae) early life stages along the Southwestern Atlantic continental shelf. Pan-American Journal of Aquatic Sciences, 2: 179-190.
Wang, D., Gouhier, T. C., Menge, B. A., & Ganguly, A. R., (2015) Intensification and spatial homogenization of coastal upwelling under climate change. Nature, 518(7539), 390-394.
49
A Monitoring Network to Detect the Impact of Climate Change on Tree Biodiversity and Carbon in Amazonian Floodplain Forests
2. IMPACT OF CLIMATE CHANGE ON BIODIVERSITY, SOCIAL-ECOLOGICAL-SYSTEMS AND ITS MEASUREMENTS
A MONITORING NETWORK TO DETECT THE IMPACT OF CLIMATE CHANGE ON TREE BIODIVERSITY AND CARBON IN AMAZONIAN FLOODPLAIN FORESTS
Eurídice N. Honorio Coronado1 and Frederick C. Draper2
1Instituto de Investigaciones de la Amazonía Peruana, Av. Abelardo Quiñones km 2.5, Iquitos, Perú2School of Geography, University of Leeds, Leeds, LS6 9JT, UK
INTRODUCTION
Peruvian floodplain forests are one of the largest freshwater ecosystems in Amazonia covering 13.5 million hectares or 18% of Peru (MINAM, 2011). These ecosystems are economically important to local communities as many of their valuable natural resources and agricultural products form the basis of important economic supply chains to urban areas. However, climate change may cause important changes in seasonal fluctuations in river levels in these ecosystems (Gloor et al., 2013). For example, a recent study showed that populations of wild animals in the Pacaya Samiria Natural Reserve generally decreased due to severe flooding in 2010 (Bodmer et al., 2014); terrestrial mammals were the most affected because of their dependence on dry areas during the flood to hunt. As the frequency of such flooding events may increase in the future (Espinoza et al., 2013; Gloor et al., 2013), there is a need to understand the resilience of these forests to current and future climatic and human impacts.
To understand the ecology of floodplain forests, we need to understand the role of the flooding and nutrient supply gradients for determining how these ecosystems function. The flood pulse of the rivers and their nutrient supply are important features of the floodplain. White-water rivers carry nutrients from the Andes, whereas black-water rivers form inside the floodplains and have low nutrient content. Forests that are flooded by white-water rivers will also have high nutrient content in the soils, while forests influenced by black-water rivers have low soil nutrient contents (e.g. palm swamp). Seasonally flooded forests develop in areas of influence of major rivers and are flooded each year for one to six months. Palm swamps are located in depressions, which receive less influence of major rivers, and maintain permanent surface water from precipitation (Junk et al., 2011). Despite their low floristic diversity compared to the surrounding upland forests, floodplain forests have high regional diversity (beta diversity), with potentially even higher values than terra firme forest (Pitman et al., 2014).
Natural dynamics of rivers cause erosion and deposition of sediments generating a natural succession in vegetation (Salo et al., 1986). This complex landscape influences the patterns of carbon stocks in these ecosystems. Estimates of above-ground carbon using remote sensing in Peru predict a national store of 6.9 Pg C, with highly variable carbon densities in the largest Peruvian floodplain, Pacaya-Samiria National Reserve of 72.9 ± 29.2 Mg C ha-1(Asner et al., 2014). Extensive below-ground carbon deposits stored as peat (organic matter) have also been recently confirmed in the region of Loreto (Lähteenoja et al., 2012). Palm swamps (748 Mg C ha-1), pole forests (1340 Mg C ha-1) and open peatlands (663 Mg C ha-1) are the most representative vegetation types accumulating peat (Draper et al., 2014). These areas that represent only 3% of the whole of the Peruvian forests have added 40% of the carbon stocks of Peru.
Direct human impacts due to resource harvesting lead to degradation across the seasonally flooded forests and palm swamps which are the two most extensive floodplain forest types in Peru. High value timber species such as mahogany and cedar were once common in seasonally flooded forests but have been heavily logged and their populations are in some cases close to local extinction (Kvist et al., 2001). Decades of fruit harvesting by cutting female individuals has heavily degraded Mauritia palm swamps that are close to local communities.
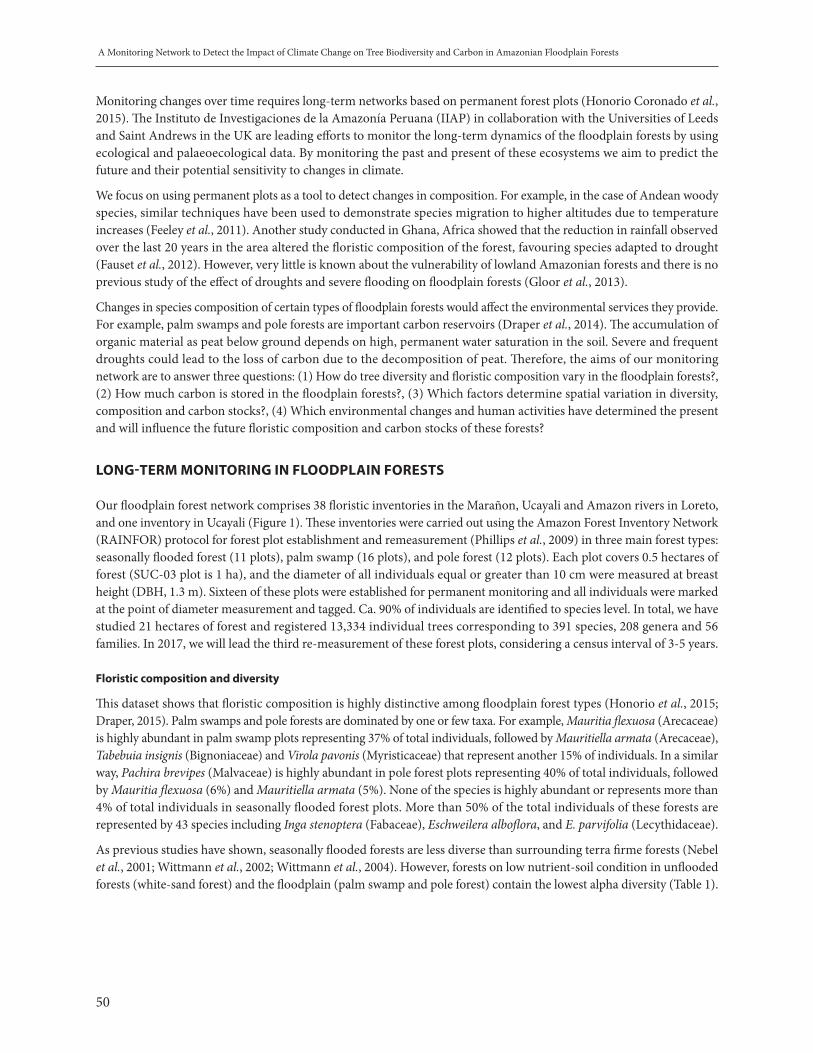
50
A Monitoring Network to Detect the Impact of Climate Change on Tree Biodiversity and Carbon in Amazonian Floodplain Forests
Monitoring changes over time requires long-term networks based on permanent forest plots (Honorio Coronado et al., 2015). The Instituto de Investigaciones de la Amazonía Peruana (IIAP) in collaboration with the Universities of Leeds and Saint Andrews in the UK are leading efforts to monitor the long-term dynamics of the floodplain forests by using ecological and palaeoecological data. By monitoring the past and present of these ecosystems we aim to predict the future and their potential sensitivity to changes in climate.
We focus on using permanent plots as a tool to detect changes in composition. For example, in the case of Andean woody species, similar techniques have been used to demonstrate species migration to higher altitudes due to temperature increases (Feeley et al., 2011). Another study conducted in Ghana, Africa showed that the reduction in rainfall observed over the last 20 years in the area altered the floristic composition of the forest, favouring species adapted to drought (Fauset et al., 2012). However, very little is known about the vulnerability of lowland Amazonian forests and there is no previous study of the effect of droughts and severe flooding on floodplain forests (Gloor et al., 2013).
Changes in species composition of certain types of floodplain forests would affect the environmental services they provide. For example, palm swamps and pole forests are important carbon reservoirs (Draper et al., 2014). The accumulation of organic material as peat below ground depends on high, permanent water saturation in the soil. Severe and frequent droughts could lead to the loss of carbon due to the decomposition of peat. Therefore, the aims of our monitoring network are to answer three questions: (1) How do tree diversity and floristic composition vary in the floodplain forests?, (2) How much carbon is stored in the floodplain forests?, (3) Which factors determine spatial variation in diversity, composition and carbon stocks?, (4) Which environmental changes and human activities have determined the present and will influence the future floristic composition and carbon stocks of these forests?
LONG-TERM MONITORING IN FLOODPLAIN FORESTS
Our floodplain forest network comprises 38 floristic inventories in the Marañon, Ucayali and Amazon rivers in Loreto, and one inventory in Ucayali (Figure 1). These inventories were carried out using the Amazon Forest Inventory Network (RAINFOR) protocol for forest plot establishment and remeasurement (Phillips et al., 2009) in three main forest types: seasonally flooded forest (11 plots), palm swamp (16 plots), and pole forest (12 plots). Each plot covers 0.5 hectares of forest (SUC-03 plot is 1 ha), and the diameter of all individuals equal or greater than 10 cm were measured at breast height (DBH, 1.3 m). Sixteen of these plots were established for permanent monitoring and all individuals were marked at the point of diameter measurement and tagged. Ca. 90% of individuals are identified to species level. In total, we have studied 21 hectares of forest and registered 13,334 individual trees corresponding to 391 species, 208 genera and 56 families. In 2017, we will lead the third re-measurement of these forest plots, considering a census interval of 3-5 years.
Floristic composition and diversity
This dataset shows that floristic composition is highly distinctive among floodplain forest types (Honorio et al., 2015; Draper, 2015). Palm swamps and pole forests are dominated by one or few taxa. For example, Mauritia flexuosa (Arecaceae) is highly abundant in palm swamp plots representing 37% of total individuals, followed by Mauritiella armata (Arecaceae), Tabebuia insignis (Bignoniaceae) and Virola pavonis (Myristicaceae) that represent another 15% of individuals. In a similar way, Pachira brevipes (Malvaceae) is highly abundant in pole forest plots representing 40% of total individuals, followed by Mauritia flexuosa (6%) and Mauritiella armata (5%). None of the species is highly abundant or represents more than 4% of total individuals in seasonally flooded forest plots. More than 50% of the total individuals of these forests are represented by 43 species including Inga stenoptera (Fabaceae), Eschweilera alboflora, and E. parvifolia (Lecythidaceae).
As previous studies have shown, seasonally flooded forests are less diverse than surrounding terra firme forests (Nebel et al., 2001; Wittmann et al., 2002; Wittmann et al., 2004). However, forests on low nutrient-soil condition in unflooded forests (white-sand forest) and the floodplain (palm swamp and pole forest) contain the lowest alpha diversity (Table 1).
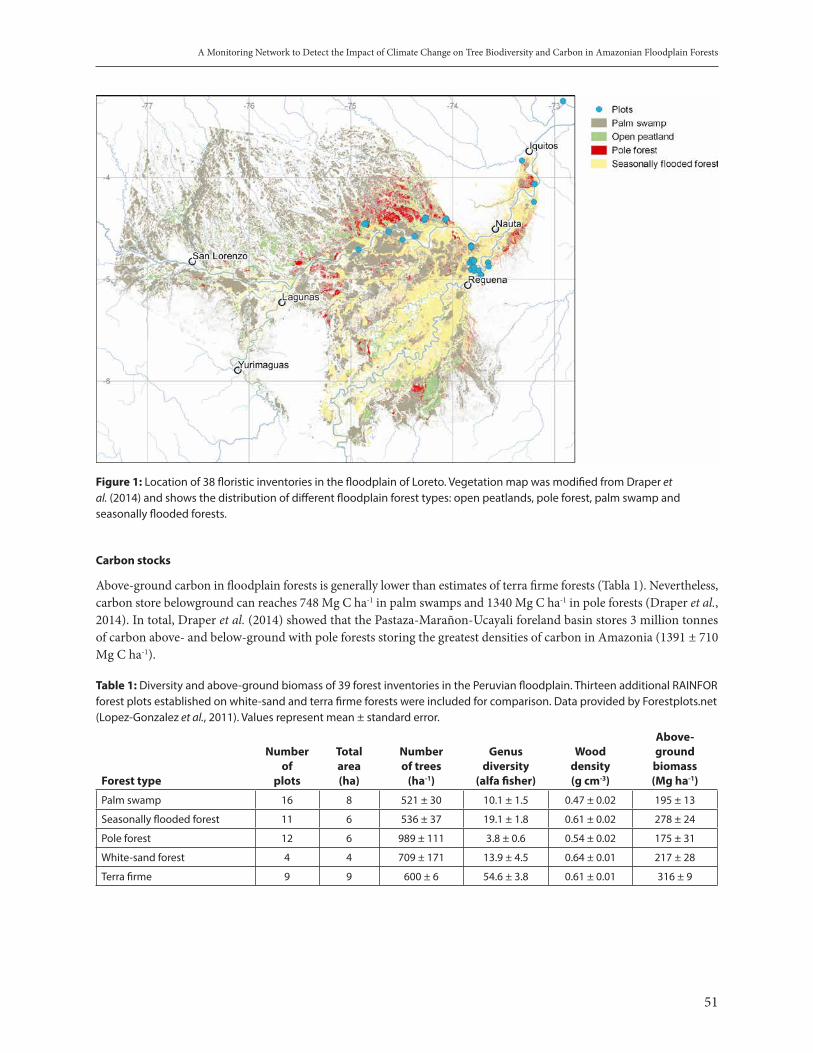
51
A Monitoring Network to Detect the Impact of Climate Change on Tree Biodiversity and Carbon in Amazonian Floodplain Forests
Figure 1: Location of 38 floristic inventories in the floodplain of Loreto. Vegetation map was modified from Draper et al. (2014) and shows the distribution of different floodplain forest types: open peatlands, pole forest, palm swamp and seasonally flooded forests.
Carbon stocks
Above-ground carbon in floodplain forests is generally lower than estimates of terra firme forests (Tabla 1). Nevertheless, carbon store belowground can reaches 748 Mg C ha-1 in palm swamps and 1340 Mg C ha-1 in pole forests (Draper et al., 2014). In total, Draper et al. (2014) showed that the Pastaza-Marañon-Ucayali foreland basin stores 3 million tonnes of carbon above- and below-ground with pole forests storing the greatest densities of carbon in Amazonia (1391 ± 710 Mg C ha-1).
Table 1: Diversity and above-ground biomass of 39 forest inventories in the Peruvian floodplain. Thirteen additional RAINFOR forest plots established on white-sand and terra firme forests were included for comparison. Data provided by Forestplots.net (Lopez-Gonzalez et al., 2011). Values represent mean ± standard error.
Forest type
Numberof
plots
Totalarea(ha)
Numberof trees
(ha-1)
Genusdiversity
(alfa fisher)
Wooddensity(g cm-3)
Above-ground
biomass(Mg ha-1)
Palm swamp 16 8 521 ± 30 10.1 ± 1.5 0.47 ± 0.02 195 ± 13
Seasonally flooded forest 11 6 536 ± 37 19.1 ± 1.8 0.61 ± 0.02 278 ± 24
Pole forest 12 6 989 ± 111 3.8 ± 0.6 0.54 ± 0.02 175 ± 31
White-sand forest 4 4 709 ± 171 13.9 ± 4.5 0.64 ± 0.01 217 ± 28
Terra firme 9 9 600 ± 6 54.6 ± 3.8 0.61 ± 0.01 316 ± 9
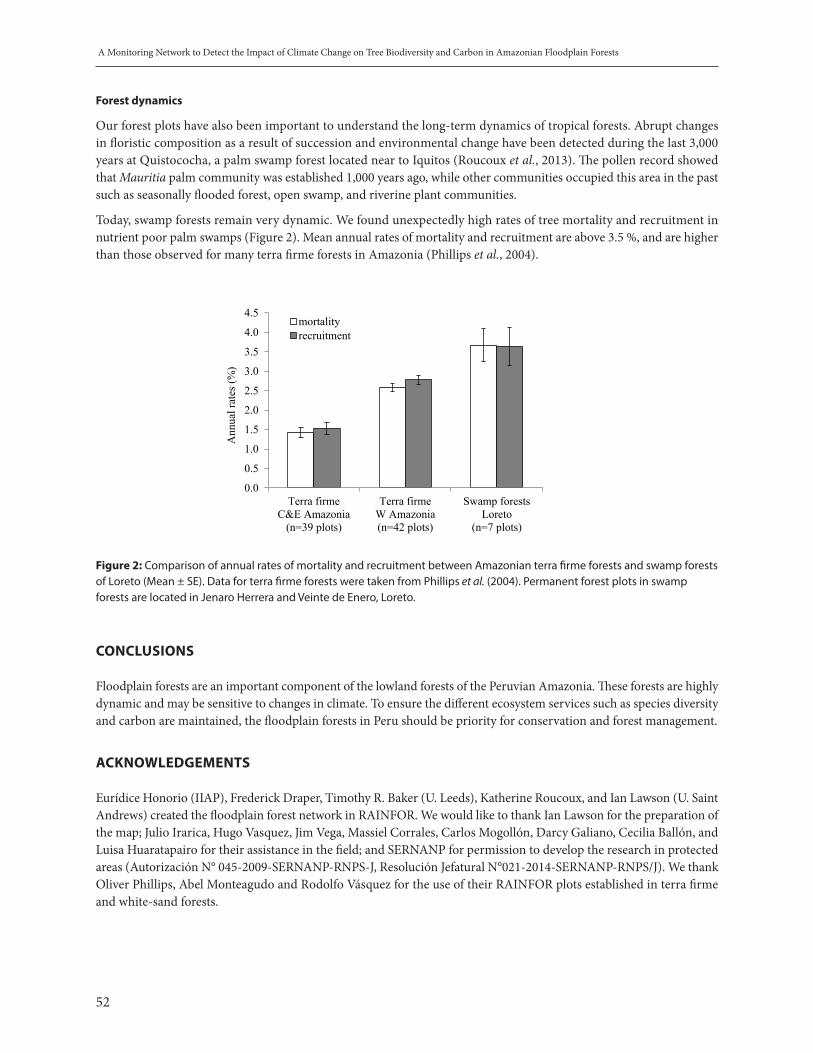
52
A Monitoring Network to Detect the Impact of Climate Change on Tree Biodiversity and Carbon in Amazonian Floodplain Forests
Forest dynamics
Our forest plots have also been important to understand the long-term dynamics of tropical forests. Abrupt changes in floristic composition as a result of succession and environmental change have been detected during the last 3,000 years at Quistococha, a palm swamp forest located near to Iquitos (Roucoux et al., 2013). The pollen record showed that Mauritia palm community was established 1,000 years ago, while other communities occupied this area in the past such as seasonally flooded forest, open swamp, and riverine plant communities.
Today, swamp forests remain very dynamic. We found unexpectedly high rates of tree mortality and recruitment in nutrient poor palm swamps (Figure 2). Mean annual rates of mortality and recruitment are above 3.5 %, and are higher than those observed for many terra firme forests in Amazonia (Phillips et al., 2004).
Figure 2: Comparison of annual rates of mortality and recruitment between Amazonian terra firme forests and swamp forests of Loreto (Mean ± SE). Data for terra firme forests were taken from Phillips et al. (2004). Permanent forest plots in swamp forests are located in Jenaro Herrera and Veinte de Enero, Loreto.
CONCLUSIONS
Floodplain forests are an important component of the lowland forests of the Peruvian Amazonia. These forests are highly dynamic and may be sensitive to changes in climate. To ensure the different ecosystem services such as species diversity and carbon are maintained, the floodplain forests in Peru should be priority for conservation and forest management.
ACKNOWLEDGEMENTS
Eurídice Honorio (IIAP), Frederick Draper, Timothy R. Baker (U. Leeds), Katherine Roucoux, and Ian Lawson (U. Saint Andrews) created the floodplain forest network in RAINFOR. We would like to thank Ian Lawson for the preparation of the map; Julio Irarica, Hugo Vasquez, Jim Vega, Massiel Corrales, Carlos Mogollón, Darcy Galiano, Cecilia Ballón, and Luisa Huaratapairo for their assistance in the field; and SERNANP for permission to develop the research in protected areas (Autorización N° 045-2009-SERNANP-RNPS-J, Resolución Jefatural N°021-2014-SERNANP-RNPS/J). We thank Oliver Phillips, Abel Monteagudo and Rodolfo Vásquez for the use of their RAINFOR plots established in terra firme and white-sand forests.
0.0
0.5
1.0
1.5
2.0
2.5
3.0
3.5
4.0
4.5
Terra firmeC&E Amazonia
(n=39 plots)
Terra firmeW Amazonia(n=42 plots)
Swamp forestsLoreto
(n=7 plots)
Ann
ual r
ates
(%)
mortalityrecruitment

53
A Monitoring Network to Detect the Impact of Climate Change on Tree Biodiversity and Carbon in Amazonian Floodplain Forests
REFERENCES
Asner, G.P., Knapp, D.E., Martin, R.E., Tupayachi, R., Anderson, C.B., Mascaro, J., Sinca, F., Chadwick, K.D., Sousan, S., Higgins, M., Farfan, W., Silman, M.R., Llactayo, W.A. & Neyra, A.F. (2014) The high-resolution carbon geography of Peru. The Carnegie Airborne Observatory and the Ministry of Environment of Perú, Berkeley, USA.
Bodmer, R.E., Puertas, T. & PE Antúnez, M. (2014) Cambio climático y fauna silvestre en la Amazonía peruana: impacto de la sequía e inundaciones intensas en la Reserva Nacional Pacaya Samiria. Fundamazonía, Lima, Perú.
Draper, F.C., Roucoux, K.H., Lawson, I.T., Mitchard, E.T., Coronado, E.N.H., Lähteenoja, O., Montenegro, L.T., Sandoval, E.V., Zaráte, R. & Baker, T.R. (2014) The distribution and amount of carbon in the largest peatland complex in Amazonia. Environmental Research Letters, 9, 124017.
Draper, F. (2015) Carbon storage and floistic dynamics in Peruvian peatland ecosystems. PhD Thesis. University of Leeds, UK. 150 p.
Espinoza, J.C., Ronchail, J., Frappart, F., Lavado, W., Santini, W. & Guyot, J.L. (2013) The Major Floods in the Amazonas River and Tributaries (Western Amazon Basin) during the 1970–2012 Period: A Focus on the 2012 Flood. Journal of Hydrometeorology, 14, 1000-1008.
Fauset, S., Baker, T.R., Lewis, S.L., Feldpausch, T.R., Affum‐Baffoe, K., Foli, E.G., Hamer, K.C. & Swaine, M.D. (2012) Drought‐induced shifts in the floristic and functional composition of tropical forests in Ghana. Ecology Letters, 15, 1120-1129.
Feeley, K.J., Silman, M.R., Bush, M.B., Farfan, W., Cabrera, K.G., Malhi, Y., Meir, P., Revilla, N.S., Quisiyupanqui, M.N.R. & Saatchi, S. (2011) Upslope migration of Andean trees. Journal of Biogeography, 38, 783-791.
Gloor, M., Brienen, R., Galbraith, D., Feldpausch, T., Schöngart, J., Guyot, J.L., Espinoza, J., Lloyd, J. & Phillips, O. (2013) Intensification of the Amazon hydrological cycle over the last two decades. Geophysical Research Letters, 40, 1729-1733.
Honorio Coronado, E.N., Vega Arenas, J.E. & Corrales Medina, M.N. (2015) Diversidad, estructura y carbono de los bosques aluviales del noreste peruano. Folia Amazónica, 24, 55-70.
Junk, W.J., Piedade, M.T.F., Schöngart, J., Cohn-Haft, M., Adeney, J.M. & Wittmann, F. (2011) A classification of major naturally-occurring Amazonian lowland wetlands. Wetlands, 31, 623-640.
Kvist, L.P., Andersen, M.K., Stagegaard, J., Hesselsoe, M. & Llapapasca, C. (2001) Extraction from woody forest plants in flood plain communities in Amazonian Peru: use, choice, evaluation and conservation status of resources. Forest Ecology and Management, 150, 147-174.
Lähteenoja, O., Reátegui, Y.R., Räsänen, M., Torres, D.D.C., Oinonen, M. & Page, S. (2012) The large Amazonian peatland carbon sink in the subsiding Pastaza‐Marañón foreland basin, Peru. Global Change Biology, 18, 164-178.
Lopez-Gonzalez, G., Lewis, S.L., Burkitt, M. & Phillips, O.L. (2011) ForestPlots.net: A web application and research tool to manage and analyse tropical forest plot data. Journal of Vegetation Science, 22, 610-613.
MINAM (2011) El Peru de los Bosques. Ministerio del Ambiente, Lima, Peru.
Nebel, G., Kvist, L.P., Vanclay, J.K., Christensen, H., Freitas, L. & Ruiz, J. (2001) Structure and floristic composition of flood plain forests in the Peruvian Amazon I. Overstorey. Forest Ecology and Management, 150, 27-57.
Phillips, O., Baker, T., Feldpausch, T.R. & Brienen, R. (2009) RAINFOR manual de campo para la remedición y establecimiento de parcelas. Red Amazónica de Inventarios Forestales, Leeds, UK.
Phillips, O., Baker, T., Arroyo, L., Higuchi, N., Killeen, T., Laurance, W., Lewis, S., Lloyd, J., Malhi, Y. & Monteagudo, A. (2004) Pattern and process in Amazon tree turnover, 1976–2001. Philosophical Transactions of the Royal Society B: Biological Sciences, 359, 381-407.

54
A Monitoring Network to Detect the Impact of Climate Change on Tree Biodiversity and Carbon in Amazonian Floodplain Forests
Pitman, N.C., Andino, J.E.G., Aulestia, M., Cerón, C.E., Neill, D.A., Palacios, W., Rivas‐Torres, G., Silman, M.R. & Terborgh, J.W. (2014) Distribution and abundance of tree species in swamp forests of Amazonian Ecuador. Ecography, 37, 902-915.
Roucoux, K.H., Lawson, I.T., Jones, T.D., Baker, T.R., Coronado, E.H., Gosling, W.D. & Lähteenoja, O. (2013) Vegetation development in an Amazonian peatland. Palaeogeography, Palaeoclimatology, Palaeoecology, 374, 242-255.
Salo, J., Kalliola, R., Hakkinen, I., Makinen, Y., Niemela, P., Puhakka, M. & Coley, P.D. (1986) River dynamics and the diversity of Amazon lowland forests. Nature, 322, 254-258.
Wittmann, F., Anhuf, D. & Funk, W.J. (2002) Tree species distribution and community structure of central Amazonian várzea forests by remote-sensing techniques. Journal of Tropical Ecology, 18, 805-820.
Wittmann, F., Junk, W.J. & Piedade, M.T. (2004) The várzea forests in Amazonia: flooding and the highly dynamic geomorphology interact with natural forest succession. Forest Ecology and Management, 196, 199-212.

55
Effects of Climate Change on a Temperate Montane Forest (National Park Bavarian Forest) – Outputs from Monitoring
EFFECTS OF CLIMATE CHANGE ON A TEMPERATE MONTANE FOREST (NATIONAL PARK BAVARIAN FOREST) – OUTPUTS FROM MONITORING
Claus BässlerBavarian Forest National Park, Freyunger Str. 2, 94481 Grafenau, Germany
ABSTRACT
Biodiversity is diminishing globally at an unprecedented rate in times of climate change and intensive land use. Since biodiversity is related to important ecosystem functions and ecosystem services it is important to understand how changes in both parameters are linked. One instrument to achieve this goal is the establishment of monitoring strategies within protected areas. We carried out a large biodiversity survey (BIOKLIM-Project) within the National Park Bavarian Forest (Bohemian Forest, Germany) to provide a broad range of data to assess the effects of climate change on this low mountain range. We were able to provide evidence that (1) variation in climate (summer drought) triggered large scale disturbance by bark beetles, (2) taxonomic groups responded differently to macroclimate and hence, species assemblages within and across taxonomic groups are currently under re-organization. Immigrating species contribute to this re-organization, (3) high altitude montane populations (from species and genetic perspectives) are highly vulnerable to climate change. Loss might happen because of a low elevation range which limits an upward escape, and finally that (4) assembly patterns are sensitive to macroclimate which might change functional diversity of assemblages and hence potentially ecosystem processes and services.
Our results underline the importance of gathering long term biodiversity data in order to answer numerous upcoming questions in times of human-caused environmental change.
Key words: Biodiversity, climate change, conservation, ecology, protected areas
1. INTRODUCTION
Biodiversity faces growing pressure from climate change but also from human actions, including habitat conversion, degradation, fragmentation, harvesting and pollution (IPCC 2014, Tittensor et al. 2014). As a result, global assessments show that species’ extinction risk is increasing on average while population sizes are declining (Pimm et al. 2014). In the past 20 years remarkable progress has been made towards understanding how the loss of biodiversity affects the functioning of ecosystems and thus affects society (Cardinale et al. 2012). Evidence is mounting that changes in biodiversity are altering key processes important to the productivity and sustainability of Earth’s ecosystems (Isbell et al. 2011).
Despite much discussion and a high level of research activity in various disciplines on assessing the impact of global change caused on biodiversity and natural systems, there is still a major lack of knowledge at relevant temporal and spatial scales and currently, the most relevant scale of ecological investigations is a local one (IPCC 2014).
Our study area is the German part of the Bohemian Forest, a low range mountain system, located in southeastern Germany (48°54' N, 13°29´ E), covering an area of ~5,000 km² at altitudes from 300 to 1,450 m a.s.l. The study area belongs to the temperate zone. In the following I summarize the current knowledge on the effects of climate change on biodiversity and lessons from biodiversity monitoring mainly for the National Park Bavarian Forest (ca. 24,500 and part of the Bohemian Forest).
56
Effects of Climate Change on a Temperate Montane Forest (National Park Bavarian Forest) – Outputs from Monitoring
2. BIOKLIM-PROJECT - THE CONCEPTUAL FRAMEWORK
In 2006 we set up a total of 288 plots along four straight transects following the altitudinal gradient. Five additional plots were installed beside the main transects to compensate for the lack of old growth forest samples at higher altitude. The four transects were selected by using a stratified random scheme. Our first imperative was to include within the straight transects from valleys to mountain tops the entire vertical gradient of the study area National Park Bavarian Forest. As a result of the division of the National Park into two main areas of wilding and continuous management, we planned to set up two transects in each category. Finally, we balanced the four transects in order to avoid autocorrelation in forest structure (e.g., to avoid co-variation of forest stand age with altitude). The chosen design using 4 main transects with 100 m between plots ensures that a minimum of 23 replications for each altitudinal range exists; sufficient to overcome simultaneous environmental effects. As outlined by (Bässler et al. 2008), the plots represent fairly well the main plant communities of the National Park. Early analyses revealed the weakness in estimating the consequences of climate change on species distributions (Bässler et al. 2010a) which led to the decision to extend the elevation gradient in 2008. We set up an additional 38 plots at elevations between ca. 300 m asl. (close to the Danube) to 650 m asl. (lowest sites within the National Park Bavarian Forest) outside the Park. The final number of plots was therefore 331 distributed from 287 m asl. to 1,420 m asl.
On each plot a plethora of environmental variables were measured, recorded or modelled. They include basic topographic information (e.g., altitude, exposition), forest structural variables (e.g., dead wood, tree species composition at different strata), soil chemical physical and chemical properties, and a set of biological meaningful climate variables (see (Bässler et al. 2008) and references cited within this article). All taxonomic groups, methods and number of sampled plots (replications) are presented in (Bässler et al. 2008). Altogether we collected data on 25 higher taxa. The number of plots to be sampled depended on the nature of the scientific enquiry and on the target group. For this reason we stratified 331 sample plots, selecting pre-stratified sub-samples with respect to the two main gradients (altitude and forest structure) for some groups (Bässler et al. 2008).
3. CLIMATE AS A CONTRIBUTING DRIVER OF LARGE SCALE DISTURBANCE
In the 1990s the Park experienced large scale disturbance in mature spruce stands by bark beetle (mainly Ips typographus, >5,000 ha, see Lehnert et al. 2013). Due to the ‘benign neglect’ strategy (non-intervention strategy) of the Park, this development led to a considerable enrichment of dead wood along with rather open conditions within a very short time frame, a situation unique for Central Europe (Lehnert et al. 2013, Beudert et al. 2015). A recent study found that in addition to stand predisposition, large-scale drivers strongly influenced bark beetle infestation risk (Seidl et al. 2016). Outbreak waves were closely related to spatial connectedness on the landscape as well as to regional bark beetle population pressure. Furthermore, regional summer drought was identified as an important trigger for local infestation pulses (Seidl et al. 2016). Large-scale synchrony and connectivity are thus key drivers of the unprecedented bark beetle outbreaks recently observed in Central Europe. As climate changes, frequency and severity of disturbance might also change in future considerably, especially in coniferous forest ecosystems prone to natural disturbance (Raffa et al. 2008, Seidl et al. 2011, Seidl et al. 2014).
4. COMMUNITIES UNDER RE-ORGANIZATION DUE TO CLIMATE CHANGE
We have evidence that species communities within the Park are under re-organization due to climate change (Bässler et al. 2013). In one study comparing the upper distributional limits of species from around 1900 (Thiem 1906) with the more recent BIOKLIM records, we found for example that ectothermic insects have overshot the expected shift caused by climate change (Bässler et al. 2013). A shift due to climate change was not consistent across taxonomic groups (e.g. plants showed no response) which suggests a considerable re-organization of species communities across taxonomic groups.

57
Effects of Climate Change on a Temperate Montane Forest (National Park Bavarian Forest) – Outputs from Monitoring
Figure 1: Shift in the upper range margin of the species. Box plots of the upper ranges of single-species shifts of the lineages under study between 1902–1904 and 2006–2007. Outliers are shown; the mean shift of each lineage is indicated by a blue line. The grey shaded area and the expected shift [50–200 m, black line = mean (125)] are based on regional climate data. (Source: Bässler et al. 2013).
5. EARLY WARNING OF CHANGE
By law, the National Park administration has the obligation to maintain natural occurring species communities typical for the landscape. In times of climate change this seems challenging. Knowledge on the consequences of climate change, on the distribution of species and how species communities will be affected are hence important for the Park management. Moreover, the importance of climate change effects on species might be modified by the existence of specific habitat features provided by a ‘benign neglect’ strategy. Some studies therefore focused on the relative importance of macroclimate versus local forest structural variables (Moning et al. 2009, Bässler et al. 2010a, Bässler et al. 2010b, Raabe et al. 2010). For species groups using dead-wood as a habitat for example it has been shown that, at the scale of the National Park, resource and habitat availability seems more important than macroclimate for species diversity. This suggests that availability of dead-wood might mitigate effects of climate change at least to a certain extent for dead-wood dependent species.
6. VULNERABILITY OF SPECIES
Climate change effects in a low mountain range might be more pronounced e.g. compared to the Alps, simply because of the limited elevation range. Hence, the assumption that high montane species should be most vulnerable seems justified (Thuiller 2007). This view is supported by a statistical exercise, where we modelled the probability of occurrence of typical high montane species based on future climate scenarios. These studies showed that even a moderate increase of temperature (1.8 °C) decrease the probability of the occurrence above ~1,100 m a.s.l. considerably (Müller et al. 2008, Bässler et al. 2010c). Furthermore that the habitat area available at the high montane zone is generally limited (less than 10% of the area of the Park, Bässler et al. 2010c).
We also studied the effects of climate change on the genetic structure of populations (Schade 2010, Oberprieler et al. 2015). One study underlines that the genetic variability within high montane species populations (Semilimax kotulae) is rather low (gene drift is larger than gene flow) indicating a high level of susceptibility to climate change (Schade 2010). Another study suggested that hybridization caused by a shift of species due to climate change led to genetic swamping of a rare species (Senecio hercynicus) by its more common congener (S. ovatus) (Oberprieler et al. 2015). Finally, a recent study focusing on within species variability of rodent species along the climate gradient clearly suggested that we should pay more attention to the potential significance of genetic and/or phenotypic plasticity of life history traits to environmental heterogeneity such as climate (Müller et al. 2014).
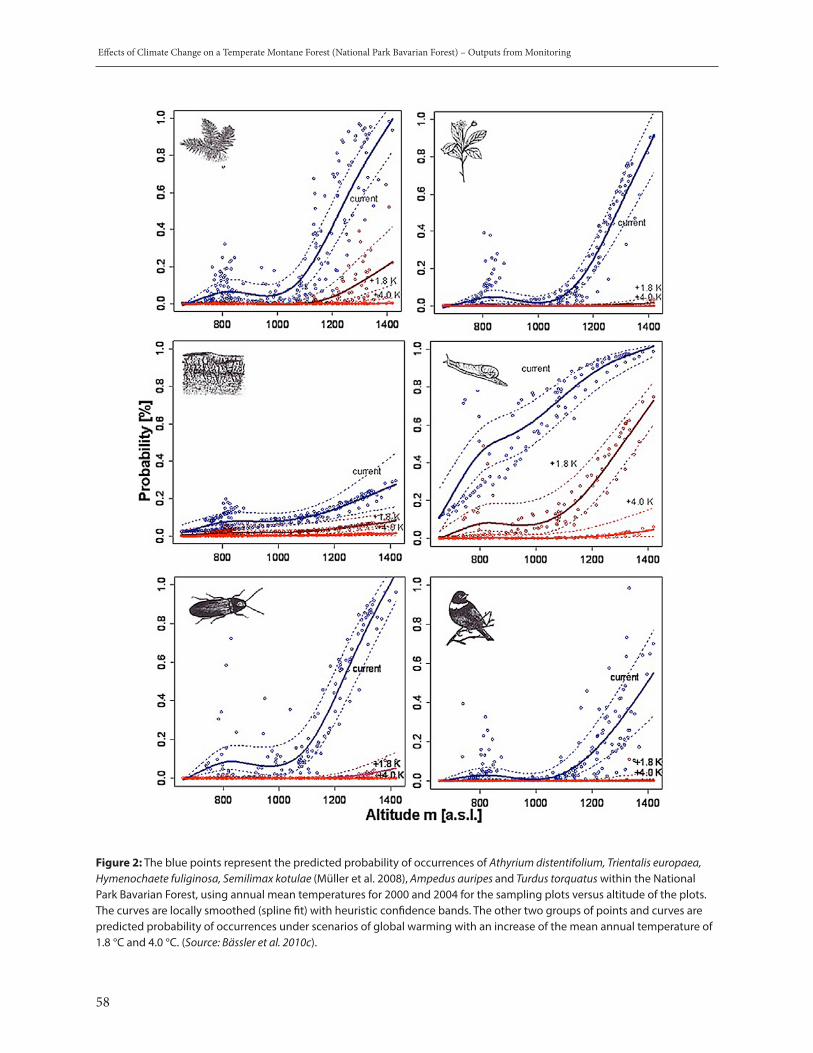
58
Effects of Climate Change on a Temperate Montane Forest (National Park Bavarian Forest) – Outputs from Monitoring
Figure 2: The blue points represent the predicted probability of occurrences of Athyrium distentifolium, Trientalis europaea, Hymenochaete fuliginosa, Semilimax kotulae (Müller et al. 2008), Ampedus auripes and Turdus torquatus within the National Park Bavarian Forest, using annual mean temperatures for 2000 and 2004 for the sampling plots versus altitude of the plots. The curves are locally smoothed (spline fit) with heuristic confidence bands. The other two groups of points and curves are predicted probability of occurrences under scenarios of global warming with an increase of the mean annual temperature of 1.8 °C and 4.0 °C. (Source: Bässler et al. 2010c).

59
Effects of Climate Change on a Temperate Montane Forest (National Park Bavarian Forest) – Outputs from Monitoring
7. IMMIGRATION OF NEW SPECIES
We also recently recorded new thermophile species entering the Park (Bässler and Leibl 2012). A very prominent example is the immigrant Oxythyrea funesta (Coleoptera, beetle), a species spreading out from the donor site close to the Danube towards and into the Park since a few years (Bussler 2007). Other examples are a fungus which relies on higher temperatures for fructification (Volvariella bombycina) and a snail (Arion lusitanicus) adapted to dry environmental conditions compared to the native species (Bässler and Leibl 2012).
8. TOWARDS A MORE MECHANISTIC UNDERSTANDING OF THE EFFECTS OF CLIMATE CHANGE
It has been recognized that considering species identity alone (e.g. species richness or taxonomic diversity) is not sufficient to infer a deeper mechanistic understanding of the underlying processes that influence communities along climate gradients, and hampers climate change predictions (Lavergne et al. 2010). A first step is to consider traits of species that underpin the relationship between species and the environment along elevation gradients (Pellissier et al. 2010). In a recent study we showed that macroclimate (elevation) was more important than forest structure in driving lichen functional diversity (Bässler et al. 2016). Functional diversity decreased and revealed that community patterns shift with elevation from random to clustered, reflecting selection for key shared traits. This analysis highlights the need to examine alternative forms of diversity and opens the avenue to predict the consequences of climate change on species assemblages and ecosystem processes. For the regional scenario with increasing temperature and decreasing availability of moisture, we hence expect a loss of specialized lichen species with a complex growth form and those with vegetative organs at higher elevations in low mountain ranges in Europe and this may result in a shift of the assembly patterns towards stochastic ecological drift. A change in the dominant assembly processes caused by climate change might have important consequences on ecosystem functioning such like nutrient cycling. If local community extinction and immigration rates remain constant, this would not necessarily lead to a decrease in species richness with global warming, but may lead to a change in the types of species present.
CONCLUSIONS
Modelling the effects of climate change on a large spatial scale is important; effects however take place on a local scale. To assess the impact of climate change on a local scale, we need reliable local data. Monitoring data from biodiversity surveys are helpful and important to reveal even subtle changes due to climate change. They are furthermore helpful to reveal possible structures and processes able to mitigate effects of climate change. We need to set up more and continue existing biodiversity surveys. Protected areas might be particularly suitable as climate change laboratories, on the one hand because research efforts can be concentrated, on the other hand because of the possibility to overcome confounding effects such like land use intensity. Beside biodiversity surveys, I recommend to set up field experiments in the future that can contribute to gather a deeper understanding on the mechanistic link between species and their environment. Such experiments can help to improve the predictions of the consequences of climate change on biodiversity and subsequent consequences on the functioning of ecosystems and hence ecosystem services for human well-being.
REFERENCES
Bässler, C., M. W. Cadotte, B. Beudert, C. Heibl, M. Blaschke, J. H. Bradtka, T. Langbehn, S. Werth, and J. Müller. 2016. Contrasting patterns of lichen functional diversity and species richness across an elevation gradient. Ecography 39:689-698.
Bässler, C., B. Förster, C. Moning, and J. Müller. 2008. The BIOKLIM-Project: Biodiversity Research between Climate Change and Wilding in a temperate montane forest – The conceptual framework. Forest Ecology, Landscape Research and Nature Conservation 7:21-33.

60
Effects of Climate Change on a Temperate Montane Forest (National Park Bavarian Forest) – Outputs from Monitoring
Bässler, C., T. Hothorn, R. Brandl, and J. Muller. 2013. Insects overshoot the expected upslope shift caused by climate warming. PLOS ONE 8:e65842-e65842.
Bässler, C. and F. Leibl. 2012. Deutliche Hinweise für den Klimawandel im Nationalpark Bayerischer Wald. AFZ - Der Wald 14:31-33.
Bässler, C., J. Müller, and F. Dziock. 2010a. Detection of Climate-Sensitive Zones and Identification of Climate Change Indicators: A Case Study from the Bavarian Forest National Park. Folia Geobotanica 45:163-182.
Bässler, C., J. Müller, F. Dziock, and R. Brandl. 2010b. Effects of resource availability and climate on the diversity of wood-decaying fungi. Journal of Ecology 98:822-832.
Bässler, C., J. Müller, T. Hothorn, T. Kneib, F. Badeck, and F. Dziock. 2010c. Estimation of the extinction risk for high-montane species as a consequence of global warming and assessment of their suitability as cross-taxon indicators. Ecological Indicators 10:341–352.
Beudert, B., C. Bässler, S. Thorn, R. Noss, B. Schröder, H. Dieffenbach-Fries, N. Foullois, and M. J. 2015. Bark beetles increase biodiversity while maintaining drinking water quality. Conservation Letters, accepted.
Bussler, H. 2007. Wärmeliebende Rosenkäfer im Bayerischen Wald. LWF Aktuell 14:58.
Cardinale, B. J., J. E. Duffy, A. Gonzales, D. U. Hooper, C. Perrings, P. Venail, A. Narwani, G. M. Mace, D. Tilman, D. A. Wardle, A. P. Kinzing, G. C. Daily, M. Loreau, J. B. Grace, A. Larigauderie, D. S. Srivastava, and S. Naeem. 2012. Biodiversity loss and its impact on humanity. Nature 486:59-67.
IPCC. 2014. Fifth Assessment Report (AR5), Working Group II, Impacts, Adaptation and Vulnerability
Isbell, F., V. Calcagno, A. Hector, J. Connolly, W. S. Harpole, P. B. Reich, M. Scherer-Lorenzen, B. Schmid, D. Tilman, J. van Ruijven, A. Weigelt, B. J. Wilsey, E. S. Zavaleta, and M. Loreau. 2011. High plant diversity is needed to maintain ecosystem services. Nature 477:196-199.
Lavergne, S., N. Mouquet, W. Thuiller, and O. Ronce. 2010. Biodiversity and climate change: Integrating evolutionary and ecological responses of species and communities. Annual Review of Ecology, Evolution and Systematics 41:321-350.
Lehnert, L. W., C. Bässler, R. Brandl, P. J. Burton, and J. Müller. 2013. Conservation value of forests attacked by bark beetles: Highest number of indicator species is found in early successional stages. Journal for Nature Conservation 21:97-104.
Moning, C., S. Werth, F. Dziock, C. Bässler, J. Bradtka, T. Hothorn, and J. Müller. 2009. Lichen diversity in temperate montane forests is influenced by forest structure more than climate. Forest Ecology and Management 258:745-751.
Müller, J., C. Bässler, S. Essbauer, S. Schex, D. W. H. Müller, L. Opgenoorth, and R. Brandl. 2014. Relative heart size in two rodent species increases with elevation: reviving Hesse’s rule. Journal of Biogeography 41:2211-2220.
Müller, J., C. Bässler, C. Strätz, B. Klöcking, and R. Brandl. 2008. Molluscs and climate warming in forests of a low mountain range, submitted. Malacologia 51:133-153.
Oberprieler, C., G. Heine, and C. Bässler. 2015. Can divergent selection save the rare Senecio hercynicus from genetic swamping by its spreading congener S. ovatus (Compositae, Senecioneae)? . Flora 210:47-59.
Pellissier, L., B. Fournier, A. Guisan, and P. Vittoz. 2010. Plant traits co-vary with altitude in grasslands and forests in the European Alps. Plant Ecology 211:351-365.
Pimm, S. L., C. N. Jenkins, R. Abell, T. M. Brooks, J. L. Gittleman, L. N. Joppa, P. H. Raven, C. M. Roberts, and J. O. Sexton, . 2014. The biodiversity of species and their rates of extinction, distribution, and protection. Science 344:987.
Raabe, S., J. Müller, M. Manthey, O. Duerhammer, U. Teuber, A. Göttlein, B. Förster, R. Brandl, and C. Bässler. 2010. Drivers of bryophyte diversity allow implications for forest management with a focus on climate change. Forest Ecology and Management 260:1956-1964.
61
Effects of Climate Change on a Temperate Montane Forest (National Park Bavarian Forest) – Outputs from Monitoring
Raffa, K. F., B. H. Aukema, B. J. Bentz, A. L. Carroll, J. A. Hicki, M. G. Turner, and W. H. Romme. 2008. Cross-scale Drivers of Natural Disturbances Prone to Anthropogenic Amplification: The Dynamics of Bark Beetle Eruptions. Bioscience 58:501-517.
Schade, S. 2010. Phylogeography of the high montane species Semilimax kotulae. Master Thesis University of Marburg, 42 pp.
Seidl, R., J. Müller, T. Hothorn, C. Bässler, M. Heurich, and M. Kautz. 2016. Small beetle, large-scale drivers: how regional and landscape factors affect outbreaks of the European spruce bark beetle. Journal of Applied Ecology 53:530-540.
Seidl, R., M.-J.-. Schelhaas, W. Werner Rammer, and P. J. Verkerk. 2014. Increasing forest disturbances in Europe and their impact on carbon storage. Nature Climate Change 4:806-810.
Seidl, R., M.-J. Schelhaas, and M. J. Lexer. 2011. Unraveling the drivers of intensifying forest disturbance regimes in Europe. Global Change Biology 17:2842-2852.
Thiem, F. M. 1906. Biogeographische Betrachtung des Rachel. - zum Zwecke der Darlegung wie das Leben diesen Raum in vertikaler Richtung besetzt hat. Abhandlungen der Naturhistorischen Gesellschaft Nürnberg 16,:6-137.
Thuiller, W. 2007. Climate change and the ecologist. Nature 448:550-552.
Tittensor, D. P., M. Walpole, S. L. L. Hill, D. G. Boyce, G. L. Britten, N. D. Burgess, S. H. M. Butchart, P. W. Leadley, E. C. Regan, R. Alkemade, R. Baumung, C. Bellard, L. Bouwman, N. J. Bowles-Newark, A. M. Chenery, W. W. L. Cheung, V. Christensen, H. D. Cooper, A. R. Crowther, M. J. R. Dixon, A. Galli, V. Gaveau, R. D. Gregory, N. L. Gutierrez, T. L. Hirsch, R. Hoft, S. R. Januchowski-Hartley, M. Karmann, C. B. Krug, F. J. Leverington, J. Loh, R. K. Lojenga, K. Malsch, A. Marques, D. H. W. Morgan, P. J. Mumby, T. Newbold, K. Noonan-Mooney, Pagad S.N., B. C. Parks, H. M. Pereira, T. Robertson, C. Rondinini, L. Santini, J. P. W. Scharlemann, S. Schindler, U. R. Sumaila, L. S. L. Teh, J. van Kolck, P. Visconti, and Y. M. Ye. 2014. A mid-term analysis of progress toward international biodiversity targets. Science 346:241-244.

62
IUCN’s Trait-based Assessment of Climate Change Vulnerability of the World’s Birds and Amphibians: A Focus on the Amazon
IUCN’S TRAIT-BASED ASSESSMENT OF CLIMATE CHANGE VULNERABILITY OF THE WORLD’S BIRDS AND AMPHIBIANS: A FOCUS ON THE AMAZON
By Wendy FodenChair, IUCN SSC Climate Change specialist Group
Climate change and its associated changes in atmospheric carbon dioxide have a range of interacting potential impacts on species (Figure 1). Some, such as shifts in species’ distribution ranges and the timings of seasonal activities such a migrations and leaf-set, may help species to adapt to changing environments, but other impacts including physiological stress, range and population declines, loss of prey and mutualisms, and increased competition with climate change immigrants are likely to have a negative impact on species’ survival. Tropical cold blooded animals in particular (e.g., amphibians, reptiles, fishes and invertebrates) are likely to face disproportionally large impacts from even small shifts in temperature because they are currently living very close to their optimal temperatures (Deutsch et al., 2008). As well as facing direct climate change impacts on species’ physiology, reproduction, population size, distribution range and inter-species interactions, effects are likely to be mediated by both changing landscape processes (e.g., fire and water runoff) and human responses to climate change (e.g., changing land use, migration and increases in bushmeat harvesting)(Segan et al., 2015).
Figure 1: Aspects of climate change and elevated CO2 concentrations and their potential interacting effects on species.
(From Foden et al. (2008), courtesy of IUCN)
IPCC projections for the Amazon predict mean warming of 1-4 oC by 2090, with little projected change in mean precipitation (IPCC, 2013). Both across the region and across seasons, a relatively consistent increase of 1.5-2oC is projected by 2050 (RCP 4.5) with much of the region projected to increase by 3 oC by 2090 (IPCC, 2013). A study of increasing dry season length in southern Amazonia suggests, however, that these projections are an underestimation of impacts (Fu et al., 2013). If dry season length continues to increase at even half the rate that it has been doing so since 1979, the authors write that “the long dry season length and fire season that contributed to the 2005 drought would become the new norm by the late 21st century” (Fu et al., 2013). How will such climatic changes affects the species of the Amazon?
Phenologyspring arrivalautumn arrivalgrowing season length
Temperature
meansextremesvariabilityseasonalitysea level rises
Rainfallmeansextremesvariabilityseasonality
Extreme eventsstormsfloodsdroughtsfires
CO concentrations2
atmosphericoceanocean pH
Predicted change Effects on species
Desycnhronization of migration or dispersal events
Uncoupling of mutualisms incl. pollinator loss and coral bleaching)(
Uncoupling of predator-prey relationships
Uncoupling of parasite-host relationships
Interactions with new pathogens and invasives
Changes in distribution ranges
Loss of habitat
Increased physiological stress causing direct mortality and increased disease susceptibility
Changes in fecundity leading to changing population structures
Changes in sex ratios
Changes in competitive ability
Inability to form calcareous structures and dissolving of aragonite

63
IUCN’s Trait-based Assessment of Climate Change Vulnerability of the World’s Birds and Amphibians:A Focus on the Amazon
In 2003 IUCN began development of a system to assess species’ vulnerability to climate change with the aim of investigating whether the IUCN Red List Categories and Criteria (IUCN, 2014) are identifying species that are becoming threatened by climate change. At this time, the field of climate change vulnerability assessment of species was relatively new and consisted mainly of studies carried out using correlative or environmental-nich-based approaches, which use corelations between species’ historic distributions and climate variables to project areas containing suitable climate for them in the future. A second approach included the use of detailed mechanistic models of species’ responses to climate change, but was restricted to situations of high data and resource availability. The advantages and disadvantages of these approaches have been widely discussed (e.g. Pacifici et al., 2015; Willis et al., 2015; Foden & Young, 2016). Following broad consulation, the IUCN team established that neither approach served the needs of most species experts carrying out IUCN Red Listers, largely because they rely on technical modeling expertise that is generally unavailable. In addition, mechanistic models are too resource intentive to apply to the massive number of species considered under the IUCN Red List, and because correlative models account for few of the biological characteristics that can have a large impact on their vulnerability, are inapplicable for the small-ranged and hence often most vulnerable species (Platts et al., 2014), IUCN chose instead to develop a trait-based approach for climate change vulnerability assessment of species. Trait-based approaches use species’ biological characteristics or traits to identify species with hightened vulnerability to climate change. They are typically and increasingly used by conservation organisations due to their consideration of a broad range of climate change impact mechanisms, their relatively low technical and data resource requirements and their applicability to all species, including those with small distributions and relatively little or poor distribution information. The disadvantages of trait-based approaches include challenges in establising thresholds for vulnerability categories (e.g., how much temperature change makes a species X highly vulnerable?), and that very little work has yet been carried out to validate their accuracy.
The IUCN’s trait-based assessment was applied to all the world’ birds, amphibians and warm-water reef-builing corals (16,857 species) (Foden et al., 2013). Figure 2 summarises the trait-based method, showing how species may be assessed for climate change vulnerability based on quantification of their sensitivity, adaptive capacity and exposure. This quantification is made by recording and scoring their biological traits and by simple modeling of their exposure to changes in key environmental variables (e.g., temperature, precipitation and sea level changes). Here I discuss the findings of the global assessment of birds, amphibians and warm-water reef-building corals, with a focus on the information they provide about climate change vulnerability of species in the Amazon region.
Figure 2: Schematic diagram showing how species were categorised using the IUCN trait-based method for assessing species’ vulnerability to climate change. Species were categorised according to three dimensions (sensitivity, low adaptive capacity and exposure) using trait groups (e.g., habitat specialisation and low dispersal capacity), which were in turn assessed using taxon-group specific traits (not shown). Species were classified as sensitive, exposed or having low adaptive capacity if they qualified under any trait group, but were considered highly vulnerable overall only if they qualified under all of sensitive, low adaptive capacity and exposure.

64
IUCN’s Trait-based Assessment of Climate Change Vulnerability of the World’s Birds and Amphibians:A Focus on the Amazon
Because the IUCN study assessed all members of three entire taxonomic groups, it was (and remains to date) the only dataset on which to carry out full and systematic prioritisation exercises at global and full-taxon group scales. Per-species assessments of climate change vulnerability, including for all Amazon bird and amphibian species, are supplied (Supplementary Online Material, Appendices A and B), and the detailed trait data underlying assessment are available on request. Amongst the most valuable outcomes were lists of the most vulnerable families and species, and spatial analyses showing where highest and lowest numbers of vulnerable species occur. Also of great interest was how these areas relate to the where species threatened by non-climate change related threats are concentrated. We discuss these results in more detail below.
The Amazon basin emerges as the area of highest and largest concentration of climate change vulnerable bird species globally (purple areas in Figure 3a). This is followed, at lower concentrations, by Mesoamerica, Eastern Europe through central to eastern Asia (excluding the Himalayan Plateau), the Congo basin and tropical West Africa, the Himalayas and Malesia. We also identified areas where high proportions of species are highly vulnerable (i.e. the number of vulnerable species relative to the total number of species occurring there) (purple areas in Figure 3b). This highlighted, firstly, the Arctic coastal regions where the relatively few species occurring there are almost all at high risk from climate change. The Amazon again emerges as a high concentration area, suggesting that its very high species richness is only part of the reason for the high concentration of vulnerable species shown in Figure 3a. Other areas where high proportions of the species occurring there are vulnerable (i.e. even though species richness may be lower) include Northern Eurasia, the Black Sea and Himalayas, the Southern oceans between c.30-60 oS, the central Andes, parts of the Eastern Sahara, tropical West Africa to Congo basin and Sundaland.
For amphibians, the Amazon emerges again as the region with the greatest and largest concentrations of climate change vulnerable species (purple areas of Figure 3c), as well as having very high proportions of at-risk species (i.e. relative to the total number of species occurring there) (Figure 3d). As with birds, this again emphasizes the region’s extremely high risk and reinforcing its prominence as a priority. High proportions of climate change vulnerable amphibians are also found in the northern Andes, Mesoamerica, Eastern Russia and Mongolia, the Himalayas, parts of North Africa, north of the Caspian Sea and western and eastern Arabia.
Figure 3 a-d also identify areas where species are predicted to have a relative degree of ‘escape’ from climate change. These include areas highlighted in blue which contain high concentrations of species that have biological traits conferring high biological susceptibility (i.e., high sensitivity and low adaptive capacity) but have relatively lower exposure. Such areas include northern and eastern North America for birds and the Congo Basin for amphibians. ‘Lucky escape’ areas also include those highlighted in yellow that contain high concentrations of highly exposed species but that where specie have biological traits that make them relatively more robust (i.e., lower sensitivity and higher adaptive capacity). Such areas include western and southern North America for both birds and amphibians.
To investigate how spatial patterns of climate change vulnerability relate to non-climate change related threat, we included bivariate plots of total numbers of climate change vulnerable and threatened (according to the IUCN Red List) species for birds and amphibians (Figure 4). This revealed that, for birds, the overlap between the two was high including much of the earth’s land and ocean surface, while for amphibians, there is very little overlap (purple areas). Areas of high climate change vulnerability but low historic threat (shown in yellow) are important new priorities for conservation since they have not previously been considered as at risk by global spatial conservation prioritisation initiatives (e.g., Biodiversity Hotspots (Myers et al., 2000)). Most prominent among these for both birds and amphibians, and considering both numbers of species and extent of area, is the Amazon.
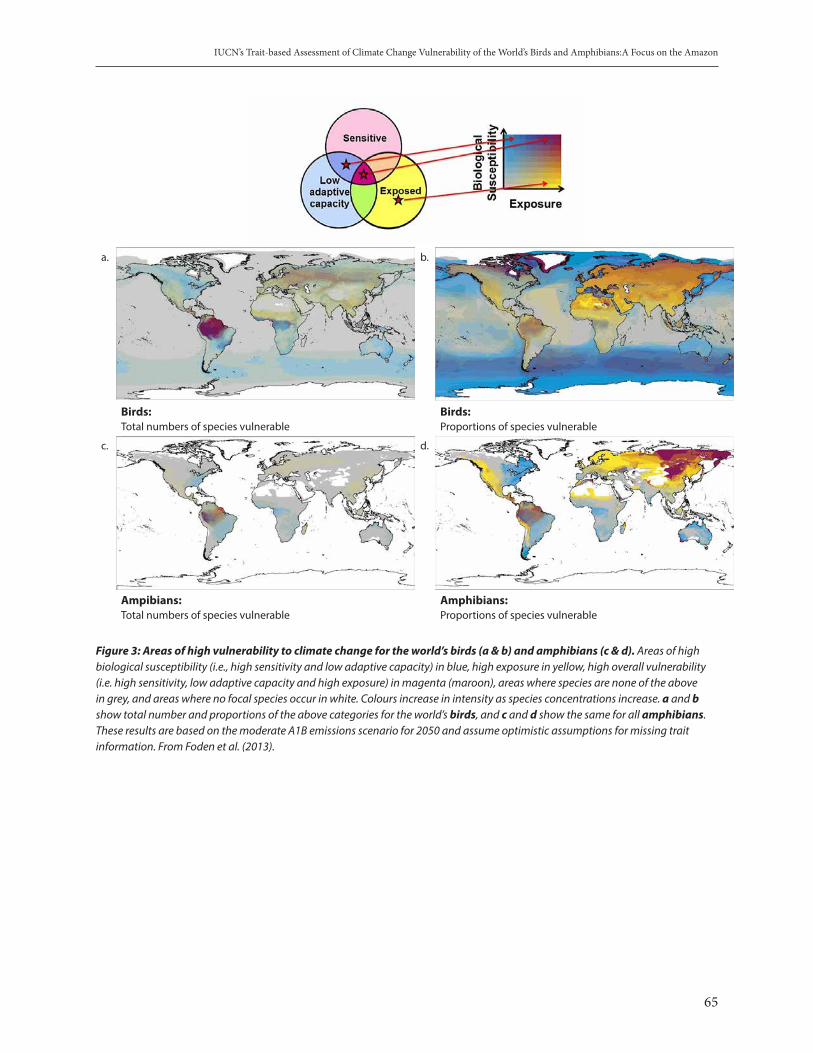
65
IUCN’s Trait-based Assessment of Climate Change Vulnerability of the World’s Birds and Amphibians:A Focus on the Amazon
a. b.
Birds:Total numbers of species vulnerable
Birds:Proportions of species vulnerable
c. d.
Ampibians:Total numbers of species vulnerable
Amphibians:Proportions of species vulnerable
Figure 3: Areas of high vulnerability to climate change for the world’s birds (a & b) and amphibians (c & d). Areas of high biological susceptibility (i.e., high sensitivity and low adaptive capacity) in blue, high exposure in yellow, high overall vulnerability (i.e. high sensitivity, low adaptive capacity and high exposure) in magenta (maroon), areas where species are none of the above in grey, and areas where no focal species occur in white. Colours increase in intensity as species concentrations increase. a and b show total number and proportions of the above categories for the world’s birds, and c and d show the same for all amphibians. These results are based on the moderate A1B emissions scenario for 2050 and assume optimistic assumptions for missing trait information. From Foden et al. (2013).

66
IUCN’s Trait-based Assessment of Climate Change Vulnerability of the World’s Birds and Amphibians:A Focus on the Amazon
a. b.
Birds:Total numbers
Amphibians:Total numbers
Figure 4: Concentrations of species that are both climate change vulnerable and threatened by non-climate stressors. Areas with high concentrations of species that are climate change vulnerable only are in yellow, threatened species (according to the IUCN Red List) only are in blue, and areas with high concentrations of both are shown in maroon. The log of total numbers of these birds and amphibians are represented by a and b respectively. Grey areas show where species are present but concentrations of species that are either climate change vulnerable or threatened are low; colours increase in intensity as species concentrations increase. These results are based on the moderate A1B emissions scenario for 2050 and assume optimistic assumptions for missing trait information. From Foden et al. (2013)
Figure 5: Framework to assess the impacts of climate change on species. Combinations of the three dimensions of climate change vulnerability, namely sensitivity, exposure and low adaptive capacity describe four distinct classes of climate change vulnerable species, each with particular implications for conservation prioritisation and strategic planning. Species that are ‘highly climate change vulnerable’ (1), being sensitive, exposed and of low adaptive capacity, are of greatest concern. They are the first priority for monitoring responses to climate change and for assessment of the interventions needed to support them. ‘Potential adapters’ (2) are sensitive and exposed (but high adaptive capacity) species that may be able to mitigate negative climate change impacts by dispersal or microevolution, although close monitoring is needed to verify this. ‘Potential persisters’ (3) have low adaptive capacity and are exposed (but are not sensitive) so may be able to withstand climate change in situ by themselves, but again, monitoring is needed to ensure that the assumptions about insensitivity are realized in practice. Finally, species of ‘high latent risk’ (4) have low adaptive capacity and are sensitive (but are not exposed). Although not of immediate concern if climate change projections and emissions scenarios are accurate, they could become climate change vulnerable if exposed beyond selected time frames (e.g., 2050). From Foden et al. (2013).
67
IUCN’s Trait-based Assessment of Climate Change Vulnerability of the World’s Birds and Amphibians:A Focus on the Amazon
CONCLUSION
The IUCN’s trait-based climate change vulnerability assessment enabled the first systematic assessment of climate change vulnerability at global scale and for all members of entire taxonomic groups. Assessing climate change vulnerability is an important step in the developent of climate change adaptation plans (e.g., Glick et al., 2011; Cross et al., 2012; Stein et al., 2014), as well as for informing conservation prioritisation and policy development. By classifying species according to their sensitivity, adaptive capacity and exposure, the IUCN’s method helps to inform subsequent steps such as the development of adaptation management and action plans (Figure 5). Climate change vulnerability assessment is, however, a new field and many areas require further development. Of high priority are ground-truthing of assessments and inclusion of the impacts of humans responding to climate change in climate change vulnerability assessments.
The IUCN study of the world’s birds and amphibians reveals that the Amazon contains both large numbers and high proportions of climate change vulnerable species for both groups. While previous studies based on projected exposure to climate change have suggested that the Amazon is at high risk due to the intensity and type of climatic change projected there, as well to El Niño effects, this study adds consideration of the biological susceptibility of the species occurring there to these changes. The region’s co-occurrence of high climate change exposure and high biological susceptibility to this is of enormous concern.
Because the Amazon region has historically had relatively low proportions of species threatened by non-climate change related threats, it has not previously been flagged in assessments of global conservation priority (e.g. Biodiversity Hotpots (e.g., Myers et al., 2000)). The IUCN findings, amongst others, show that the rapidly emerging threat of climate change necessitates urgent reconsideration of this. This is underscored by the Amazon region’s enormous value for carbon storage and hence for climate change mitigation. Effective conservation protection in the area will minimise non-climatic threats to the region’s species, thereby maximising their inherent ability to adapt to climate change. Enhancing this through proactive, ambitious and well-coordinated climate change adaptation strategies is clear and urgent need.
ACKNOWLEDGEMENTS
The IUCN’s global climate change vulnerability assessment was the product of many authors’ work, principally: Georgina Mace, Stuart Butchart, Simon Stuart, Jean-Christophe Vié, Resit Akçakaya, Ariadne Angulo, Lyndon DeVantier, Alexander Gutsche, Emre Turak E, Long Cao, Simon Donner, Vineet Katariya, Rodolphe Bernard, Robert Holland, Adrian Hughes, Susannah O’Hanlon, Stephen Garnett and Cagan Şekercioğlu. A much broader body of scientists and experts contributed to defining traits and gathering species information, and are listed in full in Foden et al. (2013). In particular, I thank the many thousands of contributers to the IUCN Red List of Threatened Species, without whom such studies would not be possible. I also thank the CBD secretariat and Lily Rodrigues for coordinating the Amazon-focused workshop and this publication. I’m very grateful to Pedro Mayor & Richard Bodmer for constructive input into this chapter.
REFERENCES
Cross M.S., Zavaleta E.S., Bachelet D., Brooks M.L., Enquist C.A.F., Fleishman E., Graumlich L.J., Groves C.R., Hannah L., Hansen L., Hayward G., Koopman M., Lawler J.J., Malcolm J., Nordgren J., Petersen B., Rowland E.L., Scott D., Shafer S.L., Shaw M.R., & Tabor G.M. (2012) The Adaptation for Conservation Targets ( ACT ) Framework: A Tool for Incorporating Climate Change into Natural Resource Management. Environmental Management, 50, 341–351.
Deutsch C.A., Tewksbury J.J., Huey R.B., Sheldon K.S., Ghalambor C.K., Haak D.C., & Martin P.R. (2008) Impacts of climate warming on terrestrial ectotherms across latitude. Proceedings of the National Academy of Sciences of the United States of America, 105, 6668–6672.
Foden W., Mace G., Vié J., Angulo A., Butchart S., Devantier L., Dublin H., Gutsche A., Stuart S., & Turak E. (2008) Species susceptibility to climate change impacts. Wildlife in a changing world - an analysis of the 2008 IUCN Red List of threatened species (ed. by J.-C. Vié, C. Hilton-Taylor, and S.N. Stuart), pp. 77–88. Lynx, Barcelona, Spain.

68
IUCN’s Trait-based Assessment of Climate Change Vulnerability of the World’s Birds and Amphibians:A Focus on the Amazon
Foden W.B., Butchart S.H.M., Stuart S.N., Vié J.-C., Akçakaya H.R., Angulo A., DeVantier L.M., Gutsche A., Turak E., Cao L., Donner S.D., Katariya V., Bernard R., Holland R.A., Hughes A.F., O’Hanlon S.E., Garnett S.T., Şekercioğlu Ç.H., & Mace G.M. (2013) Identifying the World’s Most Climate Change Vulnerable Species: A Systematic Trait-Based Assessment of all Birds, Amphibians and Corals. PLoS ONE, 8, e65427.
Foden W.B. & Young B.E. (2016) IUCN SSC Guidelines for Assessing Species ’ Vulnerability to Climate Change. Version 1.0. Occasional Paper of the IUCN Species Survival Commission No. 59. IUCN Species Survival Commission, Cambridge, UK.
Fu R., Yin L., Li W., Arias P.A., Dickinson R.E., Huang L., Chakraborty S., Fernandes K., Liebmann B., Fisher R., & Myneni R.B. (2013) Increased dry-season length over southern Amazonia in recent decades and its implication for future climate projection. Proceedings of the National Academy of Sciences, 110, 18110–18115.
Glick P., Stein B.A., & Edelson N.A. (2011) Scanning the conservation horizon: a guide to climate change vulnerability assessment. National Wildlife Federation, Washington D.C.
IPCC (2013) Annex I: Atlas of Global and Regional Climate Projections. Climate Change 2013: The Physical Science Basis. Contribution of Working Group I to the Fifth Assessment Report of the Intergovernmental Panel on Climate Change (ed. by G.J. van Oldenborgh, M. Collins, J. Arblaste, J.H. Christensen, S.B. Power, M. Rummukainen, and T. Zhou), pp. 1–84. Cambridge University Press, Cambridge and New York.
IUCN (2014) Guidelines for Using the IUCN Red List Categories and Criteria (Version 11).
Myers N., Mittermeier R. a, Mittermeier C.G., da Fonseca G. a, & Kent J. (2000) Biodiversity hotspots for conservation priorities. Nature, 403, 853–8.
Pacifici M., Foden W.B., Visconti P., Watson J.E.M., Butchart S.H.M., Kovacs K.M., Scheffers B.R., Hole D.G., Martin T.G., Akçakaya H.R., Corlett R.T., Huntley B., Bickford D., Carr J.A., Hoffmann A.A., Midgley G.F., P. P.-K., Pearson R.G., Williams S.E., Willis S.G., Young B., & Rondinini C. (2015) Assessing species vulnerability to climate change. Nature Climate Change, 5, 215–225.
Platts P.J., Garcia R.A., Hof C., Foden W., Hansen L.A., Rahbek C., & Burgess N.D. (2014) Conservation implications of omitting narrow-ranging taxa from species distribution models, now and in the future. Diversity and Distributions, 20, 1307–1320.
Segan D.B., Hole D.G., Donatti C.I., Zganjar C., Martin S., & Watson J. (2015) Considering the impact of climate change on human communities significantly alters the outcome of species and site-based vulnerability assessments. Diversity & Distributions, 21, 1101–1111.
Stein B.A., Glick P., Edelson N., & Staudt A. (2014) Climate-Smart Conservation: Putting Adaptation Principles into Practice. .
Willis S.G., Foden W., Baker D.J., Belle E., Burgess N.D., Carr J., Doswald N., Garcia R.A., Hartley A., Hof C., Newbold T., Rahbek C., Smith R.J., Visconti P., Young B.E., & Butchart S.H.M. (2015) Integrating climate change vulnerability assessments from species distribution models and trait-based approaches. Biological Conservation, 190, 167–178.

69
Biodiversity Data for Climate Change Research and Policy
BIODIVERSITY DATA FOR CLIMATE CHANGE RESEARCH AND POLICY
Tim HirschGlobal Biodiversity Information Facility (GBIF) Secretariat
INTRODUCTION
Understanding better the links between climate change and biodiversity is critical not only to developing rational strategies for mitigating and adapting to climate change, but also to framing adequate responses to the multiple pressures on biodiversity and the ecosystem services it underpins. A growing body of research explores these links at multiple scales and dimensions, primarily through use of models to predict the response of biodiversity to different scenarios of climate change. Such research helps to inform action in a wide range of policy areas, some relating specifically to biodiversity goals such as adequate coverage of protected areas, conservation of threatened species and reducing the threats from invasive alien species; but others addressing wider sustainable development goals including food security, support for human livelihoods and reducing the risks to human health from emerging infectious diseases. The quality and usefulness of this research depends critically on the availability of adequate data on the spatial distribution of species over time (primary biodiversity data). Scarcity and unevenness of such data in forms that can be readily accessed remains a major barrier affecting the accuracy of biodiversity models and scenarios, and thus the quality of information available for developing adequate climate change and biodiversity policies. Nevertheless, important progress has been made in overcoming the barriers to biodiversity data mobilization, through development of common data standards, technical infrastructures to facilitate discovery of and access to primary biodiversity data, and the construction of collaborative networks and policies to promote open access and re-use of data. This paper outlines current progress in mobilizing biodiversity data, offers examples of its use in research relevant to climate change, and suggests actions to scale up the availability of such data.
BIODIVERSITY DATA SOURCES
Primary biodiversity data is defined as the digital text or multimedia records detailing facts about the occurrence of organisms. At its most basic, this data documents the ‘what, where, when, how and by whom’ relating to exploration of the planet’s biological resources. In other words, which taxa have been found to occur in a particular place and time; through which methods of sampling, observation and identification; and by which individuals or research teams. Sources of such data are many and varied, ranging from evidence returned from the earliest days of natural history exploration to contemporary and ongoing monitoring programmes and observations by citizens and communities across the planet. Improving the data available for biodiversity research and policy involves assembling data from all of these sources in formats that enable them to be efficiently exchanged, integrated, discovered and analysed. The major sources potentially contributing to the body of available primary biodiversity data are:
• Natural history collections held by institutions around the world, including zoological museums, herbaria and other collections in which the primary evidence of species occurrence is a physical specimen brought back from the field and preserved for future examination. Converting or mobilizing such evidence into useful data involves a process of digitization in which, for example, the contents of specimen labels are transcribed to document species names, dates and locations of collection, as well as imaging to enable remote examination of the specimen;
• Natural history literature published over time, either in paper form or electronically. A wealth of data on the occurrence of species is embedded in such publications, but needs to extracted in formats that enable it to be

70
Biodiversity Data for Climate Change Research and Policy
integrated and discovered along with other sources of data. Projects such as the Biodiversity Heritage Library1 provide an invaluable service by imaging thousands of historic publications and enabling text to be searched, for example by species names, using optical character recognition (OCR) techniques;
• Research data assembled for peer-reviewed studies in academic journals. While species occurrence data collected from the field are often provided as supplementary materials accompanying research articles, and are increasingly deposited in data repositories, they remain in diverse formats and need to be standardized to enable efficient discovery and re-use;
• Biodiversity monitoring projects carried out for diverse purposes including protected area management, species recovery plans and environmental impact assessment. Data from such monitoring, including remote sensing such as through camera traps and satellite tracking, also remain in many different formats and dispersed across multiple databases or isolated in inaccessible documentation.
• Citizen/volunteer observation networks provide an increasingly important source of data on the occurrence of species over time. In some countries, voluntary nature recorders have for decades provided detailed observations enabling fine-scaled analysis of biodiversity changes, while the recent availability of smartphones with global positioning software has revolutionized the ability of citizen scientists to contribute primary biodiversity data.
MOBILIZING DATA FOR RESEARCH AND POLICY
Use of common data standards
A critical step in the mobilization of primary biodiversity data for use in research and policy is to express data using commonly-agreed standards that enable efficient sharing, integration and re-use. In contrast to other domains, widely-accepted standards are available for expressing species occurrence data that are relatively simple to use, and enable datasets using such standards to be harvested and indexed by a range of aggregator platforms, such as the Global Biodiversity Information Facility’s GBIF.org2 and national, regional and thematic platforms (for example the Ocean Biogeographic Information System3 for marine data) developed by the biodiversity informatics community. These standards are mediated through Biodiversity Information Standards, also known as the Taxonomic Databases Working Group (TDWG).4 For species occurrence data, the most commonly accepted standards are Darwin Core (DwC)5 and Access to Biological Collections Data (ABCD).6 Tools and training resources are available to convert data collected using different formats, including simple spreadsheet data, where necessary mapping data fields into appropriate columns to enable this standardization.
Data publication, integration and discovery
Once biodiversity datasets are organized into appropriate standards, data-holding institutions may choose to share or ‘publish’ their data through open-access platforms such as GBIF.org, using exchange formats that enable automated harvesting and retain full information about the provenance of the data. The preferred exchange format for publishing through GBIF is Darwin Core Archive (DwC-A)7, a zipped file which associates core data files with metadata documents providing rich information about the dataset.
To make biodiversity data accessible for indexing and wider discovery, institutions make these data files available from their own or shared servers via an online access point registered with the aggregating platforms. In the case of GBIF and
1 www.biodiversitylibrary.org 2 www.gbif.org 3 http://www.iobis.org 4 www.tdwg.org 5 http://www.tdwg.org/activities/darwincore/ 6 http://www.tdwg.org/activities/abcd/ 7 https://www.gbif.org/darwin-core

71
Biodiversity Data for Climate Change Research and Policy
a growing number of other platforms, this is facilitated through use of freely-available software such as the Integrated Publishing Toolkit (IPT)8 which enables automated harvesting of data into centralised databases, as well as providing a local platform to showcase data mobilized by particular institutions and networks.9
Data published in this way are indexed by GBIF and other platforms enabling users to search and download records based on a range of search criteria, including by species or other taxon name, coordinates or country of occurrence, date range or basis of record (e.g. specimen, observation). This is the means by which researchers or policy makers can bring together species occurrence data relevant to their particular area of interest, often combining large volumes of records, sometimes numbering in the millions and derived from many different data sources. Importantly, all records obtained in this way retain full information about the context of the records so that users can judge the reliability of the data and include adequate citation of the original sources (see next section).
Addressing barriers to open access to biodiversity data
While well-proven means now exist to provide open access to biodiversity data, realizing the full potential of this process requires continuous efforts to overcome a range of barriers. These can broadly be divided into technical barriers, institutional barriers and social/economic barriers that limit the volume of data that is currently available to improve knowledge about biodiversity and its links with climate change.10
Technical barriers. As described above, organizing biodiversity data into formats suitable for efficient exchange and discovery requires understanding of the relevant standards and best practices, as well as access to stable servers that enable data to be harvested and updated by aggregating networks. Collaborative initiatives such as GBIF and its partner institutions (national and thematic nodes) can help to support these technical needs through capacity and training initiatives (see capacity section below), and through provision of pooled data hosting arrangements in which lower-capacity institutions may use shared facilities provided by higher-capacity partners and networks as a platform from which to make data available for wider access.
Institutional barriers. A major challenge exists in many countries to encourage collaboration between various national institutions that each hold relevant biodiversity data, but collect and store them using different formats and separate databases. The establishment of national biodiversity information facilities with a coordinating node institution, with a clear mandate and transparent governance structure, can help to overcome these barriers and encourage pooling of data using common standards across different ministries and agencies.11
Social and economic barriers. Mobilization of biodiversity data for open access and re-use involves challenging accepted and often engrained practices among professional and institutional communities that are reluctant or unable to share data for a variety of reasons. Scientists often feel that sharing data is not in their professional interest since credit arises from the impact of their published research, and data sharing may be perceived as a professional risk if others use data for research which does not credit the originators of that data. Research funding agencies and academic publishers can each play an important role in requiring good practices on data publication from funded research projects and articles accepted for publication. Incentives can also be provided through mechanisms to enable proper recognition and citation for data publication, for example with the growing practice of publishing ‘data papers’ in journals, in which peer review is applied to descriptions of openly-available datasets, citable in the same way as research papers.12 In addition, the use of Digital Object Identifiers (DOI) both for datasets and data downloads through GBIF provides practical means for
8 www.gbif.org/ipt 9 See for example http://data.canadensys.net/ipt/ which brings together datasets mobilized from natural history collections in Canada.10 A review of barriers to the sharing of biodiversity data and information, with recommendations for eliminating them, was compiled by the
Friends of the Conservation Commons and published as an information document to CBD COP11, UNEP/CBD/COP/11/INF/811 For guidance on coordinating national data mobilization activities, see GBIF Secretariat 2015. Establishing an Effective GBIF
Participant Node: Concepts and general considerations. Copenhagen. Available online at https://www.gbif.org/document/80925/establishing-an-effective-gbif-participant-node.
12 See https://www.gbif.org/data-papers

72
Biodiversity Data for Climate Change Research and Policy
proper data citation even when using large volumes of data, thus returning credit to those sharing data in standard formats and giving greater visibility to data holdings.13
Mobilization of digital data for re-use also requires investment, but remains low on the priorities for many institutions operating on tight budgets. Governments should consider support for such investment as part of the commitment to achieving goals related to biodiversity, climate change and sustainable development, for example progress towards Aichi Biodiversity Target 19 on the sharing of biodiversity knowledge. Identifying key data gaps and prioritizing digitization of collections, as well as training for relevant professionals, can focus such investment on areas where they will have the most impact.
Data quality and fitness for use
The principle of free and open access to biodiversity data brings with it significant challenges regarding quality and the fitness of such data for use in different applications for research and policy. The nature of an open publication process necessarily means that data will be of variable precision, accuracy and completeness. GBIF encourages application of data quality tools prior to publication, and many national or thematic data aggregating facilities will carry out significant data cleaning prior to sharing through the global network. Additionally, GBIF applies automated tools that will, for example, match species names to a taxonomic backbone (including identification of synonyms) drawing from sources such as the Catalogue of Life14, and will flag obvious errors such as a mismatch between geographic coordinates and the country of origin. Varying levels of precision and certainty of geolocation may also be included in the data itself, for example in cases where publishers wish to generalize the location of a threatened or valuable species. GBIF continuously seeks to improve the quality of data shared through its network, including through better signposting of data quality indicators and processing of user feedback. However, caution is always advised and most research uses involve significant data cleaning: near-term plans involve developing ‘reference datasets’ whereby pre-cleaned data arising from research is preserved and indexed for future discovery and re-use.
GBIF – PROGRESS TO DATE IN GLOBAL COLLABORATION ON OPEN ACCESS TO BIODIVERSITY DATA
The Global Biodiversity Information Facility (GBIF) was established in 2001 by governments under a non-binding Memorandum of Understanding, with the aim of promoting and facilitating free and open access to biodiversity data via the Internet, for the benefit of science, society and a sustainable future.15 It operates through a secretariat in Copenhagen, providing the technical infrastructure for publishing and accessing data, and coordinating activities of a network of nodes established by GBIF’s participating countries and organizations. Funding is provided through its ‘Voting Participants’, governments that agree to fund the core activities of the network through a Work Programme and secretariat costs, with recommended national contributions based on a formula linked to GDP and a discount for countries with lower per capita GDP.16
To date, 57 countries and 39 international organizations participate formally in GBIF as members of the Governing Board.17 Membership is concentrated in particular regions, especially western Europe, North America, Oceania and Latin America, with some representation from Africa (16 countries) but few Participants in Asia (six countries), and large membership gaps in the Middle East and Eastern Europe. Nevertheless the data published through participating institutions has a much wider global reach than the membership suggests, as data from natural history collections and observer networks brings together specimens and observations from all over the world so that
13 See http://www.gbif.org/newsroom/news/ipt-release-supports-doi-citation14 http://www.catalogueoflife.org15 GBIF (2010) GBIF Memorandum of Understanding. Copenhagen: Global Biodiversity Information Facility, 20 pp. Accessible online at http://
www.gbif.org/resource/80661.16 http://www.gbif.org/governance/governing-board 17 See https://www.gbif.org/the-gbif-network

73
Biodiversity Data for Climate Change Research and Policy
electronic publication acts as a means of ‘data repatriation’ to researchers and decision makers in countries from which these records were obtained. In addition, some associate members such as thematic networks, the Chinese Academy of Sciences and the Taiwan Biodiversity Information Facility (TaiBIF) mobilize data from outside the formal country membership.
Taken together, GBIF brings together more than 850 million species occurrence records relating nearly one million species, shared through more than 35,000 datasets published by over 1,100 institutions. This volume of data continues to grow year by year (see Figure 1), and mobilization of data through GBIF over time is now used as an indicator of progress towards Aichi Biodiversity Target 19 through the Biodiversity Indicators Partnership18, and was also used as an indicator for the same target in the Fourth Global Biodiversity Outlook (GBO4).19
Figure 1: Number of species occurrence records available through GBIF.org over time, cumulative (Source: GBIF Secretariat)
Data accessed through GBIF is used in a growing number of peer-reviewed publications covering a wide range of biodiversity-relevant research. Based on literature tracking carried out by the GBIF Secretariat, more than four hundred publications cited use of GBIF.org as a source of data during 2016, with the number for 2017 projected to exceed 700 publications (see Figure 2). These papers include research on invasive alien species, impacts of climate change, species conservation and protected areas, agriculture and human disease risk, and involve a range of scientific disciplines including biogeography, macroecology, taxonomy and phylogenetic studies.20
18 http://www.bipindicators.net/numberofgbifrecordsovertime 19 www.cbd.int/gbo4 20 A summary of the research facilitated by data accessed through GBIF, published during 2016, is at GBIF (2017). 2017 Science Review. 56
pages. Copenhagen: Global Biodiversity Information Facility. Available online at https://www.gbif.org/science-review

74
Biodiversity Data for Climate Change Research and Policy
Figure 2: Number of peer-reviewed publications citing GBIF as a source of data, by year (source: GBIF Secretariat)
DATA USE IN CLIMATE-RELEVANT RESEARCH
A significant proportion of the research assisted by access to data through GBIF.org relates in some way to the interaction between climate change and biodiversity. Some of the policy-relevant thematic areas in which such research is focussed are given below, with examples in each area. Further examples of climate-related research making use of data through GBIF can be examined at https://www.gbif.org/resource/search?contentType=literature&topics=CLIMATE_CHANGE.
Conservation planning
Design of policies on the siting of protected areas and recovery plans for threatened species depends crucially on understanding the future climate conditions affecting ecosystems under different scenarios. Species occurrence data accessed through GBIF is commonly used to generate models estimating the areas likely to be suitable as future habitats for particular species or groups of species, based on the ‘climate envelopes’ or niches demonstrated by past and present occurrences – in other words the range of temperature, precipitation and other variables within which these species exist. Such research can be invaluable to ensure that conservation policies remain effective into the future.
Example: Ramirez et al. (2014)21 used species distribution models to design conservation strategies for tropical Andean biodiversity under climate change. The study assessed likely changes to the climate niche size for Andean species, modelling more than 11,000 bird and vascular plant species. Using occurrence data from GBIF among other sources, the study concluded that by the 2050s, more than 50 per cent of species would experience a reduction in their niche of over 45%, and 10% would face extinction. It recommended a landscape-network approach to conservation to enable biodiversity in this region to adapt to climate change.
Invasive alien species
Many studies use occurrence data of invasive alien species, both in their native and introduced ranges, to model the areas most at risk from future invasions. These studies focus mainly on risk areas based on current climatic and environmental conditions, but some research has also assessed the likely changes in invasion risk based on anticipated future climate conditions.
21 Ramirez-Villegas, J., Cuesta, F., Devenish, C., Peralvo, M., Jarvis, A., & Arnillas, C. A. (2014). Using species distributions models for designing conservation strategies of Tropical Andean biodiversity under climate change. Journal for Nature Conservation, 22(5), 391–404. http://doi.org/10.1016/j.jnc.2014.03.007

75
Biodiversity Data for Climate Change Research and Policy
Example: Bellard et al. (2013)22 used models to project future suitable areas for the one hundred worst invasive species as assessed by IUCN. The study used GBIF to access occurrence data for 87 of these species. Based on future climate and land-use changes, it concluded that invasion risk is likely to increase by 2100 in temperate regions, while many tropical regions are likely to become less suitable for invasive species. It projected that the ranges of invasive amphibians and birds are likely to contract, while those for aquatic and terrestrial invertebrates will likely expand.
Agriculture and food security
Many studies use biodiversity data to examine the impact of climate change on future agriculture and food security, both by projecting changes in areas suitable for growing particular crops, and by assessing the current and future distribution of the wild relatives of important crops that will be increasingly needed as a genetic resource to develop future crop varieties resilient to climate change.
Example: Vincent et al. (2013)23 developed a global inventory of crop wild relatives most critical to food security under climate change. Based on 173 priority crops, 1,667 plant taxa were considered to be globally important. Using data from GBIF among other sources, the research identified West Asia, China and southeast Europe as having the highest number of priority crop wild relatives, while China, Mexico and Brazil were identified as high-priority countries for further collection of wild plants.
Targeting human health risks
An emerging research use of biodiversity data is the assessment of risk to human populations from infectious diseases spread by animal hosts. Modelling of present and future distribution of host or ‘reservoir’ species, based on climate change scenarios, can help to predict changes in areas most at risk from these diseases, and thereby focus resources on detection, prevention and treatment strategies.
Example: Thomassen et al. (2013)24 modelled predicted range shifts of the Human Monkeypox virus, an emerging infectious disease, in response to climate change in Central Africa. The research looked at projected distribution changes for 11 mammals identified as reservoirs of this disease, including pangolins, porcupines, monkeys, rats and rope squirrels. Occurrence records for these species, accessed through GBIF and other networks, provided the biodiversity data for these models. The research concluded that based on IPCC scenarios for the 2050s and 2080s, the disease was likely to shift eastwards with greater risk in eastern Democratic Republic of Congo, Uganda, Kenya and Tanzania. The study suggested using these models to prioritize future surveillance for outbreaks of this disease.
CAPACITY NEEDS IN BIODIVERSITY DATA MOBILIZATION AND USE
To enable continued progress in the mobilization of data that helps to address the impact of climate change on biodiversity, important capacity constraints in many countries need to be overcome. As already mentioned, the volume of data shared from natural history collections and observation networks is overwhelming concentrated in the developed world, although regions such as Latin America are making rapid advances in biodiversity data publication from their own collections and networks.25
Collaboration through networks such as GBIF can assist countries in developing the capacity to mobilize and access data essential for better understanding of biodiversity and its links with climate change. A capacity enhancement programme helps participant countries in GBIF to develop mentoring and training projects making use of the expertise
22 Bellard, C., Thuiller, W., Leroy, B., Genovesi, P., Bakkenes, M., & Courchamp, F. (2013). Will climate change promote future invasions? Global Change Biology, 19(12), 3740–8. http://doi.org/10.1111/gcb.12344
23 Vincent, H., Wiersema, J., Kell, S., Fielder, H., Dobbie, S., Castañeda-Álvarez, N. P., … Maxted, N. (2013). A prioritized crop wild relative inventory to help underpin global food security. Biological Conservation, 167, 265–275. http://doi.org/10.1016/j.biocon.2013.08.011
24 Thomassen, H. A., Fuller, T., Asefi-Najafabady, S., Shiplacoff, J. A. G., Mulembakani, P. M., Blumberg, S., … Rimoin, A. W. (2013). Pathogen-Host Associations and Predicted Range Shifts of Human Monkeypox in Response to Climate Change in Central Africa. PLoS ONE, 8(7), e66071. http://doi.org/10.1371/journal.pone.0066071
25 See for example http://www.gbif.org/newsroom/news/brazil-flora-fungi

76
Biodiversity Data for Climate Change Research and Policy
and experience of other biodiversity information networks to enable access to data held in national institutions and ongoing monitoring programmes.26 In addition, the Biodiversity Information for Development (BID) programme, funded by the European Union, is providing €3.9m over four years (2015-2018) to projects supporting mobilization of biodiversity data for priority information needs in Africa, the Caribbean and Pacific.27 A Biodiversity Information Fund for Asia (BIFA), using funds provided by the Government of Japan, is also supporting projects in the region to improve the availability of data.
Funds available for developing biodiversity informatics capacity are still relatively modest, and need to be scaled up if existing progress is to be accelerated and sustained into the future. The ability of countries to mobilize biodiversity data is often concentrated in the expertise of a very few individuals, making such efforts vulnerable to being short-lived, and the relevant skills must be built into educational programmes and curricula if the continuing need for data access is to be met into the future.
CONCLUSIONS
This paper has focussed on the actions needed to mobilize biodiversity data from existing sources, and to make it available to research and policy related to climate change. In itself this is a major undertaking, and the same skills and practices will be needed to maintain access to new sources of data as they become available. Other networks such as the Group on Earth Observations Biodiversity Observation Network (GEO BON) are assisting governments to design monitoring programmes to capture the data needed to understand the status and trends of biodiversity going into the future, for example through the development of Essential Biodiversity Variables.28 Close collaboration between all initiatives in the area will be needed.
An encouraging development is the emphasis placed recently by the Convention on Biological Diversity (CBD) on the importance of improved data access and monitoring arrangements to meeting the Aichi Biodiversity Targets under the Strategic Plan for Biodiversity 2011-2020. The 13th meeting of the Conference of Parties to the CBD (COP 13) invited Parties and relevant organizations to further promote open access to biodiversity-related data, through use of voluntary guidance with the following components29:
• Promote open data access through policy initiatives
• Promote the use of common data standards
• Invest in the digitization of natural history collections
• Establish national biodiversity information facilities
• Enhance national capacity in biodiversity informatics
• Engage the public in biodiversity observation through citizen science networks
• Encourage data sharing from the private sector
• Develop national platforms for data discovery, visualization and use
• Analyse data and information gaps to prioritize new data mobilization
• Engage with and support regional and global networks for data mobilization and access.
Action on all these fronts will greatly enhance the availability of data to inform research and policy on biodiversity, and in particular strengthen the understanding of how decisions can better address the interactions of biodiversity and climate change, essential for meeting the global community’s priorities for sustainable development.
26 https://www.gbif.org/programme/82219/capacity-enhancement-support-programme 27 http://www.gbif.org/programme/bid 28 http://geobon.org 29 CBD/COP/DEC/XIII/31

77
Wireless Sensor Networks and Analytics as Emerging Tools for a Paradigm Shift on Environmental Monitoring
WIRELESS SENSOR NETWORKS AND ANALYTICS AS EMERGING TOOLS FOR A PARADIGM SHIFT ON ENVIRONMENTAL MONITORING
Arturo Sanchez-AzofeifaEarth and Atmospheric Sciences Department, University of Alberta. Edmonton, Alberta, Canada T6G2E3. [email protected]
1. INTRODUCTION
One common denominator observed over the last few decades, as part of consolidated global environmental monitoring efforts, is the realization that each year is becoming hotter than the previous one. In fact, early in 2016, NASA and NOAA reported that 2015 was the hottest year on record, setting heat records across the globe and causing droughts across many Latin American countries (NOAA 2016). Areas that have been more affected by this warming trend can be found in Central America, northern Colombia and northeast Brazil.
The impact of this sustained warming trend is not only economic but it can be reflected on biodiversity degradation trends as documented by Pounds et al. (2006) or on the lost of ecosystem services in areas that depend highly on water availability (Portillo-Quintero et al. 2014). It is clear that current environmental monitoring systems, although with capacity to provide regional information, lack the ability to provide information at local scale, which in turn, is fundamental for sound decision-making and the detection of causes and effects of climate change (Pounds et al. 2006).
Associated to climate change, its patterns and effects, the science of environmental monitoring is evolving rapidly, as well as the technology that supports it. Every day, we are confronted with the presence of large amounts of information that demand a high degree of synthesis in order to support real time decision-making. Questions dealing with how we can handle, provide quality control mechanisms, analyze and visualize terabytes of information in real time are emerging as local communities suffering the effects of climate change demand answers from national governments. This in turn produces a problem of how well and accurate we can communicate our science to a larger audience right when the even take place. In other words, how can we move from “it happened” to “it is happening.”
In this context, this chapter will first evaluate the evolution of scientific paradigms in the context of environmental monitoring, present the concept of wireless sensor networks as new emerging tool for environmental monitoring, and the analytic methods developed to support such monitoring, and it will close with some final remarks on how they can be considered for the monitoring of the effects of climate change on biodiversity in the years to come.
2. EVOLUTION OF SCIENTIFIC PARADIGMS
Hey at al. on their edited book The Fourth Paradigm presents the evolutions of the three scientific paradigms based on the concepts presented by the Jim Gray (Hey et al. 2009). Gray is considered one of the main forces behind the evolution of eScience and its applications to every every day application. The first scientific paradigm, defined by Gray is defined, as an empirical paradigm on which early scientific knowledge is used to describe a natural phenomena (e.g. the rotation of the earth around the sun). This paradigm evolved over a few hundred years until in the late 17th and 18th centuries when a second paradigm emerged based on the theoretical branch of science. This paradigm was supported by the presence of new mathematical models about our natural environmental, which in turn were used to better understand our natural environment and develop a new range of science ranging from Newton to Einstein. This paradigm was in place until the mid 1950’s when the first computer was developed and a new computational paradigm was born, and used the power of emerging computers to support scientific discoveries via advanced modeling and associated algorithms (e.g. early stock exchange algorithms). It took just a few decades to make this paradigm obsolete with the mergence of what Jim Gray called the fourth paradigm of science driven by eScience. eScience is new a paradigm based on models, computational algorithms on which much of the information is collected by sensors and analyzed in real time. The

78
Wireless Sensor Networks and Analytics as Emerging Tools for a Paradigm Shift on Environmental Monitoring
main characteristic of this new paradigm is that it is data intensive and driven in many cases by the evolution of cellular phones, social media, and analyzed via advanced analytical approaches. In other words, as our every day lives become more driven by fast technological developments (e.g. smartphones), the demand for “real time” information is driving the emergence of this new paradigm at many different societal levels.
When we look at the emergence and evolution of these paradigms, a fundamental question that emerges is how the consolidation of eScience Paradigm is affecting the way that we conduct environmental monitoring, as well research towards understanding the effects of climate change on forest ecosystems. Some basic answers emerge from the evolution of phenological studies. For example Brown et al. (2016) presents examples on how the use of several types of security and other web based cameras can be used as powerful tools to estimate phenological variables key to understanding the impact of climate change on phenological cycles. In addition, Beaubien and Hamann (2011) present how citizen science via several social media mechanisms can also become an important tool for environmental monitoring. This two are just common examples of the emergence of this paradigm. In addition, improvement on sensor design, data loggers and huge advances on wireless communications are impacting the world of environmental monitoring. The emergence of wireless sensor networks, is also a clear example of the evolution of the science paradigms into the XXI century.
3. WIRELESS SENSOR NETWORKS
Wireless sensor networks can be defined as a set of autonomous sensor systems that have the capacity of measuring and storing information as any other sensor/data logger system, plus the capacity of communicating wirelessly with other sensors and data-collector systems, called aggregators, where the information can be send via cellular model, the internet or satellite to a data base where the information can be analyzed in real time (Sanchez-Azofeifa et al. 2011, Rankine et al. 2014). Wireless sensor networks present the opportunity for hyper-temporal sampling and large area coverage currently not provided by conventional, one sensor – one data logger system. Wireless sensor networks allows for real time monitoring micro-meteorological variables and soil moisture to predict phenological variables such as the start of the season, end of season and the duration of the growing season on a forest ecosystem. These variables are key to understand the impact of climate change over tropical dry forest biodiversity. Figure 1 presents an example of a wireless sensor network implemented at the Santa Rosa National Park Environmental Monitoring Super Site, Guanacaste, Costa Rica.
Figure 1: Wireless sensors and nodes deployed at the Santa Rosa National Park, Costa Rica. As part of long term efforts to monitor the impact of climate change on tropical dry forest phenology

79
Wireless Sensor Networks and Analytics as Emerging Tools for a Paradigm Shift on Environmental Monitoring
4. BIG DATA AND ANALYTICS FOR ENVIRONMENTAL AND CLIMATE CHANGE RESEARCH:
The implementation of wireless sensor networks for environmental monitoring has driven the development cyber-infrastructure aimed to provide quality control, metadata generation, analysis and visualization of large data sets (Rankine et al. 2014). In the case of the Santa Rosa Environmental Monitoring Super Site Guanacaste, Costa Rica; the site produces close to 10 billion data points per year product of a combination of wireless sensor data, and two CO2/H2O Eddy covariance towers located on site, and a network of soil CO2 carbon emissions sensors. Such level of data generation and its implementation of real time data algorithms allow for fast data quality and control of the network and rate of data collection among many several benefits, including the possibility of development of advanced mechanisms for equipment maintenance.
One of the major constrains for the implementation of wireless sensor networks and advanced analytics is the inertia present on many governmental organizations to switch their data processing techniques from the 3rd to the 4th Paradigm of Science. In general, many organizations live under the concept of “fact finding paradigm” on which much of the data is analyzed several months after it was collected and deposited on a hard drive. Basically under this concept the user or researcher applies queries to static data. In other words, outcomes to support policy- making is based on “what happened” in many cases months or years ago. The more advanced algorithms is call “current fact finding paradigm” under this concept we work analyzing data in motion, meaning that queries are applied to dynamic data as it is collected. This fundamental philosophical shift on the way that we perceive and collect and analyze information represents core elements on the implementation of wireless sensor networks applied to biodiversity monitoring.
The implementation of wireless sensor networks in combination with cyber-infrastructure mechanism can allows us to develop more smart applications for the conservation of tropical biodiversity. The cyber-infrastructure will allow for the integration of many different types of sensors via real time date integration, the evaluation of real time data in the context of other previous trends to evaluate changes and impacts. Figure 2 presents observations of a wireless sensor network aimed to measure Photosynthetic Active Radiation (PAR) at the Parque Estadual de Montes Claros, Minas Gerais, Brazil. Under this framework, PAR measurements were taken before and after a storm to compare losses on primary productivity in real time. Such application, when translated into economic models which can be used to estimate total losses on ecosystem services.
5. FINAL REMARKS
Understanding the impact of climate change on biodiversity requires a change in our data analysis paradigm. Policy making implementation cannot wait years for data to be analyzed and visualized in order to develop mitigation and adaptation policies. Such approaches must be framed in the context of the 4th paradigm of science on which sensors, cyber-infrastructure and algorithm that can serve to support smart decision-making. It is fundamentally clear that real time decision making is necessary and we need to move from “it happen” to “it is happening,” changes, from governments and organizations along that line of thinking is fundamentally necessary in light of fast transformational changes in the way that we conduct science, and to cope with the pace of technology development. The implementation of this approach at the Santa Rosa National Park, Costa Rica and the Parque Estadual de Mata Seca, Minas Gerais, Brazil are the first step on bringing the 4th paradigm of science in the context of data analytics to analysis of real time impacts of climate change in tropical dry forest environments, which we currently have under early operation.

80
Wireless Sensor Networks and Analytics as Emerging Tools for a Paradigm Shift on Environmental Monitoring
Figure 2: Changes on the Fraction of Photosynthesic Active Radiation at the Parque Estadual de Montes Claros, Minas Gerais Brazil. Observations represent outcomes from a wireless sensor network collecting 5 min data. (source: http://Enviro-net.org).
6. REFERENCES
Beaubien E., Hamann, A (2011). Plant phenology networks of citizen scientists: recommendations from two decades of experience in Canada. International Journal of Biometeorology 55:833–841.
Brown T, Hultine K, Steltzer H, Aubrecht D, DeNicholas J, Denny EG, Denslow MW, Elmendorf M, Granados J, Henderson S, Moore D, Nagai S, SanClements M, Sanchez-Azofeifa A, Sonnentag O, Tazik D, Richardson AD. 2016 Using phenocams to monitor our changing Earth: towards a global phenocam network. Frontiers on Ecology and Environment 14(2): 84–93, doi:10.1002/fee.1222
Hey T, Tansely S, Tolle, K 2009 Jim Gray on eScience: A Transformed Scientific Method. On: The fourth paradigm: Data-intensive scientific discovery, Hey, Tansely, Tole (Eds.), Microsoft Research, Redmond, Washington, USA. 17-31.
New York Times, January 21st 2016 (2016). 2016 was warmest year on historica record, Scientists say. http://www.nytimes.com/2016/01/21/science/earth/2015-hottest-year-global-warming.html?_r=0
NOAA, National Center for Environmental Information. 2016 2015 is Earth’s warmest year by widest margin on record; December 2015 temperature record warm. http://www.ncdc.noaa.gov/sotc/summary-info/global/201512
Portillo-Quintero C, Sanchez-Azofeifa A, Calvo-Alvarado J, Quesada M, do Espirito Santo MM. 2014 The role of tropical dry forests for biodiversity, carbon and water conservation in the neotropics: lessons learned and opportunities for management. Regional Environmental Change 15: 1039–1049.
Pounds JA, Bustamante MR, Coloma LA, Consuegra JA, Fogden MPL, Foster PN, La Marca E, Masters KL, Merino-Viteri A, Puschendorf R, Ron SR, Sánchez-Azofeifa A, Still CJ, Young BE. 2006 Widespread amphibian extinction from epidemic disease driven by global warming. Nature, 439(7073): 161-167.
Rankine CJ, Sanchez-Azofeifa GA, MacGregor MH. 2014 Seasonal wireless sensor network link performance in boreal forest phenology monitoring. 2014 Eleventh Annual IEEE International Conference on Sensing, Communication, and Networking (SECON), 302-310.
Sánchez-Azofeifa A, Rankine C, do Espirito Santo MM, Fatland R, Garcia M. 2011 Wireless sensor networks for environmental monitoring: Two case studies from tropical forests. 2011 IEEE 7th International Conference on eScience. 70-76.

81
Impact of Recent Climate Fluctuations on Biodiversity and People in Flooded Forests of the Peruvian Amazon
IMPACT OF RECENT CLIMATE FLUCTUATIONS ON BIODIVERSITY AND PEOPLE IN FLOODED FORESTS OF THE PERUVIAN AMAZON
Richard Bodmer1,2*, Tula Fang2, Miguel Antunez3, Pablo Puertas2, Kimberlyn Chota2, Marlini Pittet1, Maire Kirkland2, Mike Walkey1, Claudia Rios4, Pedro Perez-Peña5, Pedro Mayor6, Joseph Zegarra2, and Emma Docherty2
1Durrell Institute of Conservation and Ecology, School of Anthropology and Conservation, University of Kent, Canterbury, Kent, UK2FundAmazonia, Museum of Amazonian Indigenous Cultures, 332 Malecon Tarapaca, Iquitos, Peru3 Wildlife Conservation Society, Urb. Sargento Lores Mz Q Lt 1, Iquitos, Loreto, Perú, 4 Servicio Nacional de Áreas Naturales Protegidas, Jorge Chávez N° 930 - 942 – Iquitos, Peru
5Instituto de Investigaciones de la Amazonía Peruana, Av. José A. Quiñones km 2.5, Iquitos, Loreto, Perú6Departament de Sanitat i Anatomia Animals, Universitat Autònoma de Barcelona, Bellaterra, Spain *Author correspondence e-mail: [email protected]
SUMMARY
Recent climatic fluctuations in flooded forests of the Peruvian Amazon have impacted both the biodiversity of wildlife and livelihoods of local Cocama people. The drought in 2010 caused decreases in fish, dolphin and wading bird populations. The consecutive intense floods that began in 2011 have resulted in dramatic declines of ground dwelling terrestrial mammals, such as peccaries, deer, large rodents, and edentates. In Loreto, Peru (375,112 km2) an estimated 1,500,000 mammals have died from the impacts of recent extreme floods. This is 100 times greater than other current causes of mammalian mortality and 10 times greater than the historic peak in mortality during unregulated commercial hunting in the 1960’s. The recent mortality of mammals is causing a paradigm shift in the ecology of flooded forests. The livelihoods of Cocama people in flooded forests have changed during the consecutive years of intensive floods, including greater mortality in perennial agricultural plants, leakage of crude oil into rivers from inundations of contained spills, and scarce wild meat. These impacts are resulting in a greater vulnerability in Cocama food security.
INTRODUCTION
The consecutive floods that have recently occurred in the western Amazon have resulted in numerous environmental problems. The flooding has caused large crop losses in perennial agriculture in the várzea. Oil spills contained in lowland areas have flooded over causing leakage of pollutants into the river system. In this paper we show how the recent intensive floods and drought have also caused changes in biodiversity and resource availability, especially wild meat. Impacts of recent climatic fluctuations were studied on wildlife and Cocama people in várzea flooded forests of the Peruvian Amazon.
The climate models for western Amazonia concur with recent climate fluctuations (Davidson et al. 2012). The models predict that the western Amazon basin will become wetter with greater flooding during the high water season (Cook et al. 2012; Espinoza et al. 2013; Gloor et al. 2015), interspersed with occasional drought during the low water season (Phillips et al. 2009; Espinoza et al. 2011).
Each year western Amazonia goes through seasonal changes between the flooding period from December to June and the low water period between July to November (Junk et al. 1989). However, these normal seasonal changes are having intensification in hydrological cycles (Espinoza et al. 2013). In the high water seasons in 2009 and 2011 - 2014 the Amazon River had very high floods with 2012 being a record flood (Espinoza et al. 2013). In 2010 the water level of the Amazon River was at a record low during the dry season (Espinoza et al. 2011).
Impacts of recent climate change in this paper use correlations between observed intensification of hydrological cycles and changes in wildlife populations. Wildlife populations are compared between years with less hydrological fluctuations (2000-2008) and those with greater hydrological fluctuations (2009-2014)(Gloor et al. 2015). Wildlife populations studied

82
Impact of Recent Climate Fluctuations on Biodiversity and People in Flooded Forests of the Peruvian Amazon
included river dolphins, primates, ungulates, large-bodied rodents, edentates, carnivores, fish, caimans, macaws, wading birds and game birds. The research included the Cocama communities to see how changes in wildlife are affecting their fishing and hunting.
Wildlife of western Amazonian flooded forests lives in an ecosystem driven by large seasonal fluctuations between high and low water seasons. Ecology of aquatic and terrestrial wildlife revolves around these seasonal changes in water level (Ayres 1993), and long periods of flooding, up to 6 months, are very harsh on much of the floral and terrestrial faunal community (Junk and Piedade 1997). People who live in flooded forests have adapted to seasonal changes in both their use of natural resources and agriculture (Piendo-Vásquez 1988; Newing and Bodmer 2004).
Flooded forests are particularly important at understanding impacts of climate fluctuations in the Amazon, since the aquatic and terrestrial interface between high and low water seasons makes this habitat sensitive to greater seasonal variations (Hamilton et al. 2002). Water level change is a robust measure of climate fluctuation, since variations are on a weekly, or even monthly basis as the waters raise and recede. This is unlike temperature and rainfall, which can have dramatic daily fluctuations resulting in large standard deviations (Wittmann et al. 2004).
METHODS
The study was conducted in the Samiria River basin of the Pacaya-Samiria National Reserve, situated in the Department of Loreto, Peru. The Pacaya-Samiria National Reserve extends over an area of 2,080,000 ha in western Amazonia (SERNANP 2009). The study sites of the Samiria River basin included 1) the complex hyrdoscape of the mouth with its lakes, channels and river (571488E: 9478156N), 2) the mid-section in the region of PV2 Tachacocha (571310 E: 9460666N) and Huisto lake (558483E: 9457498N), and 3) the upper section including PV3 Hungurari (552522E: 9441552N) and PV4 Pithecia (536643E: 9423977N).
Water levels were from the Servicio de Hidrografía y Navegación de la Amazonía, Marina de Guerra del Perú (htpp://www.dhn.mil.pe/shna) and levels from the Iquitos station were used for their longer and more complete records. For the analysis years were categorized as 1) normal, 2) drought, and 3) intensive floods, as follows: 2006 – normal; 2007 – normal; 2008 – normal; 2009 - intensive floods; 2010 – drought: 2011 - intensive floods; 2012 – historic intensive floods; 2013 - intensive floods; and 2014 intensive floods.
Wildlife populations were surveyed throughout the year in all years from 2006 to 2013. Data prior to 2006 is from Aquino et al. (2001). Greater details on the survey methods can be found in Bodmer et al. (2014). Line censuses along transect trails were used to conduct terrestrial mammal and game bird censuses. Densities were estimated using the Distance method following Buckland et al. (2004) and analyzed using DISTANCE software. The sample lengths were 540 km in 2006, 821 km in 2007, 1068 km in 2008, 117 km in 2009, 1826 km in 2010, 1135 km in 2011, 704 km in 2012, 930 km in 2013, and 1098 km in 2014.
Digital camera traps with heat/motion sensors were used to examine abundance of ungulates, rodents, felids, armadillos and other terrestrial species. Camera traps stations were set over an area of approximately 200 km2 and distributed across habitat types. Capture rates were independent events per 1,000 camera-days, as ind/m.c.d. Independent events had a minimum gap of 30 minutes for photos of the same species. Results from transect surveys concurred with camera trap surveys (r2=97.5, p=0.001). An average of 20-40 cameras was set with around 1000 camera days per year.
Nocturnal aquatic transects were used to assess the caiman population on rivers, channels and lakes. Species, size class, habitat and location were recorded. Population abundance was calculated as N/L, where N is the number of individuals and L= the distance travelled in kilometers. The sample included 189 km in 2006, 124 km in 2007, 252 km in 2008, 742 km in 2009, 1109 km in 2010, 833 km in 2011, 600 km in 2012, 838 km in 2013 and 605 km in 2014.
Fifteen minute point counts were used to survey macaws and were set in sampling units separated by 500m along shorelines. All macaws either perched or flying were noted and the distances of first sighting were estimated. Abundances were expressed as the number of individuals per point. The sample included 331 points in 2006, 622 points in 2007, 383

83
Impact of Recent Climate Fluctuations on Biodiversity and People in Flooded Forests of the Peruvian Amazon
points in 2008, 1046 points in 2009, 1753 points in 2010, 1498 points in 2011, 1154 points in 2012, 968 points in 2013 and 1007 points in 2014.
Aquatic surveys of 5 km were used to census dolphins in rivers, lakes and channels. Population trends were analyzed by line transects as ind/km. Care was taken not to double count dolphins by observing pods. The sample included 217 km in 2006, 259 km in 2007, 442 km in 2008, 950 km in 2009, 1318 km in 2010, 1958 km in 2011, 1487 km in 2012, 922 km in 2013 and 1013 km in 2014.
Fish were surveyed using catch per unit effort (CPUE) and demography. Censuses used green gill nets of 30 meters long, 3 meters deep, and a mesh size of 3.5 inches set for 1 hour in lakes and channels with weak currents. Individuals were identified, measured by standard length and weighed. Catch per unit effort was calculated by the number of individuals and biomass caught. Demography used the standard length of the fish as size classes. The sample included 307 net hours in 2006, 175 net hours in 2007, 135 net hours in 2008, 290 net hours in 2009, 508 net hours in 2010, 494 net hours in 2011, 397 net hours in 2012, 372 net hours in 2013 and 228 net hours in 2014.
Wading birds were surveyed using shoreline transects of rivers, lakes, and channels. Abundances were calculated as individuals per kilometer (ind/km). The sample included 24 km in 2006, 75 km in 2007, 180 km in 2008, 404 km in 2009, 281 km in 2010, 551 km in 2011, 380 km in 2012, 367 km in 2013 and 507 km in 2014.
RESULTS
Impacts of Droughts
The Amazon basin has experienced two recent drought events over the past decade, in 2005 and 2010 (Espinoza et al. 2012). During the annual low water season the Pacaya-Samiria National Reserve becomes dry land interspersed by shallow lakes, small channels and slow flowing rivers. Drought conditions in 2005 and 2010 had record low water level and drying lakes, dried up channels and stagnant rivers. They lasted around two months during September and October and were linked to El Niño events (Espinoza et al. 2011).
Fish are the major component of aquatic diversity and animal biomass in flooded forests of Amazonia (Henderson et al. 1998). During the drought of 2010 fish populations decreased in the Samiria River basin. The water level trough fell to 105.43 m.a.s.l., the lowest recorded level, and reduced water bodies resulted in greater mortality, especially of the larger size classes.
Fish populations in the Samiria River basin showed an increase in numbers after 2007 with a catch of 2.44 kg/net, then a decrease in biomass after the 2010 drought to 1.17 kg/net. Demography of the most common species, including Astronotus ocellatus, Liposarcus pardalis, Pygocentrus nattereri and Serrasalmus rhombeus showed a significant decrease in size classes in 2011, reflecting greater mortality in larger size classes during the drought. Populations recovered in 2012 and 2013 following record high waters with a catch of 2.20 kg/net. The only common species that did not show a demographic change as a result of the drought was Prochilodus nigricans.
Each year flocks of Neotropical cormorants (Phalacrocorax brasilianus) and great egrets (Ardea alba) migrate to and congregate at the mouth of the Samiria River between the months of August to November. During this period schooling fish migrate out of the Samiria and into the larger Marañon River providing abundant food for the birds. Abundances of Phalacrocorax brasilianus and Ardea alba at the mouth of the Samiria River were relatively constant prior to the drought. The drought conditions of 2010 resulted in significantly lower numbers of Phalacrocorax brasilianus (x2=125.41, gl=5, p<0.0001) and Ardea alba (x2=11.098, gl=4, p=0.0495) reflecting lower fish populations. In 2012 there was a recovery of Phalacrocorax brasilianus and Ardea alba with numbers approaching previous peak years.
The drought in 2010 had an impact on dolphin populations. The extreme low water conditions resulted in lower dolphin numbers throughout the Samiria River. During the driest months of September and October pink river dolphin (Inia geoffrensis) numbers decreased by 47%. In 2011, the pink river dolphin was at a low of 1.02 ind/km following the drought of 2010 and only began to increase in 2012 with 2.62 ind/km, and a further increase in 2013 of 2.68 ind/km. The grey river dolphin (Sotalia fluviatilis) was also impacted by the drought, but to a lesser extent than the pink river dolphin.

84
Impact of Recent Climate Fluctuations on Biodiversity and People in Flooded Forests of the Peruvian Amazon
Family group of pink dolphin. Photo: P. Puertas/FundAmazonia
Impacts of Floods
Ecological conditions of long periods of flooding in várzea forests of the Samiria River, up to 6 months, can be very harsh on ground dwelling mammals. Terrestrial mammals must seek out levees during the high water season, which increases competition and predation (Bodmer 1990). Floods have been more intense during the exceptionally high waters of 2009, and 2011 to 2014 with 2012 being the highest recorded flood and linked to La Niña cycles (Espinoza et al. 2013).
Ground dwelling wildlife including ungulates, terrestrial rodents and terrestrial edentates had great mortality and populations were reduced to the lowest levels ever reported. Overall the total density of terrestrial mammals has decreased from a 2000-2008 density of 15.6 – 12.5 ind/km2 to a 2009 density of 6.8 ind/km2 and a 2014 density of 0.3 ind/km2 (Table 1). Intensive floods began in 2009 with a peak flood level at 117.73 m.a.s.l. compared to the 2000 - 2008 average of 116.80 m.a.s.l. In 2011 the peak flood was at 117.92 m.a.s.l., in 2012 at 118.97 m.a.s.l., in 2013 at 117.93 m.a.s.l. and in 2014 at 117.65 m.a.s.l.
White-lipped peccary (Pecari tajacu) have been impacted dramatically by intensive floods of recent years. The species had a peak in its population in the Samiria River basin in 2000 with a density of 10.5 ind/km2. In 2009, the density was 3.64 ind/km2, which declined dramatically in 2011 to 0.59 ind/km2. No white lipped peccary were sighted on line transects in 2012, 2013 and 2014 (b=-1.0, t=-3.1, p=0.017). Results from camera traps concur with line transects, and capture rates in 2011 were 9.86 herds/m.c.d., 56% lower than in 2009. In 2013-2014 there were no white-lipped peccary recorded on camera traps.
Collared peccay (Tayassu pecari) have also been impacted severely by intensive floods. Collared peccary had a peak population in the Samiria River basin in 2000 with a density of 2.4 ind/km2. In 2009 the density was 0.23 ind/km2, which declined dramatically and in 2011, 2012, 2013 and 2014 no individuals were sighted on line transects (b=-2.6, t=-2.6, p=0.047). Collared peccary still occur in the Samiria River basin, but at much lower numbers than in the past. Camera traps concur with line transect results, and capture rates in 2011 were 29.02 herds/m.c.d., 51% lower than in 2009. There were no collared peccary observed on camera traps in 2013 and only 3 herds recorded in 2014 with a rate of 3.65 herds/m.c.d..

85
Impact of Recent Climate Fluctuations on Biodiversity and People in Flooded Forests of the Peruvian Amazon
Red brocket deer (Mazama americana) were faring slightly better than the peccaries until the historically high floods of 2012, which caused their population to fall dramatically. Density of red brocket deer was relatively constant in the Samiria River basin between 2000 to 2010 averaging around 0.2 ind/km2, but in 2011 red brocket deer density dropped to 0.04 ind/km2 and in 2012 to 0.02 ind/km2, and no sightings in 2013 or 2014 (b=-14.8, t=-3.2, p=0.017). Camera trap results agreed with the transects. In 2009, there were 36.36 ind/m.c.d. and by 2011 the capture rate fell to 19.15 ind/m.c.d.. The red brocket deer showed a large decrease in 2013 with a capture rate of only 3.96 ind/m.c.d. and in 2014 at 1.21 ind/m.c.d., resulting in a 97% decrease since 2009.
Black agouti (Dasyprocta fuliginosa) densities have decreased in the Samiria River basin as a result of intensive floods. Density of black agouti in 2000 was 2.1 ind/km2 and in 2009 density was 1.2 ind/km2. Agouti density decreased in 2012 to 0.39 ind/km2 during the very intensive inundations and has shown a dramatic decrease with a density of 0.10 ind/km2 in 2013 and in 2014 densities decreased further to 0.01 ind/km2 (b =-0.1, t =-2.4, p=0.042). Camera trap results also showed a dramatic decrease of black agouti. Capture rates in 2009 were 445.45 ind/m.c.d. compared to a capture rate in 2011 of 239.11 ind/m.c.d.. After the 2012 flood there were no captures of black agoutis on camera traps, until 2014 with 3.65 ind/m.c.d.
Pacas (Cuniculus paca) are a terrestrial nocturnal species and were only observed on camera traps. Results of capture rates showed a decrease in their population following recent flood events. In 2009 paca had a capture rate of 113.64 ind/m.c.d., which fell to 45.59 ind/m.c.d. in 2011. In 2013 the capture rate of paca fell further to 21.78 ind/m.c.d. and in 2014 still further to 7.30 ind/m.c.d., with a 94% decrease since 2009.
Giant anteaters (Myrmecophaga trydactila) were also impacted by the intensive floods. Capture rate on camera traps in 2009 were 22.72 ind/m.c.d. and in 2011 were 8.70 ind/m.c.d. In 2013 capture rates fell to 4.95 ind/m.c.d. and in 2014 even further to 2.43 ind/m.c.d., with a 89% decrease since 2009.
Nine-banded armadillo (Dasypus novemcinctus) are nocturnal species and were only recorded on camera traps. Armadillos were impacted by intensive floods and populations declined. Capture rates in 2009 were 127.27 ind/m.c.d. and in 2011 were 31.34 ind/m.c.d. In 2013 capture rates fell to 4.95 ind/m.c.d. and in 2014 had a similar rate of 6.09 ind/m.c.d., with a 93% decrease since 2009.
Lowland tapir (Tapirus terrestris) are not showing negative impacts from intensive floods and are maintaining stable populations. Camera traps have better accuracy with tapirs than sightings on line transects. In 2009 tapir had a capture rate of 22.73 ind/m.c.d. and in 2011 capture rates fell slightly to 19.15 ind/m.c.d., which was much less than other ungulate species. In 2013 tapir had a capture rate of 36.63 ind/m.c.d. and in 2014 the capture rate was 30.45 ind/m.c.d., which were greater than previous years.
Wildlife Not Impacted by Droughts or Floods
Animal species that have arboreal or semi arboreal habits can escape the physical effects of flooding and their ability to ascend trees makes them better adapted to the intensive inundations. Wildlife species such as birds, primates, sloths and semi arboreal mammals are all able to avoid the direct impact of flooding. Also, species with both aquatic and terrestrial habits, such as caimans and otters, can overcome both drought and intensive floods.
Caimans are long lived species that have adapted to the Amazonian ecosystem over millennium. They live on the aquatic-terrestrial interface and adapt to both the annual dry and wet seasons of flooded forests. Black caiman (Caiman niger) from 2006-2013 had a stable abundance (b=1.5, t=0.3, p=0.707) as did the spectacled caiman (Caiman crocodylus) population (b=-1.2, t=-0.2, p=0.822).
The density of game birds in 2014 was around the long term average in the Samiria River basin at 2.02 ind/km2 (b= -0.4, t= -2.1, p=0.07). The macaw population in the Samiria River have been stable from 2006 to 2014 (b=0.3, t=1.0, p=0.32).
The density of primates was similar from 2006 to 2014 with an overall density in 2014 of 232.10 ind/km2 (b=0.3, t=-1.1, p= 0.30). Amazon squirrel (Sciurus spadiceus) densities have shown a stable population between 2006 and 2014 (b=0.3, t=-1.1, p= 0.29) as have tamandua (Tamandua tetradactyla)(b=3.6, t=-1.03, p=0.33), three toed sloth (Bradypus variegatus)(b=0.23, t=-0.63, p= 0.54), coati (Nasua nasua)(b= 0.07, t=-0.18, p= 0.85), and tyra (Eira barbara)(b=0.12,

86
Impact of Recent Climate Fluctuations on Biodiversity and People in Flooded Forests of the Peruvian Amazon
t=-0.31, p=0.95). Jaguars (Panthera onca), pumas (Puma concolor) and common opossums (Didelphis marsupialis) had similar abundances on camera traps and no indications of declines caused by floods.
Ocelot (Leopardus pardalis) abundance was correlated to agouti densities. In 2009 ocelot abundance had a capture rate of 9.09 ind/m.c.d.. In 2011 the capture rate increased to 54.55 ind/m.c.d. In 2013 the capture rate was 19.80 ind/m.c.d.and in 2014 it was 8.52 ind/m.c.d.. These results agree with the Lokta-Volterra predictions of carnivore and predator densities. During the initial years of higher water level the main prey of the ocelot, agoutis, were forced onto smaller levees, thus increasing the ease of predation. This was reflected in greater ocelot abundances. However, when the agouti population crashed due to consecutive years of intensive floods, the ocelot population also crashed and in 2014 was at a low point.
Giant river otter (Pteronura brasiliensis) density have been increasing steadily in the Samiria River basin and the continued population growth does not appear to be impacted by the recent climate variations in water level. The otters are both terrestrial and aquatic and can adapt to both intensive inundations and droughts. Between 2000 and 2007 there were no giant river otter observed on the transects. In 2008 density was at 0.05 ind/km2, in 2009 it increased to 0.44 ind/km2 and then increased year on year until 2014 with the greatest population recorded at 6.06 ind/km2.
Impact on Indigenous Cocama People
Cocama indigenous people of the Samiria River basin have been impacted by both droughts and floods. Droughts cause poor water quality through stagnation, rotting fish, and algae blooms. Fish mortality increases resulting in lower fish stocks. In contrast, intensive floods cause different impacts, including high mortality in perennial agriculture crops, especially plantains, pollution from oil spill containment areas that flooded over (Hill 2016), and a dramatic decrease in wild meat harvests.
The Cocama have traditionally used subsistence resources from the forest, especially fish and to a lesser extent wild meat (Kvist et al. 2001). The Cocama, similar to other people living in várzea, have varied their resource use between high and low water seasons (Endoa et al. 2016). Traditionally Cocama would hunt more during the flooded season when terrestrial mammals were restricted to levees and fish more during the dry season when fish stocks were concentrated in lakes, rivers and channels (Kirkland 2013).
The drought of 2010 resulted in high fish mortality and a decrease in fish populations immediately following the dry conditions. In addition, after the drought the size of commonly used fish decreased, which meant that people had to capture greater numbers to maintain the same weight of their catch. This required greater effort and less sustainable fisheries. The fish populations recovered relatively quickly, and two years after the drought fish populations were at healthy levels.
The major species hunted for wild meat were peccaries, deer, tapir and large rodents (Fang et al. 2008). Recent years of consecutive high floods have caused a dramatic decline in these species, resulting in fewer animals to hunt and hunting becoming less sustainable. Hunting on levees likely accelerated the population crash of terrestrial mammals during the initial years of intensive floods. Terrestrial mammals became more vulnerable to overhunting, since their populations were declining from food shortage and drowning, especially during the historic flood of 2012.
The Cocama have reduced hunting over the past five years as terrestrial mammals have become scarce. Hunters who still go out are less successful and state that “it is no longer worthwhile going hunting, there are no longer game animals.” The decline of wild meat species has made Cocama rely more on fishing during the high water season. The Cocama of the Samiria must now fish in the high water season when fish are more dispersed and fish returns are lower. Local people state that during the high water they must fish for longer periods to meet the daily fish intake of their families (Kirkland 2013). A similar pattern has been seen in other areas where hunting returns have declined (Rowcliffe et al. 2005). Fortunately, fish numbers are overall high in the Samiria River basin and can support the increased fishing.

87
Impact of Recent Climate Fluctuations on Biodiversity and People in Flooded Forests of the Peruvian Amazon
Table 1: Density (ind/km2) declines of ground dwelling terrestrial mammals in the mid-section of the Samiria River basin.
20001 2006-20082 20092 20122
White lipped peccary3 10.5 7.0 3.64 0
Collared peccary3 2.4 0.4 0.23 0
Red brocket deer3 0.6 0.2 0.21 0.02
Lowland tapir3 0.06 0.01 0.02 0.03
Black agouti3 2.1 1.06 1.22 0.39
Paca4 1.7 0.66 0.12
Nine-banded armadillo4 1.8 0.74 0.03
Giant anteater4 0.3 0.13 0.06
Total +15.66 12.56 6.85 0.65
1. Densities from Aquino et al. 2001.2. Densities from this study.3. Line transect Distance results.4. Estimated by proportional relationship with camera trap and line transect results.
Table 2: Threats of mammals over 1 kg body weight in the Region of Loreto, Peru.
Number of mammals killed or removed
(Individuals)
International trade in mammals1 1,200
Wild meat market sales1 8,000
Hunting by timbermen2 26,000
Subsistence hunting1 105,000
Peak mortality by commercial hunting in 19601 280,000
Mortality from recent climate change3 1,500,000
1. Fang et al. 2008, annually2. Mayor et al. 2015, annually 3. This study, from consecutive floods
DISCUSSION
We realize that the cause and effect relationships of correlations need to be treated with caution. The stable hydrological conditions in 2000 – 2008 and intensification of hydrological cycles in 2009 – 2014 were clearly different (Espinoza et al. 2013). The results in this paper show that different wildlife species and assemblages of species had the same population trends, which increases the confidence that observed changes in wildlife populations were a result of recent hydrological intensification. For example, the aquatic assemblages of fish, dolphins and wading birds all showed declines during and immediately following the drought, and then they all recovered after two years of heavy flooding. Similarly, terrestrial mammals, including peccaries, brocket deer, paca, agouti, armadillo, and giant anteater all showed declines in their populations following consecutive years of intensive flooding, increasing confidence that the historically high water levels were the cause of the population crash.
The Amazon forests of Loreto, Peru extend over an area of 375,112 km2. These forests are situated in the Ucamara depression resulting in large expanses of flooded forests covering 32% of Loreto, or 120,035 km2 (Salo et al. 1986; Kalliola et al. 1998). In flooded forests of the Samiria River basin ground dwelling terrestrial mammals with a body size greater than 1 kg have declined by 11.91 ind/km2 or 97% as a consequence of consecutive years of intensive inundations (Table 1). We estimate that approximately 1,500,000 mammals have died as a result of recent climate fluctuations in the Peruvian Amazon of Loreto.
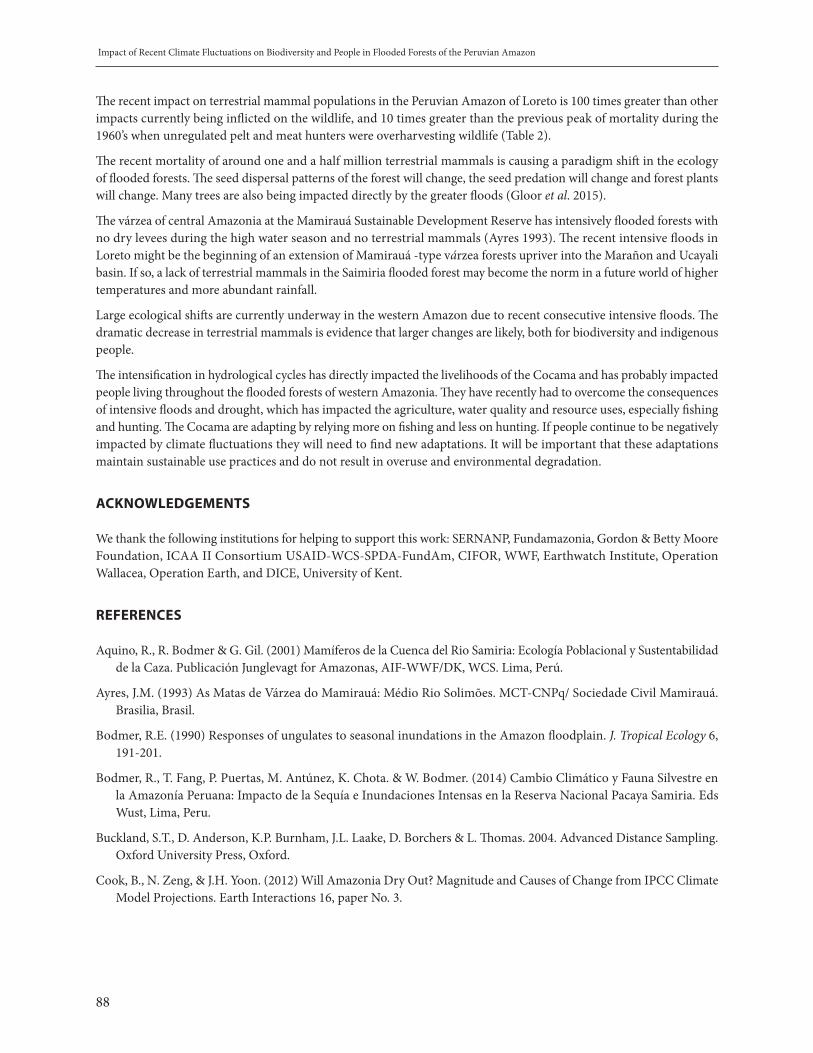
88
Impact of Recent Climate Fluctuations on Biodiversity and People in Flooded Forests of the Peruvian Amazon
The recent impact on terrestrial mammal populations in the Peruvian Amazon of Loreto is 100 times greater than other impacts currently being inflicted on the wildlife, and 10 times greater than the previous peak of mortality during the 1960’s when unregulated pelt and meat hunters were overharvesting wildlife (Table 2).
The recent mortality of around one and a half million terrestrial mammals is causing a paradigm shift in the ecology of flooded forests. The seed dispersal patterns of the forest will change, the seed predation will change and forest plants will change. Many trees are also being impacted directly by the greater floods (Gloor et al. 2015).
The várzea of central Amazonia at the Mamirauá Sustainable Development Reserve has intensively flooded forests with no dry levees during the high water season and no terrestrial mammals (Ayres 1993). The recent intensive floods in Loreto might be the beginning of an extension of Mamirauá -type várzea forests upriver into the Marañon and Ucayali basin. If so, a lack of terrestrial mammals in the Saimiria flooded forest may become the norm in a future world of higher temperatures and more abundant rainfall.
Large ecological shifts are currently underway in the western Amazon due to recent consecutive intensive floods. The dramatic decrease in terrestrial mammals is evidence that larger changes are likely, both for biodiversity and indigenous people.
The intensification in hydrological cycles has directly impacted the livelihoods of the Cocama and has probably impacted people living throughout the flooded forests of western Amazonia. They have recently had to overcome the consequences of intensive floods and drought, which has impacted the agriculture, water quality and resource uses, especially fishing and hunting. The Cocama are adapting by relying more on fishing and less on hunting. If people continue to be negatively impacted by climate fluctuations they will need to find new adaptations. It will be important that these adaptations maintain sustainable use practices and do not result in overuse and environmental degradation.
ACKNOWLEDGEMENTS
We thank the following institutions for helping to support this work: SERNANP, Fundamazonia, Gordon & Betty Moore Foundation, ICAA II Consortium USAID-WCS-SPDA-FundAm, CIFOR, WWF, Earthwatch Institute, Operation Wallacea, Operation Earth, and DICE, University of Kent.
REFERENCES
Aquino, R., R. Bodmer & G. Gil. (2001) Mamíferos de la Cuenca del Rio Samiria: Ecología Poblacional y Sustentabilidad de la Caza. Publicación Junglevagt for Amazonas, AIF-WWF/DK, WCS. Lima, Perú.
Ayres, J.M. (1993) As Matas de Várzea do Mamirauá: Médio Rio Solimões. MCT-CNPq/ Sociedade Civil Mamirauá. Brasilia, Brasil.
Bodmer, R.E. (1990) Responses of ungulates to seasonal inundations in the Amazon floodplain. J. Tropical Ecology 6, 191-201.
Bodmer, R., T. Fang, P. Puertas, M. Antúnez, K. Chota. & W. Bodmer. (2014) Cambio Climático y Fauna Silvestre en la Amazonía Peruana: Impacto de la Sequía e Inundaciones Intensas en la Reserva Nacional Pacaya Samiria. Eds Wust, Lima, Peru.
Buckland, S.T., D. Anderson, K.P. Burnham, J.L. Laake, D. Borchers & L. Thomas. 2004. Advanced Distance Sampling. Oxford University Press, Oxford.
Cook, B., N. Zeng, & J.H. Yoon. (2012) Will Amazonia Dry Out? Magnitude and Causes of Change from IPCC Climate Model Projections. Earth Interactions 16, paper No. 3.

89
Impact of Recent Climate Fluctuations on Biodiversity and People in Flooded Forests of the Peruvian Amazon
Davidson, E.A., A.C. de Arau´jo, P. Artaxo, J.K. Balch, I. F. Brown, M.C. Bustamante,M. T. Coe, R.S. DeFries, M. Keller, M. Longo, J.W. Munger, W. Schroeder, B.S. Soares-Filho, C.M. Souza Jr & S.C. Wofsy B. (2012) The Amazon basin in transition. Nature 481, 321-328.
Endoa, W., Peres, C. & Haugaasena, T. (2016) Flood pulse dynamics affects exploitation of both aquatic and terrestrial prey by Amazonian floodplain settlements. Biol. Conserv. 201, 129–136.
Espinoza, et al. (2011) Climate variability and extreme drought in the upper Solimões River (western Amazon basin): Understanding the exceptional 2010 drought. Geophys. Res. Lett., 38, L13406.
Espinoza JC., Ronchail J., Frappart F., Lavado W., Santini W. & Guyot JL. (2013) The major floods in the Amazonas River and tributaries (Western Amazon basin) during the 1970 – 2012 period: A focus on the 2012 flood. Jr. of Hydrometeorology 14: 1000-1008.
Fang, T., R. Bodmer, P. Puertas, P. Mayor, P. Perez, R. Acero & D. Hayman. (2008) Certificación de pieles de pecaries (Tayassu tajacu y T. pecari) en la Amazonía peruana: Una estrategia para la conservación y manejo de fauna Silvestre en la Amazonia peruana. Wust Editions-Darwin Institute, Lima, Peru.
Gloor, M., J. Barichivich, G. Ziv, R. Brienen, J. Schöngart, P. Peylin, B. Barcante Ladvocat Cintra, T. Feldpausch, O. Phillips, & T. Baker. (2015) Recent Amazon climate as background for possible ongoing and future changes of Amazon humid forests, Global Biogeochem. Cycles, 29.
Hamilton, S. K., Sippel, S. J. & J. M. Melack. (2002) Comparison of inundation patterns among major South American floodplains. J. Geophys. Res. Atmos. 107:1–14.
Henderson, P.A., W. D. Hamilton & W.G. Crampton. (1998) Evolution and diversity in Amazonian floodplain communities. In: Dynamics of Tropical Communities. Newbery, D.M. Prins, H.H. y N.D. Brown (eds.). Blackwell Science, Oxford.
Hill, D. (2016) Look at the oil spilled in the world’s 2nd ‘Best Place for Wildlife´: Decades of exploration and exploitation has led to severe contamination in the Pacaya Samiria National Reserve in Peru’s Amazon. The Guardian: 14 – 01-2016.
Junk, W.J., Bayley, P.B. & R.E. Sparks (1989) The flood pulse concept in river-floodplain systems. In: Proceedings of the International Large River Symposium. Dodge, D.P. (ed.). Can. Spec. Publ. Fish. Aquat. Sci. 106:110–127.
Kalliola, R., Ruokolainen, K., Tuomisto, H., Linna, A. & S. Maki.(1998) Mapa Geoecologico de la Zona de Iquitos y Variacion Ambiental. IN: Geoecologia y Desarrollo Amazonico: Estudio Integrado en la Zona de Iquitos, Peru. Kalliola, R. and S. Flores Paitan (eds.). Turun Yliopisto, Turku, Finland.
Kirkland, M. (2013) The Impacts and Sustainability of Hunting and Fishing by the Cocama-Cocamilla People in the Pacaya-Samiria National Reserve, Peru. MSc Thesis, University College London, UK.
Kvist L.P., S. Gram, A.C. Cácares & I.B. Orem (2001) Socio-economy of flood plain households in the Peruvian Amazon. Forest Ecology & Manag. 150, 175-185.
Mayor, P., P. Perez, M. Bowler, M. Kirkland & R. Bodmer. (2015) Effects of selective logging on large mammal populations in a remote indigenous territory in the northern Peruvian Amazon. Ecology and Society 20 (4): 36.
Newing, H. & R. Bodmer. (2004) Collaborative wildlife management and adaptation to change: The Tamshiyacu-Tahuayo Communal Reserve, Perú. Nomads 7.
Phillips, O. L. et al. (2009) Drought sensitivity of the Amazon rainforest. Science 323, 1344–1347
Pinedo-Vásquez, M. (1988) The River People of Maynas. In: People of the tropical forest. Denslow, J.S. and C. Padoch (eds.). University of California, Berkeley.
Rowcliffe, J.M., E.J. Milner-Gulland & G. Cowlishaw (2005) Do bushmeat consumers have other fish to fry? Trends Ecol. Evol. 20, 274-276.
Salo, J., R. Kalliola, I. Häkkinen, Y. Mäkinen, P. Niemelä, M. Puhakka & P.D. Coley. (1986) River dynamics and the diversity of Amazon lowland forests. Nature 322, 254-258.
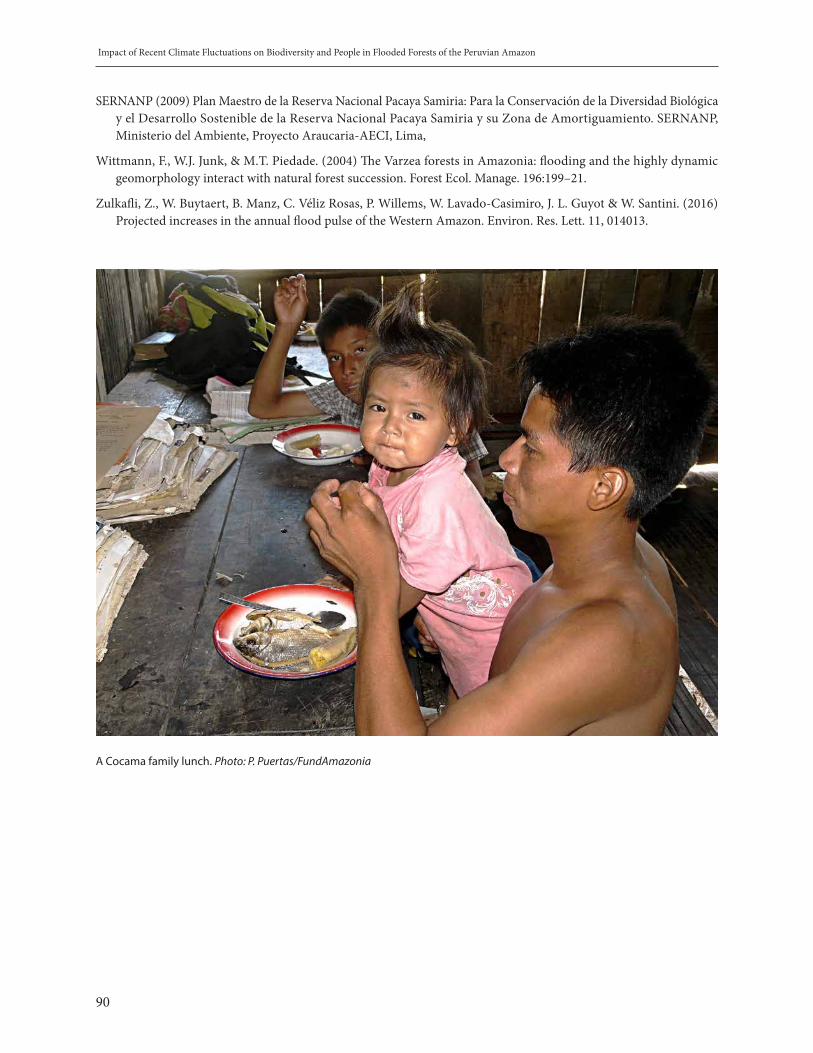
90
Impact of Recent Climate Fluctuations on Biodiversity and People in Flooded Forests of the Peruvian Amazon
SERNANP (2009) Plan Maestro de la Reserva Nacional Pacaya Samiria: Para la Conservación de la Diversidad Biológica y el Desarrollo Sostenible de la Reserva Nacional Pacaya Samiria y su Zona de Amortiguamiento. SERNANP, Ministerio del Ambiente, Proyecto Araucaria-AECI, Lima,
Wittmann, F., W.J. Junk, & M.T. Piedade. (2004) The Varzea forests in Amazonia: flooding and the highly dynamic geomorphology interact with natural forest succession. Forest Ecol. Manage. 196:199–21.
Zulkafli, Z., W. Buytaert, B. Manz, C. Véliz Rosas, P. Willems, W. Lavado-Casimiro, J. L. Guyot & W. Santini. (2016) Projected increases in the annual flood pulse of the Western Amazon. Environ. Res. Lett. 11, 014013.
A Cocama family lunch. Photo: P. Puertas/FundAmazonia

91
Overview of the Panel on Biodiversity and Health under Climate Change
OVERVIEW OF THE PANEL ON BIODIVERSITY AND HEALTH UNDER CLIMATE CHANGE
Montag, Doreen1, Kuch, Ulrich2, Rodriguez, Lily3, Müller, Ruth2
1Queen Mary University of London, Centre for Primary Care and Public Health, Barts and London School of Medicine and Dentistry, United Kingdom2 Goethe University, Institute of Occupational, Social and Environmental Medicine, Frankfurt am Main, Germany3 University of Bonn, ILR - Institut für Lebensmittel und Ressourcenökonomik, Bonn, Germany
INTRODUCTION
Since the signing of the Rio Convention on Biological Diversity (CBD) in 1992, biodiversity (diversity within species, between species and of ecosystems) has become a central focus in research, conservation and policy, seeking to analyse and protect human well-being (Cardinale et al. 2012, Hillebrand and Matthiessen 2009, Lanzerath and Friele 2014, Naeem et al. 2009, Rask and Worthington 2015, Vadrot 2014). Despite numerous research and conservation programmes related to biodiversity, the rates of biodiversity loss continue to increase while our understanding of the impact of local biodiversity loss on global ecosystem functioning, human well-being and human health is still developing (Brose and Hillebrand 2016, Dornelas et al. 2014, Gamfeldt et al. 2015, WHO/CBD 2015).
Biodiversity is recognized as a key factor in securing human well-being through regulating local and global climates and protecting health through functioning ecosystems (Cardinale et al. 2012, Chivian and Bernstein 2008, Lovejoy and Hannah 2005, Sandifer et al 2015). Sustainable development is essential to conserve biodiversity and protect human health. Ecosystems provide services, including food security, nutrition, air quality, freshwater quality, and providing medicinal and genetic resources for preventing and treating communicable and non-communicable diseases (Sala et al 2009, WHO/CBD 2015). Any economic development and global environmental governance that is not centred on human health and the protection of biodiversity, will not be sustainable and only contribute to further health challenges (Biermann 2012, Bowen et al. 2011, Wang and Horton 2015, Whitmee et al. 2015, Young et al. 2014).
The recent joint publication by the WHO and CBD (2015) on the state of the art knowledge on biodiversity and health, is a milestone in closing research gaps and opening up new research fields. However, our knowledge of biodiversity and health is still limited; research on the diversity of bacteria, parasites, viruses and fungi, for example, has mostly focused on those that negatively impact human health (Levi, Massey, et al. 2016, Keesing et al. 2010, Wood et al. 2014) and not those that are central for ecosystem functioning (Sala et al. 2009). Even so, our knowledge about how biodiversity loss and changing temperatures, humidity, and precipitation impact microorganisms and their human hosts is fragmentary (Lafferty 2014, Wood et al. 2014).
A concise understanding of the knowledge on biodiversity and health is important and cannot be understood outside the context of anthropogenic climate change, global changes and economic development.
BIODIVERSITY, HEALTH AND CLIMATE CHANGE
During the Holocene, stable climates and functioning ecosystems allowed for humans to settle down and cultures to develop (Biermann 2012, Rockström et al. 2009, Steffen et al. 2015). In the Anthropocene, characterised by the burning of fossil fuels and other anthropogenic changes such as different forms of land-use, overpopulation, and over-exploitation of natural resources, massive alterations of the planetary system have taken place since the beginning of the Industrial Revolution (Biermann 2012, Corlett 2015, Oldfield et al. 2014). Resulting planetary changes, such as the increased concentration of CO2 in the atmosphere and widespread biodiversity loss are not only interacting with each other but also defining the quality of life of the human species on the planet (Rockström et al. 2009, Waters et al. 2016). The passing of so-called boundary thresholds at interplay with socioeconomic factors is leading to global changes that
92
Overview of the Panel on Biodiversity and Health under Climate Change
are challenging life on earth as we know it (Biermann 2012). Global change impacts planetary boundaries that are influencing climate change, putting the future of human life on the planet as a whole at risk (Hansen et al. 2013, Hansen et al. 2016, Rockström et al. 2009, Steffen et al. 2015).
Anthropogenic climate change is generally perceived to negatively impact on biodiversity, with unknown consequences (Cardinale et al. 2012, Ceballos et al. 2015, Jantz et al. 2015, Pongsiri et al. 2009, Romanelli et al. 2015, Urban et al. 2016, Seddon et al. 2016). In addition, local climate changes (e.g., in temperature, rainfall) will alter the distributions of pathogens and disease vectors (Campbell-Lendrum et al. 2015, Confalonieri and Suassuna Dutra 2014, Dhimal et al. 2015, Egbendewe-Mondzozo et al. 2011). Particularly the risk of mosquito-borne diseases will increase in higher altitudes and temperate regions as a consequence of climate change, as seen in the spread of mosquitoes in the Ecuadorian and Colombian Andes or the Himalayas (IPCC 2014, Pinault and Hunter 2011, Siraj et al. 2014, Zhong et al. 2016). On the other hand, biodiversity can enhance resilience towards climate change (Civitello et al. 2015, Duffy et al. 2016, Gamfeldt et al. 2015, Keesing and Ostfeld 2015, Levi et al. 2016,). In this sense, the impact of climate change on biodiversity and human health is perceived to worsen current health challenges and increase human diseases (Wang and Horton 2015, Haines et al. 2006, Romanelli et al. 2015).
While impacts of climate change on health can be direct, indirect or tertiary, they are all interlinked with social processes and inequalities that put some people at a higher risk of suffering than others (Butler 2014, Lemery et al. 2014, McMichael et al. 2008, Wang and Horton 2015). Paradoxically, it is those people who are marginalized in society, often living in remote areas or places of urban marginalization, in ecologically deprived areas or impoverished in highly biodiverse areas, those who have historically not contributed to climate change, who are suffering the consequences and are often double burdened because of additional inadequate access to health services (Bowen et al. 2011, Hall 2014, Lacey 2012, Tsosie 2007).
OVERVIEW OF AREAS OF BIODIVERSITY AND HEALTH
Biodiversity’s impact on human health has often been related to infectious disease research (Johnson et al. 2015, Keesing et al. 2010, Keesinget al. 2006, Keesing and Ostfeld 2015, Levi, Keesing, et al. 2016, Levi et al. 2015, Levi, Massey, et al. 2016, Alonso Aguirre et al. 2012, Mackenzie et al. 2013). However, the compilation of the state of the art knowledge shows that biodiversity through ecosystem services plays a crucial role in preventing communicable and non-communicable diseases, those that have been related to freshwater use (water-borne and water-related diseases), agriculture and insufficient nutrient intake (malnutrition, under-nutrition, gastrointestinal diseases, obesity, diabetes, heart diseases), air-pollution (respiratory diseases) and urbanization and green spaces (e.g., chronic intestinal inflammation) (WHO/CBD 2015). This supports the underlying dependency of humans on the local, regional and global eco- and planetary system for overall health and well-being.
WATER BIODIVERSITY AND HEALTH
Water is at the centre of human life and planetary processes (Romanelli and Daniel 2015, Rockström et al. 2009, Steffen, Richardson, et al. 2015). Fresh water is essential for human survival, while water is also at the centre of social processes, such as industrial and subsistence practices. The growing human population and increasing demand for water, not only for drinking but mostly unsustainable industrial processes, are pushing fresh water resources towards their thresholds (Rockström et al. 2009, Steffen et al. 2015).
Freshwater ecosystems are interconnected with other ecosystems, such as forests, soil, wetlands and mountains systems, that in themselves depend on biodiversity for their own processes (Jackson et al. 2016). Particularly the quality of water is essential when it comes to human health, specifically where fresh water and other water supply sources are highly contaminated with pathogens (Prüss-Ustün et al. 2014, 2016). Pathogens that can cause water-borne and water-related diseases can be prevented as much through functioning ecosystems that purify water as through a key role of governance in providing sanitation (Neira 2016, Ekane et al. 2014). Loss of biodiversity can substantially limit the water purification process (Romanelli and Daniel 2015). Diverse forms of human development can bring benefits but may also encompass

93
Overview of the Panel on Biodiversity and Health under Climate Change
activities that can destroy biodiversity and potentially be a risk to human health, such as is the case of altered waterways like dams and irrigation canals (Myers and Patz 2009, Romanelli and Daniel 2015).
Mining and unsustainable agriculture are other ways of polluting fresh water resources, interfering with natural water ecosystems, and impacting on the availability and quality of water for humans (Habib 2012, Ranjan et al. 2012, Riojas-Rodríguez and Rodríguez-Dozal 2012). Large-scale industrial use of water is often attributed to an unsustainable use and misuse of fresh-water resources (Whiteman et al. 2013). Chemical pollution of fresh water can negatively impact neurological functioning of humans and inhibit human development (Breilh 2012). It can also lead to an increase in gastrointestinal diseases and increase the suffering of the most vulnerable in already conflict-ridden regions, often children under five (Habib 2012). Children are also often the ones who are suffering most from malnutrition, under-nutrition and diarrheal diseases at the same time, often described as diseases of poverty and used as an index for human development (Bain et al. 2013, Ganguly et al. 2015, Schaible and Stefan 2007). However, this does not happen out of context, but rather in deprived environments and disrupted ecosystems (Leisher et al. 2012, Sachs et al. 2009).
BIODIVERSITY, AGRICULTURE, FOOD SECURITY AND NUTRITION
The manifold expansion of the human population over the last century with an increasing demand for food production have had a direct impact on land-use change through unsustainable agriculture, unsustainable fresh water use and uncontrolled urbanization. In its latest report, IFPRI (2016, 1-2) describes advances in managing malnutrition in all its forms, pointing out the state of the art knowledge with 2 billion people out of a global population of 7 billion being malnourished in any form; with 2 billion adult people over 18 years old out of 5 billion being obese. In their latest annual report, FAO (2015) estimated that 795 million people worldwide continued to suffer from under-nutrition, showing a decrease from 18.6% in 1990-1992 to 10.9% in 2014-2016. Under-nutrition is unequally distributed across the world and within nations representing highly unequal access to food (FAO 2015). Furthermore, malnutrition is a leading factor of obesity and diabetes, often reflecting an insufficiently diverse and sub-standard quality micro-nutrient diet.
Biodiversity, agricultural biodiversity, food security, nutrition and health are highly complex and interact with each other (Hodgkin and Hunter 2015, Hunter et al. 2015). Agricultural biodiversity is essential for food security and human health, independent of geography or economic status, and plays a particular role under current and future climate regimes (Watts et al. 2015, Dwivedi et al. 2013, González 2011).
While intra- and inter-species biodiversity is highly important for a healthy nutrition, global consumption currently relies on a few stable crops only (Hunter et al. 2016, Khoury et al. 2014). Research has shown that there is a high variability of nutrient compositions at an inter-species level, for example, in the case of potato and banana, which emphasizes the importance of consuming different genetic varieties of species to assure a high-quality intake of micronutrients and bio-active non-nutrients (Fanzo et al. 2013, Heywood et al. 2013, Hunter and Fanzo 2013).
Indigenous and local knowledge of agricultural biodiversity has been crucially important for a healthy, highly nutritious diet, protecting peoples’ health against chronic disease risk, malnutrition and infectious diseases (Kuhnlein 2015). Diverse cultural food systems in distinct ecosystems around the world have supported the conservation of genetic food resources and provided resilient food security through times of hardship. In the Amazon region, ethnobotanic research has shown an increase of biodiversity through agrobiodiversity prior to the conquest (Balée 1994, Posey 1985, Rival 2006). However, global change and an increasing pressure even on indigenous populations through globalization, increased urbanization and land-use changes through, for instance, the mining and fossil fuel boom in the Amazon, and unsustainable palm oil and soya bean production, have recently led to an acculturation of local practices and changes in food systems (Blackwell et al. 2009, Finer et al. 2008, Larrea 2014, Larrea Maldonado 2013b). Deteriorations of environments, sedentary and cultural changes in food consumption are now leading to malnutrition and chronic diseases such as diabetes and obesity among impoverished and marginalised indigenous people (Bernstein 2008, Piperata et al. 2011, Larrea 2014).

94
Overview of the Panel on Biodiversity and Health under Climate Change
ENVIRONMENTAL MICROBIAL DIVERSITY AND CHRONIC DISEASES
The susceptibility to inflammatory disorders, such as obesity, cardiovascular disease and inflammation-associated depression, is influenced by a failure of the immune-response system (Rook and Knight 2015). Such a failure in itself can be influenced by diverse structural issues, like socioeconomic status as well as aspects of biodiversity (Rook, 2013). Microbial biodiversity in the environment and in the human gut and the communication between them is highly important for regulating the human immune system (Rook and Knight 2015). Exposure to environmental microbial diversity since early childhood is essential for developing a functioning immune response (Rook and Knight 2015). Environmental microbes come from soil, plants and animals, and can be inhaled through the air or taken up through the skin (Rook, 2013).
Higher species diversity in microbial communities has been related to stable and more productive communities (Karkmanet al. 2017). It has also been demonstrated that a higher species diversity improves resistance against invasive species, such as the protection against invasive parasitic intrusions (Civitello et al. 2015, Fargione and Tilman 2005). This so-called dilution effect is highly important within a local ecosystem, may it be in soil or other parts of the ecosystem, or in the human gut. However, some research has shown that it is not so much the diversity within the human gut but the functionality of the diverse microbes that is important to the human immune response system (Karkman 2017, Neff et al. 2016).
Microbiota have been developing with human evolution (Rook 2013, Rook and Knight 2015). Rook (2013) describes the evolutionary co-development of organisms like helminths, which he summarized under the term Old Friends, as having driven the human immune response. He argues that most of the organisms that co-evolved with humans have been lost through modern lifestyles. Current lifestyles and biomedicine are reducing natural microbiota, for example through a lack of breast-feeding, and via excessive use of antibiotics in children (Rook 2013). Some of them, such as helminths have largely been eliminated, which means that people have to rely mostly on organisms from the natural environment like green spaces in urban areas coexisting animals (Zhang et al. 2015).
Microbial diversity in the environment and intestines, particularly a highly diverse gut microbiome, has been shown to confer anti-inflammatory properties (Neff et al. 2016). This argument and latest research results imply that a decreased microbial environment is closely related to higher chronic background inflammations and prevalence of chronic inflammatory diseases, but also depression (Karkman et al. 2017, Rook and Knight 2015).
The homeostasis of the human microbiota -where the microbiome is composed of bacteria, viruses, archaeal and eukaryotic cells- can be achieved through different bacterial species with same functions (Karkman et al 2017) which contribute to health and disease (Macke et al. 2017). Humans can be home to diverse communities, which are in turn influenced by nutrition and the natural environment in which each person is embedded (Ruokolainen et al 2016). Indigenous people, living or having grown up in remote areas, therefore have a different microbiome, as have subsistence farmers and people who have for generations lived in highly urban environments (Clemente et al. 2015, Huttenhower et al. 2014, Obregon-Tito et al. 2015). The gut microbiome is developed at an early childhood age for up to two years, and forms of birth delivery already play an important role since children born through caesarean section have been shown to have lower gut species diversity and weaker immune systems (Arrieta et al. 2014, Jakobsson et al. 2014, Karkmanet al. 2017). This essential gut microbiome is influenced by the environment, and transferred through generations (Bloomfield et al. 2016). A combination of exposure to microbe-poor environments and diminished horizontal transfer can negatively influence human health, and even cause the extinction of species that are important for human health (Bloomfield et al. 2016, Blaser et al. 2013, Deehan and Walter 2016, Lozupone et al. 2013).
In this regard, it might be important to analyse in greater detail the relationship between recently contacted and urbanized indigenous groups whose environment has been severely degraded through deforestation, forest fragmentation, mining, and agricultural projects, whose diet has been abruptly changed, and who show a high prevalence of chronic diseases (Bernstein 2008, Raoult 2016, Waters 2006, Yépez et al. 2008).
In general, it has been shown that there is a correlation between gut microbiome and obesity (Turnbaugh 2017), liver cirrhosis (Qin et al. 2014), rheumatoid arthritis (Bruscaet al. 2014, Chen et al. 2016) and paediatric diseases (Arora, et al. 2015). Importantly, anthropogenic environments not only have an impact on humans, but also on animals. A one
95
Overview of the Panel on Biodiversity and Health under Climate Change
health approach is also needed here, as Hablützel et al. (2016) described immune-regulatory deficiency also in fish kept in an anthropogenic environment for eleven months. Animals who live with humans also share their microbiome, and this has an impact on each other’s immune systems (Rook and Knight 2015).
In addition, immune-regulation is also important for allergies, since a failure of the immune-regulation may cause the attack of inapposite targets, such as allergens (Rook 2013). A high microbial diversity in the environment is an essential factor for immunoregulation and a lower risk of allergies (Allaerts and Chang 2017). A decreased microbial diversity and climate change are expected to increase the future risk of allergies, through an increased exposure to allergens and a decreased diversity of allergenic species (Beaumont and Duursma 2016, D’Amato et al. 2013, Reinmuth-Selzle et al. 2017).
Overall, research into the impact of environmental microbial diversity on human health has shown that microbial diversity could firstly be perceived as an ecosystem service for human health (Rook 2013) and that, secondly, human exposure to environmental microbial diversity, in soil, plants, and animals, is essential for immune-regulation (Bloomfield et al. 2016, Rook and Knight 2015). Microbial diversity and the type of its composition in the human gut can then have a dilution effect to protect from infectious diseases such as food- and water-borne diseases.
BIODIVERSITY, VECTOR-BORNE AND OTHER INFECTIOUS DISEASES
The dilution process has also been widely discussed within the literature on the role of biodiversity to protect from infectious diseases for humans and animals (Civitello et al. 2015, Levi et al. 2016, Aguirre et al. 2012, Epstein 2002, Keesing et al. 2006, Keesing and Ostfeld 2015, Pongsiri et al. 2009). Randolph and Dobson (2012) suggested that the composition of the community might play a more important role than diversity per se, similar to the microbial diversity in the gut. At the same time, other researchers have shown that biodiversity loss can have an amplification effect on infectious disease transmission (Vourc’h et al. 2012, Keesing and Ostfeld 2015, Levi, et al. 2016). Karesh and Formenty (2015) emphasized that dilution and amplification effects were very likely part of the same impact that biodiversity loss exerts on the host-vector relationship.
Biodiversity influences infectious diseases in diverse ways, based on host diversity and host community composition, and through changes and decreases in the diversity of vectors. In this context, the role of the biodiversity of mosquitoes for the transmission of pathogens, that of pathogens for vector competence, the competition between native and invasive mosquitoes, and the significance of intermediate host population diversity for tick-associated virus transmission cycles need to be investigated further (Kreß et al 2017).
Forest fragmentation and road construction have been reported to change vector-host relationships, with increased transmission between vectors and humans as other animals diminish (Confalonieri and Suassuna Dutra 2014, Patz et al. 2004). Road construction also increases the access to wild animals by hunters, which in turn increases the risk of zoonotic disease transmission (Patz et al. 2004, Karesh and Formenty 2015, Wolfe et al. 2005). The intensification of fossil fuel extraction and mining in general in the Amazon area has been shown to increase the prevalence of neglected tropical diseases such as leishmaniasis and Chagas’ disease, but also of malaria (Karesh et al. 2012, Wolfe et al. 2005, Aguilar et al. 2007, Calvopina et al. 2004, Barros and Honório 2015). Neglected tropical diseases pose an additional challenge because they are under-researched, underfinanced and affecting already highly vulnerable populations (Manderson et al. 2009, Noble and Austin 2015, Wang and Horton 2015).
In Nepal, for example, a systematic review of the literature has shown that global change has influenced the spread of dengue fever, Japanese encephalitis and visceral leishmaniasis across diverse spatial regions (Dhimal, Ahrens and Kuch 2015). Since the first dengue fever outbreak in Nepal in 2006, dengue fever and its vector Aedes aegypti have spread across low and high altitudes (90 m - >1300 m above sea level) (Dhimal, Ahrens, and Kuch 2015). Similarly, since the first record of Japanese encephalitis in Nepal in 1965, the disease and its main vector, Culex tritaeniorhynchus mosquitoes, have spread throughout the country (Dhimal, Ahrens, and Kuch 2015). Particularly, since 2005 there has been a spread towards mountainous regions (Dhimal, Ahrens, and Kuch 2015) most likely as a result of climate change.

96
Overview of the Panel on Biodiversity and Health under Climate Change
Hence, vector-borne diseases such as dengue fever, chikungunya fever, Zika virus infection and malaria, but also other emerging or neglected tropical diseases like bat-borne and rodent-borne viral diseases, snakebite envenoming, and plant pathogens, need to be understood in the context of biodiversity, climate change and sustainable development.
THEORETICAL APPROACHES TO UNDERSTAND BIODIVERSITY, HEALTH AND SUSTAINABLE DEVELOPMENT
Discussions among scientists about the validity of research results on the relevance of global biodiversity conservation politics for protecting human health (Levi, Massey, et al. 2016, Wood et al. 2014, 2016) showcase the need for transdisciplinary approaches to providing local, national, regional and global policy recommendations (Horton et al. 2014, Lee and Brumme 2013). Over the last three decades, different frameworks have been developed and used to approach distinct areas of biodiversity and human health. Those approaches encompass one medicine, ecohealth, eco-bio-social, conservation medicine, One Health, and planetary health (Aguirre et al. 2002, Aguirre et al. 2016, Arunachalam et al. 2010, Charron 2012, Lebel 2003, Mackenzie et al. 2013, Schwabe 1984, Whitmee et al. 2015).
Since Calvin Schwabe’s (1984) one medicine concept to emphasize the close relationship between animal and human well-being and health, the relationship between environmental disruptions through anthropogenic factors like land use change and urbanization, has influenced further conceptual approaches such as ‘conservation medicine’ (Aguirre et al. 2002). Conservation medicine emphasizes environmental conservation, particularly biodiversity conservation as being essential for human and animal health (Wilcox et al. 2004, Aguirre et al. 2012).
Almost at the same time, the relationships between ecosystem health, human well-being and sustainable development were analysed within an ecohealth approach (Waltner-Toews and Key 2005). Ecohealth is based on an ecosystem approach that stresses a participatory, sustainable and gender equity approach to analyse the different ecosystem factors that negatively impact human health (Charron 2012, Lebel 2003).
Over the last decade, the One Health approach incorporated previous approaches to situate human health and animal health within the ecosystem, and sustainable development, in the same framework (King et al. 2008). One Health stresses the importance of a systemic transdisciplinary approach to analyse and protect the health of all beings (Zinsstag et al. 2011). The recent WHO/CBD (2015) report on biodiversity and human health underlines that a One Health approach encompasses earlier ecohealth approaches.
The planetary health approach encompasses the well-being of the planetary system in which the lives of the human and other species are embedded (Whitmee et al. 2015). As it situates the well-being of species within an intact planetary system (Demaio and Rockström 2015, Horton et al. 2014), this approach incorporates others such as the One Health approach which particularly addresses human and non-human health (Barrett et al. 2011, Lee and Brumme 2013, Rabinowitz et al. 2013). The planetary health approach, therefore, addresses an additional layer of analysis, the Earth System and the interconnectedness of all factors and levels (Whitmee et al. 2015).
PANEL DISCUSSION
Within this framework, the panel discussion on health and biodiversity focused on the relevance of connecting climate change and sustainable development to protect biodiversity and human health. Using examples from the regional setting of South America, especially Peru and Ecuador, the panellists emphasized the need for more local and regional research to better understand the relationships between biodiversity and health in a rapidly changing environment.
The biodiversity-rich Peruvian and Ecuadorian Amazon and adjacent mountain ranges overlap with fossil fuels underground and are home to indigenous groups, some of whom are living in voluntary isolation (Finer et al. 2008, Napolitano 2007, Larrea Maldonado 2013a). These same areas may have particularly high potential to provide medicinal and genetic resources (Chivian and Bernstein 2008, WHO/CBD 2015), to protect people from the risk of infections and to contribute to food security, and are often inhabited by human populations living under conditions of extreme poverty who are, for example, missing access to clean water, suffer from inequity and have a low human development index (Fisher

97
Overview of the Panel on Biodiversity and Health under Climate Change
and Christopher 2007, Larrea Maldonado 2013a, b). Thus, there is a challenge and urgent need to balance sustainable development (encompassing biodiversity conservation, mitigation of climate change impacts and protecting human health) with other interests of the regional populations and the rapidly expanding activities of extractive industries (Moran and Fleming-Moran 1996, Naeem et al. 2016, Steffen, Richardson, et al. 2015, Vallejo et al. 2015). It is recommended to make this a priority on national agendas of sustainable development in order to protect the wellbeing of the people and the planet, consolidated in planetary health (Boron et al. 2016, Wang and Horton 2015, Whitmee et al. 2015, WHO/CBD 2015, Zinngrebe 2016).
Highly important for countries like Peru and Ecuador is the connection between biodiversity and infectious disease transmission. Theoretically, there is a higher average of pathogen numbers in highly biodiverse areas, such as the Yasuní Biosphere Reserve (Karesh and Formenty 2015, Levi et al. 2016). However, more research is needed to analyse this in detail, particularly, because higher rates of anthropogenic interferences and forest clearances and particularly road constructions have an impact on infectious disease transmission in different ways (Loh et al. 2016).
Biodiversity and global change effects on neglected diseases like snakebite envenoming, rabies, Chagas’ disease, and on malaria and various other vector-borne and parasitic diseases should be prioritized in research agendas due to the widely recognized, massive impact of these diseases on the health and economic development of disadvantaged and marginalized human populations.
Distribution and risk maps under present and future climate, land use, and social-ecological change scenarios should be developed as a priority for native and invasive species of known health relevance, to facilitate prevention, control, adaptation and mitigation measures, and to inform conservation, economic and health policies. Research addressing these challenges needs to integrate all levels of biodiversity as well as multiple drivers of change, including robust knowledge on the genetic diversity, structure, dynamics, and adaptation of health-relevant organisms, including their microbiomes.
In many ways, snakes, snake venoms and snakebite are iconic and representative examples for some of the complex interactions between biodiversity, climate change and health. As the most efficient predators of rats and mice, countless rodent-eating species of snake provide ecosystem services of paramount importance especially for human food production and food security (e.g., Whitaker 1978), but also in the control of rodent-borne infectious diseases. At the same time, venomous snakes are a cause of frequently overlooked and unrecognized human suffering. Although it is eminently curable, snakebite envenoming (i.e., the pathophysiological processes following the injection of snake venom via the bite of a snake) is among the most neglected of the so-called neglected tropical diseases, causing massive morbidity, mortality and disability among the rural poor populations of subtropical and tropical countries (e.g., Alirol et al. 2010), thereby promoting and perpetuating poverty (Harrison et al. 2009). The survival and activity of snakes is strongly influenced by climatic factors. Thus, climate change is expected to have significant impacts on their diversity, distribution and abundance. Depending on the species this may lead to extinctions, range shifts, or range expansions and corresponding changes in health risks (Lawing and Polly 2011, Chaves et al. 2015, Yañez-Arenas et al. 2016). In addition, extreme weather events like floods, by now an often-documented phenomenon in Asia, Africa and Latin America, often create periods of peak frequency encounters between snakes and humans, resulting in exceptionally high mortality due to the simultaneous inaccessibility of health care (Alirol et al. 2010).
At the same time, bio-active compounds from animals (e.g., snake, spider, scorpion, insect and cone snail venoms; frog skin secretions) constitute a mostly untapped source of countless evolutionarily tested molecules with specific biological functions. Although the traditional importance of harnessing the diversity of Peru’s natural libraries of pharmacologically active compounds, and their potential for future, science-driven discovery and product development has long been recognized within the country and abroad (e.g., Cinchona tree), there is comparatively little research on these topics (Blare and Donovan 2016, Robinson 2010, Schlagenhauf Lawlor 2007).
Nevertheless, indigenous people living in the Amazon possess local medicinal knowledge to treat and cure illnesses. How this knowledge can be used and under which agreements can it be shared, transferred and combined with biomedicine in an equitable way, and respecting the customary laws of the holders of this traditional knowledge, is still under discussion. The third objective of the CBD has provided an international framework for this, and almost 20 years later the Nagoya Protocol addressed the legal context for Access to Genetic Resources and the Fair and Equitable Sharing

98
Overview of the Panel on Biodiversity and Health under Climate Change
of Benefits Arising from their Utilization (ABS), but procedures and contract models in countries such as Peru and Ecuador are still under development.
It is important that indigenous communities are given access to socio-economic resources (Koutouki et al. 2011), and this is of particular significance in highly biodiverse and highly multi-ethnic countries like Peru and Ecuador (Finer et al. 2008, Finer et al. 2009, Napolitano 2007, Orta-Martínez and Finer 2010, Bass et al. 2010). Peru, for example, has developed legislation to facilitate the protection of traditional knowledge so that indigenous groups can protect their own knowledge built through centuries of experience (Zamudio 2013, Poggi González 2011).
Consequently, the actual and potentially positive and negative roles that such bio-active compounds from nature play for health, and the way in which global change impacts (including, but not limited to climate change, land use change, and invasive species) affect these services/disservices and interactions in the present and future, have remained largely unknown.
In the Ecuadorian context, there has been an important investment into infrastructure and human resources with the legal and ethical background to establish a new field of biodiversity conservation, bioprospecting, and research for alternative economic revenues and the protection of indigenous knowledge (Gerique 2012, Heeren 2016, Moeller 2010, Ribadeneira 2009). As this is a new field in Ecuador aiming at diversifying the economy and contributing to the National Plan of Buen Vivir1 (SENPLADES 2013), aspects of health-related research and the role of biodiversity on diseases and well-being should receive more attention (Golinelli et al. 2015, Navarro et al. 2015, Rodríguez 2007, Widenhorn 2013). In this context, it is of great importance to recover and strengthen the technical and operational capabilities of the programmes and strategies on public health, particularly the control of vector-borne and neglected tropical diseases, to sustain and deepen previous achievements of, for example, dengue fever, malaria, and snakebite control.
Importantly, there is growing knowledge of Peru and Ecuador’s biodiversity at the species level (Bass et al. 2010, Ledo et al. 2012, Beaudrot et al. 2016). However, critical interactions between biodiversity, health, and global change, such as urbanisation, deforestation, and climate change have rarely been addressed, and if so, usually on a very limited geographical scale, rendering generalizations difficult. Challenges exist particularly in relation to vector-borne diseases like chikungunya, dengue and Zika virus infections and malaria, and neglected tropical diseases like Chagas’ disease and snakebite envenoming, which are all very sensitive to climate, biodiversity, and other anthropogenic factors.
It is recommended that more emphasis should be given to analysing the roles of high biodiversity for disease prevention and control, and to studying the impact of global changes, such as climate change, urbanization, and deforestation, on the distribution and risk of pathogens and their vectors and reservoir hosts. In addition, more research will be needed particularly in Amazonian rainforest areas affected by rapid changes due to the extraction of fossil fuels and other raw materials, infrastructure expansion (e.g., road constructions), uncontrolled settlements, and other land use changes (e.g., increasing industrial-scale monocultures of African palm oil and soybean, cattle farming).
ACKNOWLEDGEMENTS
We would like to thank the Peruvian Ministry of Environment (MINAM), the CBD secretariat, IAI and Pro-Ambiente (GIZ) for inviting us to take part in the meeting. D. Montag would like to acknowledge the Project Prometeo at the Ecuadorian Secretary of Higher Education, Science, Technology and Innovation (Senescyt) for financing her research, and the Universidad Andina Simón Bolívar. We would like to thank M. H. Aguilar and M. Dhimal for comments on earlier drafts, and A. Milner for proofreading and invaluable comments. Finally, we would like to thank two anonymous reviewers for their highly constructive inputs to earlier versions.
1 The National Plan of Buen Vivir (or, in English: Well-being) is the central development plan of the Ecuadorian government. This five-year national plan was developed by the National Secretary of Planning and Development of Ecuador (SENPLADES).
99
Overview of the Panel on Biodiversity and Health under Climate Change
REFERENCES
Aguilar HM, Abad-Franch F, Pinto Dias JC, Veríssimo Junqueira AC, Rodrigues Coura J. 2007 Chagas Disease in the Amazon Region. Memórias do Instituto Oswaldo Cruz 102:47-56.
Aguirre AA, Beasley VR, Augspurger T, Benson WH, Whaley J, Basu N. 2016 One Health—Transdisciplinary Opportunities for SETAC Leadership in Integrating and Improving the Health of People, Animals, and the Environment. Environmental Toxicology and Chemistry 35 (10): 2383-2391.
Aguirre, A Alonso, Richard S Ostfeld, Gary M Tabor, Carol House, and Mary C Pearl. 2002. Conservation Medicine: Ecological Health in Practice: Oxford University Press.
Aguirre, AA, Ostfeld RS, Daszak P. 2012. New Directions in Conservation Medicine. Applied Cases of Ecological Health. Oxford: Oxford University Press.
Alirol E, Sharma SK, BawaskarHS, Kuch U, Chappuis F. 2010 Snake Bite in South Asia: A Review. PLoS Neglected Tropical Diseases 4 (1):e603.
Allaerts W, Chang TW. 2017 Skewed Exposure to Environmental Antigens Complements Hygiene Hypothesis in Explaining the Rise of Allergy. Acta Biotheoretica:1-18.
Arora SK, Dewan P, Gupta P. 2015 Microbiome: Paediatricians’ Perspective.” The Indian Journal of Medical Research 142 (5):515.
Arrieta MC, Stiemsma LT, Amenyogbe N, Brown EM, Finlay B. 2014 The Intestinal Microbiome in Early Life: Health and Disease. Frontiers in Immunology 5:427.
Arunachalam N, Tana S, Espino F, Kittayapong P, Abeyewickrem W, Wai KT, Tyagi BK, Kroeger A, Sommerfeld J, Petzold M. 2010 Eco-Bio-Social Determinants of Dengue Vector Breeding: A Multicountry Study in Urban and Periurban Asia. Bulletin of the World Health Organization 88 (3):173-184.
Bain LE, Awah PK, Geraldine N, Kindong NP, Siga Y, Bernard N, Tanjeko AT. 2013 Malnutrition in Sub–Saharan Africa: Burden, Causes and Prospects. Pan African Medical Journal 15 (1).
Balée W. 1994 Footprints of the Forest: Ka’apor Ethnobotany - the Historical Ecology of Plant Utilization by an Amazonian People. New York: Columbia University Press.
Barrett MA, Bouley TA, Aaron H Stoertz AH, Stoertz RW. 2011 Integrating a One Health Approach in Education to Address Global Health and Sustainability Challenges. Frontiers in Ecology and the Environment 9 (4):239-245.
Barros FSM, Honório NA. 2015 Deforestation and Malaria on the Amazon Frontier: Larval Clustering of Anopheles darlingi (Diptera: Culicidae) Determines Focal Distribution of Malaria. The American Journal of Tropical Medicine and Hygiene 93 (5):939-953.
Bass, M S, M Finer, C N Jenkins, H Kreft, D F Cisneros-Heredia, S F McCracken, N C A Pitman, P H English, K Swing, G Villa, A Di Fiore, C C Voigt, and T H Kunz. 2010 Global Conservation Significance of Ecuador’s Yasuní National Park. PloS One 5:e8767. doi: 10.1371/journal.pone.0008767.
Beaudrot L, J A Ahumada, T O’Brien, P Alvarez-Loayza, K Boekee, A Campos-Arceiz, D Eichberg, S Espinosa, E Fegraus, and C Fletcher. 2016 Standardized Assessment of Biodiversity Trends in Tropical Forest Protected Areas: The End is not in Sight. PLoS Biol 14 (1):e1002357.
Beaumont LJ, Duursma DE. 2016 Impacts of Climate Change on the Distributions of Allergenic Species. In PJ Beggs (Ed) Impacts of Climate Change on Allergens and Allergic Diseases:p. 29-49. Cambridge University Press
Bernstein A. 2008 Emerging Patterns in Over- Weight and Obesity in Ecuador. Rev Panam Salud Publica/ 24 (1):71–4.
Biermann F 2012 Planetary Boundaries and Earth System Governance: Exploring the Links. Ecological Economics 81:4-9. doi: 10.1016/j.ecolecon.2012.02.016.

100
Overview of the Panel on Biodiversity and Health under Climate Change
Blackwell AD, Pryor G, Pozo J, Tiwia W, Sugiyama LS. 2009 Growth and Market Integration in Amazonia: a Comparison of Growth Indicators between Shuar, Shiwiar, and Nonindigenous Cchool Children. American Journal of Human Biology 21: 161-171.
Blare T,Donovan J. 2016 Building Value Chains for Indigenous Fruits: Lessons from Camu-Camu in Peru. Renewable Agriculture and Food Systems:1-13.
Blaser M, Bork P, Fraser C, Knight R, Wang J. 2013 The Microbiome Explored: Recent Insights and Future Challenges. Nature Reviews Microbiology 11 (3): 213-217.
Bloomfield SF, Rook GAW, Scott EA, Shanahan F, Stanwell-Smith R, Turner P. 2016. Time to Abandon the Hygiene Hypothesis: New Perspectives on Allergic Disease, the Human Microbiome, Infectious Disease Prevention and the Role of Targeted Hygiene. Perspectives in Public Health 136 (4):213-224.
Boron V, Payán E, MacMillan D, Tzanopoulos J. 2016 Achieving Sustainable Development in Rural Areas in Colombia: Future Scenarios for Biodiversity Conservation under Land use Change. Land Use Policy 59:27-37.
Bowen KJ, Friel S, Ebi K, Butler CD, Miller F, McMichael AJ. 2011 Governing for a Healthy Population: Towards an Understanding of How Decision-Making Will Determine Our Global Health in a Changing Climate. International Journal of Environmental Research and Public Health 9:55-72. doi: 10.3390/ijerph9010055.
Breilh J. 2012 Coping with Environmental and Health Impacts in a Floricultural Region of Ecuador. In DF Charron (Ed) Ecohealth Research in Practice. Innovative Applications of an Ecosystem Approach to Health. Insight and Innovation in International Development., ed 59-68. Ottawa, Cairo, Dakar, Montevideo, Nairobi, New Delhi, Singapore.: IDRC, CRDI, Springer.
Brose U, Hillebrand H. 2016. Biodiversity and Ecosystem Functioning in Dynamic Landscapes. Phil. Trans. R. Soc. B 371 (1694): 20150267.
Brusca SB, Abramson SB, Scher JU. 2014. Microbiome and Mucosal Inflammation as Extra-Articular Triggers for Rheumatoid Arthritis and Autoimmunity. Current Opinion in Rheumatology 26 (1): 101.
Butler, C D 2014. Climate Change and Global Health. Croydon, UK: CABI.
Calvopina M, Armijos RX, Hashiguchi Y. 2004. Epidemiology of Leishmaniasis in Ecuador: Current Status of Knowledge—A Review. Memorias do Instituto Oswaldo Cruz. 99:663-672.
Campbell-Lendrum D, Manga L, Bagayoko M, Sommerfeld J. 2015. Climate Change and Vector-Borne Diseases: What are the Implications for Public Health Research and Policy? Phil. Trans. of the Royal Society of London B: Biological Sciences 370 (1665):20130552.
Cardinale BJ, Duffy JE, Gonzalez A, Hooper DU, Perrings C, Venail P, Narwani A, Mace GM, Tilman D, Wardle DA, Kinzig AP, Daily GC, Loreau M, Grace JB, Larigauderie A, Srivastava DSNaeem S. 2012 Biodiversity Loss and its Impact on Humanity. Nature 486:59-67. doi: 10.1038/nature11148.
Ceballos G, Ehrlich PR, Barnosky AD, García A, Pringle RM, Palmer TM. 2015 Accelerated Modern Human–Induced Species Losses: Entering the Sixth Mass Extinction. Science Advances 1 (5):e1400253. doi: 10.1126/sciadv.1400253.
Charron, D. F. 2012. Ecohealth Research in Practice. Ottawa, Cairo, Dakar, Montevideo, Nairobi, New Delhi, Singapore: Springer, IDRC, CRDI.
Chen J, Wright K, Davis JM, Jeraldo P, Marietta EV, Murray J, Nelson H, Matteson EL, Taneja V. 2016 An Expansion of Rare Lineage Intestinal Microbes Characterizes Rheumatoid Arthritis. Genome Medicine 8 (1):43.
Chivian E, Bernstein A (Eds.). 2008 Sustaining Life. How Human Health Depends on Biodiversity: Oxford University Press.
Civitello DJ, Cohen J, Fatima H, Halstead NT, Liriano J, McMahon TA, Ortega CN, Sauer EL, Sehgal T, Young S. 2015 Biodiversity Inhibits Parasites: Broad Evidence for the Dilution Effect. Proceedings of the National Academy of Sciences 112 (28):8667-8671.
101
Overview of the Panel on Biodiversity and Health under Climate Change
Clemente JC, Pehrsson EC, Blaser MJ, Sandhu K, Gao Z, Wang B, Magris M, Hidalgo G, Contreras M, Noya-Alarcón O. 2015 The Microbiome of Uncontacted Amerindians. Science Advances 1 (3): e1500183.
Confalonieri UEC, Suassuna Dutra FRL. 2014 Climate Change and Vector Borne Diseases in Latin America. In Malik, Grohmann, Akhtar (Ed), Environmental Deterioration and Human Health, 315-324. Netherlands: Springer
Corlett RT. 2015 The Anthropocene Concept in Ecology and Conservation. Trends in Ecology & Evolution 30 (1): 36-41. doi: 10.1016/j.tree.2014.10.007.
Deehan EC, Walter J. 2016 The Fiber Gap and the Disappearing Gut Microbiome: Implications for Human Nutrition. Trends in Endocrinology & Metabolism 27 (5): 239-242.
Demaio AR, Rockström J. 2015 Human and Planetary Health: Towards a Common Language. The Lancet 386 (10007):e36-e37.
Dhimal, M. B. Ahrens, and U. Kuch. 2015 Climate Change and Spatiotemporal Distributions of Vector-Borne Diseases in Nepal—A Systematic Synthesis of Literature. PLoS One 10 (6):e0129869. doi: 10.1371/journal.pone.0129869PONE-D-14-52729 [pii].
Dornelas M, Gotelli NJ, McGill B, Shimadzu H, Moyes F, Sievers C, Magurran AE. 2014. Assemblage Time Series Reveal Biodiversity Change but not Systematic Loss. Science 344 (6181):296-299. doi: 10.1126/science.1248484.
Duffy J E, Lefcheck JS, Stuart-Smith RD, Navarrete SA, Edgar GJ. 2016 Biodiversity Enhances Reef Fish Biomass and Resistance to Climate Change. Proceedings of the National Academy of Sciences 113 (22):6230-6235.
Dwivedi SL, Sahrawat K, Upadhyaya H, Ortiz R. 2013 Food, Nutrition and Agrobiodiversity under Global Climate Change. Adv Agron 120:1-128.
Egbendewe-Mondzozo A, Musumba M, McCarl BA, Wu X. 2011 Climate Change and Vector-borne Diseases: An Economic Impact Analysis of Malaria in Africa. International Journal of Environmental Research and Public Health 8:913-930.
Ekane N, Nykvist B, Kjellén M, Noel S, Weitz N. 2014 Multi-level Sanitation Governance: Understanding and Overcoming Challenges in the Sanitation Sector in Sub-Saharan Africa. Waterlines 33 (3):242-256.
Epstain PR. 2002 Biodiversity, climate change and emerging infectious diseases. In Aguirre AA, Ostfeld RS, Tabor G M, House C and Pearl M C: Conservation Medicine: Ecological Health in Practice, 27-39. New York, NY: Oxford University Press.
Fanzo J, Hunter D, Borelli T, Mattei F. 2013 Diversifying Food and Diets: Using Agricultural Biodiversity to Improve Nutrition and Health: Routledge.
FAO. 2015. State of Food Insecurity in the World: Meeting the 2015 International Hunger Targets: Taking Stock of uneven Progress. Roma: FAO.
Fargione JE, Tilman D. 2005 Diversity Decreases Invasion via Both Sampling and Complementarity Effects. Ecology Letters 8 (6):604-611.
Finer M, Jenkins CN, Pimm SL, Keane B, Ross C. 2008 Oil and Gas Projects in the Western Amazon: Threats to Wilderness, Biodiversity, and Indigenous Peoples.” PloS One 3:e2932. doi: 10.1371/journal.pone.0002932.
Finer M, Vijay V, Ponce F, Jenkins CN, Kahn TR. 2009 Ecuador’s Yasuní Biosphere Reserve: A Brief Modern History and Conservation Challenges. Environmental Research Letters 4:034005.
Fisher B, Christopher T. 2007 Poverty and Biodiversity: Measuring the Overlap of Human Poverty and the Biodiversity Hotspots. Ecological Economics 62 (1):93-101. doi: 10.1016/j.ecolecon.2006.05.020.
Gamfeldt L, Lefcheck JS, Byrnes JEK, Cardinale BJ, J Duffy JE, Griffin JN. 2015 Marine Biodiversity and Ecosystem Functioning: What’s Known and What’s next? Oikos 124 (3): 252-265.

102
Overview of the Panel on Biodiversity and Health under Climate Change
Ganguly E, Sharma PK, Bunker CH. 2015 Prevalence and Risk Factors of Diarrhea Morbidity among Under-Five Children in India: A Systematic Review and Meta-Analysis. Indian Journal of Child Health 2 (4):152.
Gerique A. 2012 Biodiversity as a Resource: Plant Use, Land Use, and Nature Conservation in Shuar, Saraguro, and Mestizo Communities in South-Eastern Ecuador. Medicinal Plants and the Legacy of Richard E. Schultes:73.
Golinelli S, K Vega-Villa, and J F Villa-Romero. 2015 Biodiversidad: Ciencia ciudadana, saberes originarios y biodiversidad aplicada en la economía social del conocimiento. In Buen Conocer-FLOK Society. Modelos sostenibles y políticas públicas para una economía social del conocimiento común y abierto en el Ecuador, 345-406. Asociación aLabs.
González CG. 2011 Climate Change, Food Security, and Agrobiodiversity: Toward a Just, Resilient, and Sustainable Food System. FORDHAM ENVTL. L. REV 22 (493).
Habib RR. 2012 Understanding Water, Understanding Health: The Case of Bebnine, Lebanon. In Charron D (Ed) Ecohealth Research in Practice. Innovative Applications of an Ecosystem Approach to Health. Insight and Innovation in International Development., 203-214. Ottawa, IDRC, CRDI, Springer.
Hablützel, PI, Brown M, Friberg IM, Jackson JA. 2016 Changing Expression of Vertebrate Immunity Genes in an Anthropogenic Environment: A Controlled Experiment. BMC Evolutionary Biology 16 (1): 175.
Haines AR, Kovats S, Campbell-Lendrum D, Corvalan C. 2006 Climate Change and Human Health: Impacts, Vulnerability, and Mitigation. Lancet 367:2101-2109. doi: 10.1016/j.puhe.2006.01.002.
Hall MJ. 2014. Advancing Climate Justice and the Right to Health Through Procedural Rights. Human Rights and Health 1 (16):8-18.
Hansen J, Kharecha P, Sato M, Masson-Delmotte V, Ackerman F, Beerling DJ, Hearty PJ, Hoegh-Guldberg O, Hsu S-L, Parmesan C. 2013 Assessing “Dangerous Climate Change Required Reduction of Carbon Emissions to Protect Young People, Future Generations and Nature. PloS One 8 (12): e81648.
Hansen J, Sato M, Kharecha P, von Schuckmann K, Beerling DJ, Cao J, Marcott S, Masson-Delmotte V, Prather MJ, Rohling EJ. 2016 Young People’s Burden: Requirement of Negative CO2 Emissions. arXiv preprint arXiv:1609.05878.
Heeren A. 2016 Commercialization of Biodiversity: The Regulation of Bioprospecting in Ecuador. Negotiating Nature: Imaginaries, Interventions and Resistance 9 (2): 94.
Heywood, V, Fanzo J, Hunter D. 2013 Overview of Agricultural Biodiversity and its Contribution to Nutrition and Health. Diversifying Food and Diets: Using Agricultural Biodiversity to Improve Nutrition and Health: 35-67.
Hillebrand H,Matthiessen B. 2009 Biodiversity in a Complex World: Consolidation and Progress in Functional Biodiversity Research. Ecology Letters 12:1405-19. doi: 10.1111/j.1461-0248.2009.01388.x.
Hodgkin T, Hunter D. 2015 Agricultural Biodiversity, Food Security and Human Health. In Connecting Global Priorities: Biodiversity and Human Health. A State of Knowledge Review, edited by WHO/CBDMontreal. p. 75-96.
Horton R, Beaglehole R, Bonita R, Raeburn J, McKee M, Wall S. 2014 From Public to Planetary Health: A Manifesto. The Lancet 383 (9920): 847.
Hunter, D, Kennedy G, Stoian D, Kikulwe E. 2016 Agrobiodiversity for Healthy, Diverse Diets and Food Systems. edited by Optimal for the Future Workshop. University of Sydney Safe Today. Sydney (Australia).
Hunter D, Burlingame B, Remans R. 2015 Biodiversity and Nutrition. In Connecting Global Priorities: Biodiversity and Human Health. A State of Knowledge Review, edited by WHO/CBD, 97-128. World Health Organization and Secretariat of the Convention on Biological Diversity.
Hunter D, Fanzo J. 2013 Agricultural Biodiversity, Diverse Diets and Improving Nutrition. Diversifying Food and Diets: Using Agricultural Biodiversity to Improve Nutrition and Health:1-14.
Huttenhower C, Knight R, Brown CT, Caporaso JC, Clemente JC, Gevers D, Franzosa EA, Kelley ST, Knights D, Ley RE. 2014 Advancing the Microbiome Research Community. Cell 159 (2): 227-230.

103
Overview of the Panel on Biodiversity and Health under Climate Change
IPCC. 2014 Climate Change 2014: Impacts, Adaptation, and Vulnerability. Part A: Global and Sectoral Aspects. Contribution of Working Group II to the Fifth Assessment Report of the Intergovernmental Panel on Climate Change. [Field, CB, Barros VR, Dokken DJ, Mach KJ, Mastrandrea MD, Bilir TE, Chatterjee M, Ebi KL, Estrada YO, Genova RC, Girma B, Kissel ES, Levy AN, MacCracken S, Mastrandrea PR, White LL (eds.)]. Cambridge University Press.
Jackson MC, Weyl O, Altermatt F, Durance I, Friberg N, Dumbrell AJ, Piggott JJ, Tiegs SD, Tockner K, Krug CB. 2016 Chapter Twelve-Recommendations for the Next Generation of Global Freshwater Biological Monitoring Tools. Advances in Ecological Research 55: 615-636.
Jakobsson HE, Abrahamsson TR, Jenmalm MC, Harris K, Quince C, Jernberg C, Björkstén B, Engstrand L, Andersson AF. 2014 Decreased Gut Microbiota Diversity, Delayed Bacteroidetes Colonisation and reduced Th1 Responses in Infants Delivered by Caesarean Section. Gut 63 (4):559-566.
Jantz SM, Barker B, Brooks TM, Chini LP, Huang Q, Moore RM, Noel J, Hurtt GC. 2015 Future Habitat Loss and Extinctions driven by Land-Use Change in Biodiversity Hotspots under Four Scenarios of Climate-Change Mitigation. Conservation Biology 29 (4): 1122-1131. doi: 10.1111/cobi.12549.
Johnson PTJ, De Roode JC,Fenton A. 2015 Why Infectious Disease Research Needs Community Ecology. Science 349 (6252): 1259504.
Johnson PTJ, Ostfeld RS, Keesing F. 2015 Frontiers in Research on Biodiversity and Disease. Ecology Letters 18 (10): 1119-1133.
Karesh WB, Dobson A, Lloyd-Smith JO, Lubroth J, Dixon MA, Bennett M, Aldrich S, Harrington T, Formenty P, Loh EH. 2012 Ecology of Zoonoses: Natural and Unnatural Histories. The Lancet 380 (9857):1936-1945.
Karesh W, Formenty P. 2015 Infectious Diseases. In Connecting Global Priorities: Biodiversity and Human Health. A State of Knowledge Review., edited by WHO/CBD, 130-159. World Health Organization and Secretariat of the Convention on Biological Diversity.
Karkman A, Lehtimäki J, Ruokolainen L. 2017 The Ecology of Human Microbiota: Dynamics and Diversity in Health and Disease. Ann N Y Acad Sci 1399 (1): 78-92.
Keesing F, Holt RD, Ostfeld RS. 2006 Effects of Species Diversity and Disease Risk. Ecology Letters 9 (4): 485-498.
Keesing F, Belden LK, Daszak P, Dobson A, Harvell CD, Holt RD, Hudson P, Jolles A, Jones KE, Mitchell CE. 2010 Impacts of Biodiversity on the Emergence and Transmission of Infectious Diseases. Nature 468 (7324): 647-652.
Keesing F, Ostfeld RS. 2015 Is Biodiversity Good for your Health? Science 349 (6245):235-236.
Khoury CK, Bjorkman AD, Dempewolf H, Ramirez-Villegas J, Guarino L, Jarvis A, Rieseberg LH, Struik PC. 2014 Increasing Homogeneity in Global Food Supplies and the Implications for Food Security. Proceedings of the National Academy of Sciences 111 (11):4001-4006.
King LJ, Anderson LR, Blackmore CG, Blackwell MJ, Lautner EA, Marcus LC, Meyer TE, Monath TP, Nave JEOhle J. 2008 Executive Summary of the AVMA One Health Initiative Task Force Report. Jr. of the American Veterinary Medical Association 233 (2):259-261. doi: 0.2460/javma.233.2.259.
Koutouki K, Von Bieberstein, Rogalla K. 2011 The Nagoya Protocol: Sustainable Access and Benefits-Sharing for Indigenous and Local Communities. Vt. J. Envtl. L. 13:513.
Kreß A, Amendt J, Müller R. 2017 Überträger von Krankheitserregern in Zeiten des Klimawandels am Beispiel der Stechmücken und Zecken in Deutschland. In Warnsignal Klima: Die Biodiversität, Lozán JL, Breckle S-W, Müller R, Rachor E (eds), p. 123-129.
Kuhnlein HV. 2015 Food System Sustainability for Health and Well-Being of Indigenous Peoples. Public Health Nutrition 18 (13):2415-2424.
104
Overview of the Panel on Biodiversity and Health under Climate Change
Lacey J. 2012 Climate Change and Norman Daniel’s Theory of Just Health: An Essay on Basic Needs. Medical Health Care and Philosophy 15:3-14. doi: 10.1007/s11019-011-9349-5.
Lafferty KD. 2014 Biodiversity Loss and Infectious Diseases. In Lyra-Jorge Verdade LM, Carolina M, Piña CI (eds) Applied Ecology and Human Dimensions in Biological Conservation, p. 73-89. Berlin Heidelberg: Springer.
Lanzerath D, Friele M. 2014 Concepts and Values in Biodiversity, Routledge Studies in Biodiversity Politics and Management. London and New York: Routledge.
Larrea C. 2014 ¿Existen alternativas frente al petróleo en la Amazonía Centro-sur? In Repositorio, UASB. Quito: http://repositorio.uasb.edu.ec/handle/10644/3917.
Larrea Maldonado, Carlos. 2013a Desarrollo social, desigualdad y pobreza. In Atlas de las Desigualdades Socio-Económicas del Ecuador SENPLADES, 21-48. Secretaría Nacional de Planificación y Desarrollo. Quito.
Larrea Maldonado, Carlos. 2013b. “Salud y equidad. In Atlas de las desigualdades socio-económicas del Ecuador, SENPLADES, 71-98. Secretaría Nacional de Planificación y Desarrollo, Quito.
Lebel J. 2003. Health: An Ecosystem Approach. Ottawa, Canada: International Development Research Centre (IDRC).
Ledo A, S Condés, and I Alberdi. 2012 Forest Biodiversity Assessment in Peruvian Andean Montane Cloud Forest. Journal of Mountain Science 9 (3): 372-384.
Lee K, Brumme ZL. 2013 Operationalizing the One Health Approach: The Global Governance Challenges. Health Policy and Planning 28 (7):778-785.
Leisher C, Sanjayan M, Blockhus J, Larsen N, Kontoleon A. 2012. Does Conserving Biodiversity Work to Reduce Poverty? A State of Knowledge Review. Biodiversity Conservation and Poverty Alleviation: Exploring the Evidence for a Link:143-159.
Lemery J, C Williams, and P Farmer. 2014 Editorial: The Great Procrastination. Health and Human Rights 1 (16):1-3.
Levi T, Massey AL, Holt RD, Keesing F, Ostfeld RS, Peres CA. 2016 Does Biodiversity Protect Humans against Infectious Disease? . Ecology 97 (2):536-542.
Loh EH, Murray KA, Nava A, Aguirre AA, Daszak P. 2016 Evaluating the Links Between Biodiversity, Land-Use Change, and Infectious Disease Emergence in Tropical Fragmented Landscapes. Tropical Conservation: Perspectives on Local and Global Priorities:79.
Lovejoy TE, Hannah L. 2005 Climate Change and Biodiversity. New Haven: Yale University.
Lozupone CA, Stombaugh J, Gonzalez A, Ackermann G, Wendel D, Vázquez-Baeza Y, Jansson JK, Gordon JI, Knight R. 2013 Meta-Analyses of Studies of the Human Microbiota. Genome Research 23 (10): 1704-1714.
Macke E, Tasiemski A, Massol F, Callens M, Decaestecker E. 2017 Life history and eco-evolutionary dynamics in light of the gut microbiota. Oikos, 126: 508–531. doi:10.1111/oik.03900
Mackenzie JS, Jeggo M, Daszak P, Richt JA. 2013 One Health: The Human-Animal-Environment Interfaces in Emerging Infectious Diseases. Vol. 366, Current Topics in Microbiology and Immunology. Heidelberg, New York, Dordrecht: Springer.
Manderson L, Aagaard-Hansen J, Allotey P, Gyapong M, Sommerfeld J. 2009 Social Research on Neglected Diseases of Poverty: Continuing and Emerging Themes. PLoS Neglected Tropical Diseases 3 (2):e332.
McMichael AJ, Friel S, Nyong A, Corvalan C. 2008 Global Environmental Change and Health: Impacts, Inequalities, and the Health Sector. British Medical Journal 336:191-194. doi: 10.1136/bmj.39392.473727.AD.
Moeller NI. 2010 The Protection of Traditional Knowledge in the Ecuadorian Amazon: A Critical Ethnography of Capital Expansion. Lancaster University.
105
Overview of the Panel on Biodiversity and Health under Climate Change
Moran EF, Fleming-Moran M. 1996 Global Environmental Change: The Health and Environmental Implications in Brazil and the Amazon Basin. Environmental Sciences 4:S025-S035.
Myers SS, Patz JA. 2009 Emerging Threats to Human Health from Global Environmental Change. Annual Review of Environment and Resources 34:223-252. doi: 10.1146/annurev.environ.033108.102650.
Naeem S, Bunker DE, Hector A, Loreau M, Perrings C. 2009 Biodiversity, Ecosystem Functioning, & Human Wellbeing. Oxford, UK: Oxford University Press.
Naeem S, Chazdon R, Duffy JE, Prager C, Worm B. 2016 Biodiversity and human well-being: an essential link for sustainable development. Proc. R. Soc. B 283: 20162091. http://dx.doi.org/10.1098/rspb.2016.2091
Napolitano DA. 2007 Towards Understanding the Health Vulnerability of Indigenous Peoples Living in Voluntary Isolation in the Amazon Rainforest Experiences from the Kugapakori Nahua Reserve, Peru. EcoHealth 4 (4): 515-531.
Navarro JC, Arrivillaga J, Morales D, Ponce P, Cevallos V. 2015 Evaluación rápida de biodiversidad de mosquitos (Diptera: Culicidae) y riesgo en salud ambiental en un área Montana del Chocó Ecuatoriano. Entomotropica 30:160-173.
Neff CP, Rhodes ME, Arnolds KL, Collins CB, Donnelly J, Nusbacher N, Jedlicka P, Schneider JM, McCarter MD, Shaffer M. 2016 Diverse Intestinal Bacteria Contain Putative Zwitterionic Capsular Polysaccharides with Anti-inflammatory Properties.” Cell Host & Microbe 20 (4):535-547.
Neira M. 2016. Preventing Disease through Healthy Environments: A Global Assessment of the Burden of Disease from Environmental Risks: World Health Organization.
Noble MD, Austin KF. 2015 Rural Disadvantage and Malaria in Less-Developed Nations: A Cross-National Investigation of a Neglected Disease.” Rural Sociology. doi: 10.1111/ruso.12087.
Obregon-Tito AJ, Tito RY, Metcalf J, Sankaranarayanan K, Clemente JC, Ursell LK, Xu ZZ, Van Treuren W, Knight R, Gaffney PM. 2015 Subsistence Strategies in Traditional Societies Distinguish Gut Microbiomes. Nature Communications 6, [6505]. DOI: 10.1038/ncomms7505
Oldfield F, Barnosky AD, Dearing J, Fischer-Kowalski M, McNeill J, Steffen W, Zalasiewicz J. 2014 The Anthropocene Review: Its Significance, Implications and the Rationale for a new Transdisciplinary Journal.” The Anthropocene Review 1 (1): 3-7. doi: 10.1177/2053019613500445.
Orta-Martínez M, Finer M. 2010 Oil Frontiers and Indigenous Resistance in the Peruvian Amazon. Ecological Economics 70: 207-218.
Patz J, Daszak P, Tabor GM, Alonso Aguirre A, Pearl M, Epstein J, Wolfe ND, Kilpatrick AM, Foufopolos J, Molyneux D, Bradley DJ, et al. 2004 Unhealthy Landscapes: Policy Recommendations on Land Use Change and Infectious Disease Emergence. Environmental Health Perspectives 112 (10):1092-1098.
Pinault LL, Hunter FF. 2011 New Highland Distribution Records of Multiple Anopheles Species in the Ecuadorian Andes. Malaria 10:236. doi: 10.1186/1475-2875-10-236.
Piperata BA, Ivanova SA, Da-gloria P, Veiga G, Polsky A, Spence JE, Murrieta RSS. 2011 Nutrition in Transition: Dietary Patterns of Rural Amazonian Women During a Period of Economic Change. American Journal of Human Biology 23 (4):458-469.
Poggi González Z. 2011 Avances en la Protección de Conocimientos Tradicionales en la Amazonía. Expectativas del Protocolo de Nagoya. Propiedad Intelectual 10 (14).
Pongsiri MJ, Roman J, Eyenwa VO, Goldberg TL, Koren HS, Newbold SC, Ostfeld RS, Pattanazak SK, Salkeld DJ. 2009 Biodiversity Loss Affects Global Disease Ecology. BioScience 59 (11):945-954.
Posey DA. 1985 Indigenous Management of Tropical Forest Ecosystems: The Case of the Kayapó Indians of the Brazilian Amazon. Agroforestry Systems 3:139-158.
106
Overview of the Panel on Biodiversity and Health under Climate Change
Prüss-Ustün, A, J Wolf, C Corvalán, T Neville, R Bos, and M Neira. 2016. “Diseases due to Unhealthy Environments: An Updated Estimate of the Global Burden of Disease Attributable to Environmental Determinants of Health.” Journal of Public Health. 39 (3): 464–475, https://doi.org/10.1093/pubmed/fdw085
Qin N, Yang F, Li A, Prifti E, Chen Y, Shao L, Guo J, Le Chatelier E, Yao J, Wu L. 2014 Alterations of the Human Gut Microbiome in Liver Cirrhosis. Nature 513 (7516): 59-64.
Rabinowitz PM, Kock R, Kachani M, Kunkel R, Thomas J, Gilbert J, Wallace R, Blackmore C, Wong D, Karesh W. 2013 Toward Proof of Concept of a One Health Approach to Disease Prediction and Control. Emerg Infect Dis 19 (12):10.3201.
Randolph SE, Dobson ADM. 2012 Pangloss Revisited: A Critique of the Dilution Effect and the Biodiversity-Buffers-Disease Paradigm. Parasitology 139 (07):847-863.
Ranjan R, Lakshmi VK, Balakrishnan K. 2012 Ecohealth Research for Mitigating Health Risks of Stone Crushing and Quarrying, India. In DF Charron (Ed) Ecohealth Research in Practice. Innovative Applications of an Ecosystem Approach to Health. Insight and Innovation in International Development., 99-108. Ottawa, Cairo, Dakar, Montevideo, Nairobi, New Delhi, Singapore: Springer, IDRC, CRDI.
Raoult D. 2016. Microbiota, Obesity and Malnutrition. Elsevier.
Rask M, Worthington R, Eds. 2015. Governing Biodiversity through Democratic Deliberation, Routledge Studies in Biodiversity Politics and Management. London and New York: Routledge.
Reinmuth-Selzle K, Kampf CJ, Lucas K, Lang-Yona N, Fröhlich-Nowoisky J, Shiraiwa M, Lakey PSJ, Lai S, Liu F, Kunert AT. 2017 Air Pollution and Climate Change Effects on Allergies in the Anthropocene: Abundance, Interaction, and Modification of Allergens and Adjuvants. Environmental Science & Technology 51(8):4119-4141.
Ribadeneira, M. 2009 Biopiracy or Fallacy? Identifying Genuine Biopiracy Cases in Ecuador. Genetic Resources, Traditional Knowledge and the Law: Solutions for Access and Benefit Sharing: 341
Riojas-Rodríguez H, Rodríguez-Dozal S. 2012 An Ecosystem Study of Manganese Mining in Molango, Mexico. In D. Charron (Ed) Ecohealth Research in Practice. Innovative Applications of an Ecosystem Approach to Health. Insight and Innovation in International Development., Ottawa, Cairo, Dakar, Montevideo, Nairobi, New Delhi, Singapore: IDRC, CRDI, Springer.
Rival L. 2006 Amazonian Historical Ecologies. Jr. of the Royal Anthropological Institute N.S.:79-94.
Robinson D. 2010 Traditional Knowledge and Biological Product Derivative Patents: Benefit-Sharing and Patent Issues Relating to Camu Camu, Kakadu Plum, and Açaí Plant Extracts. United Nations University.
Rockström J, Steffen W, Noone K, Persson A, Chapin FSIII, Lambin E, Lenton TM, Scheffer M, Folke C, Schellnhuber H, Nykvist JB, De Wit CA, Hughes T, Van der Leeuw S, Rodhe H, Sörlin S, Snyder PK, Costanza R, Svedin U, Falkenmark M, Karlberg L, Corell RW, Fabry VJ, Hansen J, Walker B, Liverman D, Richardson K, Crutzen P, Foley J. 2009 Planetary Boundaries: Exploring the Safe Operating Space for Humanity. Ecology and Society 14 (2): 32.
Rodríguez GA. 2007 Conflictos ambientales amenazan la salud de la población y la biodiversidad del planeta. Revista de Derecho 28:329-347.
Romanelli C, Capon A, Maiero M, Campbell-Lendrum D. 2015 Climate Change, Biodiversity and Human Health. In WHO/CBD (Ed) Connecting Global Priorities: Biodiversity and Human Health. A State of Knowledge Review, 222-367. World Health Organization and Secretariat of the Convention on Biological Diversity.
Romanelli C, Daniel B. 2015 Freshwater, Wetlands, Biodiversity and Human Health. In WHO/CBD (Ed) Connecting Global Priorities: Biodiversity and Human Health. A State of Knowledge Review, p. 46-62. World Health Organization and Secretariat of the Convention on Biological Diversity.
Rook GA 2013 Regulation of the Immune System by Biodiversity from the Natural Environment: An Ecosystem Service Essential to Health. Proc. of the National Academy of Sciences 110 (46):18360-18367.

107
Overview of the Panel on Biodiversity and Health under Climate Change
Rook GA, Knight R. 2015 Environmental Microbial Diversity and Noncommunicable Diseases. In WHO/CBD (Ed) Connecting Global Priorities: Biodiversity and Human Health. A State of Knowledge Review. p. 151-164.
Ruokolainen L, Fyhrquist N, Haahtela T. 2016 The Rich and the Poor: Environmental Biodiversity Protecting from Allergy. Current Opinion in Allergy and Clinical Immunology 16 (5): 421-426.
Sachs JD, Baillie JEM, Sutherland WJ, Armsworth PR, Ash N, Beddington J, Blackburn TM, Collen B, Gardiner B, Gaston KJ. 2009. Biodiversity Conservation and the Millennium Development Goals. Science 325 (5947): 1502-1503.
Sala OE, Meyerson LA, Parmesan C. 2009 Biodiversity Change and Human Health: From Ecosystem Services to Spread of Disease. Vol. 69, (Scientific Committee on Problems of the Environment (SCOPE Series): Island Press.
Sandifer PA, Sutton-Grier AE, Ward BP. 2015 Exploring Connections among Nature, Biodiversity, Ecosystem Services, and Human Health and Well-Being: Opportunities to Enhance Health and Biodiversity Conservation. Ecosystem Services 12: 1-15.
Schaible UE, Stefan HE. 2007 Malnutrition and Infection: Complex Mechanisms and Global Impacts. PLoS Med 4 (5):e115.
Schlagenhauf Lawlor P. 2007 Travel Medicine. Tales Behind the Science.” In Wilder-Smith A, Schwartz E, Shaw M (Ed) Barking up the Right Trees? Malaria Drugs from Chinchona to Quing Hao., 87-90. Elsevier Ltd.
Schwabe C. 1984 Veterinary Medicine and Human Health Baltimore, MD: Williams & Wilkins.
Seddon N, Mace GM, Naeem S, Tobias JA, Pigot AL, Cavanagh R, Mouillot D, Vause J, Walpole M. 2016. “Biodiversity in the Anthropocene: Prospects and Policy.” Proc. R. Soc. B. 283: 20162094.
SENPLADES. 2013 Plan Nacional del Buen Vivir 2013-2017. Quito: SENPLADES.
Siraj AS, Santos-Vega M, Bouma MJ, Yadeta D, Ruiz Carrascal D, Pascual M. 2014 Altitudinal Changes in Malaria Incidence in Highlands of Ethiopia and Colombia. Science 343 (6175):1154-8. doi: 10.1126/science.1244325.
Steffen W, Richardson K, Rockström J, Cornell SE, Fetzer I, Bennett EM, Biggs R, Carpenter SR, de Vries W, de Wit CA. 2015 Planetary Boundaries: Guiding Human Development on a Changing Planet. Science 347 (6223):1259855.
Tsosie RA. 2007 Indigenous People and Environmental Justice: The Impact of Climate Change. University of Colorado Law Review 78:1625.
Turnbaugh PJ. 2017 Microbes and Diet-Induced Obesity: Fast, Cheap, and Out of Control. Cell Host & Microbe 21 (3):278-281.
Urban, MC, Bocedi G, Hendry AP, Mihoub J-B, Pe’er G, Singer A, Bridle JR, Crozier LG, De Meester L, Godsoe W. 2016 Improving the Forecast for Biodiversity under Climate Change. Science 353 (6304):aad8466.
Vadrot AB.M. 2014 The Politics of Knowledge and Global Biodiversity, Routledge Studies in Biodiversity Politics and Management London, NY: Routledge.
Vallejo MC, Burbano R, Falconí F, Larrea C. 2015 Leaving Oil Underground in Ecuador: The Yasuní-ITT Initiative from a Multi-Criteria Perspective. Ecological Economics 109:175-185.
Vourc’h G, Plantard O, Morand S. 2012 How does Biodiversity Influence the Ecology of Infectious Disease? In New Frontiers of Molecular Epidemiology of Infectious Diseases, 291-309. Springer.
Waltner-Toews D, Key J. 2005 The Evolution of an Ecosystem Approach: The Diamond Schematic and an Adaptive Methodology for Ecosystem Sustainability and Health. Ecology and Society 10 (1):38(online).
Wang H, Horton R. 2015 Tackling Climate Change: The Greatest Opportunity for Global Health. The Lancet 386 (10006):1798–1799. doi: 10.1016/S0140-6736(15)60931-X.
Waters WF. 2006 Globalization and Local Response to Epidemiological Overlap in 21st Century Ecuador. Globalization and Health 2:8.

108
Overview of the Panel on Biodiversity and Health under Climate Change
Watts N, Adger WN, Agnolucci P et al 2015 Health and Climate Change: Policy Responses to Protect Public Health. The Lancet. doi: 10.1016/S0140-6736(15)60854-6.
Whiteman G, Walker B, Perego P. 2013 Planetary Boundaries: Ecological Foundations for Corporate Sustainability. Jr of Management Studies 50 (2): 307-336.
Whitmee S, Haines A, Beyrer C, Boltz F, Capon AG, Dias B, Ezeh A, Frumkin H, Gong P, Head P. 2015 Safeguarding Human Health in the Anthropocene Epoch: Report of the Rockefeller Foundation–Lancet Commission on Planetary Health. The Lancet 386 (10007):1973-2028. doi: 10.1016/S0140-6736(15)60901-1.
WHO/CBD. 2015 Connecting Global Priorities: Biodiversity and Human Health. A State of Knowledge Review.: World Health Organization and Secretariat of the Convention on Biological Diversity. Montreal.
Widenhorn S. 2013 Towards Epistemic Justice with Indigenous Peoples’ Knowledge? Exploring the Potentials of the Convention on Biological Diversity and the Philosophy of Buen Vivir. Development 56 (3):378-386.
Wilcox BA, Aguirre AA, Daszak P, Horwitz P, Martens P, Parkes M, Patz JA, Waltner-Toews D. 2004. EcoHealth: A Transdisciplinary Imperative for a Sustainable Future. EcoHealth 1 (1):3-5.
Wolfe ND, Daszak P, Kilpatrick AM, Burke DS. 2005 Bushmeat Hunting, Deforestation, and Prediction of Zoonotic Disease. Emerging Infectious Diseases 11 (12):1822-1827.
Wood CL, Lafferty KD, DeLeo G, Young HS, Hudson PJ, Kuris AM. 2014 Does Biodiversity Protect Humans against Infectious Disease? Ecology 95 (4):817-832. doi: 10.1890/13-1041.1.
Yépez R, Carrasco F, Baldeón ME. 2008 Prevalence of Overweight and Obesity in Ecuadorian Adolescent Students in the Urban Area. Archivos Latinoamericanos de Nutrición 58 (2):39-143.
Young OR, Underdal A, Kanie N, Andresen S, Bernstein S, Biermann F, Gupta J, Haas PM, Iguchi M, Kok M. 2014 Earth System Challenges and a Multi-Layered Approach for the Sustainable Development Goals. Policy Brief 1. Tokyo: United Nations University Institute for the Advanced Study of Sustainability.
Zamudio T. 2013. Los conocimientos tradicionales y el régimen legal de acceso y distribución de beneficios. Derecho PUCP (69): 259-279.
Zhang Y-J, Li S, Gan RY, Zhou T, Xu DP, Li HB. 2015 Impacts of Gut Bacteria on Human Health and Diseases. International Journal of Molecular Sciences 16 (4):7493-7519.
Zhong D, Wang X, Xu T, Zhou G, Wang Y, Lee M-C, Hartsel JA, Cui L, Zheng B, Yan G. 2016. Effects of Microclimate Condition Changes Due to Land Use and Land Cover Changes on the Survivorship of Malaria Vectors in China-Myanmar Border Region. PloS one 11 (5):e0155301.
Zinngrebe, Y. 2016 Conservation Narratives in Peru: Envisioning Biodiversity in Sustainable Development. Ecology and Society 21 (2): 35.http://dx.doi.org/10.5751/ES-08512-210235.
Zinsstag J, Schelling E, Waltner-Toews D, Tanner M. 2011. From “One Medicine” to “One Health” and Systemic Approaches to Health and Well-Being. Preventive Veterinary Medicine 101 (3):148-156.

109
Territorial Management, as a Mechanism for Mitigation and Adaptation to Climate Change
3. ECOSYSTEM-BASED SOLUTIONS AND OTHER APPROACHES TO COPE WITH CLIMATE CHANGE
TERRITORIAL MANAGEMENT, AS A MECHANISM FOR MITIGATION AND ADAPTATION TO CLIMATE CHANGE
Lilian Painter1, Mariana Montoya1 and Mariana Varese1
1Wildlife Conservation Society, Latin America and Caribbean Program
1. INTRODUCTION
Throughout the Amazon pollution, deforestation, unsustainable resource extraction and invasive species represent the most relevant direct threats to species, ecosystem functions and human well-being. These direct threats are a result of contributing factors including lack of knowledge to guide sustainable management, few economic alternatives, global demand for products and poor territorial governance that result in illegal resource extraction and poorly planned development.
Territorial management is a process that aims to reach a planned, sustainable and efficient land use. Territorial planning refers to the methods used by public institutions and social organizations to plan the proper and efficient distribution of people and use of resources in a specific geographical area or territory to improve their living conditions and strengthen mechanisms for sustainability. It requires an adaptive governance approach (Schultz et al. 2015), in which decision making processes involve multiple government and non-government stakeholders at multiple levels to negotiate, coordinate and agree on management actions across the landscape in order to deal with local and large-scale perturbations. It also contemplates environmental management, economic development, organizational consolidation, capacity building and cultural recovery. Therefore, it is an important strategy to reduce the above contributing factors.
Territorial management is implemented in different jurisdictions under strategic orientations provided by protected area management plans, subnational government development plans, indigenous life plans or integral management plans and can also be implemented within individual properties or areas under management of productive associations or natural resource management concessions. However, wherever it is implemented it is important that land use rights are clearly established so that consultation processes do not weaken the rights of legitimate stakeholders. Territorial management in specific jurisdictions will vary in their guiding principles, visions and legal basis but they all share two common elements: a zoning plan that establishes land uses according to the aptitudes of different areas and that should respond to the strategic management vision; and natural resource management regulations to support the implementation of the zoning plan by detailing permitted practices and access rights for different user groups.
It is possible to generalize the principal components of a territorial planning process. First the conditions for the planning process must be established through a body with legitimacy to convene and lead a transparent participatory construction. A diagnostic phase follows, incorporating both technical information as well as participatory mapping and analysis of different development scenarios, including those related to informal highly impacting human activities, impacts of development projects and climate change. Finally, the development of the spatial plan or zoning plan according to the different potential, constraints, opportunities and risks. Another important aspect to consider is the need to identify incompatibilities and potential synergies between the different scales and levels of indigenous, local, municipal, provincial, and even national territorial planning.

110
Territorial Management, as a Mechanism for Mitigation and Adaptation to Climate Change
2. IMPORTANCE OF INTEGRATED TERRITORIAL MANAGEMENT FOR BIODIVERSITY AND ECOSYSTEM CONSERVATION
Protected areas usually are found over areas with a higher biodiversity than surrounding areas that are managed mainly for human subsistence and economic development. However, although protected areas are essential for biodiversity and ecosystem conservation they require connectivity with surrounding areas in order to be able to operate at a scale that is relevant for conserving biodiversity, cultural characteristics, ecosystems and their services. Operating at a larger landscape scale also allows the inclusion of jurisdictions that are challenged by the same socioeconomic threats, for example resulting from new transport infrastructure; and to take into account opportunities for reconciling development and conservation through tourism routes or forest management. Considerations of scales and multiple scales, and identifying for example, the appropriate basin scale to operate is critical to understand the context and to better address the threats to the territory (Barthem et al., 2014).
Because of this, it is important that land use plans are developed at different scales and across neighboring and overlapping jurisdictions in an integrated territorial plan that responds both to local development visions as well as to environmental services and species spatial requirements. Protected area management plans must therefore look at the regional development context and look to promote the reconciliation of the strategic objectives of neighbouring jurisdictions and with those of the protected area.
Many ecosystem services that are critical for human health and development also require integrated land use planning across jurisdictions for example, watershed conservation, large biomass reservoirs, areas of distribution of wild crop relatives and areas that are critical for erosion control or prevention. All of the above ecosystem services represent natural solutions to climate change (Dudley et al., 2009). Altitudinal and latitudinal corridors are also important to allow population movements of species during climate change and also allow humans to relocate their productive activities. Landscape species are characterized by their dependence on large, diverse areas and significant impact on natural ecosystems (Sanderson et al., 2012). Their habitat requirements make them particularly vulnerable to land use practices that result in habitat fragmentation or degradation and because of this they can be used to identify connectivity needs around protected areas.
Important conservation areas for ecosystems or species can overlap with ancestral indigenous territories and community owned lands both within and outside protected areas. In these cases any land use plan must be built using participatory processes and be led by the indigenous people, as established by national legislation in most Latin American countries and the United Nations Declaration on the Rights of Indigenous People. In these areas local livelihoods must be supported to deal with the pressing need to reduce poverty, conserve biodiversity, maintain ecosystem services and increase resilience to current and future climatic conditions.
3. IMPORTANCE OF INTEGRAL TERRITORIAL MANAGEMENT AS A MECHANISM FOR CLIMATE CHANGE MITIGATION AND ADAPTATION
Mitigation
In Bolivia, the Wildlife Conservation Society has been working with the Tacana People´s Indigenous Council (CIPTA) for 15 years. During this time we have provided technical assistance to support their efforts to obtain legal recognition of their indigenous territorial rights over 389,340 hectares and, in parallel to the process of land titling, developing a participatory strategic and land use plan, as well as technical, administrative and organizational tools required for territorial management (CIPTA, 2007).
The zoning plan is implemented through productive projects distributed across the indigenous land that represent an alternative to illegal encroachment associated with deforestation and increased frequency of fires for slash and burn, and therefore a mitigation strategy to climate change. Maintaining presence across the indigenous land consolidates indigenous territorial control and allows protection of critical areas for environmental services.
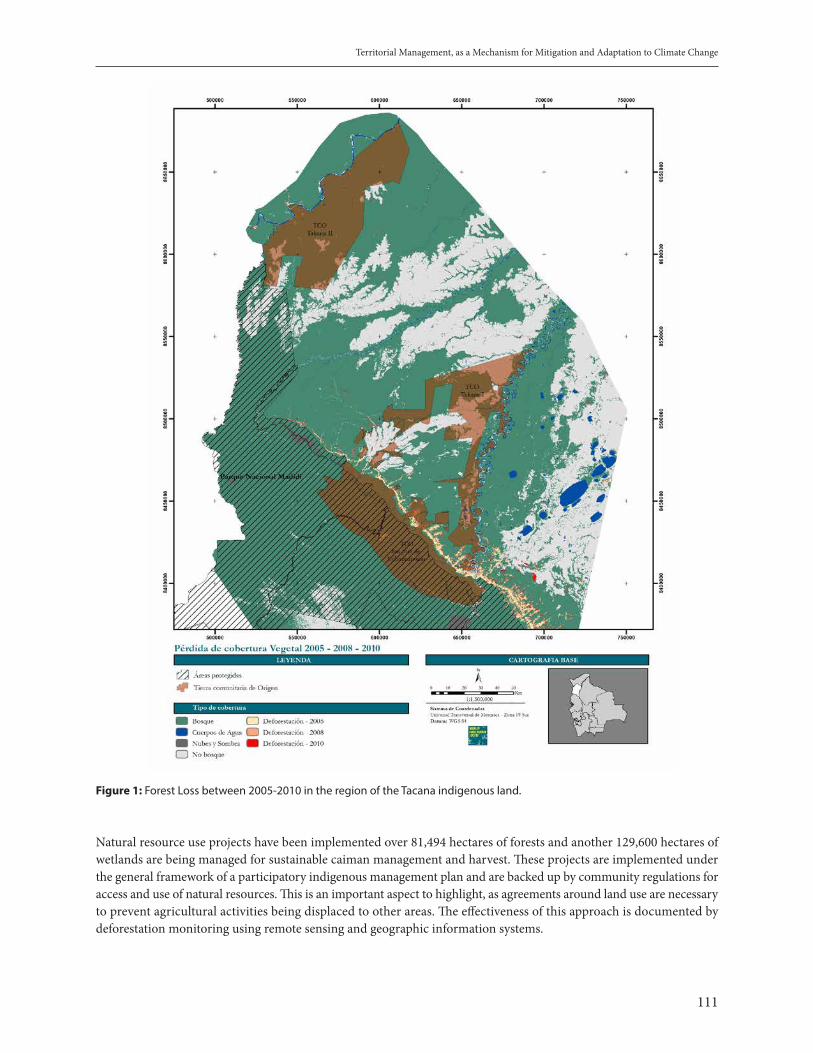
111
Territorial Management, as a Mechanism for Mitigation and Adaptation to Climate Change
Figure 1: Forest Loss between 2005-2010 in the region of the Tacana indigenous land.
Natural resource use projects have been implemented over 81,494 hectares of forests and another 129,600 hectares of wetlands are being managed for sustainable caiman management and harvest. These projects are implemented under the general framework of a participatory indigenous management plan and are backed up by community regulations for access and use of natural resources. This is an important aspect to highlight, as agreements around land use are necessary to prevent agricultural activities being displaced to other areas. The effectiveness of this approach is documented by deforestation monitoring using remote sensing and geographic information systems.
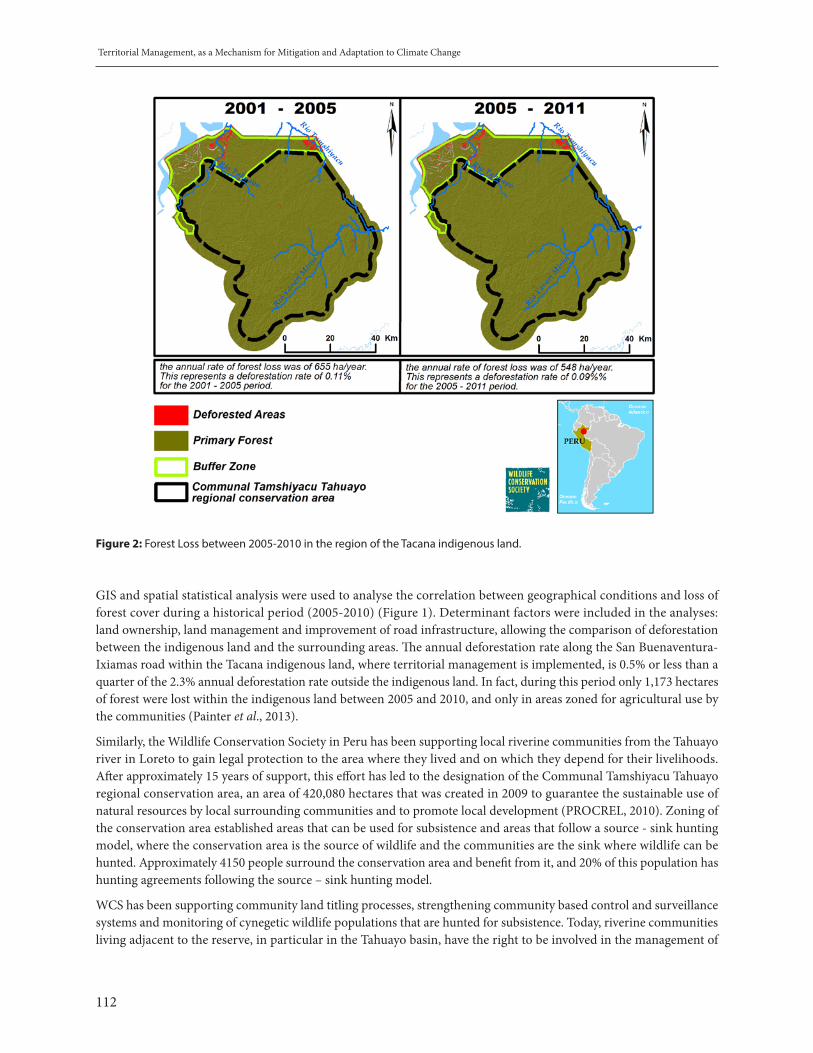
112
Territorial Management, as a Mechanism for Mitigation and Adaptation to Climate Change
Figure 2: Forest Loss between 2005-2010 in the region of the Tacana indigenous land.
GIS and spatial statistical analysis were used to analyse the correlation between geographical conditions and loss of forest cover during a historical period (2005-2010) (Figure 1). Determinant factors were included in the analyses: land ownership, land management and improvement of road infrastructure, allowing the comparison of deforestation between the indigenous land and the surrounding areas. The annual deforestation rate along the San Buenaventura-Ixiamas road within the Tacana indigenous land, where territorial management is implemented, is 0.5% or less than a quarter of the 2.3% annual deforestation rate outside the indigenous land. In fact, during this period only 1,173 hectares of forest were lost within the indigenous land between 2005 and 2010, and only in areas zoned for agricultural use by the communities (Painter et al., 2013).
Similarly, the Wildlife Conservation Society in Peru has been supporting local riverine communities from the Tahuayo river in Loreto to gain legal protection to the area where they lived and on which they depend for their livelihoods. After approximately 15 years of support, this effort has led to the designation of the Communal Tamshiyacu Tahuayo regional conservation area, an area of 420,080 hectares that was created in 2009 to guarantee the sustainable use of natural resources by local surrounding communities and to promote local development (PROCREL, 2010). Zoning of the conservation area established areas that can be used for subsistence and areas that follow a source - sink hunting model, where the conservation area is the source of wildlife and the communities are the sink where wildlife can be hunted. Approximately 4150 people surround the conservation area and benefit from it, and 20% of this population has hunting agreements following the source – sink hunting model.
WCS has been supporting community land titling processes, strengthening community based control and surveillance systems and monitoring of cynegetic wildlife populations that are hunted for subsistence. Today, riverine communities living adjacent to the reserve, in particular in the Tahuayo basin, have the right to be involved in the management of
113
Territorial Management, as a Mechanism for Mitigation and Adaptation to Climate Change
the area and to benefit from resources provided by its well-conserved forests. This process has allowed riverine local communities of the Tahuayo river to be actively engaged in a diverse set of activities such as sustainable natural resource management, artisanal crafts for the national and international markets, tourism and sustainable fish harvest, that provide an incentive to maintain the forest that harbors the resources under management.
A temporal deforestation analysis was done by WCS for the Communal Tamshiyacu Tahuayo regional conservation area and its buffer zone, and the results showed minimum forest loss. For the analysis period from year 2001 to 2005, the annual rate of forest loss was of 655ha/year (0.11%) and for the period 2005 to 2011 it was 548 ha/year (0.09%) (Figure 2). It is important to mention that forest loss is mainly concentrated outside the conservation area in the Tamshiyacu basin and not in the Tahuayo basin (Mercado, 2012) where the conservation area is almost intact. One of the main reasons of forest loss is small scale agriculture.
Adaptation
Territorial management builds resilience to current environmental risks and future scenarios resulting from climate change by reducing exposure and reducing the sensitivity of the system through better land use planning. Zoning or land use planning identifies areas that maintain critical ecosystem services that the indigenous and riverine communities rely upon and also areas that are exposed to floods, droughts or fires. It also builds consensus on the use of different areas for agriculture, tourism, hunting, logging, fishing, cattle ranching as well as sacred areas. The implementation of productive projects in the different management zones maintains diverse livelihoods that have reduced sensitivity to environmental shocks. In the case of northwestern Bolivia, cacao, forestry, incense, handicrafts, livestock management, wild honey harvesting, timber management, and other productive activities help to provide an average annual household income of close to US$1,200, or double that of the average rural household in Bolivia (INE, 2011). Supporting access by indigenous people to their ancestral lands and resources is also important for subsistence activities, such as agricultural production and hunting and fishing for household consumption or reciprocal exchange. In the case of Peru, access by riverine communities to their communal land and to the conservation area is also critical for subsistence activities. Sustainable management of subsistence hunting requires indigenous people and ribereños to have access to large hunting areas that are preferably linked to protected areas through wildlife corridors. Indigenous territories are also crucial to maintain the vast cultural knowledge of medicinal plants and crops that are essential to maintain current indigenous livelihoods and also maintain resilience in the face of climate change.
In addition, in both cases in Bolivia and Peru, the implementation of community natural resource management projects throughout the indigenous land and riverine communities permits the indigenous people and ribereños to maintain a greater control over their land, reducing and replacing illegal and unsustainable natural resource activities with regulated and sustainable activities carried out by indigenous people in their ancestral land and by ribereños in their communal lands. In the case of Peru, governmental authorities may support the ribereños to enforce control over the area, and the ribereños are willing to collaborate with the authorities.
Hence, indigenous territorial management represents a no-regrets strategy for the reduction of climate change vulnerabilities of indigenous populations through the generation of economic returns, diversification of local livelihoods, conservation of forest cover and related averted emissions. It therefore addresses both current poverty alleviation needs and long-term adaptation to climate change.
In addition, territorial management of riverine communities and the adjacent conservation area influence the adaptive capacity of local populations by ensuring the provision of natural resources, maintaining the forest and by strengthening local institutions. Through this influence territorial management can enhance the resilience of the ecosystems and social systems in the face of climate change (Johnson & Becker, 2015). Territorial management can also strengthen the resilience of entire socio-ecological systems to threats operating at multiple scales (Schultz et al., 2015).

114
Territorial Management, as a Mechanism for Mitigation and Adaptation to Climate Change
4. CONCLUSIONS
Territorial management is a critical process to advance in the control of drivers of forest deforestation and degradation, to increase resilience of local livelihoods to climate change and to increase the resilience of the landscape or social-ecological system. Any effort to reduce the loss and degradation of forests, as well as other ecosystems, must identify the reasons behind this loss. Deforestation is the result of complex socioeconomic processes that interact between each other and whose relative importance varies geographically. The interaction between all socioeconomic processes establishes population growth and the expansion of the agricultural frontier that is associated to the existence of markets or subsistence activities. National policies, including transport infrastructure, fiscal and non fiscal incentives or disincentives to different productive sectors, policies related to land and natural resource access and property rights, energy and industrial development policies determine the context for development and population increase.
The effectiveness of these policies to promote the welfare of its citizens depends on the development of an institutional framework that allows coordination between sectors, accountability, transparent decision-making and citizen participation mechanisms. Traditional development models have tended to justify biodiversity losses and the impact on vulnerable human populations for the economic benefits to the whole society or interest groups. The basis for agreements between stakeholders on forest management is participatory land use planning or land management.
Additionally, territorial management is the basis for planning the protection of ecosystem integrity and therefore reduces the risks and impacts of environmental threats such as floods, fires and droughts. Natural vegetation allows floodwaters to disperse and stabilize soils, reducing the incidence of landslides. Forests conserve watersheds and reduce the spread of fires. The conservation of indigenous farming practices maintains diversity of seed varieties and crops that are key to maintaining options to adapt to droughts and floods. Furthermore, natural vegetation of the flooded forest, the integrity of wetlands and their dynamics with water bodies, maintain ecological process that will sustain fish production that is critical to ensure animal protein during and after climate-related extreme events. A well conserved flooded forest, combined with sustainable fisheries management can maintain fish spawning areas and stocks after a climate disturbance, contributing to the persistence of a regional-scale fish population.
In order to further inform these processes it is important to develop our understanding on the cost-benefit of different economic alternatives and scenarios, both of different economic activities as well as different infrastructure uses. We also need to understand the landscape connectivity needs for both ecosystems and biodiversity, such as altitudinal and latitudinal corridors and wildlife corridors, and preferably at multiples scales and/or basin scales. Finally, financial mechanisms to support territorial management must be established by documenting the multiple benefits to equitable development and conservation.
5. REFERENCES
Barthem, R., Calle, I., Cañas, C., Castillo, O., Forsberg, B., Goulding, M., Heck, C., Montoya, M., Mora, C., Venticinque, E. (2014) Inambari: Towards an integrated approach to river basin management. Edited by Anderson, E.. Wildlife Conservation Society.
CIPTA. (2007) Pueblo Indígena Tacana, Consolidación y Gestión territorial. La Paz, Bolivia.
Dudley, N., S. Stolton, A. Belokurov, L. Krueger, N. Lopoukhine, K. MacKinnon, T. Sandwith and N. Sekhran [editors] (2009) Natural Solutions: Protected areas helping people cope with climate change. IUCN-WCPA, The Nature Conservancy, UNDP, Wildlife Conservation Society, The World Bank and WWF, Gland, Switzerland, Washington DC & New York.
Johnson, B. B., & Becker, M. L. (2015) Social–Ecological Resilience and Adaptive Capacity in a Transboundary Ecosystem. Society & Natural Resources, 28(7), 766-780. doi:10.1080/08941920.2015.1037035

115
Territorial Management, as a Mechanism for Mitigation and Adaptation to Climate Change
Mercado, A. (2012) La deforestación histórica en el paisaje Yavarí - Samiria: Resultados preliminares. Wildlife Conservation Society, Lima, Perú.
Sanderson, E., D. Wilkie, A. Vedder. (2001) The landscape species approach – a tool for site-based conservation. Bulletin 2. LIVING LANDSCAPES PROGRAM. Wildlife Conservation Society.
Painter, L., T.M., Siles, A. Reinaga & R. Wallace. (2013) Escenarios de deforestación en el Gran Paisaje Madidi-Tambopata. Consejo Indígena del Pueblo Tacana y Wildlife Conservation Society. La Paz, Bolivia.
PROCREL-Programa de Conservación, Gestión y Uso Sostenible de la Diversidad Biológica de Loreto. (2010) Plan Maestro del área de conservación regional comunal Tamshiyacu Tahuayo: 2010-2015. Gobierno Regional de Loreto. Loreto, Perú.
Schultz, L., Folke, C., Österblom, H., & Olsson, P. (2015) Adaptive governance, ecosystem management, and natural capital. Proceedings of the National Academy of Sciences, 112(24), 7369-7374. doi:10.1073/pnas.1406493112
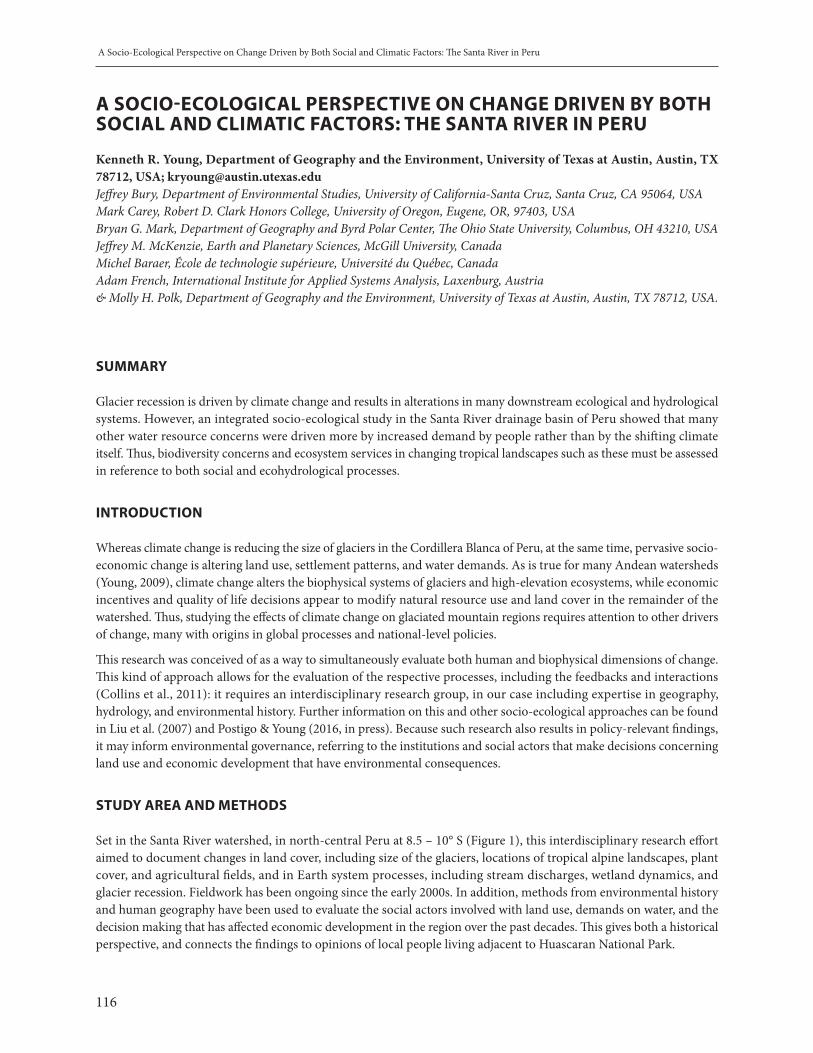
116
A Socio-Ecological Perspective on Change Driven by Both Social and Climatic Factors: The Santa River in Peru
A SOCIO-ECOLOGICAL PERSPECTIVE ON CHANGE DRIVEN BY BOTH SOCIAL AND CLIMATIC FACTORS: THE SANTA RIVER IN PERU
Kenneth R. Young, Department of Geography and the Environment, University of Texas at Austin, Austin, TX 78712, USA; [email protected] Bury, Department of Environmental Studies, University of California-Santa Cruz, Santa Cruz, CA 95064, USAMark Carey, Robert D. Clark Honors College, University of Oregon, Eugene, OR, 97403, USABryan G. Mark, Department of Geography and Byrd Polar Center, The Ohio State University, Columbus, OH 43210, USAJeffrey M. McKenzie, Earth and Planetary Sciences, McGill University, CanadaMichel Baraer, École de technologie supérieure, Université du Québec, CanadaAdam French, International Institute for Applied Systems Analysis, Laxenburg, Austria& Molly H. Polk, Department of Geography and the Environment, University of Texas at Austin, Austin, TX 78712, USA.
SUMMARY
Glacier recession is driven by climate change and results in alterations in many downstream ecological and hydrological systems. However, an integrated socio-ecological study in the Santa River drainage basin of Peru showed that many other water resource concerns were driven more by increased demand by people rather than by the shifting climate itself. Thus, biodiversity concerns and ecosystem services in changing tropical landscapes such as these must be assessed in reference to both social and ecohydrological processes.
INTRODUCTION
Whereas climate change is reducing the size of glaciers in the Cordillera Blanca of Peru, at the same time, pervasive socio-economic change is altering land use, settlement patterns, and water demands. As is true for many Andean watersheds (Young, 2009), climate change alters the biophysical systems of glaciers and high-elevation ecosystems, while economic incentives and quality of life decisions appear to modify natural resource use and land cover in the remainder of the watershed. Thus, studying the effects of climate change on glaciated mountain regions requires attention to other drivers of change, many with origins in global processes and national-level policies.
This research was conceived of as a way to simultaneously evaluate both human and biophysical dimensions of change. This kind of approach allows for the evaluation of the respective processes, including the feedbacks and interactions (Collins et al., 2011): it requires an interdisciplinary research group, in our case including expertise in geography, hydrology, and environmental history. Further information on this and other socio-ecological approaches can be found in Liu et al. (2007) and Postigo & Young (2016, in press). Because such research also results in policy-relevant findings, it may inform environmental governance, referring to the institutions and social actors that make decisions concerning land use and economic development that have environmental consequences.
STUDY AREA AND METHODS
Set in the Santa River watershed, in north-central Peru at 8.5 – 10° S (Figure 1), this interdisciplinary research effort aimed to document changes in land cover, including size of the glaciers, locations of tropical alpine landscapes, plant cover, and agricultural fields, and in Earth system processes, including stream discharges, wetland dynamics, and glacier recession. Fieldwork has been ongoing since the early 2000s. In addition, methods from environmental history and human geography have been used to evaluate the social actors involved with land use, demands on water, and the decision making that has affected economic development in the region over the past decades. This gives both a historical perspective, and connects the findings to opinions of local people living adjacent to Huascaran National Park.

117
A Socio-Ecological Perspective on Change Driven by Both Social and Climatic Factors: The Santa River in Peru
The setting is of high mountains (Figure 2) descending abruptly to an arid coast (Figure 3). This is a tropical site, with strong seasonality in rainfall, and dramatic changes in the native vegetation and in terms of possible agricultural practices. The highest elevations have glaciers, and have been traditionally used as pastures for grazing livestock. The middle elevations have highland agriculture, including the planting of potatoes, wheat, and maize. Nevertheless, the largest demographic change in those elevations is a shift to living in urban areas, with the growth of towns and cities, including the city of Huaraz located adjacent to the Cordillera Blanca and Huascaran National Park. The coast of Peru is arid, with sparse native vegetation but increasingly occupied by large areas of irrigated export agriculture, including the large Chavomichic and Chinecas projects that utilize waters of the Santa River.
Figure 1: The study area is located in western Peru, in a river basin that extends from the glaciers of the Cordillera Blanca (located within Huascaran National Park) down to the drylands of the Pacific Ocean coast.
FINDINGS
Climate change is reducing glaciers in the Cordillera Blanca of Peru (Figure 2). Our hydrological modeling suggests that downstream discharge will first increase and then decrease as the glaciers retreat (Bury et al., 2013). However, the timing is such that the initial increase has already occurred, with surface waters showing decreased flow, especially in the dry seasons. We have also observed concurrent changes in high elevation lakes and wetlands, which increased in size with glacier recession, but which eventually will shrink if they receive less water as stream discharge drops (Young, 2014).
In terms of the human dimensions, we showed that the future availability of water resources in the Santa River watershed is limited by glacier retreat in the Cordillera Blanca, but also under unprecedented and increasing demands for multiple uses associated with agriculture, mining, and urban expansion (Carey et al., 2014). There are more extractive activities than in the past, and larger urban populations requiring drinking water, trends that will continue to increase the need for more water and the potential for social conflicts over lands and natural resources (Bury et al., 2013; Wathrall et al., 2014).
Much of the economic development to date in the study area has essentially been subsidized by the availability of water originating in the upper watersheds of the Santa River. In the future, there likely will be more intensive agriculture systems in the lower elevations (Figure 3) and larger towns and cities (Bury et al., 2013). National goals are to depend on the export agriculture for revenue, and to favor urban sites for improved education and health care. These emphases thus reduce attention and assistance to smallholder farmers, further increasing trends of demographic shifts to the cities. Thus, the social trends will increase, even though available water resources will reduce as climate change continues.
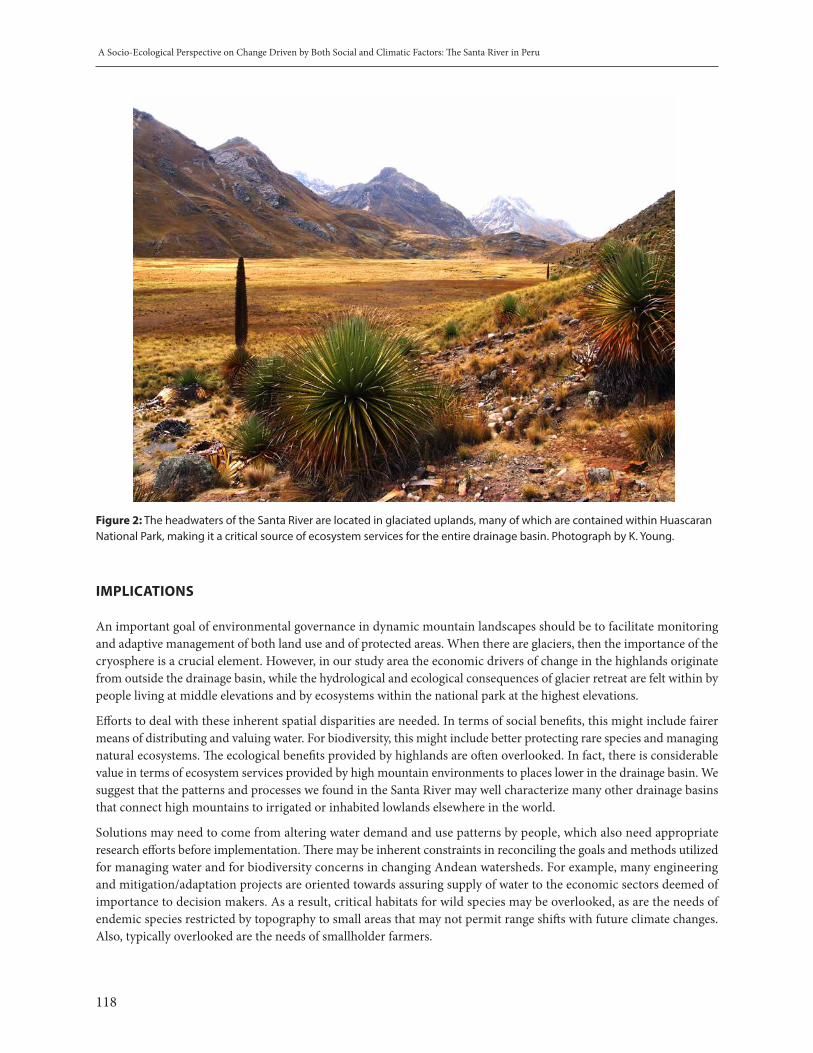
118
A Socio-Ecological Perspective on Change Driven by Both Social and Climatic Factors: The Santa River in Peru
Figure 2: The headwaters of the Santa River are located in glaciated uplands, many of which are contained within Huascaran National Park, making it a critical source of ecosystem services for the entire drainage basin. Photograph by K. Young.
IMPLICATIONS
An important goal of environmental governance in dynamic mountain landscapes should be to facilitate monitoring and adaptive management of both land use and of protected areas. When there are glaciers, then the importance of the cryosphere is a crucial element. However, in our study area the economic drivers of change in the highlands originate from outside the drainage basin, while the hydrological and ecological consequences of glacier retreat are felt within by people living at middle elevations and by ecosystems within the national park at the highest elevations.
Efforts to deal with these inherent spatial disparities are needed. In terms of social benefits, this might include fairer means of distributing and valuing water. For biodiversity, this might include better protecting rare species and managing natural ecosystems. The ecological benefits provided by highlands are often overlooked. In fact, there is considerable value in terms of ecosystem services provided by high mountain environments to places lower in the drainage basin. We suggest that the patterns and processes we found in the Santa River may well characterize many other drainage basins that connect high mountains to irrigated or inhabited lowlands elsewhere in the world.
Solutions may need to come from altering water demand and use patterns by people, which also need appropriate research efforts before implementation. There may be inherent constraints in reconciling the goals and methods utilized for managing water and for biodiversity concerns in changing Andean watersheds. For example, many engineering and mitigation/adaptation projects are oriented towards assuring supply of water to the economic sectors deemed of importance to decision makers. As a result, critical habitats for wild species may be overlooked, as are the needs of endemic species restricted by topography to small areas that may not permit range shifts with future climate changes. Also, typically overlooked are the needs of smallholder farmers.

119
A Socio-Ecological Perspective on Change Driven by Both Social and Climatic Factors: The Santa River in Peru
TOWARDS ADAPTATION IN MOUNTAIN WATERSHEDS
Mountains, especially those found in tropical latitudes, contain unique biological diversity and landscape patterns (Young & León, 2007; Young & Lipton, 2006). In addition, they are exposed to many consequences of global climate change, exasperated by concurrent socioeconomic shifts in land use. Endemic species of plants and animals are found in small areas due to topographic barriers and are further limited to narrow altitudinal ranges due to habitat specificities (Young, 2014). Current trends and future predictions suggest further reduction in habitat for specialist species due to ecological change and land use shifts by farmers and pastoralists along the environmental gradients of tropical mountains.
Often proposed adaptation efforts in mountains focus on water resources, natural hazards, or more recently, carbon stocks, but do so in an uncoordinated fashion that may incorporate unrecognized trade-offs. Further, such efforts may inadvertently act to increase asymmetries of cause and effect, especially in regards the lesser relative power of local people to influence outcomes, compared to national governments. Public lands protected for biodiversity in tropical mountains are predominantly located in areas considered to be of little value for settlement and agriculture; other high elevation sites are managed as common pool resource areas by local communities. These sites represent opportunities for integrated approaches to socio-ecological change, as adjusted to land use goals and as calibrated to provide opportunities for future species range shifts. At the same time, these same areas may be future scenes of socio-environmental conflicts as land use changes in response to climate dynamics.
In our study region, Huascaran National Park serves as an important mediator of ongoing environmental change in the high mountains of the Santa River watershed, with altitudinal gradients available for shifts in distributions of native plants and animals (Young & Lipton, 2006). The glaciers inside the park provide much of the water utilized by downstream users. Sites outside the park might benefit from adjustments in land use strategies, for example, with efforts to use water more efficiently through the judicious choice of land cover types and water resource monitoring (Ponette-González et al., 2014, 2015), and with programs that reward upslope inhabitants for water services received downslope.
Figure 3: The coastal deserts of Peru contain unique biodiversity and ecosystem types. Nonetheless they are being transformed through massive irrigation projects meant for export agriculture, including for asparagus and avocados. In this photograph, fields of marigolds have replaced desert habitats, now reduced to hilltop remnants. Photograph by K. Young.
120
A Socio-Ecological Perspective on Change Driven by Both Social and Climatic Factors: The Santa River in Peru
RECOMMENDATIONS
Our recommendations are to intensify efforts to monitor and to evaluate the socio-ecological and socio-hydrological dimensions of change in glaciated mountain ranges (see also Huggel et al., 2015). Based on our research findings, more proactive management and planning could be done by social actors in Peru who focus on the demand-side of water resources, which would need to be informed by social science approaches rather than being limited to debates about water supplies. In all these efforts, the requirements of native species of plants and animals need also to be considered, in terms of environmental flows in the streams and rivers, and of habitat connectivity in regards the species most affected by warming temperatures and shifting humidity regimes. Both social justice and ecological benefits should be criteria utilized to improve socio-ecological systems.
ACKNOWLEDGMENTS
Support for this project was received from the Dynamics of Coupled Human-Natural Systems program (Award #1010381) and the Geography and Spatial Sciences program (Award #1333141) of the U.S. National Science Foundation. We are grateful for much assistance from Peruvian institutions, including the management team of Huascaran National Park, and the Museo de Historia Natural in Lima.
REFERENCES
Bury, J., Mark, B. G., Carey, M., Young, K.R., McKenzie, J. M., Baraer, M., French, A., & Polk, M. H. (2013) New geographies of water and climate change in Peru: Coupled natural and social transformations in the Santa River watershed. Annals of the Association of American Geographers 103: 363-374.
Carey, M., Baraer, M., Mark, B. G., French, A., Bury, J., Young, K. R. & McKenzie, J. M. (2014) Toward hydro-social modeling: Merging human variables and the social sciences with climate-glacier runoff models (Santa River, Peru). Journal of Hydrology 518: 60-70.
Collins, S. L., Carpenter, S. R., Swinton, S. M., Orenstein, D. E., Childers, D. L., Gragson, T. L., Grimm, N. B., Grove, J. M., Harlan, S. L., Kaye, J. P., Knapp, A. K., Kofinas, G. P., Magnuson, J. J., McDowell, W. H., Melack, J. M., Ogden, L. A., Robertson, G. P., Smith, M. D.& Whitmer, A. C. (2011) An integrated conceptual framework for long-term social–ecological research. Frontiers in Ecology and the Environment 9: 351–357. DOI:10.1890/100068
Huggel, C., Scheel, M., Albrecht, F., Andres, N., Calanca, P., Jurt, C., Khabarov, N., Mira-Salama, D., Rohrer, M., Salzmann, N., Silva, Y., Silvestre, E., Vicuña, L. & Zappa, M. (2015) A framework for the science contribution in climate adaptation: Experiences from science-policy processes in the Andes. Environmental Science & Policy 47: 80-94.
Liu, J., Dietz, T., Carpenter, S. R., Alberti, M., Folke, C., Moran, E., Pell, A. N., Deadman, P., Kratz, T., Lubchenco, J., Ostrom, E., Ouyang, Z., Provencher, W., Redman, C. L., Schneider, S. H., & Taylor, W. W. (2007) Complexity of coupled human and natural systems. Science 317: 1513-1516. DOI: 10.1126/science.1144004
Ponette-González, A. G.,Marín-Spiotta, E., Brauman, K. A., Farley, K. A., Weathers, K. C., & Young, K. R. (2014) Hydrologic connectivity in the high-elevation tropics: Heterogeneous responses to land change. BioScience 64: 92-104.
Ponette-González, A. G., Brauman, K. A., Marín-Spiotta, E., Farley, K. A., Kathleen C. Weathers, K. C., Young, K. R., & Curran, L. M. (2015) Managing water services in tropical regions: From land cover proxies to hydrologic fluxes. Ambio 44: 367-375.
Postigo, J. C. & Young, K. R. (eds.). (2016) Naturaleza y Sociedad: Perspectivas Socio-Ecológicas sobre Cambios Globales en América Latina. Instituto de Estudios Peruanos, DESCO, INTE-PUCP, Lima. In press.
121
A Socio-Ecological Perspective on Change Driven by Both Social and Climatic Factors: The Santa River in Peru
Wrathall, D. J., Bury, J., Carey, M., Mark, B., McKenzie, J., Young, K., Baraer, M., French, A., & Rampini, C. (2014) Migration amidst climate rigidity traps: Resource politics and socio-ecological possibilism in Honduras and Peru. Annals of the Association of American Geographers 104, 292-304.
Young, K. R. (2009) Andean land use and biodiversity: Humanized landscapes in a time of change. Annals of the Missouri Botanical Garden 96, 492-507.
Young, K. R. (2014) Ecology of land cover change in glaciated tropical mountains. Revista peruana de biología 21: 259-270.
Young, K. R. and León, B. (2007) Tree-line changes along the Andes: Implications of spatial patterns and dynamics. Philosophical Transactions of the Royal Society B: Biological Sciences 362, 263-272.
Young, K. R. and Lipton, J. K. (2006) Adaptive governance and climate change in the tropical highlands of western South America. Climatic Change 78, 63-102.

122
The Importance of Species Selection and Seed Sourcing in Forest Restoration for Enhancing Adaptive Capacity to Climate Change
THE IMPORTANCE OF SPECIES SELECTION AND SEED SOURCING IN FOREST RESTORATION FOR ENHANCING ADAPTIVE CAPACITY TO CLIMATE CHANGE:COLOMBIAN TROPICAL DRY FOREST AS A MODEL
Evert Thomas1, Carolina Alcazar1, Luis Gonzalo Moscoso H. 2, Alvaro Vasquez3, Luis Fernando Osorio3, Beatriz Salgado-Negret4, Mailyn Gonzalez4, Mauricio Parra-Quijano5, Michele Bozzano6, Judy Loo6, Riina Jalonen7, Wilson Ramirez4 1 Bioversity International, Lima, Peru2 Forestpa SAS, Medellin, Colombia3 Universidad Nacional de Colombia, sede Medellin, Colombia4 Instituto de Investigación de Recursos Biológicos Alexander von Humboldt, Bogota, Colombia5 Fundación Agrobiodiversidad Colombiana, Bogotá, Colombia.6 Bioversity International, Rome, Italy7 Bioversity International, Serdang, Malaysia
SUMMARY
• Forest restoration projects can derive great benefit from integrating climate modeling, functional trait analysis and genetic considerations in the selection of appropriate tree species and sources of forest reproductive material, for their critical importance for the delivery of ecosystem services and the viability and adaptive capacity of restored forests.
• Targets in restoration projects are not only quantitative but also qualitative. There is need for political commitment to create demand for good quality forest reproductive material of native species through regulatory frameworks and resource allocations.
• User friendly knowledge-based decision making tools need to be developed and mainstreamed to assist emerging restoration practitioners with the choice of tree species and sources of forest reproductive material.
• Countries need to increase experimental field setups such as provenance and progeny trials for native species to validate decision tools and apply adaptive management under climate change.
• Seed supply systems for restoration need to be diversified by involving and training stakeholders at different levels of society.
Keywords: climate change, functional traits, genetic diversity, seed transfer zones, restoration.
INTRODUCTION
The search for workable solutions to mitigate and adapt to climate change is onerous. In spite of concerted global efforts over decades to reduce the emission of greenhouse gasses, the atmospheric concentrations of these gasses, and the associated effects of climate change, have continued to increase (Stocker et al., 2013). Forest restoration including tree planting is increasingly seen by policy makers around the world as a fundamental part of the solution, for its enormous potential to tackle environmental crises related to climate change, biodiversity loss and desertification, while simultaneously boosting economic and rural development (Aronson & Alexander, 2013). Forest restoration, done properly, can do all that. With approximately 2 billion hectares of degraded land waiting to be restored globally, the potential scale of restoration activities is enormous (Laestadius et al., 2012). As in most countries large-scale restoration is a completely new undertaking, making mistakes will be unavoidable. While mistakes provide opportunities to reassess

123
The Importance of Species Selection and Seed Sourcing in Forest Restoration for Enhancing Adaptive Capacity to Climate Change
and continuously improve restoration practices, where possible, potential problems should be anticipated and avoided. Aside from putting in place the necessary human, technical and logistic capacity, one important, but often overlooked, aspect of ensuring the success of restoration projects relates to the selection of appropriate forest reproductive material (FRM), at least for active restoration activities that involve tree planting. As a minimum condition, FRM should be selected to (i) correspond to the restoration objectives, (ii) be well adapted to survive and thrive under the degraded site conditions and (iii) have sufficient genetic diversity to ensure the potential to adapt to changing conditions in the future (Thomas et al., 2014a).
Here we present a scalable approach which is intended to assist restoration practitioners of tropical dry forest (TDF) in Colombia with the identification of appropriate tree species and sources of FRM. Decision making combines information on (i) suitability modeling under current and future climate conditions; (ii) the intended future use of the forest under restoration; (iii) locally prevailing stress conditions; (iv) functional trait diversity of tree species; and (v) the genetic quality of FRM. Of all Colombian ecosystems, TDF is most threatened. Approximately 90% of its original cover has disappeared and less than 4% of old growth forest remains, while another 5% show some degree of degradation. With most forest fragments being located on private lands and less than 5% being represented in the national system of protected areas, the risks of further forest loss remain high (Pizano & García 2014). In response to this unsettling reality, the conservation and restoration of TDF has become a national priority in Colombia. The national research institute Alexander Von Humboldt plays a key facilitating role in this endeavor. The institute has recently published a very detailed map of the remaining TDF fragments and restoration priorities, based on remote sensing imaginary and exhaustive field validation (García et al., 2014). As a result of these efforts, approximately 345,000 hectares of degraded land have been identified as having the highest priority for dry forest restoration in the country, mainly located in Caribbean and Andean regions. The recently adopted Colombian law for the compensation for biodiversity loss (MADS, 2012) has great potential for providing part of the financial means to trigger large-scale restoration activities. Given the delicate conservation state of Colombian TDF, a growing body of scientific knowledge on its biology (Pizano & García, 2014), and the existing political momentum in support of efforts to reverse degradation trends (see Aguilar et al., 2015), we consider this ecosystem an ideal model case for testing our protocol for the selection of appropriate species and sources of FRM which we hope will be scaled out and up to other ecosystems and countries.
In what follows we outline the rationale and implementation of the elements considered in our protocol, which are summarized in figure 1. To facilitate accessibility to the information generated, we propose a map-based tool, available at www.restool.org, which allows the user to select any area (resolution of 30 arc seconds or ~1km2 at the equator) with potential for restoring TDF and extracting area-specific information about possible options regarding the selection of tree species and sources of FRMs that are best matched to user-defined restoration goals and the specific environmental conditions of the restoration site, now and in the future. The concept of restoration has different, audience-specific meanings and interpretations, ranging from recovering a pre-disturbance situation (ecological restoration) to establishing biodiversity-friendly land-use practices with a principally productive focus (forest landscape restoration). Our tool is intended to support the decision making of anyone interested in planting trees on land that is suitable for tropical dry forest for whichever purpose, and hence our use of the word restoration in what follows should be interpreted as such.
1. SUITABILITY MODELING TO ASSESS SPECIES’ ADAPTIVE POTENTIAL UNDER CLIMATE CHANGE
Climate change will increasingly affect the habitat suitability of the TDF ecosystem and the tree species that are part of it. To gauge potential future climate impacts we carried out suitability modeling, using an ensemble approach (following the protocol described in Thomas et al., 2014b) both for the TDF biome as a whole and for the tree species known to occur in it (Figure 1 section 1). For assessing potential range expansions or contractions of TDF as a biome, we carried out model calibrations using the historical distribution of TDF as a reference. Model quality was evaluated based on its discriminatory power to distinguish historical distribution areas from non-TDF areas, based on climatic, edaphic and terrain variables. Model projections to different future climate scenarios and time horizons allowed developing worst- and best-case scenarios (Figure 2a and 2b, respectively), the worst-case scenario being useful for the identification of priority areas for restoration. In spite of its degraded and fragmented state, TDF in Colombia is home to more than 900
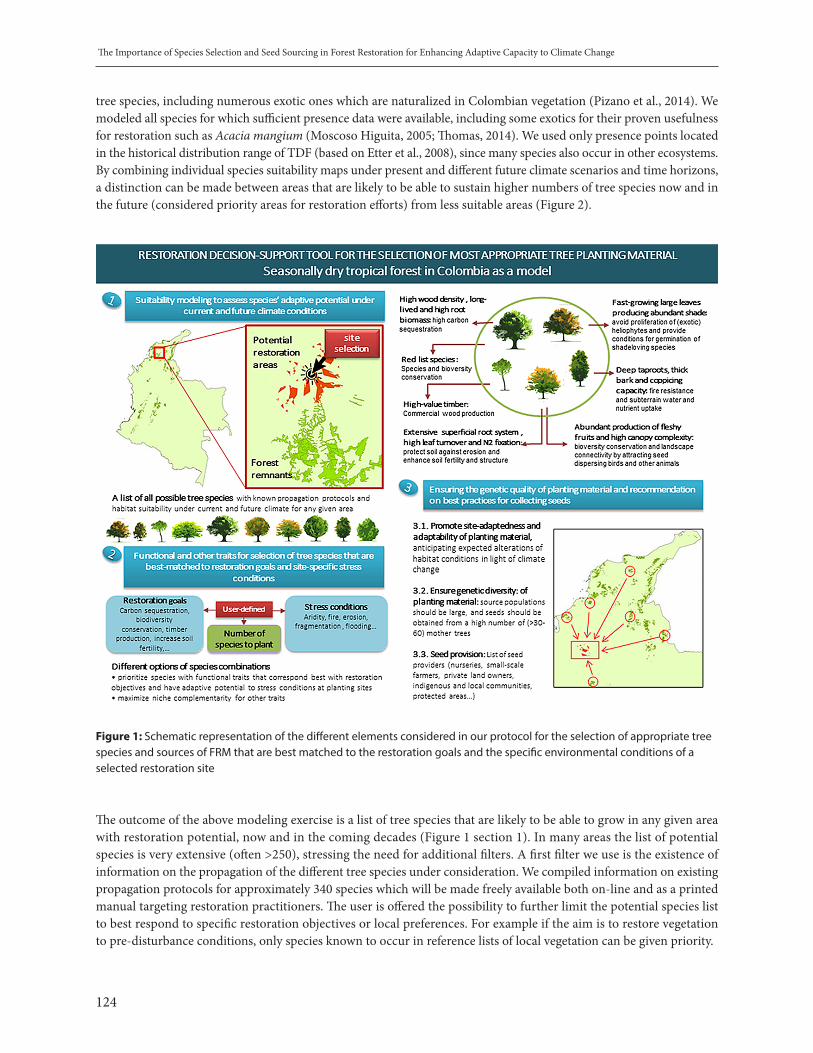
124
The Importance of Species Selection and Seed Sourcing in Forest Restoration for Enhancing Adaptive Capacity to Climate Change
tree species, including numerous exotic ones which are naturalized in Colombian vegetation (Pizano et al., 2014). We modeled all species for which sufficient presence data were available, including some exotics for their proven usefulness for restoration such as Acacia mangium (Moscoso Higuita, 2005; Thomas, 2014). We used only presence points located in the historical distribution range of TDF (based on Etter et al., 2008), since many species also occur in other ecosystems. By combining individual species suitability maps under present and different future climate scenarios and time horizons, a distinction can be made between areas that are likely to be able to sustain higher numbers of tree species now and in the future (considered priority areas for restoration efforts) from less suitable areas (Figure 2).
Figure 1: Schematic representation of the different elements considered in our protocol for the selection of appropriate tree species and sources of FRM that are best matched to the restoration goals and the specific environmental conditions of a selected restoration site
The outcome of the above modeling exercise is a list of tree species that are likely to be able to grow in any given area with restoration potential, now and in the coming decades (Figure 1 section 1). In many areas the list of potential species is very extensive (often >250), stressing the need for additional filters. A first filter we use is the existence of information on the propagation of the different tree species under consideration. We compiled information on existing propagation protocols for approximately 340 species which will be made freely available both on-line and as a printed manual targeting restoration practitioners. The user is offered the possibility to further limit the potential species list to best respond to specific restoration objectives or local preferences. For example if the aim is to restore vegetation to pre-disturbance conditions, only species known to occur in reference lists of local vegetation can be given priority.
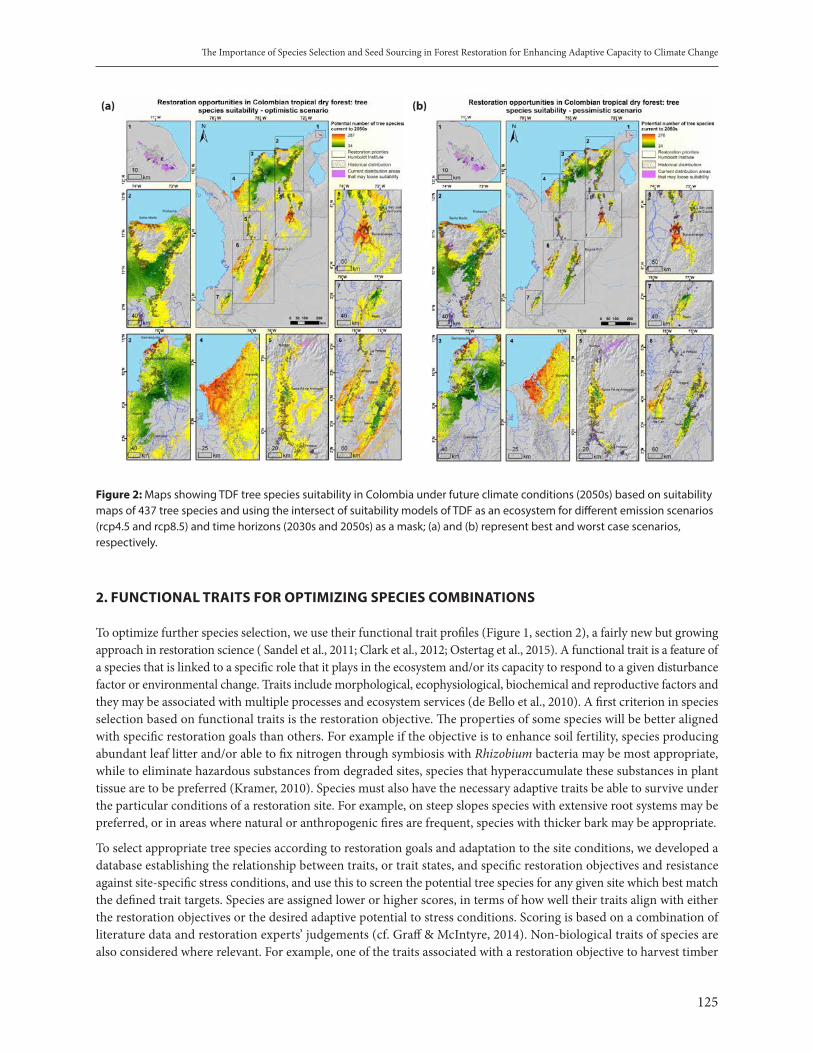
125
The Importance of Species Selection and Seed Sourcing in Forest Restoration for Enhancing Adaptive Capacity to Climate Change
(a) (b)
Figure 2: Maps showing TDF tree species suitability in Colombia under future climate conditions (2050s) based on suitability maps of 437 tree species and using the intersect of suitability models of TDF as an ecosystem for different emission scenarios (rcp4.5 and rcp8.5) and time horizons (2030s and 2050s) as a mask; (a) and (b) represent best and worst case scenarios, respectively.
2. FUNCTIONAL TRAITS FOR OPTIMIZING SPECIES COMBINATIONS
To optimize further species selection, we use their functional trait profiles (Figure 1, section 2), a fairly new but growing approach in restoration science ( Sandel et al., 2011; Clark et al., 2012; Ostertag et al., 2015). A functional trait is a feature of a species that is linked to a specific role that it plays in the ecosystem and/or its capacity to respond to a given disturbance factor or environmental change. Traits include morphological, ecophysiological, biochemical and reproductive factors and they may be associated with multiple processes and ecosystem services (de Bello et al., 2010). A first criterion in species selection based on functional traits is the restoration objective. The properties of some species will be better aligned with specific restoration goals than others. For example if the objective is to enhance soil fertility, species producing abundant leaf litter and/or able to fix nitrogen through symbiosis with Rhizobium bacteria may be most appropriate, while to eliminate hazardous substances from degraded sites, species that hyperaccumulate these substances in plant tissue are to be preferred (Kramer, 2010). Species must also have the necessary adaptive traits be able to survive under the particular conditions of a restoration site. For example, on steep slopes species with extensive root systems may be preferred, or in areas where natural or anthropogenic fires are frequent, species with thicker bark may be appropriate.
To select appropriate tree species according to restoration goals and adaptation to the site conditions, we developed a database establishing the relationship between traits, or trait states, and specific restoration objectives and resistance against site-specific stress conditions, and use this to screen the potential tree species for any given site which best match the defined trait targets. Species are assigned lower or higher scores, in terms of how well their traits align with either the restoration objectives or the desired adaptive potential to stress conditions. Scoring is based on a combination of literature data and restoration experts’ judgements (cf. Graff & McIntyre, 2014). Non-biological traits of species are also considered where relevant. For example, one of the traits associated with a restoration objective to harvest timber

126
The Importance of Species Selection and Seed Sourcing in Forest Restoration for Enhancing Adaptive Capacity to Climate Change
is the average market price of a standardized unit of wood for commercially exploited timber species, while the red list classification of species is used among the traits to guide restoration goals associated with biodiversity conservation.
In a next step, the resulting subset of tree species is used to assemble species combinations that maximize both scores associated with restoration goals and diversity in other response and effect traits. Response traits are the response of plant species to environmental conditions (e.g. resource availability, disturbance), whereas effect traits refer to the effects species exert on the ecosystem (e.g. biogeochemical cycling) (Lavorel & Garnier, 2002; Suding et al., 2008). Maximizing diversity in functional traits promotes niche complementarity this refers to the combination of resource partitioning, i.e. how species use resources and adapt to planting sites, which is particularly critical in degraded areas which by definition are resource-limited, and facilitation i.e. impacts on other species through modification of the growth environment (Loreau & Hector, 2001). Maximizing niche complementarity in restoration projects can be useful as it is positively related not only to primary production (communities with high diversity of plant traits have high primary productivity (Wood et al 2015)) but also to the speed and success of establishment of nascent ecosystems (Verheyen et al., 2015). Furthermore, niche complementarity can increase functional redundancy between native and invasive species hence reducing invasiveness risk (Funk et al., 2008).
Based on the species-selection protocol outlined above, the user of our decision-support tool is provided with different options of species combinations that are best aligned with the restoration objectives and the planting site conditions, and maximize additional trait diversity. This allows one to match the most appropriate species combination to local realities, e.g. in terms of local preferences for species, and availability of germplasm. Cost associated with the use of a large number of species should not be considered a disincentive, at least not in the mid to longer term. Experiences from the Brazilian Atlantic Forest restoration pact which aims to restore 15 million hectares by 2050, have shown that with the right (political and economic) incentives, the cost of seedling production does not necessarily inhibit the use of diverse species combinations, so there is no plausible justification to avoid using high diversity of native species (Brancalion et al., 2010), as long as there is an adequate supply chain of native tree seedlings grown in nurseries.
3. ENSURING THE GENETIC QUALITY OF FRM
Once the species combination to be planted in a given area has been decided upon, information is provided on recommended (mixes) of appropriate sources of FRM. The origin and genetic quality of FRM is positively related not only to the survival, growth, productivity and adaptive capacity of tree populations (Reed & Frankham, 2003; Schaberg et al., 2008; Reynolds et al., 2012), but also to wider ecosystem functioning and resilience (Gregorius, 1996; Reusch et al., 2005; Whitham et al., 2006; Bailey, 2011) which is increasingly important in light of climate change (Sgrò et al 2011; Bozzano et al., 2014; Havens et al., 2015). In a meta-analysis of almost 250 plant species reintroductions worldwide, Godefroid et al (2011) found that when restoration practitioners had some knowledge of the genetic variation of the target species this significantly enhanced the survival rate from the first year after reintroduction, and this difference increased over time.
Two main considerations in the selection of germplasm are crucial to avoid problems and bolster the adaptive potential of planted forests. FRM should be (1) well-matched to the (present and expected future) conditions of the planting site to ensure survival, growth and reproduction of planted trees and (2) genetically diverse enough to avoid adverse effects of inbreeding, provide sufficient building blocks for adaptation to changing conditions through natural selection, and enhance populations’ resistance to acute and chronic stressors, such as pests and diseases, drought and other effects of progressive climate change (Thomas et al., 2014a). Inadequate attention to these considerations can result in different degrees of failure in restoration (Gregorio et al., 2016). High initial mortality is a type of failure that is often manifested early on and may still be ‘fixed ’ during the planting, maintenance or guarantee periods of restoration projects by replanting with quality FRM. However, most other types of failure are manifested on much longer time scales, often long after the monitoring phase has ended and project funds have dried up. One example is that trees do survive but show suboptimal or poor growth when not well adapted to site conditions, an outcome consistently demonstrated by provenance trials around the world (FAO, 2014). Another type of failure is delayed mortality, which may manifest itself only after certain exceptional events such as the strong winter of 1984/1985 in the Landes region of France which
127
The Importance of Species Selection and Seed Sourcing in Forest Restoration for Enhancing Adaptive Capacity to Climate Change
destroyed a 30,000 ha plantation of Pinus pinaster Aiton, established with non-frost-resistant material from the Iberian Peninsula (Timbal et al., 2005). A last example of failure is when there is a decrease in the quality and quantity of seed production in planted forests -a typical effect of inbreeding (Broadhurst et al 2008)- which may jeopardize the long term viability and resilience of plantations. For example, a comparison of self-pollinated and outcrossed offspring of Douglas-fir (Pseudotsuga menziesii), 33 years after seedling establishment showed that the survival of selfed trees was 61% lower than that of the outcrossed trees and that the diameter at breast height of selfed trees was 41% smaller than that of the outcrossed trees (for surviving trees) (White et al., 2007).
Good genetic quality of FRM can be achieved by application of seed collection protocols and adequate planning to identify the seed sources best matched to the conditions of the restoration site (Thomas et al., 2015). For ensuring genetic diversity in planting stock, among a series of other considerations recently summarized by Basey et al. (2015), source populations should be large (at least 500 reproductively mature individuals), and seeds should be obtained from a high number (ideally 30-60, but minimally >15) of mother trees per population; ideally collecting and mixing seed from multiple suitable populations. It is important to note that quality seeds are unlikely to excessively raise the costs of restoration efforts. In a review based on 40-50 years of experiences with tree seed supply systems in the global South, Graudal & Lilleso (2007) estimated that (good quality) seed generally represents only 2-4% of total plantation establishment costs. Also the cost of producing quality seed, for example harvested from a minimum of 40 mother trees as compared to random collection from a few trees, is for most species, less than 5% per unit of seed collected (Graudal and Lilleso 2007). When this is compared with the opportunity costs associated with failed plantings, the cost is small indeed. In Atlantic Forest regions, many of the native tree nurseries work collaboratively and swap their material so they have diverse genotypes represented in their nursery stock (Robin Chazdon, pers. comm.).
To ensure suitability of planting material (Figure 1, section 3), identification and selection of FRM should ideally be guided by the strength of the interaction between genotype performance and current and future environmental conditions (genotype-by-environment, GXE interactions), which are studied using multi-location progeny or provenance trials and climate modeling, respectively (Sgrò et al., 2011; Breed et al., 2013). However provenance and progeny trials of native species in tropical dry forest conditions currently either do not exist in Colombia, or are not yet mature enough to guide decision making. Therefore, recommendations for seed sourcing in our approach are based on a combination of available genetic data and ecogeographic assessments. Neutral genetic characterization data of a number of model species’ populations at representative sites across Colombian tropical dry forest remnants are used to identify areas that are relatively genetically homogenous which, in combination with an ecogeographical analysis, is used to construct seed transfer zones (Azpilicueta et al., 2013, Thomas et al. 2017). Seed transfer zones are geographical areas within which plant materials can be expected to be moved freely with little disruption of genetic patterns or loss of local adaptation.
It has been shown that (i) ecogeographical boundaries can be useful proxies for delineating seed transfer zones (Miller et al., 2011; Potter & Hargrove, 2012), and (ii) that genetic studies in model species can provide useful resources to infer seed source guidelines from life history properties for species with no population genetic knowledge (Williams et al., 2014). Accordingly, we constructed seed zones for species lacking genetic data through a combination of their ecogeographic distribution profile and some of their life history traits, notably those related to mating system which have been shown to correlate with patterns in neutral genetic diversity (Duminil et al., 2007). We acknowledge that delineating seed transfer zones based on neutral marker data is not ideal since neutral and adaptive genetic diversity are generally not ecologically equivalent measures of intraspecific variation (Whitlock, 2014), and neutral molecular markers may or may not reflect the same genetic patterns as traits under natural selection (Mijangos et al., 2015). Therefore, this approach has to be considered as a due diligence approach, given the absence of reliable GxE data for most if not all tree species for Colombian TDF.
Climate change will increasingly affect seed sourcing strategies (Havens et al., 2015). For example if temperature is expected to increase by 2°C at a given restoration site, it may be wise to use at least some FRM from populations of a target species which presently already grow under hotter conditions. A growing number of studies recommend the use of seed from mixed sources, in different compositions to anticipate the potential impacts of climate change (Broadhurst et al., 2008; Sgro et al., 2011; Breed et al., 2013; Prober et al., 2015). We use a decision tree which builds on those developed by Breed et al. (2013) and Byrne et al. (2011) to select the most appropriate seed sourcing approach, depending on the

128
The Importance of Species Selection and Seed Sourcing in Forest Restoration for Enhancing Adaptive Capacity to Climate Change
evidence and confidence limits surrounding climate distribution modeling, and the knowledge of population genetic and/or environmental differences between populations. For identifying TDF sites where current environmental conditions are likely to be similar to those under future climate scenarios at a given restoration site, we applied the Ecogeographical Land Characterization (ELC) maps approach (Parra-Quijano et al., 2012, 2014). ELC maps identify zones with similar abiotic growth conditions based on selected variables grouped in bioclimatic, edaphic and geophysic components. ELC maps can be used as proxies for delineating seed zones and can be projected to future climate conditions. For Colombian TDF seed zones, we created an ELC map under present climate conditions covering the current TDF remnants using non-collinear abiotic variables such as rainfall during the driest month, average daytime temperature range, soil pH and cation exchange capacity, terrain slope, sunshine, among others. This ELC map was projected to future climate scenarios (representative concentration pathways RCPs 4.5 and 8.5) using a Random Forest model. Joint interpretation of current and future ELC maps allows identifying the current location seed zones that are expected to appear at a given restoration site in the future.
The combined outcome of all the above analyses result in recommendations of most suitable seed sources and mixes thereof for a given restoration site and tree species. Different options are always provided to enhance the convenience of actually obtaining FRM in sufficient quantities within determined periods of time. Availability of seed is a constraining factor in many restoration endeavors around the world, and this is no different for Colombian TDF, a situation which is very likely to increase as the demand for restoration will continue to grow. To alleviate this situation we are compiling a list of contact details of land owners, indigenous and local communities, individuals or institutions such as arboreta, interested in contributing to providing seeds from TDF forest patches under their control. We plan to make contact details of seed providers publicly available to potential buyers.
Seed provision can be a profitable business in Colombia, where one kilogram of seeds of certain tree species such as Colombian mahogany (Cariniana pyriformis) can be worth more than twice a monthly wage. As people in rural areas often do not earn even the minimum wage, such amounts can be attractive. For private landowners, seed provision can be considered to be a type of payment for ecosystem services and hence can serve as an incentive to continue to conserve TDF patches for the seeds they produce. Experiences from the Brazilian Atlantic Forest restoration pact have shown that diversified strategies for obtaining planting stock are important to guarantee seed availability (Brancalion et al., 2012a) and that harvesting of FRM can be a good avenue for generating income and jobs in rural contexts (Brancalion et al., 2012b). However it is important that seed providers are trained in proper collection of FRM so it adequately captures the diversity of local tree populations (Basey et al., 2015). In the longer term a certification system for seed providers may be developed.
4. CONCLUSIONS AND RECOMMENDATIONS
Today, many if not most restoration projects in Colombia and beyond are opportunistic in the way they select and collect FRM, using material that is easily available, but often of poor quality, putting at risk long-term success (Jalonen et al. in press). Use of inadequate FRM may be even more likely as a consequence of limited restoration experience of the many new actors emerging in response to the enormous restoration goals in Colombia and worldwide. Policy has an important role in avoiding these risks. Decision makers first need to acknowledge that the targets in restoration projects are not only quantitative but also qualitative, meaning that adequate attention needs to be given to the identity and genetic quality of FRM. This was recognized by the 12th Conference of the Parties to the United Nations Convention on Biological Diversity, which, in decision XII/19, indent 4(h), called for due attention to genetic diversity and the use of native species in ecosystem restoration (http://www.cbd.int/doc/decisions/cop-12/cop-12-dec-19-en.pdf) (2014). The implementation of this decision will require political commitment to create demand for good quality seeds of native species through regulatory frameworks and resource allocations. As most restoration practitioners lack the capacity to plan adequately for the selection of species and seed sources that best respond to the restoration goals, while enhancing resilience against climate change and other stress factors, the development and use of user-friendly knowledge-based tools and protocols such as the one we have outlined here (www.restool.org) should be promoted. Such tools and protocols can then be used by governments, donors or implementers of restoration projects to ensure due diligence is applied in the selection of appropriate species and seed sources.

129
The Importance of Species Selection and Seed Sourcing in Forest Restoration for Enhancing Adaptive Capacity to Climate Change
However, as these tools and protocols make extensive use of modeling, which have inherent uncertainties; they have to be complemented with robust field experimentation. The time is now for Colombia and other countries, particularly in the tropics, to invest in the establishment of provenance and progeny trails, arboreta and demonstration plantings with native species across different environmental gradients, as such trials generate the most reliable data on site adaptability and how this may change as a consequence of global warming. It will be critical to apply adaptive management and learn from mistakes and failures and continuously integrate new knowledge in decision–making as it becomes available. Countries also need to invest more in the establishment of functional seed distribution systems at different scales, to ensure the availability of appropriate FRM at any given restoration site (Atkinson et al. 2017). This includes diversifying seed supply by involving stakeholders at different levels of society, including small scale farmers, private land owners, indigenous and local communities, and protected areas. Ensuring the quality of FRM harvested by these actors will require capacity strengthening and possibly the development of certification schemes.
ACKNOWLEDGEMENTS
The authors wish to thank Ecopetrol, Empresas Públicas de Medellín, the government of Antioquia, Colombia, the Forest Ecosystem Restoration Initiative (FERI), the CGIAR Fund Donors (http://www.cgiar.org/who-we-are/cgiar-fund/fund-donors-2) and the CGIAR Research Program on Forests, Trees and Agroforestry for financial support. We are grateful to Robin Chazdon and Holm Tiessen for helpful comments on a previous version of this chapter.
REFERENCES
Aguilar M., Sierra J., Ramirez W., Vargas O., Calle Z., Vargas W., Murcia C., Aronson J., & Barrera Cataño J.I. (2015) Toward a post-conflict Colombia: restoring to the future. Restoration Ecology, 23, 4–6.
Aronson J. & Alexander S. (2013) Ecosystem Restoration is Now a Global Priority: Time to Roll up our Sleeves. Restoration Ecology, 21, 293–296.
Atkinson R., Thomas E., Cornelius J., Zamora R. & M. Franco (2017) Fit for purpose seed supply systems for the implementation of landscape restoration under Initiative 20x20: An analysis of national seed systems in Mexico, Guatemala, Costa Rica, Colombia, Peru, Chile and Argentina. World Resources Institute, Bioversity International, ICRAF
Azpilicueta M.M., Gallo L.A., Van Zonneveld M., Thomas E., Moreno C., & Marchelli P. (2013) Management of Nothofagus genetic resources: Definition of genetic zones based on a combination of nuclear and chloroplast marker data. Forest Ecology and Management, 302, 414–424.
Bailey J.K. (2011) From genes to ecosystems: a genetic basis to ecosystem services. Population Ecology, 53, 47–52.
Basey A.C., Fant J.B., & Kramer A.T. (2015) Producing native plant materials for restoration: 10 rules to collect and maintain genetic diversity. Native Plants Journal, 16, 37–53.
De Bello F., Lavorel S., Díaz S., Harrington R., Cornelissen J.H.C., Bardgett R.D., Berg M.P., Cipriotti P., Feld C.K., Hering D., da Silva P.M., Potts S.G., Sandin L., Sousa J.P., Storkey J., Wardle D. a., & Harrison P. a. (2010) Towards an assessment of multiple ecosystem processes and services via functional traits. Biodiversity and Conservation, 19, 2873–2893.
Bozzano M., Jalonen R., Thomas E., Boshier D., Gallo L., Cavers S., Bordács S., Smith P., & Loo J. (2014) Genetic considerations in ecosystem restoration using native tree species. State of the World’s Forest Genetic Resources – Thematic Study. FAO and Bioversity International, Rome.
Brancalion P.H.S., Rodrigues R.R., Gandolfi S., Kageyama P.Y., Nave A.G., Gandara F.B., Barbosa L.M., & Tabarelli M. (2010) Instrumentos legais podem contribuir para a restauração de florestas tropicais biodiversas. Revista Árvore, 34, 455–470.

130
The Importance of Species Selection and Seed Sourcing in Forest Restoration for Enhancing Adaptive Capacity to Climate Change
Brancalion P.H.S., Viani R. a G., Aronson J., Rodrigues R.R., & Nave A.G. (2012a) Improving Planting Stocks for the Brazilian Atlantic Forest Restoration through Community-Based Seed Harvesting Strategies. Restoration Ecology, 20, 704–711.
Brancalion P.H.S., Viani R. a G., Strassburg B.B.N., & Rodrigues R.R. (2012b) Finding the money for tropical forest restoration. Unasylva, 63, 41–50.
Breed M.F., Stead M.G., Ottewell K.M., Gardner M.G., & Lowe A.J. (2013) Which provenance and where? Seed sourcing strategies for revegetation in a changing environment. Conservation Genetics, 14, 1–10.
Broadhurst L.M., Lowe A., Coates D.J., Cunningham S. a., McDonald M., Vesk P. a., & Yates C. (2008) Seed supply for broadscale restoration: maximizing evolutionary potential. Evolutionary Applications, 1, 587–597.
Byrne M., Stone L., & Millar M. a. (2011) Assessing genetic risk in revegetation. Journal of Applied Ecology, 48, 1365–1373.
Clark D.L., Wilson M., Roberts R., Dunwiddie P.W., Stanley A., & Kaye T.N. (2012) Plant traits - a tool for restoration? Applied Vegetation Science, 15, 449–458.
Díaz S. & Cabido M. (2001) Vive la différence: plant functional diversity matters to ecosystem processes. Trends in Ecology & Evolution, 16, 646–655.
Duminil J., Fineschi S., Hampe A., Jordano P., Salvini D., Vendramin G.G., & Petit R.J. (2007) Can population genetic structure be predicted from life-history traits? The American naturalist, 169, 662–672.
Etter A., McAlpine C., & Possingham H. (2008) Historical Patterns and Drivers of Landscape Change in Colombia Since 1500: A Regionalized Spatial Approach. Annals of the Association of American Geographers, 98, 2–23.
FAO (2014) Report on the State of the World’s Forest Genetic Resources. United Nations Food and Agriculture Organization, Rome, Italy.
Funk J.L., Cleland E.E., Suding K.N., & Zavaleta E.S. (2008) Restoration through reassembly: plant traits and invasion resistance. Trends in Ecology and Evolution, 23, 695–703.
García H., Corzo G., Isaacs P., & Etter A. (2014) Distribución y estado actual de los remanentes del bioia: insumos para su gestiónma de bosque seco tropical en Colomb. En Bosque seco tropical en Colombia (ed. by C. Pizano and H. García), Instituto de Investigación de recursos Biológicos Alexander von Humboldt, Bogota D.C. Colombia.
Godefroid S., Piazza C., Rossi G., Buord S., Stevens A.-D., Aguraiuja R., Cowell C., Weekley C.W., Vogg G., Iriondo J.M., Johnson I., Dixon B., Gordon D., Magnanon S., Valentin B., Bjureke K., Koopman R., Vicens M., Virevaire M., & Vanderborght T. (2011) How successful are plant species reintroductions? Biological Conservation, 144, 672–682.
Graff P. & McIntyre S. (2014) Using ecological attributes as criteria for the selection of plant species under three restoration scenarios. Austral Ecology, 39, 907–917.
Graudal L. & Lilleso J. (2007) Experiences and Future Prospects for Tree Seed Supply in Agricultural Development Support Working Paper 2007.
Gregorio N., Herbohn J., Harrison S., Pasa A., & Ferraren A. (2016) Regulating the Quality of Seedlings for Forest Restoration: Lessons from the National Greening Program in the Philippines. Small-scale Forestry, 1–20.
Gregorius H. (1996) The contribution of the genetics of populations to ecosystem stability. Silvae Genetica, 45, 267–271.
Havens K., Vitt P., Still S., Kramer A.T., Fant J.B., & Schatz K. (2015) Seed Sourcing for Restoration in an Era of Climate Change. Natural Areas Journal, 35, 122–133.
Jalonen, R., Valette, M., Boshier, D., Duminil, J., Thomas, E. Forest and landscape restoration severely constrained by a lack of attention to the quantity and quality of tree seed: insights from a global survey. Conservation Letters (in press)
Kramer U. (2010) Metal hyperaccumulation in plants. Annual Review of Plant Biology, 61, 517–534.

131
The Importance of Species Selection and Seed Sourcing in Forest Restoration for Enhancing Adaptive Capacity to Climate Change
Laestadius L., Maginnis S., Minnemeyer S., Potapov P., Saint-Laurent C., & Sizer N. (2012) Mapping opportunities for forest landscape restoration. Unasylva, 62, 47–48.
Lavorel S. & Garnier E. (2002) Predicting changes in community composition and ecosystem functioning from plant traits: Functional Ecology, 16, 545–556.
Loreau M. & Hector A. (2001) Partitioning selection and complementarity in biodiversity experiments. Nature 412: 72–76.
MADS (Ministerio de Ambiente y Desarrollo Sostenible de Colombia) (2012) Manual para la Asignación de Compensaciones por Pérdida de Biodiversidad. .
Mijangos J.L., Pacioni C., Spencer P.B.S., & Craig M.D. (2015) Contribution of genetics to ecological restoration. Molecular Ecology, 24, 22–37.
Miller S. a., Bartow A., Gisler M., Ward K., Young A.S., & Kaye T.N. (2011) Can an Ecoregion Serve as a Seed Transfer Zone? Evidence from a Common Garden Study with Five Native Species. Restoration Ecology, 19, 268–276.
Moscoso Higuita L. (2005) Reforestation: A Natural Process. Editorial Colina, Medellín, Colombia.
Ostertag R., Warman L., Cordell S., & Vitousek P.M. (2015) Using plant functional traits to restore Hawaiian rainforest. Journal of Applied Ecology, 52:805-809.
Parra-Quijano M., Iriondo J.M., & Torres E. (2012) Ecogeographical land characterization maps as a tool for assessing plant adaptation and their implications in agrobiodiversity studies. Genetic Resources and Crop Evolution, 59, 205–217.
Parra-Quijano M., Torres E., Iriondo J.M., & López F. (2014) CAPFITOGEN Tools. Programme to Strengthen National Plant Genetic Resource Capacities in Latin America. Version 1.2. FAO, Rome, Italy.
Pizano C. & García H. (2014) En Bosque seco tropical en Colombia. Instituto de Investigación de recursos Biológicos Alexander von Humboldt, Bogota D.C. Colombia.
Pizano C., González-M. R., Gonzáles M.F., Castro-Lima F., Rodríguez N., Idárraga-Piedrahíta A., Vargas W., Vergara-Varela H., Castaño-Naranjo A., Devia W., Rojas A., Cuadros H., & Lázaro Toro J. (2014) Las plantas de los bosques secos de Colombia. En Bosque seco tropical en Colombia (ed. by C. Pizano and H. García), Instituto de Investigación de recursos Biológicos Alexander von Humboldt, Bogota D.C. Colombia.
Potter K.M. & Hargrove W.W. (2012) Determining suitable locations for seed transfer under climate change: A global quantitative method. New Forests, 43, 581–599.
Prober S.M., Byrne M., McLean E.H., Steane D. a., Potts B.M., Vaillancourt R.E., & Stock W.D. (2015) Climate-adjusted provenancing: a strategy for climate-resilient ecological restoration. Frontiers in Ecology and Evolution, 3: 65.
Reed D.H. & Frankham R. (2003) Correlation between fitness and genetic diversity. Conservation Biology, 17, 230–237.
Reusch T., Ehler A., Hammerli A., & Worm B. (2005) Ecosystem recovery after climatic extremes enhanced by genetic diversity. Proceedings of the National Academy of Sciences USA, 102, 2826–2831.
Reynolds L.K., McGlathery K.J., & Waycott M. (2012) Genetic diversity enhances restoration success by augmenting ecosystem services. PLoS ONE, 7, 1–7.
Schaberg P., DeHayes D., Hawley G., & Nijensohn S. (2008) Anthropogenic alterations of genetic diversity within tree populations: Implications for forest ecosystem resilience. Forest Ecology and Management, 256, 855–862.
Sgro C.M., Lowe A.J., & Hoffmann A.A. (2011) Building evolutionary resilience for conserving biodiversity under climate change. Evolutionary Applications, 4, 326–337.
Stocker T.F., D. Qin G.-K., Plattner L.V., Alexander S.K., Allen N.L., Bindoff F.-M., Bréon J. a., Church U., Cubasch S., Emori P., Forster P., Friedlingstein N., Gillett J.M., Gregory D.L., Hartmann E., Jansen B., Kirtman R., Knutti K., Krishna Kumar P., Lemke J., Marotzke V., Masson-Delmotte G. a., Meehl I.I., Mokhov S., Piao V., Ramaswamy D., Randall M., Rhein M., Rojas C., Sabine D., Shindell L.D., Talley D.G., & Xie V. and S.-P. (2013) Technical Summary.

132
The Importance of Species Selection and Seed Sourcing in Forest Restoration for Enhancing Adaptive Capacity to Climate Change
Climate Change 2013: The Physical Science Basis. Contribution of Working Group I to the Fifth Assessment Report of the Intergovernmental Panel on Climate Change (ed. by T.F. Stocker, D. Qin, G.-K. Plattner, M. Tignor, S.K. Allen, J. Boschung, A. Nauels, Y. Xia, V. Bex, and P.M. Midgley), pp. 33–115. Cambridge University Press, Cambridge United Kingdom and New York, NY, USA.
Suding K.N., Lavorel S., Chapin F.S., Cornelissen J.H.C., Díaz S., Garnier E., Goldberg D., Hooper D.U., Jackson S.T., & Navas M.L. (2008) Scaling environmental change through the community-level: A trait-based response-and-effect framework for plants. Global Change Biology, 14, 1125–1140.
Thomas E. (2014) Gold rush: forest devastated by mining is reborn. Nature, 511, 155.
Thomas E., Jalonen R., Loo J., Boshier D., Gallo L., Cavers S., Bordács S., Smith P., & Bozzano M. (2014a) Genetic considerations in ecosystem restoration using native tree species. Forest Ecology and Management, 333, 66–75.
Thomas, E., Gil Tobón, C., Gutierrez, J.P., Alcazar Caicedo, C., Moscoso Higuita, L.G., Becerra, L.A., Loo, J., Gonzales, M.A. (2017) Genetic diversity of Enterolobium cyclocarpum in Colombian seasonally dry tropical forest: implications for conservation and restoration. Biodiversity & Conservation 26, 825–842.
Thomas E., Alcázar Caicedo C., Loo J., & Kindt R. (2014b) The distribution of the Brazil nut (Bertholletia excelsa) through time: from range contraction in glacial refugia, over human-mediated expansion, to anthropogenic climate change. Boletim do Museu Paraense Emílio Goeldi. Ciências Naturais, 9, 267–291.
Thomas E., Jalonen R., Loo J., & Bozzano M. (2015) Avoiding failure in forest restoration: the importance of genetically diverse and site-matched germplasm. Unasylva, 245:29-36
White T.W., Adams W.T., & Neale D.B. (2007) Forest Genetics. CAB International 2007,
Whitham T.G., Bailey J.K., Schweitzer J. a, Shuster S.M., Bangert R.K., LeRoy C.J., Lonsdorf E. V, Allan G.J., DiFazio S.P., Potts B.M., Fischer D.G., Gehring C. a, Lindroth R.L., Marks J.C., Hart S.C., Wimp G.M., & Wooley S.C. (2006) A framework for community and ecosystem genetics: from genes to ecosystems. Nature reviews. Genetics, 7, 510–523.
Whitlock R. (2014) Relationships between adaptive and neutral genetic diversity and ecological structure and functioning: A meta-analysis. Journal of Ecology, 102, 857–872.
Williams A. V., Nevill P.G., & Krauss S.L. (2014) Next generation restoration genetics: Applications and opportunities. Trends in Plant Science, 19, 529–537.

133
Biodiversity, Sustainable Certifications and Climate Change Adaptation: Lessons from Shade Coffee Systems in Mesoamerica
BIODIVERSITY, SUSTAINABLE CERTIFICATIONS AND CLIMATE CHANGE ADAPTATION: LESSONS FROM SHADE COFFEE SYSTEMS IN MESOAMERICA
Solano, Ana Lucía 1, D. Pons 2, C. Tucker 3, R. Díaz 4, J. Barrera 5 H. Eakin 6 and E. Castellanos 1
(1) Centro de Estudios Ambientales y de Biodiversidad, Universidad del Valle de Guatemala. (2) University of Denver (3) University of Florida (4) Universidad Nacional de Costa Rica. (5) Colegio de la Frontera Sur (6) Arizona State University.
SUMMARY
The coffee sector has recently faced several crises starting with the international low coffee prices in 2001 followed by the recent infection by coffee leaf rust (Hemileia vastatrix) that affected producers all over Mesoamerica. The first crisis generated various certification schemes to help producers cope with the stressors and to get them into the sustainability production mainstream demanded by the market. The subsequent evaluation of the effectiveness of these certification schemes has been increasingly discussed and evaluated. Here we used a mixed methods approach conducted by an interdisciplinary team in Mesoamerica to assess the environmental outcomes related to adaptation and mitigation practices observed among coffee farmers under sustainable certification schemes and traditional coffee farmers at similar geographic contexts. Although none of the farms where shade-certified, we emphasized the analysis on the shade system as a way to discriminate among biodiversity in shade trees, canopy closure and structural complexity among coffee plantations as a proxy to assess the capacity of the system to hold biodiversity in light of the global trend on reducing shade to increase productivity. We found that sustainable certifications could be an adaptation strategy by promoting the implementation of agricultural practices that help preserve the environment, under the concept of Ecosystem-based adaptation (Eba). In addition, it can help farmers increase their income. However, these benefits do not seem to be exclusive of the certification schemes as non-certified farmers have adopted similar agricultural practices as well. Although the intensification of coffee systems has been associated to biodiversity loss, the impact of the certification schemes on biodiversity is less clear when addressed only by measuring tree species, canopy closure and structural complexity. This can be explained by the limitations to attribute a particular practice to a certification scheme since traditional farmers tend to improvise or reproduce similar agricultural practices.
1. INTRODUCTION
Coffee is the second most traded commodity after oil (Bernades et al., 2012; Toledo & Moguel 2012). International coffee trade generates over US$90 billion each year and supports the livelihoods of 100 million people worldwide (Pendergast 1999; DaMatta & Ramalho 2006). Among the coffee producers, smallholder farmers produce over 70% of the world’s coffee in 85 countries in Latin America, Asia and Africa in some of the most biologically diverse regions of the world (Bacon 2005; UNFCCC 2007: Toledo & Moguel 2012). Unfortunately, coffee crops are very sensitive to climate changes and extreme weather events (Magrach & Ghazoul 2015) and pests and infestations have severely impacted the region (i.e. Georgiou et al., 2014). Aside from price volatility, extreme weather and pest infestation have been identified by coffee farmers from Mesoamerica as the second and third stressors to coffee production (Castellanos et al., 2013). Yet, the vulnerability of coffee producers to climate changes (i.e. exposition to a risk) differs from farm to farm depending on the location and size of the coffee plot (see Haggar et al., 2013), the species and varieties grown (Jha et al., 2014) but also on the management and subsequent agricultural practices and social organization of the coffee producers. These complex array of coffee systems in Mesoamerica generates not only different yields but also different ecosystem services widely recognized by the literature and traditionally associated with shade coffee plantations that may be at risk of disappearing or become more technified with subsequent impacts on the ecosystem services including biodiversity loss (Perfecto et al,. 1996; Moguel & Toledo 1999; Philpott et al., 2008; Gobbi 2000; Toledo & Moguel 2012).
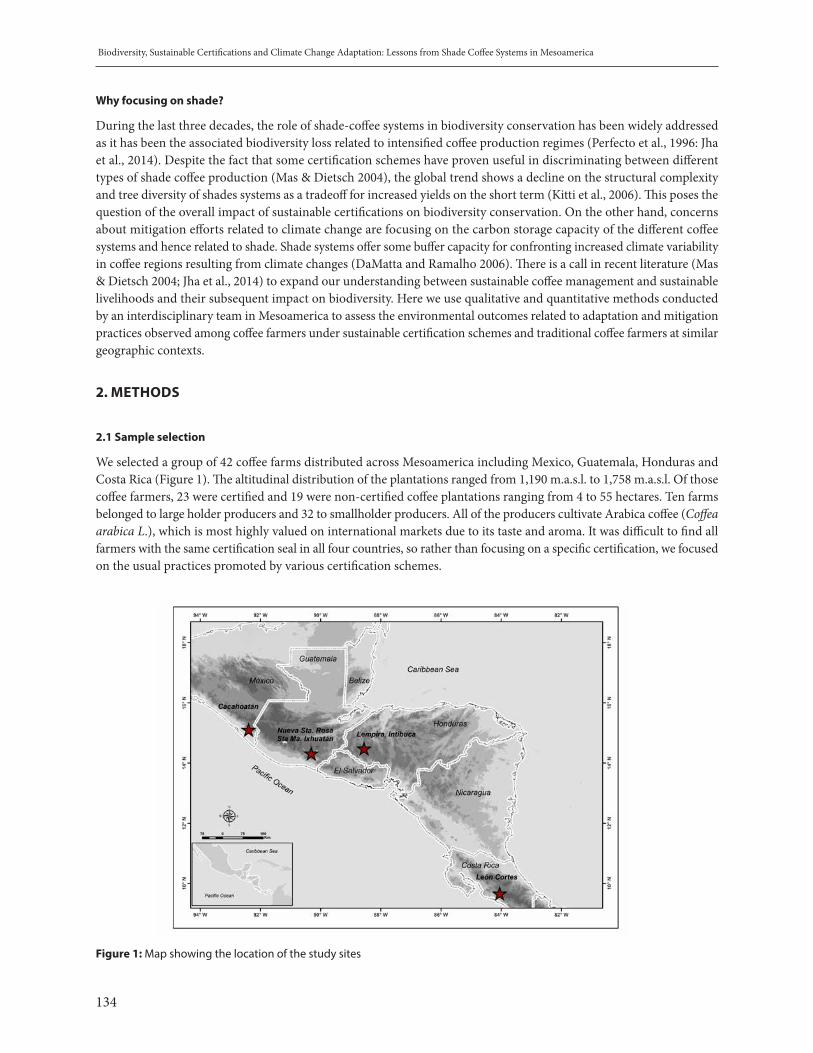
134
Biodiversity, Sustainable Certifications and Climate Change Adaptation: Lessons from Shade Coffee Systems in Mesoamerica
Why focusing on shade?
During the last three decades, the role of shade-coffee systems in biodiversity conservation has been widely addressed as it has been the associated biodiversity loss related to intensified coffee production regimes (Perfecto et al., 1996: Jha et al., 2014). Despite the fact that some certification schemes have proven useful in discriminating between different types of shade coffee production (Mas & Dietsch 2004), the global trend shows a decline on the structural complexity and tree diversity of shades systems as a tradeoff for increased yields on the short term (Kitti et al., 2006). This poses the question of the overall impact of sustainable certifications on biodiversity conservation. On the other hand, concerns about mitigation efforts related to climate change are focusing on the carbon storage capacity of the different coffee systems and hence related to shade. Shade systems offer some buffer capacity for confronting increased climate variability in coffee regions resulting from climate changes (DaMatta and Ramalho 2006). There is a call in recent literature (Mas & Dietsch 2004; Jha et al., 2014) to expand our understanding between sustainable coffee management and sustainable livelihoods and their subsequent impact on biodiversity. Here we use qualitative and quantitative methods conducted by an interdisciplinary team in Mesoamerica to assess the environmental outcomes related to adaptation and mitigation practices observed among coffee farmers under sustainable certification schemes and traditional coffee farmers at similar geographic contexts.
2. METHODS
2.1 Sample selection
We selected a group of 42 coffee farms distributed across Mesoamerica including Mexico, Guatemala, Honduras and Costa Rica (Figure 1). The altitudinal distribution of the plantations ranged from 1,190 m.a.s.l. to 1,758 m.a.s.l. Of those coffee farmers, 23 were certified and 19 were non-certified coffee plantations ranging from 4 to 55 hectares. Ten farms belonged to large holder producers and 32 to smallholder producers. All of the producers cultivate Arabica coffee (Coffea arabica L.), which is most highly valued on international markets due to its taste and aroma. It was difficult to find all farmers with the same certification seal in all four countries, so rather than focusing on a specific certification, we focused on the usual practices promoted by various certification schemes.
Figure 1: Map showing the location of the study sites

135
Biodiversity, Sustainable Certifications and Climate Change Adaptation: Lessons from Shade Coffee Systems in Mesoamerica
2.2 Assessment of agroecological variables
We evaluated several agroecological variables related to the three pillars of Climate Smart Agriculture (CSA): the crop productivity, ecological conditions that may favor adaptation of the plantation to climatic changes and the ability of the system to contribute to the mitigation of greenhouse gas emissions. The specific variables measured were: a) coffee production b) plant biodiversity, c) canopy closure d) disease and pest incidence and e) carbon sequestration. We evaluated one hectare per plantation for each farmer. Within each hectare, 4 interior plots (20 m by 30 m) were established to measure each variable described above.
2. 3 Survey of agricultural practices and certification perceptions
We administered a survey to explore the experiences and perceptions of farmers with respect to certification schemes (one certified farmer was unable to complete the survey, reducing responses to 41). The survey explored general aspects of the coffee plantation and specific aspects related to certification such as perceived benefits, information about the process to get certified and the costs associated with it. Producers with certification were also asked about their experiences with the certification process and outcomes. We collected data about productivity, production costs and the final sale price. We also triangulated information on agricultural practices measured on the farm with qualitative methods using information provided by the farmer. Finally, we inquired about the perceptions that producers have about the changes in the incidence of pests and climate, how this has affected them and what actions have been taken to address this situation.
3. RESULTS
3.1 Biodiversity
We evaluated the number of tree species used as coffee shade and their subsequent vegetable strata within the coffee plantations. The analysis did not find a significant difference in the average number of species of shade trees between certified and noncertified plantations. The most common tree species were those of the genus Inga, Grevillea, and varieties of Musa sp. Although there is no significant difference between certified and noncertified tree species richness (p> 0.05), we observed a trend towards more tree species in certified farms than noncertified ones. This finding is similar to those by Philpott (2007) and Haggar et al., (2015) were the organic (certified) farms had greater tree species richness compared to conventional farms. We also found that at country level, Guatemala shows the greatest number of tree species within the coffee plots.
Similar to the finding from Philpott et al., 2007 in Chiapas, we could not find significant differences in vegetation characteristics yet, both the certified and uncertified producers from Guatemala and Honduras tend to have greater diversity of plants within the plantation and could enable these farmers to acquire a more specific shade-certification. Although these findings cannot be explained only by the certification, there is a cultural component that influences how the producers, in particular the small ones, manage their plots. For instance, these smallholder farmers have started to diversify their shade to get some produce to sustain their nutrition. This diversification of shade systems in smallholder farms may be an important agricultural practice that helps farmers adapt to climate changes, fight price volatility and production costs but may also be supporting biodiversity as suggested by Méndez et al 2010.
3.2 Carbon fixation and shade percentage
The findings show that the total amount of carbon stored in certified plantations is higher, and this relates mainly to the higher number of shade trees. The difference was not statistically significant probably due to the high variability shown by the data. Shade trees are a requirement for certification, thus it is expected that shade be more prevalent in certified plantations.
The analysis of shade cover shows that certified farms tend to have denser shade (62%) than noncertified (51%), this result suggests better environmental characteristics for certified farms, for example: improved quality of habitat for biodiversity.

136
Biodiversity, Sustainable Certifications and Climate Change Adaptation: Lessons from Shade Coffee Systems in Mesoamerica
But is important to clarify that microclimates at regional levels usually dictate the adequate shade percentage needed to adjust for the right humidity of the farm according to its locations and despite the certification.
3.3 Pest and diseases
Coffee leaf rust (Hemiliea vastatrix) appeared as the most serious plant health problem for coffee producers during the study period. Field assessments estimated that 60% to 90% of coffee plants in all four countries showed infestation. Yet, no statistical significant difference between certified and noncertified farms was evident. Apparently, the practices promoted by certification do not reduce the impact of pests on coffee plantations. Whether this is also related to the lack of statistical difference between shade compositions remains an important subject of study. This could have an impact on biodiversity because if the agricultural practices in place now remain useless to prevent pests and infestations like the Hemileia vastatrix, an altitudinal shift of the plantations as the only effective adaptation strategy could create conflicts with high-biodiversity cloud forest at higher elevations from the coffee plantations as highlighted by Magrach & Ghazoul 2015. This same altitudinal shift could also give room to less biodiverse crops creating a double loss of biodiversity; one on the retreating side in the lower part of the altitudinal distribution of coffee and one in the higher limits where forest could be removed.
4. CONCLUSIONS
Certification schemes entail a number of practices that according to our data are associated with increased shade cover, increased carbon sequestration and soil conservation, practices associated with climate smart agricultural systems. However we also found that many of these benefits and practices are also associated with noncertified plantations, suggesting that these practices were already in use prior to certification, or else, they have been adopted by noncertified farmers who observed certified plantations. The number of noncertified farmers perceiving benefits in practices such as soil conservation and shade management suggests that these agronomic practices are widely seen as beneficial and are not necessarily pursued because of obligations under certification. Therefore, environmental certifications may expand important agricultural practices.
At the same time, our study found no clear evidence that certified plantations foster more resilient plantations than noncertified plantations. Both kinds of plantations experience similar vulnerability to pests, coffee plant diseases, and extreme weather events. Some producers perceived benefits from following sound environmental practices in their agricultural labor required by certification schemes. When the quality of coffee is the main goal, good agricultural practices make sense to achieve consistency in production.
The relationship between certification and social and environmental outcomes is complex. Further research is clearly needed to demonstrate the “climate-smart” aspects of specific agronomic practices, and to communicate these benefits to farmers who face climatic stress. In general, certification does appear to be a pathway toward improved social and environmental outcomes for farmers, but it is not the only pathway. A focus on the underlying agronomic practices and their benefits, and how these can be expanded to a broader population, regardless of reliance on certification schemes, would appear to be a strategic policy opportunity for the Mesoamerican region.
5. RECOMMENDATIONS
The results of this study highlight the importance of shade coffee systems, for its positive impact on the environment as a reserve of biodiversity and storage of sequestered carbon and its positive impact on the local and international economy. We recommend more studies where shade-certified coffee systems can be included and compared to other sustainability-oriented certifications.

137
Biodiversity, Sustainable Certifications and Climate Change Adaptation: Lessons from Shade Coffee Systems in Mesoamerica
6. ACKNOWLEDGMENTS
This work was carried out with the aid of a grant from the Inter-American Institute for Global Change Research (IAI) SGP-CRA2060 which is supported by the US National Science Foundation (Grant GEO-1138881). We would also like to thank all farmers who collaborated in this research and the valuable comments of the anonymous reviewers.
7. REFERENCES
Bacon, C. M., Ernesto Méndez, V., Gómez, M.,Eugenia Flores, Stuart, D., & Flores, S. R. D. (2008) Are sustainable coffee certifications enough to secure farmer livelihoods? the millenium development goals and Nicaragua’s fair trade cooperatives. Globalizations, 5(2), 259-274. doi:10.1080/14747730802057688
Bacon, C. M., Méndez, V. E., & Gliessman, S. R. (2008) Food, health, and the environment: Confronting the coffee crisis: Fair trade, sustainable livelihoods and ecosystems in mexico and central america. Cambridge, US: The MIT Press.
Bandeira, F., Martorell, C., Meave, J., & Caballero, J. (2005) The role of rustic coffee plantations in the conservation of wild tree diversity in the Chinantec region of Mexico. Biodiversity & Conservation, 14(5), 1225-1240. doi:10.1007/s10531-004-7843-2
Bernardes, T., Moreira, M. A., Adami, M., Giarolla, A., & Rudorff, B. F. T. (2012) Monitoring Biennial Bearing Effect on Coffee Yield Using MODIS Remote Sensing Imagery. Remote Sensing, 4(12), 2492-2509. doi:10.3390/rs4092492
Castellanos, E., Tucker, C. Eakin, H. Morales, H., Barrera,J. & Diaz, R. (2013) Assessing the adaptation strategies of farmers facing multiple stressors: Lessons from the Coffee and Global Changes Project in Mesoamerica. Environmental Science and Policy 26:19-28.
DaMatta F, Ramalho J. (2006) Impacts of drought and temperature stress on coffee physiology and production: A review. Brazilian Journal of Plant Physiology 18: 55–81.
Dietsch, T. (2003) In Perfecto I., Root T.(Eds.), Conservation and ecology of birds in coffee agroecosystems of Chiapas, Mexico ProQuest Dissertations Publishing.
Georgiou, S., (2014) An analysis of the weather and climate conditions related to the 2012 epidemic of coffee rust in Guatemala: technical report: CATIE , 2014. 93 p.
Gobbi, J. A. (2000) Is biodiversity-friendly coffee financially viable? an analysis of five different coffee production systems in western el salvador. Ecological Economics, 33(2), 267-281. doi:http://dx.doi.org/10.1016/S0921-8009(99)00147-0
Haggar, J., Medina, B., Aguilar, R., & Munoz, C. (2013) Land use change on coffee farms in southern Guatemala and its environmental consequences. Environmental Management, 51(4), 811-23. doi:10.1007/s00267-013-0019-7
Haggar, J., Asigbaase, M., Bonilla, G., Pico, J., & Quilo, A. (2015) Tree diversity on sustainably certified and conventional coffee farms in Central America. Biodiversity & Conservation, 24(5), 1175-1194. doi:10.1007/s10531-014-0851-y
Jha, S., Bacon, C., Philpott, S., Méndez, V., Läderach, P., & Rice, R. (2014) Shade coffee: Update on a disappearing refuge for biodiversity. Bioscience, 64(5), 416.
Kitti, M., Heikkilä, J., & Huhtala, A. (2009) ‘ Fair’ policies for the coffee trade – protecting people or biodiversity? Environment and Development Economics, 14(6), 739-758. doi:10.1017/S1355770X09005208
Magrach, A., & Ghazoul, J. (2015) Climate and pest-driven geographic shifts in global coffee production: Implications for forest cover, biodiversity and carbon storage. PLoS One, 10(7) doi:10.1371/journal.pone.0133071
Mas, A. H., & Dietsch, T. V. (2004) Linking shade coffee certification to biodiversity conservation: Butterflies and birds in Chiapas, Mexico. Ecological Applications, 14(3), 642-654. doi:10.1890/02-5225

138
Biodiversity, Sustainable Certifications and Climate Change Adaptation: Lessons from Shade Coffee Systems in Mesoamerica
Méndez, V. E., Bacon, C., Olson, M., Morris, K., & Shattuck, A. (2010) Agrobiodiversity and shade coffee smallholder livelihoods: A review and synthesis of ten years of research in Central America. The Professional Geographer, 62(3), 357-376. doi:10.1080/00330124.2010.483638
Messer, K., Kotchen, M., & Moore, M. (2000) Can shade-grown coffee help conserve tropical biodiversity? A market perspective. Endangered Species Update, 17(6), 125-131.
Moguel, P., Toledo, V., (1999) Biodiversity conservation in traditional coffee systems of Mexico. Conservation Biology 13, 11–21.
Pendergast, M. (1999) Uncommon grounds: The history of coffee and how it transformed our world (1st ed.). New York, NY: Basic Books.
Perfecto, I., Rice, R., Greenberg, R., & Van, D. V. (1996) Shade coffee: A disappearing refuge for biodiversity. BioScience 46(8), 598-608.
Perfecto, I., Vandermeer, J., Mas, A., & Pinto, L. (2005) Biodiversity, yield, and shade coffee certification. Ecological Economics, 54(4), 435-446. doi:10.1016/j.ecolecon.2004.10.009
Philpott, S. M., & Dietsch, T. (2003) Coffee and conservation: A global context and the value of farmer involvement. Conservation Biology 17(6), 1844-1846.
Philpott, S. M., Bichier, P., Rice, R., & Greenberg, R. (2007) Field Testing ecological and economic benefits of coffee certification programs; pruebas en campo de los beneficios ecológicos y económicos de los programas de certificación de café. Conservation Biology, 21(4), 975-985. doi:10.1111/j.1523-1739.2007.00728.x
Philpott, S. M., Arendt, W. J., Armbrecht, I., Bichier, P., Diestch, T. V., Gordon, C., et al. (2008) Biodiversity loss in latin american coffee landscapes: Review of the evidence on ants, birds, and trees; pérdida de biodiversidad en paisajes cafetaleros en latinoamérica: Revisión de la evidencia en hormigas, aves y árboles. Conservation Biology, 22(5), 1093-1105. doi:10.1111/j.1523-1739.2008.01029.x
Takahashi, R., & Todo, Y. (2014) The impact of a shade coffee certification program on forest conservation using remote sensing and household data. Environmental Impact Assessment Review; Environ.Impact Assess.Rev., 44, 76-81. doi:10.1016/j.eiar.2013.10.002
Toledo, V., & Moguel, P. (2012) Coffee and sustainability: The multiple values of traditional shaded coffee. Journal of Sustainable Agriculture, 36(3), 353-377. doi:10.1080/10440046.2011.583719
UNFCCC (United Nations Framework Convention on Climate Change). (2007) “Climate change: Impacts, vulnerabilities and adaptation in developing countries”. Climate Change Secretariat (UNFCCC), Bonn, Germany.

139
Conclusions, Further Research and General Recommendations
4. CONCLUSIONS, FURTHER RESEARCH AND GENERAL RECOMMENDATIONS
The contributions to the symposium have documented the relevance of research for understanding climate change and biodiversity, on how climate change is impacting natural ecosystems, threatening the natural capital and livelihoods of rural and indigenous people. Scientific findings have also shown that social processes can have an even higher impact on important resources for human populations, such as water and how some solutions based on nature, such as forest restoration, ecological intensification of coffee plantations, land-use planning of local and indigenous communities, and other strategies related to nature, can better respond to climate change. Despite the advances made, more research is needed to reduce uncertainties, understand the interactions among different levels or system organization, and propose tailored solutions for local people and biodiversity on how to best cope with climate change.
The results here presented should also contribute to the design of more appropriate policies towards scaling-up of solutions at national or regional levels. Nevertheless, solutions such as investment in agricultural productivity, reduced food waste, development of interconnected protected area networks and many other efforts to reduce greenhouse gas emissions from other sectors require important behavioural changes. Those changes as well as intensive strategic and multidisciplinary work will be required by governments, private companies, consumers and farmers.
The following paragraphs summarize the findings, knowledge gaps and main recommendations from the documents included in this volume as well as those coming from the presentations and discussions that took place during the two-day Symposium. They are the support to the Lima Declaration on Biodiversity and Climate Change (see Annex).
The Symposium used as framework for discussions, issues regarding climate change mitigation from the Intergovernmental Panel on Climate Change (IPCC) 5th Assessment Report (AR5), the state of implementation of the Convention on Biological Diversity (CBD) Strategic Plan 2010-2020, and the 4th Global Biodiversity Outlook (GBO, 2014). The IPCC report has confirmed the great influence of the Anthropocene on current CO2 emissions levels and its consequent impacts on human and natural systems. At the same time, the GBO has shown that there has been progress towards implementing the strategic plan, but at rates that are still insufficient to halt the loss of biodiversity and achieve the agreed targets by 2020.
SOME FINDINGS
On tropical forests and carbon fluxes. Variation in the species that occur in different lowland tropical forests determines patterns in aboveground carbon stocks and productivity.
• Taller trees and with high wood density store more carbon, thus, tropical forest in Borneo carry more carbon than Amazonian forests.
• Species diversity does not show a relationship with carbon stocks, as exemplified by peatland ecosystems (aguajales).
The resilience of forest carbon stocks to environmental change is enhanced where a wide range of species with different adaptations co-exist.
• In Ghana, forests have increased in biomass despite a long-term drought, thanks to a shift in composition towards dry forest species.
• Remote sensing analyses of carbon and vegetation models of the trajectory of the tropical forest biome need to incorporate variation in species composition.
140
Conclusions, Further Research and General Recommendations
Long-term, large scale studies of tropical forests, such as the RAINFOR network of plots, are shedding light on Amazon forest dynamics changes. By growing faster, trees have gained biomass, but they are also dying faster. Climate change and the accelerating carbon fluxes are themselves feeding back on the rate of global climate change.
Monitoring seasonally flooded forests with a network of plots helped to show a distinctive vegetation composition, low in diversity but comparable to poor white sand-soil forests. Aboveground Carbon storage is also comparatively lower than in terra firme forests, but belowground is significantly higher than any standing forest; with pole forests storing the greatest densities of carbon in Amazonia (1391 ± 710 Mg C ha-1, see Honorio, this volume). They are extremely dynamic over time and sensitive to changing environmental conditions.
Tropical peat swamp forests (PSF) store large amounts of carbon in the soil. Yet accurate inventories of their contribution to the carbon pool and the stage of degradation are still in progress. For instance, half of Indonesian PSF, the largest tropical peatlands have been lost already, by draining. In Peru, large areas of dense plan swamps (of Mauritia flexuosa) are under threat by logging; these conversions can translate into significant reduction of tree carbon stocks although soil carbon losts have not yet been calculated (Hergoualc´h et al. 2017).
PSF need more studies in upper-amazonian forests. Mapping, description, coverage and characterization of peat swamps, tracing gas emissions, and degree of degradation are missing information that will be useful for designing, for instance, REDD+ projects on these carbon rich ecosystems. In this line, it was recommended to:
• Embrace new technologies and ‘state of the art’ analyses, including early engagement with new satellite missions: provide opportunities to develop human and institutional capacity to achieve this
• Focus on ‘critical ecotones’ or key environmental gradients: e.g. cloud base in montane forest; mosaics of flooded forests; dry/wet forest ecotone
• TCollect long-term, field-based monitoring data, which are very important to develop our understanding of the effect of climate change on biodiversity
• Develop and use big, multidisciplinary datasets based on collaborative science, open access data, linking local with existing international initiatives
Studies along elevation gradients are helping to explain forested ecosystems and predict climate change impacts. In the tropical Andes, plant diversity is maintained until 1700 m approximately above 150 species, decreasing to less than 30 species at the treeline at about 3400 m; most tree species have narrow altitudinal distributions.
Net primary productivity (NPP) also decreases with elevation but the transition is abrupt at around 1600-1700 m asl, due to a dry season produced by the decline in cloud presence.
Decomposition processes also change with altitude, switching from macro-fauna soil to microbial organisms, dominated by fungi (instead of bacteria) at higher elevations; amount of carbon storage also changing from above ground to underground, at higher elevations. Under climate change conditions, it will be expected that warming will increase the loss of carbon from soil more than it increases gain of carbon in tree biomass.
Although tree species are migrating upslope, migration is occurring at a slower speed than expected from changes in temperature, especially on those species at the timberline, suggesting that other factors than temperature are involved related to those changes (Feeney et al. 2011, 2012).
In the marine realm, the relationship among changes observed in biodiversity, climate and ocean characteristics are still unclear. The larvae and plankton export´ mechanisms to the oceanic realm and their influence on the inter-annual variability in the recruitment of keystone species are unknown, but data recently gathered and models suggest that intense shelf-open ocean exchanges take place at the transition between the South Brazil and Patagonia shelves. Marine bird populations, like the Peruvian pelican (Pelecanus thagus) are showing extreme behavioural changes such as nest abandon, for which a premature extinction can occur.
It is also still unclear how coastal productive ecosystems exchange mass, nutrients and species within them and with the neighbouring deep ocean and the way they will respond to changes in circulation and winds. An improved knowledge

141
Conclusions, Further Research and General Recommendations
of exchange processes between continental platforms and deep oceans is essential for better understanding, modelling and prediction of future evolution in productivity and biodiversity in response to climate change.
Knowledge gaps of marine organisms such as sponges, jellyfish, corals, about which very little is known from the species diversity and phylogenetic from the Pacific Ocean neighbouring South America.
ON THE IMPACTS OF CLIMATE CHANGE ON BIODIVERSITY, SOCIAL-ECOLOGICAL SYSTEMS AND ITS MEASUREMENTS
Climate change is impacting also in temperate forests. A monitoring programme in Bavaria, Germany, over an altitudinal transect, has provided evidence that summer drought triggers large scale disturbance by bark beetles; that taxonomic groups respond differently to macroclimate, pointing out that community´s composition is under re-organization within and across taxonomic groups. Notably, high-altitude montane populations have shown to be highly vulnerable to climate change. Loss of species might happen because of a narrow elevation range which limits an upward escape. Finally, changes in assembly patterns encompassing macroclimate changes have the potential to change functional diversity of those assemblages and hence potentially ecosystem processes and services.
On measuring vulnerability of species. IUCN methodology is a suitable tool for a wide range of organisms. It combines best aspects of available approaches (use predicted changes and effect on species). It is important to validate species evaluations made with IUCN tool by using responses to climate change observed with monitoring data. By doing this, it includes impact of human responses to climate change, and the interactions of climate change with other threats. It also translates vulnerability studies into strategies for managing adaptation to climate change.
Wireless sensor networks can change the paradigm on when monitoring data can be processed. Processing data flux in real time, through platforms of such as Enviro-Net, could revolutionize our comprehension of responses of tropical systems to global environmental changes (www.tropi-dry.eas.ualberta.ca). This, in turn, will help us to better predict future responses, anticipate changes and respond in a timely frame, thus involving better informed decision-making.
Camera traps are also an automatized methodology used more and more for documenting presence and stage of wild populations in Amazonian forests, especially for mammals and birds in remote protected areas.
Much research needs to be made on host–pathogen interactions in the tropics, under climate change conditions, such as increased air temperature and reduced precipitation. For instance, fungal diseases are responsible for losses of at least 10% of global food production, representing a threat to food security (Strange & Scott, 2005). Furthermore, these losses occur more in developing countries that lack proper infrastructure. Host–pathogen relationships are well suited to a dynamical analysis of the effects of climate change due to the direct linkages between pathogen behaviour and abiotic factors such as temperature and rainfall, in natural conditions. These relationships are known to affect recruitment of some Amazonian plant species. Seedlings of the palm Iriartea deltoidea experience significant mortality due to infection by the fungus Diplodia mutila, illustrating the temperature sensitivity of the fungus, and of I. deltoidea seedling mortality in response to infection (Alvarez-Loayza et al, 2008).
Climate change is affecting the livelihoods of Amazonian populations. Recent climatic fluctuations in flooded forests of the Peruvian Amazon have impacted both the biodiversity of wildlife and livelihoods of local people. The drought in 2010 caused decreases in fish, dolphin and wading bird populations. Fishing and hunting activities are changing due to changes and extreme events in rainfall seasonality. These impacts are resulting in a greater vulnerability of indigenous communities’ food security.
On biodiversity and human health. Climate change is perceived to worsen current health challenges. Biodiversity, at the species level and across a wide range of organisms, including micro-organisms and gut microbiota, have a positive effect on human health, by providing food security, nutrition, clean water, clean air, among others services. But biodiversity also possesses some risks to human beings, vector –borne diseases including mammal-borne viral diseases, snakebite envenoming and plant pathogens; changes on these services need to be understood under climate change and sustainable development contexts.

142
Conclusions, Further Research and General Recommendations
It is recommended to apply the One Health approach stressing the importance of a systemic transdisciplinary approach to analyse and protect health of all beings, as they are all interrelated, thus supporting the planetary health approach.
Strengthening capabilities of programmes and strategies on public health, especially on vector-diseases, will improve the resilience of most marginalized people, living in remote areas or poor conditions, with limited economic resources and limited access to health care services.
On data availability and quality. Data-bases are currently insufficient and require higher investment and resources to collect, systematize information, and quality control. Whenever possible, information should be made freely available.
• Expand existing networks (such as GBIF), engage more potential data publishers
• Invest in capacity to mobilize data.
• Develop strategies for digitization, identify data gaps
• In the same way, similar levels of investments are needed to recuperate, organize and curate grey information that could be mise en valeur.
• Requires the establishment of mechanisms of transparency and open data access concept widely acceptance in all research and academic education.
• As a complement, it is necessary to establish networks for exchange and knowledge management.
• Improve data quality through engaging expert communities and key users
• Improve data citation, reproducibility of research e.g. through use of DOIs for datasets and downloads
• Promote and engage in new data types for biodiversity, e.g. sample-based data including abundance using standard protocols
• Also always consider non-climatic threats and biological characteristics of organisms and phenotypic and ecological plasticity.
ECOSYSTEM -BASED SOLUTIONS AND OTHER APPROACHES TO COPE WITH CLIMATE CHANGE
Effective conservation strategies depend on incorporating knowledge of the ecological and socio-economic dimensions of the system. Examples in this volume include: Tamshiyacu-Tahuayo, Peru – with ribereño communities; Costa Rica – in agricultural systems; Madidi, Bolivia indigenous local communities land-use planning.
In order to further inform integrated territorial management processes it is important to develop our understanding on the cost-benefit of different economic alternatives and scenarios, both of different economic activities as well as different infrastructure uses.
The landscape connectivity needs to be understood, for both ecosystems and species diversity, such as altitudinal and latitudinal corridors and wildlife corridors, and preferably at multiples scales and/or basin scales.
Water resource concerns in highland Andean ecosystems can be driven more by increased demand by people rather than by the shifting climate itself. Thus, biodiversity concerns and ecosystem services in changing tropical landscapes such as these must be assessed in reference to both social and eco-hydrological processes.
More proactive management and planning could be done by social actors who focus on the demand-side of water resources, which would need to be informed by social science approaches, rather than being limited to debates about water supplies; much more needs to be done on governance issues.
In all these efforts, the requirements of native species of plants and animals need to be also considered, in terms of environmental flows in the streams and rivers, and of habitat connectivity in regards to the species most affected by warming temperatures and shifting humidity regimes. Both social justice and ecological benefits should be criteria utilized to improve socio-ecological systems.
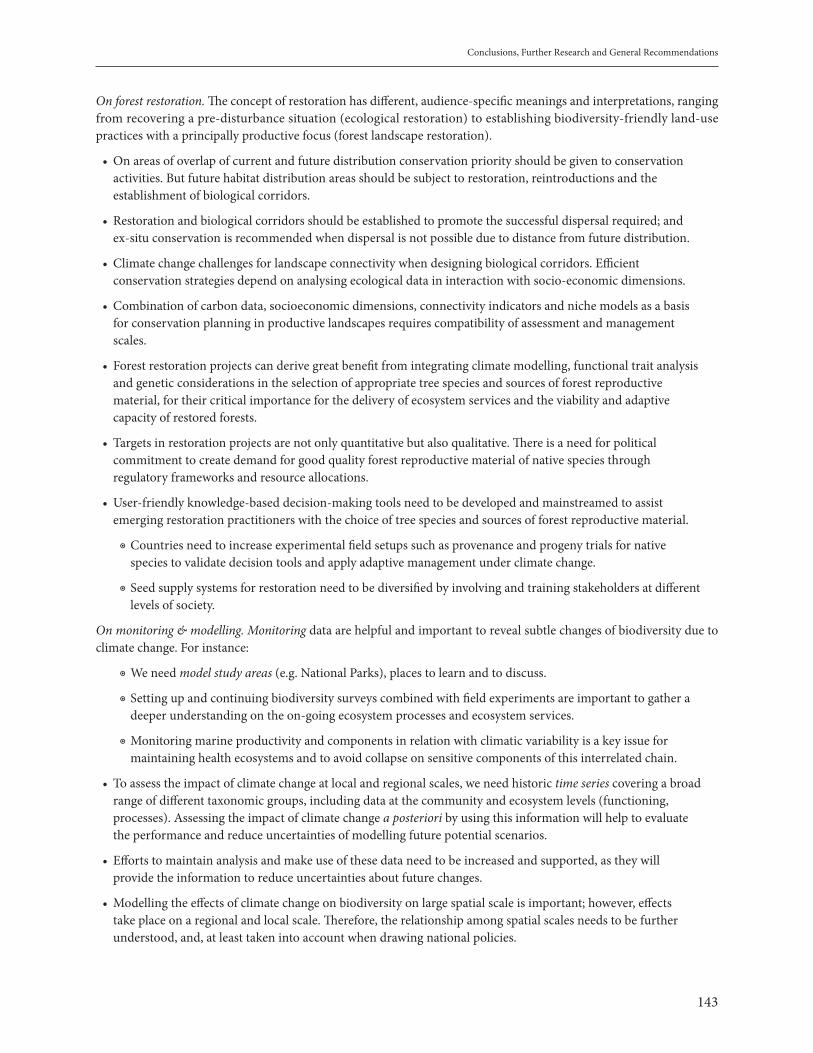
143
Conclusions, Further Research and General Recommendations
On forest restoration. The concept of restoration has different, audience-specific meanings and interpretations, ranging from recovering a pre-disturbance situation (ecological restoration) to establishing biodiversity-friendly land-use practices with a principally productive focus (forest landscape restoration).
• On areas of overlap of current and future distribution conservation priority should be given to conservation activities. But future habitat distribution areas should be subject to restoration, reintroductions and the establishment of biological corridors.
• Restoration and biological corridors should be established to promote the successful dispersal required; and ex-situ conservation is recommended when dispersal is not possible due to distance from future distribution.
• Climate change challenges for landscape connectivity when designing biological corridors. Efficient conservation strategies depend on analysing ecological data in interaction with socio-economic dimensions.
• Combination of carbon data, socioeconomic dimensions, connectivity indicators and niche models as a basis for conservation planning in productive landscapes requires compatibility of assessment and management scales.
• Forest restoration projects can derive great benefit from integrating climate modelling, functional trait analysis and genetic considerations in the selection of appropriate tree species and sources of forest reproductive material, for their critical importance for the delivery of ecosystem services and the viability and adaptive capacity of restored forests.
• Targets in restoration projects are not only quantitative but also qualitative. There is a need for political commitment to create demand for good quality forest reproductive material of native species through regulatory frameworks and resource allocations.
• User-friendly knowledge-based decision-making tools need to be developed and mainstreamed to assist emerging restoration practitioners with the choice of tree species and sources of forest reproductive material.
◉ Countries need to increase experimental field setups such as provenance and progeny trials for native species to validate decision tools and apply adaptive management under climate change.
◉ Seed supply systems for restoration need to be diversified by involving and training stakeholders at different levels of society.
On monitoring & modelling. Monitoring data are helpful and important to reveal subtle changes of biodiversity due to climate change. For instance:
◉ We need model study areas (e.g. National Parks), places to learn and to discuss.
◉ Setting up and continuing biodiversity surveys combined with field experiments are important to gather a deeper understanding on the on-going ecosystem processes and ecosystem services.
◉ Monitoring marine productivity and components in relation with climatic variability is a key issue for maintaining health ecosystems and to avoid collapse on sensitive components of this interrelated chain.
• To assess the impact of climate change at local and regional scales, we need historic time series covering a broad range of different taxonomic groups, including data at the community and ecosystem levels (functioning, processes). Assessing the impact of climate change a posteriori by using this information will help to evaluate the performance and reduce uncertainties of modelling future potential scenarios.
• Efforts to maintain analysis and make use of these data need to be increased and supported, as they will provide the information to reduce uncertainties about future changes.
• Modelling the effects of climate change on biodiversity on large spatial scale is important; however, effects take place on a regional and local scale. Therefore, the relationship among spatial scales needs to be further understood, and, at least taken into account when drawing national policies.

144
Conclusions, Further Research and General Recommendations
GENERAL REMAINING QUESTIONS FOR RESEARCH:
• Which species and how, will change their geographical distribution with climate change?
• Proof methods based on species characters (or features), to measure vulnerability against observed data.
• What are the causes for changes observed in biodiversity?
• What is the impact (footprint) of divers “drivers”; make careful sampling /experiments to detect isolated effects of different factors?
• What factors will they have over functioning, changes in ecosystem composition?
• Is resilience proportional or constant with biodiversity?
• How will these changes affect human livelihood - e.g. food resources?
• How will disruptions in organism interactions affect biodiversity?
• Which are the common factors promoting success of different conservation strategies in diverse contexts?
• How effectives are/will be current conservation strategies under climate change conditions?
• An analysis at regional scale of ecosystems vulnerability to climate change and connections to adaptation strategies is still missing.
RECOMMENDATIONS FOR SCIENCE-POLICY INTERACTIONS
The following recommendations were made by participants:
• Promote global mechanisms for monitoring the sustainable use of biodiversity, giving special focus to more sensitive areas, such as mining, which affects water sources and biodiversity. Researchers can contribute to review national legal frameworks, from the economic, governance and ecological perspective and developing models affecting biodiversity.
• Persist in reducing the gap between science and policy, actively integrating research and academic institutions in designing and supporting policy strategies, by promoting national and sub-national networks collecting policy and more vulnerable social group needs, at local levels, thus enabling decentralization and more inclusive approaches.
• Promote knowledge dialogues and interdisciplinary projects and initiatives reflecting the contribution of a diversity of social and natural sciences, and traditional knowledge for the conservation, restoration and sustainable use of biodiversity in the framework of climate change.
• Given the information gaps on marine issues, adding up to the uncertainty on the impacts of climate change for national economies, it becomes clear the need for public policies to support and motivate the development of research across a wide range of institutions and universities, diversifying also the coverage of topics, from natural to social sciences.
• Technology transfer and capacity building are also needed to improve knowledge on biodiversity functioning and potential uses, thus allowing more sustainable use of marine resources, including by aquaculture.
• Support the inclusion of climate change in education and academic processes, encouraging young researchers by providing suitable infrastructure.
• At national levels, it is urgent to embrace the ecosystem approach in fisheries, not only to the sustainable use of one resource. It is necessary to take into account the whole ecosystem to keep it resilient through time.
145
Conclusions, Further Research and General Recommendations
• Generate and improve dialogue opportunities among researchers and decision-makers, building common agendas, disseminating successful experiences and deepening experiences on measures and initiatives for climate change adaptation.
• The information flux from science should not be unidirectional; for this to work properlyan agenda orienting towards the research needs for public policies needs to be established. Establish formal and informal communication – ‘pipelines’ to allow information to flow among scientists and to and from policy makers.
• Managing biodiversity implies also interactive processes to establish objectives, evaluate changes and adapt management according to the dynamics of the ecosystems.
• Monitoring the species distributions and reduction of threats will be key for maintaining livelihoods quality of people, especially of those living in rural areas.
• Ideally, coordinating bodies should be created to establish and implement agendas, discuss results, and motivate new questions, but this will need some resources from public treasury.
• Amazonian natural protected areas should include the complete range of flooding ecosystems.
• Long-term monitoring of flooding Amazonian forest is necessary to understand the resilience of these ecosystems to climate change.
• Intensify efforts to monitor and to evaluate the socio-ecological and socio-hydrological dimensions of change in glaciated mountain ranges.
• National and regional (continental) efforts on monitoring physical, chemical and biological marine variables are needed to register and understand impacts of climate change on marine ecosystems.
• Proper procedures concerning shipping specimens of marine organisms for scientific identification need to be put in place, as for terrestrial organisms, to remove obstacles for research collaborations and advancing knowledge on marine biodiversity.
• Promote, support and follow-up processes of diversified agriculture, organic agricultural production and fair commercial channels. When possible, increase access to credits and establish agricultural insurance to cope with climate change impacts.
• Extend technical assistance, access to climate information and strength local organizations capacities.
• Financial mechanisms to support territorial management must be established by documenting the multiple benefits to equitable development and conservation.
REFERENCES
Alvarez-Loayza P, White J, Giraldo CC. 2008 First report of Aspergillus flavus colonizing naturally dispersed seeds of Oxandra acuminata, Pseudomalmea diclina, and Unonopsis matthewsii in Peru. Plant Disease 92:974.
Feeley KJ, Silman MR, Bush M, Farfan W, Garcia Cabrera K, Malhi Y, Meir P, Salinas Revilla N, Raurau Quisiyupanqui MN, Saatchi S. 2011 Upslope migration of Andean trees J. Biogeography 38: 783–791.
Feeley KJ, Malhi Y, Zelazowski P, Silman M. 2012 The relative importance of deforestation, precipitation change, and temperature sensitivity in determining the future distributions and diversity of Amazonian plant species. Global Change Biology. 18(8): 2636–2647.
Hergoualc´h K, Gutiérrez-Vélez VH, Menton M, Verchot LV. 2017 Characterizing degradation of palm swamp peatlands from space and on the ground: An exploratory study in the Peruvian Amazon. Forest Ecology and Management 393: 63–73.
Strange RN, Scott PR. 2005 Plant disease: a threat to global food security. Annu Rev Phytopathol.43: 83-116.

146
Annex: The Lima Declaration on Biodiversity and Climate Change
ANNEX: THE LIMA DECLARATION ON BIODIVERSITY AND CLIMATE CHANGE
The 5th IPCC report overwhelmingly shows clearly that global overheating is caused by human activities. To date, research has revealed many of the impacts of climate change on our planet’s ecosystems, but it has also become clear that many of the peculiarities associated with how these ecosystems are responding are still unknown. Meanwhile, the Global Biodiversity Outlook 4 confirmed that despite the efforts that have been made, the rate of biodiversity loss is increasing and the state of biological diversity will continue to deteriorate unless enhanced efforts to reduce these trends are implemented at the local, national and regional level. This, as is understandable, creates a situation of uncertainty about what is happening and what is to come.
In this context, we commend the response of researchers who answered our call to inform us and other policy-makers about the state of the art in research on the impact of climate change on biodiversity, its vulnerability and adaptation today and in the near future. We also welcome the response of the Secretariat of the Convention on Biological Diversity as well as the international organizations that have actively contributed to the development of this event. Peru remains committed to the goals of both the Convention on Biological Diversity, and the Framework Convention on Climate Change, and we feel a responsibility to promote the synergies necessary to achieve adequate and timely contributions to help to achieve those goals.
We are sure that, to the extent that research provides conclusions based on relevant observations, these conclusions will contribute to the reduction of uncertainty in our estimates of the impacts of climate change. Furthermore, these results will help strengthen the quality and consistency of the decisions we take both in Peru and at the regional, or even global, level, regarding the integration of biodiversity into policies for mitigation and adaptation to climate change, as part of an integrated, intersectoral approach.
This dialogue with researchers to translate scientific information into public knowledge, facilitates the understanding and application of these results when discussed together with policy-makers and also, to some extent, private sector leaders and society at large, who are hereby called upon to co-participate in decisions related to climate change and biodiversity.
Finally, this Declaration will reinforce the importance of scientific research related to climate change and biodiversity, not only in Peru, but in the Andean region and in South America in general, as well as the corresponding agenda. Our natural heritage constitutes a comparative advantage; the conservation and sustainable use of biodiversity will allow us to meet the enormous challenges of global change and sustainable development.
Lima, December 9th, 2014
Gabriel Quijandría Braulio Ferreira de Souza Dias Vice-minister of Environment Executive Secretary Peru Convention on Biological Diversity
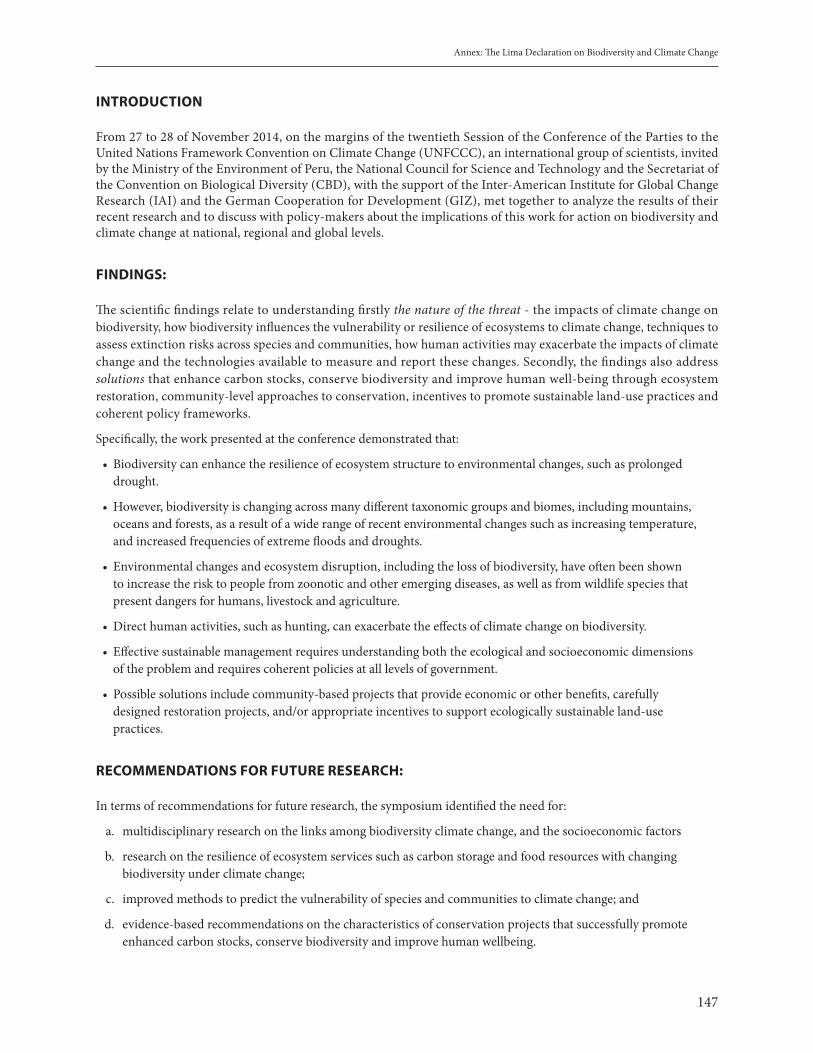
147
Annex: The Lima Declaration on Biodiversity and Climate Change
INTRODUCTION
From 27 to 28 of November 2014, on the margins of the twentieth Session of the Conference of the Parties to the United Nations Framework Convention on Climate Change (UNFCCC), an international group of scientists, invited by the Ministry of the Environment of Peru, the National Council for Science and Technology and the Secretariat of the Convention on Biological Diversity (CBD), with the support of the Inter-American Institute for Global Change Research (IAI) and the German Cooperation for Development (GIZ), met together to analyze the results of their recent research and to discuss with policy-makers about the implications of this work for action on biodiversity and climate change at national, regional and global levels.
FINDINGS:
The scientific findings relate to understanding firstly the nature of the threat - the impacts of climate change on biodiversity, how biodiversity influences the vulnerability or resilience of ecosystems to climate change, techniques to assess extinction risks across species and communities, how human activities may exacerbate the impacts of climate change and the technologies available to measure and report these changes. Secondly, the findings also address solutions that enhance carbon stocks, conserve biodiversity and improve human well-being through ecosystem restoration, community-level approaches to conservation, incentives to promote sustainable land-use practices and coherent policy frameworks.
Specifically, the work presented at the conference demonstrated that:
• Biodiversity can enhance the resilience of ecosystem structure to environmental changes, such as prolonged drought.
• However, biodiversity is changing across many different taxonomic groups and biomes, including mountains, oceans and forests, as a result of a wide range of recent environmental changes such as increasing temperature, and increased frequencies of extreme floods and droughts.
• Environmental changes and ecosystem disruption, including the loss of biodiversity, have often been shown to increase the risk to people from zoonotic and other emerging diseases, as well as from wildlife species that present dangers for humans, livestock and agriculture.
• Direct human activities, such as hunting, can exacerbate the effects of climate change on biodiversity.
• Effective sustainable management requires understanding both the ecological and socioeconomic dimensions of the problem and requires coherent policies at all levels of government.
• Possible solutions include community-based projects that provide economic or other benefits, carefully designed restoration projects, and/or appropriate incentives to support ecologically sustainable land-use practices.
RECOMMENDATIONS FOR FUTURE RESEARCH:
In terms of recommendations for future research, the symposium identified the need for:
a. multidisciplinary research on the links among biodiversity climate change, and the socioeconomic factors
b. research on the resilience of ecosystem services such as carbon storage and food resources with changing biodiversity under climate change;
c. improved methods to predict the vulnerability of species and communities to climate change; and
d. evidence-based recommendations on the characteristics of conservation projects that successfully promote enhanced carbon stocks, conserve biodiversity and improve human wellbeing.
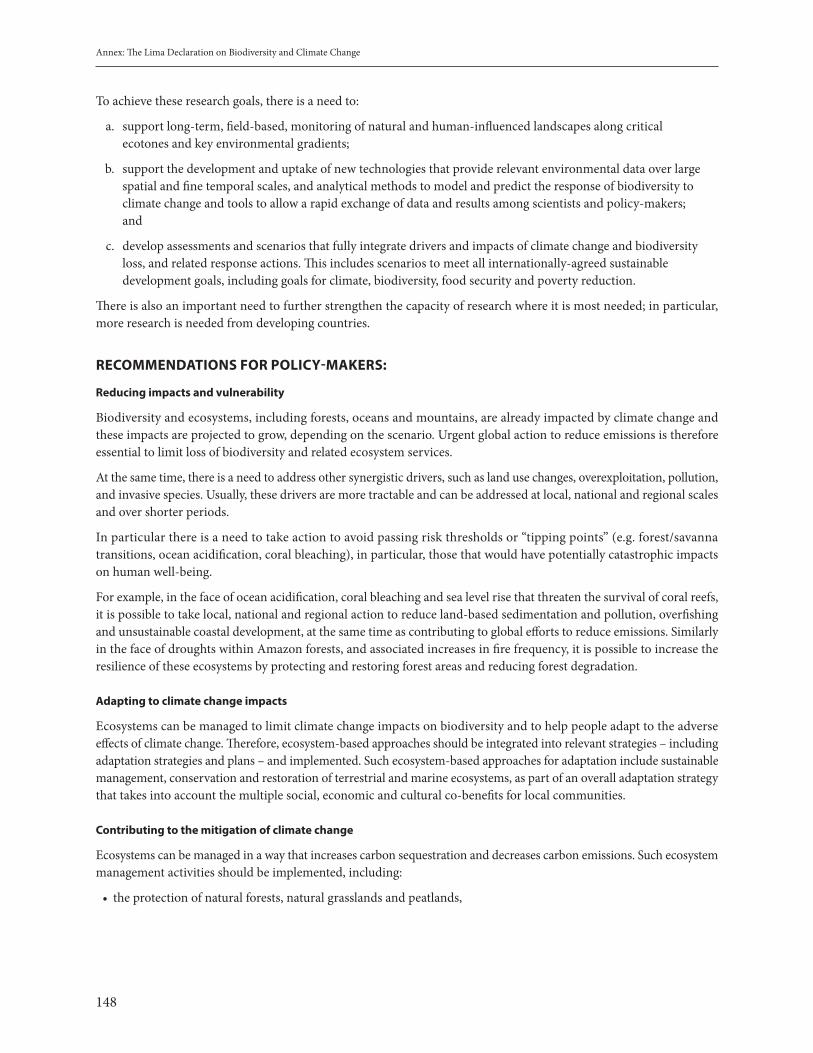
148
Annex: The Lima Declaration on Biodiversity and Climate Change
To achieve these research goals, there is a need to:
a. support long-term, field-based, monitoring of natural and human-influenced landscapes along critical ecotones and key environmental gradients;
b. support the development and uptake of new technologies that provide relevant environmental data over large spatial and fine temporal scales, and analytical methods to model and predict the response of biodiversity to climate change and tools to allow a rapid exchange of data and results among scientists and policy-makers; and
c. develop assessments and scenarios that fully integrate drivers and impacts of climate change and biodiversity loss, and related response actions. This includes scenarios to meet all internationally-agreed sustainable development goals, including goals for climate, biodiversity, food security and poverty reduction.
There is also an important need to further strengthen the capacity of research where it is most needed; in particular, more research is needed from developing countries.
RECOMMENDATIONS FOR POLICY-MAKERS:
Reducing impacts and vulnerability
Biodiversity and ecosystems, including forests, oceans and mountains, are already impacted by climate change and these impacts are projected to grow, depending on the scenario. Urgent global action to reduce emissions is therefore essential to limit loss of biodiversity and related ecosystem services.
At the same time, there is a need to address other synergistic drivers, such as land use changes, overexploitation, pollution, and invasive species. Usually, these drivers are more tractable and can be addressed at local, national and regional scales and over shorter periods.
In particular there is a need to take action to avoid passing risk thresholds or “tipping points” (e.g. forest/savanna transitions, ocean acidification, coral bleaching), in particular, those that would have potentially catastrophic impacts on human well-being.
For example, in the face of ocean acidification, coral bleaching and sea level rise that threaten the survival of coral reefs, it is possible to take local, national and regional action to reduce land-based sedimentation and pollution, overfishing and unsustainable coastal development, at the same time as contributing to global efforts to reduce emissions. Similarly in the face of droughts within Amazon forests, and associated increases in fire frequency, it is possible to increase the resilience of these ecosystems by protecting and restoring forest areas and reducing forest degradation.
Adapting to climate change impacts
Ecosystems can be managed to limit climate change impacts on biodiversity and to help people adapt to the adverse effects of climate change. Therefore, ecosystem-based approaches should be integrated into relevant strategies – including adaptation strategies and plans – and implemented. Such ecosystem-based approaches for adaptation include sustainable management, conservation and restoration of terrestrial and marine ecosystems, as part of an overall adaptation strategy that takes into account the multiple social, economic and cultural co-benefits for local communities.
Contributing to the mitigation of climate change
Ecosystems can be managed in a way that increases carbon sequestration and decreases carbon emissions. Such ecosystem management activities should be implemented, including:
• the protection of natural forests, natural grasslands and peatlands,
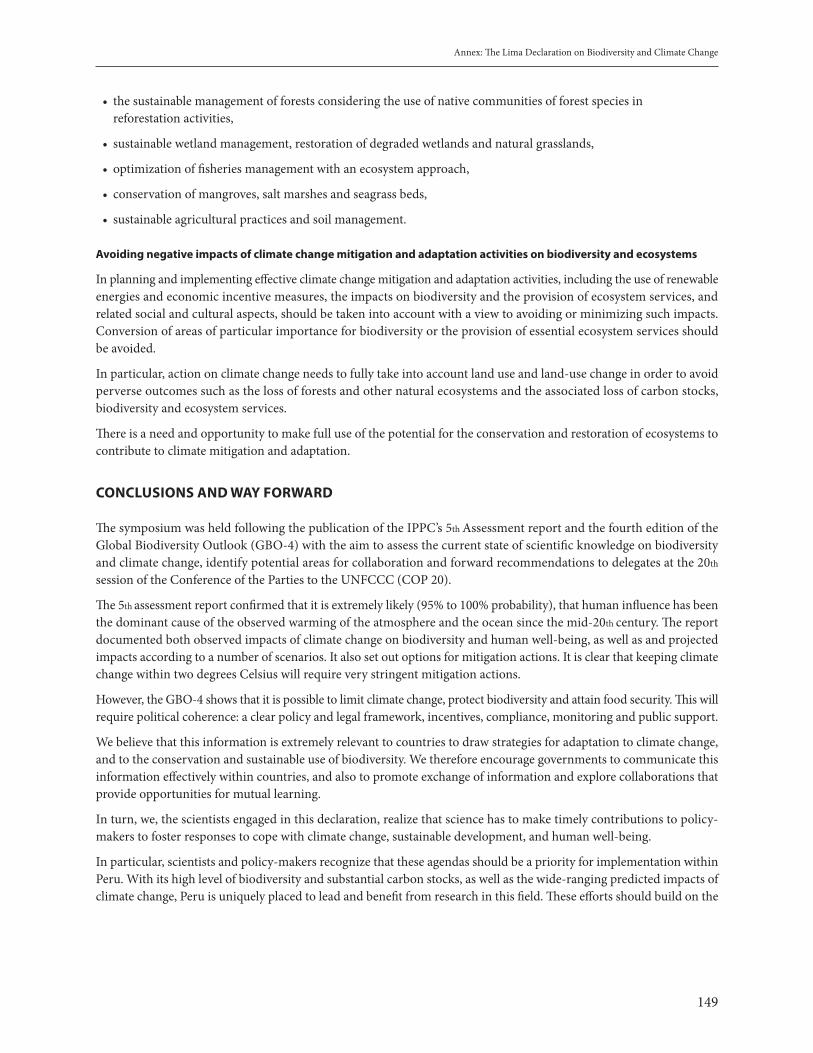
149
Annex: The Lima Declaration on Biodiversity and Climate Change
• the sustainable management of forests considering the use of native communities of forest species in reforestation activities,
• sustainable wetland management, restoration of degraded wetlands and natural grasslands,
• optimization of fisheries management with an ecosystem approach,
• conservation of mangroves, salt marshes and seagrass beds,
• sustainable agricultural practices and soil management.
Avoiding negative impacts of climate change mitigation and adaptation activities on biodiversity and ecosystems
In planning and implementing effective climate change mitigation and adaptation activities, including the use of renewable energies and economic incentive measures, the impacts on biodiversity and the provision of ecosystem services, and related social and cultural aspects, should be taken into account with a view to avoiding or minimizing such impacts. Conversion of areas of particular importance for biodiversity or the provision of essential ecosystem services should be avoided.
In particular, action on climate change needs to fully take into account land use and land-use change in order to avoid perverse outcomes such as the loss of forests and other natural ecosystems and the associated loss of carbon stocks, biodiversity and ecosystem services.
There is a need and opportunity to make full use of the potential for the conservation and restoration of ecosystems to contribute to climate mitigation and adaptation.
CONCLUSIONS AND WAY FORWARD
The symposium was held following the publication of the IPPC’s 5th Assessment report and the fourth edition of the Global Biodiversity Outlook (GBO-4) with the aim to assess the current state of scientific knowledge on biodiversity and climate change, identify potential areas for collaboration and forward recommendations to delegates at the 20th
session of the Conference of the Parties to the UNFCCC (COP 20).
The 5th assessment report confirmed that it is extremely likely (95% to 100% probability), that human influence has been the dominant cause of the observed warming of the atmosphere and the ocean since the mid-20th century. The report documented both observed impacts of climate change on biodiversity and human well-being, as well as and projected impacts according to a number of scenarios. It also set out options for mitigation actions. It is clear that keeping climate change within two degrees Celsius will require very stringent mitigation actions.
However, the GBO-4 shows that it is possible to limit climate change, protect biodiversity and attain food security. This will require political coherence: a clear policy and legal framework, incentives, compliance, monitoring and public support.
We believe that this information is extremely relevant to countries to draw strategies for adaptation to climate change, and to the conservation and sustainable use of biodiversity. We therefore encourage governments to communicate this information effectively within countries, and also to promote exchange of information and explore collaborations that provide opportunities for mutual learning.
In turn, we, the scientists engaged in this declaration, realize that science has to make timely contributions to policy-makers to foster responses to cope with climate change, sustainable development, and human well-being.
In particular, scientists and policy-makers recognize that these agendas should be a priority for implementation within Peru. With its high level of biodiversity and substantial carbon stocks, as well as the wide-ranging predicted impacts of climate change, Peru is uniquely placed to lead and benefit from research in this field. These efforts should build on the

150
Annex: The Lima Declaration on Biodiversity and Climate Change
substantial human and institutional capacity across academic, civil society and government sectors that span the full range of marine and terrestrial biomes.
This is a special endeavor to create synergies among research communities and policy-makers and we are grateful to the government of Peru for this opportunity to promote the needed dialogue; The CBD secretariat, international cooperation agencies, such as the GIZ, and inter-governmental scientific research organizations such as the Inter-American Institute for Global Change Research (IAI) are ready to expand the networking and linkages among disciplines, as well as between the science and policy sectors, and truly hope that the dialogue will be taken as a useful example.

151
Annex: The Lima Declaration on Biodiversity and Climate Change
DECLARACIÓN DE LIMA 2014 SOBRE CIENCIA DE LA BIODIVERSIDAD Y EL CAMBIO CLIMÁTICO De la ciencia a los responsables de políticas, para el desarrollo sostenible
los días 27 y 28 de noviembre de 2014, a la vera de la vigésima Conferencia de las Partes de la CMNUCC, un grupo internacional de científicos, invitados por el Ministerio del Ambiente del Perú, el Consejo Nacional de Ciencia y Tecnología y la Secretaría del Convenio sobre Diversidad Biológica, con el apoyo del Instituto Interamericano para la Investigación del Cambio Global (IAI) y la Agencia Alemana de Cooperación Internacional (GIZ), se reunió para analizar los resultados de sus investigaciones recientes y debatir con los encargados de políticas acerca de las implicaciones de su trabajo para la acción en materia de biodiversidad y cambio climático en las escalas nacional, regional y global.
RESULTADOS:
Las conclusiones científicas tienen que ver en primer lugar con la naturaleza de las amenazas – los impactos del cambio climático en la biodiversidad, cómo influye ésta en la vulnerabilidad al cambio climático o la resiliencia de los ecosistemas, las técnicas para evaluar el riesgo de extinción de especies y comunidades, cómo puede la actividad humana exacerbar los impactos del cambio climático y las tecnologías disponibles para medir y reportar dichos cambios. En segundo lugar, las conclusiones abordan las soluciones dirigidas a incrementar las reservas de carbono, conservar la biodiversidad y contribuir al bienestar humano mediante la restauración de los ecosistemas, los acercamientos a la conservación desde el nivel de comunidad, los incentivos para promover prácticas sostenibles de uso del suelo y marcos de políticas coherentes.
Específicamente, el trabajo presentado en la conferencia demuestra que:
• La biodiversidad puede incrementar la resiliencia de la estructura ecosistémica a los cambios ambientales, tales como las sequías prolongadas.
• Sin embargo, la diversidad biológica está sufriendo alteraciones a través de numerosos grupos taxonómicos y biomas diferentes, que incluyen las montañas, los océanos y los bosques, como consecuencia de una gran variedad de cambios ambientales, tales como el aumento de la temperatura o el incremento en la frecuencia de inundaciones y sequías extremas
• Se ha demostrado repetidamente que los cambios ambientales y las perturbaciones en los ecosistemas, incluyendo la pérdida de diversidad biológica, aumentan el riesgo para la población ante enfermedades zoonóticas y otras enfermedades emergentes, así como de especies salvajes que ponen en peligro a las personas, la ganadería y la agricultura
• Actividades humanas directas, como por ejemplo la caza, pueden exacerbar los efectos del cambio climático en la diversidad biológica
• Un manejo sostenible eficaz requiere entender las dimensiones ecológicas y socioeconómicas del problema, así como políticas coherentes en todos los niveles de gobierno
• Entre las posibles soluciones se cuentan los proyectos comunitarios que ofrezcan beneficios económicos o de otro tipo, proyectos de restauración cuidadosamente diseñados, e/o incentivos adecuados para promover prácticas ecológicamente sostenibles para el uso del suelo.
RECOMENDACIONES PARA FUTURAS INVESTIGACIONES:
En cuanto a las recomendaciones para futuros trabajos de investigación, el simposio identificó la necesidad de:
a. ainvestigaciones multidisciplinarias de los vínculos entre la biodiversidad y el cambio climático y los factores socioeconómicos que impactan en alguno de ellos o en ambos;

152
Annex: The Lima Declaration on Biodiversity and Climate Change
b. investigaciones de la resiliencia de los servicios ecosistémicos tales como el almacenamiento de carbono y los recursos alimentarios ante las variaciones en la diversidad biológica en condiciones de cambio climático
c. mejores métodos de predicción de la vulnerabilidad de especies y comunidades al cambio climático
d. recomendaciones basadas en evidencias respecto de las características de los proyectos de conservación exitosos que promueven el incremento en las reservas de carbono, conservan la diversidad biológica y contribuyen al bienestar humano.
Para alcanzar estos objetivos de investigación es necesario:
a. apoyar el monitoreo de largo plazo y basado en observaciones directas de los paisajes naturales y aquellos afectados por el hombre a lo largo de ecotonos críticos y gradientes ambientales clave
b. apoyar el desarrollo y la apropiación de nuevas tecnologías que ofrezcan datos ambientales pertinentes sobre grandes superficies y pasos temporales pequeños, métodos analíticos para modelar y predecir la respuesta de la biodiversidad al cambio climático y herramientas que permitan un rápido intercambio de datos y resultados entre científicos y encargados de políticas
c. elaborar evaluaciones y escenarios de integren de manera integral los impulsores e impactos del cambio climático y la pérdida de biodiversidad, y las acciones de respuesta relacionadas. Esto incluye que los escenarios cumplan todas las metas de desarrollo sostenible acordadas internacionalmente, incluyendo las metas para el clima, la diversidad biológica, la seguridad alimentaria y la reducción de la pobreza.
Existe también la importante necesidad de continuar fortaleciendo la capacidad de investigación donde más se necesita; en especial, hacen falta más trabajos de investigación que provengan de los países en desarrollo
RECOMENDACIONES PARA ENCARGADOS DE POLÍTICAS:
Reduciendo los impactos y la vulnerabilidad
Los diversidad biológica y los ecosistemas, incluyendo bosques, océanos y montañas, ya están sufriendo los impactos del cambio climático, y las proyecciones indican que dichos impactos se intensificarán, dependiendo del escenario. Es por ello que se requieren acciones globales urgentes para reducir las emisiones y así limitar la pérdida de biodiversidad y los servicios ecosistémicos asociados.
Al mismo tiempo, es necesario tomar en consideración otros impulsores sinérgicos, como los cambios en el uso del suelo, la sobreexplotación, la contaminación y las especies invasoras. En general, estos impulsores suelen ser más fáciles de controlar y pueden tratarse en escalas locales, nacionales y regionales y en plazos más breves.
En particular, es necesario emprender acciones para evitar traspasar umbrales de riesgo o “puntos de inflexión” (por ejemplo, la transición bosque/sabana, la acidificación de los océanos, el blanqueo de coral), en particular, aquellos que potencialmente tendrían impactos catastróficos en el bienestar humano.
Por ejemplo, ante la acidificación de los océanos, el blanqueo de coral y el aumento del nivel del mar que amenazan la supervivencia de los arrecifes coralinos, es posible actuar en el nivel local, nacional y regional para reducir la sedimentación y contaminación provenientes de tierra, la sobrepesca y el desarrollo costero no sostenible, al tiempo que se contribuye a los esfuerzos mundiales por reducir las emisiones. De manera similar, ante las sequías que tienen lugar en la selva amazónica y el incremento asociado en la frecuencia de incendios, es posible aumentar la resiliencia ecosistémica mediante la protección y restauración de las áreas forestales y la reducción de la degradación forestal.
Adaptándose a los impactos del cambio climático
Es posible manejar los ecosistemas para limitar los impactos del cambio climático en la biodiversidad y ayudar a las sociedades a adaptarse a los efectos adversos del cambio climático. Por eso, es necesario incorporar enfoques ecosistémicos en las estrategias pertinentes –incluyendo las estrategias y los planes de adaptación- y ponerlas en marcha. Entre los
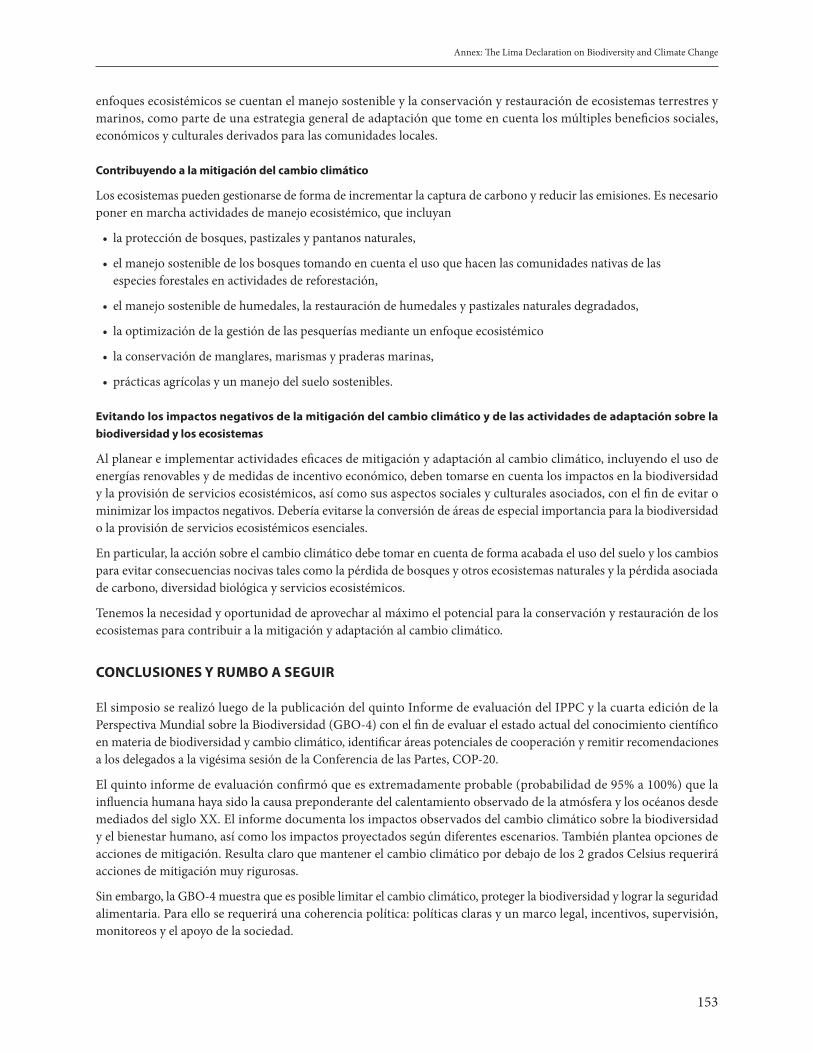
153
Annex: The Lima Declaration on Biodiversity and Climate Change
enfoques ecosistémicos se cuentan el manejo sostenible y la conservación y restauración de ecosistemas terrestres y marinos, como parte de una estrategia general de adaptación que tome en cuenta los múltiples beneficios sociales, económicos y culturales derivados para las comunidades locales.
Contribuyendo a la mitigación del cambio climático
Los ecosistemas pueden gestionarse de forma de incrementar la captura de carbono y reducir las emisiones. Es necesario poner en marcha actividades de manejo ecosistémico, que incluyan
• la protección de bosques, pastizales y pantanos naturales,
• el manejo sostenible de los bosques tomando en cuenta el uso que hacen las comunidades nativas de las especies forestales en actividades de reforestación,
• el manejo sostenible de humedales, la restauración de humedales y pastizales naturales degradados,
• la optimización de la gestión de las pesquerías mediante un enfoque ecosistémico
• la conservación de manglares, marismas y praderas marinas,
• prácticas agrícolas y un manejo del suelo sostenibles.
Evitando los impactos negativos de la mitigación del cambio climático y de las actividades de adaptación sobre la biodiversidad y los ecosistemas
Al planear e implementar actividades eficaces de mitigación y adaptación al cambio climático, incluyendo el uso de energías renovables y de medidas de incentivo económico, deben tomarse en cuenta los impactos en la biodiversidad y la provisión de servicios ecosistémicos, así como sus aspectos sociales y culturales asociados, con el fin de evitar o minimizar los impactos negativos. Debería evitarse la conversión de áreas de especial importancia para la biodiversidad o la provisión de servicios ecosistémicos esenciales.
En particular, la acción sobre el cambio climático debe tomar en cuenta de forma acabada el uso del suelo y los cambios para evitar consecuencias nocivas tales como la pérdida de bosques y otros ecosistemas naturales y la pérdida asociada de carbono, diversidad biológica y servicios ecosistémicos.
Tenemos la necesidad y oportunidad de aprovechar al máximo el potencial para la conservación y restauración de los ecosistemas para contribuir a la mitigación y adaptación al cambio climático.
CONCLUSIONES Y RUMBO A SEGUIR
El simposio se realizó luego de la publicación del quinto Informe de evaluación del IPPC y la cuarta edición de la Perspectiva Mundial sobre la Biodiversidad (GBO-4) con el fin de evaluar el estado actual del conocimiento científico en materia de biodiversidad y cambio climático, identificar áreas potenciales de cooperación y remitir recomendaciones a los delegados a la vigésima sesión de la Conferencia de las Partes, COP-20.
El quinto informe de evaluación confirmó que es extremadamente probable (probabilidad de 95% a 100%) que la influencia humana haya sido la causa preponderante del calentamiento observado de la atmósfera y los océanos desde mediados del siglo XX. El informe documenta los impactos observados del cambio climático sobre la biodiversidad y el bienestar humano, así como los impactos proyectados según diferentes escenarios. También plantea opciones de acciones de mitigación. Resulta claro que mantener el cambio climático por debajo de los 2 grados Celsius requerirá acciones de mitigación muy rigurosas.
Sin embargo, la GBO-4 muestra que es posible limitar el cambio climático, proteger la biodiversidad y lograr la seguridad alimentaria. Para ello se requerirá una coherencia política: políticas claras y un marco legal, incentivos, supervisión, monitoreos y el apoyo de la sociedad.

154
Annex: The Lima Declaration on Biodiversity and Climate Change
Creemos que esta información es extremadamente relevante para que los países definan estrategias de adaptación al cambio climático y para la conservación y uso sostenible de la biodiversidad. Por lo tanto alentamos a los gobiernos a comunicar de manera efectiva esta comunicación al interior de los países, a promover el intercambio de información y a explorar cooperaciones que ofrezcan oportunidades de aprendizaje mutuo.
A su vez, los científicos involucrados en esta declaración saben que la ciencia debe hacer aportes oportunos a los encargados de políticas para promover la adopción de respuestas para hacer frente al cambio climático, el desarrollo sostenible y el bienestar humano.
En particular, los científicos y encargados de políticas reconocen que dichas agendas deben implementarse con prioridad en Perú. Con su alto nivel de biodiversidad y las importantes reservas de carbono, así como la gran variedad de impactos pronosticados del cambio climático, Perú se encuentra en una posición única para encabezar la investigación en este campo y beneficiarse de ella. Estos esfuerzos deben apoyarse en las sólidas capacidades humanas e institucionales de los sectores académico, gubernamental y de la sociedad civil que abarcan la variedad completa de biomas marinos y terrestres.
Este es un emprendimiento especial dirigido a crear sinergias entre las comunidades científicas y los encargados de políticas y estamos agradecidos con el Gobierno de Perú por la oportunidad de promover este diálogo necesario. La Secretaría del CDB, agencias de cooperación internacional, tales como GIZ, y organizaciones intergubernamentales de investigación científica, como el Instituto Interamericano para la Investigación del Cambio Global (IAI) están dispuestas para ampliar las redes y conexiones entre disciplinas, así como entre los sectores científico y político, y esperan sinceramente que este diálogo constituya un ejemplo útil.

