the l3pilot data management toolchain for a level 3
TRANSCRIPT
The L3Pilot Data Management Toolchain for a Level 3 VehicleAutomation Pilot
Downloaded from: https://research.chalmers.se, 2022-04-05 02:45 UTC
Citation for the original published paper (version of record):Hiller, J., Koskinen, S., Berta, R. et al (2020)The L3Pilot Data Management Toolchain for a Level 3 Vehicle Automation PilotELECTRONICS, 9(5)http://dx.doi.org/10.3390/electronics9050809
N.B. When citing this work, cite the original published paper.
research.chalmers.se offers the possibility of retrieving research publications produced at Chalmers University of Technology.It covers all kind of research output: articles, dissertations, conference papers, reports etc. since 2004.research.chalmers.se is administrated and maintained by Chalmers Library
(article starts on next page)

electronics
Article
The L3Pilot Data Management Toolchain for a Level 3Vehicle Automation Pilot
Johannes Hiller 1 , Sami Koskinen 2, Riccardo Berta 3 , Nisrine Osman 3 , Ben Nagy 4,Francesco Bellotti 3,* , Ashfaqur Rahman 4, Erik Svanberg 5, Hendrik Weber 1,Eduardo H. Arnold 6 , Mehrdad Dianati 6 and Alessandro De Gloria 3
1 Institute for Automotive Engineering, RWTH Aachen University, Steinbachstr. 7, 52074 Aachen, Germany;[email protected] (J.H.); [email protected] (H.W.)
2 Automated Vehicles, VTT Technical Research Centre of Finland Ltd, Visiokatu 4, 33720 Tampere, Finland;[email protected]
3 Department of Electrical, Electronics and Telecommunication Engineering and Naval Architecture (DITEN),University of Genova, 16145 Genova, Italy; [email protected] (R.B.);[email protected] (N.O.); [email protected] (A.D.G.)
4 Assisted & Automated Driving, Jaguar Land Rover, Gaydon CV35 0RR, UK; [email protected] (B.N.);[email protected] (A.R.)
5 SAFER, Chalmers University of Technology, 417 56 Göteborg, Sweden; [email protected] Warwick Manufacturing Group (WMG), University of Warwick, Coventry CV4 7AL, UK;
[email protected] (E.H.A.); [email protected] (M.D.)* Correspondence: [email protected]
Received: 2 April 2020; Accepted: 11 May 2020; Published: 15 May 2020
Abstract: As industrial research in automated driving is rapidly advancing, it is of paramountimportance to analyze field data from extensive road tests. This paper investigates the design anddevelopment of a toolchain to process and manage experimental data to answer a set of researchquestions about the evaluation of automated driving functions at various levels, from technicalsystem functioning to overall impact assessment. We have faced this challenge in L3Pilot, the firstcomprehensive test of automated driving functions (ADFs) on public roads in Europe. L3Pilotis testing ADFs in vehicles made by 13 companies. The tested functions are mainly of Society ofAutomotive Engineers (SAE) automation level 3, some of them of level 4. In this context, the presentedtoolchain supports various confidentiality levels, and allows cross-vehicle owner seamless datamanagement, with the efficient storage of data and their iterative processing with a variety of analysisand evaluation tools. Most of the toolchain modules have been developed to a prototype version in adesktop/cloud environment, exploiting state-of-the-art technology. This has allowed us to efficientlyset up what could become a comprehensive edge-to-cloud reference architecture for managing datain automated vehicle tests. The project has been released as open source, the data format into whichall vehicular signals, recorded in proprietary formats, were converted, in order to support efficientprocessing through multiple tools, scalability and data quality checking. We expect that this formatshould enhance research on automated driving testing, as it provides a shared framework for dealingwith data from collection to analysis. We are confident that this format, and the information providedin this article, can represent a reference for the design of future architectures to implement in vehicles.
Keywords: automated vehicles; field operational tests; edge-to-cloud architectures; referencearchitecture; big data; data toolchain; Internet of things; IoT
Electronics 2020, 9, 809; doi:10.3390/electronics9050809 www.mdpi.com/journal/electronics
Electronics 2020, 9, 809 2 of 17
1. Introduction
Automated driving represents a challenging frontier for embedded systems, with an ever-widerinterest rising among academia and industry in terms of sensors, devices, algorithms and developmentframeworks, in a pervasive continuum from the edge to the cloud (e.g., [1–4]). In this rapidly advancingresearch and development process, it is of paramount importance to analyze field data from road tests.Not only do tests support performance assessment and spot technical issues and indicate possiblesolutions [5], but they also reveal user behavior and acceptance, which is a key factor in designinguseful and successful products.
The big challenge represented by automated driving has drawn vehicle manufacturers to joinforces to face pre-competitive research both on specific aspects and in wider, more general pilot projects.The L3Pilot research project aims at testing the viability of automated driving as a safe and efficientmeans of transportation on public roads. It focuses on large-scale piloting of Society of AutomotiveEngineers (SAE) Level 3 functions, with an additional assessment of some Level 4 functions [6], with agoal of laying the foundation for the design of future, user-accepted, L3 and L4 systems. The systemsare being exposed to variable conditions in hundreds of trips on vehicles by 13 vehicle owners across10 European countries. In L3Pilot, vehicle owners are the companies that perform tests on a vehicleprototype: either an original equipment manufacturer (OEM) (the project includes 10 OEMs), a supplieror a research facility. The tests cover a wide range of driving scenarios, including parking, overtakingon highways and driving through urban intersections. The tests are expected to provide valuable datafor evaluating technical aspects, user acceptance, as well as impact on traffic and safety. The projectintends also to create a large databank to enable simulation studies of the performance of automateddriving (AD) over time, which can’t be investigated in road tests, due to the time and effort needed.
For such large test campaigns projects, efficiently and effectively dealing with data is of paramountimportance. The scientific literature has already provided an account of data management in large-scaleautomotive research projects (e.g., [7]), however, this information needs to be updated in the lightof the evolution of the automated functions and of the data processing and management tools andarchitectures (e.g., cloud computing [8]). In this context, we are particularly interested in understandinghow to design and develop a data management toolchain for automotive test data (both qualitativeand quantitative, both vehicular and subjective), with a goal to support a wide spectrum researchinvestigation. The toolchain should be used by various stakeholders and owners, with strong privacyand intellectual property (IP) requirements.
This paper describes the methodology and the toolchain we have designed in order to managedata throughout the whole project. The L3Pilot toolchain has been implemented in a desktop/cloudenvironment, exploiting state-of-the-art technology. We believe that this step is necessary, in order toefficiently set up a comprehensive reference system architecture. However, we also expect that part ofthis implementation will smoothly pass towards the edge, exploiting the well-known benefits of edgeprocessing [9], and we hope that our experience may be useful to define effective specifications andsupport development in an automotive embedded environment.
The remainder of the article is organized as follows. Section 2 provides a short overview ofrelated works, while Section 3 introduces the design methodology, and Section 4 introduces the L3Pilotreference system architecture. Section 5 focuses on the common data format designed in order tosupport portability. Section 6 goes in detail of the data processing, while Section 7 presents thesubjective data tool to perform user acceptance analysis. Section 8 illustrates the database storingaggregated data from all the pilot sites, while Section 9 presents and discuss achievements after thepre-pilot (i.e., preparatory tests). Conclusions are finally drawn in Section 10.
2. Related Work
Data acquisition and telemetry are key factors for quality and performance in vehicle developmentand management [10]. The euroFOT project already used small built-in devices with flash storage andGPRS network connection to remotely track and upload data during field operational tests (FOT) [11].

Electronics 2020, 9, 809 3 of 17
Recently, connectivity has been introduced in automotive production series, making vehicles highlymobile nodes in the Internet of Things (IoT) paradigm. In this context, [12] presents the CommonVehicle Information Model as a harmonized data model, allowing a common understanding andgeneric representation, brand-independent throughout the whole data value and processing chain.Since the volume of data collected from fleets of vehicles using telematics services can be very high, it isimportant to design the systems and frameworks to support scalability and efficiency, [13] explore theopportunities of leveraging Big Automotive Data for knowledge-driven product development, and topresent a technological framework for capturing data from connected vehicles and analyzing it online.
Concerning the data format, [14] describes an approach to combine standards specified for theautomotive test data management with the widely used Unified Modelling Language (UML).
Over the past decade, a large number of FOTs have been conducted to test Intelligent TransportSystems in real traffic conditions with thousands of drivers (e.g., euroFOT [15], which also investigatedwhether automatic video processing could improve naturalistic data analyses [16]). In order to ensurescientifically sound studies, the Field opErational teSt supporT Action (FESTA) project developed amethodology for FOTs, mainly centered on three focuses: the user, the vehicle or the context [17]. L3Pilotdecided to follow this methodology, which has been used by several European FOTs in the last ten years.The main handbook has been periodically updated by the FOT-Net community, capturing lessonslearned and documenting best practices. L3Pilot intends to offer experiences and recommendations tofuture pilot projects and FOTs, especially considering the Data Sharing Framework [18].
Several collaborative industrial research projects have been conducted in Europe concerning thefirst levels of driving automation. The AdaptIVe project developed several automated functions offeringdifferent levels of assistance, including partial, conditional and high automation [19]. Drive C2Xinvestigated cooperative awareness enabled by periodic message exchange between vehicles androadside infrastructure [20]. The FOT-Net Data project prepared a Data Sharing Framework, includinghands-on recommendations on how to prepare for and perform data sharing of transport researchdata [7]. TEAM developed a set of apps for collaborative mobility [21].
3. Methodology
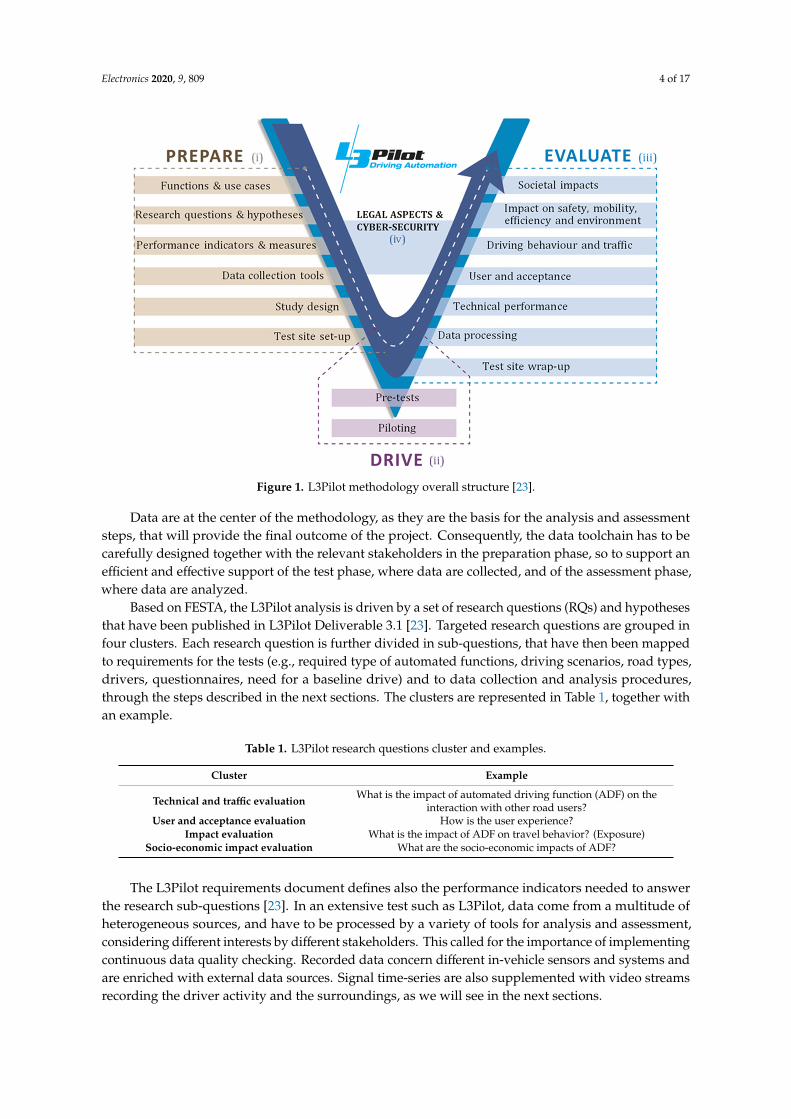
A fundamental step in the design of a system for a complex project, combining human andtechnological aspects, is given by the definition of the methodology, which shapes all the phasesof an FOT project. As several FOTs have been conducted in Europe in recent years, the FESTAmethodology has established itself as a reference [17,22]. The FESTA approach gives general guidanceon organizational issues, methodology and procedures, data acquisition and storage and evaluationfor FOTs. FESTA covers the whole process of planning, preparing, executing, analyzing and reportingan FOT. The steps that need to be carried out during an FOT are graphically presented in the formof a V diagram, where there is correspondence between the levels on the left-hand side (concerningthe “preparation” of the FOT) and right-hand side (concerning the “analysis” or “evaluation”).)Figure 1 shows the L3Pilot FESTA methodology implementation [23]. The left side of the V descendsfrom definition of functions and use cases, down to research questions and hypotheses, performanceindicators and measures, data collection tools and pilot site set-up. The bottom of the V (concerning the“use”, which is “drive” in L3Pilot) is represented by data acquisition during tests. In L3Pilot, the drivephase consists of two parts: pre-tests (or pre-pilots) and tests (or pilots). The pre-tests period takesplace before large-scale user tests can safely and confidently begin. During pre-testing, e.g., functionperformance is honed and data collection processes tested. Traditionally, in FOT terminology, thepre-testing would be called piloting. Finally, the right side rises mirroring the left side: data processing,data analysis to answer research questions on technical performance, user acceptance and behavior,impact on traffic and mobility, up to societal impacts. The methodology allows considering, at differentlevels, the point of view of different stakeholders, such as politics, industry, research.
Electronics 2020, 9, 809 4 of 17Electronics 2020, 9, x FOR PEER REVIEW 4 of 18
Figure 1. L3Pilot methodology overall structure [23].
Data are at the center of the methodology, as they are the basis for the analysis and assessment steps, that will provide the final outcome of the project. Consequently, the data toolchain has to be carefully designed together with the relevant stakeholders in the preparation phase, so to support an efficient and effective support of the test phase, where data are collected, and of the assessment phase, where data are analyzed.
Based on FESTA, the L3Pilot analysis is driven by a set of research questions (RQs) and hypotheses that have been published in L3Pilot Deliverable 3.1 [23]. Targeted research questions are grouped in four clusters. Each research question is further divided in sub-questions, that have then been mapped to requirements for the tests (e.g., required type of automated functions, driving scenarios, road types, drivers, questionnaires, need for a baseline drive) and to data collection and analysis procedures, through the steps described in the next sections. The clusters are represented in Table 1, together with an example.
Table 1. L3Pilot research questions cluster and examples.
Cluster Example Technical and traffic
evaluation What is the impact of automated driving function (ADF) on the
interaction with other road users? User and acceptance
evaluation How is the user experience?
Impact evaluation What is the impact of ADF on travel behavior? (Exposure) Socio-economic impact
evaluation What are the socio-economic impacts of ADF?
The L3Pilot requirements document defines also the performance indicators needed to answer the research sub-questions [23]. In an extensive test such as L3Pilot, data come from a multitude of heterogeneous sources, and have to be processed by a variety of tools for analysis and assessment, considering different interests by different stakeholders. This called for the importance of implementing continuous data quality checking. Recorded data concern different in-vehicle sensors and systems and are enriched with external data sources. Signal time-series are also supplemented
Figure 1. L3Pilot methodology overall structure [23].
Data are at the center of the methodology, as they are the basis for the analysis and assessmentsteps, that will provide the final outcome of the project. Consequently, the data toolchain has to becarefully designed together with the relevant stakeholders in the preparation phase, so to support anefficient and effective support of the test phase, where data are collected, and of the assessment phase,where data are analyzed.
Based on FESTA, the L3Pilot analysis is driven by a set of research questions (RQs) and hypothesesthat have been published in L3Pilot Deliverable 3.1 [23]. Targeted research questions are grouped infour clusters. Each research question is further divided in sub-questions, that have then been mappedto requirements for the tests (e.g., required type of automated functions, driving scenarios, road types,drivers, questionnaires, need for a baseline drive) and to data collection and analysis procedures,through the steps described in the next sections. The clusters are represented in Table 1, together withan example.
Table 1. L3Pilot research questions cluster and examples.
Cluster Example
Technical and traffic evaluation What is the impact of automated driving function (ADF) on theinteraction with other road users?
User and acceptance evaluation How is the user experience?Impact evaluation What is the impact of ADF on travel behavior? (Exposure)
Socio-economic impact evaluation What are the socio-economic impacts of ADF?
The L3Pilot requirements document defines also the performance indicators needed to answerthe research sub-questions [23]. In an extensive test such as L3Pilot, data come from a multitude ofheterogeneous sources, and have to be processed by a variety of tools for analysis and assessment,considering different interests by different stakeholders. This called for the importance of implementingcontinuous data quality checking. Recorded data concern different in-vehicle sensors and systems andare enriched with external data sources. Signal time-series are also supplemented with video streamsrecording the driver activity and the surroundings, as we will see in the next sections.

Electronics 2020, 9, 809 5 of 17
4. Test Data Management System Architecture
The first step in system design consisted in defining the workflow to support. L3Pilot deals witha complex data flow, because of the quantity and variety of data and stakeholders. Vehicle ownersare interested in an in-depth analysis of their own data. This analysis should be complete and,for obvious confidentiality concerns, restricted. The consortium, on the other hand, is interestedin answering to the RQs, assessing the overall impact of SAE level 3/4 ADFs, without consideringdifferences in performance among the different manufacturers. Finally, a part of the data is to be madeavailable publicly.
Due to competitive and secretive phase of current production development, the collected datasetsare not shared as full within the consortium. Only indicators that are seen reasonably free ofproduct-level confidentiality are shared. The restriction is not a huge limitation, since high-level impactanalysis does not necessarily need the raw vehicular data time-series, but can work on statisticalsynthesis values. L3Pilot has not yet decided on which parts and how exactly the datasets could beaccessed publicly. Summary indicators at project level, for which reasonable anonymity can be ensuredand agreed, are currently seen to become available. Even more detailed datasets might be possible toaccess by making a non-disclosure agreement with the dataset owner. The data chain should thusenable collaborative evaluation activities in the current competitive ADF development framework.
Based on these requirements, the project designed a multi-layer data processing flow, beginningwith raw data acquisition from the vehicles and ending with the analysis and display of the results [24].Figure 2 shows an outlook of this process, which will be detailed in the remainder of this article.
Electronics 2020, 9, x FOR PEER REVIEW 6 of 18
Figure 2. High-level schema of the overall L3Pilot data management architecture.
5. Data Logging, Conversion to the Common Format and Storage in HDF5 Files
A fundamental design choice was to define a common format for all the data processed in the project, to be agreed and shared by all the project partners. This choice was deemed necessary in order to facilitate the processing of data and the analysis, by allowing a common processing of heterogeneous source data. The L3Pilot Common Data Format (CDF), which is detailed in the following sub-sections, makes it possible to use a comprehensive toolchain for all analysis steps, following the transfer of data from the vehicle owner to an analysis partner [25]. To the best of our knowledge, this is the first time that such a big automotive consortium defined and released as open source—a common data format for processing information about automated driving.
From a methodological viewpoint, the format emerged as a combination of a bottom-up approach, stemming from the need to include all the signals necessary to answer the project’s RQs, and of a top-down approach, due to the need for generalizing and abstracting the data structure for future projects.
5.1. Common Data Format
The first step in the data management chain consists of logging data, in a proprietary format, from the vehicular communication buses. Logged data are then converted in the L3Pilot CDF. Conversion is done through MATLAB, Python or C++ scripts. One file is produced for every test trip, which contains all the information related to that trip, apart from the videos recorded by the several cameras installed in a vehicle (front camera, driver face and upper body, driver hands, driver feet).
We decided to store the converted data in HDF5 [26], a binary file format characterized by its ability to contain and compress large and complex structured data [27]. HDF5 also includes a data model and software libraries for storing and managing data. Through the compression, HDF5 enables portability, so facilitating the transfer of large amounts of data. HDF5 supports various programming languages, one of them being Python, which is important for exploiting the rising potential within artificial intelligence (e.g., for automatic scene detection and video data annotation). An .h5 file can be extracted to a set of .csv files and, vice-versa, several tables (or .csv files) can be combined into one .h5 file. The benefit over .mat is in the wider selection of supported tools. In L3Pilot, an .h5 file is organized as an extensible set of datasets. Table 2 provides a brief description of the datasets, together with some signal examples. In each dataset, data (listed in columns) are
Figure 2. High-level schema of the overall L3Pilot data management architecture.
Figure 2 highlights four layers which correspond to different levels of data access and confidentiality.The left-most one is the vehicle owner layer, involving proprietary data logged from the vehicle.Filtered data, according to the vehicle owner confidentiality requirements and policies, are thenconverted to a common data format, in order to tackle the variety of proprietary data sources, andsupport the processing through the different tools made available by the analysis and evaluationpartners, as described in the next sections. After translation into the common format, these data aremade available to an “analysis partner”, a selected project partner (one or more for each vehicle owner)who supports the data owner in a detailed, and restricted, analysis. The minimal set of tasks fora “selected partner” concern video data annotation, data quality checking and execution of scriptsfor extraction of indicators and events (these tasks are illustrated in the next sections). But suchpartners are also consulted on test procedures, analysis of signal quality and verification of driving
Electronics 2020, 9, 809 6 of 17
scenario detection (e.g., uninfluenced driving, following a lead vehicle, etc.). The third layer involvesaggregating data for higher level analyses, and feeds into the de-identified The consolidated database(CDB) is described in Section 7. The fourth step consists in further filtering and aggregating data to bemade available publicly.
5. Data Logging, Conversion to the Common Format and Storage in HDF5 Files
A fundamental design choice was to define a common format for all the data processed in theproject, to be agreed and shared by all the project partners. This choice was deemed necessary in orderto facilitate the processing of data and the analysis, by allowing a common processing of heterogeneoussource data. The L3Pilot Common Data Format (CDF), which is detailed in the following sub-sections,makes it possible to use a comprehensive toolchain for all analysis steps, following the transfer of datafrom the vehicle owner to an analysis partner [25]. To the best of our knowledge, this is the first timethat such a big automotive consortium defined and released as open source—a common data formatfor processing information about automated driving.
From a methodological viewpoint, the format emerged as a combination of a bottom-up approach,stemming from the need to include all the signals necessary to answer the project’s RQs, andof a top-down approach, due to the need for generalizing and abstracting the data structure forfuture projects.
5.1. Common Data Format
The first step in the data management chain consists of logging data, in a proprietary format, fromthe vehicular communication buses. Logged data are then converted in the L3Pilot CDF. Conversion isdone through MATLAB, Python or C++ scripts. One file is produced for every test trip, which containsall the information related to that trip, apart from the videos recorded by the several cameras installedin a vehicle (front camera, driver face and upper body, driver hands, driver feet).
We decided to store the converted data in HDF5 [26], a binary file format characterized by itsability to contain and compress large and complex structured data [27]. HDF5 also includes a datamodel and software libraries for storing and managing data. Through the compression, HDF5 enablesportability, so facilitating the transfer of large amounts of data. HDF5 supports various programminglanguages, one of them being Python, which is important for exploiting the rising potential withinartificial intelligence (e.g., for automatic scene detection and video data annotation). An .h5 file can beextracted to a set of .csv files and, vice-versa, several tables (or .csv files) can be combined into one.h5 file. The benefit over .mat is in the wider selection of supported tools.
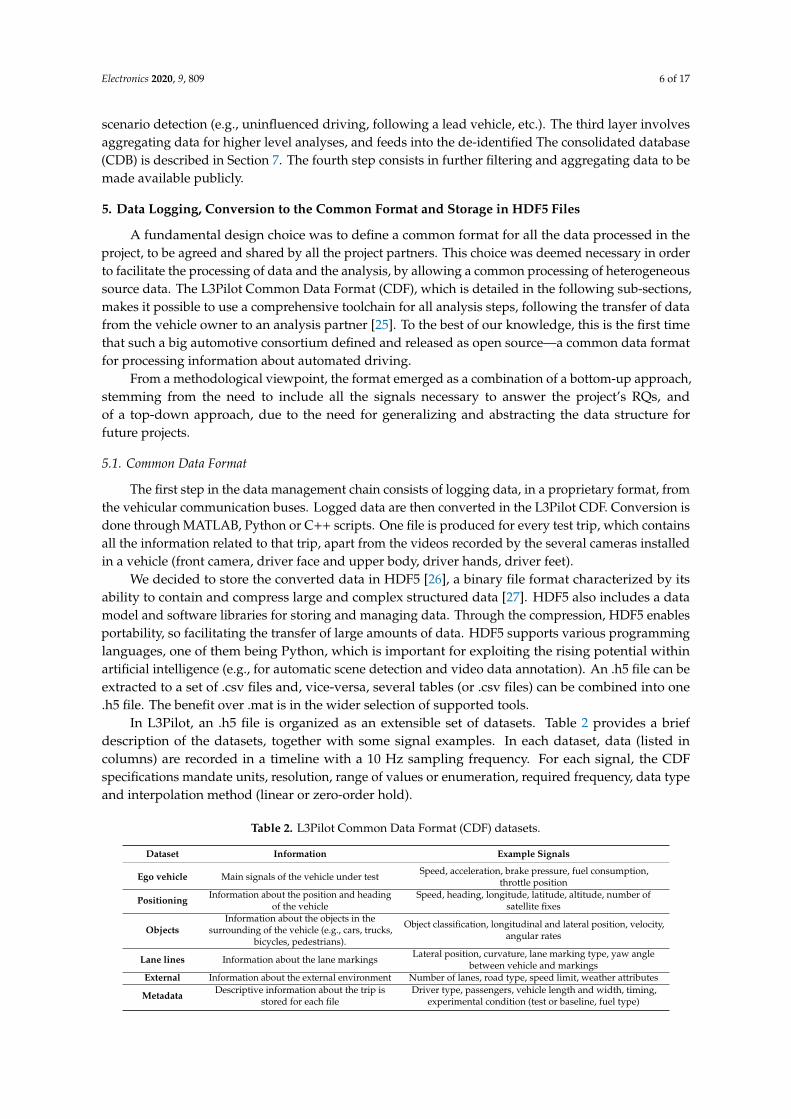
In L3Pilot, an .h5 file is organized as an extensible set of datasets. Table 2 provides a briefdescription of the datasets, together with some signal examples. In each dataset, data (listed incolumns) are recorded in a timeline with a 10 Hz sampling frequency. For each signal, the CDFspecifications mandate units, resolution, range of values or enumeration, required frequency, data typeand interpolation method (linear or zero-order hold).
Table 2. L3Pilot Common Data Format (CDF) datasets.
Dataset Information Example Signals
Ego vehicle Main signals of the vehicle under test Speed, acceleration, brake pressure, fuel consumption,throttle position
Positioning Information about the position and headingof the vehicle
Speed, heading, longitude, latitude, altitude, number ofsatellite fixes
ObjectsInformation about the objects in the
surrounding of the vehicle (e.g., cars, trucks,bicycles, pedestrians).
Object classification, longitudinal and lateral position, velocity,angular rates
Lane lines Information about the lane markings Lateral position, curvature, lane marking type, yaw anglebetween vehicle and markings
External Information about the external environment Number of lanes, road type, speed limit, weather attributes
Metadata Descriptive information about the trip isstored for each file
Driver type, passengers, vehicle length and width, timing,experimental condition (test or baseline, fuel type)

Electronics 2020, 9, 809 7 of 17
5.2. Data Quality Checking
Data converted in the CDF is next checked for correctness and consistency. Data quality checkingis very important, according to our experience with previous projects, where faulty or incompletedata caused issues in later data processing stages, causing significant delays and inconvenience in amore critical phase of the project. Several factors may jeopardize data quality, such as test set-up, timesynchronization among sensors, sensor/communication failures, etc.
We thus decided to develop a specific checking tool (we called it L3Q), that parses the HDF5files in order to guarantee that all the defined data structures are present and correct, so that they arecompatible with the post-processing and evaluation tools. The main purpose of L3Q is to speed upmanual quality checking and warn about errors in log files.
L3Q is a small Java software for checking the conformity of log files against the published logfile format. It checks whether the stored values in each log file respect the set minima, maxima andsampling frequencies defined for each variable, and highlights implausible ranges in the html reports itgenerates. Additionally, it visualizes a few key signals in the html reports to support manual inspectionon plausibility and time synchronization: e.g., vehicle speed vs GPS speed vs brake signal. The toolsignals the error/warning conditions, without making any automatic correction.
The quality checking tool is run also after the post-processing step, that is described in the nextsub-section, guaranteeing that all the data delivered to the analysis phase are correct.
5.3. Pseudonymization
The tests include sensitive data for vehicle owner confidentiality and driver privacy. We decidedthat pseudonymization (or de-identification) was the most appropriate solution to deal with such data.Pseudonymization allows identifying database entities such as trips and drivers, but only by the ownersof the data, who know the pseudonymized ID. The pseudonymization process is managed by the vehicleowners, and is applied to produce the trip ID and the user ID. The ID is an 8-character string, obtainedthrough a simple procedure, based on a SHA-256 hashing. Source information (e.g., driver name,date of birth, trip place, vehicle owner, etc.), integrated with a secret word for “salting”, is processedthrough a deterministic hash function (e.g., SHA-256), that generates a 64-character identifier [28].For the purposes of L3Pilot, we considered it to be sufficient to extract the left-most 8 characters ofthe 64-character string to have the driver ID and the trip ID. This way, there are still enough uniquecombinations with sufficiently low collision probabilities. Using these IDs, vehicle manufacturers canthen track their participants and trips throughout the HDF5 files, subjective questionnaires and theCDB, where data from all the owners are finally put together. When sharing data beyond the analysispartner(s), further sensor-level data anonymization steps may be deemed necessary to protect productintellectual property rights (IPR).
6. Data Post-Processing and Enrichment
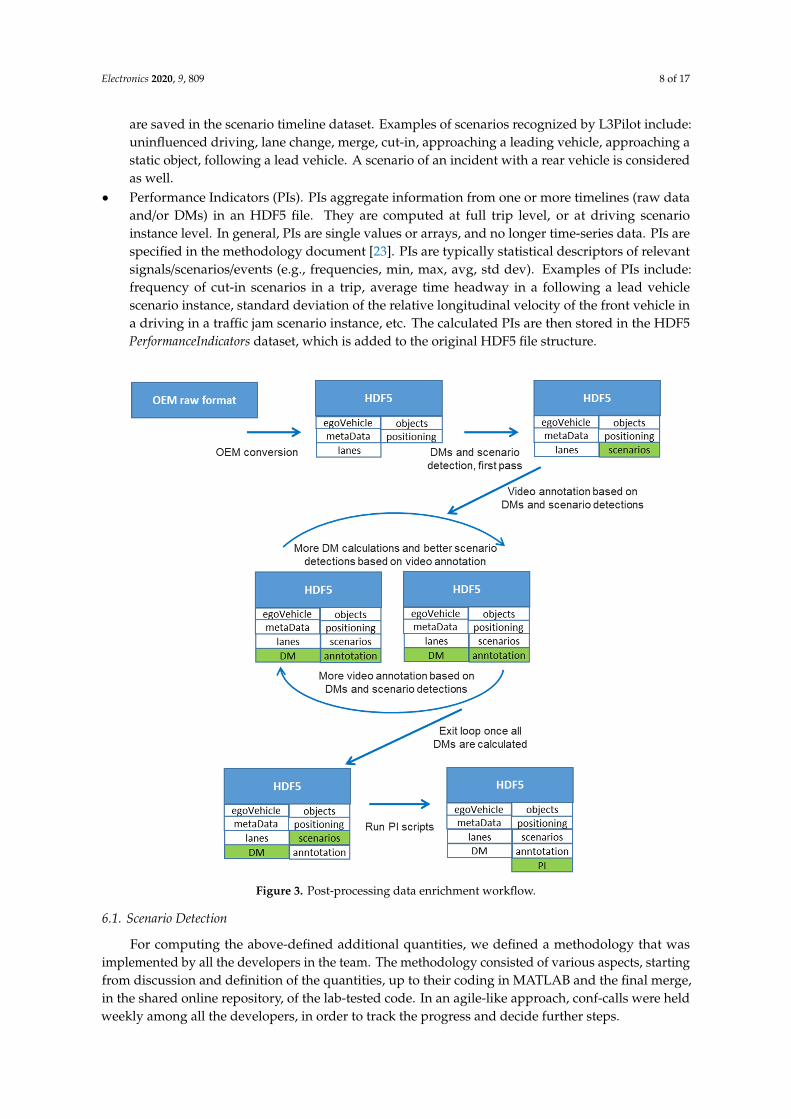
The second main step is represented by data enrichment. This involves the processing—throughMATLAB scripts—of the data present in an HDF5 file, in order to obtain additional information,particularly related to the methodological requirements and the project RQs. Figure 3 sketchesthe post-processing steps, highlighting the main iteration, which revolves around video annotation.The additional data can be grouped in three main clusters, such as:
• Derived Measures (DMs). These are time-series signals computed from the above-mentionedraw signals. Examples of DMs include: time headway, time-to-collision, traffic density, absoluteacceleration of the objects in their direction of travel, etc. The calculated derived measures are thenstored in the DerivedMeasures HDF5 dataset, which is added to the original HDF5 file structure(Figure 3).
• Driving Scenarios (or simply scenarios). These are stereotypical situations that may happenduring a drive. They are recognized by analyzing the raw signal timelines. Driving scenarios
Electronics 2020, 9, 809 8 of 17
are saved in the scenario timeline dataset. Examples of scenarios recognized by L3Pilot include:uninfluenced driving, lane change, merge, cut-in, approaching a leading vehicle, approaching astatic object, following a lead vehicle. A scenario of an incident with a rear vehicle is consideredas well.
• Performance Indicators (PIs). PIs aggregate information from one or more timelines (raw dataand/or DMs) in an HDF5 file. They are computed at full trip level, or at driving scenarioinstance level. In general, PIs are single values or arrays, and no longer time-series data. PIs arespecified in the methodology document [23]. PIs are typically statistical descriptors of relevantsignals/scenarios/events (e.g., frequencies, min, max, avg, std dev). Examples of PIs include:frequency of cut-in scenarios in a trip, average time headway in a following a lead vehiclescenario instance, standard deviation of the relative longitudinal velocity of the front vehicle ina driving in a traffic jam scenario instance, etc. The calculated PIs are then stored in the HDF5PerformanceIndicators dataset, which is added to the original HDF5 file structure.Electronics 2020, 9, x FOR PEER REVIEW 9 of 18
Figure 3. Post-processing data enrichment workflow.
6.1. Scenario Detection
For computing the above-defined additional quantities, we defined a methodology that was implemented by all the developers in the team. The methodology consisted of various aspects, starting from discussion and definition of the quantities, up to their coding in MATLAB and the final merge, in the shared online repository, of the lab-tested code. In an agile-like approach, conf-calls were held weekly among all the developers, in order to track the progress and decide further steps. As an implementation example of the methodology, we present here the case of the function we defined for the Cut-in scenario (Figure 4).
Figure 4. Graphical representation of the cut-in scenario. VuT standsstays for vehicle under test. The cut-in is performed by the “New Lead Vehicle”.
Figure 3. Post-processing data enrichment workflow.
6.1. Scenario Detection
For computing the above-defined additional quantities, we defined a methodology that wasimplemented by all the developers in the team. The methodology consisted of various aspects, startingfrom discussion and definition of the quantities, up to their coding in MATLAB and the final merge,in the shared online repository, of the lab-tested code. In an agile-like approach, conf-calls were heldweekly among all the developers, in order to track the progress and decide further steps.
Electronics 2020, 9, 809 9 of 17
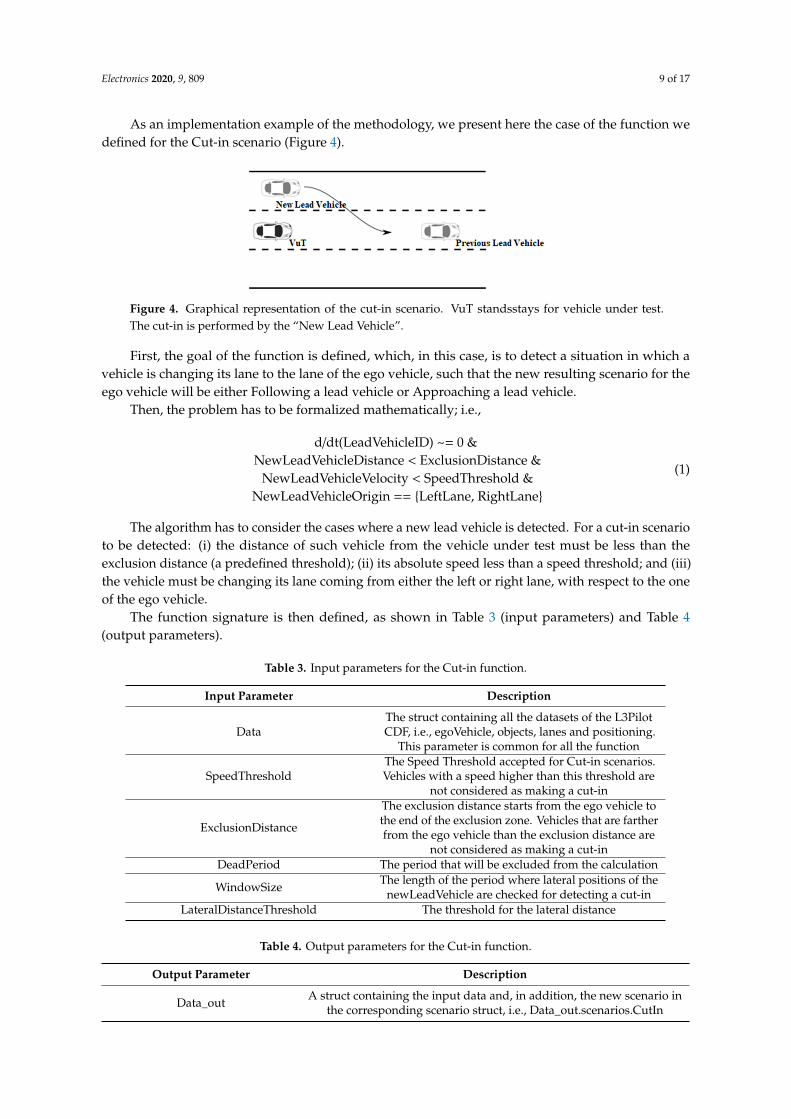
As an implementation example of the methodology, we present here the case of the function wedefined for the Cut-in scenario (Figure 4).
Electronics 2020, 9, x FOR PEER REVIEW 9 of 18
Figure 3. Post-processing data enrichment workflow.
6.1. Scenario Detection
For computing the above-defined additional quantities, we defined a methodology that was implemented by all the developers in the team. The methodology consisted of various aspects, starting from discussion and definition of the quantities, up to their coding in MATLAB and the final merge, in the shared online repository, of the lab-tested code. In an agile-like approach, conf-calls were held weekly among all the developers, in order to track the progress and decide further steps. As an implementation example of the methodology, we present here the case of the function we defined for the Cut-in scenario (Figure 4).
Figure 4. Graphical representation of the cut-in scenario. VuT standsstays for vehicle under test. The cut-in is performed by the “New Lead Vehicle”.
Figure 4. Graphical representation of the cut-in scenario. VuT standsstays for vehicle under test.The cut-in is performed by the “New Lead Vehicle”.
First, the goal of the function is defined, which, in this case, is to detect a situation in which avehicle is changing its lane to the lane of the ego vehicle, such that the new resulting scenario for theego vehicle will be either Following a lead vehicle or Approaching a lead vehicle.
Then, the problem has to be formalized mathematically; i.e.,
d/dt(LeadVehicleID) ~= 0 &NewLeadVehicleDistance < ExclusionDistance &
NewLeadVehicleVelocity < SpeedThreshold &NewLeadVehicleOrigin == LeftLane, RightLane
(1)
The algorithm has to consider the cases where a new lead vehicle is detected. For a cut-in scenarioto be detected: (i) the distance of such vehicle from the vehicle under test must be less than theexclusion distance (a predefined threshold); (ii) its absolute speed less than a speed threshold; and (iii)the vehicle must be changing its lane coming from either the left or right lane, with respect to the oneof the ego vehicle.
The function signature is then defined, as shown in Table 3 (input parameters) and Table 4(output parameters).
Table 3. Input parameters for the Cut-in function.
Input Parameter Description
DataThe struct containing all the datasets of the L3PilotCDF, i.e., egoVehicle, objects, lanes and positioning.
This parameter is common for all the function
SpeedThresholdThe Speed Threshold accepted for Cut-in scenarios.Vehicles with a speed higher than this threshold are
not considered as making a cut-in
ExclusionDistance
The exclusion distance starts from the ego vehicle tothe end of the exclusion zone. Vehicles that are fartherfrom the ego vehicle than the exclusion distance are
not considered as making a cut-inDeadPeriod The period that will be excluded from the calculation
WindowSize The length of the period where lateral positions of thenewLeadVehicle are checked for detecting a cut-in
LateralDistanceThreshold The threshold for the lateral distance
Table 4. Output parameters for the Cut-in function.
Output Parameter Description
Data_out A struct containing the input data and, in addition, the new scenario inthe corresponding scenario struct, i.e., Data_out.scenarios.CutIn
Electronics 2020, 9, 809 10 of 17
Then, the function is expressed in pseudo-code and finally implemented in MATLAB. The stepsof the Cut-in detection algorithm are the following:
1. Set the default input values, if the relevant parameters were not passed;2. Check for necessary fields;3. Preparatory calculations. This involves the creation of: (i) the Cut-in scenario array (one entry for
each sample in the timeline), which is initially zeroed; and of (ii) the newLeadVehicle_Indices,which marks all the time samples where a new lead vehicle is detected;
4. Iterate over the time samples in which a new lead vehicle is detected;
a. Get the index of the object matching the lead vehicle;b. Check that the object is not empty and that its longitudinal distance and absolute velocity
are below the given thresholds;c. Get the mean of the lateral position of this object starting from (current time—WindowSize)
until (current time—DeadPeriod). If this mean is greater than LateralDistanceThreshold, Cut-inis considered from the left. If this mean is lower than—LateralDistanceThreshold, Cut-in isconsidered from the right. Otherwise, no Cut-in is detected;
5. Write the Cut-in scenario to the scenario dataset and finally pass the updated overall dataset asthe output parameter.
If, in 4b above, the object is empty, there could be three cases: if the id of the former lead vehiclestill exists, then it is a lane change of the lead vehicle; otherwise, the lead vehicle left the view range.
6.2. Video Annotation
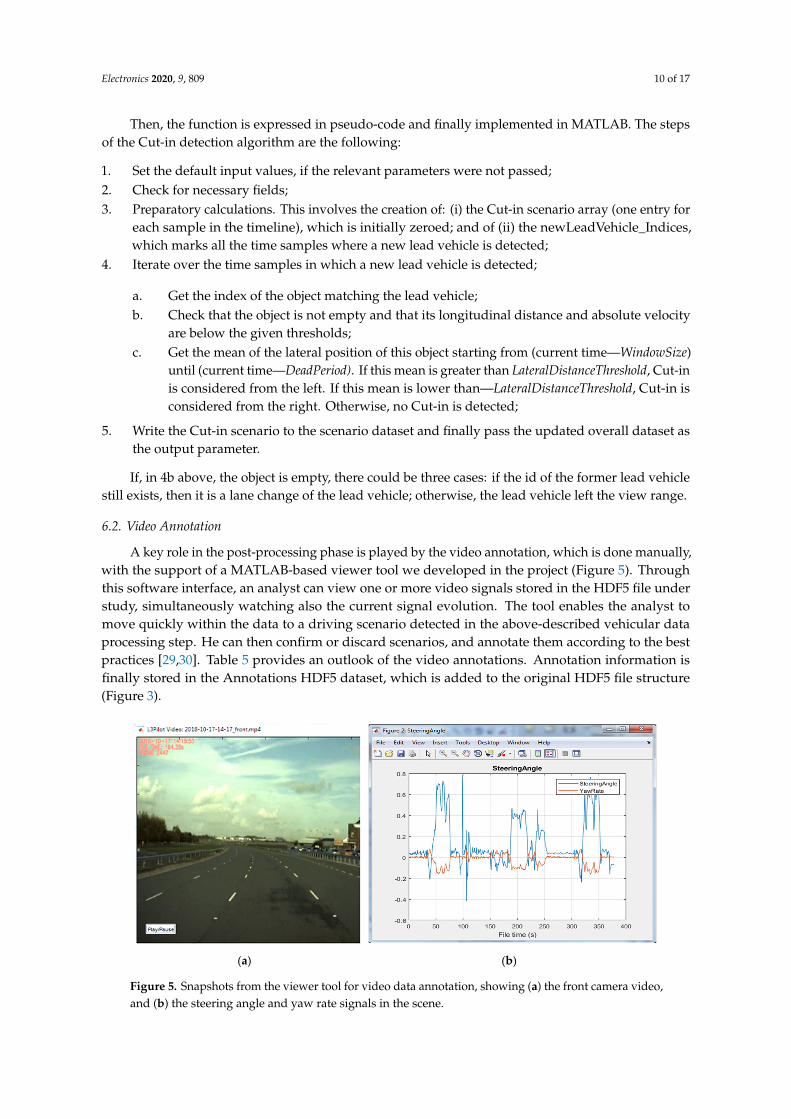
A key role in the post-processing phase is played by the video annotation, which is done manually,with the support of a MATLAB-based viewer tool we developed in the project (Figure 5). Throughthis software interface, an analyst can view one or more video signals stored in the HDF5 file understudy, simultaneously watching also the current signal evolution. The tool enables the analyst tomove quickly within the data to a driving scenario detected in the above-described vehicular dataprocessing step. He can then confirm or discard scenarios, and annotate them according to the bestpractices [29,30]. Table 5 provides an outlook of the video annotations. Annotation information isfinally stored in the Annotations HDF5 dataset, which is added to the original HDF5 file structure(Figure 3).
Electronics 2020, 9, x FOR PEER REVIEW 12 of 18
(a) (b)
Figure 5. Snapshots from the viewer tool for video data annotation, showing (a) the front camera video, and (b) the steering angle and yaw rate signals in the scene.
All the additional information created in the post-processing phase is incrementally added in the HDF5 file, which is thus enriched with computed data, in addition to the original signal time series (Figure 3). As anticipated, a new round of data quality checking is then performed on the enriched HDF5 file as well.
7. Subjective Data Tool
Until now, we have dealt with data from vehicles and cameras. Another important aspect is subjective data collection using online surveys. Pilot vehicle users are asked to reflect on (automated) driving and report about their test experience, mainly addressing the RQs on impact evaluation and socio-economic impact evaluation. There are two main types of participants: drivers (for legal/company rules, driving automated vehicles is restricted in several cases) and passengers. Questionnaires are filled by users before and after the driving experience.
In order to support execution and management of the subjective data collection, we chose the LimeSurvey commercial tool [31]. Three specific questionnaires were developed, according to the context of use: urban, traffic jam motorway and parking. The questionnaires are translated in all the pilot sites’ local languages. Survey results are exported in .csv files to feed the “selected partner” analysis and the CDBDB.
Each questionnaire is structured into groups of questions, as specified by the user assessment methodology. Questions are of different types: text input, single and multiple choices, arrays, numeric arrays. Conditional questions are also implemented, for instance to show (or hide) some questions (or their answers), based on the answer to a previous question.
Customizations are needed for some questions, for instance, to add text options to numeric arrays or to add text input to sub-questions (typically to allow the user to specify the “Other” option), or to automatically set values for consistency among answers. Customization is also needed to check and enforce consistency of the input values. For instance, clicking on a checkbox (stating that the participant never makes certain kind of trips) clears its favorite transport means selections for a specific kind of trip (if the participant had selected some). Customizations are implemented by modifying/adding the Javascript and JQuery source code for the relevant questions. LimeSurvey has a well-established user/developer community that provides extensive support for queries and extensions.
Several questions required participant’s input validation, in order to prevent the insertion of incorrect data. For instance, when ranking transport mode preferences, participants have to provide
Figure 5. Snapshots from the viewer tool for video data annotation, showing (a) the front camera video,and (b) the steering angle and yaw rate signals in the scene.

Electronics 2020, 9, 809 11 of 17
Table 5. L3Pilot Video annotations.
Item Annotated Values Notes
Driver secondary task
No task, interaction with passenger, using a mobilephone, using another electronic device, eating or
drinking, smoking or personal grooming, reading orwriting, interaction with object, interaction with
external object, unknown, not annotated
Up to three simultaneoussecondary tasks are
traced
ADF interaction Glances, manual, both, none, other, not annotated
Face expressions Nothing special, asleep/relaxing, drowsy, angry,surprised, fear/concern, not annotated
Hands 0 hands, 1 hand, 2 hands, not annotated Hands on wheel
Glance direction Eyes off road, eyes on road, eyes to mirror,not annotated
Roadworks Not in a roadwork zone, in a roadwork zone;unknown, not annotated;
Weather As of [30]Precipitation and
precipitation type areannotated as well
Road surface Dry, wet; ice, snow, aquaplane, unknown,not annotated;
All the additional information created in the post-processing phase is incrementally added in theHDF5 file, which is thus enriched with computed data, in addition to the original signal time series(Figure 3). As anticipated, a new round of data quality checking is then performed on the enrichedHDF5 file as well.
7. Subjective Data Tool
Until now, we have dealt with data from vehicles and cameras. Another important aspect issubjective data collection using online surveys. Pilot vehicle users are asked to reflect on (automated)driving and report about their test experience, mainly addressing the RQs on impact evaluation andsocio-economic impact evaluation. There are two main types of participants: drivers (for legal/companyrules, driving automated vehicles is restricted in several cases) and passengers. Questionnaires arefilled by users before and after the driving experience.
In order to support execution and management of the subjective data collection, we chose theLimeSurvey commercial tool [31]. Three specific questionnaires were developed, according to thecontext of use: urban, traffic jam motorway and parking. The questionnaires are translated in allthe pilot sites’ local languages. Survey results are exported in .csv files to feed the “selected partner”analysis and the CDBDB.
Each questionnaire is structured into groups of questions, as specified by the user assessmentmethodology. Questions are of different types: text input, single and multiple choices, arrays, numericarrays. Conditional questions are also implemented, for instance to show (or hide) some questions(or their answers), based on the answer to a previous question.
Customizations are needed for some questions, for instance, to add text options to numeric arraysor to add text input to sub-questions (typically to allow the user to specify the “Other” option), or toautomatically set values for consistency among answers. Customization is also needed to check andenforce consistency of the input values. For instance, clicking on a checkbox (stating that the participantnever makes certain kind of trips) clears its favorite transport means selections for a specific kind oftrip (if the participant had selected some). Customizations are implemented by modifying/addingthe Javascript and JQuery source code for the relevant questions. LimeSurvey has a well-establisheduser/developer community that provides extensive support for queries and extensions.
Several questions required participant’s input validation, in order to prevent the insertion ofincorrect data. For instance, when ranking transport mode preferences, participants have to provide
Electronics 2020, 9, 809 12 of 17
ordered values (without ties or empty slots). This is achieved by writing validation expressions, whichare checked at runtime by the LimeSurvey Expression manager.
A small set of MATLAB scripts were also developed, that extract and convert data from the .csvfiles exported from LimeSurvey into the .json format, which is the body of the HTTP POST requeststhat are needed to insert data in the CDBCDB, as described in the next section.
8. Consolidated Database (CDB)
The final step of the data processing involves the preparation of information for the CDB. The goalis to collect aggregated and pseudonymized information from all the HDF5 files, and make it availableto the whole consortium (while the “selected partner” analysis is restricted to each specific vehicleowner), in order to support high-level impact analysis.
Collected data are also being utilized as feeds, to allow for further impact analysis studies.Not only does L3Pilot capture a snapshot of how automated driving technology is and looks liketoday, it also scales up the detailed findings from log and survey data with various tools, such asmacroscopic simulations and transparent stepwise calculations, to estimate higher level impacts ofautomated driving. To the best of our knowledge, L3Pilot is among the first projects collecting data(from several vehicle manufacturers) and scientific evidence on near-future impacts. Data needed forthis goal typically refer to instances of scenarios and related key performance indicators, in order toenable simulation studies for impact analysis.
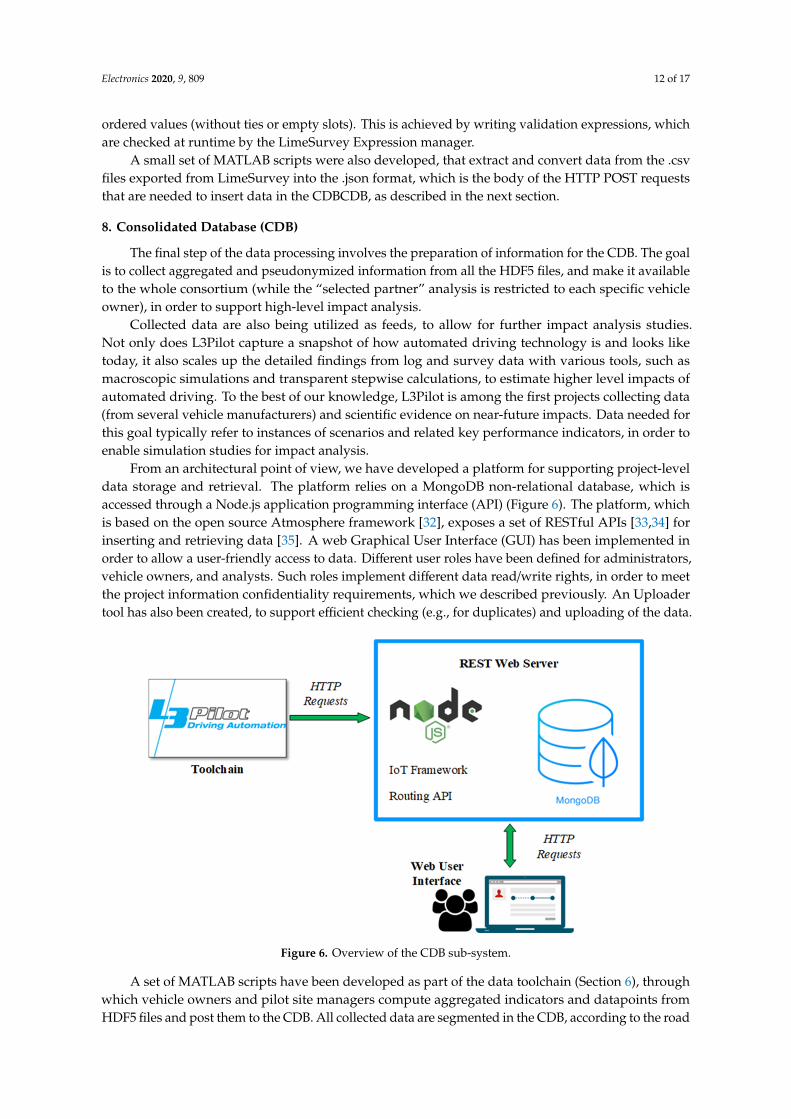
From an architectural point of view, we have developed a platform for supporting project-leveldata storage and retrieval. The platform relies on a MongoDB non-relational database, which isaccessed through a Node.js application programming interface (API) (Figure 6). The platform, whichis based on the open source Atmosphere framework [32], exposes a set of RESTful APIs [33,34] forinserting and retrieving data [35]. A web Graphical User Interface (GUI) has been implemented inorder to allow a user-friendly access to data. Different user roles have been defined for administrators,vehicle owners, and analysts. Such roles implement different data read/write rights, in order to meetthe project information confidentiality requirements, which we described previously. An Uploadertool has also been created, to support efficient checking (e.g., for duplicates) and uploading of the data.
Electronics 2020, 9, x FOR PEER REVIEW 14 of 18
Beside a remote CDB, which is shared among all the consortium analysts, various installations of the same platform were also set up at each pilot site, in order to perform preliminary analyses before the complete common data gathering.
The CDB is able to provide this feature by creating a new user typology (“Public user”), which will be allowed access only to specific computations that will aggregate stored data at a level considered suited to preserve confidentiality. However, as anticipated, L3Pilot has not defined which data will be made available publicly yet, nor the access modality.
Figure 6. Overview of the CDB sub-system.
9. Pre-Pilot Achievements and Discussion
As of April 2020, the data chain has been developed and tested in the pre-pilots, which were planned for preliminarily testing of the data processing and analysis chain, before full-scale, on-road tests. AllsA tests have been substantially positive, and allowed us to spot bugs and face challenging situations that we had not previously considered. The data chain has been used by the analysts and all the 13 vehicle owners in the project.
A preliminary test showed that the L3Pilot CDF is more efficient than formats well established for FOTs, such as .csv (82% size reduction). On the other hand, it performs almost as well in terms of memory efficiency as the MATLAB proprietary format (9% size increase), while being independent of the software used [25]. Portability has already been successfully experienced by the use of various tools that process the CDF files in different environments: Windows or Linux, and using Python, R, Java or MATLAB. The binary format requires specific tools for accessing/adding data in HDF5 files, but this is considered a minor limitation. L3Pilot contributed new open source code to the HDF Group by improving the Java support of the format (e.g., handling complex variables, which entailed a table within a table).
MATLAB scripts for vehicular data processing have been implemented, also exploiting synthetic data or collected from previous drives, for initial and continuous testing. Lab tests also involved data quality checking through the dedicated tool. The experience demonstrates that such quality monitoring is mandatory in large-scale tests.
Using a common format among different vehicle owners was deemed very useful. For research organizations and development projects in general, a common data format would enable the development of various tools on top of it, with clear efficiency advantages compared to the state-of-the-art.
As none of the vehicle owners currently log directly in CDF, recordings had to be filtered, resampled and then converted into CDF. Development of conversion software took an important part
Figure 6. Overview of the CDB sub-system.
A set of MATLAB scripts have been developed as part of the data toolchain (Section 6), throughwhich vehicle owners and pilot site managers compute aggregated indicators and datapoints fromHDF5 files and post them to the CDB. All collected data are segmented in the CDB, according to the road

Electronics 2020, 9, 809 13 of 17
type and experimental condition (baseline or treatment, ADF available or not, ADF active or not), so asto support analysis and comparisons, according to the research questions. As anticipated in Section 7,subjective data, which is the outcome of questionnaires filled by users, is also inserted. Putting thingstogether, information from the source files to be inserted in the CDF is of the following kind:
• Performance Indicators. These are the statistical descriptors presented in Section 6. They arecomputed at trip level or at driving scenario instance level;
• Data Points per driving scenario instances. These are particular types of data that are used forassessing impact by comparing different simulations enabled by the collected data. For eachdriving scenario, two types of data are recorded: starting points and summary values. The formerrecord significant values at the beginning of the considered scenario instance (e.g., relative speedof the involved vehicles, relative positions, geometrical characteristics of the objects). The latterrecord significant statistical values for the considered scenario instance (e.g., mean speed of theego vehicle, min and mean longitudinal acceleration, etc.);
• Subjective data. One array of data is provided for each user questionnaire, including both pre- andpost-hoc experience. Each element of the array contains the numerical code of the correspondingtest participant’s response.
Beside a remote CDB, which is shared among all the consortium analysts, various installations ofthe same platform were also set up at each pilot site, in order to perform preliminary analyses beforethe complete common data gathering.
The CDB is able to provide this feature by creating a new user typology (“Public user”), which willbe allowed access only to specific computations that will aggregate stored data at a level consideredsuited to preserve confidentiality. However, as anticipated, L3Pilot has not defined which data will bemade available publicly yet, nor the access modality.
9. Pre-Pilot Achievements and Discussion
As of April 2020, the data chain has been developed and tested in the pre-pilots, which wereplanned for preliminarily testing of the data processing and analysis chain, before full-scale, on-roadtests. AllsA tests have been substantially positive, and allowed us to spot bugs and face challengingsituations that we had not previously considered. The data chain has been used by the analysts and allthe 13 vehicle owners in the project.
A preliminary test showed that the L3Pilot CDF is more efficient than formats well establishedfor FOTs, such as .csv (82% size reduction). On the other hand, it performs almost as well in terms ofmemory efficiency as the MATLAB proprietary format (9% size increase), while being independent ofthe software used [25]. Portability has already been successfully experienced by the use of varioustools that process the CDF files in different environments: Windows or Linux, and using Python, R,Java or MATLAB. The binary format requires specific tools for accessing/adding data in HDF5 files,but this is considered a minor limitation. L3Pilot contributed new open source code to the HDF Groupby improving the Java support of the format (e.g., handling complex variables, which entailed a tablewithin a table).
MATLAB scripts for vehicular data processing have been implemented, also exploiting syntheticdata or collected from previous drives, for initial and continuous testing. Lab tests also involved dataquality checking through the dedicated tool. The experience demonstrates that such quality monitoringis mandatory in large-scale tests.
Using a common format among different vehicle owners was deemed very useful. For researchorganizations and development projects in general, a common data format would enable thedevelopment of various tools on top of it, with clear efficiency advantages compared tothe state-of-the-art.
As none of the vehicle owners currently log directly in CDF, recordings had to be filtered,resampled and then converted into CDF. Development of conversion software took an important
Electronics 2020, 9, 809 14 of 17
part of the development, and led to availability of tools that can now flexibly manage differentrequirements. In general, experience taught us the higher importance of the CDF as the number ofsensors increases. However, it must be kept in mind that automotive companies have departmentswith different logging needs, which are very difficult to harmonize, and a lot of work is needed inthis direction. Of course, format unification or harmonization may be applied at later stages of theprocessing pipe. For instance, the definition of common key performance indicators allows commonimpact analysis, without prescribing a format for the source signal time series.
A huge quantity of data (in the order of terabytes) is being processed, size depending mostly onthe amount of video cameras and selected resolution. Aggregated data is being loaded in the CDB(both in local private installations and in the shared cloud installation, that collects data from all thepilot sites). Scalability is necessary when dealing with such quantities of data. This is increasinglysupported by state-of-the-art cloud services. The CDB implements another level of data integrity check,which allowed for the spotting of other bugs in data preparation and upload.
Overall, the L3Pilot experience stresses the importance of sharing information and data, at least atthe level of indicators and well-defined syntheses (e.g., the datapoints), which enables combining testresults from several pilot sites. Overall, this makes it possible to develop interoperable tools. The scopeof data processing scripts in a project such as L3Pilot has become very large. The number of derivedmeasures, performance indicators and scenarios to be calculated out of test data amounts to hundreds.If pilot sites would each face such evaluation and calculation requirements alone, they would just endup carrying out a limited evaluation due to the lack of resources. There are also general barriers thathinder data sharing, such as: intellectual property rights, privacy and product confidentiality, qualityissues, lack of resources or trust, poor or missing agreements. This obviously stresses the importanceof data sharing clauses in consortium agreements.
Toolchain developers found it good practice to organize weekly scrum calls to review developmentstatus, list tasks and go through issues, according to the agile methodology [36]. Weekly meetings alsoenabled creation of a well-functioning team across many organizations, and the use of a versioningtool such as Git was vital to manage the several teams working on complex hardware/softwaresystem development.
10. Conclusions and Future Work
Conducting a pilot on novel automated driving functions implies processing a huge amountof data, in order to extract meaningful information. We have faced this challenge designing anddeveloping a toolchain to process and manage qualitative (user questionnaire) and quantitative(vehicular) data in L3Pilot. Such data are now being analyzed for answering a set of RQs aboutevaluation of L3 automation on aspects such as technical functioning, user acceptance, traffic impact,and socio-economic impact. Positive feedback from the L3Pilot analysts has shown the validity ofpresented approach.
Data processing starts by converting all logged data into the CDF—a format that L3Pilot createdand promotes for open collaboration [25,26]. Open source ideas and tools are becoming more common,as data processing needs have spread across vehicle makers. The CDF is a HDF5-based file format,where each trip is saved as one file, including metadata that provides further information of therecording. The minimum required CDF signal list caters for various impact assessment areas, mainly:driver behavior, user experience, mobility, safety, efficiency, environment, and socio-economics.Creating conversion scripts from original logs into CDF required considerable effort. However, thealternative of using tailored analysis scripts for each different log format and vehicle type would havebeen very challenging in such a large research project with several vehicle manufacturers, whose sensorsets and setups differ.
The common format enabled the development of combined analysis scripts for all pilot sites,that include indicator calculation, event and driving situation detection, and support for video dataannotation. The shared calculation framework ensures that fully comparable indicators, distributions
Electronics 2020, 9, 809 15 of 17
and event lists can be extracted from each test. The resulting indicators and data distributions werefurther used as an input for impact assessment, where results from many pilot sites are statisticallycombined. As an important novelty, a low-confidentiality, pseudonymized aggregation of datafrom each test trip is stored in the CDB shared in the cloud. Combining results from different pilotsites enabled analysts to use a larger dataset for statistical work. To the best of our knowledge,this is the first open-sourced format by a large automotive consortium to store and process datafrom automated driving tests, and it comes with a confidentiality-aware toolchain for processing,data sharing and evaluation.
Our experience stresses two main benefits of data sharing within a consortium: (1) getting moreresearch results for the money that was spent into collecting data, (2) multiple people being able toscientifically validate results and build belief into the findings. Of course, there are also importantaspects of confidentiality, property, and privacy, that must be considered and adequately balanced.
The next major step of the project is completing the analysis of the test data, in order to respond tothe project RQs. This will provide further feedback on the quality of the designed data chain. We areconfident that the open source release of the CDF specifications will enable further collaborationregarding automated driving data sharing and analysis.
A key point will concern the study on how to improve CDF, particularly considering the differentand sometimes conflicting needs of different users and stakeholders (e.g., different departments ofan automotive company), also implying different types of source data, derived measures, detectablescenarios, and performance indicators.
Overall, we hope that the presented L3Pilot toolchain may become a comprehensive edge-to-cloudreference workflow and architecture for managing data in automated vehicle tests. The CDF can alsoencourage the development community to share data and tools.
Author Contributions: Conceptualization, J.H., S.K., R.B., N.O., B.N., F.B., A.R., E.S., E.H.A., A.D.G., software,J.H., S.K., R.B., N.O., B.N., F.B., A.R., E.S., E.H.A., methodology, H.W., supervision, M.D., A.D.G. All authors haveread and agreed to the published version of the manuscript.
Funding: This project has received funding from the European Union’s Horizon 2020 research and innovationprogramme under grant agreement No 723051. The sole responsibility of this publication lies with the authors.
Acknowledgments: The authors would like to thank all partners within L3Pilot for their cooperation andvaluable contribution.
Conflicts of Interest: The authors declare no conflict of interest.
References
1. Liu, S.; Liu, L.; Tang, J.; Yu, B.; Wang, Y.; Shi, W. Edge computing for autonomous driving: Opportunitiesand challenges. IEEE 2019, 107, 1697–1716. [CrossRef]
2. Bhat, A.; Aoki, S.; Rajkumar, R. Tools and methodologies for autonomous driving systems. IEEE 2018, 106,1700–1716. [CrossRef]
3. Park, J.; Choi, B. Design and implementation procedure for an advanced driver assistance system based onan open source AUTOSAR. Electronics 2019, 8, 1025. [CrossRef]
4. García Cuenca, L.; Puertas, E.; Fernandez Andrés, J.; Aliane, N. Autonomous driving in roundaboutmaneuvers using reinforcement learning with q-learning. Electronics 2019, 8, 1536. [CrossRef]
5. Li, L.; Huang, W.; Liu, Y.; Zheng, N.; Wang, F. Intelligence testing for autonomous vehicles: A new approach.IEEE Trans. Intell. Veh. 2016, 1, 158–166. [CrossRef]
6. SAE. Taxonomy and Definitions for Terms Related to Driving Automation Systems for on-Road Motor Vehicles;Technical Report, J3016_2018; SAE International: Warrendale, PA, USA, 2018.
7. Gellerman, H.; Svanberg, R.; Barnard, Y. Data sharing of transport research data. Transp. Res. Procedia 2016,14, 2227–2236. [CrossRef]
8. Yu, C.; Lin, B.; Guo, P.; Zhang, W.; Li, S.; He, R. Deployment and dimensioning of fog computing-basedinternet of vehicle infrastructure for autonomous driving. IEEE Internet Things J. 2019, 6, 149–160. [CrossRef]
Electronics 2020, 9, 809 16 of 17
9. Lin, L.; Liao, X.; Jin, H.; Li, P. Computation offloading toward edge computing. IEEE August 2019, 107,1584–1607. [CrossRef]
10. Chandiramani, J.R.; Bhandari, S.; Hariprasad, S.A. Vehicle data acquisition and telemetry. In Proceedings ofthe 2014 Fifth International Conference on Signal and Image Processing, Bangalore, India, 23 December 2014;pp. 187–191.
11. Benmimoun, M.; Benmimoun, A. Large-scale FOT for analyzing the impacts of advanced driver assistancesystems. In Proceedings of the 17th ITS World Congress, Tokyo, Japan, 25–29 October 2010.
12. Pillmann, J.; Sliwa, B.; Wietfeld, C. The AutoMat CVIM—A Scalable Data Model for Automotive BigData Marketplaces. In Proceedings of the 2018 19th IEEE International Conference on Mobile DataManagement (MDM), Aalborg, Denmark, 26–28 June 2018; pp. 284–285.
13. Johanson, M.; Belenki, S.; Jalminger, J.; Fant, M.; Gjertz, M. Big automotive data: Leveraging large volumes ofdata for knowledge-driven product development. In Proceedings of the 2014 IEEE International Conferenceon Big Data (Big Data), Washington, DC, USA, 27–30 October 2014; pp. 736–741.
14. Bartz, R. Mapping data models of the standardized automotive testing data storage to the unified modelinglanguage. In Proceedings of the 2013 IEEE International Conference on Industrial Technology (ICIT),Cape Town, South Africa, 25–28 February 2013; pp. 1327–1332.
15. Burzio, G.; Mussino, G.; Tadei, R.; Perboli, G.; Dell’Amico, M.; Guidotti, L. A subjective field test on lanedeparture warning function in the framework of the euro FOT project. In Proceedings of the 2009 2ndConference on Human System Interactions, Catania, Italy, 21–23 May 2009; pp. 608–610.
16. Dozza, M.; Pañeda González, N. Recognising safety critical events: Can automatic video processing improvenaturalistic data analyses? Accid. Anal. Prev. 2013, 60, 298–304. [CrossRef] [PubMed]
17. Barnard, Y.; Innamaa, S.; Koskinen, S.; Gellerman, H.; Svanberg, E.; Chen, H. Methodology for fieldoperational tests of automated vehicles. Transp. Res. Procedia 2016, 14, 2188–2196. [CrossRef]
18. Data Sharing Framework 2019. Available online: https://knowledge-base.connectedautomateddriving.eu/
wp-content/uploads/2020/04/Data-Sharing-Framework-v1.1-final.pdf (accessed on 13 May 2020).19. Adaptive Project Final Report. Available online: http://www.adaptive-ip.eu/files/adaptive/content/
downloads/AdaptIVe-SP1-v1-0-DL-D1-0-Final_Report.pdf (accessed on 9 January 2019).20. Boban, M.; d’Orey, P.M. Measurement-based evaluation of cooperative awareness for V2V and V2I
communication. In Proceedings of the 2014 IEEE Vehicular Networking Conference (VNC), Paderborn,Germany, 3–5 December 2014; pp. 1–8.
21. Bellotti, F.; Kopetzki, S.; Berta, R.; Lytrivis, P.; Amditis, A.; Raffero, M.; Aittoniemi, E.; Basso, R.; Radusch, I.; DeGloria, A. TEAM applications for Collaborative Road Mobility. IEEE Trans. Ind. Inform. 2019, 15, 1105–1119.[CrossRef]
22. Updated Version of the FESTA Handbook. Available online: https://connectedautomateddriving.eu/wp-content/uploads/2017/08/2017-01-31_FOT-NET_FESTA-Handbook.pdf (accessed on 14 March 2020).
23. L3Pilot Deliverable D3.1: From Research Questions to Logging Requirements. Available online: https://l3pilot.eu/detail/news/l3pilot-research-questions-and-hypotheses-available-for-download-1/ (accessed on14 March 2020).
24. Nagy, B.; Hiller, J.; Osman, N.; Koskinen, S.; Svanberg, E.; Bellotti, F.; Berta, R.; Kobeissi, A.; De Gloria, A.Building a Data Management Toolchain for a Level 3 Vehicle Automation Pilot’. In Proceedings of the 26thITS World Congress, Singapore, 21–25 October 2019.
25. Hiller, J.; Svanberg, E.; Koskinen, S.; Bellotti, F.; Osman, N. The L3Pilot common data format—Enablingefficient autonomous driving data analysis. In Proceedings of the NHTSA ESV, Eindhoven, The Netherlands,10–13 June 2019.
26. L3Pilot Common Data Format (L3Pilot CDF). Available online: https://github.com/l3pilot/l3pilot-cdf(accessed on 25 March 2020).
27. The HDF5 Library and File Format. Available online: https://www.hdfgroup.org/solutions/hdf5/ (accessed on5 March 2019).
28. Penard, W.; van Werkhoven, T. On the Secure Hash Algorithm family, in Tel, G.; Editor, Cryptography inContext. Available online: https://www.staff.science.uu.nl/~tel00101/liter/Books/CrypCont.pdf (accessed on29 April 2020).
29. Researcher Dictionary for Safety Critical Event Video Reduction Data, 5 October 2015, Version 4.1.Available online: https://vtechworks.lib.vt.edu/bitstream/handle/10919/56719/V4.1_ResearcherDictionary_for_
Electronics 2020, 9, 809 17 of 17
VideoReductionData_COMPLETE_Oct2015_10-5-15.pdf;sequence=1VirginiaTechTransportationInstitute,Blacksburg,Virginia (accessed on 28 April 2020).
30. UDRIVE Annotation Codebook. Available online: https://erticonetwork.com/wp-content/uploads/2017/
12/UDRIVE-D41.1-UDrive-dataset-and-key-analysis-results-with-annotation-codebook.pdf (accessed on28 April 2020).
31. LimeSurvey. Available online: https://www.limesurvey.org/ (accessed on 13 March 2020).32. Atmosphere. Available online: https://github.com/Atmosphere-IoT-Framework/api (accessed on 13 March 2020).33. Steiner, T.; Algermissen, J. Fulfilling the hypermedia constraint via http options, the http vocabulary in rdf,
and link headers. In Proceedings of the Second International Workshop on RESTful Design ACM, Eindhoven,The Netherlands, 10–13 June 2011; pp. 11–14.
34. Richardson, L.; Amundsen, M.; Ruby, S. RESTful Web APIs’; O’Reilly Media: Sevastopol, CA, USA, 2013.35. Bellotti, F.; Berta, R.; Kobeissi, A.; Osman, N.; Arnold, E.; Dianati, M.; Nagy, B.; De Gloria, A. Designing an
IoT framework for automated driving impact analysis. In Proceedings of the 30th IEEE Intelligent VehiclesSymposium, Paris, France, 9–12 June 2019.
36. Kirsi Korhonen, Agile processes in software engineering and extreme programming. In Proceedings of theXP 2019 Workshops, Montréal, QC, Canada, 21–25 May 2019; Volume 31, p. 73.
© 2020 by the authors. Licensee MDPI, Basel, Switzerland. This article is an open accessarticle distributed under the terms and conditions of the Creative Commons Attribution(CC BY) license (http://creativecommons.org/licenses/by/4.0/).