the ksa - jll real estate market... · source: ksa ministry of finance 608 2015 528 2016 692 2017f...
TRANSCRIPT

THE
KSAREAL ESTATE MARKET
2016: A Year In Review

Macroeconomic OverviewAge of Austerity2015 saw the first steps in government spending cuts which hinted at more drastic measures to come. This paved the way for the release of the structured plans of the Saudi Vision 2030 (Vision) and National Transformation Program (NTP) in the first half of 2016. Both plans confirmed what many expected; in response to the steep decline in oil prices the government would be making substantial cuts in spending to reduce its fiscal deficit. One of the major measures of the NTP is to cut the public sector wage bill, from 45% of government expenditure to 40%, by shrinking its workforce by a fifth. Additionally, the government removed certain perks and benefits from public sector employee pay, and announced in September that minsters’ and members of the Shoura Councils’ pay would be cut by 20% and 15% respectively.
According to Oxford Economics, GDP grew at the much slower rate of 1.6% in 2016 compared to 3.5% in 2015. On a positive note, the raising of SAR 65.6 billion (USD 17.5 billion) through an international sovereign bond sale, eased liquidity in the market. The government released payments totaling (USD 10.6 billion) to contractors and injected SAR 20 billion (USD 5.3 billion) into the banking system in 2016. Further easements will depend on oil price levels which also recently received positive news. During the OPEC meeting in November, the group agreed to cut oil production by 1.2 mbd. Following the announcement, oil prices are expected to average USD 50 per barrel in 2017.
Weaker Spending PowerIn addition to the cuts in public sector pay, household spending power in Saudi weakened earlier this year when the government announced it would no longer subsidize petrol and utilities. According to the latest National Expenditure and Income Survey, 21% of household spending is on housing and utilities (water, electricity, gas and other fuels), and 9% on transport. The combined effect of the cut in subsidies, which saw oil prices increase by 50%, and housing rents increase over 2015 and 2016, will result in less spending allocated to luxuries such as high-end retail brands, international travel, expensive furnishings and eating out. Household spending will further weaken once redundancies within the public sector are made.
The effect has already been noticeable in the pattern of household spending. Saudi Electricity Company revealed that electricity consumption reduced in 2016 for the first time in 15 years. Latest data released by SAMA also shows that the value of point of sales (POS) transactions increased marginally by 1% Y-o-Y in October 2016, compared to October 2015, when the value of POS transactions increased by 15% Y-o-Y. This indicates that although spending is still increasing, consumers are being more selective and choosing more affordable brands.
Source: KSA Ministry of Finance
6082015
5282016
6922017F
GovernmentRevenue(SAR/Billion)
9752015
8252016
8902017F
GovernmentSpending(SAR/Billion)
-3672015
-2972016
-1982017F
FiscalBalance(SAR/Billion)
COPYRIGHT © JONES LANG LASALLE IP, INC. 2017

White Land TaxThe tax was introduced in Q4 2015 without much detail. Since then, the regulations were released in June 2016 and the six-month registration period for landowners, whose lands met the criteria, opened.
The regulations define white land as any idle land designated for residential or residential / commercial use within the urban boundaries outlined by the Ministry of Housing (MoH). Apart from defining white lands, the regulations also cover other items including the responsibility of payment, exemptions and phasing. The tax will be introduced over four phases, however, if the housing supply and demand equilibrium is adjusted in the earlier phases, the remaining phases will not be introduced. The four phases are:
Phase 1 - Undeveloped land with an area exceeding 10,000 sq m. Phase 2 - Developed land with an area exceeding 10,000 sq m. Phase 3 - Developed land with an area exceeding 5,000 sq m from one plan. Phase 4 - Developed land with an area collectively exceeding 10,000 from one city.
The situation in each city will be regularly assessed by the MoH to determine whether the next phase of the tax should be implemented. The tax will only be implemented in cities that suffer from a shortage of housing. The first three cities the tax will be implemented in are Riyadh, Jeddah and Dammam. Riyadh will be the first city to be invoiced by early 2017, followed closely by Jeddah and Dammam in the same year. The urban boundaries for Makkah and Madinah are currently being drawn and are expected to be announced by mid-2017. A further three cities are currently under study; however, their names have not been announced.
Following the end of the registration period in December, the MoH
announced the total area of land registered reached 634,999,900 sq m. The breakdown of land registered in each city is illustrated in the table below:
It is expected that in 2017, the revenue generated from the invoiced properties and the mechanism used to fund the MOH’s projects and the plan to improve infrastructures and amenities in residential neighborhoods currently located further from city centers, will be announced.
Total Land Area Registered (sq m) % of which is over 10,000 sq m
Riyadh 283,068,860 79%
Jeddah 173,435,460 70%
Dammam 134,736,273 73%
Other Cities 43,769,348 45%
White Land Tax
As with the establishment of any new law, 2016 has been an active year for the White Land Tax. The tax was introduced in Q4 2015 without much detail. Since then, the regulations were released in June 2016 and the six-month registration period for landowners, whose lands met the criteria, opened.
The regulations defined white lands as any idle lands designated for residential or residential / commercial use within the urban boundaries outlined by the Ministry of Housing (MoH). Apart from defining white lands, the regulations also revealed other items including the responsibility of payment, exemptions and phasing. The tax will be introduced over four phases, however, if the housing supply and demand equilibrium is adjusted in the earlier phases the remaining phases will not be introduced. The four phases are:
Phase 1 - Undeveloped land with an area that exceeds 10,000 sq m.Phase 2 - Developed land with an area that exceeds 10,000 sq m.Phase 3 - Developed land with an area that exceeds 5,000 sq m.Phase 4 - Developed land with an area that collectively exceeds 10,000.
The situation in each city will be regularly assessed by the MoH to determine whether the next phase of the tax should be implemented. The tax will only be implemented in cities that suffer from a shortage of housing. The first three cities the tax will be implemented in are Riyadh, Jeddah and Dammam. Riyadh will be the first city to be invoiced by early 2017 followed closely by Jeddah and Dammam in the same year. The urban boundaries for Makkah and Madinah are currently being drawn and expected to be announced by mid-2017. A further three cities are currently under study; however, their names have not been announced.
Following the end of the registration period in December, the MoH announced the total area of land registered reached 634,999,941sq m. The breakdown of land registered in each city is illustrated in the table below:
It is expected that in 2017, the revenue generated from the invoiced properties and the mechanism used to fund the MOH’s projects and the plan to improve infrastructures and amenities in residential neighborhoods currently located further from city centers, will be announced.
Home Financing
Home financing in Saudi has been another active area over the last year. Speculation in late 2015 that the 70%LTV announced by SAMA in 2014 would increase to 85% for specialized mortgage lenders were realized in early 2016. SAMA increased LTVs to increase accessibility to home ownership. So far, raising the LTV has had little impact on the market. Real estate transactions registered by the Ministry of Justice decreased by 29% in 2016 compared to 2015.
Riyadh Jeddah Dammam Other CitiesTotal Land Area Registered (sq m) 283,068,860 173,435,460 134,726,273 43,769,348% which is over 10,000 sq m 79% 70% 73% 45%
Source: Ministry of Housing
Source: Ministry of Housing
6 months to register land
60 days to file a complaint
60 days to receive aresponse
1 year to pay the tax
Announcement of regulationsJune 2016
Invoicing beginsJanuary2016
Last date to pay the tax
Jun Jul Aug Sep Oct Nov Dec Jan Feb Mar Apr May Jun Jul Aug Sep Oct Nov Dec
2016 2017
Current Position
Timeline for White Land Tax
Source: Ministry of Housing
COPYRIGHT © JONES LANG LASALLE IP, INC. 2017

Home Financing Home financing in Saudi has been another active area over the last year with SAMA increasing the maximum LTV for specialised mortgage lenders from 70% to 85% in early 2016. This move has however had little impact on the market to date with real estate transactions registered by the Ministry of Justice decreasing by 29% in 2016 compared to 2015.
Additionally, a consortium between the Ministry of Housing, Ministry of Finance and the Saudi Arabian Monetary Agency introduced facilitated mortgages in October 2016. This program aims to benefit families registered with the Real Estate Development Fund to obtain a loan. The Ministry of Finance will issue a financial guarantee and trust to banks to cover 15% of the total value of the real estate unit in case mortgagees default on payments and the mortgaged house sale price does not cover the defaulted amount.
SAMA announced that the minimume installment of mortgages funded by commercial banks will be reduced from 70% to 15%.
Real Estate Investment Traded FundsIn an effort to diversify the economy and open the real estate to smaller investors, the Capital Market Authority (CMA) approved rules allowing for the formation of the Real Estate Investment Traded Funds (REITs) in October 2016. These rules include a minimum fund size of SAR 100 million (USD 26.6 million), with at least 75% of the fund to be invested within Saudi Arabia. 30% of the REIT must be owned by public shareholders and 90% of the fund’s net profits must be redistributed annually to investors.
The introduction of REITs is aimed at improving transparency to help achieve NTP’s goal to increase real estate’s contribution to GDP from 5% to 10% annually. Additionally, REITs may help achieve some of the broader goals in the Saudi 2030 Vision to increase supply of housing by providing alternative sources of finance and reducing reliance on the banking sector. However, given that funds will not be allowed to invest in raw land, and may only invest 25% on development projects, the impact of REITs on the shortage of housing supply is likely to be limited. There are also restrictions on debt, which is not allowed to exceed 50% of a fund’s assets.
To date, the only REIT in Saudi is the Riyad REIT. Launched in June 2015, and listed on Tadawul in November 2016, the REIT has a capital of SAR 500 million. Its assets include the Ascott Tahliya Tower in Jeddah, Tamayouz and Izdihar Centers in Riyadh and the Shati Tower in Dammam.
COPYRIGHT © JONES LANG LASALLE IP, INC. 2017

Riyadh Prime Rental Clock
* Hotel clock reflects the movement of RevPARNote: The property clock is a graphical tool developed by JLL to illustrate where a market sits within its individual rental cycle. These positions are not necessarily representative of investment or development market prospects. It is important to recognise that markets move at different speeds depending on their maturity, size and economic conditions. Markets will not always move in a clockwise direction, they might move backwards or remain at the same point in their cycle for extended periods.
Source: JLL
Jeddah Prime Rental Clock
DMA Prime Rental Clock
Residential
Q4 2015
Rental GrowthSlowing
RentsFalling
Rental GrowthAccelerating
RentsBottoming Out
Q4 2016
Rental GrowthSlowing
RentsFalling
Rental GrowthAccelerating
RentsBottoming Out
Office
OfficeHotel*
Hotel*
RetailRetail
Residential
Residential
Q4 2015
Rental GrowthSlowing
RentsFalling
Rental GrowthAccelerating
RentsBottoming Out
Q4 2016
Rental GrowthSlowing
RentsFalling
Rental GrowthAccelerating
RentsBottoming Out
Office
Office
Hotel*
Hotel*
Retail
Retail
Residential
Residential
Q4 2016
Rental GrowthSlowing
RentsFalling
Rental GrowthAccelerating
RentsBottoming Out
Office
Hotel*
Retail
Rental GrowthSlowing
RentsFalling
Rental GrowthAccelerating
RentsBottoming Out
Office
Hotel*
RetailResidential
Q4 2015
COPYRIGHT © JONES LANG LASALLE IP, INC. 2017
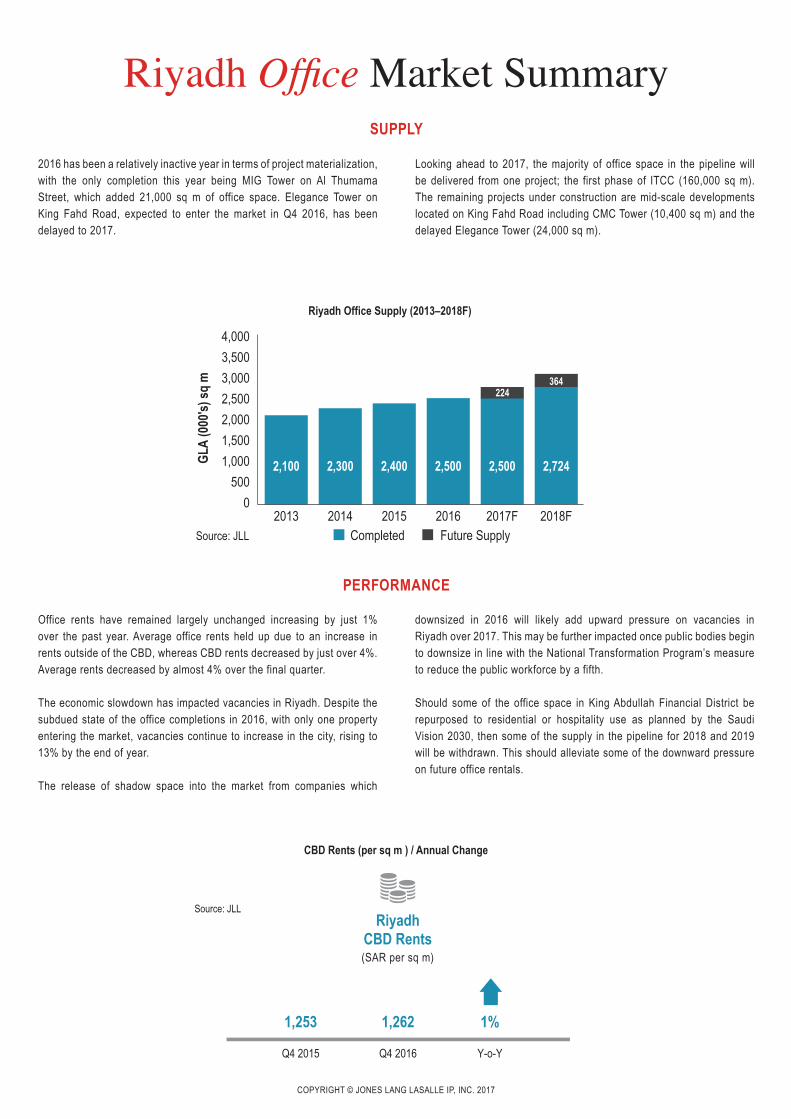
2016 has been a relatively inactive year in terms of project materialization, with the only completion this year being MIG Tower on Al Thumama Street, which added 21,000 sq m of office space. Elegance Tower on King Fahd Road, expected to enter the market in Q4 2016, has been delayed to 2017.
Looking ahead to 2017, the majority of office space in the pipeline will be delivered from one project; the first phase of ITCC (160,000 sq m). The remaining projects under construction are mid-scale developments located on King Fahd Road including CMC Tower (10,400 sq m) and the delayed Elegance Tower (24,000 sq m).
Office rents have remained largely unchanged increasing by just 1% over the past year. Average office rents held up due to an increase in rents outside of the CBD, whereas CBD rents decreased by just over 4%. Average rents decreased by almost 4% over the final quarter.
The economic slowdown has impacted vacancies in Riyadh. Despite the subdued state of the office completions in 2016, with only one property entering the market, vacancies continue to increase in the city, rising to 13% by the end of year.
The release of shadow space into the market from companies which
downsized in 2016 will likely add upward pressure on vacancies in Riyadh over 2017. This may be further impacted once public bodies begin to downsize in line with the National Transformation Program’s measure to reduce the public workforce by a fifth.
Should some of the office space in King Abdullah Financial District be repurposed to residential or hospitality use as planned by the Saudi Vision 2030, then some of the supply in the pipeline for 2018 and 2019 will be withdrawn. This should alleviate some of the downward pressure on future office rentals.
Riyadh Office Market SummarySUPPLY
Riyadh Office Supply (2013–2018F)
2,100 2,300 2,400 2,500 2,500 2,724
224364
0500
1,0001,5002,0002,5003,0003,5004,000
2013 2014 2015 2016 2017F 2018FSource: JLL
GLA
(000
's) sq
m
Completed Future Supply
CBD Rents (per sq m ) / Annual Change
1,131
Q4 2015
1,124
Q4 2016
-1%
Y-o-Y
JeddahCBD Rents(SAR per sq m)
1,253
Q4 2015
1,262
Q4 2016
1%
Y-o-Y
RiyadhCBD Rents(SAR per sq m)
Source: JLL
PERFORMANCE
1,131
Q4 2015
1,124
Q4 2016
-1%
Y-o-Y
JeddahCBD Rents(SAR per sq m)
1,253
Q4 2015
1,262
Q4 2016
1%
Y-o-Y
RiyadhCBD Rents(SAR per sq m)
Source: JLL
COPYRIGHT © JONES LANG LASALLE IP, INC. 2017

The current supply of office space in Jeddah reached almost 984,000 sq m in Q4 2016. The most notable completion in 2016 was Emaar Square, which began handing over to tenants in Q4. Emaar Square (24,000 sq m) was the largest completion in Jeddah since the Headquarters entered the market in 2014. There were no other completions in Q4 2016.
A number of small to mid-scale projects may be withdrawn from the supply pipeline as landlords change the purpose of the building from commercial to furnished apartments, which are growing in popularity.
2016 saw office rents soften marginally (-1%). The softening lease rates reflected the contracting economic conditions in the market due to the decline in oil prices and completion, or near completion, of a number of infrastructure projects which will see engineering and contracting companies reduce their office space requirements.
Y-o-Y vacancy rates remained stable in Q4 2016 at 6% despite a number of vacancies over the last two quarters. Average rents currently stand at SAR 1,124, which declined marginally (-1%) Y-o-Y but remained stable over the quarter.
Further declines in lease rates and occupancies are expected over 2017. The main cause of vacancies will be the release of shadow vacancies into the market as a number of companies move out of rented space into
owner occupier buildings, along with the decision of more companies to postpone or scale back their expansion plans.
The market is likely to swing in favor of occupiers as waning demand for office space will create more room for negotiation adding downward pressure on lease rates. This may result in a more notable decline in average rents.
Medical clinics are increasingly leasing space within office buildings due to the limited stock of purpose built clinical buildings in Jeddah. This is positive news for landlords as it increases the diversity of the tenant pool in Jeddah which is witnessing waning demand from corporate occupiers.
Jeddah Office Market SummarySUPPLY
Jeddah Office Supply (2013–2018F)
742 853 892 984 984 1,084
86
0
200
400
600
800
1,000
1,200
2013 2014 2015 2016 2017F 2018FSource: JLL
GLA
(000
's) sq
m
Completed Future Supply
100
CBD Rents (per sq m ) / Annual Change
1,131
Q4 2015
1,124
Q4 2016
-1%
Y-o-Y
JeddahCBD Rents(SAR per sq m)
1,253
Q4 2015
1,262
Q4 2016
1%
Y-o-Y
RiyadhCBD Rents(SAR per sq m)
Source: JLL
PERFORMANCE
COPYRIGHT © JONES LANG LASALLE IP, INC. 2017

Al Mahmal Commercial Center, which added approximately 12,000 sq m of office space, was the only major completion in the second half of 2016. Looking ahead to 2017, a large area of office space is expected to enter an already oversupplied market including Abdul Karim Tower and Al Hajri Tower.
The delay in the materialisation of large master planned projects in the DMA, such as the Marina development and Al Rashed City, is positive news for the current office market. Such developments may become commercial hubs and compete with existing buildings.
The future pipeline of office space in the DMA includes a number of mid to large scale projects. This will add further downward pressure on both rents and occupancies in 2017.
The business park concept continues to be popular. A number of new projects have been announced including: Union Square and Alkaltham Business Park.
Out of the three main cities in Saudi, the DMA has the lowest average office rents, which currently stand at SAR 970. The current climate has added downward pressure on grade A office rents. Whereas rents for the prime buildings reach SAR 1,500, there are few buildings in the DMA where rents exceed SAR 1,300.
Vacancies in Q4 2016 averaged 39%. The high vacancy rate reflects the oversupply in the market caused by the completion of a number of mid-scale projects, ranging between 20,000 – 30,000 sq m, in 2014 and 2015 coupled with the crash in oil price earlier this year which caused a direct impact on tenants operating in the oil and gas sectors in the DMA.
DMA Office Market SummarySUPPLY
DMA Office Supply (2013–2018F)
521 542 669 751 751 856
30
0
200
400
600
800
1,000
1,200
2013 2014 2015 2016 2017F 2018FSource: JLL
GLA
(000
's) sq
m
Completed Future Supply
105
CBD Rents (per sq m ) / Annual Change
PERFORMANCE
COPYRIGHT © JONES LANG LASALLE IP, INC. 2017

Riyadh Residential Market Summary
Riyadh Residential Supply (2013–2018F)
Residential Property Rent and Sale Indices
940 971 989 1,010 1,010 1,035
800
850
900
950
1,000
1,100
1,050
2013 2014 2015 2016 2017F 2018FCompleted Future Supply
Num
ber o
f Uni
ts (0
00's) 25
23
Source: JLL
Rents
-1%Q-o-Q
1%Y-o-Y
Sales
-4%Q-oQ
-7%Y-o-Y
JeddahApartment (2-3BR)
Rents
-2%Q-o-Q
-3%Y-o-Y
Sales
-2%Q-oQ
-12%Y-o-Y
JeddahVilla (3BR)
Rents
3%H2 2016
-8%H2 2016
4%H2 2016
-27%H2 2016
Sales
DMAApartments (2BR)
Rents Sales
DMAVillas
Rents
-1%Q-o-Q
-4%Y-o-Y
Sales
0%Q-oQ
-1%Y-o-Y
RiyadhVilla (3BR)
Rents
-1%Q-o-Q
-4%Y-o-Y
Sales
-1%Q-oQ
1%Y-o-Y
RiyadhApartment (2-3BR)
Approximately 4,000 units mostly formed of stand alone villas and apartment buildings entered the market in Q4 2016. The only notable completion was by Masa Alamaeriah Group which added 59 villas to the market.
A further 25,000 units are expected to enter the market in 2017. Unlike other major cities, Riyadh has a number of large scale communities under development. Some of the more notable projects include the Green Oasis development by Al Argan which is expected to deliver over 900 villas in 2017, and East Gate, which plans to deliver 7,000 villas. This development appeals to the growing demand for community style living.
In an effort to increase housing supply in the Kingdom, the government has taken initiatives to work with the private sector this year.
East Gate has showcased how the private sector can successfully work with the government to deliver units to those who qualify for housing support from the Ministry of Housing and for a loan from the Real Estate Development Fund. 100% of the units have been reserved prior to the commencement of construction.
Unit prices in East Gate start from SAR 650,000 and the difference between the cost of the unit and the loan can be paid in installments over a period of four years. The bank will also hold 5% of the value of the contract for an additional year once the unit is delivered as a guarantee. In this way, the end users interests are protected by ensuring the quality of the product and the flow of finance to ensure project materialisation on time.
Y-o-Y rents for both villas and apartments decreased by 4%. Residential performances remained relatively stable across the board in Q4 2016, with falls being limited to just -1%.
Riyadh is expected to be the first city to be invoiced under the White Land Tax in January 2017. Although the effect on residential prices is unlikely to be immediate, this is a positive step forward. Affordability is becoming an increasingly significant issue, particularly after the removal of certain perks
and benefits from public sector employees pay, which further limits their ability to borrow from the banking and specialized mortgage lender sectors.
The number of residential transactions in Riyadh decreased in 2016 by around 26% compared to 2015, according to the Ministry of Justice, giving buyers more bargaining power. This may add continued downward pressure on sales prices in 2017.
SUPPLY
PERFORMANCE
1,131
Q4 2015
1,124
Q4 2016
-1%
Y-o-Y
JeddahCBD Rents(SAR per sq m)
1,253
Q4 2015
1,262
Q4 2016
1%
Y-o-Y
RiyadhCBD Rents(SAR per sq m)
Source: JLL
COPYRIGHT © JONES LANG LASALLE IP, INC. 2017

Jeddah Residential Market Summary
Jeddah Residential Supply (2013–2018F)
Residential Property Rent and Sale Indices
754 769 789 803 803 817680700720740760780800820
860840
2013 2014 2015 2016 2017F 2018FCompleted Future Supply
Num
ber o
f Uni
ts (0
00's)
14
13
Source: JLL
Rents
-1%Q-o-Q
1%Y-o-Y
Sales
-4%Q-oQ
-7%Y-o-Y
JeddahApartment (2-3BR)
Rents
-2%Q-o-Q
-3%Y-o-Y
Sales
-2%Q-oQ
-12%Y-o-Y
JeddahVilla (3BR)
Rents
3%H2 2016
-8%H2 2016
4%H2 2016
-27%H2 2016
Sales
DMAApartments (2BR)
Rents Sales
DMAVillas
Rents
-1%Q-o-Q
-4%Y-o-Y
Sales
0%Q-oQ
-1%Y-o-Y
RiyadhVilla (3BR)
Rents
-1%Q-o-Q
-4%Y-o-Y
Sales
-1%Q-oQ
1%Y-o-Y
RiyadhApartment (2-3BR)
Q4 2016 saw the completion of the first phase (33 villas) of the Murooj Villas development in North Jeddah. The remaining 76 units are expected to enter the market in 2017. A total of approximately 4,000 units were added to the market over the last quarter.
Although there were limited notable completions in 2016, the projects which did complete were part of a growing concept of quality lifestyle developments including: Diyar Al Salama (168 units), Taibah Residential Complex (143 units), Hyat Villas (96 units), the first part of phase 2 of Al Fareeda development (219 units) and Da’em Residences (120 units).
The first half of 2017 is expected to see a number of developments enter the market which were delayed from 2016, including: Farsi Seven Towers, Abraj Al Hilal 2 and Gardenia Residence.
The need to shift focus towards affordable housing development was reinforced by speakers at Cityscape Jeddah earlier this quarter. However, the majority of projects presented were high end developments in either the U.A.E or Turkey, with few local projects displayed; indicating a continued preference of Saudi investors to invest abroad.
A number of high rise towers will furnish Jeddah’s skyline over the next 2 – 3 years. Projects under development include Diamond Tower, Farsi Seven Towers, Bayat Plaza, Golden Tower and the Aqua Raffles Towers which recently begun construction. These developments will add almost 1,000 units to the market once completed.
Following the continuous growth witnessed in 2015, apartment rental growth slowed over 2016 and Q4 2016 saw a further slowdown in Y-o-Y apartment rents which increased marginally by less than 1%. Q-o-Q rents remained relatively stable decreasing marginally by less than 1%. Villa rents decreased both Q-o-Q and Y-o-Y by 2% and 3% respectively, showing a continued preference for apartments for rent.
Sales prices decreased across the board in Q4 2016 for both apartments and villas. Apartment sale prices decreased by 4% Q-o-Q and 7% Y-o-Y, while villa sale prices decreased by 2% Q-o-Q and saw a steeper decrease of 12% Y-o-Y.
Sales prices may decrease further in 2017, given the decrease in residential transactions by 16% in 2016, compared to 2015, according to the Ministry of Justice.
SUPPLY
PERFORMANCE
1,131
Q4 2015
1,124
Q4 2016
-1%
Y-o-Y
JeddahCBD Rents(SAR per sq m)
1,253
Q4 2015
1,262
Q4 2016
1%
Y-o-Y
RiyadhCBD Rents(SAR per sq m)
Source: JLL
COPYRIGHT © JONES LANG LASALLE IP, INC. 2017

DMA Residential Market Summary
DMA Residential Supply (2013–2018F)
Residential Property Rent and Sale Indices
323 326 331 340 340 349240260280300320340360380
420400
2013 2014 2015 2016 2017F 2018FCompleted Future Supply
Num
ber o
f Uni
ts (0
00's)
910
Source: JLL
Rents
-1%Q-o-Q
1%Y-o-Y
Sales
-4%Q-oQ
-7%Y-o-Y
JeddahApartment (2-3BR)
Rents
-2%Q-o-Q
-3%Y-o-Y
Sales
-2%Q-oQ
-12%Y-o-Y
JeddahVilla (3BR)
Rents
3%H2 2016
-8%H2 2016
4%H2 2016
-27%H2 2016
Sales
DMAApartments (2BR)
Rents Sales
DMAVillas
Rents
-1%Q-o-Q
-4%Y-o-Y
Sales
0%Q-oQ
-1%Y-o-Y
RiyadhVilla (3BR)
Rents
-1%Q-o-Q
-4%Y-o-Y
Sales
-1%Q-oQ
1%Y-o-Y
RiyadhApartment (2-3BR)
The total stock of residential units in the DMA was approximately 340,000 units at the end of the year. Approximately 9,000 units entered the market over the year. There were no major completions in the second half of 2016. The majority of supply remains in the form of traditional stand alone villas and apartment buildings.
Future supply may face some delays in materializing as some large scale projects, such as the remaining phases of Al Khobar Lakes, face delays.
Apartment complexes providing between 100 – 200 units are on the rise in the DMA, with a number of such projects in the pipeline. Notable projects include: The Grand Residence (220 units), Orsiyat Residential Towers (116 units), Sawari Residential Tower (130 units) and Sultan Residential Tower (208 units).
The Ministry of Housing has given permission to the Jenan Real Estate Company to sell off-plan units in its luxury residential tower; Al Khobar Views.
The Ministry hopes that allowing developers to market and sell units off-plan that projects will allow them to meet their targeted completion dates. This is turn should help improve the current situation of project delays and low materialization rates and reduce the overall housing shortage.
Additionally, the Ministry of Housing signed an MoU with a Chinese company in August to develop 100,000 units in Al Ahsa, elsewhere in the Eastern Province.
Increases in apartment and villa rents are showing signs of slowing down. Rents increased by 3% and 4% respectively over the second half of 2016. This is expected to slow further in 2017.
Prices are expected to decrease in 2017, particularly as the number of residential transactions in the DMA decreased in 2016 by 32%. Giving buyers more room for negotiation, which should add downward pressure on sales prices.
Rents and sales prices are highest in Al Khobar, compared to Dammam and Al Dhahran, as Al Khobar remains the preferred residential location in the DMA.
SUPPLY
PERFORMANCE
1,131
Q4 2015
1,124
Q4 2016
-1%
Y-o-Y
JeddahCBD Rents(SAR per sq m)
1,253
Q4 2015
1,262
Q4 2016
1%
Y-o-Y
RiyadhCBD Rents(SAR per sq m)
Source: JLL
COPYRIGHT © JONES LANG LASALLE IP, INC. 2017

Riyadh Retail Market Summary
There were no further completions in Q4 2016. All the supply which entered the market earlier in 2016 was convenience retail. However, looking ahead to 2017, there are a number of regional and super regional centers in the pipeline.
Much of the future supply over the next two years is concentrated along the Northern and Eastern Ring Roads and Al Thumama Road. With new supply entering the market in those areas, competition amongst shopping centers will be strong as they compete for the waning demand within those catchment areas.
The current concentration of many shopping centers in the central area of Riyadh, means there is an opportunity to serve relatively underprovided
areas in the city. Particularly in the growth corridors in the North and East of the city.
Shopping centers are increasingly becoming places to meet and socialize as opposed to just shopping. Particularly in a city which has limited entertainment offerings. With the expected growth in households opting to stay locally during school and public holidays, retailers are developing their entertainment and F&B offerings by introducing more concepts and new brands.
A number of new F&B retailers have recently entered the market including Nandos, Zafran, Five Guys and Shake Shack. The entrance of new F&B retailers will see more competition and improved quality in this segment in 2017.
Community center rents remained unchanged both Q-o-Q and Y-o-Y. Super regional centers on the other hand continue to show marginal decreases both Q-o-Q (-1%) and Y-o-Y (-2%). A trend which is likely to continue throughout 2017.
Vacancies increased marginally Y-o-Y and reached 9% as of Q4 2016. Given the supply which is currently under construction, this is expected to increase further over the coming year. Particularly as retailers are likely to reconsider their expansion plans given weaker household spending.
SUPPLY
PERFORMANCE
Riyadh Retail Supply (2013–2018F)
1,270 1,370 1,410 1,500 1,500 1,781
281
195
0
500
2,000
1,500
1,000
2,500
2013 2014 2015 2016 2017F 2018FCompleted Future Supply
GLA
(000
's) sq
m
Source: JLL
Retail Rents (% change)
-1%Q-o-Q
-2%Y-o-Y
0%Q-o-Q
0%Y-o-Y
RiyadhRetail Rents
-2%Q-o-Q
Super Regional RegionalSuper Regional Community Centres
-3%Y-o-Y
0%Q-o-Q
-2%Y-o-Y
JeddahRetail Rents
1,131
Q4 2015
1,124
Q4 2016
-1%
Y-o-Y
JeddahCBD Rents(SAR per sq m)
1,253
Q4 2015
1,262
Q4 2016
1%
Y-o-Y
RiyadhCBD Rents(SAR per sq m)
Source: JLL
COPYRIGHT © JONES LANG LASALLE IP, INC. 2017

Jeddah Retail Market Summary
The largest completion in 2016 was Al Yasmin Mall, the first quality shopping center to open in the area of Al Haramain Road, which added over 58,000 sq m of quality retail space. There were several other completions in 2016 including Al Khayyat 3, Galleria Commercial Center and the expansion of Al Andalus Mall.
With the delay of the completion of the Red Sea Mall and Al Rabie expansions to Q1 2017, there were no further completions in Q4 2016. Current supply of retail space in the market stands at 1.15 million sq m.
The next major completion expected to enter will be Jeddah Park (expected in late 2017), followed by King Avenue by Um Al Qura located in South Obhur.
The changing dynamic of household expenditure in Saudi creates an opportunity for affordable brands. Data from SAMA shows that although expenditure is still on the rise, the value of spending has stabilized. This suggests that households are selecting more affordable brands over luxury.
Many developers have placed their expansion plans within Jeddah on hold until there is more economic clarity. Although there have been a number of shopping centers planned or announced over the last two years, few have actually reached the construction phase. It is likely that many of these centers will face a 2 – 3 year delay in materialization.
The second half of 2016 witnessed weaker household spending in Jeddah. Y-o-Y rents decreased by 2% and 3% for regional and super regional centers respectively. Q-o-Q lease rates for regional centers remained unchanged but decreased by 2% for super regional centers.
Vacancies increased marginally during 2016 but remained at 10% in Q4. Although dated centers are still responsible for the majority of vacancies, notable, quality shopping centers, which previously enjoyed 100% occupancies, are also now witnessing vacancies of around 2%.
SUPPLY
PERFORMANCE
Jeddah Retail Supply (2013–2018F)
979 1,060 1,070 1,150 1,150 1,355
205142
0200400600800
1,4001,2001,000
1,600
2013 2014 2015 2016 2017F 2018FCompleted Future Supply
GLA
(000
's) sq
m
Source: JLL
Retail Rents (% change)
-1%Q-o-Q
-2%Y-o-Y
0%Q-o-Q
0%Y-o-Y
RiyadhRetail Rents
-2%Q-o-Q
Super Regional RegionalSuper Regional Community Centres
-3%Y-o-Y
0%Q-o-Q
-2%Y-o-Y
JeddahRetail Rents
1,131
Q4 2015
1,124
Q4 2016
-1%
Y-o-Y
JeddahCBD Rents(SAR per sq m)
1,253
Q4 2015
1,262
Q4 2016
1%
Y-o-Y
RiyadhCBD Rents(SAR per sq m)
Source: JLL
COPYRIGHT © JONES LANG LASALLE IP, INC. 2017

DMA Retail Market Summary
There were no major completions in the second half of 2016 with the current stock of retail space in the DMA remaining at 1.024 million sq m. Only one neighbourhood center is expected to complete in 2017 which will add approximately 6,000 sq m to the market.
Most of the current major retail supply in the DMA is based in Al Khobar and Al Dhahran. Looking ahead, a number of centers are planned or under construction in Dammam including Dammam Mall (by Arabian Centers) and West Avenue (by Hamat Real Estate).
In an area which has historically competed with Bahrain, convenience retail centers (those below 30,000 sq m) outnumber regional and super regional centers in the DMA. This is likely due to higher demand for larger centers in Bahrain from Saudi consumers. Particularly during weekends, school and public holidays.
JLL currently tracks 16 centers in the DMA which are classified as community, neighborhood or convenience centers, compared to 5 regional and super regional centers which typically provides a wider range of retail and entertainment options.
Weaker spending power amongst local residents may actually benefit the DMA unlike Jeddah or Riyadh where the effects of weaker spending have begun to emerge. Initial statistics indicate that less Saudi households are traveling during holiday periods. If more residents in the DMA are staying over the holidays then expenditure will be spent locally instead of in Bahrain.
Occupancies in regional and super regional centers in the DMA are quite high given the limited supply of major quality centers. Many existing centers are in the neighborhood and community center categories, which add little supply to the market at a time thus creating limited competition. Average rents in super regional centers currently average around SAR 2,800 per sq m, while regional center rents are averaging around SAR 2,100 per sq m.
Given the limited supply entering the market and the likely delay in the delivery of some of the planned and under construction centers in the DMA; rents are likely to plateau over the next year with some downward pressure possible.
SUPPLY
PERFORMANCE
DMA Retail Supply (2013–2018F)
956 1,007 1,019 1,024 1,024 1,030
6 114
0200400600800
1,4001,2001,000
1,600
2013 2014 2015 2016 2017F 2018FCompleted Future Supply
GLA
(000
's) sq
m
Source: JLL
Retail Rents (% change)
COPYRIGHT © JONES LANG LASALLE IP, INC. 2017

There were no changes to the Riyadh hotel supply during the last quarter of the year and the total number of rooms was 11,800 at the end of the year. This represents around 8% growth in available rooms over the course of 2016.
A further 4,300 keys are currently scheduled for 2017, among them several projects postponed from 2015 and 2016. We expect a relatively large share of these to experience further delays and open only in 2018 or later.
These delays in materialization of the hotel pipeline should soften the impact of the new entrants on hotel performance in Riyadh and reducing the risk of a significant oversupply situation.
The decline in demand from the business and public sector segments of the market highlights the need for Riyadh’s hospitality to diversify and to reduce its reliance on business tourism.
Evidence has already begun to show that fewer households are traveling internationally during school and public holidays due to weakening spending power. The current leisure-oriented offering is relatively limited in comparison to the size in the city. Hence the opportunity exists for the hospitality market in Riyadh to provide a more diversified offering, e.g. within the desert resort market. This can be expected to attract leisure tourists, especially from the domestic or regional market.
Pressure on hotel occupancy rates in Riyadh increased over the first half of the year and occupancy rates stabilized around 6 basis points below their 2015 levels over the second half of the year. YT Novemeber occupancy rates was 54% which is one of the lowest levels ever recorded for the city.
ADRs also continued to decline in Q4 2016, yet with a slight slow down in the pace of decrease over the last months. YT Novemeber ADR bottomed at USD 211, 7% below its 2015 level.
The strong reliance of Riyadh on business travel and domestic tourism, is the main reason for the decrease in performance. Cuts in government spending and quieter business environment over the year can largely explain the 17% drop in RevPAR which reached USD 114.
SUPPLY
PERFORMANCE
Riyadh Hotel Market Summary
Riyadh Hotel Supply (2013–2018F)
Hotel Performance
9,500 9,900 10,700 11,800 11,800 16,100
4,300
3,700
0
8,0006,0004,0002,000
12,00010,000
16,00014,000
20,00018,000
2013 2014 2015 2016 2017F 2018FCompleted Future Supply
KEYS
Source: JLL
Occupancy(%)
75%
YT Nov 2015
68%
YT Nov 2016
Average Daily Rates(USD)
255
YT Nov 2015
264
YT Nov 2016
4%
Y-o-Y
JeddahHotel Performance
Occupancy(%)
60%
YT Nov 2015
54%
YT Nov 2016
Average Daily Rates(USD)
228
YT Nov 2015
211
YT Nov 2016
-7%
Y-o-Y
RiyadhHotel Performance
Source: STR Global
Occupancy(%)
75%
YT Nov 2015
68%
YT Nov 2016
Average Daily Rates(USD)
255
YT Nov 2015
264
YT Nov 2016
4%
Y-o-Y
JeddahHotel Performance
Occupancy(%)
60%
YT Nov 2015
54%
YT Nov 2016
Average Daily Rates(USD)
228
YT Nov 2015
211
YT Nov 2016
-7%
Y-o-Y
RiyadhHotel Performance
Source: STR Global
COPYRIGHT © JONES LANG LASALLE IP, INC. 2017

The hotel sector in Jeddah has been active over 2016 with six hotels opening throughout the year. Two of which opened in the last quarter of the year including the Assila The Rocco Forte Hotel & Residential Suites (210 keys and 94 apartments) and the locally branded Casablanca Grand (125 keys) which is the fourth property for the Casablanca Group in Jeddah. These completions have increased the stock of quality hotel keys in Jeddah by around 1,200 keys which represents a 14% increase compared to last year.
Looking ahead, further completions are expected in 2017, including the Ritz Carlton (224 keys) and the Novotel Jeddah Tahlia (139 keys) which are expected to enter the market in early 2017 and Elaf Galleria (445 keys) expected later in 2017.
Weaker spending power is likely to see the number of outbound tourist trips decrease from Saudi households. Notable travel agencies have already started
to report a decline in outbound travelers during the school holiday in November compared to the same holiday last year.
Travel agencies also noted that demand for local flights increased during the school holiday as more households chose to visit domestic tourism destinations such as Jeddah and the DMA, visit relatives in other cities or go on religious visits to Makkah and Madinah.
The development of the entertainment and tourism sectors in the already popular tourist city of Jeddah was a theme at Cityscape Jeddah. Projects outlined include the eventual development of Jeddah Eye and ambitious plans to develop the Jeddah Corniche.
YT November occupancy rates in Jeddah were 68%, down by almost 7% compared to the same period last year and which can be largely explained by the decrease in business tourism.
ADRs, however, have increased by 4% to USD 264 YT November; the highest in KSA and the region. Many factors have played in the slight increase in ADR, among them the likely increase in domestic demand during school holidays and weekends due to the reduced ability of
Saudi households to travel outside the country. This is likely to have allowed operators to enhance their revenue management strategies and maximized ADRs during peak leisure periods.
RevPAR dropped by almost 7% YT November to USD 179 compared USD 192 during the same period in 2015.
SUPPLY
PERFORMANCE
Jeddah Hotel Market Summary
Jeddah Hotel Supply (2013–2018F)
Hotel Performance
7,300 7,500 8,600 9,800 9,800 11,500
1,700 1,600
0
4,0002,000
8,0006,000
12,00010,000
16,00014,000
2013 2014 2015 2016 2017F 2018FCompleted Future Supply
KEYS
Source: JLL
Occupancy(%)
75%
YT Nov 2015
68%
YT Nov 2016
Average Daily Rates(USD)
255
YT Nov 2015
264
YT Nov 2016
4%
Y-o-Y
JeddahHotel Performance
Occupancy(%)
60%
YT Nov 2015
54%
YT Nov 2016
Average Daily Rates(USD)
228
YT Nov 2015
211
YT Nov 2016
-7%
Y-o-Y
RiyadhHotel Performance
Source: STR Global
Occupancy(%)
75%
YT Nov 2015
68%
YT Nov 2016
Average Daily Rates(USD)
255
YT Nov 2015
264
YT Nov 2016
4%
Y-o-Y
JeddahHotel Performance
Occupancy(%)
60%
YT Nov 2015
54%
YT Nov 2016
Average Daily Rates(USD)
228
YT Nov 2015
211
YT Nov 2016
-7%
Y-o-Y
RiyadhHotel Performance
Source: STR Global
COPYRIGHT © JONES LANG LASALLE IP, INC. 2017

The second half of 2016 witnessed the opening of two internationally branded hotels in the DMA; the Golden Tulip Al Khobar Suites (52 keys) and the Aloft Dhahran (262 keys), increasing the supply of quality branded hotels to almost 6,500 keys.
This marks the fifth property for the Golden Tulip brand in DMA, while the Aloft Dhahran is the brand’s first property in the DMA and the second in KSA.
Although a number of hotels are currently in advanced stages of construction, only one hotel is expected to open in 2017: the Radisson Blu Resort Half Moon Bay with 136 keys which is a conversion from the former Boudl Half Moon Bay resort.
According to the Tourism Information and Research (MAS), hotels, resorts and furnished apartments experienced 95% - 100% occupancies in the DMA during the mid-term school holidays in November 2016.
Although high occupancies are not unusual during the holiday period, findings by MAS indicate a possible change in household behavior. Whereas previously families in the DMA and the Eastern Region preferred to spend their holidays in Bahrain, weaker purchasing power may lead to families in the Region opting to holiday locally more often. This is positive news for a sector which has seen poorer performance due to a decline in business visitors.
The contraction in the oil and gas sector had a direct impact on the DMA hospitality market due to its reliance on business tourism. YT November occupancy rates in the DMA have dropped significantly (-13%) to 55% compared to 68% over the same period in 2015. This is a direct result of the sharp decline in business visitors in the oil and gas and support industries.
Unlike Jeddah, where ADRs remained high despite decreasing occupancies, ADRs in the DMA have decreased by almost 3% to reach USD 165. As a result, RevPAR declined by almost 20% to an average of USD 90 YT November 2016, down from USD 115 during the same period in 2015.
SUPPLY
PERFORMANCE
DMA Hotel Market Summary
DMA Hotel Supply (2013–2018F)
Hotel Performance
4,800 5,200 6,100 6,500 6,500 6,600
1001,400
0
4,0002,000
8,0006,000
12,00010,000
16,00014,000
2013 2014 2015 2016 2017F 2018FCompleted Future Supply
KEYS
Source: JLL
Occupancy(%)
67%
YT Nov 2015
55%
YT Nov 2016
Average Daily Rates(USD)
170
YT Nov 2015
165
YT Nov 2016
-3%
Y-o-Y
DMAHotel Performance
Occupancy(%)
60%
YT Nov 2015
54%
YT Nov 2016
Average Daily Rates(USD)
224
YT Nov 2015
210
YT Nov 2016
-6%
Y-o-Y
RiyadhHotel Performance
Source: STR Global
Occupancy(%)
75%
YT Nov 2015
68%
YT Nov 2016
Average Daily Rates(USD)
255
YT Nov 2015
264
YT Nov 2016
4%
Y-o-Y
JeddahHotel Performance
Occupancy(%)
60%
YT Nov 2015
54%
YT Nov 2016
Average Daily Rates(USD)
228
YT Nov 2015
211
YT Nov 2016
-7%
Y-o-Y
RiyadhHotel Performance
Source: STR Global
COPYRIGHT © JONES LANG LASALLE IP, INC. 2017

KSA Construction CostsRef Built Asset Cost Range
SAR Low
Cost Range SAR Mid
Cost Range SAR High
HOTELS (Including FF+E, OS+E; Excluding Parking)
1.1 3 Star Hotel Per m2 5,000 6,000 7,0001.2 4 Star Hotel Per m2 6,500 7,500 8,5001.3 5 Star Business Hotel Per m2 9,000 10,500 12,0001.4 5 Star Hotel ( Resort & Destination) Per m2 10,000 11,500 13,000
RESIDENTIAL VILLAS (Including FF+E, OS+E; Excluding Parking)
2.1 Villa - Low Specification Per m2 2,100 2,300 2,6002.2 Villa - Medium Specification Per m2 2,600 2,850 3,3002.3 Villa - High Specification Per m2 4,500 5,000 6,0002.4 Apartment - Low/Medium Rise - Low
SpecificationPer m2 2,450 2,800 3,100
2.5 Apartment - Low /Medium Rise - Medium Specification
Per m2 3,000 3,350 3,700
2.6 Apartment - Low/Medium Rise - High Specification
Per m2 4,250 4,600 5,000
2.7 Apartment - High Rise - Low Specification Per m2 4,000 4,400 4,800
2.8 Apartment - High Rise - Medium Specification Per m2 4,750 5,250 5,750
2.9 Apartment - High Rise - High Specification Per m2 5,500 6,000 6,500
COMMERCIAL OFFICES (Shell and Core, Excluding Parking)
3.1 Offices - Low/Medium Rise - Low Specification Per m2 3,000 3,300 3,600
3.2 Offices - Low /Medium Rise - Medium Specification
Per m2 3,500 3,750 4,000
3.3 Offices - Low/Medium Rise - High Specification Per m2 3,800 4,200 4,600
3.4 Offices - High Rise - Low Specification Per m2 3,900 4,200 4,500
3.5 Offices - High Rise - Medium Specification Per m2 4,300 4,600 5,000
3.6 Offices - High Rise - High Specification Per m2 5,000 5,500 6,000
CAR PARKING
4.1 Surface Parking Per m2 220 260 320
4.2 Surface Parking with Shading Per m2 375 475 650
4.3 Above Grade Parking - Approximate 4 levels Per m2 1,750 2,500 3,000
4.4 Below Grade Parking - Approximate 3 levels Per m2 2,250 2,750 3,100
Tender Price Inflation (Estimated Average) Year Low Medium High
2017 -0.5% 0.0% 0.5%
2018 0.0% 0.5% 1.0%
2019 1.0% 1.5% 2.0%
Exclusions: Professional fees, Contingencies, Inflation, Municipality / Statutory fees, Land Acquisition Costs & Financing, Inflation/Escalation, External Works, Services/Diversions/Upgrades, incoming infrastructure, roads, landscaping, public realm, Value Added Tax (VAT)
Note: Costs/m2 are based on GIA, as per RICS code of measuring practice 6th Edition, all costs assume traditional procurement.
COPYRIGHT © JONES LANG LASALLE IP, INC. 2017

Opportunities in alternative assetsUnderperformance in the four main asset classes will prompt investors to consider alternative asset classes such as healthcare and education.
Demand for hotels has traditionally been led by existing supply which was generally in the high end category. Weaker spending means demand is likely to increase for budget accommodation from both Saudi households and business travelers.
There is a further opportunity within the residential sector to tap into the affordable housing segment of the market, of which, there is currently a substantial shortage across KSA.
White Land TaxWith development activity likely to increase over the next two years, opportunities for private developers to form partnerships with the public sector will arise.
Real Estate Investment Traded FundsThe introduction of REITs can provide better planning and clearer exit strategies for investors; e.g. develop – lease – sell.
Regional unrestContinued tensions in the region will likely see more resources dedicated towards security and defense, which will likely mean cutbacks in spending for other sectors.
Restrictions in the number of pilgrimsDelays in lifting the 20% restrictions on pilgrim permits will continue to impact the hotel market in Makkah, but also in Jeddah; the gateway to Makkah. These restrictions may also delay the Kingdom’s diversification efforts, as religious tourism is one of its primary drivers.
Weak oil prices
With oil prices expected to remain low for the immediate future, this will delay the recovery of the Saudi economy, particularly in cities such as the DMA which is heavily reliant on the sector.
Delays in infrastructure projectsMajor infrastructure projects such as the Jeddah, Makkah and DMA metros can have major positive effects for local economies by spurring demand from the construction and support industries.
OPPORTUNITIES RISKS
2017 and Beyond
COPYRIGHT © JONES LANG LASALLE IP, INC. 2017

Future SupplyJLL estimates of future supply are updated quarterly, based on physical inspections and discussions with developers. We remain cautious of the ability of some projects to meet their stated completion deadlines, with significant delays in project delivery leading to a low materialisation rate.
Interpretation of market positions in the rental clock6 o’clock indicates a turning point towards rental growth. At this position, we believe the market has reached its lowest point and the next movement in rents is likely to be upwards.
9 o’clock indicates the market has reached the rental growth peak, while rents may continue to increase over coming quarters the market is heading towards a period of rental stabilisation.
12 o’clock indicates a turning point towards a market consolidation / slowdown. At this position, the market has no further rental growth potential left in the current cycle, with the next move likely to be downward.
3 o’clock indicates the market has reached its point of fastest decline. While rents may continue to decline for some time, the rate of decrease is expected to slow as the market moves towards a period of rental stabilisation.
ResidentialThe supply data is based on the National Housing Census (2010) and our quarterly survey of major projects and stand-alone developments in selected areas in Riyadh and Jeddah.
Completed building refers to a building that is handed over for immediate occupation.
Residential performance data is based on two separate baskets. One for rentals in villas and apartments and another for sales performance for villas and apartments. The two baskets cover properties in selected locations across Riyadh and Jeddah.
OfficeThe supply data is based on our quarterly survey of Grade A and B office space located in certain areas of each city.
In Riyadh, the areas covered include: CBD, North and East Ring Roads, Khurais, Mazer, and Sitteen Streets.
In Jeddah, the areas covered include: Prince Sultan, Tahlia, Al-Malek, Ibrahim Al Jaffali, Amanah Street, Madinah, King Abdullah and Rowdah Streets.
Completed building refers to a building that is handed over for immediate occupation.
Definitions & Methodology
COPYRIGHT © JONES LANG LASALLE IP, INC. 2017

The rents shown in the office performance graphic represent the average of Prime, Grade A and Upper Grade B office space.
Prime Office Rent represents the top open-market rent that could be expected for a notional office unit of the highest quality and specification in the best location in a market, as at the survey date (normally at the end of each quarter period). The Prime Rent reflects an occupational lease that is standard for the local market. It is a face rent that does not reflect the financial impact of tenant incentives, and excludes service charges and local taxes.
Office vacancy rates are based on estimates by the JLL Agency team for a basket of buildings.
RetailClassification of Retail Centres is based upon the ULI definition and based on their GLA:
● Super Regional Malls have a GLA of above 90,000 sq m ● Regional Malls have a GLA of 30,000 – 90,000 sq m ● Community Malls have a GLA of 10,000 – 30,000 sq m ● Neighbourhood Malls have a GLA of 3,000 – 10,000 sq m ● Convenience Malls have a GLA of less than 3,000 sq m
Retail supply relates to the Gross Lettable Area (GLA) within retail malls tracked by JLL.
Average rents for Shopping Centres represents the quoted average rents for line shops for the major shopping malls in Riyadh and Jeddah.
Vacancy rate is based on estimates from the JLL Retail team, and in the case of Jeddah on data received from the Shopping Centre Committee of the Jeddah Chamber of Commerce and Industry, and represents the average rate across standard in line shop unit shops.
HotelsHotel room supply is based on existing supply figures provided by the Saudi Commission for Tourism and Antiquities as well as future hotel development data tracked by JLL Hotels.
Room supply includes 3, 4 and 5 star hotel rooms but excludes serviced apartments.
Performance data is based on a monthly survey of hotels conducted by STR Global.
COPYRIGHT © JONES LANG LASALLE IP, INC. 2017
JeddahLevel 2, Suite 209Jameel Square Tahliya and Andalus Streets JunctionPO Box 2091Jeddah 8909 – 23326Saudi ArabiaTel: +966 12 660 2555Fax: +966 12 669 4030
Al KhobarLevel 21, Al Khobar Gate TowerKing Fahed Road Al Khobar 31952PO Box 32348 Saudi ArabiaTel: +966 13 330 8401+966 13 330 8402+966 13 330 8403
Riyadh18th Floor, South TowerAbraj AttawuniyaKing Fahd RoadPO Box 13547Riyadh 11414Saudi ArabiaTel: +966 11 218 0303Fax: +966 11 218 0308
For questions and inquires about the KSA real estate market, please contact:
Jamil GhaznawiCountry [email protected]
Dana WilliamsonHead of Tenant Representation & Corporate Solutions [email protected]
Marko VucinicSenior Vice President (Hotels)[email protected]
Andrew WilliamsonHead of [email protected]
Asma DakkakResearch [email protected]
Hassan ShamseddineSenior Financial [email protected]
@JLLMENA youtube.com/joneslanglasalle linkedin.com/companies/jones-lang-lasalle joneslanglasalleblog.com/EMEAResearch
© 2017 Jones Lang LaSalle IP, Inc. All rights reserved. The information contained in this document is proprietary to Jones Lang LaSalle and shall be used solely for the purposes of evaluating this proposal. All such documentation and information remains the property of Jones Lang LaSalle and shall be kept confidential. Reproduction of any part of this document is authorised only to the extent necessary for its evaluation. It is not to be shown to any third party without the prior written authorisation of Jones Lang LaSalle. All information contained herein is from sources deemed reliable; however, no representation or warranty is made as to the accuracy thereof.
jll-mena.com
Craig Plumb Head of [email protected]
Fayyaz AhmadDirector, [email protected]
Ahmed AlmihdarSenior [email protected]
Andrew RotteveelHead of Project & Development [email protected]