the judicial system and economic development across eu
TRANSCRIPT

Vincenzo Bove and Elia Leandro
Unit I.1 - Competence Centre on Microeconomic Evaluation (CC-ME)
The judicial system and economic development across EU Member States
2017
EUR 28440 EN

This publication is a Technical report by the Joint Research Centre (JRC), the European Commission’s science and
knowledge service. It aims to provide evidence-based scientific support to the European policy-making process.
The scientific output expressed does not imply a policy position of the European Commission. Neither the
European Commission nor any person acting on behalf of the Commission is responsible for the use which might
be made of this publication.
Contact information
Name: Leandro Elia
Address: TP 361, Via E. Fermi 2749, I-21027, Ispra (Va), ITALY
E-mail: [email protected].
Tel.: +39 03327 83077
JRC Science Hub
https://ec.europa.eu/jrc
EUR 28440 EN
PDF ISBN 978-92-79- 65425-1 ISSN 1831-9424 doi:10.2760/449912
Luxembourg: Publications Office of the European Union, 2017
© European Union, 2017
Reuse is authorised provided the source is acknowledged. The reuse policy of European Commission documents is regulated by Decision 2011/833/EU (OJ L 330, 14.12.2011, p. 39).
For any use or reproduction of photos or other material that is not under the EU copyright, permission must be sought directly from the copyright holders.
How to cite this report: Vincenzo Bove and Leandro Elia; The judicial system and economic development across EU Member States;
EUR 28440 EN, Publications Office of the European Union, Luxembourg, 2017, ISBN 978-92-79- 65425-1, doi:10.2760/449912,
JRC104594
All images © European Union 2017

The judicial system and economic
development across EU Member States
Vincenzo Bovea and Leandro Eliab
Abstract
This analysis presents a number of correlations between EU Member States (MS)
judicial systems and indicators of firm performance. To measure the functioning of the
justice systems, we use indicators of efficiency, quality and independence. To measure
economic development, business statistics such as value added, turnover, value added per
worker and the number of enterprises are employed. Results show some strong correlations
between the length of court proceedings - a proxy for efficiency of the justice system -
and MS firm performance. At the same time, however, the correlations between economic
performances and some of the available measures capturing more complex facets of an
effective justice system, namely quality and independence, are less pronounced and robust.
Policy implications should be drawn with caution due to the small sample size and the
short time period available. Moreover, although our findings reveal interesting relations,
the evidence is best described as descriptive rather than causal.
aDepartment of Politics and International Studies, University of Warwick; email [email protected] Commission, DG Joint Research Centre, Unit I1. Modelling, Indicators and Impact Evaluation,
Competence Centre on Microeconomic Evaluation (CC-ME), TP 361, Via E. Fermi 2749, I-21027, Ispra (Va),ITALY; email: [email protected]. The present work was written when Vincenzo Bove was visitingthe JRC. We are grateful to Corinna Ghirelli, Sven Langedijk, Gianluca Mazzarella, Elena Meroni, PaoloParuolo, Giulia Santangelo for their helpful comments. The responsibility for any remaining errors or omissionsis our own.
1

2
1 Introduction
The present study aims at exploring whether a nation?s judicial system affects its levels
of economic development. The main elements of an effective justice system are its efficiency,
quality and independence. To effectively assess the functioning of the judiciary, there are a
number of indicators that can be used and that fall into six main areas: efficiency, quality and
independence. At the same time, the state of the economy can be captured by indicators of
value added, turnover, value added per worker - a proxy for labor productivity - and the number
of enterprises. Results presented in this analysis should not be interpreted as establishing causal
relationships, because the economic outcomes we investigate are undoubtedly caused by many
other factors that cannot be observed, and therefore included in the analysis. Instead, our
results offer a broad and informative range of correlation patterns. If anything, the analyses
presented below can be helpful in steering future research efforts that intend to identify causal
mechanisms.
2 Data
Data on the justice systems are taken from the “2016 EU Justice Scoreboard” published by
the DG JUST. We use a long time series to explore whether the association between the judiciary
and business performances could be explained by the implementation of reformprocesses within
thenational justicesystems. We select a sub-set of indicators for each of the three areas that
identify an effective justice system, i.e. efficiency, quality and independence. The selection
of indicators has also been dictated by the availability of time series. Efficiency of a justice
system is measured by an indicator of the time needed to resolve litigious civil and commercial
cases and the number of administrative pending cases. Quality of the judiciary is captured
by per capita total spending on law courts, the total number of judges and the number of
quality standards that MS adopted to monitor and assess the justice system. Independence is
measured by companies’ perception of judicial independence. Data on the economy of member
states are taken from the Structural Business Statistics, a database provided by Eurostat. In

3
particular, the present study focus on indicators of firm performance, such as value added,
turnover, labour productivity measured as value added per worker, and number of enterprises.
For these variables, we use the average annual compound rate for the period 2010-14. We make
sure that data on economic performances and data on the judiciary systems cover the same
time window.
3 Empirical models
To estimate the effects of the judiciary on firm performance the following linear regression
model is used:
Yi = α + βJUSTi,2010 + γYi,2010 + εi (1)
where Yi is the average annual growth rate of real value added (real turnover, real value added
per worker as a proxy for labour productivity, number of enterprises) for country i. We take
the average over the period 2010-2014. Yi,2010 is the beginning-of-period real value added (real
turnover, real value added per worker, number of enterprises) and is meant to capture initial
differences that can influence subsequent variables’ growth rate. JUSTi,2010 is the level of
judiciary functioning in 2010, the starting year for our analysis. As mentioned above, the
multi-faceted nature of judicial performance and the efficiency of the justice system is captured
by the following indicators:
• the time needed to resolve litigious civil and commercial cases (in days);
• the number of litigious civil and commercial pending cases (per 100 inhabitants).
Moreover, to capture the quality domain of the justice system the study uses
• the per capita total expenditure on law courts;
• the number of judges (per 100K inhabitants);
• the number of quality standard.

4
Finally, to gauge independence of the court and judges the study uses:
• the businesses’ survey on perception of judicial independence.
To sum up, four linear regressions for each of the above mentioned indicators of justice
systems’ functioning are estimated.
All the independent variables are transformed into logs to scale down the variance and reduce
the effect of outliers. In so doing, the coefficients can be interpreted as a semi-elasticity. Due
to the small sample size, we need to explore the effect of each indicator for the justice system
separately. However, an additional model is also provided, where the three indicators, one for
each category (efficiency, quality and independence) are included simultaneously. Indicators
considered in this specification were chosen so as to safeguard sample size.
Yet, additional variables that might explain some or all the correlation between the output
variable and the indicator of justice cannot be included. Hence, results have to be interpreted
with caution. Estimates of regression model (1) might in part capture the effects of changes in
the judiciary occurred during the period 2010-14. This would be the case if countries with issues
in the functioning of their justice system had implemented relatively more incisive reforms. As
a consequence, the justice system has level effects on the output variable of interest. To explore
this possibility, the regression model (1) is augmented with the following variable ∆JUSTi =
JUSTi,2014−JUSTi,2010, that is increasing (decreasing) in the level of justice system functioning.
4 Results
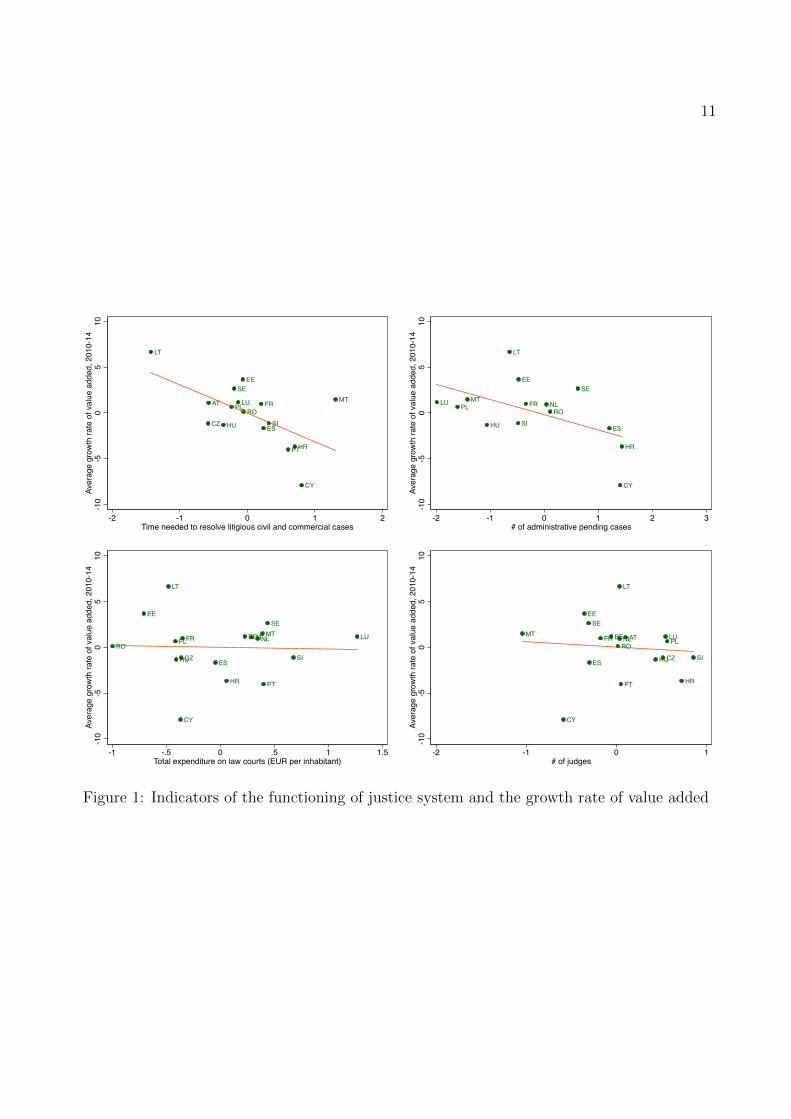
Tables (1)-(4) report the results obtained from model (1). Figures (1)-(8) give a visual
interpretation of the regression results. More precisely, Figures (1-8) display the correlations
between the dependent (∆Yi) and independent variables (JUSTi,2010) while removing the influ-
ence of the beginning-of-period variable (Yi,2010). The superimposed red line is the prediction
for ∆Yi from the linear regression (1). The sign of coefficients are all consistent with the ex-
pectations, albeit they are statistically different from zero only in very few cases. For instance,
if we look at the effect of the length of proceedings, we find that a 1% increase in efficiency is

5
predicted to boost the growth rate of value added by 0.03% (Table 1), to increase the growth
rate of turnover by 0.02% (Table 2), and to increase the growth rate of the number of firms
by 0.04%. Similar findings are obtained when the number of pending cases is the indicator for
efficiency. Yet, this negative association seems to remain robust to the inclusion of all judiciary
performance indicators (see models in columns viii).
Another important factor that appears to influence firm performance is independence. In
particular, businesses’ perception of judicial independence is significantly correlated with the
growth rate of turnover and productivity, while it seems not statistically associated with the
growth rate of number of enterprises and of value added. A 1% increase in the percentage of
companies that perceived the justice system as independent increments average growth rate of
turnover by 0.05% and that of productivity by 0.05%.
Since countries with challenges in the functioning of their justice system are more likely to
implement stronger justice reforms, and this could partly drive the statistical association be-
tween the justice system and firm performance, the regression models have been re-estimated
including the variable ∆JUSTi. This variable is meant to capture changes occurred in the
judiciary because of implementation of national reforms and remove its influence in the rela-
tionship of interest. This approach was used only for the models wherein time varying justice
indicators were factored in. The results are reported in Tables (5)-(7). There are only very
few results that remain robust to this check. For instance, while the coefficient of perceived
independence remains robust to all specifications, the length of proceedings is significant only
for the growth rate of the number of companies. Moreover, it seems there is a positive and
statistically significant effect of increasing the total expenditure on law courts, , which lifts all
indicators of business performance. However, one cannot exclude the possibility that this effect
is due to the overall increase in expenditure in response to the economic downturn.

6
5 Conclusion
This analysis explored whether a well-functioning judicial system is associated with eco-
nomic development. By using data from the “2016 EU Justice Scoreboard” and Structural
Business Statistics, the study finds strong statistically significant correlation between the length
of proceedings - a proxy for efficiency of the judiciary - and MS firm performance. On the other
hand, results for quality and independence of the judiciary are mixed. In particular, the study
cannot reject the hypothesis of no correlation between total spending on law courts, the num-
ber of judges, the number of quality standard and firm performance indicators. In addition, a
weak correlation (at conventional levels of statistical significance) is found between companies’
perceived independence of the justice system and economic development.
Our findings are subject to several caveats. First, one may be concerned with the small
sample size, which considerably hinders the confidence in our estimates by introducing bias in
the estimates or by producing spurious correlations. Small sample size also prevents generaliza-
tion of the results. Second, our model does not account for important factors that are difficult
to observe or quantify and that can drive both economic performances as well as the quality of
institutions, including the judiciary system. In addition, we confined our study to country-level
effects, rather than on the impact of the judicial system on local organizations. To dig deeper
into the relationship between the judicial system and economic development, more effort should
be devoted to the integration of court-level data with company-level information on business
characteristics.

7
Table 1: Indicators of the functioning of justice system and the average growth rate (2010-14)of value added
(i) (ii) (iii) (iv) (v) (vi) (vii) (viii)
Value added(2010) -1.14∗∗ -0.22 -0.72 -0.81 -1.14∗∗ -0.85 -0.30 1.13∗∗
(0.504) (0.57) (0.42) (0.64) (0.40) (0.55) (0.62) (0.43)Efficiency
Length of proceedings -3.34∗∗ -3.40∗∗
(1.31) (1.54)Pending cases -1.71∗
(0.81)Quality
Total spending -0.20 -0.23(1.20) (1.43)
# of judges -0.58(1.57)
# of standard -1.26(1.42)
Independence
Perceived independence (WEF) 3.53 4.33(2.49) (2.94)
R2 0.48 0.38 0.12 0.13 0.35 0.19 0.35 0.56Countries 16 14 18 18 17 18 17 16
NOTE. - Ordinary least squares estimates given. A constant is included in every model but not shown. All independent variablesare in logs. Standard errors are robust to heteroskedasticity. ∗ p < 0.10, ∗∗ p < 0.05, ∗∗∗ p < 0.01

8
Table 2: Indicators of the functioning of justice system and the average growth rate (2010-14)of turnover
(i) (ii) (iii) (iv) (v) (vi) (vii) (viii)
Turnover(2010) -0.81∗ 0.00 -0.56 -0.49 -0.82∗∗ -0.59 -0.15 -0.92∗∗
(0.44) (0.38) (0.41) (0.51) (0.33) (0.47) (0.53) (0.36)Efficiency
Length of proceedings -2.41∗∗ -2.65∗∗
(1.05) (1.16)Pending cases -1.57∗∗
(0.56)Quality
Total spending 0.65 0.33(1.20) (1.11)
# of judges -0.62(1.39)
# of standard -2.55(1.52)
Independence
Perceived independence (WEF) 5.14∗∗ 5.64∗∗
(2.05) (2.34)
R2 0.322 0.402 0.077 0.072 0.284 0.268 0.280 0.562Countries 16 14 18 18 17 18 17 16
NOTE. - Ordinary least squares estimates given. A constant is included in every model but not shown. All independent variablesare in logs. Standard errors are robust to heteroskedasticity. ∗ p < 0.10, ∗∗ p < 0.05, ∗∗∗ p < 0.01

9
Table 3: Indicators of the functioning of justice system and the average growth rate (2010-14)of productivity
(i) (ii) (iii) (iv) (v) (vi) (vii) (viii)
Productivity(2010) -0.75 -0.76 -1.23 -0.86 -0.99 -2.59∗∗ -0.48 -4.60∗∗
(0.71) (0.84) (1.31) (0.88) (1.04) (0.88) (0.53) (1.75)Efficiency
Length of proceedings -0.64 -0.47(0.98) (0.72)
Pending cases -0.71∗∗
(0.29)Quality
Total spending 0.50 1.72(1.32) (1.13)
# of judges -0.16(0.86)
# of standard -0.89(1.66)
Independence
Perceived independence (WEF) 5.60∗∗∗ 7.16∗∗∗
(1.32) (2.11)
R2 0.129 0.306 0.088 0.078 0.088 0.338 0.261 0.498Countries 16 13 17 17 16 17 16 16
NOTE. - Ordinary least squares estimates given. A constant is included in every model but not shown. All independent variablesare in logs. Standard errors are robust to heteroskedasticity. ∗ p < 0.10, ∗∗ p < 0.05, ∗∗∗ p < 0.01

10
Table 4: Indicators of the functioning of justice system and the average growth rate (2010-14)of # enterprises
(i) (ii) (iii) (iv) (v) (vi) (vii) (viii)
# enterprises(2010) -0.59 0.42 -0.02 -0.04 -0.21 0.10 0.50 -0.39(0.57) (0.68) (0.59) (0.67) (0.77) (0.66) (0.67) (0.70)
Efficiency
Length of proceedings -4.11∗∗ -3.89∗∗
(1.11) (1.33)Pending cases -0.81
(0.84)Quality
Total spending -0.05 -0.90(1.48) (0.97)
# of judges -0.27(1.72)
# of standard 0.11(2.33)
Independence
Perceived independence (WEF) 4.70 3.11(2.95) (3.06)
R2 0.503 0.045 0.000 0.001 0.006 0.113 0.162 0.540Countries 17 15 19 19 18 19 18 17
NOTE. - Ordinary least squares estimates given. A constant is included in every model but not shown. All independent variablesare in logs. Standard errors are robust to heteroskedasticity. ∗ p < 0.10, ∗∗ p < 0.05, ∗∗∗ p < 0.01
11
AT
HR
CY
CZ
EE
FR
HU
LT
LU MTPL
PT
ROSI
ES
SE
-10
-50
510
Aver
age
grow
th ra
te o
f val
ue a
dded
, 201
0-14
-2 -1 0 1 2Time needed to resolve litigious civil and commercial cases
HR
CY
EE
FR
HU
LT
LU MTNLPL
ROSI
ES
SE
-10
-50
510
Aver
age
grow
th ra
te o
f val
ue a
dded
, 201
0-14
-2 -1 0 1 2 3# of administrative pending cases
ATBE
HR
CY
CZ
EE
FR
HU
LT
LUMTNLPL
PT
ROSI
ES
SE
-10
-50
510
Aver
age
grow
th ra
te o
f val
ue a
dded
, 201
0-14
-1 -.5 0 .5 1 1.5Total expenditure on law courts (EUR per inhabitant)
ATBE
HR
CY
CZ
EE
FR
HU
LT
LUMTNL PL
PT
ROSI
ES
SE
-10
-50
510
Aver
age
grow
th ra
te o
f val
ue a
dded
, 201
0-14
-2 -1 0 1# of judges
Figure 1: Indicators of the functioning of justice system and the growth rate of value added

12
ATBE
HR
CZ
EE
FR
HU
LT
LUMT
NLPL
PT
RO
SI
ES
SE
-4-2
02
46
Aver
age
grow
th ra
te o
f val
ue a
dded
, 201
0-14
-.8 -.6 -.4 -.2 0 .2# of quality standard
ATBE
HR
CY
CZ
EE
FR
HU
LT
LUMTNLPL
PT
ROSI
ES
SE
-10
-50
510
Aver
age
grow
th ra
te o
f val
ue a
dded
, 201
0-14
-.6 -.4 -.2 0 .2 .4Perceived judicial independence (source: World Economic Forum)
BE
HR
CY
CZ
EE
FR
HU
LT
LU MTNLPL
PT
ROSI
ES
SE
-10
-50
510
Aver
age
grow
th ra
te o
f val
ue a
dded
, 201
0-14
-1 -.5 0 .5Councils for the Judiciary, appointment by govt and parliament
Figure 2: Indicators of the functioning of justice system and the growth rate of value added

13
AT
HR
CY
CZ
EE
FR
HU
LT
LU
MT
PL
PT
RO SIES
SE
-6-4
-20
24
Aver
age
grow
th ra
te o
f tur
nove
r, 20
10-1
4
-1.5 -1 -.5 0 .5 1Time needed to resolve litigious civil and commercial cases
HR
CY
EE
FR
HU
LT
LU
MT
NLPL
ROSIES
SE
-6-4
-20
24
Aver
age
grow
th ra
te o
f tur
nove
r, 20
10-1
4
-2 -1 0 1 2 3# of administrative pending cases
ATBE
HR
CY
CZ
EE
FR
HU
LT
LU
MT
NLPL
PT
RO SIES
SE
-6-4
-20
24
Aver
age
grow
th ra
te o
f tur
nove
r, 20
10-1
4
-1 -.5 0 .5 1Total expenditure on law courts (EUR per inhabitant)
ATBE
HR
CY
CZ
EE
FR
HU
LT
LU
MT
NL PL
PT
RO SIES
SE
-6-4
-20
24
Aver
age
grow
th ra
te o
f tur
nove
r, 20
10-1
4
-2 -1 0 1# of judges
Figure 3: Indicators of the functioning of justice system and the growth rate of turnover

14
ATBE
HR
CZ
EE
FR
HU
LT
LU
MT
NLPL
PT
ROSI
ES
SE
-4-2
02
4Av
erag
e gr
owth
rate
of v
alue
add
ed, 2
010-
14
-.8 -.6 -.4 -.2 0 .2# of quality standard
ATBE
HR
CY
CZ
EE
FR
HU
LT
LU
MT
NLPL
PT
RO SIES
SE
-6-4
-20
24
Aver
age
grow
th ra
te o
f tur
nove
r, 20
10-1
4
-.6 -.4 -.2 0 .2 .4Perceived judicial independence (source: World Economic Forum)
BE
HR
CY
CZ
EE
FR
HU
LT
LU
MT
NLPL
PT
RO SIES
SE
-6-4
-20
24
Aver
age
grow
th ra
te o
f tur
nove
r, 20
10-1
4
-1 -.5 0 .5Councils for the Judiciary, appointment by govt and parliament
Figure 4: Indicators of the functioning of justice system and the growth rate of turnover

15
AT
HR
CY
CZ
EE
FRHU
LT
LU
MT
PL
PTRO
SI
ES
SE
-20
24
Aver
age
grow
th ra
te o
f pro
duct
ivity,
201
0-14
-2 -1 0 1 2Time needed to resolve litigious civil and commercial cases
HR
CY
EE
FRHU
LT
LU
MT
PL
RO
SI
ES
SE
-20
24
Aver
age
grow
th ra
te o
f pro
duct
ivity,
201
0-14
-4 -2 0 2 4# of administrative pending cases
AT
BE
HR
CY
CZ
EE
FRHU
LT
LU
MT
PL
PTRO
SI
ES
SE
-20
24
Aver
age
grow
th ra
te o
f pro
duct
ivity,
201
0-14
-1 -.5 0 .5 1Total expenditure on law courts (EUR per inhabitant)
AT
BE
HR
CY
CZ
EE
FRHU
LT
LU
MT
PL
PTRO
SI
ES
SE
-20
24
Aver
age
grow
th ra
te o
f pro
duct
ivity,
201
0-14
-1.5 -1 -.5 0 .5 1# of judges
Figure 5: Indicators of the functioning of justice system and the growth rate of productivity

16
AT
BE
HR
CZ
EE
FRHU
LT
LU
MT
PL
PT
RO
SI
ES
SE
-2-1
01
23
Aver
age
grow
th ra
te o
f val
ue a
dded
, 201
0-14
-.6 -.4 -.2 0 .2 .4# of quality standard
AT
BE
HR
CY
CZ
EE
FRHU
LT
LU
MT
PL
PTRO
SI
ES
SE
-20
24
Aver
age
grow
th ra
te o
f pro
duct
ivity,
201
0-14
-.4 -.2 0 .2 .4Perceived judicial independence (source: World Economic Forum)
BE
HR
CY
CZ
EE
FRHU
LT
LU
MT
PL
PTRO
SI
ES
SE
-20
24
Aver
age
grow
th ra
te o
f pro
duct
ivity,
201
0-14
-.8 -.6 -.4 -.2 0 .2Councils for the Judiciary, appointment by govt and parliament
Figure 6: Indicators of the functioning of justice system and the growth rate of productivity

17
AT
HR
CY
CZ
EEFR
HU
LT
LU
MT
PL
PT
ROSK
SI
ES
SE
-50
510
Aver
age
grow
th ra
te o
f # o
f ent
erpr
ises,
201
0-14
-2 -1 0 1 2Time needed to resolve litigious civil and commercial cases
HR
CY
EEFR
HU
LT
LU
MT
NL
PLRO
SK
SI
ES
SE
-50
510
Aver
age
grow
th ra
te o
f # o
f ent
erpr
ises,
201
0-14
-2 -1 0 1 2 3# of administrative pending cases
ATBE
HR
CY
CZ
EEFR
HU
LT
LU
MT
NL
PL
PT
ROSK
SI
ES
SE
-50
510
Aver
age
grow
th ra
te o
f # o
f ent
erpr
ises,
201
0-14
-1 -.5 0 .5 1 1.5Total expenditure on law courts (EUR per inhabitant)
ATBE
HR
CY
CZ
EEFR
HU
LT
LU
MT
NL
PL
PT
ROSK
SI
ES
SE
-50
510
Aver
age
grow
th ra
te o
f # o
f ent
erpr
ises,
201
0-14
-2 -1 0 1# of judges
Figure 7: JIndicators of the functioning of justice system and the growth rate of # enterprises

18
ATBE
HR
CZ
EE
FR
HU
LT
LU
MT
NL
PL
PT
ROSK
SI
ES
SE
-50
510
Aver
age
grow
th ra
te o
f val
ue a
dded
, 201
0-14
-.8 -.6 -.4 -.2 0 .2# of quality standard
ATBE
HR
CY
CZ
EEFR
HU
LT
LU
MT
NL
PL
PT
ROSK
SI
ES
SE
-50
510
Aver
age
grow
th ra
te o
f # o
f ent
erpr
ises,
201
0-14
-.6 -.4 -.2 0 .2 .4Perceived judicial independence (source: World Economic Forum)
BE
HR
CY
CZ
EEFR
HU
LT
LU
MT
NL
PL
PT
ROSK
SI
ES
SE
-50
510
Aver
age
grow
th ra
te o
f # o
f ent
erpr
ises,
201
0-14
-1 -.5 0 .5Councils for the Judiciary, appointment by govt and parliament
Figure 8: Indicators of the functioning of justice system and the growth rate of # enterprises

19
Table 5: Robustness check. Indicators of the functioning of justice system and the averagegrowth rate (2010-14) of value added
(i) (ii) (iii) (iv) (v)
Value added(2010) -1.36∗∗ 0.01 -0.70∗∗ -0.78 -0.86(0.46) (0.57) (0.29) (0.53) (0.56)
Efficiency
Length of proceedings -2.16(1.34)
∆ Length of proceedings 0.34(2.22)
Pending cases -1.39(1.63)
∆ Pending cases 1.58(2.29)
Quality
Total spending 1.38(1.02)
∆ Total spending 10.77∗∗
(3.95)# of judges 0.00
(1.47)∆ # of judges 20.28
(13.99)Independence
Perceived independence (WEF) 4.82∗∗
(2.21)∆ Perceived independence (WEF) 5.03
(3.79)
R2 0.591 0.443 0.560 0.309 0.213Countries 14 13 18 18 18
NOTE. - Ordinary least squares estimates given. A constant is included in every model but not shown. All independent variablesare in logs. Standard errors are robust to heteroskedasticity. ∗ p < 0.10, ∗∗ p < 0.05, ∗∗∗ p < 0.01

20
Table 6: Robustness check. Indicators of the functioning of justice system and the averagegrowth rate (2010-14) of turnover
(i) (ii) (iii) (iv) (v)
Turnover(2010) -0.86∗ 0.20 -0.59∗∗ -0.51 -0.60(0.46) (0.45) (0.23) (0.41) (0.47)
Efficiency
Length of proceedings -1.93(1.37)
∆ Length of proceedings -1.51(2.40)
Pending cases -0.91(1.25)
∆ Pending cases 1.56(1.67)
Quality
Total spending 2.13∗∗
(0.84)∆ Total spending 9.68∗∗∗
(2.88)# of judges -0.17
(1.25)∆ # of judges 16.90
(10.59)Independence
Perceived independence (WEF) 6.09∗∗∗
(1.93)∆ Perceived independence (WEF) 3.69
(3.41)
R2 0.390 0.401 0.589 0.252 0.285Countries 14 13 18 18 18
NOTE. - Ordinary least squares estimates given. A constant is included in every model but not shown. All independent variablesare in logs. Standard errors are robust to heteroskedasticity. ∗ p < 0.10, ∗∗ p < 0.05, ∗∗∗ p < 0.01

21
Table 7: Robustness check. Indicators of the functioning of justice system and the averagegrowth rate (2010-14) of productivity
(i) (ii) (iii) (iv) (v)
Productivity(2010) -0.86 -0.60 -2.23∗∗ -0.75 -2.59∗∗
(0.79) (1.03) (0.90) (0.74) (0.92)Efficiency
Length of proceedings -0.70(1.09)
∆ Length of proceedings -1.51(2.40)
Pending cases 0.72(1.16)
∆ Pending cases 1.56(1.67)
Quality
Total spending 2.00∗∗
(0.70)∆ Total spending 5.04∗∗∗
(1.36)# of judges 0.23
(0.83)∆ # of judges 10.26∗
(5.10)Independence
Perceived independence (WEF) 5.30∗∗∗
(1.56)∆ Perceived independence (WEF) -1.20
(2.98)
R2 0.165 0.344 0.439 0.243 0.343Countries 14 12 17 17 17
NOTE. - Ordinary least squares estimates given. A constant is included in every model but not shown. All independent variablesare in logs. Standard errors are robust to heteroskedasticity. ∗ p < 0.10, ∗∗ p < 0.05, ∗∗∗ p < 0.01

22
Table 8: Robustness check. Indicators of the functioning of justice system and the averagegrowth rate (2010-14) of # enterprises
(i) (ii) (iii) (iv) (v)
# enterprises(2010) -0.94 0.75 0.17 -0.04 0.12(0.62) (0.91) (0.58) (0.68) (0.66)
Efficiency
Length of proceedings -3.39∗∗
(1.14)∆ Length of proceedings 2.82
(2.10)Pending cases 0.10
(1.45)∆ Pending cases 2.21
(3.17)Quality
Total spending 0.90(1.43)
∆ Total spending 6.83∗∗∗
(1.84)# of judges -0.22
(1.92)∆ # of judges 1.73
(15.08)Independence
Perceived independence (WEF) 5.30∗∗∗
(1.56)∆ Perceived independence (WEF) 4.99
(5.06)
R2 0.490 0.108 0.130 0.002 0.133Countries 15 14 19 19 19
NOTE. - Ordinary least squares estimates given. A constant is included in every model but not shown. All independent variablesare in logs. Standard errors are robust to heteroskedasticity. ∗ p < 0.10, ∗∗ p < 0.05, ∗∗∗ p < 0.01

Europe Direct is a service to help you find answers to your questions about the European Union
Free phone number (*): 00 800 6 7 8 9 10 11
(*) Certain mobile telephone operators do not allow access to 00 800 numbers or these calls may be billed.
A great deal of additional information on the European Union is available on the Internet.
It can be accessed through the Europa server http://europa.eu
How to obtain EU publications
Our publications are available from EU Bookshop (http://bookshop.europa.eu),
where you can place an order with the sales agent of your choice.
The Publications Office has a worldwide network of sales agents.
You can obtain their contact details by sending a fax to (352) 29 29-42758.

doi:10.2760/449912
ISBN 978-92-79-65425-1
KJ-N
A-28440-EN
-N