the journal of pulmonary technique · packages strictly for the hme/dme industry. 3b medical’s...
TRANSCRIPT

Volume 10 Number 1 Winter 2015
The Journal of Pulmonary Technique

Ad Page 2
Acoustical Percussor
i n t r o d u c i n g
The New Sound of Airway Clearance TherapyConsider the Many Advantages of the Vibralung Acoustical Percussor
✜ Easy to operate; battery-powered, lightweight and portable, can be used almost anywhere
✜ Requires only minimal patient effort with normal breathing
✜ No patient discomfort; no contact with the external chest wall
✜ Treatment times are quick and efficient
✜ Unique coupling of acoustical energy (sound waves) directly to the airway gently vibrates the airway surface to loosen secretions
✜ Sole therapy or adjunct to other methods/devices
✜ Optional simultaneous aerosol delivery
✜ Incorporates delivery of PEP (Positive Expiratory Pressure)
✜ Works during both phases of the breathing cycle
A Paradigm Shift in Respiratory CareCan you hear it? It’s the new sound of the Vibralung® Acoustical Percussor, and it’s starting a revolution in Airway Clearance Therapy (ACT). The Vibralung Acoustical Percussor applies vibratory sound waves over a wide range of frequencies (5 to 1,200 Hz) to vibrate the column of gas in the tracheo-bronchial tract. As a result, mucus is loosened and separated throughout the airways to promote safe, effective and gentle ACT like no other alternative.
The Gentler Approach to ACTThe Vibralung Acoustical Percussor is a gentler form of ACT than oscillatory PEP devices, or those that make contact with the external chest wall. It may be especially useful for airway clearance therapy when other means like vests
and hand-held chest percussors cannot be used. It’s the ideal choice whenever airway clearance is the goal and patient comfort is preferred.
© 2
014
Wes
tmed
Inc.
All r
ight
s re
serv
ed.
7132
8 Re
v.01
When Your Care Is Critical
To schedule a demonstration or for more information, visit www.vibralungACT.com, or email: [email protected], Inc. | www.westmedinc.com | 800.975.7987 ext. 1842
Vibralung Ad-F1.indd 1 6/26/14 9:57 PM
Westmed PLACED.indd 1 2014-06-27 11:52 AM
Biphasic Cuirass Ventilation (BCV)Your Patients will thank you with every breath.
855 2-GET-BCV(855-243-8228)
Homecare provided by:
Biphasic Cuirass Ventilation (BCV)Your Patients will thank you with every breath.
855 2-GET-BCV(855-243-8228)
Homecare provided by:
Biphasic Cuirass Ventilation (BCV)Your Patients will thank you with every breath.
855 2-GET-BCV(855-243-8228)
Homecare provided by:
REST_68.indd 1 2014-10-24 11:27 AM

Ad Page 5
4 Respiratory Therapy Vol. 10 No. 1 n Winter 2015
Table of ContentsDEPARTMENTS
4 News
10 Spotlight on Spirometry
15 Interview – Discussing Manually Ventilating Very Young Patients
17 Interview – Discussing Obstructive Sleep Apnea
ARTICLES
18 The Pressure-Volume Tool and ECMO
19 Bridging Patients To Lung Transplant in ERs
24 Bridging Patients To Lung Transplant
26 Improving Rehabilitation in Skilled Nursing Facilities
27 Aerosol Delivery for Pediatric Patients
30 Telehealth Monitoring and COPD
40 Trends in Acute Bronchodilator Responses
48 Studying Inflammatory Activity in COPD
Vol. 10 No. 1Winter 2015
Volume 10 Number 1 Winter 2015
The Journal of Pulmonary Technique Newsm Winter 2015
Company To Aid Armed ForcesZoll Medical Corporation, a manufacturer of medical devices and related software solutions, announced signing an agreement to buy substantially all of the assets of Impact Instrumentation, Inc., of West Caldwell, N.J., a manufacturer of respiratory care products. Impact Instrumentation has been designing and manufacturing portable and automatic emergency ventilators, portable and onboard aspirators, custom mounting systems, and specialized testing systems for over 35 years. Products include the Uni-Vent Series of portable critical care ventilators and portable resuscitators, and the Ultra-Lite Series of portable aspirators, which are used aboard ships, aircraft, and other military medical and transport services. The acquisition complements Zoll’s comprehensive portfolio of lifesaving equipment for military applications, including monitors and defibrillators. Impact is the leading supplier of transport ventilators to the U.S. military. With the addition of the Impact Instrumentation product line, Zoll will now offer solutions to optimize circulation, cardiac rhythm, and ventilation when caring for critically ill patients, particularly those serving in the armed forces.
Patent DisputesBMC Medical Co., Ltd. and 3B Medical, Inc. are claiming victories in a first round of a global battle with ResMed. “A high possibility, that the patent in suit is not valid,” the First District Court of Munich stated in a decision (official docket number 7 O 24459/13), referring to the German counterpart of ResMed’s European Patent No. 1 210 139 B1 relating to a CPAP system with detachable water tank. The Court removed the preliminary injunction based on that German counterpart, and stayed a parallel
infringement proceeding until an opinion on validity in an ongoing invalidity proceeding. Furthermore, another European patent asserted by ResMed against BMC, EP 0 661 071 relating to Auto On/Off function, has expired. The president of BMC Medical confirmed that CPAP products with detachable water tank and Auto On/Off function will be soon available again in Germany.
Companies Join Forces3B Medical, Inc. and CMB Solutions, Inc. have announced the formation of a strategic alliance. 3B Medical is a manufacturer and distributor of PAP devices, masks and accessories whose focus is on improving patient compliance and comfort. CMB Solutions provides patient contact and compliance management software through manyoutcome-based product packages strictly for the HME/DME industry. 3B Medical’s iCodeConnect-cloud based patient management system renders modems obsolete with a free and fully automated IVR compliance capture which allows sleep data to be transferred easily by patient or provider engagement. The integration of 3B’s iCode with CMB Solutions’ cloud-based system allows mutual clients an automated and efficient platform with real-time proven compliance even for same-day order processing due to their seamless integration with multiple billing software and fulfillment services. This means a huge savings for the HME/DME who will no longer have to look between billing system, compliance system, patient contact system and fulfillment system to process orders. CMB Solutions will continue to offer client-branded compliance and quality assurance surveys for all product lines, but will include iCode entry into their live call, email, text and IVR scripts. This will populate back into iCodeConnect for detailed compliance reporting for its users.
New Advances for Clinical Reporting 3B Medical has introduced what it calls open or clear airway apnea reporting, a major enhancement to clinical reporting. Central Sleep Apnea (CSA) occurs when the brain signal to the body to inhale is not communicated timely. It is a different problem than Obstructive Sleep Apnea (OSA). 3B Medical’s devices are now equipped to detect when a patient is experiencing an open or clear airway apnea in real time and respond appropriately. The reporting of open
REAL AND REPRODUCIBLE RESULTS FOR BETTER AIRWAY MANAGEMENT IN THE ICUETT biofi lm and pathogen-laden secretions
are damaging to a patient’s body and
potentially life threatening. Such buildup
increases the risk of infection, work of
breathing and may cause emergency
airway restoration. All of which increases
vent days, ICU days and total cost of care.
There is a quick, safe and cost-effective
solution: endOclear®. This innovation
is proven by clinical research.(1)(2) The
endOclear patented wiper blade is
designed to effectively clean ETT’s. The
process of cleaning the ETT takes a mere
three to fi ve seconds.
Partner with Mercury Medical in
the endOclear PROCESS IMPROVEMENT
PROGRAM. Hard dollar cost savings,
reduced MV days and improvement
in patient outcomes are
guaranteed. Call
Scott Horowitz at
800.237.6418,
ext. 3023, to
discuss this
special program.
in patient outcomes are
guaranteed. Call
Scott Horowitz at
800.237.6418,
ext. 3023, to
special program.
1. Removal of Endotracheal Tube Debris Obstructions by a Clearing Secretion Device, Massachusetts General Hospital, Cristina Mietto MD, Kevin Foley RRT, Lindsay Salerno RRT, Jenna Oleksak RRT, Riccardo Pinciroli MD, Jeremy Goverman MD, Lorenza Berra MD.
2. The Use of a Unique Mucus Shaver Clearing Device to Improve Ventilator Weaning, Linda Schofi eld RN PhD, Gary W. Saur MBA RRT, Jeffrey Washington MD, McLaren Northern Michigan.
mercurymed.com800.237.6418
Your Need . . . Our Innovation®+
MERC-2958_endOclear_Ad_RESULTS-Production.indd 1 10/14/14 4:17 PM
Continued on page 7…

6 Respiratory Therapy Vol. 10 No. 1 n Winter 2015 Respiratory Therapy Vol. 10 No. 1 n Winter 2015 7
ISSN 2152-355XPublished six times each year byGoldstein and Associates, Inc.10940 Wilshire Blvd., Suite 600Los Angeles, CA 90024 USATel: 310-443-4109 · Fax: 310-443-4110E-mail: [email protected]: www.respiratorytherapy.ca
Publisher/Editor in Chief Steve GoldsteinManaging Editor Christopher HiscoxSenior Editor Chris CampbellNews Editor Vincent TerrierAssociate Editor Jordana HammekeAssociate Editor Susan GoldsteinAssistant Editor Laszlo Sandor
Circulation, Coverage, Advertising Rates: Complete details regarding circulation, coverage, advertising rates, space sizes, and similar information are available to prospective advertisers. Closing date is 45 days preceding date of issue.
Change of Address: Notices should be sent promptly to Circulation Department. Provide old mailing label as well as new address. Allow two months for change.
Editorial Contributions will be handled with reasonable care. However, publishers assume no responsibility for the safety of artwork, photographs or manuscripts. All submissions may be emailed to [email protected]. Every precaution is taken to ensure accuracy, but the publish ers cannot accept responsibility for the correctness or accuracy of information supplied herein or for any opinion expressed. Editorial closing date is the first day of the month preceding month of issue.
©2015 by Goldstein & Associates, Inc. All rights reserved. Reproduction in whole or in part without written permission is strictly prohibited.
Mohammed Al Ahmari, PhD, MSc, RRTAARC Intl Fellow Director, Respiratory Care Program King Fahd Military Medical Complex &Prince Sultan College of Health Sciences Al-Khobar, Saudi Arabia
Prof. Nicolino Ambrosino, Head, Pulmonary Unit, Cardio-Thoracic DepartmentUniversity Hospital, Pisa; Head, Pulmonary Rehabilitation and Weaning UnitAuxilium Vitae, Volterra, Italy
Muhammad Aslam, MDAssociate Professor of PediatricsUniversity of California IrvineNeonatologistUCI Medical CenterCalifornia, USA
Eliezer Be’eri, MDDirector, Respiratory Rehabilitation UnitAlyn Hospital Founder and CSOInnovent Medical SystemsJerusalem, Israel
Melissa K. Brown, BS, RRT-NPS, RCPFaculty, Respiratory Therapy Program Grossmont CollegeEl Cajon, CA
Prof. Andrea Calkovksa, MD, PhDDepartment of Physiology, Jessenius Faculty of MedicineComenius UniversityMala Hora, Slovakia
Prof. Enrico M. CliniClinica di Malattie Apparato RespiratorioDipartimento di Oncologia Ematologia e PneumologiaUniversita Studi di Modena e Reggio, Italy
Larry H. Conway, BS, RRT Chief,Director of Respiratory CareVA Medical CenterWashington, DC
Ed Coombs, MA RRT-NPS, ACCS, FAARC Marketing Director — Intensive Care Key Application Field Manager — Respiratory Care North AmericaDraeger MedicalTelford, PA
Prof. Caglar Cuhadaroglu, MDPulmonology Department and Sleep CenterMaslak Hospital, Facutly of MedicineUniversity of AcibademIstanbul, Turkey
Antonio Esquinas, MD, PhD, FCCPDirector, International School of Noninvasive Mechanical VentilationCatholic University-San AntonioMurcia, Spain
Dr. Javier FernandezDirector of Clinical Affairs & EducationRespiratory Division Latin AmericaMiami, FL
Gerardo N. Ferrero, PTClinical Specialist, Latin AmericaBuenos Aires, Argentina
Louis Fuentes, RRTMarketing Manager — VentilationMaquet Medical Systems, USA Wayne, NJ
Dr. Miguel GoncalvesPulmonology Department and ICU and Emergency DepartmentUniversity Hospital of S. João School Faculty of MedicineUniversity of Porto, Portugal
Joshua F. Gonzales, MHA, RRT-NPS, RRT-SDS, RCPAssociate ProfessorDepartment of Respiratory CareTexas State UniversitySan Marcos, TX
Rik Goselink, PT, PhDProfessor, Rehabilitation SciencesDean, Faculty of Kinesiology and Rehabilitation SciencesUniversitaire Ziekenhuizen Leuven/Katholieke Uniersiteit Leuven, Belgium
Charles J. Gutierrez, PhD, RRT, FAARCAssistant ChiefNeurorespiratory Care Program — Spinal Cord Injury CenterJames A. Haley Veterans HospitalTampa, FL
Ken D. Hargett, MHA, RRT, RCP, FAARC, FCCMDirector, Respiratory Care Services, Pulmonary Diagnostic Laboratory, Digestive Disease EndoscopyThe Methodist HospitalHouston, TX
Surinder K. Jindal, MDPostgraduate Institute of MedicalEducation & ResearchChandigarh, India
Brent D. Kenney, BSRT, RRT, RCP, FAARCSupervisor of Care Coordinators, Respiratory Care DepartmentMercy HospitalSpringfield, MO
Prof. Dr. Naomi Kondo NakagawaDepartment of Physiotherapy, Communication Science and Disorders and Occupational TherapyFaculdade de Medicina da Universidade de Sao Paulo, Brazil
Scott E. Leonard, MBA, BA, RRTDirector of Respiratory Therapy, EEG, NeurophysiologyGeorge Washington University HospitalWashington, DC
Rebecca A. Mabry, BSSenior VP, Marketing and SalesBreathe Technologies, Inc.Irvine, CA
Paul Mathews, PhD, RRT, FCCM,FCCP, FAARC, Associate Professor,Respiratory Care Education, University of Kansas Medical CenterKansas City, KS
Benan Mayrakci, MDAssistant Professor of PediatricsDirector of Pediatric Intensive Care UnitHacettepe University School of Medicine, Ankara, Turkey
Timothy R. McConnell, PhDChair, Department of Exercise ScienceBloomsburg UniversityPennsylvania USA
Bob Messenger, BS, RRT, CPFTManager, Respiratory Clinical EducationInvacare CorporationElyria, OH
Kenneth Miller, MEd, RRT-NPS, AE-CClinical Educator, Dean of Wellness, Respiratory Care ServicesLehigh Valley Health NetworkAllentown, PA
Nawal M. MofarrehMBBS, Arab Board-InternalMedicine I, Cardiac Center-Al-Thawra General Modern Hospital,CPR Instructor & Co-OrdinatorSaudi Heart Association in affiliation with American Heart Association, CPR Center, Al-Thawra HospitalSana’a-Yemen
Richard J. Morishige, MS, RRT, RCP, RACDirector, Clinical AffairsBreathe Technologies, Inc., Irvine, CA
Pavlos M. Myrianthefs, MD, PhDAssistant ProfessorAthens University Critical Care DepartmentKAT HospitalAthens
Cheryl Needham, BA, RRTSr. Clinical Marketing ManagerGlobal Channel MarketingPhilips Home Healthcare SolutionsMurrysville, PA
Paul Nuccio, MS, RRT, FAARCDirector of Pulmonary ServicesBrigham and Women’s Hospital & Dana-Farber Cancer InstituteBoston, MA
Lisa Pappas, RRT, BSRespiratory Clinical Coordinator, NICUUniversity of Utah HospitalSalt Lake City, UT
Hossein Razavi, MD, FCCPPulmonary, Critical Care &Sleep MedicineSt. Helena, CA
Dr. John H. Riggs, PhD, RCP, FAARCDirector of Respiratory ServicesMission HospitalsAsheville, NC
Daniel D. Rowley, MSc, RRT-ACCS, NPS, RPFT, FAARCClinical CoordinatorPulmonary Diagnostics & Respiratory Therapy ServicesUniversity of Virginia Medical CenterCharlottesville, VA
J. Kyle Schwab, MDMedical DirectorLouisiana Sleep FoundationBaton Rouge, LA
Tushar A. Shah, MD, MPH, FAAPDivision of NeonatologyCincinnati Children’s Hospital Medical CenterCincinnati, OH
Chet Sivert Jr, BSDirector of Regulatory and Clinical AffairsElectromed, Inc.New Prague, MN
Dave Swift, RRTOttawa Hospital — Civic Site; CampusCoordinator (Professional Practice) &Special Care Nursery Charge Therapist;Respiratory Therapy Team Lead; National Office of the Health Care Emergency Response Team (NOHERT); Subject Matter Expert, Health Canada
Editorial Advisory Boardairway apneas can alert clinicians and physicians to a patient with higher need for care. This new enhanced efficacy reporting is a major advancement. Home Sleep Testing (HST) has been increasing in use. “Patients diagnosed by HST are often not screened or accurately diagnosed for the presence of CSA or Complex Sleep Apnea. For that reason, the Open Airway Apnea reporting in our units can act as a surrogate marker for CSA and allow for more comprehensive patient care,” said Angela Giudice, Clinical Manager for 3B Medical.
RTs Use Pig Lungs to EducateRoyal University Hospital in Saskatoon, Canada is trying to breathe new life into respiratory patient care. The RT team at the hospital has set up an information booth that includes a display of a healthy set of lungs, bright pink and hooked up to a medical ventilator as they expand and contract. They came from a pig, but are as close to the real thing as you can get. They use the pig lung because the anatomy of it is almost the same as the human lung so it gives a good idea of what the human lung actually looks like and how the human lung expands with each breathe we take. Jeffery Dmytrowich, a respiratory therapist for the Saskatoon Health Region (SHR), says it’s the perfect model that’s catching the public’s attention and has on-site respiratory therapists fielding questions including what they do. At present, there are 71 respiratory therapists in the health region treating patients of all ages. Rates of respiratory issues are climbing and they’re also getting better at diagnosing them early, said Dmytrowich, who has 15 years experience in the field, and adds that most of us take breathing for granted inhaling and exhaling up to 12 to 20 times a minute. For infants that number is 40 to 60 times a minute. Ways to avoid having to see a respiratory therapists include avoiding triggers if you have asthma and to steer clear of smoking.
Best Practices RecognizedDrager announced that it has received the 2014 Frost & Sullivan Best Practices Award for its vision to invest in technological innovations in ventilation therapy and its ability to maintain superior customer relationships. The award recognizes excellence across several categories for outstanding achievement and superior performance in areas such as leadership, technological innovation, customer service and strategic product development. Dräger received its Frost & Sullivan Best Practices Award in the Growth Excellence Leadership category for Mechanical Ventilation Equipment, which had an impressive list of finalists. Candidates were evaluated on specific market criteria, including Total Customer Experience, Product/Service Value, and Purchase and Ownership Experience. Dräger was the only company to score a 9.0 or better, on a 10-point scale, in all performance criteria measures. Dräger offers an extensive product line in ventilation therapy, including highly versatile mechanical ventilators. Dräger’s acute care ventilators include the Evita Infinity V500/V300 and Savina 300. In the neonatal intensive acute care ventilation market, Drager offers the Babylog VN 500 and Babylog 8000 Plus. The company’s transport care products include Oxylog 3000 plus and Oxylog 2000 plus.
Results in From Lung Function StudyPositive results are being touted from a third lung function study comparing the efficacy and safety of Anoro Ellipta (umeclidinium /vilanterol, ‘UMEC/VI’), the combination long-acting muscarinic antagonist (LAMA)/long-acting beta2-
adrenergic agonist (LABA), with the LAMA tiotropium, administered in the HandiHaler inhaler, in patients with chronic obstructive pulmonary disease (COPD). This study was a 24-week, blinded, parallel group, multicenter study. In this study UMEC/VI 62.5/25 mcg showed a statistically significant improvement of 112mL compared with tiotropium 18mcg (95% confidence interval (CI) 81, 144, p<0.001) for the primary endpoint measurement of lung function using trough forced expiratory volume in one second (FEV1) at the end of the treatment period (day 169). For the secondary endpoint measurement of lung function using weighted mean FEV1 0-6 hour, at the end of the treatment period (day 168) UMEC/VI 62.5/25mcg showed a statistically significant improvement of 105mL, (95% confidence interval (CI) 71, 140, p<0.001) compared to tiotropium 18 mcg. The most commonly reported side effects for both UMEC/VI and tiotropium included headache (9% UMEC/VI; 7% tiotropium), nasopharyngitis (6% UMEC/VI; 7% tiotropium), cough (3% UMEC/VI; 3% tiotropium) and back pain (2% UMEC/VI; 3% tiotropium). The overall incidence of on-treatment adverse events was 44% in the UMEC/VI group and 42% in the tiotropium group. The incidence of any on-treatment serious adverse event in both treatment arms was 4%.
FDA Approves ProductThe FDA has granted final approval of PulmoFlow, Inc.’s New Drug Application for Kitabis Pak — a co-packaging of generic tobramycin inhalation solution with a PARI LC PLUS Nebulizer. This is the first nebulized drug and device combination to be approved for patients with cystic fibrosis. Kitabis Pak is in stock and available now through PARI Respiratory Equipment, Inc. Kitabis Pak sets a new standard for nebulized drugs similar
News…continued from page 4

Ad Page 9
8 Respiratory Therapy Vol. 10 No. 1 n Winter 2015
to asthma & COPD inhalers where the drug and device are prescribed and dispensed together. The price of Kitabis Pak will be similar to the price of generic tobramycin drug alone. In addition to exclusively marketing Kitabis Pak, PARI also offers a compressor access program called PARI PROVIDE for patients who do not have the proper compressor to deliver the tobramycin inhalation solution.
Testing Devices DonatedRespiratory therapy students will soon have the opportunity to simulate the proper management of life-like respiratory ailments using the latest in training and test lung devices. Grand Rapids-based, Michigan Instruments Inc. developers of the world-renowned “Michigan Lung” plans to donate two of the respiratory simulation units to the pro-gram, which cost approximately $12,000 to $15,000 each. Grand Valley and Muskegon Community College are collaborating to offer Muskegon’s Respiratory Therapy education for GVSU students. Nursing and Physician Assistant students at GVSU will also benefit from the simulation units. These sophisticated devices provide students with real-time data, measurements and response that simulate those of a real respiratory patient. With this information, students learn how to properly ventilate and manage a variety of respiratory conditions. Michigan Instruments Inc, partnered with local software design and development firm, Atomic Object, to architect and develop cutting edge software called “PneuView 3” — their latest training and test lung software application which calculates and displays, in real time, numerous respiratory parameters and waveforms. Software improvements combined with intricate design modifications to the Michigan Lung, provide users with even greater simulation capabilities.
COPD on the Rise: StudyAs patients, caregivers and the healthcare community came together in support of World COPD Day (Nov. 19), a GSK global survey of people living with chronic obstructive pulmonary disease (COPD) shed new light on the growing burden of COPD in the US. GSK’s “Continuing to Confront COPD International Patient Survey” explores changes in COPD prevalence and disease burden, comparing data from the current study with GSK’s original “Confronting COPD” survey conducted ten years ago. COPD is a growing problem in the US and in one decade has risen from the fourth leading cause of death to the third, after heart disease and cancer. Data from the survey suggest that COPD prevalence has also increased from a decade ago, from six to seven percent of adults ages 40 years and older. The burden of COPD on patients and the US healthcare system was also high. Twenty-six percent of US participants reported visiting the
emergency room as a result of their COPD, with an additional 17 percent hospitalized within the last year — a statistic similar to that reported in Mexico, and higher than those reported in most European countries surveyed. The survey also revealed that many patients may be underestimating the severity of their symptoms. While more than half (54 percent) of US participants reported clinically significant dyspnea (shortness of breath), the majority (70 percent) classified their COPD as only mild or moderate in severity, demonstrating a disconnect between the level of symptoms and their own subjective assessment of the disease.
Promotion EarnedFollowing six years of distinguished service as a local respiratory sales executive, Michael Dougherty, BS, RRT-NPS has been promoted to the position of Key Application Field Manager for Neonatal & Respiratory Care with Dräger’s marketing team. Mike will oversee and execute the marketing and product management of Dräger’s neonatal product portfolio including; jaundice management, warming therapy, and transport devices. He joins an elite team that is focused to provide innovative and cost-effective solutions for the hospital/medical segment of Dräger. “Mike is an extremely bright and talented RRT who will be a welcome addition to the marketing team” says Edwin Coombs, Director of Marketing, Intensive Care/Neonatal Care.
Zoll Makes an ImpactZOLL Medical Corporation, a manufacturer of medical devices and related software solutions, announced that it signed an agreement to purchase substantially all of the assets of Impact Instrumentation, Inc., of West Caldwell, N.J., a manufacturer of respiratory care products. Impact Instrumentation has been designing and manufacturing portable and automatic emergency ventilators, portable and onboard aspirators, custom mounting systems, and specialized testing systems for over 35 years. Products include the Uni-Vent Series of portable critical care ventilators and portable resuscitators, and the Ultra-Lite Series of portable aspirators, which are used aboard ships, aircraft, and other military medical and transport services. The acquisition complements ZOLL’s portfolio of lifesaving equipment for military applications, including monitors and defibrillators. Impact is the leading supplier of transport ventilators to the U.S. military. With the addition of the Impact Instrumentation product line, ZOLL will now offer solutions to optimize circulation, cardiac rhythm, and ventilation when caring for critically ill patients, particularly those serving in the armed forces.
Analyzer Agreement ReachedNova Biomedical has announced that it has been awarded a group purchasing agreement with Premier, Inc., for its Blood Gas Analyzer category. The new agreement allows Premier members, at their discretion, to take advantage of special pricing and terms pre-negotiated by Premier for Nova Stat Profile Prime and pHOx Ultra analyzers and associated consumables. Stat Profile Prime’s ZERØ maintenance cartridge technology consists of individual cartridges for biosensors, calibrators, and liquid quality control. Each cartridge is maintenance-free, ready to use, and easily replaced in seconds. This design optimizes the life of each cartridge; improves analyzer uptime; and eliminates the waste, downtime, and higher costs of older combined calibrator/sensor cartridge systems. Nova’s new technology MicroSensor Card contains biosensors for pH, PCO2, PO2, Na, K, iCa, Cl, Glu, and Lac. Credit card-sized, the MicroSensor Card is automatically calibrated and always ready to deliver a full 10-test profile in
How are You Managing COPD?Your Choice is an EasyOne®
ndd products are easy-to-use, accurate and reliable
for testing anytime, anywhere. With the EasyOne Pro,
spirometry, DLCO and lung volumes can be obtained
in just 20 minutes. Automatic calibration, outstanding
worldwide service along with a maintenance free design
makes your choice for lung function an EasyOne.
Portable PFT
PC spirometry
Office spirometry
For more information go to www.nddmed.com
Respiratory_Therapy_Layout 1 2/24/14 1:25 PM Page 1

Ad Page 11
10 Respiratory Therapy Vol. 10 No. 1 n Winter 2015
just 60 seconds. MicroSensor cards can be replaced in less than half the time of older cartridge systems, which can take more than one hour to calibrate and can remain unstable with drift, frequent re-calibrations, and reduced throughput for even longer periods of time.
Dosing Study Results ReleasedSunovion Pharmaceuticals Inc. has announced dose ranging results from a Phase 2, randomized, double-blind, placebo-controlled, parallel group study of SUN-101 (glycopyrrolate inhalation solution) delivered via the innovative, proprietary eFlow nebulizer system twice a day in patients with moderate-to-severe chronic obstructive pulmonary disease (COPD). All four doses (12.5 mcg, 25 mcg, 50 mcg, and 100 mcg) studied produced statistically and clinically significant changes in forced expiratory volume in one second (trough FEV1) in bronchodilation, which persisted throughout the 24-hour dosing interval to inform dose selection. Data were presented at the 2014 American College of Chest Physicians annual meeting (CHEST 2014) in Austin. The primary endpoint of the study was change from baseline in morning trough FEV1 after 28 days of treatment.
SPOTLIGHT ON SPIROMETRYGet CompatiblenSpire Health, Longmont, CO, offers KoKo Legend portable spirometer with full USB compatibility to the industry standard KoKo PFT spirometry software. KoKo Legend’s intuitive color touch screen walks both patient and physician through standard testing procedures promoting superior patient test results. Exceeding ATS/ERS standards, KoKo Legend utilizes a unique flexible orifice pneumotach for extraordinary precision at low flow rates. Optional test grading for increased technician compliance. Choose built-in or external office printing for 8-1/2 x 11 reports. Easily transfer test results into the KoKo PFT Spirometry software and download new patients to be tested. Contact nSpireHealth.com, (800) 574-7374.
Full RangeVitalograph has been a world-leading provider of research quality spirometers for more than 50 years. Our extensive range spans from simple hand-held and desktop devices such as the micro and the Alpha, to the sophisticated Compact Expert medical workstation. Coupled with the Spirotrac V software, one can perform spirometry, COPD assessments with the 6-minute walk test, cough analysis, and various bronchial challenges with unparalleled accuracy and reliability using the Pneumotrac’s robust Fleisch pneumotachometer. Both the Compact Expert and the PC-Based Pneumotrac feature a host of optional functionality including wireless Bluetooth 12-lead ECG, wired and wireless pulse oximetry and blood pressure measurement and even a wireless Bluetooth weight scale. The hand-held In2itive spirometer can do double duty as booth a portable device and a direct to PC full function system. Spirotrac V software features Windows 7 and 8 compatibility, automatic network direct SQL-Server database operation and built-in bidirectional HL7 for interfacing to most EMRs and EHRs at no additional charge.
Go With The FlowAt ndd Medical Technologies, our EasyOne Pro is a portable single breath DLCO device allowing physicians to provide
their patients with prompt, accurate diagnosis and treatment. The EasyOne Pro performs PFTs in under 30 minutes all in on square foot. Some of the many features include Single Breath CO diffusion (DLCO), Spirometry, Flexible EMR capabilities, no warm-up time, challenge testing, no expensive service contracts along with a high-resolution color touch screen. With ndd’s TrueFlow technology there are no moving parts, no codes to enter and no disposables to calibrate. The ultrasonic flow measurement is independent of pressure, temperature and humidity. And our Easy on-PC is an easy-to-operate spirometer that uses the power of your PC, laptop, or tablet, leveraging premium ultra sound technology for a complete spirometry solution. The Easy on-PC offers challenge testing, pediatric incentives and inspiratory and expiratory real time curves. Some of the essential features of the Easy on-PC are flexible EMR capabilities, trending, selectable predicted values and interpretation, automated quality control, quick testing as well as being multilingual. With ndd’s Easy on-PC you will receive point of care testing for fast, accurate and easy diagnosis.
Make A DiscoveryFuturemed offers a line of spirometers ideal for use in an office, at the bedside, or for testing at a workplace. The most complete of the series, Discovery-2, is equipped with components that allow for testing, review and printing spirometry in virtually any location. Discovery-2 has a high resolution color screen that displays real-time graphs, allowing the technician to confirm test quality during each maneuver. Reports can be generated immediately through the on-board printer, or stored for batch printing at a later time. A more compact alternative, Spiropalm, also displays real-time spirometry graphs. Hundreds of tests can be stored internally, or saved as a pdf report on flash-drive which can then be read on standard computers. Both spirometers are available with software for interface with a PC, and meet ATS, ERS and Occupational standards for spirometry. For more information visit www.futuremed.com, or call 1-800-222-6780.
VENTILATION ROUNDTABLE
Impact Instrumentation, IncTell us about your company.Impact Instrumentation, Inc. is a US-based manufacturer of world-class Portable Critical Care Ventilators, Portable and On-Board Aspirators, Specialty Mounting Systems and test equipment. Impact has grown from a start-up company occupying a small office 38 years ago with 2 founding members to 3 large manufacturing facilities and over 160 employees in West Caldwell, New Jersey. Impact has had many significant product introductions over the years completely focused on the medical industry.
What ventilation products does your company offer?The 731 Series of ventilators include Eagle II for hospital and MRI use, EMV+ for military and mass casualty use and the AEV for non-invasive mask CPAP ventilation. These vents are rugged, weigh less than 10 lbs., offer AC, SIMV (EMV+ and Eagle II only) and CPAP/BiPAP modes with automatic leak compensation, a simple intuitive user interface, reduced O2 consumption, a battery run time of 10+ hrs, built-in rapid charger and SpO2 and can be used on patients as small as 5 kg.
Vitalograph Pneumotrac
No question!
for the highest quality spirometry with Spirotrac V software
Wouldn’t your patients benefit from having the highest quality spirometry with Spirotrac V software backed by the only company with 50 years of spirometry experience?
A variety of portable and desktop spirometers are
available — all connectable to the Spirotrac V network
1-800-255-6626 • www.vitalograph.comemail: [email protected]
Mention this ad for a free box of filters
RT Vitalograph FP R2B.indd 1 2014-03-06 12:41 AM

12 Respiratory Therapy Vol. 10 No. 1 n Winter 2015
ERT Page 13
The Eagle II ventilator is an ideal solution for intra-hospital transports as well as ER and ICU bedside ventilation. The Eagle II MRI ventilator can be used in MRI suites with magnets as large as 3 Tesla and can be placed as close as 2 meters (6.6 feet) to the magnet’s bore opening. Available 12-foot patient circuits are designed to optimize performance in the MRI suite. Workhorse ventilators that have been on the market and serving the medical, transport, military and mass casualty community for many years include the 754 Eagle and the 73X ventilators.
Tell us about your company’s current or recent R&D efforts.Impact re-invests millions of dollars into research and development each year and has a commitment to continuous improvement in manufacturing and new product development. R&D is the largest investment for Impact.
Discuss the training and support services you offer.Impact offers both on-line and in person technical and clinical training for its products. Respiratory therapists employed by Impact as well as paramedics and nurses are principally responsible for on-site training at the customer’s facility at no charge. On-line training is supported by video, Power Point and competency presentations.
Where are your products used? (ie, hospital, home, etc.)Impact’s products can be found in hospitals, ambulances, stockpiles, ships and aircraft, fire and rescue services, and over 20 military services world-wide including the US, Israel, Singapore and Australia.
What developments do you foresee for ventilation products and applications?Future ventilation products will continue to focus on ease-of-use, communication capabilities, built-in advanced technologies and clinical functional capabilities.
Philips RespironicsWhat ventilation products does your company offer?Philips’ ventilation solutions include ventilation systems for home, acute care and alternative care sites. We offer both non-invasive and invasive support solutions for a wide range of patients.
Tell us about your company’s current or recent R&D efforts?Philips is dedicated to providing care to respiratory patients requiring ventilation at every stage in their journey, and offering reliable, economical solutions that provide high quality of care for caregivers, providers and payers. We are constantly working to make our devices smaller, lighter and more user-friendly to enable patients and caregivers to integrate therapy into activities of daily living and social wellbeing. Our Trilogy noninvasive ventilator has redefined the market by incorporating features such as dual prescriptions that allow a caregiver or family member to easily transition a patient from day- to night-time settings, AVAPS-AE that automatically synchronizes with the patient’s changing respiratory needs, and mouthpiece ventilation that provides patients with portable daytime ventilation without the need for a tracheostomy.
Discuss the training and support services you offer.Philips offers a number of training options for respiratory support specialists, including hands-on clinicians training workshops for our Trilogy product family. We also offer a number of helpful clinical resources, including brochures, DVDs, caregiver instructions and user manuals so they have everything they could need right at their fingertips.
Where are your products used? (ie hospital, home, etc.)Philips provides solutions across the full respiratory care spectrum, which can be used in the home, hospital and alternative care sites. Our solutions vary depending upon setting and the individualized needs of the patient.
What developments do you foresee for ventilation products and applications?We believe that the industry will begin to see very significant improvements in ventilation solutions across the board. The ability to monitor the patient remotely may become a larger focus for innovation as clinicians and care providers want to increase efficiencies in the care and management of the chronic respiratory patient. Being able to detect or prevent an acute exacerbation can be a vital part of a disease management program by allowing clinicians to spend their time and effort on those “at risk” patients and knowing when to intervene appropriately. Ventilation technology has evolved over the past couple of decades. Advanced algorithms and capabilities of non-invasive ventilators have extended their use beyond the neuromuscular patients to COPD patients. Philips offers several non-invasive options for both acute facilities and the home. Lastly, we’ll begin seeing updated, easier to use ventilation solutions. They’ll be smaller, more portable and run off batteries with longer lives to offer patients more independence. They’ll also look less clinical and therefore less intimidating, providing both comfort and confidence to users. Right now, these machines have several alarms that can go off for a myriad of reasons, some more significant than others. Notifications will be streamlined so caregivers can more effectively provide aid to patients.
Hayek Medical DevicesWhat ventilation products does your company offer?Hayek Medical is the exclusive provider of BiPhasic Cuirass Ventilation (BCV) therapy options in the US. The current products that provide BCV are: • UnitedHayekRTX:ThisBiphasicCuirassVentilatoralso
doubles as a secretion clearance unit with assisted cough was until recently our only model. The RTX is designed for critical care but has been used frequently for in home applications
• UnitedHayekHRTX:OurnewestBiphasicCuirassVentilatorfunctionally performs as the RTX except it is designed for primarily home or basic level use. The HRTX will offer patients portability with an ability to operate for extended periods on battery power. The HRTX comes with all the important therapeutic benefits of the RTX though with somewhat less graphics or screen display while providing functionality designed to benefit home users.
Tell us about your company’s current or recent R&D efforts. United Hayek’s technology for moving air, currently, in and out of a cuirass is phenomenal almost needing to be seen and felt
MasterScope 2
Getting It Done. Right.
The new, all-in-one platform for respiratory clinical trials
ert.com/respiratory
Next GenerationDiagnostic PlatformIntegrated Spirometry, ECG, eCOA/Patient Reported Outcomes, and FeNO collection
Protocol-specific workflows for standard and complex trials
New user-friendly interface for better site performance and quality data
Resp-Print-Ad-Dec2014 2.indd 1 12/29/14 10:51 AM

14 Respiratory Therapy Vol. 10 No. 1 n Winter 2015 Respiratory Therapy Vol. 10 No. 1 n Winter 2015 15
to be believed. The development and future application of this capability means United Hayek will be a very important part of the future of pulmonary support. Also just released for the US market is our Secretion Clearance only device, the SCS. All of the very potent high frequency chest wall oscillation and assist cough functions that the RTX can apply through the cuirass will be available at a much lower cost profile for patients needing only the airway clearance functions.
Discuss the training and support services you offer.BCV, even though it is a far more natural way support patients is for most clinicians a totally new set of concepts. All of the side effects of ventilation we have been taught for so long are turned upside down with BCV and are non-existent. This is a method of support that is actually therapeutic to the lungs and other systems. Additionally due to our similarity to previous generation of negative pressure ventilation (NPV) devices most clinicians feel they know our devices’ capabilities. The Hayek so greatly exceeds the capabilities of those devices it is astonishing to those experienced with the old NPV systems. The patient’s this can serve are not limited to those with basic support needs. This means we need to educate caregivers on the concepts of this new type of support and how it works differently. We routinely provide full staff training on initial installation with follow up all the way to advanced training as users gain experience with the interventions available with BCV. As to support, we have clinical specialists that are available to our users through our company support line at any time. We also have a BCV discussion group on LinkedIn where users can discuss and relate their experiences with these devices.
Where are your products used? (ie, hospital, home, etc.)The United Hayek vents and secretion clearance products are used across the spectrum of care. When applied in the ED, patients are less breathless more quickly and hospital admission may be prevented. If used as part of ICU care, support can be non-invasive, fluid intake, nutrition and communication with the patient is not impaired and duration of critical care needs can be decreased. One of the most challenging and perhaps expensive patients hospitals deal with are the patients that move out of ICU, decompensate for lack of pulmonary support some time later and have to return to ICU more critical than when they were originally admitted. If patients are moved to the floor or step down unit with the Hayek, they will be more likely to achieve discharge on schedule. Since the Hayek can be prescribed for patients at home and is much simpler to use with less side effects than either invasive positive pressure ventilation (PPV) with trach or non-invasive PPV with mask and it includes airway clearance functions built in to the vent, patients that discharge with this device may return to acute care in the future, but the potential of their return being for reasons of pulmonary exacerbations is greatly decreased thus preventing frequent readmissions for these causes. So as you see the Hayek covers the entire spectrum resulting in improving the patient’s experience and saving money by decreasing intensity and duration of intensive care and also allowing care to continue in the home.
What developments do you foresee for ventilation products and applications?We have made great strides as an industry in meeting the pulmonary support needs of our patients and we have seen advances in technology toward the end of protecting the lungs and enhancing patient/ventilator synchrony that I believe make
real difference in patient comfort and outcomes. I foresee one major shift that can have a profound effect on outcomes for patients needing support in the future. As clinicians realize what United Hayek Medical has to offer with these products they will include this therapy in standard treatment protocols to improve results. The RTX can be used as a totally stand alone non-invasive support device that provides the advantages of far more natural support of lung inflation and deflation without mask or artificial airway, which is far more comfortable for most patients and preserves their ability to eat, drink and speak. It can also be used non-invasively in conjunction with PPV to dramatically decrease side effects and improve on clinical results. The use of BCV to facilitate weaning from PPV, shorten duration of intubation, and potentially prevent need for trach is another advancement that is on the increase. Early in my career, I was taught natural ventilation is always better that PPV but we did not have a good way to provide that type of support. Now with these devices from Hayek there is a good way. It all becomes clear when placed on a patient in distress because it’s just better!
CovidienWhat ventilation products does your company offer?Covidien offers a wide range of ventilation products, including our Puritan Bennett ventilators, heated filtration systems, ventilation accessories and software. These products may help reduce asynchrony and the risk of infections in ventilated patients from neonates to adults. Specific devices include: The Puritan Bennett 980 ventilator helps enable patients to breathe more naturally† through some of the most innovative breath delivery technology available. The PAV*+ software used by the Puritan Bennett 980 ventilator is a breath type designed to help manage work of breathing and to support the patient’s breathing efforts, allowing the patient to drive the start, duration and end of each breath. The Newport HT70 Plus ventilator combines ruggedness, ease of use and clinical proficiency with exceptional mobility for patients from 5 kg to adult. All models of the Newport HT70 ventilator can be used for home care, transport, hospital, long-term care and emergency preparedness, as well as for invasive or noninvasive ventilation. In addition to standard clinical features, the Newport HT70 Plus ventilator offers an on-airway flow sensor that provides expanded monitoring with alarms and the choice of flow or pressure trigger. With waveform graphics, an oxygen cylinder usage calculator and internal battery use time estimator, the Newport HT70 Plus ventilator goes beyond standard portable ventilation.
Tell us about your company’s current or recent R&D efforts.Dealing with leaks during mechanical ventilation is a large problem faced by many clinicians. Leaks can occur with uncuffed tubes, chest tubes, cuff leaks, and noninvasive approaches. Leaks can auto-trigger and delay cycling, due to a mismatch between the patient and ventilator. Covidien’s Leak Compensation software reacts quickly to changing leaks, helping clinicians improve patient-ventilator synchrony. The software can be used with invasive and noninvasive ventilation. A study by Oto et al. using a lung model found that the Leak Compensation software from Covidien required fewer breaths to synchronize than any other ventilator in the study.1
Continued on page 25…
Respiratory Therapy: Manually ventilating very young patients can be one of the most challenging and stressful techniques to not only learn, but to perform. There is more to it than just getting the air in and out; it’s a matter of the proper rate, tidal volume and pressure. How often do neonates need some type of ventilation support? Steve LeCroy: The numbers might surprise a few folks. According to the American Heart Association almost 10% of all neonates require some form of respiratory support at birth, and almost 4 out of every 1000 births will require mechanical ventilation. The bigger questions everyone should be asking is how often do clinicians get the opportunity to manually ventilate a patient in this age group? And when they do is it safe and effective? And I think the answer to the first part is not very often, unless of course they work in the NICU or labor and delivery. And the second answer I suspect that in many cases it may not be safe or effective. For most clinicians ventilating neonates and small infants would be considered a low probability, high risk and high liability event.
RT: Why might clinicians have difficulty manually ventilating newborns and infants? SL: The first and most obvious reason is opportunity, they just don’t do it enough. It’s very difficult to get good hands on training, we all know mannequins are a good start but are nothing like the real thing. Even though manual ventilations are considered a BLS skill it’s important to recognize that a BLS skill does not equate to an easy skill. There’s also the psychological aspect of treating babies and infants. If the average clinician is presented with a 60 year difficulty breathing patient the stress level is most likely pretty low. If the same clinician is presented with a 6 day old patient with difficulty breathing the stress level can be overwhelming. It’s like asking the average driver to drive a race car and telling them it’s just a car.
RT: What complications can be caused by improper manual ventilation techniques? SL: There is a wide range of problems associated with poor
manual ventilation techniques. Injuries can range from the development of a pneumothorax or chronic lung disease from too high of an inspiratory pressure to hypoxia from under ventilation both of which can lead to bad outcomes. Improper ventilation rates and volumes can also lead to major acid/base balance problems. For example under ventilating can not only create an hypoxic state leading to neurological problems, but can create a hypercapnic situation, and as most RT’s know a high CO2 can cause a drop in pH putting a patient into respiratory acidosis a situation in which neither organs nor medications work very well.
RT: What are the recommended starting PIP and PEEP pressures for small infants and newborns? SL: First, we should probably define the terms PIP and PEEP. PIP or peak inspiratory pressure is the maximum pressure exerted on the airway at the end of inspiration. PEEP is Positive End Expiratory Pressure or the pressure that remains in the airways at the end of expiration. Both PIP and PEEP are measured in centimeters of water or cmH2O. Clinicians that routinely treat adults are less concerned about PIP, however I believe that’s about to change. Adult manual ventilation techniques could be a discussion for another day. According to the Neonatal Resuscitation Program guidelines the recommended starting PIP should be 20 cmH2O pressure and the initial PEEP should be 5 cmH2O pressure. However, some newborns may require higher pressures to get chest rise, for example those born with surfactant issues.
RT: What type of equipment is typically used for manual ventilation of infants and newborns? SL: There are 3 basic types of manual ventilation devices a Bag-valve-mask, hyperinflation bag, and a t-piece resuscitator. Each of these devices has its pros and cons and I would recommend that all clinicians consider those pros and cons before selecting a device.
RT: What are your thoughts regarding using a bag-valve-mask on small infants or neonates? SL: This one is easy, many infant BVMs don’t come with a manometer or a PEEP valve, even though most manufacturers have them as options. Without a manometer or PEEP valve I can safely say that it’s impossible to know the PIP and PEEP pressures being used. Even with a manometer and PEEP valve it’s extremely unlikely that PIP and PEEP pressures are consistent. I would argue that a BVM without a manometer and PEEP valve is the most dangerous piece of resuscitation
In this feature, Respiratory Therapy interviews clinicians and healthcare providers about the actual application of specific products and therapies. Participating in the interview is Steve LeCroy, Clinical Manager at Mercury Medical, who has been an educator for over 30 years in the fields of respiratory and pre-hospital care, and has over 35 years of experience as a Respiratory Therapist, and over 30 years as a paramedic.
Interview
Input on questions was provided by Scott Horowitz, Senior Product Manager at Mercury Medical. If you would like to participate in this feature, as a company or healthcare provider, please contact Steve Goldstein at [email protected]. Steven C. LeCroy, MS, CRTT, EMT-P, is a retired captain/paramedic from St Petersburg Fire & Rescue, an adjunct instructor at St Petersburg College, a 35-year respiratory therapist and an expert witness in over 75 legal cases across the US. He is currently the Clinical Manager at Mercury Medical.

16 Respiratory Therapy Vol. 10 No. 1 n Winter 2015 Respiratory Therapy Vol. 10 No. 1 n Winter 2015 17
equipment in use today. If you currently use a BVM without a manometer or PEEP valve and you had to testify due to a bad outcome how would you answer if asked what pressures where use? Or did your ventilation technique meet the standard? I think the answer to both questions is pretty clear. The one positive aspect of a BVM is they don’t need an oxygen source to work since they self-inflate. For those that use a BVM and believe they can feel lung compliance are probably mistaken. Studies have shown that feeling lung compliance while using a BVM is highly overrated.
RT: What about a hyperinflation bags? SL: Hyperinflation bags or anesthesia type ventilation bags have been around for years. I think most respiratory clinicians would agree that using a hyperinflation bag is one of the most difficult skills to master. It’s been my experience that it takes significant training and experience to properly ventilate a patient using such a device. I’ve heard clinicians say you need what they call an “experienced hand”. From having experience with hyperinflation bags it does take a lot of feel to maintain the proper pressures. I’ve heard respiratory therapist comment that they prefer a hyperinflation bag because they get a better feel for lung compliance. This may be true for the more experienced users, I doubt that’s the case for the average or infrequent user.
RT: What is a t-piece resuscitator? SL: A t-piece resuscitator is a manual ventilation device that does not have a bag and has the ability to set and control PIP as well as PEEP. The device attaches directly to the patient interface and ventilation is accomplished by placing a finger over a hole on the exhalation side. Most t-piece resuscitators have an in-line manometer for continuous monitoring of the pressure and can also be used to provide CPAP.
RT: Which one of the manual ventilation devices would you recommend? SL: Without a doubt the t-piece resuscitator. In my opinion it is the safest most effective manual ventilation device regardless of the skill level of the clinician. I’m sure there are RT’s out there that will disagree they will argue that they want a device where they can feel lung compliance, a skill I believe to be poorly developed especially in inexperienced hands.
RT: What makes a t-piece resuscitator a good option for manual ventilation? SL: The first and most obvious reason is ease of use. The proper technique for both the BVM and hyperinflation bag can be difficult to master, those that teach I’m sure can sympathize with that. The only negative to using a t-piece resuscitator is that you have to have a constant gas flow. However, I believe the problem I know about is the problem I can manage. No device is perfect, but when the risks and benefits of each device are compared the advantages of a t-piece outweighs the risk.
RT: Any final thoughts when it comes to manually ventilating infants and newborns? SL: Each clinician should be asking themselves the same question. How comfortable am I with the equipment I’m using? Be critical! It’s not about the clinician it’s about the patient. Even if you have years of experience are you using the most effective safest equipment. There are only three ways to handle a situation you can ignore it, prepare for it which includes training and equipment, or you can take out more insurance. Either way the balls in your court.
Respiratory Therapy: What first drew you to treating sleep disorders, more specifically Obstructive Sleep Apnea (OSA)?Dr Sam Mickelson: During residency, I had the opportunity of training with Dr. Shiro Fujita, who had just developed the first reconstructive surgery (UPPP) for treatment of obstructive sleep apnea. However, we found that the success rate of this soft palate surgery was only 40-50%, since many of the patients also had narrowing of the lower part of the throat, (the area behind the tongue). I was convinced that we should be able to cure most patients with sleep apnea surgically. I have spent my entire career searching for better ways to treat this disorder.
RT: What makes Inspire Therapy so unique compared to OSA treatments like CPAP or Oral?SM: Both CPAP and oral appliances require the patient to use an external device to enlarge the airway. Many people have issues with these devices. Many patients complain about using CPAP as they don’t want to sleep next to someone while wearing a mask on their face and an air compressor on the nightstand. Others complain about the irritation from the mask, air swallowing effects, air pressure intolerance or having to travel with the machine. Even the oral appliance limits the user from talking or kissing their bed-partner or may aggravate the jaw joint. Inspire therapy is internal and only needs a remote control to turn it on and off. Inspire therapy is simple, easy to use, portable and your bed-partner may not even know it is in use.
RT: How invasive is the Inspire Therapy procedure compared to other traditional surgeries for OSA?SM: It is minimally invasive compared to other airway reconstructive surgeries as it does not require removal or alteration of normal throat structures. It is performed through external incisions and causes only mild post op pain.
RT: How exactly does the stimulation enlarge the patient’s airway?SM: Patient with sleep apnea have small air passages in the throat. When awake, there is good muscle tone and the airway stays open, but when asleep, muscle tone decreases and the airway closes up. Inspire therapy stimulates the upper airway nerves causing increased muscle tone, thereby preventing collapse of the airway when asleep.
RT: Can the Inspire system be controlled?SM: Yes. The remote control allows the patient to increase or decrease the intensity of the stimulation as needed. The patient can also use a delay feature so the stimulation turns on after falling asleep. We can also modify the stimulation frequency and stimulation timing during breathing. Ultimately, we confirm proper settings by testing in the sleep lab.
RT: The technology sounds similar to a pacemaker. Is that a fair comparison? Why or why not?SM: Yes, it is similar to a pacemaker in the sense that both are implanted into the body. A big difference though, is that pacemakers typically turn themselves on and off in response to an abnormal heart beat. In contrast, Inspire therapy is controlled by a remote control (like a TV remote) and is turned on any time the person is sleeping.
RT: What implications does Inspire Therapy hold for the future of the industry?SM: We anticipate a huge number of people who are struggling with or have discontinued using CPAP to now be able to be treated and cured. Since untreated and under treated sleep apnea can lead to high blood pressure, diabetes, heart attack, stroke, irregular heartbeats, Alzheimer’s disease and sudden death, this new therapy will likely improve survival and quality of life for these patients.
RT: You performed Georgia’s first Inspire Therapy procedure at Northside Hospital-Atlanta. How is the patient progressing?SM: He is doing great. A recent sleep study showed that he reduced the number of stop breathing spells from 57/hour down to 1/hour (normal is less than 5/hour) and his oxygen levels are now normal when sleeping. He is using Inspire therapy every night and his sleep apnea symptoms are completely gone.
In this feature, Respiratory Therapy interviews clinicians and healthcare providers about the actual application of specific products and therapies. Participating in the interview from Northside Hospital is Dr Sam Mickelson, Advanced Earn Nose & Throat Associates.
Interview
Input on questions was provided by Chris Campbell, Managing Editor for the Journal, Respiratory Therapy. If you would like to participate in this feature, as a company or healthcare provider, please contact Steve Goldstein at [email protected].
18 Respiratory Therapy Vol. 10 No. 1 n Winter 2015 Respiratory Therapy Vol. 10 No. 1 n Winter 2015 19
Minimizing ventilator-induced lung injury is a major concern when providing ventilation for patients with acute lung injury. The gold standard for lung protection is ARDSnet Protocol. If the oxygenation end-point cannot be achieved ECMO may be another intervention. Recently the utilization of ECMO has demonstrated a reduction in lung injury and improved outcomes. Gas exchange is managed by ECMO while the ventilator’s goal is to maintain lung inflation at the lowest pressures possible. The utilization of the Pressure-Volume Tool (P/V Tool) can help determine the lower inflection (LIP) and upper inflation points (UIP) and to provide recruitment maneuvers if required.
The P/V Tool (Hamilton Medical Inc, Reno Nevada) is a systematic ventilator application that allows the clinician to set lower and higher starting pressures, along with a Phigh (PEEP) for a sustained time frame if desired for a recruitment maneuver. After the maneuver, a pressure/volume graph is visualized to assess the inspiratory and expiratory limbs of the P/V loop. Also a loop hysteresis is available to determine if there is potential additional lung to be recruited. The P/V tool is performed every 12hrs for LIP/UIP assessment and recruitment maneuvers are performed if Clt <20cm/h20 for all patients placed on ECMO.
The P/V Tool has been utilized on a daily basis to determine the lower and upper inflection points on twenty-eight patients placed on V-V ECMO for ALI management. On thirteen of the patients whose lung compliance was <20cm/h20 (8 cm/h20 to 14 cm/h20 Q6hr recruitment maneuvers were performed for 30 seconds at a PEEP of 30 cm/h20 to improve lung compliance. All patients’ lung compliance was maintained > 20cm/h20during the ECMO utilization by performing sequential P/V tool assessment or recruitment maneuvers.
The utilization of the P/V tool helped our clinical team maintain lung inflation during ECMO. The ability to assess and adjust ventilator settings or perform recruitment maneuvers if indicated helps to maintain lung compliance during ECMO management.
The Utilization Of The Pressure-Volume Tool To Determine The Lower Inflection Point To Maintain Lung Inflation During Extra Corporeal Memebrane Oxygenation (ECMO) Kenneth Miller MEd, RRT-ACCS, Rita Pechulis MD, James Wu, MD, Dorothea Watson MD
Kenneth Miller, MEd, RRT-ACCS, NPS, AE-C Educational Coordinator, Dean of Wellness, Respiratory Care Services LVHN.
AbstractObjectives: Recent evidence suggests that high flow nasal cannula (HFNC) may have a meaningful impact on care, workflow and economics in the Emergency Department (ED) setting. The goal of the current project was to better understand how utilization of HFNC as first line of respiratory support would impact workflow within the ED, and to define hypotheses for future research related to patient outcomes.
Methods: A multicenter study was designed to assess the utilization and value of HFNC in the ED setting using a real-time, case-by-case assessment of staff perceptions and decision-making around the application of HFNC. From May of 2013 through March of 2014, six hospitals in four systems across four states participated in the project. HFNC was initiated as a front line therapy in place of other oxygen therapy modalities, and used based on clinician discretion. For each individual use of HFNC, attending staff responded to questions regarding the decision to initiate HFNC, perceptions on how the therapy performed, and decisions on patient disposition. The respondents were instructed to record their answers at the time of therapeutic intervention.
Results: A total of 128 assessments were completed. Chronic obstructive pulmonary disease (COPD), general dyspnea and congestive heart failure (CHF) represented the majority of working diagnoses treated with HFNC (41%, 29% and 17%, respectively). Seventy-four percent of HFNC interventions involved patients with hypoxemia and 25% of them involved elevated arterial carbon dioxide levels. Respondents indicated excellent respiratory responses as well as high ease of use and patient tolerance. Disposition decisions were to admit 41% of cases to the ICU, 54% to the medical floor and 5% to discharge.
Conclusions: HFNC may be useful in the ED to rapidly stabilize patients in significant respiratory distress with an easily tolerated respiratory support modality. Clinical use guidelines were established that were effective and acceptable to clinical staff. The use of the therapy may have utility in reducing ICU admissions associated with the use of NIPPV as a primary respiratory modality.
IntroductionHigh Flow Nasal Cannula (HFNC) is a novel respiratory therapy delivered through a loose fitting nasal cannula that improves breathing efficiency by using high flow rates to flush the respiratory dead space of expired air and replace it with fresh respiratory gas 1,2. Proper conditioning of respiratory gas to near 100% relative humidity and body temperature allows for the administration of high flow rates without damaging the nasal mucosa3-5. The high flow rates interact with the mechanisms of spontaneous breathing to improve ventilatory efficiency and therefore reduce work of breathing. Evidence suggests that the mechanisms of action for HFNC include purging nasopharyngeal dead space6, reducing inspiratory resistance, improving conductance and pulmonary compliance7, providing mild positive distending pressure8-10 and restoring mucocilliary function through rehydration11,12.
HFNC is used on a widespread basis within the intensive care setting for ventilatory support to reduce the patient’s work of breathing and to alleviate dyspnea. It has consistently been used as a stopgap measure to treat patients in respiratory distress, and as an alternative to pressure based non-invasive ventilation that results in similar outcomes13,14. While both HFNC and supplemental oxygen are typically initiated as frontline therapies, clinical experience indicates that the numerous mechanisms of action for HFNC provides a higher level of support than simple oxygen therapy15,16.
Clinical experience with HFNC in multiple care settings shows it is easily tolerated, simple to administer and monitor, and rapidly stabilizes patients in distress. This experience suggests that HFNC may have meaningful impact on care, workflow and economics in the Emergency Department (ED) setting. Several recent articles have evaluated the performance of HFNC specifically in the ED including both pediatric17,18 and adult applications15,16, as well as three editorial comments19-21.
Although there is sufficient rationale for the adoption of HFNC in emergency care, the utilization within and impact on ED workflow has yet to be described. The goal of the current study was to ascertain ED staff opinions on the utility, practicality and value of HFNC in emergency care, and to help develop hypotheses for future research related to HFNC therapy and patient outcomes. The authors represent the clinical staff from six hospitals where HFNC was being introduced into the ED as a front line therapy. The hypothesis was that HFNC would have a positive impact on emergency care based on ED staff
Assessment of High Flow Nasal Cannula Therapy use in the Emergency Department Setting: Observations of Practice Across Four SystemsSheldon Spivey, RRT1, Terrell Ashe, RRT-NPS1, Rose Dennis, MHA, RN, RRT, Russell Graham, BSRT, RRT, CPFT2, Bobbie Melton, BSRT, RRT2, Suzanne Croft, MHS, RRT3, Terry Ellis, BS, RRT4, Todd McCarl, MBA, RRT5, Jody Miller, BSRT, RRT5, Susan Anderson, MHS, RRT5, Tracy Green, RRT6, Charles Dunlap, BSRT, RRT-NPS7, Mark Kolnsberg, MBA, CPM, CBET7, Thomas L Miller, PhD7,8
About the authors: (1)Athens Regional Medical Center, Athens GA. (2)Memorial Hermann Hospital - Texas Medical Center, Houston, TX. (3)Memorial Hermann Hospital - Northeast, Humble, TX. (4)Erlanger Health System, Chattanooga, TN. (5)Mission Hospital, Asheville, NC. (6)Memorial Hermann Hospital - The Woodlands, The Woodlands, TX. (7)Vapotherm, Inc., Exeter, NH. (8)Jefferson Medical College, Philadelphia, PA.

20 Respiratory Therapy Vol. 10 No. 1 n Winter 2015 Respiratory Therapy Vol. 10 No. 1 n Winter 2015 21
perceptions of the effectiveness in providing respiratory support among various pulmonary pathologies, the practicality of use in the ED setting and the influence on patient disposition.
MethodsStudy DesignA multicenter study was designed to assess staff perceptions on the utility and value of HFNC in the ED setting. This study was conducted during a period in which HFNC was being introduced into the ED at the participating centers. The study was part of a quality assessment in each institution as to the early impact of HFNC in the ED. The data was collected by having attending staff respond to a set of assessment questions each time they administered HFNC in the care of an ED patient. The respondents were instructed to complete the assessment document as close to the time of HFNC initiation as appropriate in order to improve recall of their perceptions. The form used for data collection was designed for rapid completion, where staff perception information was collected using a Likert-type scale, and judgments were reported by circling choices.
From May of 2013 through March of 2014, six hospitals in four systems across four states (Georgia, Texas, Tennessee, and
North Carolina, USA) participated in the project. Each center already used HFNC in the Intensive Care Units and respiratory staff was trained and competent in its delivery. Application of HFNC was by clinician discretion on a case-by-case basis; there were no defined inclusion criteria for this project. All data represent staff self-reported perceptions related to device utility, including presumed diagnoses at the time of HFNC initiation and perceptions regarding disposition options; no actual patient information was used in this study.
Application of HFNCParticipating centers used the Precision Flow® HFNC system (Vapotherm, Exeter, NH, USA), and prior to initiation of the project agreed upon HFNC application guidelines for use in the ED. The application guidelines, shown in Figure 1, provided a set of decision trees for determining starting cannula flow rates and inspiratory oxygen fractions, as well as recommendations for increasing these parameters. The two decision trees were differentiated by early indications of whether hypoxia or work of breathing was the primary symptomology, and initial application differed by the starting oxygen fraction. Starting inspiratory oxygen fraction was set at 100% for hypoxia and 50% for increased work of breathing. HFNC was always initiated as a front line respiratory support modality, and pressure-based
Vapotherm Protocol Guidelines: Patient is Spontaneously Breathing Patient is Alert and Oriented Patient Has a Protected Airway
Vapotherm (HFT) Candidates presents with one of more of the clinical presentations: Increase Work of Breathing Increase Cardiac Workload Refractory Hypoxemia
Conditions indicative of, but not solely attributed to the following clinical diagnosis:
Mild to Moderate CHF Acute Exacerbation of COPD Asthma Pneumonia Emphysema
Bronchitis RSV Bronchiolitis Influenza Pleural Effusion
Part 2 of the protocol should be considered when:
Patient Has a History ofChronic Lung Disease
Patient’s Arterial Blood Gasindicates a PartlyCompensated ORCompensated ChronicRespiratory Acidosis
Part 1
PRECISION FLOW - HIGH FLOW THERAPY
EMERGENCY ROOM - ADULT PROTOCOL
310032 Rev. A For detailed information about Vapotherm applications and study results, visit our web site www.vtherm.com or call 1-866-827-6843.
Part 2 of the protocol should be considered when:
Patient Has a History ofChronic Lung Disease
Patient’s Arterial Blood Gasindicates a PartlyCompensated ORCompensated ChronicRespiratory Acidosis
Part 2 Part 2
PRECISION FLOW - HIGH FLOW THERAPY
EMERGENCY ROOM - ADULT PROTOCOL
Figure 1. High Flow Nasal Cannula Clinical Application Guidelines. Participating centers agreed on these clinical use guidelines for the application of High Flow Nasal Cannula Therapy (HFT) using the Vapotherm Precision Flow, with only minor modifications between centers to fit each center’s policy and procedure guidelines. Real-time decision-making was always at the discretion of attending staff.
therapies were recommended for patients failing to respond to HFNC. Real-time decision-making was always at the discretion of attending staff.
Recording Assessment and Clinical PerceptionsTo classify the clinical perceptions across the various conditions warranting HFNC use, respondents were asked to choose responses related to:
• If they had followed or deviated from the HFNC application guidelines (e.g., by using a higher or lower initial flow or oxygen fraction).
• The presentation symptomology that lead to the choice to use HFNC for the patient: hypercapnia, hypoxemia and/or increased work of breathing (WOB).
• The working ED diagnosis as presumed at the time HFNC was initiated (not necessarily the patient’s confirmed diagnosis): Chronic Obstructive Pulmonary Disease (COPD), Congestive Heart Failure (CHF), Chronic Respiratory Failure (CRF), Drug Over Dose (OD), Asthma or General Dyspnea.
To assess attending staff’s perceptions of HFNC performance and utility for each patient application, the following questions were asked. The responses were given in the format of a Likert-like scale between 1 and 5, where 5 represented ideal and 1 represented disappointment.
• Patient respiratory response to therapy, ranging from Excellent (5) to Insufficient (1).
• Frequency of rain-out, interface slippage or other technical/clinical difficulties applying therapy, ranging from Never (5) to Frequent (1).
• Patient comfort and tolerance of therapy, ranging from Excellent (5) to Insufficient (1).
• Simplicity of set-up and use, ranging from Simple (5) to Complex (1).
• Monitoring and support of therapy required (adjustments, refilling fluids, adjusting interface), ranging from Minimal (5) to Frequent (1).
To assess the impact of HFNC on workflow and disposition, staff were asked to report the decisions on patient disposition from the ED. Responses included patients’ post ED assignment
to either the intensive care unit (ICU), be released to a medical floor (Floor), discharged from the hospital (Discharge) or some other arrangement (Other).
Data AnalysisData were compiled in a single database to represent overall staff perceptions across all centers. Data on working diagnosis and decisions on disposition are presented as incidence and percentage of total cases, while categorical data on staff feedback are presented as median ± 95% Confidence Interval (CI), mode and range. Data were analyzed using MedCalc statistical software, v 13.3.0.0 (MedCalc Software bvba, Belgium).
ResultsA total of 128 assessments were completed across the six participating centers as shown in Table 1. Seventy-two (56%) respondents reported the adopted application guidelines were followed, 8 (6%) reported they deviated from the application guidelines and 48 (38%) did not report on this question.
Presentation symptomology and diagnosis The decision to initiate HFT was associated with the symptomatology summarized in Table 2. Because of overlap, the percentages for each recognized condition add up to more than 100%. Seventy-four percent of HFNC interventions involved patients with hypoxemia and 25% of them involved elevated arterial carbon dioxide levels. Ninety percent of the interventions in hypercarbic patients involved hypoxemia as well in a combined respiratory failure presentation. Clinical assessment of an increased work of breathing was common to 84% of the total HFNC uses.
Figure 2. Working Diagnoses. Breakout of presumed primary diagnosis (working diagnosis) at the time HFNC was initiated in the Emergency Department. COPD= Chronic Obstructive Pulmonary Disease, CHF = Congestive Heart Failure, Overdose = drug overdose.
Table 1: Responses by center
Total Responses 128
Athens Regional Medical Center 68
Memorial Herman Texas Medical Center 16
Baroness Erlanger 16
Memorial Herman Northeast 11
Mission Hospital 9
Memorial Herman The Woodlands 8
Table 2: Presentation Symptomology
Condition n %
Hypoxemia 94 74
Hypercapnia 32 25
Combined Failure 28 22
Increased WOB 108 84
n = total number of cases for each condition, where the n > 128 HFNC uses because of cases who had multiple presentations; % relative to the n per the total 128.
Table 3: Subjective Performance Ranking per Staff Response
n Range Mode Median 95% CI Median
Patient respiratory response 127 1 - 5 5 4.0 4.0 to 5.0
Technical difficulties 123 1 - 5 5 5.0 5.0 to 5.0
Comfort and tolerance 118 1 - 5 5 5.0 4.1 to 5.0
Simplicity 123 1 - 5 5 5.0 5.0 to 5.0
Monitoring 122 1 - 5 5 5.0 4.0 to 5.0
Scores represent the perception responses on a Likert scale where 5 was the ideal situation and 1 was least desirable. n = total number of reports with a response to the question.

22 Respiratory Therapy Vol. 10 No. 1 n Winter 2015 Respiratory Therapy Vol. 10 No. 1 n Winter 2015 23
The working diagnoses at the time of HFNC treatment are shown in Figure 2. The most common presumed primary diagnoses were COPD (n = 52; 41%), General Dyspnea (n = 37; 29%) and CHF (n = 21; 17%). Other presumed diagnosis totaling 13% of all cases consisted of asthma, pneumonia, drug overdose, sarcoidosis and unreported conditions. There were many cases of multiple working diagnoses, where COPD was confounded with CHF in 21 cases (40% of all COPD) and CHF was confounded with pneumonia in 1 case (6% of all CHF).
Perception of HFNC Performance Table 3 shows the range, median and mode subjective staff rating given for each of the five performance categories related to HFNC use. Patient respiratory response was perceived to be more than adequate, with a modal score of 5 and a median score of 4 (95% CI 4.0 to 5.0, range 1 to 5). There were minimal technical difficulties reported, with only four instances reporting average or below with respect to perceived technical challenges. Median rating for perceived technical competence was 5.0 (95% CI 4.3 to 4.6, range 1 to 5), with a mode of 5.
Comfort and tolerance of the therapy by the patient were rated very highly across the group with a median 5 out of 5 (95% CI of the median 5.0 to 5.0, range 1 to 5). Anecdotal instances (assessed via the free-text comment section of the collection tool) of mechanical ventilation avoidance were reported in patients who may have been intubated secondary to being intolerant of a full-face non-invasive ventilation mask. Simplicity of use was rated highly, with a median of 5.0 (95% CI of the median 5 to 5, range 1 to 5), as was the perception of a minimal requirement for monitoring during therapy, with a median of 5.0 (95% CI of the median 4 to 5, range 1 to 5).
Decisions on DispositionStaff reported the post ED disposition decisions for 94 cases where HFNC was administered in the ED (Figure 3). Across all diagnoses, the majority of cases resulted in a discharge to the Medical Floor (54%) compared to the ICU (41%), with a small number of patients who were discharged to home or left against medical advice (5%). This trend for a majority of Medical
Floor admissions held through each presumed diagnosis and presentation category, where COPD was associated with 65% floor admission, CHF with 50%, a hypercarbia presentation with 57% and hypoxemia with 55%. The ratio of Floor to ICU admissions was 1.43:1 across all responses, 2.2:1 for COPD, 1.28:1 for CHF, 1.45:1 for hypercarbia and 1.33:1 for hypoxemia.
DiscussionThe goal of this project was to identify the impact of introducing HFNC to the ED department based on ED staff perceptions and resultant patient disposition following treatment with HFNC in the ED. The focus was on application, staff acceptance and patient disposition. A secondary objective was to define a hypothesis for a prospective clinical trial of patient outcomes and value using HFNC as a ventilatory support modality in the ED. The situations in which the staff felt HFNC should be used as a treatment modality represented a typical spread of clinical presentations for this geographical region (South and South Eastern United States), and no one set of respiratory symptomologies emerged as particularly responsive or unresponsive to HFNC. However, HFNC does appear to be contraindicated for patients under the influence of a drug overdose, and thus depression of respiratory drive. This is in line with the primary indication for HFNC that the patient is able to breathe spontaneously and protect his/her airway.
Overall, staff perceived excellent success with HFNC to affect respiratory response and to achieve patients’ satisfaction and compliance. Few instances occurred where staff felt that patients were unable to be supported by HFNC, and in no circumstances did staff perceive that patients were unable to tolerate the therapy. In the majority of cases, staff made decisions to admit HFNC patients to the general care floors, as opposed to the ICU. Guidelines for non-invasive ventilation, and the common practice in all participating centers, recommend ICU admission for patients on NIV.22,23 It is likely that any avoidance of NIV resulted in a meaningful change to workflow and total cost of care based on patients being admitted to lower acuity care areas instead of the ICU.
A number of case reports were generated for presentation from the current project (abstracts). One instance involved a complex 60 year-old COPD patient with lung cancer, chronic renal failure and CHF, presenting in combined failure, and who was intubated with similar presentations on prior visits. The medical team was anticipating intubation when HFNC was trialed; however, moments after initiation of HFNC the patient began to return toward normal respiratory values with a markedly reduced work of breathing. The medical team concluded that this patient avoided intubation and her exacerbation was successfully mitigated through use of HFNC, despite failing non-invasive ventilation. A second patient presenting with orthopnea and acute onset of severe respiratory distress, have a respiratory rate near 50 breaths/min, was initially treated with non-invasive ventilation via full facemask. She was started on HFNC in an effort to oxygenate prior to intubation; however, rapidly following HFNC initiation her respiratory rate dropped to 12 breaths/min. The effort to intubate was successfully aborted.
The responses reported in this paper demonstrate that the use of HFNC within the ED setting is not only feasible, but has the potentially to dramatically improve patient experience during acute exacerbations of respiratory disease. Nonetheless, Esquinas and Martin point out that while HFNC as a first
Figure 3. Post Emergency Department Disposition. Data represent the staff’s decisions on patient disposition from the Emergency Department, and are broken out by major working diagnoses (chronic obstructive pulmonary disease; COPD, and congestive heart failure; CHF) and presentations (hypoxemia and hypercapnia). Data are percent of dispositions to Medical Floor admission, Intensive Care Unit (ICU) admission and discharge from the hospital. When high flow nasal cannula was used in the treatment of respiratory distress patients, the majority of reported admissions were to the Medical Floor as opposed to the ICU. All Presentations n= 100; COPD n=37; CHF n=17; Hypoxemic n=76; Hypercarbic n=29.
line intervention in the ED is practicable, there are no good randomized controlled trial data to indicate that HFNC is effective in the applications where non-invasive ventilation is normally used24. A defined goal of this project was to support the development of a sound hypothesis for a prospective randomized controlled trial. The data here indicate that a comparison of HFNC to non-invasive ventilation in the ED may be warranted, as opposed to a comparison with front line oxygen therapies.
Limitations of this project are that the data are purely observational and not directed by a protocol for application in any specific conditions or patient population. There was no control group for a comparison to conventional standard of care, and historical data from each center proved difficult to abstract given that care and disposition would need to be inferred from billing codes. Additionally, not every case treated by HFNC during the assessment period was represented in the data set, and thus the possibility exists that complicated cases were not included.
In conclusion, this project resulted in an understanding that HFNC is perceived to be valuable in the ED setting and perhaps more analogical to non-invasive ventilation versus oxygen therapies. Moreover, the clinical use guidelines established and presented herein were generally effective and acceptable to clinical staff. The authors recommend these use guidelines as a starting point for the establishment of uniform clinical practice guidelines. Lastly, these observations led to a hypothesis to evaluate HFNC against non-invasive ventilation in the ED setting for patients in respiratory distress.
References1. Dysart K, Miller TL, Wolfson MR, Shaffer TH. Research
in high flow therapy: mechanisms of action. Respiratory medicine. Oct 2009;103(10):1400-1405.
2. Gotera C, Diaz Lobato S, Pinto T, Winck JC. Clinical evidence on high flow oxygen therapy and active humidification in adults. Revista portuguesa de pneumologia. Sep-Oct 2013;19(5):217-227.
3. Kelly MG, McGarvey LP, Heaney LG, Elborn JS. Nasal septal perforation and oxygen cannulae. Hosp Med. Apr 2001;62(4):248.
4. Robertson NJ, McCarthy LS, Hamilton PA, Moss AL. Nasal deformities resulting from flow driver continuous positive airway pressure. Arch Dis Child Fetal Neonatal Ed. Nov 1996;75(3):F209-212.
5. Woodhead DD, Lambert DK, Clark JM, Christensen RD. Comparing two methods of delivering high-flow gas therapy by nasal cannula following endotracheal extubation: a prospective, randomized, masked, crossover trial. Journal of perinatology: official journal of the California Perinatal Association. Aug 2006;26(8):481-485.
6. Dewan NA, Bell CW. Effect of low flow and high flow oxygen delivery on exercise tolerance and sensation of dyspnea. A study comparing the transtracheal catheter and nasal prongs. Chest. Apr 1994;105(4):1061-1065.
7. Greenspan JS, Wolfson MR, Shaffer TH. Airway responsiveness to low inspired gas temperature in preterm neonates. J Pediatr. Mar 1991;118(3):443-445.
8. Spence KL, Murphy D, Kilian C, McGonigle R, Kilani RA. High-flow nasal cannula as a device to provide continuous positive airway pressure in infants. Journal of perinatology: official journal of the California Perinatal Association. Dec 2007;27(12):772-775.
9. Parke R, McGuinness S, Eccleston M. Nasal high-flow therapy delivers low level positive airway pressure. British journal of anaesthesia. Dec 2009;103(6):886-890.
10. Spentzas T, Minarik M, Patters AB, Vinson B, Stidham G. Children with respiratory distress treated with high-flow nasal cannula. Journal of intensive care medicine. Sep-Oct 2009;24(5):323-328.
11. Hasani A, Chapman TH, McCool D, Smith RE, Dilworth JP, Agnew JE. Domiciliary humidification improves lung mucociliary clearance in patients with bronchiectasis. Chron Respir Dis. 2008;5(2):81-86.
12. Rea H, McAuley S, Jayaram L, et al. The clinical utility of long-term humidification therapy in chronic airway disease. Respir Med. Apr;104(4):525-533.
13. Wettstein RB. A fresh look at the physiologic effects of high-flow nasal cannulae and the role they play in patient care. Respiratory care. Apr 2013;58(4):715-716.
14. Ward JJ. High-flow oxygen administration by nasal cannula for adult and perinatal patients. Respiratory care. Jan 2013;58(1):98-122.
15. Lenglet H, Sztrymf B, Leroy C, Brun P, Dreyfuss D, Ricard JD. Humidified high flow nasal oxygen during respiratory failure in the emergency department: feasibility and efficacy. Respiratory care. Nov 2012;57(11):1873-1878.
16. Ozkurt B, Cinar O, Cevik E, et al. Efficacy of high-flow oxygen therapy in all types of headache: a prospective, randomized, placebo-controlled trial. The American journal of emergency medicine. Nov 2012;30(9):1760-1764.
17. Wing R, James C, Maranda LS, Armsby CC. Use of high-flow nasal cannula support in the emergency department reduces the need for intubation in pediatric acute respiratory insufficiency. Pediatric emergency care. Nov 2012;28(11):1117-1123.
18. Kelly GS, Simon HK, Sturm JJ. High-flow nasal cannula use in children with respiratory distress in the emergency department: predicting the need for subsequent intubation. Pediatric emergency care. Aug 2013;29(8):888-892.
19. Ricard JD. The authors respond to: High-flow nasal cannula oxygen therapy in the emergency department: welcome, but selection should be the first step. Respiratory care. May 2013;58(5):e67-68.
20. Dean P, Hughes M, Kinsella J. Don’t forget high flow nasal oxygen delivery for emergency oxygen. Bmj. 2013;346:f28.
21. Equinas AM, Bie P, Pascuali M. Nasal high-flow therapy and aerosol delivery: a difficult target to achieve? Pediatric critical care medicine: a journal of the Society of Critical Care Medicine and the World Federation of Pediatric Intensive and Critical Care Societies. Feb 2014;15(2):185-186.
22. Liesching T, Kwok H, Hill NS. Acute applications of noninvasive positive pressure ventilation. Chest. Aug 2003;124(2):699-713.
23. Metge P, Grimaldi C, Hassid S, et al. Comparison of a high-flow humidified nasal cannula to nasal continuous positive airway pressure in children with acute bronchiolitis: experience in a pediatric intensive care unit. European journal of pediatrics. Feb 14 2014.
24. Esquinas AM, Martin C. High-flow nasal cannula oxygen therapy in the emergency department: welcome, but selection should be the first step. Respiratory care. May 2013;58(5):e66-67.

24 Respiratory Therapy Vol. 10 No. 1 n Winter 2015 Respiratory Therapy Vol. 10 No. 1 n Winter 2015 25
Case Study BackgroundWhen it comes to cystic fibrosis, the damage to a human body is devastating. An estimated 30,000 children and adults in the United States have this genetic disease.
Everyone takes breathing for granted — imagine taking a straw and trying to breathe through it for an entire day and you get the idea of the impact of cystic fibrosis.
Patients suffer a variety of impacts, including shortness of breath and increased oxygen need, which severely decreases a person’s ability to do even the most basic forms of physical activity. The condition leads to a variety of wasting of vital muscle groups — respiratory muscles, postural or trunk muscles, arm and leg muscles, and cardiovascular deconditioning.
But cystic fibrosis doesn’t just erode the body physically — a patient’s mind suffers as well because they are no longer able to do even the most basic things. Climbing a couple of steps to get into their home becomes impossible without gasping for air. Standing and doing the dishes can become a catastrophic experience because this breathlessness leads to intense fear or anxiety.
Lung transplantation is possible for patients with end stage cystic fibrosis, but not everyone is healthy enough to qualify or even survive such a major surgery.
Without intervention, a poor outcome is inevitable. That’s why the team of professionals at the Children’s Hospital Los Angeles affiliated Cystic Fibrosis Care Center at Ventura County Medical Center all worked together to conduct a case study to see how the Breathe Technologies’ NIOV System could improve the outcome of a patient with this disease.
The PatientJ was chosen from the Adult Cystic Fibrosis Clinic. He is 32, works as a banker and had recently gotten married. His life-long physical activity was playing ice hockey, and he also enjoyed free weights and jogging on a treadmill, activities he was unable to continue due to his condition.
J was on the transplant list when chosen for the case study, but without an improvement in his condition he was not healthy enough to be able to survive such a major surgery.
J’s end stage lung disease was marked by FEV1 of 16%, every six-week three-week courses of antibiotics, and the placement of a gastrostomy tube to maintain weight. Despite nasal cannula oxygen at 4 LPM, J was still unable to participate in his exercise program. Serial six-minute walk tests had been performed with each clinic visit. He was having difficulty ascending stairs at home despite the use of oxygen. The St George’s Respiratory Questionnaire Symptom Score 85 (normal 12), Activity Score 92 (normal 9), Impact Score 66 (normal 9), and Total 77 (normal 2) was consistent with the devastating impact on his life.
Treatment PlanThe medical team developed a single subject design for J consisting of Baseline and Intervention with the Breathe Technologies NIOV System. NIOV consists of a one-pound portable device that can be mounted on a belt clip, making it easy for J to carry with him. A four-hour battery duration allows for extended trips. J was titrated by delivering volume of 100 mL at rest and 140 mL with exercise. The NIOV System detects a J’s spontaneous breathing via sensor ports located in the nasal pillow interface and delivers synchronized augmented volumes of ambient air and oxygen at rates of up to 40 breaths per minute.
Testing MethodsAt baseline a six-minute walk test was performed with and without the NIOV System and repeated at Day 30. Primary endpoint was the 6 Minute Walk Test distance and Borg score.
The ResultsUsing the NIOV System, J’s life has seen a remarkable turnaround.
J was able to participate in the physical activity required to keep enough muscle mass and stamina to survive transplant surgery. He is currently waiting for a healthy set of lungs in order to move forward with the transplant.
J was also strong enough to go on a belated honeymoon.
By day 30 of using the NIOV System, J’s condition had greatly improved and his rating on the transplant inclusion criteria scale was upgraded. J noted a ventilator synchrony problem with
Bridging Patients To Lung Transplant – A Cystic Fibrosis Case StudyChris Landon MD FAAP, FCCP, CMD
Chris Landon MD FAAP, FCCP, CMD is Clinical Associate Professor of Pediatrics Keck-USC School of Medicine, Director of Pediatrics, Ventura County Medical Center and Center Director of the Children’s Hospital Los Angeles affiliated Cystic Fibrosis Care Center Clinic at Ventura County Medical Center.
movement and unexpected ventilator assistance while driving. Adjustments were sufficient to make the intervention tolerable.
For the 6 Minute Walk Test, at baseline J was only able to cover 980 feet with nasal cannula oxygen alone, but on that first day with the NIOV System he was able to increase that number to 1,050 feet. After 30 days of exercise augmented by the NIOV System, J was able to walk 1,050 feet with nasal cannula and 1,110 feet with the NIOV System.
J’s Borg scores greatly improved as well after 30 days of using the NIOV System, dropping from a Borg baseline of 6.5 after 4 minutes to a score of 2, and a Borg baseline of 4 after 8 minutes to zero.
J Updates His ProgressSince the case study was conducted, J has updated the medical team on his daily activities, saying that the NIOV System is an essential part of his exercise routine. Here is what is involved in his own words:
“As I continue to deteriorate, the NIOV has had a bigger and bigger impact. Right now if I try to go on the elliptical while on the regular cannula at 6LPM, I can last about 20 seconds before my O2 drops to below 88 and I am completely out of breath. While on the NIOV, I have it at 180 mL, I have built up to going 4 minutes without stopping, and I stop because of fatigue rather than because of my O2 dropping (O2 only takes a slight dip to about 90/91 by the time I need to stop). I go on the elliptical every single day for at least 3 minutes. I work out with weights for about 5 minutes, 5 times a week. It doesn’t sound like much, but without the NIOV I wouldn’t be able to do anything at all, and I would probably be in the hospital by now - too sick for a transplant at this point.”
More About The DeviceWhen the patient inhales, a set volume of oxygen gas is delivered using the NIOV System — all customized for that patient. Volume delivery settings ranging from 50 mL to 250 mL can be quickly programmed to 3 levels of patient activity — low, medium and high. In addition to the volume of oxygen gas that is preset, ambient air is also entrained through two entrainment ports located on the interface to increase the total volume and properly ventilate patients.
Discuss the training and support services you offer.We partner with customers to ensure our respiratory solutions, as well as other products, best serve clinicians and patients. Specific support includes in-service programs, in-house continuing education (CE) programs, field-based technical training and Web-based tools. In addition, our Professional Affairs and Clinical Education (PACE) website (http://www.covidien.com/pace/pages.aspx) features clinical education on a variety of topics, including ventilation.
Where are your products used? (ie, hospital, home, etc.)Covidien’s products span a wide range of ventilation solutions. Our solutions are for neonate, pediatric and adult patients across all hospital care settings. In addition, many of our ventilator products are also used in hospital-type facilities, at home and during intra-hospital transport.
What developments do you foresee for ventilation products and applications?Covidien works closely with the Integrating Healthcare Enterprise (IHE) initiative in developing medical device interoperability standards. Recently, electronic medical record (EMR) connectivity and medical device interoperability have become increasingly important in healthcare. An example of this is Covidien’s Vital Sync virtual patient monitoring platform. The Vital Sync platform allows clinicians to remotely access streaming patient information from bedside devices on any web-enabled device such as a clinician’s smartphone, tablet or laptop. This capability may enhance patient safety by enabling clinicians to detect clinical distress remotely through continuous monitoring.
References1. Oto J, Chenelle CT, Marchese AD, Kacmarek RM. A
comparison of leak compensation in acute care ventilators during non-invasive and invasive ventilation; a lung model study. Respir Care. May 21, 2013. [Epub ahead of print] *Proportional Assist and PAV are registered trademarks of The University of Manitoba, Canada. Used under license. †VC, VC+, PC, PS
Ventilation Roundtable…continued from page 14

26 Respiratory Therapy Vol. 10 No. 1 n Winter 2015 Respiratory Therapy Vol. 10 No. 1 n Winter 2015 27
Case Study BackgroundThe word “independence” means different things to different people. For a healthy person, it’s likely something taken for granted. We don’t even think about putting on a pair of shoes and hitting the gym. For Chris, independence means simply being able to go into his garage to tinker with his tools without his wife having to supervise for fear he could suffer great harm. At the age of 79, Chris has a long history of pulmonary compromise, with comorbidities that include pulmonary HTN and pulmonary embolus. Despite the convenience of living in a single-storey house, even climbing the 5 steps required to enter his home had become a barrier that was both humiliating and frustrating. And then there were the falls. Chris has a history of falls, some doing damage to more than just his ego. As a result of a fall, Chris ended up hospitalized.
Chris was admitted to CareOne at Evesham in Marlton, New Jersey — a skilled nursing facility that provides sub-acute rehabilitation, typically after a hospital stay. Many residents stay for a short term, receiving therapy and nursing services before returning to their prior living situation.
After assessing Chris’ history of damaging falls and severe limits to a meaningful lifestyle, the CareOne team developed a plan to use the Breathe Technologies’ NIOV System in order to improve all aspects of his life — in effect, giving him a measure of independence.
Treatment PlanWhen Chris was admitted, he was on 8L of continuous O2 at home, with saturation at rest 74% (sitting); HR 100 bpm; RR 20 (on initial evaluation); unable to ambulate upon evaluation due to O2 saturation and dyspnea on exertion.
With standard O2 concentration via nasal cannula at such a high flow volume, Chris was limited to moving up to 25 feet — the length of O2 tubing. Chris occasionally ventured out in the community with his wife on portable O2, but was unable to tolerate extended periods of time away from home as it compromised his energy demands. The CareOne team saw the Breathe NIOV System as a viable way to get Chris mobile.
NIOV consists of a one-pound portable device that can be mounted on a belt clip, making it easy to carry. A four-hour battery duration allows for extended trips. NIOV detects a
patient’s spontaneous breathing via sensor ports located in the nasal pillow interface and delivers synchronized volumes of air and oxygen that augments a patient’s own breath at rates of up to 40 breaths per minute. When the patient inhales, a set volume of oxygen gas is delivered — all customized for that patient. Volume delivery settings ranging from 50 mL to 250 mL can be quickly programmed to 3 levels of patient activity — low, medium and high. In addition to the volume of oxygen gas that is preset, using the venturi effect, ambient air is also entrained through two entrainment ports located on the interface, resulting in a higher delivery volume.
Chris was educated on the use of the system and was able to seamlessly alternate between NIOV and commercial-sized O2 tanks at rest. No significant adjustments were required. The therapy treatment with the NIOV resulted in O2 saturation 87%; HR 100 bpm; RR 20 while ambulating. Chris was able to ambulate 20 feet with rolling walker, with assistance, upon introduction of the new system.
The ResultsAccording to Chris’ CareOne primary therapist Ernestine Williams, with the use of the NIOV System, positive results were “immediate.” Chris was able to progress and improve his ambulation distance on a daily basis. Chris then expressed a desire to resume working in his workshop on some carpentry projects, with future goals to be able to garden and travel. He felt that he could now do it while using the NIOV System — plus applying a few energy conservation strategies.
While using the NIOV System, Chris is now able to ambulate 120 feet with a rollator independently, climb up and down 5 steps independently, and maintain O2 sats at rest and with activity between 89% to 90%.
According to Williams, “with NIOV, the patient may be able to realistically resume some of these past interests, giving him a feeling of physical improvement, more balance to his life, and camaraderie with his wife. A positive outlook on one’s life/circumstances often translates to improved physical ability and greatly improves rehabilitation outcomes.”
The CareOne administration also reports that the facility found a cost savings through using the NIOV System because it reduces acute transfers, and patients are able to tolerate more physical therapy and pulmonary rehabilitation, and heal faster, allowing them to return home in a shorter period of time.
Improving Rehabilitation While Saving Costs In Skilled Nursing Facilities – A Case StudyChris Campbell
Chris Campbell is the Senior Editor of Respiratory Therapy.
History of Aerosol Therapy in our Pediatric Patients Leading to a Performance Improvement PlanAs respiratory therapist, a large portion of our time is spent delivering aerosolized medications to patients yet it is often given the least amount of thought. In addition we often have a false sense that the dosage of medication placed in a nebulizer is also delivered to patient’s lung effectively. This is not necessarily the case. Several factors affect delivery to the lung including: nebulizer type, driving gas flow, particle size, residual volumes, respiratory patterns, age, cognitive and physical ability to use device, crying during therapy and clinical application (interface). The development of new aerosol delivery devices and associated research has increased our awareness surrounding aerosol delivery.
Historically, jet nebulizers also referred to as, small volume nebulizers (SVN) have been the aerosol devices utilized by clinicians to deliver aerosolized medications. “Radioisotopic studies demonstrate that around 10% of the dose placed in the chamber of a jet nebulizer may reach the lungs in adults, though this is greatly influenced by the nebulizer used and the way in which it is operated.”1
Children pose additional obstacles. Their lack of cognitive and physical ability to follow instructions forces us to utilize alternative methods for aerosol delivery, preferably an aerosol mask. However, many of us have been confronted with a scared and crying child. In vivo studies indicate that lung deposition of aerosol is significantly reduced in the crying child, to as little as 0.6%.2 In this situation many clinicians resort to “blow by” application, which is an inefficient and ineffective aerosol delivery method. Everard, et al demonstrated a “50% and 80% reduction in medication delivery via a facemask when a nebulizer was moved 1 and 2 cm respectfully from the face.”1 So you can imagine what waving a blow by inches away from a screaming child’s face will do. Now also imagine the impact of an efficient delivery method on a very sick child in respiratory distress who needs the medication delivered to the lung.
As many other departments, aerosol delivery via SVN was common practice in our department, up until about 8 years ago when we observed a demonstration of a new type of aerosol delivery device (Aerogen Solo). The Solo delivers up to 4 times the amount of medication as compared to an SVN. Dubus, et al, demonstrated this utilizing an animal model and
radioscintigraphy. He measured 12.6% lung deposition with an Aerogen Pro versus 0.5% with a MistyNeb SVN, a twenty-five-fold increase in lung deposition.3
Performance Improvement Plan for Pediatric Patients in Respiratory Distress: Clinical Experience
Patricia Dailey, BS, RRT, Thayer Tina, RRT, John Santos, RRT, Puncho Gurung, MD
History of Aerosol Therapy in our Pediatric Patents Leading to a Performance Improvement Plan As respiratory therapist, a large portion of our time is spent delivering aerosolized medications to patients yet it is often given the least amount of thought. In addition we often have a false sense that the dosage of medication placed in a nebulizer, is also delivered to patient’s lung effectively. This is not necessarily the case. Several factors affect delivery to the lung including: nebulizer type, driving gas flow, particle size, residual volumes, respiratory patterns, age, cognitive and physical ability to use device, crying during therapy and clinical application (interface). The development of new aerosol delivery devices and associated research has increased our awareness surrounding aerosol delivery. Historically, jet nebulizers also referred to as, small volume nebulizers (SVN) have been the aerosol devices utilized by clinicians to deliver aerosolized medications. “Radioisotopic studies demonstrate that around 10% of the dose placed in the chamber of a jet nebulizer may reach the lungs in adults, though this is greatly influenced by the nebulizer used and the way in which it is operated.” 1 Children pose additional obstacles. Their lack of cognitive and physical ability to follow instructions forces us to utilize alternative methods for aerosol delivery, preferably an aerosol mask. However, many of us have been confronted with a scared and crying child. In vivo studies indicate that lung deposition of aerosol is significantly reduced in the crying child, to as little as 0.6%. 2 In this situation many clinicians resort to “blow by” application, which is an inefficient and ineffective aerosol delivery method. Everard, et al demonstrated a “50% and 80% reduction in medication delivery via a facemask when a nebulizer was moved 1 and 2 cm respectfully from the face.”1 So you can imagine what waving a blow by inches away from a screaming child’s face will do. Now also imagine the impact of an efficient delivery method on a very sick child in respiratory distress who needs the medication delivered to the lung. As many other departments, aerosol delivery via SVN was common practice in our department, up until about 8 years ago when we observed a demonstration of a new type of aerosol delivery device (Aerogen Solo). The Solo delivers up to 4 times the amount of medication as compared to an SVN. Dubus, et al, demonstrated this utilizing an animal model and radioscintigraphy. He measured 12.6% lung deposition with an Aerogen Pro versus 0.5% with a MistyNeb SVN, a twenty-five-fold increase in lung deposition.3
Figure 1. Examples of SVN with a pediatric aerosol mask
Figure 2. To the left is an Aerogen Solo with a pediatric mask. To the right is an Aerogen Solo in-line with the Fisher & Paykel Optiflow System. Our commitments to making the best technology available to our patients led us to our first opportunity to use the Aerogen Solo. Two days after initial demonstration of the device, a concerned staff respiratory therapist contacted me about a pediatric patient in respiratory distress. The patient was an 8-year-old asthmatic admitted from the ER to the pediatric inpatient unit in severe respiratory distress. The plan was to move him to the pediatric intensive care unit (PICU) for more intensive therapy. Our goal was to relieve the patient’s respiratory distress, keep him out of intensive care and get him home.
Figure 1. Examples of SVN with a pediatric aerosol mask.
Performance Improvement Plan for Pediatric Patients in Respiratory Distress: Clinical Experience
Patricia Dailey, BS, RRT, Thayer Tina, RRT, John Santos, RRT, Puncho Gurung, MD
History of Aerosol Therapy in our Pediatric Patents Leading to a Performance Improvement Plan As respiratory therapist, a large portion of our time is spent delivering aerosolized medications to patients yet it is often given the least amount of thought. In addition we often have a false sense that the dosage of medication placed in a nebulizer, is also delivered to patient’s lung effectively. This is not necessarily the case. Several factors affect delivery to the lung including: nebulizer type, driving gas flow, particle size, residual volumes, respiratory patterns, age, cognitive and physical ability to use device, crying during therapy and clinical application (interface). The development of new aerosol delivery devices and associated research has increased our awareness surrounding aerosol delivery. Historically, jet nebulizers also referred to as, small volume nebulizers (SVN) have been the aerosol devices utilized by clinicians to deliver aerosolized medications. “Radioisotopic studies demonstrate that around 10% of the dose placed in the chamber of a jet nebulizer may reach the lungs in adults, though this is greatly influenced by the nebulizer used and the way in which it is operated.” 1 Children pose additional obstacles. Their lack of cognitive and physical ability to follow instructions forces us to utilize alternative methods for aerosol delivery, preferably an aerosol mask. However, many of us have been confronted with a scared and crying child. In vivo studies indicate that lung deposition of aerosol is significantly reduced in the crying child, to as little as 0.6%. 2 In this situation many clinicians resort to “blow by” application, which is an inefficient and ineffective aerosol delivery method. Everard, et al demonstrated a “50% and 80% reduction in medication delivery via a facemask when a nebulizer was moved 1 and 2 cm respectfully from the face.”1 So you can imagine what waving a blow by inches away from a screaming child’s face will do. Now also imagine the impact of an efficient delivery method on a very sick child in respiratory distress who needs the medication delivered to the lung. As many other departments, aerosol delivery via SVN was common practice in our department, up until about 8 years ago when we observed a demonstration of a new type of aerosol delivery device (Aerogen Solo). The Solo delivers up to 4 times the amount of medication as compared to an SVN. Dubus, et al, demonstrated this utilizing an animal model and radioscintigraphy. He measured 12.6% lung deposition with an Aerogen Pro versus 0.5% with a MistyNeb SVN, a twenty-five-fold increase in lung deposition.3
Figure 1. Examples of SVN with a pediatric aerosol mask
Figure 2. To the left is an Aerogen Solo with a pediatric mask. To the right is an Aerogen Solo in-line with the Fisher & Paykel Optiflow System. Our commitments to making the best technology available to our patients led us to our first opportunity to use the Aerogen Solo. Two days after initial demonstration of the device, a concerned staff respiratory therapist contacted me about a pediatric patient in respiratory distress. The patient was an 8-year-old asthmatic admitted from the ER to the pediatric inpatient unit in severe respiratory distress. The plan was to move him to the pediatric intensive care unit (PICU) for more intensive therapy. Our goal was to relieve the patient’s respiratory distress, keep him out of intensive care and get him home.
Figure 2. To the left is an Aerogen Solo with a pediatric mask. To the right is an Aerogen Solo in-line with the Fisher & Paykel Optiflow System.
Our commitment to making the best technology available to our patients led us to our first opportunity to use the Aerogen Solo. Two days after initial demonstration of the device, a concerned staff respiratory therapist contacted me about a pediatric patient in respiratory distress. The patient was an 8-year-old asthmatic admitted from the ER to the pediatric inpatient unit in severe respiratory distress. The plan was to move him to the pediatric intensive care unit (PICU) for more intensive therapy. Our goal was to relieve the patient’s respiratory distress, keep him out of intensive care and get him home.
He had already received usual treatment in the Emergency Room, which consisted of 5 hours of continuous albuterol (7.5 mg/hour) via AirLife brand MistyNeb continuous SVN and was refractory to treatment. He was retracting, and tachypneic. Auscultation of his lungs revealed decreased aeration, inspiratory and expiratory wheezes and a prolonged expiratory phase.
We gave him one albuterol (7.5 mg) treatment with the Aerogen Solo via mouthpiece application, which took less than 8 minutes
Performance Improvement Plan for Pediatric Patients in Respiratory Distress: Clinical ExperiencePatricia Dailey, BS, RRT, Thayer Tina, RRT, John Santos, RRT, Puncho Gurung, MD
Patricia A Dailey, BS, RRT, Medical Science Liaison, Aerogen, Ltd.

28 Respiratory Therapy Vol. 10 No. 1 n Winter 2015 Respiratory Therapy Vol. 10 No. 1 n Winter 2015 29
to deliver as compared to 1 hour with the MistyNeb. Within minutes he demonstrated an increase in aeration, decrease in work of breathing, decreased wheezing and an improvement in expiratory phase. He had one more 7.5 mg albuterol treatment with the Solo, spent less than one hour in the PICU and was discharged the next morning.
This was the first of what seemed to be a pattern of successful treatment with the Aerogen Solo for patients who were refractory to albuterol therapy via traditional SVN. So much so that use of the Aerogen Solo with pediatric patients in respiratory distress became more favorable than the SVN. The next wave of use for the Aerogen Solo was associated with the high flow nasal cannula application.
Our experience utilizing Fisher & Paykel High Flow Nasal Cannula (HFNC) in the pediatric patient has produced positive clinical outcomes. McKiernan, et al, described a 68% reduction in intubations with the use of HFNC in our pediatric patients with respiratory distress associated with bronchiolitis. They theorized, “that reduction in intubation was associated with decreased respiratory rates and work of breathing due to the use of a noninvasive form of ventilatory support that is comfortable and well tolerated.”4
Many of our patients requiring HFNC also require aerosol drug delivery. Bench studies have demonstrated efficient and effective aerosol delivery utilizing the Aerogen Aeroneb Solo via the Fisher & Paykel HFNC application.5,6 In addition to being an effective method for delivering aerosol to children, aerosol delivery via HFNC also does not require cooperation from the patient. The aerosol can be delivered without disturbing the child and requires less time to deliver than the traditional SVN reducing therapist time at the bedside. For these reasons aerosol delivery via the HFNC application utilizing the Solo has become our standard of practice for any patient requiring HFNC.
Performance Improvement Plan for the Pediatric Patient in Respiratory DistressAccording to the Pioneer Valley Asthma Coalition, “The Pioneer Valley has one of the highest rates of asthma in the nation. Pediatric asthma rates are extremely high in both Holyoke (19%) and Springfield (17%,) (Table 1) both close to double the statewide prevalence of 9.5%.”7 Baystate Medical Center, in Springfield, Massachusetts is a major medical center serving western Massachusetts with the region’s only Pediatric ER. Pediatric asthma patients frequent the emergency room at Baystate. In an effort to improve the care of these patients we developed a Pediatric Performance Improvement Plan (PIP) for patients in respiratory distress.
The ultimate goal of the PIP was to provide the best possible clinical outcomes utilizing the least invasive methods available in a timely and efficient manner. Our hope was to improve patient comfort, reduce work of breathing, improve clinical outcomes, decrease length of stay and reduce hospital admissions.
In September 2013, we assembled a team to develop a PIP that included: respiratory therapists, ER nurses, ER pediatric physicians, PICU intensivists, health care quality, pulmonologists and infants/children’s physicians. Based on our experience within our own institution a plan was developed which included: frequent assessments by the respiratory therapist, a therapist driven model, a clinical asthma score (CAS), Fisher & Paykel
High Optiflow Nasal Cannula (HFNC) and Aerogen Aeroneb Solo.
In order to facilitate patient care, our Pediatric ER is equipped with a mounted HFNC system and Aerogen controller at each patient bedside providing quick easy access to equipment. Respiratory Therapists initially score patients utilizing a modified CAS, scoring mild, moderate or severe. The respiratory therapist repeats CAS every 30 to 60 minutes, as needed, until the patient is either discharged or admitted. Patients who score mild receive aerosol therapy via traditional SVN, patients who score moderate receive aerosol therapy via Solo and patients who score severe are placed on a HFNC with aerosol therapy delivered via Solo. All patients receive the same albuterol dosing of 7.5 mg albuterol for weights <10 kg or 15 mg albuterol for weights > 10 kg. (Figure 3)
During the first month of the performance improvement plan (fall 2013) we treated approximately 96 patients with respiratory distress associated with asthma exacerbations with an average length of stay around 2.2 hours. This was not designed as a clinical study. It was simply a plan to try to improve the care of our pediatric asthma patients in the ER. Clinical observations and respiratory therapist commentaries indicated that our plan produced more favorable clinical outcomes than our previous methods of treatment.
The team was reassembled this summer (2014) to plan for the anticipated influx of seasonal pediatric respiratory distress patients for the fall. Feedback around clinical response to the PIP was so positive that the team felt that it would be beneficial for all pediatric patients in respiratory distress to receive aerosol therapy via the Solo instead of SVN, independent of CAS. The team also decided to reduce the albuterol dose to 7.5 mg and leave the 15 mg dose as an option.
Overall, response to the PIP has been overwhelmingly positive from clinicians, patients and parents. Short treatment times, frequent clinical assessments by respiratory therapists, readily available access to critical respiratory equipment, high-quality aerosol delivery and minimal residual medication volumes associated with the Aerogen Solo, most likely contributed to clinical outcomes. We believe that use of noninvasive methods of ventilatory support and efficient advanced aerosol techniques
Performance Improvement Plan for Pediatric Patients in Respiratory Distress: Clinical Experience
Patricia Dailey, BS, RRT, Thayer Tina, RRT, John Santos, RRT, Puncho Gurung, MD
He had already received usual treatment in the Emergency Room, which consisted of 5 hours of continuous albuterol (7.5 mg/hour) via AirLife brand MistyNeb continuous SVN and was refractory to treatment. He was retracting, and tachypneic. Auscultation of his lungs revealed decreased aeration, inspiratory and expiratory wheezes and a prolonged expiratory phase. We gave him one albuterol (7.5 mg) treatment with the Aerogen Solo via mouthpiece application, which took less than 8 minutes to deliver as compared to 1 hour with the MistyNeb. Within minutes he demonstrated an increase in aeration, decrease in work of breathing, decreased wheezing and an improvement in expiratory phase. He had one more 7.5 mg albuterol treatment with the Solo, spent less than one hour in the PICU and was discharged the next morning. This was the first of what seemed to be a pattern of successful treatment with the Aerogen Solo for patients who were refractory to albuterol therapy via traditional SVN. So much so that use of the Aerogen Solo with pediatric patients in respiratory distress became more favorable than the SVN. The next wave of use for the Aerogen Solo was associated with the high flow nasal cannula application. Our experience utilizing Fisher & Paykel High High Flow Nasal Cannula (HFNC) in the pediatric patient has produced positive clinical outcomes. McKiernan, et al, described a 68% reduction in intubations with the use of HFNC in our pediatric patients with respiratory distress associated with bronchiolitis. They theorized, “that reduction in intubation was associated with decreased respiratory rates and work of breathing due to the use of a noninvasive form of ventilatory support that is comfortable and well tolerated.”4 Many of our patients requiring HFNC also require aerosol drug delivery. Bench studies have demonstrated efficient and effective aerosol delivery utilizing the Aerogen Aeroneb Solo via the F & P HFNC application5, 6. In addition to being an effective method for delivering aerosol to children, aerosol delivery via HFNC also does not require cooperation from the patient. The aerosol can be delivered without disturbing the child and requires less time to deliver than the traditional SVN reducing therapist time at the bedside. For these reasons aerosol delivery via the HFNC application utilizing the Solo has become our standard of practice for any patient requiring HFNC. Performance Improvement Plan for the Pediatric Patient in Respiratory Distress According to the Pioneer Valley Asthma Coalition, “The Pioneer Valley has one of the highest rates of asthma in the nation. Pediatric asthma rates are extremely high in both Holyoke (19%) and Springfield (17%,) (Table 1) both close to double the statewide prevalence of 9.5%.”7 Baystate Medical Center, in Springfield, Massachusetts is a major medical center serving western Massachusetts with the region’s only Pediatric ER. Pediatric asthma patients frequent the emergency room at Baystate. In an effort to improve the care of these patients we developed a Pediatric Performance Improvement Plan (PIP) for patients in respiratory distress.
Table 1. Shows asthma rates in Western Massachusetts as compared statewide prevalance.7
had a positive impact on clinical outcomes, as well as staff and patient satisfaction.
Our respiratory therapy department believes that patients deserve the best care possible and we are committed to providing quality patient care beyond the status quo. In addition, our proactive approach to the care prepared us well in advance for the high volume of pediatric respiratory distress patients associated with the outbreak of the Enterovirus D68, allowing Baystate staff to respond quickly and efficiently to the crisis. In September there were reports that pediatric patients in respiratory distress were being admitted to our ER at a rate of 50 per day. The majority of these patients were discharged from the ER after 6-9 treatments. Those admitted were discharged on the next day and none required intubation. ER care for Enterovirus D68 requires 5 hours of care; in August 2014 we reported we spent 2.5 hours.
Anecdotal feedback from clinicians, in addition to improvement in CAS led us to hypothesize that patients demonstrate a positive clinical response to aerosol delivery utilizing the Aerogen Solo via Fisher & Paykel HFNC application. In addition our overall consensus is that patients demonstrate a better clinical response from aerosol therapy delivered utilizing the Aerogen Solo versus traditional small volume nebulizer (SVN). Clinical studies are needed to confirm our observations and hypothesis.
Disclosure: Patricia Dailey is a Registered Respiratory Therapist. She was employed at Baystate Medical Center as the Clinical Educator in the Respiratory Therapy Department from 1994-2011, and the Manager of Respiratory Therapy and Pulmonary Patient Services from 2011-2014. Currently, she is employed by Aerogen as a Medical Science Liaison. During the course of her career, she has led the way with aerosol delivery and use of high flow nasal application by taking an innovative approach to patient care. She is an author, educator, lecturer, researcher and respiratory clinician. She has had numerous faculty appointments and has experience in all facets of respiratory therapy in all age groups. She received numerous Presidents’
Quality Awards while employed at BMC, including a 2014 winner of the award for collaboration on the Proven Care Initiative for patients with lung cancer. Her positive clinical experience with aerosol delivery utilizing Aerogen delivery devices and interest in clinical research with aerosol and HFNC led her to pursue a career with Aerogen. Her goals are to expand clinical research in the area of aerosol delivery in order to optimize care to patients with respiratory disease. She also plans to take an active role in educating clinicians on the importance of quality aerosol delivery. Positive clinical outcomes, innovation, patient satisfaction, respiratory therapy engagement and reduction in healthcare costs are her top priorities.
References 1. Erzinger S, Schueepp KG, Brooks-Wildhaber J, Devadason
SG, Wildhaber JH. J of Aerosol Med. June 2007, 20(s1): S78-S84.
2. Dubus JC, Vecellio L, De Monte M, Fink JB, Grimbert D, Montharu J, Valat C, Behan N, Diot P; Aerosol deposition in neonatal ventilation. Pediatr Res. 2005 Jul;58(1):10-4. Epub 2005 Mar 17.
3. McKiernan C, Chadrick Chua L, Visintainer PF, Allen H. High flow nasal cannulae therapy in infants with bronchiolitis. www.jped.com
4. Bhashyam AR, Wolf M, Marsinkowski AL, Saville A, Thomas K, Carcillo JA, Corcoran TE. Aerosol delivery through nasal cannulas: an in vitro study, JAM vol 21 no 2 pp 1-7 2008
5. Ari A, Harwood H, Sheard M, Dailey P, Fink JB. In vitro comparison of heliox and oxygen in aerosol delivery utilizing high flow nasal cannula. Pediatric Pulm 46:795–801 (2011)
6. Pioneer Valley Asthma Coalition. Asthma Facts. (2014). Retrieved Oct 31, 2014, from Pioneer Valley Asthma Coalition: http://pvasthmacoalition.org/asthma_facts.
Performance Improvement Plan for Pediatric Patients in Respiratory Distress: Clinical Experience
Patricia Dailey, BS, RRT, Thayer Tina, RRT, John Santos, RRT, Puncho Gurung, MD
Figure 3. Original 2013 Performance Plan for Pediatric Patient in Respiratory Distress implemented for the Emergency Room. Changes to new PIP include administration of aerosol for all patients with the Aerogen Solo and 7.5 mg albuterol standard (15 mg albuterol optional). Overall, response to the PIP has been overwhelmingly positive from clinicians, patients and parents. Short treatment times, frequent clinical assessments by respiratory therapists, readily available access to critical respiratory equipment, high quality aerosol delivery and minimal residual medication volumes associated with the Aerogen Solo, most likely contributed to clinical outcomes. We believe that use of noninvasive methods of ventilatory support and efficient advanced aerosol techniques had a positive impact on clinical outcomes, as well as staff and patient satisfaction. Our respiratory therapy department believes that patients deserve the best care possible and we are committed to providing quality patient care beyond the status quo. In addition, our proactive approach to the care prepared us well in advance for the high volume of pediatric respiratory distress patients associated with the outbreak of the Enterovirus D68, allowing Baystate staff to respond quickly and efficiently to the crisis. In September there were reports that pediatric patients in respiratory distress were being admitted to our ER at a rate of 50 per day. The majority of these patients were discharged from the ER after 6-9 treatments. Those admitted were discharged on the next day and none required intubation. ER care for Enterovirus D68 requires 5 hours of care; in August 2014 we reported we spent 2.5 hours. Anecdotal feedback from clinicians, in addition to improvement in CAS led us to hypothesize that patients demonstrate a positive clinical response to aerosol delivery utilizing the Aerogen Solo via F & P HFNC application. In addition our overall consensus is that patients demonstrate a better clinical response from aerosol therapy delivered utilizing the Aerogen Solo versus traditional small volume nebulizer (SVN). Clinical studies are needed to confirm our observations and hypothesis. Disclosure Patricia Dailey is a Registered Respiratory Therapist. She was employed at Baystate Medical Center as the Clinical Educator in the Respiratory Therapy Department from 1994-2011, and the Manager of Respiratory Therapy and Pulmonary Patient Services from 2011-2014. Currently, she is employed by Aerogen as a Medical Science Liaison. During the course of her career, she has led the way with aerosol delivery and use of high flow nasal application by taking an innovative approach to patient care. She is an author, educator, lecturer, researcher and respiratory clinician. She has had numerous faculty appointments and has experience in all facets of respiratory therapy in all age groups. She received numerous Presidents’ Quality Awards while employed at BMC, including a 2014 winner of the award for collaboration on the Proven Care Initiative for patients with lung cancer. Her positive clinical experience with aerosol delivery utilizing Aerogen delivery devices and interest in clinical research with aerosol and HFNC led her to pursue a career with Aerogen. Her goals are to expand clinical research in the area of aerosol delivery in order to optimize care to patients with respiratory disease. She also plans to take an active role in educating clinicians on the importance of quality
Figure 3. Original 2013 Performance Plan for Pediatric Patient in Respiratory Distress implemented for the Emergency Room. Changes to new PIP include administration of aerosol for all patients with the Aerogen Solo and 7.5 mg albuterol standard (15 mg albuterol optional).

30 Respiratory Therapy Vol. 10 No. 1 n Winter 2015 Respiratory Therapy Vol. 10 No. 1 n Winter 2015 31
Background: The increasing prevalence and associated cost of treating chronic obstructive pulmonary disease (COPD) is unsustainable, and focus is needed on self-management and prevention of hospital admissions. Telehealth monitoring of patients’ vital signs allows clinicians to prioritise their workload and enables patients to take more responsibility for their health. This paper reports the results of a pilot randomised controlled trial (RCT) of Telehealth-supported care within a community-based COPD supported-discharge service.
Methods: A two-arm pragmatic pilot RCT was conducted comparing the standard service with a Telehealth-supported service and assessed the potential for progressing into a full RCT. The co-primary outcome measures were the proportion of COPD patients readmitted to hospital and changes in patients’ self-reported quality of life. The objectives were to assess the suitability of the methodology, produce a sample size calculation for a full RCT, and to give an indication of cost-effectiveness for both pathways.
Results: Sixty three participants were recruited (n = 31 Standard; n = 32 Telehealth); 15 participants were excluded from analysis due to inadequate data completion or withdrawal from the Telehealth arm. Recruitment was slow with significant gaps in data collection, due predominantly to an unanticipated 60% reduction of staff capacity within the clinical team. The sample size calculation was guided by estimates of clinically important effects and COPD readmission rates derived from the literature. Descriptive analyses showed that the standard service group had a lower proportion of patients with hospital readmissions and a greater increase in self-reported quality of life compared to the Telehealth-supported group. Telehealth was cost-effective only if hospital admissions data were excluded.
Conclusions: Slow recruitment rates and service reconfigurations prevented progression to a full RCT. Although there are advantages to conducting an RCT with data collection
conducted by a frontline clinical team, in this case, challenges arose when resources within the team were reduced by external events. Gaps in data collection were resolved by recruiting a research nurse. This study reinforces previous findings regarding the difficulty of undertaking evaluation of complex interventions, and provides recommendations for the introduction and evaluation of complex interventions within clinical settings, such as prioritisation of research within the clinical remit.
BackgroundGiven the forecast increasing prevalence of chronic obstructive pulmonary disease (COPD), current models of care provision are unsustainable and must adapt to embrace prevention and self-management.1 This potentially requires individuals diagnosed with COPD to be supported to manage the disease at home, thereby avoiding hospital admission and reducing healthcare costs.2
COPD is characterised by progressive worsening of lung capacity. Patients with advanced COPD typically experience impaired physical, emotional, and social functioning which results in poor quality of life.3 In the UK, COPD is the fifth largest cause of mortality and the second largest cause of emergency admissions to hospital.4 COPD costs the National Health Service (NHS) over £800 million per annum.5
Remote monitoring of patients’ physiology and symptoms using Telehealth is considered to be highly appropriate for people with COPD, a condition which is associated with frequent hospital admissions and high levels of disability and depression.6,7 It involves the remote exchange of patient data (eg, vital signs) between a patient and clinician which can be used to identify potential deterioration, prevent avoidable hospital admissions, and help improve an individual’s quality of life.8 Telehealth also has the potential to help patients improve their ability to self-manage their condition, eg, through patient education.7
A recent Cochrane review7 demonstrated the potential for Telehealth in reducing hospital admissions and increasing quality of life; however, in the identified studies, Telehealth was usually delivered as part of a more complex package of care and, thus, it was difficult to separate the effect of the technology from other aspects of the service. The recently reported results of a large scale UK trial of Telehealth also demonstrated that use of this technology within services has the potential to reduce mortality and emergency admission rates9; however, the results were not definitive in that the same study failed to demonstrate
A Pilot Randomised Controlled Trial Of A Telehealth Intervention In Patients With Chronic Obstructive Pulmonary Disease: Challenges Of Clinician-Led Data CollectionClaire L Bentley, Gail A Mountain, Jill Thompson, Deborah A Fitzsimmons, Kinga Lowrie, Stuart G Parker and Mark S Hawley
The authors are with School of Health and Related Research, The University of Sheffield, Regent Court, School of Nursing and Midwifery, The University of Sheffield, School of Health Studies, Western University, Institute for Ageing and Health, Newcastle University, Campus for Ageing and Vitality. This is an Open Access article distributed under the terms of the Creative Commons Attribution License which permits unrestricted use, distribution, and reproduction in any medium, provided the original work is properly credited. The Creative Commons Public Domain Dedication waiver applies to the data made available in this article, unless otherwise stated.
cost-effectiveness. Nevertheless, implementation of Telehealth remains a policy priority in the UK10 and internationally, for example, through the Veterans’ Association in the US11 and across Canada.12 Despite the cited benefits of Telehealth,13 research has illustrated that patients and front line clinicians may not be receptive to the intervention, with the extent of staff training and support that is necessary to embed such technology into routine practice being emphasised.14
This paper reports results from the pilot stage of a pragmatic randomised controlled trial (RCT) of a Telehealth-supported service and a standard service pathway provided through one hospital discharge service for people with COPD within one primary care trust (PCT) in the UK. Findings are reported in accordance with the Consolidated Standards of Reporting Trials (CONSORT) checklist for clinical trials.15
Study contextIn May 2009, a PCT in the North of England introduced a dedicated discharge service for individuals with early stage COPD as defined locallya. It had been identified by the PCT that approximately 1,200 patients with COPD were being discharged from local acute in-patient services annually. A standard (non-Telehealth-supported) service was established to assist patients to manage their illness more effectively following hospital discharge, with the aim of decreasing readmission rates. Two COPD specialist nurses, one specialist physiotherapist, and one community matron were employed full time within the service. The COPD supported discharge service received referrals from the local NHS Acute Care Trust via two routes: i) specialist COPD nurses based on respiratory wards who were able to refer patients directly and ii) a telephone referral route allowed any relevant staff member within the hospital to refer a patient with a diagnosis of COPD, even if COPD was not the primary cause of their admission (see below for full referral criteria).
Criteria for referral to the supported discharge service• SpO2 > 90% on air or pO2 > 7 kPa/pH 7.35–7.45• Respiratory rate <25• Temperature <37.8°C• Systolic blood pressure 90–180 mm/Hg• Pulse 50–100 BPM• Orientated and alert/able to give consent• Safe discharge environment• Between 1 and 3 previous admissions (including the current
admission) in the previous 12 months from the current date of discharge where COPD is the primary or secondary documented reason for hospitalisation
The service involved six home visits over the 8-week time frame, resulting in a conservative estimate of 8 hours and 25 minutes of
time spent with each patient (including clinical administration time and cancelled appointments). It was recognised by the PCT that a service which was delivered entirely face-to-face was unsustainable in the long term, particularly given the numbers of patients presenting to acute care with COPD and in the context of an ageing population and static NHS budgets. A subsequent decision was taken by the PCT to introduce Telehealth within the discharge service. The selected Telehealth system (Doc@Home) enables the patient to undertake daily vital signs monitoring. If monitored signs and symptoms fall outside anticipated parameters for the individual, or if the user fails to undertake monitoring activity, clinician alerts are generated so that appropriate action can be taken.
Table 1 provides an overview of the standard service and Telehealth-supported service. It was estimated that reduction of the number of home visits and inclusion of remote monitoring of patients’ vital signs could reduce the average time spent on each patient to 5 hours 30 minutes, thus better utilising staff resources and reducing costs. Telehealth equipment was to be provided to patients for 8 weeks, in accord with the overall service offer. Agreements were established between the PCT, Local Authority, and equipment provider for the installation, delivery, alert management, and de-installation of the equipment. Both the standard service and the Telehealth-supported service are free at the point of delivery for its users.
The research programmeThe overall research questions (agreed with the PCT service commissioners and managers) were as follows:• Does a Telehealth-supported discharge service decrease
hospitalisations compared to the standard service?• Does a Telehealth-supported discharge service result in
improved quality of life for people with COPD compared to the standard service and does this change over time?
• Does a Telehealth-supported discharge service reduce use of NHS resources compared to the standard service?
Study design was informed by the Medical Research Council guidance for evaluating complex interventions.16 It involved a feasibility study (reported elsewhere) which investigates the practicalities of undertaking the research, eg, flow of referrals into the discharge service and clinician/patient engagement levels. The feasibility study was followed by a pilot randomised controlled trial (RCT) to finalise study methods. The intention was to then continue to a full RCT, as described in the published protocol.17
The specific objectives of the pilot randomised controlled trial were to i) test the trial methodology, namely recruitment, randomisation, intervention implementation, and outcome
parameters for the individual, or if the user fails toundertake monitoring activity, clinician alerts are gener-ated so that appropriate action can be taken.Table 1 provides an overview of the standard service
and Telehealth-supported service. It was estimated thatreduction of the number of home visits and inclusion ofremote monitoring of patients’ vital signs could reducethe average time spent on each patient to 5 hours 30 mi-nutes, thus better utilising staff resources and reducingcosts. Telehealth equipment was to be provided to pa-tients for 8 weeks, in accord with the overall serviceoffer. Agreements were established between the PCT,Local Authority, and equipment provider for the instal-lation, delivery, alert management, and de-installation ofthe equipment. Both the standard service and theTelehealth-supported service are free at the point of de-livery for its users.
The research programmeThe overall research questions (agreed with the PCT ser-vice commissioners and managers) were as follows:
� Does a Telehealth-supported discharge servicedecrease hospitalisations compared to the standardservice?
� Does a Telehealth-supported discharge service resultin improved quality of life for people with COPDcompared to the standard service and does thischange over time?
� Does a Telehealth-supported discharge servicereduce use of NHS resources compared to thestandard service?
Study design was informed by the Medical ResearchCouncil guidance for evaluating complex interventions[16]. It involved a feasibility study (reported elsewhere)which investigates the practicalities of undertaking theresearch, e.g., flow of referrals into the discharge serviceand clinician/patient engagement levels. The feasibilitystudy was followed by a pilot randomised controlled trial(RCT) to finalise study methods. The intention was to
then continue to a full RCT, as described in the pub-lished protocol [17].The specific objectives of the pilot randomised con-
trolled trial were to i) test the trial methodology, namelyrecruitment, randomisation, intervention implementa-tion, and outcome measurements; ii) estimate the sam-ple size required for a full trial, through analysis of dataon patient contact with other services, including hospitaladmissions; and iii) conduct a preliminary evaluation ofthe cost-effectiveness of the Telehealth interventionthrough analysis of healthcare usage, patient contact data,and quality of life data.
MethodsThe study reported in this paper involved a pragmatictwo-arm pilot RCT informed by the findings from a priorfeasibility study. The pilot RCT followed an ‘internal/ex-ternal’ design [18] so that, if the chosen methods wereconsistently and rigorously applied, the pilot data mightbe incorporated into a full trial.The pilot trial was conducted over 14 months. Through-
out the data collection period close contact was main-tained with all stakeholders via monthly project steeringmeetings. Records were maintained of emergent issuesand identified solutions. The feasibility study identifiedthat a target sample size of n = 60 participants, recruitedover a 3 month period, would be acceptable for the pilotRCT given the number of referrals into the service and anestimated acceptance rate of 32% [17]. As shown inTable 2, potential candidates were approached by a COPDdischarge team clinician during the first post-dischargehome visit and were provided with study information ifthey expressed interest in participating. During the secondvisit 48 hours later, further information was provided andwritten consent then obtained from those who wished toparticipate. Random allocation to the two arms of the trialwas generated through a web-based programme, accessedby the administrator for the COPD service, who generatedthe allocation online and informed the clinician immedi-ately following receipt of consent. Participants receivedtheir allocated treatment pathway for 8 weeks, with a
Table 1 Summary of standard and Telehealth-supported services
Timeline Standard COPD service Telehealth-supported COPD service
1 day – First home visit after hospital discharge Home visit Home visit
3 days Home visit Home visit
5 days Home visit Home visit
Telehealth equipment installed
2 weeks Home visit Remote review of Telehealth parameters throughout 8 weeks
6 weeks Home visit Remote review of Telehealth parameters throughout 8 weeks
8 weeks Discharge home visit Discharge home visit
Telehealth equipment removed
Bentley et al. Trials 2014, 15:313 Page 3 of 12http://www.trialsjournal.com/content/15/1/313
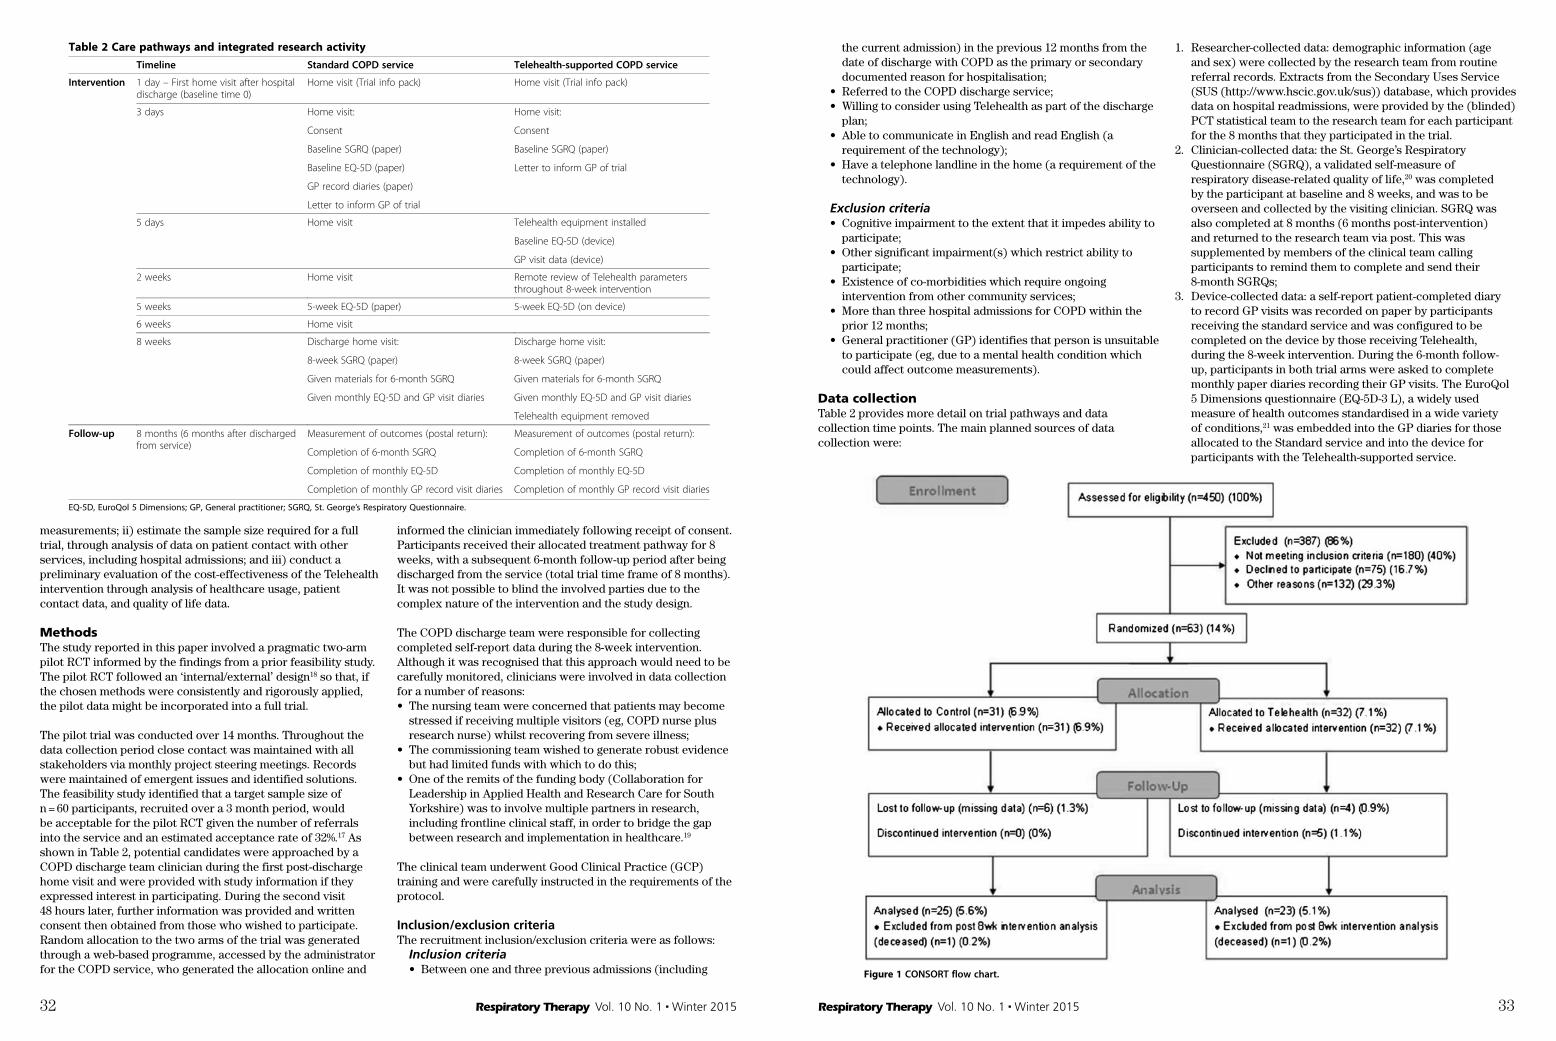
32 Respiratory Therapy Vol. 10 No. 1 n Winter 2015 Respiratory Therapy Vol. 10 No. 1 n Winter 2015 33
measurements; ii) estimate the sample size required for a full trial, through analysis of data on patient contact with other services, including hospital admissions; and iii) conduct a preliminary evaluation of the cost-effectiveness of the Telehealth intervention through analysis of healthcare usage, patient contact data, and quality of life data.
MethodsThe study reported in this paper involved a pragmatic two-arm pilot RCT informed by the findings from a prior feasibility study. The pilot RCT followed an ‘internal/external’ design18 so that, if the chosen methods were consistently and rigorously applied, the pilot data might be incorporated into a full trial.
The pilot trial was conducted over 14 months. Throughout the data collection period close contact was maintained with all stakeholders via monthly project steering meetings. Records were maintained of emergent issues and identified solutions. The feasibility study identified that a target sample size of n = 60 participants, recruited over a 3 month period, would be acceptable for the pilot RCT given the number of referrals into the service and an estimated acceptance rate of 32%.17 As shown in Table 2, potential candidates were approached by a COPD discharge team clinician during the first post-discharge home visit and were provided with study information if they expressed interest in participating. During the second visit 48 hours later, further information was provided and written consent then obtained from those who wished to participate. Random allocation to the two arms of the trial was generated through a web-based programme, accessed by the administrator for the COPD service, who generated the allocation online and
informed the clinician immediately following receipt of consent. Participants received their allocated treatment pathway for 8 weeks, with a subsequent 6-month follow-up period after being discharged from the service (total trial time frame of 8 months). It was not possible to blind the involved parties due to the complex nature of the intervention and the study design.
The COPD discharge team were responsible for collecting completed self-report data during the 8-week intervention. Although it was recognised that this approach would need to be carefully monitored, clinicians were involved in data collection for a number of reasons:• The nursing team were concerned that patients may become
stressed if receiving multiple visitors (eg, COPD nurse plus research nurse) whilst recovering from severe illness;
• The commissioning team wished to generate robust evidence but had limited funds with which to do this;
• One of the remits of the funding body (Collaboration for Leadership in Applied Health and Research Care for South Yorkshire) was to involve multiple partners in research, including frontline clinical staff, in order to bridge the gap between research and implementation in healthcare.19
The clinical team underwent Good Clinical Practice (GCP) training and were carefully instructed in the requirements of the protocol.
Inclusion/exclusion criteriaThe recruitment inclusion/exclusion criteria were as follows:
Inclusion criteria• Between one and three previous admissions (including
subsequent 6-month follow-up period after being dis-charged from the service (total trial time frame of8 months). It was not possible to blind the involved partiesdue to the complex nature of the intervention and thestudy design.The COPD discharge team were responsible for col-
lecting completed self-report data during the 8-weekintervention. Although it was recognised that this ap-proach would need to be carefully monitored, clini-cians were involved in data collection for a number ofreasons:
� The nursing team were concerned that patients maybecome stressed if receiving multiple visitors (e.g.,COPD nurse plus research nurse) whilst recoveringfrom severe illness;
� The commissioning team wished to generate robustevidence but had limited funds with which to dothis;
� One of the remits of the funding body(Collaboration for Leadership in Applied Health andResearch Care for South Yorkshire) was to involve
multiple partners in research, including frontlineclinical staff, in order to bridge the gap betweenresearch and implementation in healthcare [19].
The clinical team underwent Good Clinical Practice(GCP) training and were carefully instructed in the re-quirements of the protocol.
Inclusion/exclusion criteriaThe recruitment inclusion/exclusion criteria were asfollows:
Inclusion criteria
� Between one and three previous admissions(including the current admission) in the previous12 months from the date of discharge with COPDas the primary or secondary documented reason forhospitalisation;
� Referred to the COPD discharge service;� Willing to consider using Telehealth as part of the
discharge plan;
Table 2 Care pathways and integrated research activity
Timeline Standard COPD service Telehealth-supported COPD service
Intervention 1 day – First home visit after hospitaldischarge (baseline time 0)
Home visit (Trial info pack) Home visit (Trial info pack)
3 days Home visit: Home visit:
Consent Consent
Baseline SGRQ (paper) Baseline SGRQ (paper)
Baseline EQ-5D (paper) Letter to inform GP of trial
GP record diaries (paper)
Letter to inform GP of trial
5 days Home visit Telehealth equipment installed
Baseline EQ-5D (device)
GP visit data (device)
2 weeks Home visit Remote review of Telehealth parametersthroughout 8-week intervention
5 weeks 5-week EQ-5D (paper) 5-week EQ-5D (on device)
6 weeks Home visit
8 weeks Discharge home visit: Discharge home visit:
8-week SGRQ (paper) 8-week SGRQ (paper)
Given materials for 6-month SGRQ Given materials for 6-month SGRQ
Given monthly EQ-5D and GP visit diaries Given monthly EQ-5D and GP visit diaries
Telehealth equipment removed
Follow-up 8 months (6 months after dischargedfrom service)
Measurement of outcomes (postal return): Measurement of outcomes (postal return):
Completion of 6-month SGRQ Completion of 6-month SGRQ
Completion of monthly EQ-5D Completion of monthly EQ-5D
Completion of monthly GP record visit diaries Completion of monthly GP record visit diaries
EQ-5D, EuroQol 5 Dimensions; GP, General practitioner; SGRQ, St. George’s Respiratory Questionnaire.
Bentley et al. Trials 2014, 15:313 Page 4 of 12http://www.trialsjournal.com/content/15/1/313
the current admission) in the previous 12 months from the date of discharge with COPD as the primary or secondary documented reason for hospitalisation;
• Referred to the COPD discharge service;• Willing to consider using Telehealth as part of the discharge
plan;• Able to communicate in English and read English (a
requirement of the technology);• Have a telephone landline in the home (a requirement of the
technology).
Exclusion criteria• Cognitive impairment to the extent that it impedes ability to
participate;• Other significant impairment(s) which restrict ability to
participate;• Existence of co-morbidities which require ongoing
intervention from other community services;• More than three hospital admissions for COPD within the
prior 12 months;• General practitioner (GP) identifies that person is unsuitable
to participate (eg, due to a mental health condition which could affect outcome measurements).
Data collectionTable 2 provides more detail on trial pathways and data collection time points. The main planned sources of data collection were:
1. Researcher-collected data: demographic information (age and sex) were collected by the research team from routine referral records. Extracts from the Secondary Uses Service (SUS (http://www.hscic.gov.uk/sus)) database, which provides data on hospital readmissions, were provided by the (blinded) PCT statistical team to the research team for each participant for the 8 months that they participated in the trial.
2. Clinician-collected data: the St. George’s Respiratory Questionnaire (SGRQ), a validated self-measure of respiratory disease-related quality of life,20 was completed by the participant at baseline and 8 weeks, and was to be overseen and collected by the visiting clinician. SGRQ was also completed at 8 months (6 months post-intervention) and returned to the research team via post. This was supplemented by members of the clinical team calling participants to remind them to complete and send their 8-month SGRQs;
3. Device-collected data: a self-report patient-completed diary to record GP visits was recorded on paper by participants receiving the standard service and was configured to be completed on the device by those receiving Telehealth, during the 8-week intervention. During the 6-month follow-up, participants in both trial arms were asked to complete monthly paper diaries recording their GP visits. The EuroQol 5 Dimensions questionnaire (EQ-5D-3 L), a widely used measure of health outcomes standardised in a wide variety of conditions,21 was embedded into the GP diaries for those allocated to the Standard service and into the device for participants with the Telehealth-supported service.
ResultsThroughout the trial, recruitment rate and quality ofdata collection were significantly impacted by an un-anticipated reduction in clinical staff capacity. These fac-tors precluded progression to a full RCT in this setting.The findings in relation to the three objectives of thepilot RCT are outlined below.
Objective one: trial methodologyRecruitmentThe CONSORT [15] flow chart for the pilot trial is shownin Figure 1. Recruitment and intervention delivery tookplace from November 2010 to December 2011, withfollow-up for 6-month post-intervention data capturecontinuing to June 2012. Although the recruitment targetof n = 60 was achieved, this was attributed to the pilotRCT time frame being extended from 3 to 14 months dueto slow recruitment to the study. During the trial timeframe, 450 patients were referred to the COPD discharge
service, of which 270 (60%) met the inclusion criteria. Ofthese, 132 could not be considered for inclusion in thestudy due to reasons other than declining participation, assummarised in Table 3. Some of the most common rea-sons were lack of clinician resources due to staff attritionthat resulted in a long waiting list for admission to the ser-vice (thereby breaching the care and research protocol),immediate hospital readmission, and patient holidays/holi-day periods. Of the remaining patients, 75 declined to par-ticipate and 63 (14%) agreed to enter the study and wererandomised. Trial acceptance rate was 45.7% (out of 138patients who were eligible and were not excluded for otherreasons); 31 participants were randomised to the standardservice and 32 participants were randomised to receivethe Telehealth-supported service. The clinicians reportedthat refusal to participate was most often due to the per-son feeling too unwell.Of the 63 randomised participants, data for 10 (15.9%)
were excluded from analysis as data completion was
Figure 1 CONSORT flow chart.
Bentley et al. Trials 2014, 15:313 Page 6 of 12http://www.trialsjournal.com/content/15/1/313

34 Respiratory Therapy Vol. 10 No. 1 n Winter 2015 Respiratory Therapy Vol. 10 No. 1 n Winter 2015 35
Outcome measuresThe two co-primary outcome measures were:1. The proportion of participants re-admitted to hospital with
COPD during the 8-week intervention and 6-month follow-up, determined using SUS data on hospital readmissions; and
2. Change in self-reported health-related quality of life at baseline, 8 weeks, and 6-month follow-up through application of the SGRQ.20
The secondary outcome measures were:1. The proportion of patients requiring unscheduled healthcare
support for the 8 week intervention period and 6-month follow-up, determined through analysis of SUS data and patient-completed diaries of GP visits; and
2. Cost-effectiveness through quality adjusted life years (QALYs) estimated from analysis of EQ-5D-3 L21 data, GP visit data, SUS data, and the COPD discharge team’s patient contact records.
Analysis – primary outcome measuresAnalysis was conducted on an intention-to-treat basis. For the primary outcome measures, descriptive statistics are presented. No inferential statistical analyses were performed as the main objective of the study was to assess the trial methodology.
Analysis – cost-effectiveness and cost utilityData on hospital admissions and unscheduled healthcare support, EQ-5D scores, and COPD team patient contact records were to be accessed and analysed to provide an indication of the cost-effectiveness of each care pathway. A cost-utility analysis was carried out based on the estimated costs of Telehealth equipment, installation and de-installation of units, telemonitoring, and clinician costs. The cost of a day of COPD-related hospital admission and other secondary care services,
including accident and emergency (A&E) visits, were extracted from the National Reference Costs Publication.22
EthicsAll necessary NHS ethical and governance approvals were obtained from the South Yorkshire Research Ethics Committee (reference 10/H130/48) and from the relevant PCT.
ResultsThroughout the trial, recruitment rate and quality of data collection were significantly impacted by an unanticipated reduction in clinical staff capacity. These factors precluded progression to a full RCT in this setting. The findings in relation to the three objectives of the pilot RCT are outlined below.
Objective one: trial methodologyRecruitmentThe CONSORT15 flow chart for the pilot trial is shown in Figure 1. Recruitment and intervention delivery took place from November 2010 to December 2011, with follow-up for 6-month post-intervention data capture continuing to June 2012. Although the recruitment target of n = 60 was achieved, this was attributed to the pilot RCT time frame being extended from 3 to 14 months due to slow recruitment to the study. During the trial time frame, 450 patients were referred to the COPD discharge service, of which 270 (60%) met the inclusion criteria. Of these, 132 could not be considered for inclusion in the study due to reasons other than declining participation, as summarised in Table 3. Some of the most common reasons were lack of clinician resources due to staff attrition that resulted in a long waiting list for admission to the service (thereby breaching the care and research protocol), immediate hospital readmission, and patient holidays/holiday periods. Of the remaining patients, 75 declined to participate and 63 (14%) agreed to enter the study and were randomised. Trial acceptance rate was 45.7% (out of 138 patients who were eligible and were not excluded for other reasons); 31 participants were randomised to the standard service and 32 participants were randomised to receive the Telehealth-supported service. The clinicians reported that refusal to participate was most often due to the person feeling too unwell.
Of the 63 randomised participants, data for 10 (15.9%) were excluded from analysis as data completion was inadequate. A further 5 participants randomised to the Telehealth-supported service were lost to follow-up (Table 4). In three instances, this was due to unexpected problems with technology connectivity despite the existence of a protocol to screen out such problems. One participant in each group died prior to completing the 6-month follow-up.
Protocol adherence and success of data collection strategyTable 5 summarises the completeness of data collection at each time point and provides an indication of extent of adherence to the research protocol. A total of 83.3% of participants completed the intervention within the 8-week service delivery time frame.
After 6 months of data collection an audit was conducted to determine adherence to data collection procedures. Significant gaps were identified which resulted in the initiation of additional procedures. The most significant change was the introduction of a research nurse in month 10 to take consent and collect trial-related data, thereby relieving the clinical team of this responsibility. Protocol adherence during the
inadequate. A further 5 participants randomised to theTelehealth-supported service were lost to follow-up(Table 4). In three instances, this was due to unexpectedproblems with technology connectivity despite the exist-ence of a protocol to screen out such problems. Oneparticipant in each group died prior to completing the6-month follow-up.
Protocol adherence and success of data collection strategyTable 5 summarises the completeness of data collectionat each time point and provides an indication of extentof adherence to the research protocol. A total of 83.3%of participants completed the intervention within the 8-week service delivery time frame.After 6 months of data collection an audit was con-
ducted to determine adherence to data collection proce-dures. Significant gaps were identified which resulted inthe initiation of additional procedures. The most signifi-cant change was the introduction of a research nurse inmonth 10 to take consent and collect trial-related data,thereby relieving the clinical team of this responsibility.Protocol adherence during the 8-week intervention in-creased to 100% after the research nurse was involved.As demonstrated in Table 5, there were many instancesof missing or invalid SGRQ data, with 56.6%, 54.2%, and28.3% valid completion rates for each respective timepoint (when excluding drop-outs and missing consent).
Only 43.8% of participants had a valid SGRQ score forboth baseline and 8-week time points, and this figure re-duced to just 8.7% for all three time points. The SGRQis designed to be completed by the participant overseen bya researcher or healthcare professional. Although this wasagreed in the protocol, clinicians tended to leave the SGRQwith participants to complete in their own time. Clinicianfeedback during the pilot was that they did not feel com-fortable overseeing SGRQ completion as they were wary ofbiasing participants’ responses when asked for advice.The completion rate for the standard service 8-week
self-report diaries (which included the EQ-5D) was simi-larly challenged. The standard service group EQ-5Dcompletion rate at baseline was 72.0% with a 5 weekcompletion rate of 44.0%, which did not allow compari-son with EQ-5D data from the Telehealth-supportedgroup (embedded within Doc@Home). The self-reportdiaries for the standard service group were completed in44.0% of cases. The postal return of monthly diaries inthe 6-month follow-up (which were given to bothgroups) did not yield meaningful data (12.5% returned).
Objective two: healthcare usage and sample size calculationBaseline characteristicsTable 6 shows age and sex distribution for the 53 consentedparticipants. The Telehealth-supported group contained agreater proportion of males and had a slightly higher meanage. Lack of comparability between the two trial arms wasa likely consequence of the small sample size.
Healthcare service usage dataData on the frequency and length (bed days) of hospitaladmissions, frequency of A&E visits (which did not leadto hospital admission), and frequency and type ofcommunity healthcare service contacts (other than theCOPD discharge service) were extracted for all partici-pants (who completed the 8 week intervention) for theduration of the intervention and 6-month follow-up. Re-sults summarised in Table 7 show that participants re-ceiving the standard service had a lower readmissionrate, fewer hospital admissions, and fewer inpatient beddays than those receiving the Telehealth-supported ser-vice. Frequency of community healthcare service contactwas similar between the two groups. It was not possibleto infer the number of GP visits from the available data.
Sample size calculationIt was not possible to use the pilot RCT data to generatea sample size calculation due to incomplete data collec-tion. Therefore, the calculation was conducted using es-timates of readmission rates, clinically meaningful effectsizes based on the literature, and clinical expertise. A 10to 20% relative reduction in hospital readmission ratewas deemed to be clinically meaningful. Table 8 shows
Table 3 Reasons for exclusion from trial
Reasons (n = 132) Number(% of eligible patients)
Backlog on telephone referral waiting list 69 (25.6%)
Not seen within adequate trial time frame 15 (5.6%)
Readmitted to hospital straightaway 11 (4.1%)
Discharged over Christmas holiday period 10 (3.7%)
Disruptions to care pathway schedule 6 (2.2%)
Unable to contact 5 (1.9%)
Patient does not believe they have COPD 4 (1.5%)
Care home resident 3 (1.1%)
Unknown clinical reason 3 (1.1%)
Going on holiday 2
Discharged elsewhere 2
Leaving area 1
Offered trial previously 1
Table 4 Reasons for discontinuing Telehealth intervention
Reason Number
No landline 2 (0.4%)
Unable to install 1 (0.2%)
Refused unit at installation stage 1 (0.2%)
Found unit difficult to use 1 (0.2%)
Bentley et al. Trials 2014, 15:313 Page 7 of 12http://www.trialsjournal.com/content/15/1/313
8-week intervention increased to 100% after the research nurse was involved. As demonstrated in Table 5, there were many instances of missing or invalid SGRQ data, with 56.6%, 54.2%, and 28.3% valid completion rates for each respective time point (when excluding drop-outs and missing consent). Only 43.8% of participants had a valid SGRQ score for both baseline and 8-week time points, and this figure reduced to just 8.7% for all three time points. The SGRQ is designed to be completed by the participant overseen by a researcher or healthcare professional. Although this was agreed in the protocol, clinicians tended to leave the SGRQ with participants to complete in their own time.
Clinician feedback during the pilot was that they did not feel comfortable overseeing SGRQ completion as they were wary of biasing participants’ responses when asked for advice.
The completion rate for the standard service 8-week self-report diaries (which included the EQ-5D) was similarly challenged. The standard service group EQ-5D completion rate at baseline was 72.0% with a 5 week completion rate of 44.0%, which did not allow comparison with EQ-5D data from the Telehealth-supported group (embedded within Doc@Home). The self-report diaries for the standard service group were completed in 44.0%
the sample sizes required to detect reductions in thisrange, given 90% power to detect significant differences ata P value of 0.05. If we take an intermediate value, with a15% relative reduction in hospital admissions from 34% to29%, 1,517 patients per arm (n = 3,034 total) would be re-quired for a full RCT.
Objective three: quality of life and preliminary evaluationof cost-effectivenessSGRQ data analysis shows that both groups reported an in-crease in disease-related quality of life (decrease in SGRQscore) between baseline and 8 weeks (Table 9). However,this increase was larger in the standard service group.
Table 5 Data completion for research outcomes
Standard Telehealth Total
Total randomised 31 (100%) 32 (100%) 63 (100%)
Consent
Valid consent 25 (80.6%) 28 (87.5%) 53 (84.1%)
Missing consent 6 (19.4%) 4 (12.5%) 10 (15.9%)
Dropped out
Prior to 8-week completion 0 (0.0%) 5 (15.6%) 5 (7.9%)
Prior to 8-month completion 1 (3.2%) 1 (3.1%) 2 (3.2%)
Intervention length
8 weeks 20 (64.5%) 20 (62.5%) 40 (63.5%)
Less than 8 weeks 0 (0.0%) 0 (0.0%) 0 (0.0%)
More than 8 weeks 5 (16.1%) 3 (9.4%) 8 (12.7%)
Baseline SGRQ
Valid 16 (51.6%) 14 (43.8%)* 30 (47.6%)
Invalid** 5 (16.1%) 3 (9.4%) 8 (12.7%)
Missing 4 (13.0%) 7 (21.9%) 11 (17.5%)
8-week SGRQ
Valid 11 (35.5%) 15 (46.9%) 26 (41.3%)
Invalid 2 (6.5%) 1 (3.1%) 3 (4.8%)
Missing 12 (38.7%) 7 (21.9%) 19 (30.2%)
6-month SGRQ
Valid 8 (25.8%) 5 (15.6%) 13 (20.6%)
Invalid 1 (3.2%) 1 (3.1%) 2 (3.2%)
Missing 5 (16.1%) 5 (15.6%) 10 (15.9%)
Had not reached time point by Jan12 10 (32.3%) 11 (34.4%) 21 (33.3%)
Participants with valid baseline & 8-week SGRQ data 9 (29.0%) 12 (37.5%) 21 (33.3%)
Participants with valid baseline, 8-week & 6-month SGRQ data 2 (6.5%) 2 (6.3%) 4 (6.3%)
*One participant who dropped out completed the baseline SGRQ; **Not enough completed questions to generate a valid score.SGRQ, St. George’s Respiratory Questionnaire.
Table 6 Baseline demographic information
Demographic Standard Telehealth Total
Sex
Male, n (%) 7 (28.0%) 12 (42.9%) 19 (35.8%)
Female, n (%) 18 (72.0%) 16 (57.1%) 34 (64.2%)
Age (years)
Mean (SD) 65.88 (9.39) 67.22 (11.60) 66.59 (10.54)
Median (IQR) 68.00 (58.85–72.85) 70.80 (60.93–73.73) 69.60 (59.80–73.40)
Minimum 41.2 44.2 41.2
Maximum 78.4 90.9 90.9
Bentley et al. Trials 2014, 15:313 Page 8 of 12http://www.trialsjournal.com/content/15/1/313

36 Respiratory Therapy Vol. 10 No. 1 n Winter 2015 Respiratory Therapy Vol. 10 No. 1 n Winter 2015 37
of cases. The postal return of monthly diaries in the 6-month follow-up (which were given to both groups) did not yield meaningful data (12.5% returned).
Objective two: healthcare usage and sample size calculationBaseline characteristicsTable 6 shows age and sex distribution for the 53 consented participants. The Telehealth-supported group contained a greater proportion of males and had a slightly higher mean age. Lack of comparability between the two trial arms was a likely consequence of the small sample size.
Healthcare service usage dataData on the frequency and length (bed days) of hospital admissions, frequency of A&E visits (which did not lead to hospital admission), and frequency and type of community healthcare service contacts (other than the COPD discharge service) were extracted for all participants (who completed the 8 week intervention) for the duration of the intervention and 6-month follow-up. Results summarised in Table 7 show that participants receiving the standard service had a lower readmission rate, fewer hospital admissions, and fewer inpatient bed days than those receiving the Telehealth-supported service. Frequency of community healthcare service contact was similar between the two groups. It was not possible to infer the number of GP visits from the available data.
Sample size calculationIt was not possible to use the pilot RCT data to generate a sample size calculation due to incomplete data collection. Therefore, the calculation was conducted using estimates of readmission rates, clinically meaningful effect sizes based on the literature, and clinical expertise. A 10 to 20% relative reduction in hospital readmission rate was deemed to be clinically meaningful. Table 8 shows the sample sizes required to detect reductions in this range, given 90% power to detect significant differences at a P value of 0.05. If we take an intermediate value, with a 15% relative reduction in hospital admissions from 34% to 29%, 1,517 patients per arm (n = 3,034 total) would be required for a full RCT.
Objective three: quality of life and preliminary evaluation of cost-effectivenessSGRQ data analysis shows that both groups reported an increase in disease-related quality of life (decrease in SGRQ score) between baseline and 8 weeks (Table 9). However, this increase was larger in the standard service group.
Table 9. St George’s Respiratory Questionnaire (SGRQ) analysis for participants with valid baseline and 8-week SGRQ scores
Due to gaps in data collection the analysis method was adjusted so that EQ-5D scores were calculated from participants’ SGRQ scores using a mapping formula produced in a previous study in patients with COPD.23 This estimates EQ-5D score as a function of SGRQ total score and sex. Quality adjusted life years (QALYs) were calculated from the EQ-5D scores using the trapezium rule. Missing data were imputed using the last observation carried forward method. Costs and QALYs were calculated for each group, and then used to plot data on the cost-effectiveness plane and to produce associated cost-effectiveness acceptability curves. A value of £20,000 per QALY was used to determine the probability that the intervention is cost-effective under current funding conditions.
The primary analysis was based on all NHS costs and was performed using estimates of unit costs and estimates of resource use. There was a higher mean total cost in the Telehealth-supported group (£1,750 vs. £580 for the standard service). Comparison with the mean cost difference showed an incremental cost per QALY gained of £68,811 (Table 10).
Table 10. NHS cost and QALYs over 6 months
A secondary sensitivity analysis was carried out based on just the costs relating to community care, i.e., Telehealth and nursing
Due to gaps in data collection the analysis method wasadjusted so that EQ-5D scores were calculated from par-ticipants’ SGRQ scores using a mapping formula pro-duced in a previous study in patients with COPD [23].This estimates EQ-5D score as a function of SGRQ totalscore and sex. Quality adjusted life years (QALYs) werecalculated from the EQ-5D scores using the trapeziumrule. Missing data were imputed using the last
observation carried forward method. Costs and QALYswere calculated for each group, and then used to plotdata on the cost-effectiveness plane and to produce asso-ciated cost-effectiveness acceptability curves. A value of£20,000 per QALY was used to determine the probabilitythat the intervention is cost-effective under currentfunding conditions.The primary analysis was based on all NHS costs and
was performed using estimates of unit costs and esti-mates of resource use. There was a higher mean totalcost in the Telehealth-supported group (£1,750 vs. £580for the standard service). Comparison with the meancost difference showed an incremental cost per QALYgained of £68,811 (Table 10).A secondary sensitivity analysis was carried out based
on just the costs relating to community care, i.e., Tele-health and nursing contacts. The rationale for this wasthat hospitalisations had a disproportionate effect on theresults, and being so rare in a pilot study, their mean ef-fect was possibly largely due to chance.The results of the secondary analysis, using only the
costs of community care, showed that there is a 71.4%chance that the Telehealth-supported services are cost-effective given the willingness to pay of £2,041 perQALY gained (Table 11).To summarise, when considering community care
costs only, and estimated equipment costs of £455 over5 years with a fairly low utilisation rate (three users peryear), the Telehealth intervention is perceived to becost-effective. However, when hospital admissions dataare included in the analysis then the Telehealth interven-tion is not deemed to be cost-effective.
DiscussionIn this paper we describe a pilot randomised controlledtrial of a Telehealth intervention for COPD. The resultsshowed that it would not be feasible to continue thepilot trial to a full RCT. In conducting this research wehave identified issues of critical importance for any sub-sequent study of this complex intervention, includingthe involvement of clinicians in recruitment and in theresearch process. The service commissioners’ expect-ation was that Telehealth-supported services might beclinically and cost-effective for people receiving time-limited support following hospital discharge. Althoughthe pilot trial has not been able to give a robust indica-tion of clinical or cost benefit due to its small samplesize and incomplete data collection, it has achieved itsobjective of demonstrating the practicalities of answeringthese questions with a full scale RCT in this particularsetting.Compared to studies recruiting participants at mul-
tiple sites and working with several clinical teams, itcould be presumed that working with one clinical team
Table 7 Healthcare service use by participants
Standard Telehealth Total
Sample size 25 23 48
Proportion with hospital admissions
Number 4 8 12
Percentage 16.0% 34.8% 25.0%
Number of hospital admissions
Total 7 16 23
Mean 0.28 0.70 0.48
Maximum 3 5 5
Total number of hospital days
Total 21 129 150
Mean 0.84 5.61 3.13
Maximum 14 43 43
Proportion with A&E visits
Number 4 1 5
Percentage 16.0% 4.3% 10.4%
Number of A&E visits
Total 5 1 6
Mean 0.20 0.04 0.13
Maximum 2 1 2
Proportion with community nurse contacts
Number 4 5 9
Percentage 16.0% 21.7% 18.8%
Number of community nurse contacts
Total 8 13 21
Mean 0.32 0.57 0.44
Maximum 3 4 4
Mortality rate
Number 1 1 2
Percentage 4.0% 4.3% 4.2%
Table 8 Required per arm sample size at P = 0.05 and 0.9power
Relativereduction
Absolute reductionin number of admissionsper 100 discharges
Sample sizeper arm
10% 3 4,240
15% 5 1,517
20% 7 768
Bentley et al. Trials 2014, 15:313 Page 9 of 12http://www.trialsjournal.com/content/15/1/313
contacts. The rationale for this was that hospitalisations had a disproportionate effect on the results, and being so rare in a pilot study, their mean effect was possibly largely due to chance.
The results of the secondary analysis, using only the costs of community care, showed that there is a 71.4% chance that the Telehealth-supported services are cost-effective given the willingness to pay of £2,041 per QALY gained (Table 11).
Table 11. Community care costs and QALYs over 6 months
To summarise, when considering community care costs only, and estimated equipment costs of £455 over 5 years with a fairly low utilisation rate (three users per year), the Telehealth intervention is perceived to be cost-effective. However, when hospital admissions data are included in the analysis then the Telehealth intervention is not deemed to be cost-effective.
DiscussionIn this paper we describe a pilot randomised controlled trial of a Telehealth intervention for COPD. The results showed that it would not be feasible to continue the pilot trial to a full RCT. In conducting this research we have identified issues of critical importance for any subsequent study of this complex intervention, including the involvement of clinicians in recruitment and in the research process. The service commissioners’ expectation was that Telehealth-supported services might be clinically and cost-effective for people receiving time-limited support following hospital discharge. Although the pilot trial has not been able to give a robust indication of clinical or cost benefit due to its small sample size and incomplete data collection, it has achieved its objective of demonstrating the practicalities of answering these questions with a full scale RCT in this particular setting.
Compared to studies recruiting participants at multiple sites and working with several clinical teams, it could be presumed that working with one clinical team with high volume referral rates in one community would simplify the research process. The study was conducted within an existing clinical service, thus bringing
increased external validity through its pragmatic design24 and the ability to directly inform one region’s commissioning choices with regard to Telehealth. However, the process of undertaking this study reinforces findings from larger-scale studies (eg, Hendy et al.25) regarding the difficulty of evaluating novel, complex interventions such as Telehealth, especially when trying to assess the utility of the intervention within a clinical service alongside undertaking rigorous research.
The study was dependent upon one small clinical team working against a backdrop of NHS restructuring. Even though initial difficulties with obtaining staff ‘buy in’ were identified and appeared to be resolved during the feasibility study, incremental demands created by the research combined with the loss of a key champion for the trial amongst the front line staff had a deleterious effect over time. Further staff attrition resulted in an eventual total loss of 60% of staff capacity within the frontline clinical team. Thus, the main challenge of involving frontline clinicians in the research and in data collection was that, understandably, clinical priorities always came first, and when resources were stretched there was little room for the rigorous research processes which were required for the pilot trial. PCT budgetary restrictions prevented return of the COPD team to its initial capacity. The combined effect of reduced staff capacity and some non-compliance with trial procedures (both staff and participants) resulted in incomplete data collection and slow recruitment to the trial. This also shows that GCP training of clinical staff is not enough to ensure adherence to trial procedures, thus research processes and data collection need to be rigorously monitored throughout the trial.
Despite the successful introduction of a Research Nurse in month 10 to consent participants and collect trial data, organisational changes within the PCT would not have allowed continuation of the pilot trial to a full RCT even if the limitations of the methodology were resolved. One example of an organisational change which impacted the project was the national reorganisation of the NHS, meaning that PCTs were disbanded in March 2013 and replaced by Clinical Commissioning Groups.
with high volume referral rates in one community wouldsimplify the research process. The study was conductedwithin an existing clinical service, thus bringing in-creased external validity through its pragmatic design[24] and the ability to directly inform one region’scommissioning choices with regard to Telehealth. How-ever, the process of undertaking this study reinforcesfindings from larger-scale studies (e.g., Hendy et al. [25])regarding the difficulty of evaluating novel, complex in-terventions such as Telehealth, especially when trying toassess the utility of the intervention within a clinical ser-vice alongside undertaking rigorous research.The study was dependent upon one small clinical team
working against a backdrop of NHS restructuring. Eventhough initial difficulties with obtaining staff ‘buy in’were identified and appeared to be resolved during thefeasibility study, incremental demands created by the re-search combined with the loss of a key champion for thetrial amongst the front line staff had a deleterious effectover time. Further staff attrition resulted in an eventualtotal loss of 60% of staff capacity within the frontlineclinical team. Thus, the main challenge of involvingfrontline clinicians in the research and in data collectionwas that, understandably, clinical priorities always camefirst, and when resources were stretched there was littleroom for the rigorous research processes which were re-quired for the pilot trial. PCT budgetary restrictions pre-vented return of the COPD team to its initial capacity.The combined effect of reduced staff capacity and somenon-compliance with trial procedures (both staff andparticipants) resulted in incomplete data collection and
slow recruitment to the trial. This also shows that GCPtraining of clinical staff is not enough to ensure adherenceto trial procedures, thus research processes and data col-lection need to be rigorously monitored throughout thetrial.Despite the successful introduction of a Research
Nurse in month 10 to consent participants and collecttrial data, organisational changes within the PCT wouldnot have allowed continuation of the pilot trial to a fullRCT even if the limitations of the methodology were re-solved. One example of an organisational change whichimpacted the project was the national reorganisation ofthe NHS, meaning that PCTs were disbanded in March2013 and replaced by Clinical Commissioning Groups.The consequences of both care pathways being rela-
tively new within what was a recently introduced servicecannot be underestimated. Fidelity to the pathways wasdifficult to achieve at the outset and was readily compro-mised. The waiting list for admission to the dischargeservice, which began to build in month 4 of the pilottrial due to the unanticipated 60% reduction in staff cap-acity, is a clear example of how the care pathways werechanged due to service imperatives which were out ofthe control of the research team.There were issues regarding clinician commitment to
Telehealth and the work-based support they needed todeliver this new intervention efficiently and appropri-ately. The importance of training and on-going supportto deliver Telehealth is now recognised [14], but was notavailable to the clinicians who participated in this studywith the consequence that adherence easily eroded and
Table 9 St George’s Respiratory Questionnaire (SGRQ) analysis for participants with valid baseline and 8-week SGRQscores
Time point Metric Standard (n = 9) Telehealth (n = 12)
Mean (SD) 65.34 (13.68)* 69.63 (16.58)
Baseline (n = 21) Median (IQR) 67.24 (52.97–77.73) 73.32 (55.16–83.85)
Min – Max (Range) 44.77–82.25 (37.48) 35.88–88.09 (52.21)
Mean (SD) 59.18 (13.21) 67.47 (15.70)
8-week (n = 21) Median (IQR) 62.14 (44.52–67.98) 69.99 (55.82–76.83)
Min – Max (Range) 42.71–81.66 (38.95) 37.18–87.88 (50.70)
*The SGRQ is scored from 0 (best possible health status) to 100 (worst possible health status).
Table 10 NHS cost and QALYs over 6 months
Item Standardmean (n = 25)
Telehealthmean (n = 28)
Meandifference
Total costs £580 £1,749.8 £1,169.8
Quality adjusted lifeyears gained
0.20 0.217 0.017
Incrementalcost-effectivenessratio
£68,811 per QALY
Table 11 Community care costs and QALYs over 6 months
Item Standardmean(n = 25)
Telehealthmean(n = 28)
Meandifference
Total costs £348.3 £383 £34.7
Quality adjustedlife years gained
0.20 0.217 0.017
Incrementalcost-effectivenessratio
£2,041 per QALY
Bentley et al. Trials 2014, 15:313 Page 10 of 12http://www.trialsjournal.com/content/15/1/313

38 Respiratory Therapy Vol. 10 No. 1 n Winter 2015 Respiratory Therapy Vol. 10 No. 1 n Winter 2015 39
The consequences of both care pathways being relatively new within what was a recently introduced service cannot be underestimated. Fidelity to the pathways was difficult to achieve at the outset and was readily compromised. The waiting list for admission to the discharge service, which began to build in month 4 of the pilot trial due to the unanticipated 60% reduction in staff capacity, is a clear example of how the care pathways were changed due to service imperatives which were out of the control of the research team.
There were issues regarding clinician commitment to Telehealth and the work-based support they needed to deliver this new intervention efficiently and appropriately. The importance of training and on-going support to deliver Telehealth is now recognised,14 but was not available to the clinicians who participated in this study with the consequence that adherence easily eroded and confidence waned. Problems with device connectivity for some of the participants randomised to receive Telehealth despite application of the study’s inclusion/exclusion criteria reinforced the lack of clinician confidence.
Feedback from the feasibility study indicated that those receiving the clinician-delivered ‘standard service’ valued this service and benefitted from it, and that both groups expressed a preference for personalised face-to-face service. The question this poses is whether those receiving Telehealth were disadvantaged in this instance compared with those in receipt of a specialist face-to-face service, which was highly tailored to patient need but unlikely to be sustainable in the longer term. This preference for face-to-face care may be more influential than the perceived reassurance of daily monitoring provided through using Telehealth. Additionally, questions were raised by the study regarding which patients might gain most benefit from Telehealth. Study participants were recruited at the point of hospital discharge and it became evident that receptiveness to using Telehealth could be severely compromised by their illness. It is possible that asking a patient to use a piece of technology at this point, even one which is simple to use, could be a daunting commitment to take on in addition to recovering from their exacerbation. There are unanswered questions regarding when in the overall care pathway from acute to primary care can Telehealth technology be most effective and for how long, taking into account exacerbation severity. There are also questions around the representativeness of the sample, and when in the COPD disease pathway deployment of Telehealth would be of most benefit. Forty percent of patients referred to the COPD service failed to qualify for the trial on one or more of the eligibility criteria, indicating that trial participants may not have been fully representative of the COPD population as a whole and that our trial design may not have been as ‘pragmatic’ as had been intended. The definition of between one and three previous hospital admissions, which formed a key component of the eligibility criteria, was based on the local definition of early stage COPD. However, it could be argued that a person with three admissions in the previous 12 months may have more advanced disease compared to someone with one or no admissions. To summarise, commissioners and clinicians require greater guidance for deployment.
By definition, complex interventions are difficult to define, standardise, and measure, and enthusiasm to undertake research can underestimate this. The results obtained from this study question the viability of involving front line clinical staff in data collection for robust research evaluation. Whilst it is true that
clinicians do not need to be involved in data collection, the observations of Bird et al.26 provide further support regarding the importance of context and culture when conducting trials, yet this is not evidenced through on-going commissioning of trials of complex interventions.
Questions remain regarding how to most appropriately conduct local evaluations to inform commissioning decisions. Leykum et al.27 suggest integration of participatory action research and randomised controlled trial methods to ensure that a complex intervention is adequately embedded within the setting. Arguably, this did occur within this study through the extensive involvement of commissioners and clinicians in study set up, design, and progress, and through regular meetings during the entire programme. As demonstrated by Hendy et al.,25 the drive to demonstrate population-based benefit through evaluation of complex interventions does not necessarily equate with the demands of implementing a complex intervention in situ.
ConclusionsWe were able to complete an informative pilot RCT, despite service reconfiguration and slow recruitment rates. However, ultimately, these factors precluded progression to a full RCT in this setting. On the basis of our experience in conducting this pilot study, we are able to recommend that a definitive trial should be multi-centre and aim to include 1,517 participants in each arm. Consent, randomisation, and data collection (in accordance with the protocol) should be supported by dedicated research staff rather than by clinicians. However, the study also raises a dilemma — there are indications that patients prefer face-to-face contact even when offered daily but remote interaction through Telehealth, yet this model of care delivery may not be sustainable in the current climate.
References1 Mannino DM, Buist AS: Global burden of COPD: risk factors,
prevalence, and future trends. Lancet 2007, 370(9589):765-773.
2 Ram FSF, Wedzicha JA, Wright J, Greenstone M: Hospital at home for patients with acute exacerbations of chronic obstructive pulmonary disease: systematic review of evidence. BMJ 2004, 329:315.
3 Gruffydd-Jones K, Langley-Johnson C, Dyer C, Badlan K, Ward S: What are the needs of patients following discharge from hospital after an acute exacerbation of chronic obstructive pulmonary disease (COPD)? Prim Care Respir J 2007, 16(6):363-368.
4 Department of Health: An Outcomes Strategy for Chronic Obstructive Pulmonary Disease (COPD) and Asthma in England. 2011. https://www.gov.uk/government/publications/an-outcomes-strategy-for-people-with-chronic-obstructive-pulmonary-disease-copd-and-asthma-in-england
5 Department of Health: A Strategic Approach to Prevention and Early Identification of COPD. 2011. http://www.respiratoryresources.org.uk/COPD.html
6 Horton K: The use of telecare for people with chronic obstructive pulmonary disease: implications for management. J Nurs Manag 2008, 16:173-180.
7 McLean S, Nurmatov U, Liu JLY, Pagliari C, Car J, Sheikh A: Telehealthcare for chronic obstructive pulmonary disease: Cochrane Review and meta-analysis. Br J Gen Pract 2012, 62(604):e739-e749.
8 Department of Health: Whole Systems Demonstrators: An Overview of Telecare and Telehealth. 2009. http://
webarchive.nationalarchives.gov.uk/+/dh.gov.uk/en/Publicationsandstatistics/Publications/PublicationsPolicyAndGuidance/DH_100946
9 Steventon A, Bardsley M, Billings J, Dixon J, Doll H, Hirani S, Cartwright M, Rixon L, Knapp M, Henderson C, Rogers A, Fitzpatrick R, Hendy J, Newman S: Effect of telehealth on use of secondary care and mortality: findings from the Whole System Demonstrator cluster randomised trial. BMJ 2012, 344(3):e3874.
10 Department of Health: Generic Long Term Conditions Model. 2010. http://webarchive.nationalarchives.gov.uk/+/www.dh.gov.uk/en/Healthcare/Longtermconditions/DH_120915
11 Darkins A, Ryan P, Kobb R, Foster L, Edmonson E, Wakefield B, Lancaster AE: Care Coordination/Home Telehealth: the systematic implementation of health informatics, home Telehealth, and disease management to support the care of Veteran Patients with Chronic Conditions. Telemed J E Health 2008, 14(10):1118-1126.
12 Canada Health Infoway: Telehealth Benefits and Adoption: Connecting People and Providers across Canada. 2011. https://www.infoway-inforoute.ca/programs-services/investment-programs/telehealth
13 Giordano R, Clark M, Goodwin N: Perspectives on Telehealth and Telecare: Learning from the 12 Whole System Demonstrator Action Network (WSDAN) sites. WSD Action Network; 2011. http://www.kingsfund.org.uk/sites/files/kf/Perspectives-telehealth-telecare-wsdan-paper.pdf
14 Joseph V, West RM, Shickle D, Keen J, Clamp S: Key challenges in the development and implementation of telehealth projects. J Telemed Telecare 2011, 17(2):71-77.
15 Schulz KF, Altman DG, Moher D: CONSORT 2010 Statement: updated guidelines for reporting parallel group randomised trials. Trials 2010, 11:32.
16 Medical Research Council: Developing and Evaluating Complex Interventions: New Guidance. 2008. http://www.mrc.ac.uk/complexinterventionsguidance
17 Fitzsimmons DA, Thompson J, Hawley M, Mountain GA: Preventative tele-health supported services for early stage Chronic Obstructive Pulmonary Disease: a pragmatic randomized controlled trial pilot. Trials 2011, 12:6.
18 Wittes J, Brittain E: The role of internal pilot studies in increasing the efficiency of clinical trials. Stat Med 1990, 9:65-72.
19 Baker R, Robertson N, Rogers S, Davies M, Brunskill N, Khunti K, Steiner M, Williams M, Sinfield P: The National Institute of Health Research (NIHR) Collaboration for Leadership in Applied Health Research and Care (CLAHRC) for Leicestershire, Northamptonshire and Rutland (LNR): a programme protocol. Implement Sci 2009, 4:72.
20 Jones P, Quirk FH, Baveystock CM: The St. George’s Respiratory Questionnaire. Respir Med 1991, 85(Suppl B):2531.
21 Brooks R: EuroQol: the current state of play. Health Policy 1996, 37(1):53-72.
22 Department of Health: NHS Trusts and PCTs Combined Reference Cost Schedules. 2010–2011. http://data.gov.uk/dataset/nhs-reference-costs-2010-11/resource/91f6f5fd-c185-4bf0-8e56-718a4d769b24
23 Starkie HJ, Briggs AH, Chambers MG, Jones P: Predicting EQ-5D values using the SGRQ. Value Health 2011, 14(2):354-360.
24 Hotopf M: The pragmatic randomised controlled trial. Adv Psychiatr Treat 2002, 8(5):326-333.
25 Hendy J, Chrysanthaki T, Barlow J, Knapp M, Rogers A,
Sanders C, Bower P, Bowen R, Fitzpatrick R, Bardsley M, Newman S: An organisational analysis of the implementation of telecare and telehealth: the whole systems demonstrator. BMC Health Serv Res 2012, 12(1):403.
26 Bird L, Arthur A, Cox K: “Did the trial kill the intervention?” experiences from the development, implementation and evaluation of a complex intervention. BMC Med Res Methodol 2011, 11(1):24.
27 Leykum LK, Pugh JA, Lanham HJ, Harmon J, McDaniel RR: Implementation research design: integrating participatory action research into randomized controlled trials. Implement Sci 2009, 4:69.
40 Respiratory Therapy Vol. 10 No. 1 n Winter 2015 Respiratory Therapy Vol. 10 No. 1 n Winter 2015 41
AbstractBackground: We previously reported a progressive decline in absolute responses of FEV1 and FVC to a near-maximal dose of 2 different short-acting bronchodilators over 4 years. Since varying host factors and the method of expressing the response may impact the time trend of acute bronchodilator responses, we now examined the potential influence of salient host characteristics on changes in bronchodilator responses over time expressed in different ways.
Methods: As part of the 4-year, placebo-controlled Understanding Potential Long-term Impacts on Function with Tiotropium (UPLIFT) trial, pre- and post-bronchodilator spirometry was performed at baseline and 1 month and every 6 months thereafter. Post-bronchodilator values for FEV1 and FVC were analyzed for subjects completing at least the 1 year visit (Placebo – N = 2463; Tiotropium – N = 2579), stratified by GOLD stage, age, gender and smoking status and expressed as absolute, relative (%) and % predicted changes from pre-bronchodilator values. Annual changes in bronchodilator response were estimated using linear mixed effects models.
Results: For all subjects analyzed, FEV1 and FVC bronchodilator responses showed progressive and highly significant (p < 0.0001) declines over 4 years. Declines were generally larger in patients with severe/very severe than mild/moderate airflow obstruction, in older patients (≥65 yrs) and in former than continuing smokers.
Conclusion: Acute FEV1 and FVC responses to bronchodilators decline significantly over time in COPD patients, whether expressed as absolute, relative or % predicted changes, potentially impacting on the clinical responses to bronchodilator therapy as well as on the annual rate of decline in post-bronchodilator lung function.
IntroductionBronchodilator responsiveness is a well-described feature of both asthma and COPD. While the response to a bronchodilator in COPD is never complete, nonetheless it often fulfills the currently accepted criteria for a significant response,1-3 although the degree of response (and the attainment of a significant response) is highly variable between testing sessions.4,5 Since COPD is usually a progressive disease characterized by a variably accelerated annual rate of decline in lung function, as determined from measurements of both pre- and post-bronchodilator forced expired volume in 1 sec (FEV1),6 it is possible that the response to a bronchodilator might also change over an extended period of time; however, few studies have examined the long-term course of responses to a bronchodilator in COPD with varying results.7-9
We recently compared the annual rates of change in the pre- versus post-bronchodilator FEV1 and FVC over 4 years in 5041 COPD UPLIFT trial participants10 and observed that, on average, the absolute FEV1 and forced vital capacity (FVC) responses to a bronchodilator decreased progressively and significantly over the 4-year course of the trial, in contrast to findings from previous studies of 1-11 years duration in which either no change, small average changes of varying significance or substantial increases in responses were observed.7-9 These differences could be due to several factors, including differences in the study populations, especially regarding the severity of airflow obstruction, as well as differences in the methods used to measure the bronchodilator response. Such methods included a standard therapeutic dose of a beta-agonist followed only 10 minutes later by repeat spirometry in the IPPB trial7 and the Lung Health Study8 and 400 mcg salbutamol with repeat spirometry after only 15 minutes in the Evaluation of COPD Longitudinally to Identify Predictive Surrograte Endpoints (ECLIPSE) study,9 compared to double doses of both a beta-agonist and a muscarinic antagonist and performance of the post-bronchodilator spirometry at the expected time of peak or near-peak action of each of the two classes of bronchodilators in the UPLIFT trial.11 It is not unlikely, therefore, that the responses to a bronchodilator were sub-maximal in the earlier trials and near-maximal in the UPLIFT study.
Because of these differences in methodology for measuring the response to a bronchodilator and the possibility that varying host factors (including gender, age, severity of airflow obstruction, smoking status and use of inhaled corticosteroids) may impact the bronchodilator response over time, we extended our analysis
Acute Bronchodilator Responses Decline Progressively Over 4 Years In Patients With Moderate To Very Severe COPDDonald P Tashkin, Ning Li, Eric C Kleerup, David Halpin, Bartolome Celli, Marc Decramer and Robert Elashoff
The authors are with the Department of Medicine, David Geffen School of Medicine at UCLA, Royal Devon and Exeter Hospital, Brigham and Women’s Hospital, University of Leuven, Department of Biomathematics, David Geffen School of Medicine at UCLA. This is an Open Access article distributed under the terms of the Creative Commons Attribution License which permits unrestricted use, distribution, and reproduction in any medium, provided the original work is properly credited. The Creative Commons Public Domain Dedication waiver applies to the data made available in this article, unless otherwise stated.
of the time trend of bronchodilator responses (for both FEV1 and FVC) over the 4 years of the UPLIFT trial to examine the potential influence of these host factors on the changes over time in bronchodilator responses expressed in three different ways: absolute change in ml, percent change from baseline and change in percent predicted.
MethodsWe performed a post-hoc analysis of data from the UPLIFT trial in which 5993 patients with moderate to very severe COPD (mean age 65±8 yrs; mean post-bronchodilator FEV1 1.32±0.44 L, 48% predicted) were randomized to receive tiotropium 18 mcg Handihaler once daily vs. placebo over a 4-year period. Detailed methods and the main results of UPLIFT have been published previously.11,12 Briefly, as part of this trial, pre- and post-bronchodilator spirometry was performed in accordance with American Thoracic Society guidelines13 at baseline and 1 month and every 6 months following randomization over 4 years. Identical spirometric equipment and study-specific software were used at each site with central quality-assurance review of all spirometry data throughout the trial.12,14 At each visit, immediately following the pre-bronchodilator spirometry, patients received study drug (either tiotropium or placebo) followed by 4 inhalations of ipratropium, 18 μg/inhalation, followed 1 hour later by 4 inhalations of albuterol, 100 μg/inhalation, followed 30 min later by spirometry again. At each spirometry visit beginning at the baseline visit, study drug was also administered immediately following the pre-bronchodilator measurement. Prior to each spirometry visit, patients were instructed to withhold their respiratory medications for an appropriate period. Visits were postponed if patients experienced an exacerbation within the preceding 6 weeks. The original UPLIFT trial protocol had been approved by the ethics committee at each center, and all patients had provided written informed consent. UPLIFT was a global trial involving 37 countries and 490 investigational centers. The trial was approved by the designated institutional review board at each of the participating centers.
Analytic methodsAcute bronchodilator responses for both FEV1 and FVC were expressed as absolute (ml), relative (%) and % predicted changes from the pre-bronchodilator values. Since we noted a substantial decline in the absolute response in the tiotropium group between the baseline and 1-month assessment, responses were analyzed beginning at the 1-month assessment for patients who completed at least the 1-year post-randomization visit (N = 2463 placebo and 2579 tiotropium patients) over the 4 years of the trial. Since tiotropium resulted in a sustained increase in the pre-bronchodilator FEV1 (which could have impacted on the response to the two short-acting bronchodilators) and was administered along with the latter to assess the acute bronchodilator response in patients in the tiotropium arm of the trial, data from the placebo and tiotropium treatment groups were analyzed separately. Responses were also stratified by GOLD grading for airflow obstruction (grades I/II, III and IV), age (≤65 yrs, >65 yrs; median age was 65 yrs), gender. smoking status (continuing smokers, sustained former smokers, intermittent smokers) and use of inhaled corticosteroids (ICS) at baseline. Longitudinal analysis was conducted to estimate the annual changes in bronchodilator response over the period from the 1-month assessment to the end of the four-year follow-up. In particular, the analysis was performed using linear mixed effects models which included the subject-specific trajectories
and data clustering due to repeated measures within patients. A linear time trend was assumed to describe the trajectory of bronchodilator response over the 4 year study period. The linearity assumption was tested by including a quadratic time effect, but it was not significant in the models. As an output of the model, the annual change was expressed as the estimated fixed effect of time (in years) and the standard error of this regression coefficient. Since this quantity was estimated based on a statistical model, not raw data, its estimated variability could only be expressed as standard error, not standard deviation.
Because of the possibility that changes in bronchodilator response over time within individual patients might influence the change in their health-related quality of life, we also examined, at the patient level, the relationship between decline in bronchodilator response and change in the St. George’s
previous studies of 1-11 years duration in which eitherno change, small average changes of varying significanceor substantial increases in responses were observed[7-9]. These differences could be due to several factors,including differences in the study populations, especiallyregarding the severity of airflow obstruction, as well asdifferences in the methods used to measure the bron-chodilator response. Such methods included a standardtherapeutic dose of a beta-agonist followed only 10 mi-nutes later by repeat spirometry in the IPPB trial [7] andthe Lung Health Study [8] and 400 mcg salbutamol withrepeat spirometry after only 15 minutes in the Evaluationof COPD Longitudinally to Identify Predictive SurrograteEndpoints (ECLIPSE) study [9], compared to double dosesof both a beta-agonist and a muscarinic antagonist and per-formance of the post-bronchodilator spirometry at the ex-pected time of peak or near-peak action of each of the twoclasses of bronchodilators in the UPLIFT trial [11]. It is notunlikely, therefore, that the responses to a bronchodilatorwere sub-maximal in the earlier trials and near-maximal inthe UPLIFT study.Because of these differences in methodology for meas-
uring the response to a bronchodilator and the possibil-ity that varying host factors (including gender, age,severity of airflow obstruction, smoking status and useof inhaled corticosteroids) may impact the bronchodila-tor response over time, we extended our analysis of thetime trend of bronchodilator responses (for both FEV1and FVC) over the 4 years of the UPLIFT trial to exam-ine the potential influence of these host factors on thechanges over time in bronchodilator responses expressedin three different ways: absolute change in ml, percentchange from baseline and change in percent predicted.
MethodsWe performed a post-hoc analysis of data from the UPLIFTtrial in which 5993 patients with moderate to very severeCOPD (mean age 65±8 yrs; mean post-bronchodilatorFEV1 1.32±0.44 L, 48% predicted) were randomized to re-ceive tiotropium 18 mcg Handihaler once daily vs. placeboover a 4-year period. Detailed methods and the main resultsof UPLIFT have been published previously [11,12]. Briefly,as part of this trial, pre- and post-bronchodilator spirometrywas performed in accordance with American Thoracic So-ciety guidelines [13] at baseline and 1 month and every6 months following randomization over 4 years. Identicalspirometric equipment and study-specific software wereused at each site with central quality-assurance review of allspirometry data throughout the trial [12,14]. At each visit,immediately following the pre-bronchodilator spirometry,patients received study drug (either tiotropium or placebo)followed by 4 inhalations of ipratropium, 18 μg/inhalation,followed 1 hour later by 4 inhalations of albuterol, 100 μg/inhalation, followed 30 min later by spirometry again. At
each spirometry visit beginning at the baseline visit, studydrug was also administered immediately following the pre-bronchodilator measurement. Prior to each spirometryvisit, patients were instructed to withhold their respiratorymedications for an appropriate period (Additional file 1).Visits were postponed if patients experienced an exacerba-tion within the preceding 6 weeks. The original UPLIFTtrial protocol had been approved by the ethics committeeat each center, and all patients had provided written in-formed consent. UPLIFT was a global trial involving 37countries and 490 investigational centers. The trial was
Table 1 Baseline characteristics of subjects in the placeboand tiotropium arms of the UPLIFT trial included in theanalysis of time trends in bronchodilator responses overthe course of the trial
Characteristic Placebo(N = 2463)
Tiotropium(N = 2579)
Age, yrs, mean (SD) 64.2 (8.39) 64.3 (8.39)
>65 yrs, N (%) 1158 (47.0%) 1223 (47.4%)
≤65 yrs, N (%) 1305 (53.0%) 1356 (52.6%)
Gender, male, N (%) 1852 (75.2%) 1965 (76.2%)
Pre-bronchodilator FEV1, L, mean (SD) 1.12 (0.40) 1.11 (0.40)
Pre-bronchodilator FEV1, % predicted,mean (SD)
39.9 (11. 8) 39.8 (11.9)
Post-bronchodilator FEV1, L, mean (SD) 1.35 (0.44) 1.34 (0.43)
Post-bronchodilator FEV1, % predicted,mean (SD)
48.2 (12.4) 48.1 (12.5)
Pre-bronchodilator FVC, L, mean (SD) 2.66 (0.83) 2.64 (0.80)
Pre-bronchodilator FVC, % predicted,mean (SD)
75.4 (18.0) 74.8 (17.9)
Post-bronchodilator FVC, L, mean (SD) 3.13 (0.90) 3.11 (0.86)
Post-bronchodilator FVC, % predicted,mean (SD)
88.7 (18.7) 88.2 (18.5)
Pre-bronchodilator FEV1/FVC ratio, %,mean (SD)
42.5 (10.3) 42.7 (10.4)
Post-bronchodilator FEV1/FVC ratio, %,mean (SD)
43.8 (10.5) 43.9 (10.7)
Smoking status
Sustained ex-smoker, N (%) 1471 (59.7%) 1502 (58.2%)
Intermittent smoker, N (%) 679 (27.6%) 761 (29.5%)
Continuing smoker, N (%) 313 (12.7%) 316 (12.3%)
Pack-yrs smoking, mean (SD) 48.0 (27.9) 49.0 (28.0)
GOLD grade of airflow obstruction
Grade I/II, N (%) 1179 (48.6%) 1226 (48.3%)
Grade III, N (%) 1059 (43.6%) 1118 (44.0%)
Grade IV, N (%) 189 (7.79%) 197 (7.75%)
Use of Inhaled Corticosteroids at baseline
Yes 1506 (61.1%) 1581 (61.3%)
No 957 (38.9%) 998 (38.7%)
SGRQ total scores, mean (SD) 45.2 (17.2) 45.0 (17.0)
Tashkin et al. Respiratory Research 2014, 15:102 Page 2 of 10http://respiratory-research.com/content/15/1/102

42 Respiratory Therapy Vol. 10 No. 1 n Winter 2015 Respiratory Therapy Vol. 10 No. 1 n Winter 2015 43
Respiratory Questionnaire (SGRQ) total score over the course of the study in the placebo group using a linear regression model. The outcome was change in SGRQ total score at the end of the study as compared to the baseline and the primary predictor was the patient level change in bronchodilator response per year estimated from the linear mixed effects model, adjusting for baseline % predicted FEV1 and frequency of exacerbations in the first year (> = 2 versus < 2).
Within-patient variability was expressed as the square-root of the variance for the regression residuals estimated from the linear mixed effects models, and between- patient variability in annual changes was expressed as the square-root of the variance of the slopes. Proportions of patients with a significant positive response according to ATS/ERS criteria,1 namely an increase of FEV1 and/or FVC of 12% and 200 ml above baseline, were determined at each visit and the odds ratios for annual changes in these proportions were estimated using generalized estimating equations.
ResultsBaseline clinical characteristics of the subjects included in the analysis are shown in Table 1 for the placebo and tiotropium groups separately. These are similar to those in the entire UPLIFT population, as previously reported.11 Mean absolute FEV1 and FVC responses to the bronchodilators (in ml ± SD) are shown for all patients, in the placebo and tiotropium groups separately, at each time point over the 4 years of the study in Figure 1. Progressive declines in both FEV1 and FVC responses are observed beginning 1 to 1½ years after the start of the study in both treatment groups.
Table 2 shows the estimated average change per year over 4
years in the absolute bronchodilator response (Δ, in ml) (±SE) for FEV1 and FVC in the placebo arm both for all subjects and by GOLD grading for airflow obstruction, age, gender, smoking status and baseline ICS use. The estimated changes per year in FEV1 and FVC responses were significant for all subgroups, except for changes in FVC responses among the continuing smokers. The annual changes in the absolute FEV1 response were larger for sustained ex-smokers than continuing smokers (p = 0.0264) and for those receiving ICS at baseline (p = 0.0081) but did not differ significantly by GOLD grade of airflow obstruction, age or gender. The changes per year in FVC responses were significantly larger in GOLD III and IV compared to GOLD I/II (p = 0.0059 and 0.0006, respectively), in subjects >65 vs ≤ 65 yrs of age (0.0022), in sustained ex-smokers than continuing smokers (p = 0.0088), and in those receiving versus not receiving ICS at baseline (p < 0.0001). Similar data are shown in Additional file 2 for the tiotropium treatment group. For all subjects analyzed, results were comparable to those in the placebo group, although differences were noted in some of the subgroups.
The time trends of relative bronchodilator responses expressed as percent changes in FEV1 and FVC from the pre-bronchodilator values are shown for all subjects in each treatment group in Figure 2. Similar to the findings for absolute changes, the percent changes in both FEV1 and FVC declined progressively over 4 years, beginning at 1 to 1.5 years after trial initiation for all subjects in both treatment groups. Estimated average changes per year in relative bronchodilator responses for FEV1 and FVC (% ± SE) in all subjects and by GOLD stage, age, gender, smoking status and baseline ICS use are shown in Table 3 for the placebo group and Additional file 3 for tiotropium subjects. In placebo subjects, declines in both FEV1 and FVC
approved by the designated institutional review board ateach of the participating centers.
Analytic methodsAcute bronchodilator responses for both FEV1 and FVCwere expressed as absolute (ml), relative (%) and % pre-dicted changes from the pre-bronchodilator values.Since we noted a substantial decline in the absolute re-sponse in the tiotropium group between the baselineand 1-month assessment, responses were analyzed be-ginning at the 1-month assessment for patients whocompleted at least the 1-year post-randomization visit(N = 2463 placebo and 2579 tiotropium patients) overthe 4 years of the trial. Since tiotropium resulted in asustained increase in the pre-bronchodilator FEV1(which could have impacted on the response to the twoshort-acting bronchodilators) and was administeredalong with the latter to assess the acute bronchodilatorresponse in patients in the tiotropium arm of the trial,data from the placebo and tiotropium treatment groupswere analyzed separately. Responses were also stratifiedby GOLD grading for airflow obstruction (grades I/II, IIIand IV), age (≤65 yrs, >65 yrs; median age was 65 yrs),gender. smoking status (continuing smokers, sustained
former smokers, intermittent smokers) and use of in-haled corticosteroids (ICS) at baseline. Longitudinal ana-lysis was conducted to estimate the annual changes inbronchodilator response over the period from the 1-month assessment to the end of the four-year follow-up.In particular, the analysis was performed using linearmixed effects models which included the subject-specifictrajectories and data clustering due to repeated measureswithin patients. A linear time trend was assumed to de-scribe the trajectory of bronchodilator response over the4 year study period. The linearity assumption was testedby including a quadratic time effect, but it was not sig-nificant in the models. As an output of the model, theannual change was expressed as the estimated fixed ef-fect of time (in years) and the standard error of this re-gression coefficient. Since this quantity was estimatedbased on a statistical model, not raw data, its estimatedvariability could only be expressed as standard error, notstandard deviation.Because of the possibility that changes in bronchodila-
tor response over time within individual patients mightinfluence the change in their health-related quality oflife, we also examined, at the patient level, the relation-ship between decline in bronchodilator response and
Figure 1 Mean absolute bronchodilator responses (±SD) (Δ = post- minus pre-bronchodilator FEV1 and FVC, ml) over 4 years bytreatment group separately (placebo and tiotropium). Mean absolute FEV1 responses are shown for the placebo group (A) and thetiotropium group (B) separately. Mean absolute FVC responses are shown for the placebo group (C) and the tiotropium group (D) separately.
Tashkin et al. Respiratory Research 2014, 15:102 Page 3 of 10http://respiratory-research.com/content/15/1/102
responses were significantly greater in GOLD IV vs. both GOLD I/II and GOLD III, in sustained ex-smokers than continuing smokers and in those using ICS at baseline but did not differ by age or gender, except for significantly greater declines in FVC responses in older subjects. Similar findings were noted in tiotropium subjects.
FEV1 and FVC responses to the bronchodilators expressed as % predicted values over 4 years are shown for all patients in each treatment group at each time point in Figure 3. As with the other methods of expressing the bronchodilator response, a progressive decline in % predicted responses for both FEV1 and FVC over 4 years was observed in both treatment groups. Estimated average changes per year in % predicted responses for FEV1 and FVC for all subjects and by subgroups are shown in Table 4 for placebo subjects and Additional file 4 for tiotropium subjects. For all subjects in both treatment groups annual declines were modest but highly significant (p < 0.0001). In placebo subjects, declines in percent predicted FVC responses were significantly larger in GOLD IV and GOLD III than GOLD I/II subjects (p = 0.0013 and 0.0023, respectively) and in older than younger patients (p = 0.0040), declines in % predicted FEV1 responses were significantly larger in women than men (p < 0.05) and declines in both FEV1 and FVC % predicted responses were
significantly greater in sustained ex-smokers than continuing smokers (p = 0.0267 and 0.0038, respectively), and in those on ICS at baseline (p = 0.0045 and p < 0.0001, respectively). Somewhat comparable findings were noted in the tiotropium group.
A progressive decline was also observed in the proportion of subjects in each treatment arm who fulfilled ATS/ERS criteria for a significant bronchodilator response, averaging 6-9% reduction in the proportion of subjects likely to exhibit a significant bronchodilator response per year (Table 5).
Findings from the analysis of the relationship between individual declines in bronchodilator response and individual changes in health-related quality of life (assessed as total SGRQ score) over the course of the study in the placebo group indicated a modest but statistically significant inverse relationship between decline in FEV1 (but not FVC) response and change in SGRQ score, after adjustment for both baseline FEV1 % predicted and exacerbation frequency (≥2 versus <2) in the first year. For for
change in the St. George’s Respiratory Questionnaire(SGRQ) total score over the course of the study in theplacebo group using a linear regression model. Theoutcome was change in SGRQ total score at the end ofthe study as compared to the baseline and the primarypredictor was the patient level change in bronchodila-tor response per year estimated from the linear mixedeffects model, adjusting for baseline % predicted FEV1and frequency of exacerbations in the first year (> = 2versus < 2).Within-patient variability was expressed as the
square-root of the variance for the regression residualsestimated from the linear mixed effects models, andbetween- patient variability in annual changes wasexpressed as the square-root of the variance of theslopes. Proportions of patients with a significant posi-tive response according to ATS/ERS criteria [1],namely an increase of FEV1 and/or FVC of 12% and200 ml above baseline, were determined at each visitand the odds ratios for annual changes in these proportionswere estimated using generalized estimating equations.
ResultsBaseline clinical characteristics of the subjects includedin the analysis are shown in Table 1 for the placebo andtiotropium groups separately. These are similar to thosein the entire UPLIFT population, as previously reported[11]. Mean absolute FEV1 and FVC responses to thebronchodilators (in ml ± SD) are shown for all patients,in the placebo and tiotropium groups separately, at eachtime point over the 4 years of the study in Figure 1. Pro-gressive declines in both FEV1 and FVC responses areobserved beginning 1 to 1½ years after the start of thestudy in both treatment groups.Table 2 shows the estimated average change per year
over 4 years in the absolute bronchodilator response (Δ,in ml) (±SE) for FEV1 and FVC in the placebo arm bothfor all subjects and by GOLD grading for airflow ob-struction, age, gender, smoking status and baseline ICSuse. The estimated changes per year in FEV1 and FVCresponses were significant for all subgroups, exceptfor changes in FVC responses among the continuingsmokers. The annual changes in the absolute FEV1 re-sponse were larger for sustained ex-smokers than con-tinuing smokers (p = 0.0264) and for those receiving ICSat baseline (p = 0.0081) but did not differ significantly byGOLD grade of airflow obstruction, age or gender. Thechanges per year in FVC responses were significantlylarger in GOLD III and IV compared to GOLD I/II(p = 0.0059 and 0.0006, respectively), in subjects >65vs ≤ 65 yrs of age (0.0022), in sustained ex-smokers thancontinuing smokers (p = 0.0088), and in those receivingversus not receiving ICS at baseline (p < 0.0001). Similardata are shown in Additional file 2 for the tiotropium
treatment group. For all subjects analyzed, results werecomparable to those in the placebo group, although dif-ferences were noted in some of the subgroups.The time trends of relative bronchodilator responses
expressed as percent changes in FEV1 and FVC fromthe pre-bronchodilator values are shown for all subjectsin each treatment group in Figure 2. Similar to the find-ings for absolute changes, the percent changes in bothFEV1 and FVC declined progressively over 4 years,beginning at 1 to 1.5 years after trial initiation for allsubjects in both treatment groups. Estimated averagechanges per year in relative bronchodilator responses forFEV1 and FVC (% ± SE) in all subjects and by GOLDstage, age, gender, smoking status and baseline ICS use areshown in Table 3 for the placebo group and Additionalfile 3 for tiotropium subjects. In placebo subjects, declinesin both FEV1 and FVC responses were significantly greater
Table 2 Estimated average change per year over 4 yearsin absolute bronchodilator response (Δ, in ml) (±SE) forFEV1 and FVC in the placebo arm of the UPLIFT trial byGOLD grading for airflow obstruction (I&II, III, IV), age(≤50 yrs, >50 yrs), gender, and smoking status (sustainedex-smoker, intermittent smoker, continuing smoker)
Group FEV1 FVC
Estimatedchange in Δ(SE) per yr
p value Estimatedchange in Δ(SE) per yr
p value
All -10.9 (0.76) <0.0001 -20.6 (1.87) <0.0001
GOLD Stage
I & II -11.1 (1.10) <0.0001 -14.4 (2.42)1 <0.0001
III -11.2 (1.10) <0.0001 -25.2 (3.08) <0.0001
IV -13.1 (2.35) <0.0001 -40.6 (8.21) <0.0001
Age, yrs
≤65 yrs -11.6 (1.05) <0.0001 -15.5 (2.64)2 <0.001
>65 yrs -10.1 (1.09) <0.0001 -2.66 (2.60) <0.0001
Gender
Male -10.7 (0.92) <0.0001 -21.4 (2.27) <0.0001
Female -11.5 (1.21) <0.0001 -18.4 (2.98) <0.0001
Smoking status
Sustained ex-smoker -11.9 (0.93) 3 <0.0001 -24.6 (2.37)3 <0.0001
Intermittent smoker -10.5 (1.48) <0.0001 -17.3 (3.57) <0.0001
Continuing smoker -6.77 (2.42) 0.0053 -9.17 (5.70) 0.11
Inhaled steroids(baseline)
No -8.41 (1.24)4 <0.0001 -11.3 (3.01)4 0.0002
Yes -12.5 (0.95) <0.0001 -26.6 (2.38) <0.00011Significantly different from GOLD III (p = 0.0059) and GOLD IV (p = 0.0006).2Significantly different from age >65 yrs (pp = 0.0022).3Signficiantly different from continuing smokers (p = 0.0264 for FEV1 andp = 0.0088 for FVC).4Significantly different from those with baseline inhaled steroids (p = 0.0081for FEV1 and p < 0.0001 for FVC)).
Tashkin et al. Respiratory Research 2014, 15:102 Page 4 of 10http://respiratory-research.com/content/15/1/102
Between- and within-subjects variability in the annualchange in absolute, relative and % predicted responsesover 4 years was quite large, as shown in Table 6 forFEV1 and FVC and each treatment arm separately. Nosignificant differences were observed between treatmentgroups. Variability in annual changes in FVC responsewas approximately twice as large as that in FEV1 re-sponses when expressed as absolute or % predictedchanges, but was similar when calculated as relativechanges.
DiscussionWe have shown that, in moderate to very severe COPD,mean responses to a near-maximal bronchodilator chal-lenge decline progressively over time to a statisticallysignificant, albeit modest and highly variable, extent, ir-respective of the method of calculating the responses(absolute, relative or % predicted pre-post bronchodila-tor change). These downward trends in bronchodilatorresponses were observed in nearly all subgroups definedby the initial severity of airflow obstruction, age, gender,smoking status over the course of the study and use ofICS at baseline. However, the magnitude of the declinein responses for FEV1 or FVC differed significantlywithin some of these subgroups; for example, declinesover time in absolute, relative and % predicted FEV1and/or FVC responses were larger in patients with se-vere and very severe vs. mild/moderate airflow, > vs. ≤65years of age, in sustained ex-smokers than continuingsmokers and in patients receiving versus not receivingICS at baseline (Tables 2, 3 and 4). The declines in re-sponses for FVC tended to be larger than those forFEV1 when these were assessed as absolute changes, butnot as relative or percent predicted changes. While somedifferences in the mean annual changes in FEV1 andFVC responses were noted between the placebo and tio-tropium arms of the trial, these differences were not sta-tistically significant irrespective of the method ofexpressing the bronchodilator response.Responses to a bronchodilator in COPD patients are
well known to vary over a relatively short time framesuch that a large proportion of patients who respond sig-nificantly to a bronchodilator challenge on one day failto do so on another day and vice versa over a relativelyshort time frame [4,5,15]. On the other hand, long-termtrends in bronchodilator responses over more than oneyear have infrequently been measured [7,8]. In the IPPBtrial, in which the average baseline pre-bronchodilatorFEV1 (36.1% predicted) was comparable to that in UP-LIFT (39.4% predicted), the mean change in the relativeFEV1 response per year over 3 years (-0.58/yr) was simi-lar to that which we observed in UPLIFT over 4 years(-0.68/yr) but, unlike the present findings, was not sig-nificantly different from zero [7]. On the other hand, thechange in % predicted FEV1 response over 3 years(-0.36/yr) was both similar to that noted in the UPLIFTpopulation over 4 years (-0.33/yr) and also significantlydifferent from zero. The long-term change in absoluteresponses in the IPPB trial was not reported.In contrast, in the 5-year LHS, in which the mean
baseline pre-bronchodilator FEV1 (75.4% predicted) wasmuch higher than that in either the IPPB trial or UP-LIFT, a substantial increase in responsiveness (assessedas relative, absolute and % predicted responses) wasnoted over the first year, with either a slight further
Table 3 Estimated average change per year over 4 yearsin relative bronchodilator response (percent changeΔ = post- minus pre-bronchodilator FEV1 and FVC/pre-bronchodilator value X 100) (±SE) in the placeboarm by GOLD grading for airflow obstruction (I&II, III,IV), age (≤50 yrs, >50 yrs), gender, and smokingstatus (sustained ex-smoker, intermittent smoker,continuing smoker)
Group FEV1 FVC
Estimatedchange inΔ (SE)per yr
p value Estimatedchange inΔ (SE)per yr
p value
All -0.68 (0.08) <0.0001 -0.66 (0.09) <0.0001
GOLD Stage
I & II -0.40 (0.11)1 0.0001 -0.28 (0.10)1 0.0085
III -0.86 (0.14)2 <0.0001 -0.89 (0.15)2 <0.0001
IV -2.08 (0.38) <0.0001 -2.11 (0.47) <0.0001
Age, yrs
≤65 yrs -0.61 (0.11) <0.0001 -0.34 (0.12)3 0.0058
>65 yrs -0.77 (0.12) <0.0001 -1.04 (0.13) <0.0001
Gender
Male -0.61 (0.10) <0.0001 -0.64 (0.10) <0.0001
Female -0.90 (0.17) <0.0001 -0.74 (0.19) <0.0001
Smoking status
Sustained ex-smoker -0.91 (0.11)4 <0.0001 -0.88 (0.11)3 <0.0001
Intermittent smoker -0.54 (0.16) 0.0007 -0.55 (0.17) 0.0014
Continuing smoker 0.12 (0.25) 0.64 0.14 (0.26) 0.59
Inhaled steroids(baseline)
No -0.30 (0.13)5 0.0273 -0.13 (0.14)5 0.35
Yes -0.93 (0.11) <0.0001 1.01 (0.12) <0.00011Significantly different from GOLD III (p = 0.0072 for FEV1 and p = 0.0008 forFVC) and GOLD IV (p < 0.0001 for FEV1 and p < 0.0001 for FVC).2Significantly different from GOLD IV (p = 0.0018 for FEV1 and p = 0.0058for FVC).3Significantly different from age >65 (p < 0.0001).4Signficiantly different from continuing smokers (p < 0.0001 for FEV1 andp = 0.0002 for FVC).5Significantly different from those with baseline inhaled steroids (p = 0.0002for FEV1 and p < 0.0001 for FVC).
Tashkin et al. Respiratory Research 2014, 15:102 Page 6 of 10http://respiratory-research.com/content/15/1/102

44 Respiratory Therapy Vol. 10 No. 1 n Winter 2015 Respiratory Therapy Vol. 10 No. 1 n Winter 2015 45
each 1 ml decline in FEV1 response there was an estimated 0.12 unit increase in total SGRQ score (or for each 10 ml decline in FEV1 response there was an estimated 1.2 unit increase in SGRQ score) (data not shown).
Between- and within-subjects variability in the annual change in absolute, relative and % predicted responses over 4 years was quite large, as shown in Table 6 for FEV1 and FVC and each treatment arm separately. No significant differences were observed between treatment groups. Variability in annual changes in FVC response was approximately twice as large as that in FEV1 responses when expressed as absolute or % predicted changes, but was similar when calculated as relative changes.
DiscussionWe have shown that, in moderate to very severe COPD, mean responses to a near-maximal bronchodilator challenge decline progressively over time to a statistically significant, albeit modest and highly variable, extent, irrespective of the method of calculating the responses (absolute, relative or % predicted pre-post bronchodilator change). These downward trends in bronchodilator responses were observed in nearly all subgroups defined by the initial severity of airflow obstruction, age, gender, smoking status over the course of the study and use of ICS at baseline. However, the magnitude of the decline in responses for FEV1 or FVC differed significantly within some of these subgroups; for example, declines over time in absolute, relative and % predicted FEV1 and/or FVC responses were larger in patients with severe and very severe vs. mild/moderate airflow, > vs. ≤65 years of age, in sustained ex-smokers than continuing smokers and in patients receiving versus not receiving ICS at baseline (Tables 2, 3 and 4). The declines in responses for
FVC tended to be larger than those for FEV1 when these were assessed as absolute changes, but not as relative or percent predicted changes. While some differences in the mean annual changes in FEV1 and FVC responses were noted between the placebo and tiotropium arms of the trial, these differences were not statistically significant irrespective of the method of expressing the bronchodilator response.
Responses to a bronchodilator in COPD patients are well known to vary over a relatively short time frame such that a large proportion of patients who respond significantly to a bronchodilator challenge on one day fail to do so on another day and vice versa over a relatively short time frame.4,5,15 On the other hand, long-term trends in bronchodilator responses over more than one year have infrequently been measured.7,8 In the IPPB trial, in which the average baseline pre-bronchodilator FEV1 (36.1% predicted) was comparable to that in UPLIFT (39.4% predicted), the mean change in the relative FEV1 response per year over 3 years (-0.58/yr) was similar to that which we observed in UPLIFT over 4 years (-0.68/yr) but, unlike the present findings, was not significantly different from zero.7 On the other hand, the change in % predicted FEV1 response over 3 years (-0.36/yr) was both similar to that noted in the UPLIFT population over 4 years (-0.33/yr) and also significantly different from zero. The long-term change in absolute responses in the IPPB trial was not reported.
In contrast, in the 5-year LHS, in which the mean baseline pre-bronchodilator FEV1 (75.4% predicted) was much higher than that in either the IPPB trial or UPLIFT, a substantial increase in responsiveness (assessed as relative, absolute and % predicted responses) was noted over the first year, with either a slight further increase or no change over the ensuing 4 years and
in GOLD IV vs. both GOLD I/II and GOLD III, in sus-tained ex-smokers than continuing smokers and inthose using ICS at baseline but did not differ by age orgender, except for significantly greater declines inFVC responses in older subjects. Similar findings werenoted in tiotropium subjects.FEV1 and FVC responses to the bronchodilators
expressed as % predicted values over 4 years are shownfor all patients in each treatment group at each timepoint in Figure 3. As with the other methods of express-ing the bronchodilator response, a progressive decline in% predicted responses for both FEV1 and FVC over4 years was observed in both treatment groups. Esti-mated average changes per year in % predicted responsesfor FEV1 and FVC for all subjects and by subgroups areshown in Table 4 for placebo subjects and Additional file4 for tiotropium subjects. For all subjects in both treat-ment groups annual declines were modest but highlysignificant (p < 0.0001). In placebo subjects, declines inpercent predicted FVC responses were significantly lar-ger in GOLD IV and GOLD III than GOLD I/II subjects(p = 0.0013 and 0.0023, respectively) and in older thanyounger patients (p = 0.0040), declines in % predictedFEV1 responses were significantly larger in women thanmen (p < 0.05) and declines in both FEV1 and FVC %
predicted responses were significantly greater in sus-tained ex-smokers than continuing smokers (p = 0.0267and 0.0038, respectively), and in those on ICS at baseline(p = 0.0045 and p < 0.0001, respectively). Somewhat com-parable findings were noted in the tiotropium group(Additional file 4).A progressive decline was also observed in the propor-
tion of subjects in each treatment arm who fulfilledATS/ERS criteria for a significant bronchodilator re-sponse, averaging 6-9% reduction in the proportion ofsubjects likely to exhibit a significant bronchodilator re-sponse per year (Table 5).Findings from the analysis of the relationship between in-
dividual declines in bronchodilator response and individualchanges in health-related quality of life (assessed as totalSGRQ score) over the course of the study in the placebogroup indicated a modest but statistically significant inverserelationship between decline in FEV1 (but not FVC) re-sponse and change in SGRQ score, after adjustment forboth baseline FEV1 % predicted and exacerbation fre-quency (≥2 versus <2) in the first year. For for each 1 mldecline in FEV1 response there was an estimated 0.12 unitincrease in total SGRQ score (or for each 10 ml decline inFEV1 response there was an estimated 1.2 unit increase inSGRQ score) (data not shown).
Figure 2 Mean percent changes (±SD) (Δ = post - minus pre-bronchodilator FEV1 and FVC, ml/pre-bronchodilator FEV1 and FVC, ml *100, %) over 4 years by treatment group. Mean relative FEV1 responses (percent changes) are shown for the placebo group (A) and the tiotropiumgroup (B) separately. Mean relative responses (percent changes) in FVC are shown for the placebo group (C) and the tiotropium group (D) separately.
Tashkin et al. Respiratory Research 2014, 15:102 Page 5 of 10http://respiratory-research.com/content/15/1/102
substantial increases from year 5 to year 11, except for the absence of any perceptible change only in absolute responses in sustained quitters over this time frame.8 The reason for these disparate findings in the LHS compared to both the IPPP study and UPLIFT is unclear but might possibly be related to the much milder degree of airflow obstruction in LHS participants compared to those in the other two studies. The observation that the decline in relative responses in UPLIFT was significantly greater in patients with severe/very severe than mild/moderate airflow obstruction seems consistent with this possible explanation; however, even the subgroup of UPLIFT subjects with mild/moderate obstruction showed highly significant declines in both FEV1 and FVC responses, irrespective of the method of expressing these responses.
In this analysis, as in previous reports,5,7-9 the response to a bronchodilator has been shown to be highly variable both between and within individuals. Moreover, because of this variability and because responsiveness has not been shown to be predictive of exacerbations or mortality in ECLIPSE9 or predict the long-term response to a bronchodilator over 1 year,16,17 bronchodilator responsiveness has been considered to be an unreliable phenotype.9 However, the progressive decline in bronchodilator responses over time demonstrated in UPLIFT, as well as in the IPPB trial, mirrors to some extent the usually progressive, but admittedly variable, decline in lung function characteristic of COPD, suggesting that these two phenomena might be inter-related. One can only speculate as to the mechanism of the observed declines in bronchodilator responses over time. One possible mechanism is a progressive increase in the thickness of the walls of the small airways with progressive increases in the severity of airflow obstruction, as reported by Hogg et al.18; the resulting decreases in airway wall
compliance could diminish the effect of bronchodilator-induced airway smooth muscle relaxation in increasing the patency of the lumen. It is also possible that the age-related loss of lung elastic recoil19 that is most likely amplified in patients with progressive emphysema could counteract drug-induced bronchodilation and reduction in air-trapping by increasing dynamic airway compression.
One clinical implication of the progressive decline in bronchodilator responses over multiple years is that this might result in a reduced effectiveness of bronchodilator therapy on clinical outcomes in COPD as the disease progresses over time, at least in some patients in view of the large inter-individual variability observed in the decline in responsiveness. The finding of a modest but statistically significant within-individual relationship between declines in acute bronchodilator responses on the one hand and worsening SGRQ scores on the other suggests that decrements in the response to a bronchodilator over time might be associated with poorer clinical outcomes, although this association does not necessarily imply causality. Moreover, the only modest changes in SGRQ score in association with declines in bronchodilator response (1.2 unit increase in SGRQ for each 10 ml decline in acute FEV1 response) argue against a clinically meaningful relationship. Another implication of our findings is that the decline in the acute bronchodilator response over time would lead to a partial convergence of the slopes of decline in lung function calculated from the pre- and post-bronchodilator FEV1 (and FVC), resulting in a steeper post- than pre-bronchodilator slope.10 Moreover, these potential consequences are likely to be relatively independent of the severity of airflow obstruction, age, gender and smoking status since significantly progressive declines in bronchodilator responses were seen in most of these subgroups. The possible
increase or no change over the ensuing 4 years and sub-stantial increases from year 5 to year 11, except for theabsence of any perceptible change only in absolute re-sponses in sustained quitters over this time frame [8].The reason for these disparate findings in the LHS com-pared to both the IPPP study and UPLIFT is unclear butmight possibly be related to the much milder degree ofairflow obstruction in LHS participants compared to thosein the other two studies. The observation that the declinein relative responses in UPLIFT was significantly greaterin patients with severe/very severe than mild/moderateairflow obstruction seems consistent with this possible ex-planation; however, even the subgroup of UPLIFT subjectswith mild/moderate obstruction showed highly significantdeclines in both FEV1 and FVC responses, irrespective ofthe method of expressing these responses.In this analysis, as in previous reports [5,7–9], the re-
sponse to a bronchodilator has been shown to be highlyvariable both between and within individuals. Moreover,because of this variability and because responsivenesshas not been shown to be predictive of exacerbations ormortality in ECLIPSE [9] or predict the long-term re-sponse to a bronchodilator over 1 year [16,17], broncho-dilator responsiveness has been considered to be an
unreliable phenotype [9]. However, the progressive de-cline in bronchodilator responses over time demon-strated in UPLIFT, as well as in the IPPB trial, mirrorsto some extent the usually progressive, but admittedlyvariable, decline in lung function characteristic ofCOPD, suggesting that these two phenomena might beinter-related. One can only speculate as to the mechanismof the observed declines in bronchodilator responses overtime. One possible mechanism is a progressive increase inthe thickness of the walls of the small airways with progres-sive increases in the severity of airflow obstruction, as re-ported by Hogg et al. [18]; the resulting decreases in airwaywall compliance could diminish the effect of bronchodilator-induced airway smooth muscle relaxation in increasing thepatency of the lumen. It is also possible that the age-relatedloss of lung elastic recoil [19] that is most likely amplified inpatients with progressive emphysema could counteract drug-induced bronchodilation and reduction in air-trapping byincreasing dynamic airway compression.One clinical implication of the progressive decline in
bronchodilator responses over multiple years is that thismight result in a reduced effectiveness of bronchodilatortherapy on clinical outcomes in COPD as the diseaseprogresses over time, at least in some patients in view of
Figure 3 Mean (±SD) % predicted (Δ = post-bronchodilator [% predicted] - minus pre-bronchodilator [% predicted] FEV1 and FVC)bronchodilator responses over 4 years by treatment group. Mean % predicted FEV1 responses are shown for the placebo group (A) and thetiotropium group (B) separately. Mean percent predicted responses in FVC are shown for the placebo group (C) and the tiotropium group (D)separately.
Tashkin et al. Respiratory Research 2014, 15:102 Page 7 of 10http://respiratory-research.com/content/15/1/102

46 Respiratory Therapy Vol. 10 No. 1 n Winter 2015 Respiratory Therapy Vol. 10 No. 1 n Winter 2015 47
impact on the slope of change in post- vs. pre-bronchodilator lung function over time needs to be taken into account in the design of long-term trials in which the annual decline in post-bronchodilator lung function is measured as a means of assessing the rate of progression of COPD.
The strengths of the present analysis include the large number of patients with varying degrees of severity of airflow obstruction who were followed over an extended period of time, the high quality and reproducibility of spirometry14 and the relatively large doses of the two different classes of short-acting bronchodilators that were administered along with the timing of post-bronchodilator spirometry to coincide with the time of expected peak action of each class of bronchodilator.
A major limitation is the large drop-out rate with only 27%, 35% and 40% of subjects completing visits at 2, 3 and 3¾ yrs, respectively. The current analysis uses all available data and the statistical inference from linear mixed effects models is valid under the missing at random assumption. Moreover, those who discontinued the trial prematurely were more likely to have fared poorly during the trial, suggesting that their bronchodilator responses, had they been measured subsequent to their
withdrawal, might tend to be even less robust than the responses at later time points in those subjects who completed the trial.
In conclusion, acute responses of both FEV1 and FVC to near maximal doses of two different bronchodilators, while considerably variable both between and within individuals, on average diminish progressively and significantly over time, consistent with the usually progressive decline in lung function with age in patients with COPD. These declines were independent of the method of expressing the bronchodilator response and tended to be larger in patients with severe/very severe compared to those with mild/moderate airflow obstruction, in patients >65 years of age and in former than continuing smokers and in those not on ICS at baseline. These declines in the response to a bronchodilator imply a possible diminution in the clinical efficacy of bronchodilator therapy over time and may account for differences in the slopes of lung function decline with age when calculated using the post- compared to the pre-bronchodilator value.
References1 Pellegrino R, Viegi G, Brusasco V, Crapo RO, Burgos F,
Casaburi R, Coates A, van der Grinten CPM, Gustafsson P, Hankinson J, Jensen R, Johnson DC, MacIntyre N, McKay R, Miller MR, Navajas D, Pedersen OF, Wanger J: Interpretative strategies for lung function tests. Eur Respir J 2005, 26:948-968.
2 Tashkin DP, Celli B, Decramer M, Liu D, Burkhart D, Cassino C, Kesten S: Bronchodilator responsiveness in patients with
the large inter-individual variability observed in the de-cline in responsiveness. The finding of a modest butstatistically significant within-individual relationshipbetween declines in acute bronchodilator responses onthe one hand and worsening SGRQ scores on the othersuggests that decrements in the response to a broncho-dilator over time might be associated with poorerclinical outcomes, although this association does notnecessarily imply causality. Moreover, the only modestchanges in SGRQ score in association with declines inbronchodilator response (1.2 unit increase in SGRQfor each 10 ml decline in acute FEV1 response) argueagainst a clinically meaningful relationship. Anotherimplication of our findings is that the decline in theacute bronchodilator response over time would lead to
a partial convergence of the slopes of decline in lung func-tion calculated from the pre- and post-bronchodilatorFEV1 (and FVC), resulting in a steeper post- than pre-bronchodilator slope [10]. Moreover, these potentialconsequences are likely to be relatively independent ofthe severity of airflow obstruction, age, gender andsmoking status since significantly progressive declinesin bronchodilator responses were seen in most of thesesubgroups. The possible impact on the slope of changein post- vs. pre-bronchodilator lung function over timeneeds to be taken into account in the design of long-term trials in which the annual decline in post-bronchodilator lung function is measured as a meansof assessing the rate of progression of COPD.The strengths of the present analysis include the
large number of patients with varying degrees of sever-ity of airflow obstruction who were followed over anextended period of time, the high quality and reprodu-cibility of spirometry [14] and the relatively large dosesof the two different classes of short-acting bronchodi-lators that were administered along with the timing of
Table 4 Estimated average change per year over 4 years in% predicted bronchodilator response (Δ = % predictedpost-bronchodilator minus % predicted pre-bronchodilatorFEV1 or FVC) (±SE) in the placebo arm by GOLD gradingfor airflow obstruction (I&II, III, IV), age (≤50 yrs, >50 yrs),gender, and smoking status (sustained ex-smoker,intermittent smoker, continuing smoker)
Group FEV1 FVC
Estimatedchange in Δ(SE) per yr
p value Estimatedchange in Δ(SE) per yr
p value
All -0.33 (0.03) <0.0001 -0.53 (0.05) <0.0001
GOLD Stage
I & II -0.33 (0.04) <0.0001 -0.35 (0.07)1 <0.0001
III -0.35 (0.04) <0.0001 -0.68 (0.09) <0.0001
IV -0.41 (0.08) <0.0001 -1.05 (0.24) <0.0001
Age, yrs
≤65 yrs -0.33 (0.04) <0.0001 -0.39 (0.07)2 <0.0001
>65 yrs -0.32 (0.04) <0.0001 -0.69 (0.08) <0.0001
Gender
Male -0.30 (0.03)3 <0.0001 -0.51 (0.06) <0.0001
Female -0.43 (0.06) <0.0001 -0.61 (0.11) <0.0001
Smoking status
Sustained ex-smoker -0.37 (0.03)4 <0.0001 -0.65 (0.07)3 <0.0001
Intermittent smoker -0.31 (0.05) <0.0001 -0.46 (0.10) <0.0001
Continuing smoker -0.18 (0.08) 0.0322 -0.16 (0.15) 0.29
Inhaled steroids(baseline)
No -0.23 (0.04)5 0.0273 -0.27 (0.09)6 0.0024
Yes -0.39 (0.03) <0.0001 -0.70 ((0.07) <0.00011Significantly different from GOLD III (p = 0.0023) and GOLD IV (p = 0.0013).2Significantly different from no baseline inhaled steroids (p = 0.0040).3Significantly different from women (p = 0.0428).4Signficiantly different from continuing smokers (FEV1 p = 0.0267;FVC p = 0.0038).5Significantly different from no baseline inhaled steroids (p = 0.0045).6Significantly different from no baseline inhaled steroids (p < 0.0001).
Table 5 Between- and within-subjects variability in theannual change in bronchodilator response expressed asabsolute, relative and percent predicted changes1
Response measuredby absolute changein FEV (ml)
Response measuredby absolute changein FVC (ml)
Tiotropium Placebo Tiotropium Placebo
Between-subjectvariability in annualchange (square-rootof variance)
15.2 15.3 30.2 44.5
Within-subject variability(square-root of variance)
109.2 107.9 244.7 252.0
Response measuredby % change inFEV (ml)
Response measuredby % change inFVC (ml)
Tiotropium Placebo Tiotropium Placebo
Between-subjectvariability in annualchange (square-rootof variance)
1.44 1.65 1.43 1.98
Within-subject variability(square-root of variance)
11.3 12.0 11.0 12.4
Response measuredby absolute changein FEV (% predicted)
Response measuredby absolute changein FVC (% predicted)
Tiotropium Placebo Tiotropium Placebo
Between-subjectvariability in annualchange (square-rootof variance)
0.55 0.54 0.89 1.26
Within-subject variability(square-root of variance)
3.93 3.88 7.04 7.23
1The variations were estimated from the linear mixed effects models.
Tashkin et al. Respiratory Research 2014, 15:102 Page 8 of 10http://respiratory-research.com/content/15/1/102
COPD. Eur Respir J 2008, 31:742-750. 3 Donohue JF: Therapeutic responses in asthma and COPD.
Bronchodilators. Chest 2004, 126(2 Suppl):125S-137S. 4 Dorinsky PM, Reisner C, Ferguson GT, Menjoge SS, Serby
CW, Witek TJ Jr: The combination of ipratropium and albuterol optimizes pulmonary function reversibility in patients with COPD. Chest 1999, 115:966-971.
5 Calverley PMA, Burge PS, Spencer S, Anderson JA, Jones PW: Bronchodilator reversibility testing in chronic obstructive pulmonary disease. Thorax 2003, 58:659-664.
6 Global Initiative for Chronic Obstructive Lung Disease: Global Strategy for the Diagnosis, Management, and Prevention of Chronic Obstructive Pulmonary Disease. 2013 update. Accessed November 19, 2013.
7 Anthonisen NR, Wright EC: Bronchodilator response in chronic obstructive pulmonary disease. Am Rev Respir Dis 1986, 133:814-819.
8 Anthonisen NR, Lindgren PF, Tashkin DP, Kanner RE, Scanlon PD, Connett JE: Bronchodilator response in the lung health study over 11 yrs. Eur Respir J 2005, 26:45-51.
9 Albert P, Agusti A, Edwards L, Tal-Singer R, Yates J, Bakke P, Celli BR, Coxson HO, Crim C, Lomas DA, MacNee W, Miller B, Rennard S, Silverman EK, Vestbo J, Wouters E, Calverley P:Bronchodilator responsiveness as a phenotypic characteristic of established chronic obstructive pulmonary disease. Thorax 2012, 67:701-708.
10 Tashkin DP, Li N, Halpin D, Kleerup E, Decramer M, Celli B, Elashoff R: Annual rates of change in pre- vs. post-bronchodilator FEV1 and FVC over 4 years in moderate to very severe COPD. Respir Med 2013, 107:1904-1911.
11 Tashkin DP, Celli B, Senn S, Burkhart D, Kesten S, Menjoge S, Decramer M: A 4-year trial of tiotropium in chronic obstructive pulmonary disease. N Engl J Med 2008, 359:1543-1554.
12 Decramer M, Celli B, Tashkin DP, Pauwels RA, Burkhart D, Cassino C, Kesten S: Clinical trial design considerations in assessing long-term functional impacts of tiotropium in COPD: The UPLIFT Trial. COPD: Jounal of Chronic
post-bronchodilator spirometry to coincide with the timeof expected peak action of each class of bronchodilator.A major limitation is the large drop-out rate with only
27%, 35% and 40% of subjects completing visits at 2, 3and 3¾ yrs, respectively. The current analysis uses allavailable data and the statistical inference from linearmixed effects models is valid under the missing at ran-dom assumption. Moreover, those who discontinued thetrial prematurely were more likely to have fared poorlyduring the trial, suggesting that their bronchodilator re-sponses, had they been measured subsequent to theirwithdrawal, might tend to be even less robust than theresponses at later time points in those subjects whocompleted the trial.In conclusion, acute responses of both FEV1 and FVC
to near maximal doses of two different bronchodilators,while considerably variable both between and within in-dividuals, on average diminish progressively and signifi-cantly over time, consistent with the usually progressivedecline in lung function with age in patients with COPD.These declines were independent of the method of ex-pressing the bronchodilator response and tended to belarger in patients with severe/very severe compared tothose with mild/moderate airflow obstruction, in pa-tients >65 years of age and in former than continuingsmokers and in those not on ICS at baseline. Thesedeclines in the response to a bronchodilator imply apossible diminution in the clinical efficacy of broncho-dilator therapy over time and may account for differ-ences in the slopes of lung function decline with age
when calculated using the post- compared to the pre-bronchodilator value.
Additional files
Additional file 1: Duration of time medication to be withheld priorto each clinic visit.
Additional file 2: Estimated average change per year over 4 yearsin absolute bronchodilator response (Δ, in ml) (±SE) for FEV1 andFVC in the tiotropium arm of the UPLIFT trial by GOLD grading forairflow obstruction (I&II, III, IV), age (≤50 yrs, >50 yrs), gender,and smoking status (sustained ex-smoker, intermittent smoker,continuing smoker).
Additional file 3: Estimated average change per year over 4 yearsin relative bronchodilator response (percent change [Δ] = post- minuspre-bronchodilator FEV1 and FVC/pre-bronchodilator value X 100)(±SE) in the tiotropium arm by GOLD grading for airflow obstruction(I&II, III, IV), age (≤50 yrs, >50 yrs), gender, and smoking status(sustained ex-smoker, intermittent smoker, continuing smoker).
Additional file 4: Estimated average change per year over 4years in % predicted bronchodilator response (Δ= % predictedpost-bronchodilator minus % predicted pre-bronchodilator FEV1or FVC) l) (±SE) in the tiotropium arm of the trial by GOLD grading forairflow obstruction (I&II, III, IV), age (≤50 yrs, >50 yrs), gender, andsmoking status (sustained ex-smoker, intermittent smoker, continuingsmoker).
AbbreviationsCOPD: Chronic obstructive pulmonary disease; FEV1: Forced expired volumein 1 second; FVC: Forced vital capacity; UPLIFT: Understanding PotentialLong-term Impacts on Function with Tiotropium; IPPB: Intermittent positivepressure breathing; LHS: Lung Health Study; ECLIPSE: Evaluation of COPDLongitudinally to Identify Predictive Surrograte Endpoints.
Table 6 Long-term trends in the proportion of subjects in each treatment arm who achieved a significantbronchodilator response for FEV1, FVC and either FEV1 or FVC
FEV FVC FEV or FVC
Tiotropium Placebo Tiotropium Placebo Tiotropium Placebo
Time N Proportion N Proportion N Proportion N Proportion N Proportion N Proportion
1 m 2535 0.42 2416 0.55 2535 0.47 2416 0.62 2535 0.59 2416 0.73
6 m 2515 0.42 2391 0.53 2515 0.44 2391 0.63 2515 0.57 2391 0.72
1 yr 2503 0.39 2382 0.53 2503 0.43 2382 0.63 2503 0.55 2382 0.72
1.5 yr 2380 0.40 2200 0.51 2380 0.43 2200 0.62 2380 0.56 2200 0.71
2 yr 2236 0.39 2040 0.49 2236 0.43 2040 0.60 2236 0.56 2040 0.69
2.5 yr 2132 0.39 1906 0.50 2132 0.42 1906 0.61 2132 0.55 1906 0.70
3 yr 2012 0.36 1792 0.47 2012 0.39 1792 0.59 2012 0.52 1792 0.69
3.5 yr 1894 0.36 1674 0.47 1894 0.41 1674 0.59 1894 0.52 1674 0.68
4 yr 1804 0.35 1599 0.47 1804 0.39 1599 0.56 1804 0.51 1599 0.66
Estimated OR (95% CI) forchange in proportion peryear*
0.92 (0.90, 0.94) 0.91 (0.89, 0.94) 0.93 (0.91, 0.95) 0.94 (0.92, 0.96) 0.92 (0.90, 0.94) 0.92 (0.90, 0.95)
p-value <0.0001 <0.0001 <0.0001 <0.0001 <0.0001 <0.0001
*The OR (odds ratio) and its 95% CI were estimated with GEE methods using data starting from 1 m.FEV: Tiotropium vs. placebo p = 0.79.FVC: Tiotropium vs. placebo p = 0.60.FEV or FVC: Tiotropium vs. placebo p = 0.84.
Tashkin et al. Respiratory Research 2014, 15:102 Page 9 of 10http://respiratory-research.com/content/15/1/102
Obstructive Pulmonary Disease 2004, 1:303-312. 13 Standardization of spirometry: 1994 update Am J Respir Crit
Care Med 1995, 152:1107-1136. 14 Janssens W, Liu Y, Liu D, Kesten S, Tashkin DP, Celli BR,
Decramer M: Quality and reproducibility of spirometry in patients with COPD: The UPLIFT experience. Respir Med 2013, 107:1409-1416.
15 Nisar M, Earis JE, Pearson MG, Calverley PMA: Acute bronchodilator trials in chronic obstructive pulmonary disease. Am Rev Respir Dis 1982, 146:555-559.
16 Tashkin D, Kesten S: Long-term treatment benefits with tiotropium in COPD patients with and without short term bronchodilator responses. Chest 2003, 123:1441-1449.
17 Mahler DA, Donohue JF, Barbeee RA, Goldman MD, Gross NJ, Wisniewski ME, Yancey SW, Zakes BA, Fickard KA, Anderson WH: Efficacy of salmeterol xinafoate in the treatment of COPD. Chest 1999, 115:957-965.
18 Hogg JC, Chu F, Utokaparch S, Woods R, Elliott WM, Buzatu L, Cherniack RM, Rogers RM, Sciurba FC, Coxson HO, Pare PD: The nature of small-airways obstruction in chronic obstructive pulmonary disease. N Engl J Med 2004, 350:2645-2653.
19 Turner JM, Mead J, Wohl ME: Elasticity of human lungs in relation to age. J Appl. Physiol 1968, 25:664-671.

48 Respiratory Therapy Vol. 10 No. 1 n Winter 2015 Respiratory Therapy Vol. 10 No. 1 n Winter 2015 49
AbstractBackground: Chronic obstructive pulmonary disease (COPD) is associated with local and systemic inflammation. The knowledge of interaction and co-variation of the inflammatory responses in different compartments is meagre.
Method: Healthy controls (n = 23), smokers with (n = 28) and without (n = 29) COPD performed spirometry and dental examinations. Saliva, induced sputum, bronchoalveolar lavage (BAL) fluid and serum were collected. Inflammatory markers were assessed in all compartments using ELISA, flow cytometry and RT-PCR.
Results: Negative correlations between lung function and saliva IL-8 and matrix metalloproteinase-9 (MMP-9) were found in smokers with COPD. IL-8 and MMP-9 in saliva correlated positively with periodontal disease as assessed by gingival bleeding in non-smokers.
Tumor necrosis factor-α (TNF-α) in saliva, serum and TNF-α mRNA expression on macrophages in BAL-fluid were lower in smokers than in non-smokers. There were positive correlations between soluble TNF-α receptor 1 (sTNFR1) and soluble TNF-α receptor 2 (sTNFR2) in sputum, BAL-fluid and serum in all groups. Sputum interleukin-8 (IL-8) or interleukin-6 (IL-6) was positively correlated with sTNFR1 or sTNFR2 in non-smokers and with sTNFR2 in COPD.
Conclusion: Saliva which is convenient to collect and analyse, may be suitable for biomarker assessment of disease activity in COPD. An attenuated TNF-α expression was demonstrated by both protein and mRNA analyses in different compartments suggesting that TNF-α response is altered in moderate and severe COPD. Shedding of TNFR1 or TNFR2 is similarly regulated irrespective of airflow limitation.
IntroductionChronic obstructive pulmonary disease (COPD) is characterized by airway inflammation, chronic airflow limitation, progressive tissue destruction, extra-pulmonary manifestations and systemic inflammation. Several studies had shown the relationship between inflammatory biomarkers and exacerbations as well as systemic inflammation in COPD.1,2 The inflammatory response in COPD is dominated by neutrophils and chemokines/cytokines such as tumor necrosis factor-α (TNF-α) and interleukin-8 (IL-8), which are of importance for neutrophils recruitment.3 Also interleukin-6 (IL-6), a pro-inflammatory cytokine, is increased locally in the airways and systemically in COPD, especially in association with acute exacerbations.4 TNF-α is capable of macrophage activation and stimulation of matrix metalloproteinase production,5 and the effects are mediated through interaction with tumor necrosis factor receptor 1 (TNFR1, TNF receptor 55) and tumor necrosis factor receptor 2 (TNFR2, TNF receptor 75), which are expressed on the surface of a number of cell types6 The TNFRs also appear in soluble forms which are generated by proteolytic cleavage of the cell surface bound TNFR in response to inflammatory mediators such as endogenous TNF-α.7 Matrix metalloproteinase-9 (MMP-9) degrades components of the extracellular matrix which alters the balance between MMP-9 and its inhibitor,8 tissue inhibitor of metaloproteinases-1 (TIMP-1) that plays a critical role in inducing airway remodelling. Chronic destructive periodontal disease is characterized by chronic inflammation of the periodontal tissues. Smoking, which is the main risk factor for COPD, also increases the risk for periodontal disease by 5 to 20 times.9 There are epidemiological studies suggesting a co-variation between periodontal disease and COPD10 but a causal relationship between the two diseases has not been convincingly demonstrated.
In this cross sectional study inflammatory biomarkers, of importance in COPD were assessed in different compartments (mouth, large and small airways and blood) in smokers with and without COPD and healthy non-smokers. The aim was to find out whether or not the inflammatory processes in smokers are similarly regulated in different tissues and to what extent the presence of airway obstruction influences these outcomes.
Materials and methodsSubjects and study designTwenty-three non-allergic, healthy non-smokers and 57 current smokers with a cumulative exposure of ≥5 pack-years were included. Smokers with a post-bronchodilator FEV1/FVC <0.7
Compartment Differences Of Inflammatory Activity In Chronic Obstructive Pulmonary DiseaseJie Ji, Ida von Schéele, Jan Bergström, Bo Billing, Barbro Dahlén, Ann-Sofie Lantz, Kjell Larsson and Lena Palmberg
The authors are with the Lung and Airway Research, Institute of Environmental Medicine, Karolinska Institutet, Department of dental medicine, Karolinska institutet, Stockholm, Sweden, Department of Medicine, Unit for Heart and Lung disease, Karolinska institutet, Stockholm, Sweden. This is an Open Access article distributed under the terms of the Creative Commons Attribution License which permits unrestricted use, distribution, and reproduction in any medium, provided the original work is properly credited. The Creative Commons Public Domain Dedication waiver applies to the data made available in this article, unless otherwise stated.
and FEV1 of 40-70% of predicted value were included in the COPD group (n = 28), and smokers with a post-bronchodilator FEV1/FVC >0.7 and FEV1 > 70% of predicted value were included in the non-COPD group (n = 29) (Table 1). Spirometry was performed according to the ATS/ERS guidelines. Subjects with a history of asthma, other pulmonary disease or serious heart disease were excluded. Exacerbations during the last month prior to the study constituted an exclusion criterion.
A clinical periodontal examination included assessment of periodontal pockets depth, gingival bleeding, and number of remaining teeth and occurrence of dental plaque. Periodontal tissue inflammation was assessed by gingival bleeding on probing, expressed as percentage of bleeding sites. Saliva, induced sputum and broncho-alveolar lavage (BAL) were collected on three separate days. Blood samples were drawn on the bronchoscopy day. Characterizations and periodontal status of the subjects have been described elsewhere.11
All subjects gave their informed consent and the study was approved by the ethics committee at Karolinska Institutet, Stockholm, Sweden.
SalivaThe subjects were not allowed to brush their teeth, eat, drink (except water) or smoke at least 90 minutes before the visit. After rinsing their mouth twice with cold water, salivation was stimulated by watching a basket of lemons. After 10 minutes collection by repeated spitting into a sterile Falcon tube, the saliva was weighed and centrifuged at 3600 rpm, at 4°C, 4 minutes. The supernatant was collected and stored in -80°C until analyses.
Induced sputumSputum induction and processing were performed as previously described.12 After inhalation of salbutamol (0.4 mg), sputum was
induced by inhaling increased concentrations of saline (0.9%, 3%, 4% and 5%), by using an ultrasonic nebulizer. At each saline concentration, FEV1 was measured. The subjects were asked to blow their noses and rinse their mouths with water after each concentration, and then to cough deeply and to make an attempt to expectorate sputum. A sample that macroscopically appeared to be free from saliva and had a weight > 1 g was considered adequate. An equal volume of 0.1% dithiothreitol was added to the whole sputum sample and rocked for 15-20 minutes in a 37°C water bath, and then the samples were filtered and centrifuged. The supernatant was collected and stored at -80°C until analyses. The cell pellet was re-suspended using PBS and put on ice until antibody staining for flow cytometry.
Trypan blue was used to determine total cell number and cell viability. Differential cell counts were performed by counting approximately 300 cells on cytospins and stained with May-Grünwald Giemsa, and the data have been presented elsewhere.13 Sputum samples containing more than 30% of squamous epithelial cells were excluded from the analysis.
Broncho-alveolar lavage (BAL)Bronchoscopy was performed as previously described.14 After pre-medication with morphine or pethidine and scopolamine, a bronchoscopy was performed using local anesthesia with xylocaine. The bronchoscope was wedged in a middle lobe segmental bronchus and isotonic saline (5 × 50 ml) was instilled into the airway tree and gently sucked back. The lavage fluid was collected and after centrifugation, the supernatant was stored in - 80°C until analyses. The cell pellet was re-suspended, then total cell count and differential cell count were performed as done with sputum samples.13 The cells were re-suspended in RPMI cell medium supplemented with 5% serum and then put into petri dishes at a concentration of 2 million cells/dish After 2 hours the non-adherent cells and supernatants were discarded and the adhered cells (macrophages) were prepared for mRNA analysis.
of the periodontal tissues. Smoking, which is the main riskfactor for COPD, also increases the risk for periodontaldisease by 5 to 20 times [9]. There are epidemiologicalstudies suggesting a co-variation between periodontal dis-ease and COPD [10] but a causal relationship between thetwo diseases has not been convincingly demonstrated.In this cross sectional study inflammatory biomarkers,
of importance in COPD were assessed in different com-partments (mouth, large and small airways and blood) insmokers with and without COPD and healthy non-smokers. The aim was to find out whether or not the in-flammatory processes in smokers are similarly regulatedin different tissues and to what extent the presence ofairway obstruction influences these outcomes.
Materials and methodsSubjects and study designTwenty-three non-allergic, healthy non-smokers and 57current smokers with a cumulative exposure of ≥5 pack-years were included. Smokers with a post-bronchodilatorFEV1/FVC <0.7 and FEV1 of 40-70% of predicted valuewere included in the COPD group (n = 28), and smokerswith a post-bronchodilator FEV1/FVC >0.7 and FEV1 >70% of predicted value were included in the non-COPDgroup (n = 29) (Table 1). Spirometry was performed ac-cording to the ATS/ERS guidelines. Subjects with a his-tory of asthma, other pulmonary disease or serious heartdisease were excluded. Exacerbations during the lastmonth prior to the study constituted an exclusioncriterion.A clinical periodontal examination included assess-
ment of periodontal pockets depth, gingival bleeding,and number of remaining teeth and occurrence of dentalplaque. Periodontal tissue inflammation was assessed bygingival bleeding on probing, expressed as percentage ofbleeding sites. Saliva, induced sputum and broncho-alveolar lavage (BAL) were collected on three separatedays. Blood samples were drawn on the bronchoscopy
day. Characterizations and periodontal status of the sub-jects have been described elsewhere [11].All subjects gave their informed consent and the study
was approved by the ethics committee at KarolinskaInstitutet, Stockholm, Sweden.
SalivaThe subjects were not allowed to brush their teeth, eat,drink (except water) or smoke at least 90 minutes beforethe visit. After rinsing their mouth twice with cold water,salivation was stimulated by watching a basket oflemons. After 10 minutes collection by repeated spittinginto a sterile Falcon tube, the saliva was weighed andcentrifuged at 3600 rpm, at 4°C, 4 minutes. The super-natant was collected and stored in -80°C until analyses.
Induced sputumSputum induction and processing were performed aspreviously described [12]. After inhalation of salbutamol(0.4 mg), sputum was induced by inhaling increasedconcentrations of saline (0.9%, 3%, 4% and 5%), by usingan ultrasonic nebulizer. At each saline concentration,FEV1 was measured. The subjects were asked to blowtheir noses and rinse their mouths with water after eachconcentration, and then to cough deeply and to make anattempt to expectorate sputum. A sample that macro-scopically appeared to be free from saliva and had aweight > 1 g was considered adequate. An equal volumeof 0.1% dithiothreitol was added to the whole sputumsample and rocked for 15-20 minutes in a 37°C waterbath, and then the samples were filtered and centrifuged.The supernatant was collected and stored at -80°Cuntil analyses. The cell pellet was re-suspended usingPBS and put on ice until antibody staining for flowcytometry.Trypan blue was used to determine total cell number
and cell viability. Differential cell counts were performedby counting approximately 300 cells on cytospins andstained with May-Grünwald Giemsa, and the data have
Table 1 Characteristics of the participants
Healthy non-smokers Smokers without COPD Smokers with COPD
Subjects n n = 23 n = 29 n = 28
Age yrs Mean (range) 55 (41-72) 53 (38-66) 61 (48-73)**###
Gender male/female 15/8 14/15 11/17
BMI Mean (range) 25.0 (19.7-31.2) 25.1 (20.4-32.7) 23.7 (17.3-29.7)
Smoking(pack-yrs) Mean (range) 0 36 (5-120) 37 (15-60)
FEV1% predicted (post- bronchodilator) 102 (97-106) 96 (91-100) 58***### (51-65)
FEV1/FVC (post-bronchodilator) 0.80 (0.77-0.82) 0.77 (0.75-0.79) 0.55***### (0.51-0.58)
Results are presented as mean and 95% confidence intervals or range.Between groups comparisons were assessed by ANOVA and Fisher’s PLSD.BMI: Body mass index; FVC: Forced Vital Capacity; FEV1: Forced Expiratory Volume in one second.**, ***indicate P < 0.01 and P < 0.001, respectively, compared with healthy non-smokers.### indicate P < 0.001 compared with smokers without COPD.
Ji et al. Respiratory Research 2014, 15:104 Page 2 of 9http://respiratory-research.com/content/15/1/104
ResultsClinical characteristics and dental signsCharacteristics of the subjects are shown in Table 1.Smoking habits were approximately 35 pack-years inboth smoker groups. An impaired periodontal status wasfound in both smokers with and without COPD with nomajor difference between the two groups as previouslydescribed [11].
SalivaThe level of salivary TNF-α was significantly lower inthe two smoker groups than in non- smokers (P < 0.001)whereas IL-8, MMP-9 and TIMP-1 in saliva did not dif-fer between the groups (Table 2). There was a negativecorrelation between lung function and the salivary levelsof IL-8 and MMP-9 in the COPD group (Figure 1). Gin-gival bleeding correlated positively with IL-8 and MMP-9 levels in saliva of non-smokers (Figure 2).
SputumBoth groups of smokers had higher levels of IL-6 in spu-tum than had non-smokers (P < 0.001), and sputum IL-8was higher in COPD patients than in the non-smokers(P = 0.006; Table 3). TNF-α level in sputum was underdetection limit in almost all cases. Sputum neutrophilTNFRs expression and sputum sTNFRs did not differbetween the groups. The levels of sputum IL-6 and IL-8were positively correlated with sputum sTNFR1 andsTNFR2 in healthy controls, and with sputum sTNFR2in COPD patients (Figure 3).
Bronchoalveolar lavage (BAL)In BAL-fluid, IL-8 was under detection limit in mostcases and MMP-9 did not differ between the groups(P = 0.112; Table 3). The levels of TIMP-1 were higher inthe two smoker groups than in non-smokers (P = 0.01;Table 3). The macrophage mRNA TNF-α was lower inboth smoker groups than in the non-smokers (P = 0.027)while its receptor (TNFR1) was higher in COPD groupthan the other two groups (P = 0.037; Table 3). sTNFR1levels in BAL fluid were higher in smokers withoutCOPD than in the other two groups, and sTNFR2 levels
were increased in both smoker groups compared withnon-smokers (Table 3).
Serum/bloodTNF-α in serum was lower in the COPD group than inother two groups (P = 0.049; Table 4).The levels of CRP in serum were lower in non-
smokers than in the two groups of smokers with no dif-ference between the latter two (P = 0.004; Table 4).Serum MMP-9-level was higher in COPD than inhealthy controls (P = 0.006; Table 4).
TNFR1 and TNFR2There was a significant positive correlation betweensTNFR1 and sTNFR2 both in BAL fluid and serum in allthree groups (Figure 4). In sputum, there was a significantcorrelation between sTNFR1 and sTNFR2 in healthycontrols and in smokers with COPD (Figure 4) but not insmokers without COPD (Rho = 0.476; P = 0.09).Pooled data from all three groups revealed a positive
correlation between TNFR1 and TNFR2 expression oncirculating neutrophils (Rho = 0.843; P = 0.0001; data notshown).
DiscussionIn the present study it was shown that smokers have anongoing inflammation in the central airways (sputum),peripheral airways (BAL fluid), and systemically (blood)and that this inflammatory response is rather associatedwith smoking than with the presence or absence ofchronic airflow limitation.Although the levels of IL-8 and MMP-9 did not differ
between the groups there was a significant negative rela-tionship between saliva levels of IL-8 and MMP-9 andlung function in COPD. The findings may indicate thatthe inflammatory markers in saliva may be related todisease severity in COPD. A similar relationship has pre-viously been shown between biomarkers in serum andlung function [16]. However whether or not that salivaanalyses may be useful for analyses of inflammatorymarkers in COPD has to be further explored. Intri-guingly, we found a very strong correlation between IL-8and MMP-9 in saliva and periodontal inflammation
Table 2 Inflammatory mediators in saliva
Healthy non-smoker Smokers without COPD Smokers with COPD
IL-8 (pg/ml) 307 (225-558) 262 (208-407) 360 (165-474) P = 0.512
MMP-9 (ng/ml) 338 (105-679) 170 (62-465) 217 (101-351) P = 0.437
TIMP-1 (ng/ml) 449 (225-814) 354 (221-535) 360 (241-469) P = 0.556
MMP-9/TIMP-1 0.54 (0.29-1.16) 0.37 (0.23-1.10) 0.38 (0.27-0.96) P = 0.789
TNF-α (pg/ml) 2.04 (1.19-3.82) 0.529*** (<0.5-1.25) 0.704*** (<0.5-1.23) P < 0.001
Results are presented as median and 25th-75th percentiles.P-values indicate comparisons between groups (Kruskal-Wallis test), bold data indicate significance.***indicate P < 0.001 compared with healthy non-smokers (Mann-Whitney U test).
Ji et al. Respiratory Research 2014, 15:104 Page 4 of 9http://respiratory-research.com/content/15/1/104

50 Respiratory Therapy Vol. 10 No. 1 n Winter 2015 Respiratory Therapy Vol. 10 No. 1 n Winter 2015 51
Serum/bloodPeripheral blood was collected in supplement-free tubes and ethylene diaminetetra-acid (EDTA) vacutainer tubes (BD Bioscience, New Jersey, USA). The samples in supplement free tubes were left 60 minutes to clot and then centrifuged twice at 3000 rpm, for 10 minutes. The obtained serum was then aliquoted and stored in -70°C until analyses. The samples in EDTA vacutainer tubes were used for flow cytometry analysis.
Flow cytometryFor TNFR1 and TNFR2 analyses of neutrophils in sputum (100 000 cells in total) and blood neutrophils and monocytes in whole blood (100 μL) were incubated with 10 μL monoclonal antibodies (anti-CD120a (TNFR1)-PE clone H398, anti-CD120b (TNFR2)-PE clone 80 M2, IOTest) for 20 minutes. Isotype-matched antibodies were used as negative controls. After incubation, the samples
were fixed and centrifuged, then stored at 2 – 8°C and analyzed within 2 hours. Analyses were performed by FACSCalibur and median fluorescent intensity (MFI) was determined by CELLQuest (BD Bioscience Pharmingen) and relative median fluorescent intensity (rMFI) was calculated.
The sTNFR1 and sTNFR2 in supernatant from sputum, BAL fluid and serum were detected using BD Cytometric Bead Array (CBA) flex set (BD Bioscience Pharmingen). Analyses were performed by FACSCalibur and the concentration of sTNFR1 and sTNFR2 were determined by FCAP Array Software (BD Bioscience Pharmingen). The range of the standard curve was 0-10000 pg/ml for sTNFR1 and 0-2500 pg/ml for sTNFR2.
mRNA preparation and real-time PCRPreparation of mRNA from alveolar macrophage was
performed in eight subjects from each group. Total mRNA was isolated by PureLink Micro-to-Midi Total RNA Purification System (Initrogen). DNase I, amplification grade was used to remove the genomic DNA (Initrogen). First-strand cDNA was synthesized from 0.5 μg of total mRNA, using QuantiTect Reverse Transcription Kit (Qiagen, Hilden, Germany). The ABI Power SYBR Green Master mix (Applied Biosystems) was used to perform the RT-PCR, also the primers were purchased from Invitrogen. The widely used cDNA of glyceraldehydes-3-phosphate dehydrogenase (GAPDH) was adopted as an internal control gene. 1 μl cDNA was used in each 25 μl PCR reaction volume to identify the products of interest.
Data were analyzed using 7500 Software v.2.0.1, the results were then calculated and expressed as 2-ΔCt.
ELISAMeasurement of IL-6 and IL-8 in saliva, sputum and BAL-fluid was performed using an in- house ELISA.15 The lower detection limit of the IL-6 assay was 3 pg/ml in all compartments. The limit of IL-8 assay of saliva and sputum was 50 pg/ml and for BAL was 12.5 pg/ml.
MMP-9 and TIMP-1 in supernatant from saliva, sputum, BAL-fluid and serum were measured using purchased DouSet ELISA MMP-9 Kit and DouSet ELISA TIMP-1 Kit (R&D SYSTEMS). The
measurements of TNF-α in supernatant from saliva, sputum and serum were performed by purchased HS quantikine ELISA Kit (R&D SYSTEMS). The analyses of MMP-9, TIMP-1 and TNF-α were performed according to the manufacturer. For all the duplicated samples, an intra-assay variation <10% (for TNF-α, <20%) was accepted.
High-sensitivity CRP testA high-sensitivity CRP (hs-CRP) test was used to measure serum level of C-reactive protein (CRP) with laser nephelometry.
StatisticsDepending on distribution of the data results are presented as means (95% confidence intervals) or medians (25-75 percentiles). Between groups comparisons were assessed by ANOVA followed by Fisher’s protected least significant difference (PLSD), or by Kruskal-Wallis test with the Mann-Whitney U test as a post hoc test when appropriate, and by means of Spearman’s rank correlation. A p-value <0.05 was considered significant. All data were analyzed using StatView version 5.0.1 (SAS Institute Inc., Cary NC).
ResultsClinical characteristics and dental signsCharacteristics of the subjects are shown in Table 1. Smoking habits were approximately 35 pack-years in both smoker groups.
assessed by gingival bleeding in healthy non-smokersbut not in the two groups of smokers. This finding indi-cates that these markers of inflammation in saliva are as-sociated with periodontal inflammation under normalconditions and that this association is masked insmokers when inflammatory activity is triggered by a po-tent pro- inflammatory stimulus such as tobacco smoke.The levels of TNF-α in saliva and serum as well as
TNF-α mRNA expression in macrophages in BAL fluidwere lower in smokers with COPD than in non-smokers. The attenuated TNF-α response was thus dem-onstrated in different compartments (mouth, serum,alveolar macrophages) by the use of different methods(protein and mRNA expression) clearly indicating a gen-erally diminished TNF production and secretion. It haspreviously been shown that pro-inflammatory cytokine,e.g. TNF-α, responses to different stimuli are attenuatedin macrophages and monocytes from smokers comparedwith non-smokers [17–19]. In a study by Pinto-Plataet al. [20], there was a positive relationship between the
blood levels of TNF-α and the severity of the disease inpatients with COPD and the patients with moderate dis-ease (GOLD stage II) had the lowest blood levels ofTNF-α [21]. Di Francia et al. [22] demonstrated un-altered TNF-α in patients with severe COPD who didnot lose weight while COPD patients with unintentionalweight loss had high TNF-α serum levels. Our COPDpatients had normal BMI and were in stage II and IIIwith a FEV1 > 40% of predicted value implying that, pa-tients with low BMI and the most severe disease werenot included. The clinical effect of TNF-α inhibitors hasbeen shown to be poor in mild and moderate.COPD [23,24] whereas an improved physical perform-
ance of TNF-α inhibition has been indicated in COPD pa-tients with severe disease and cachexia [25]. It could thusbe speculated that the TNF-α response in COPD is bimodalwith an attenuated response in moderate disease and an en-hanced response in more severely ill patients; in particularthose who also experience weight loss. In addition, ourCOPD patients were in a stable phase with no recent
Figure 1 Relationship between lung function index and salivary biomarkers. Relationship between FEV1 (percent of predicted value) andIL-8 (a) and MMP-9 (b) in saliva in smokers with COPD. Rho indicates coefficient of correlation according to Spearman.
Figure 2 Relationship between dental statues and salivary biomarkers. Relationship between gingival bleeding index and IL-8 (a) andMMP-9 (b) in saliva in healthy non-smokers. Rho indicates coefficient of correlation according to Spearman.
Ji et al. Respiratory Research 2014, 15:104 Page 5 of 9http://respiratory-research.com/content/15/1/104
Table 3 Inflammatory mediators in respiratory tracts
Healthy non-smoker Smokers without COPD Smokers with COPD P-value
Sputum IL-6 (pg/ml) 33.4 (11.5-62.6) 223*** (78.9-641) 486*** (262-1031) P < 0.001
IL-8 (pg/ml) 628 (430-1351) 1100 (595-1710) 2941**# (980-4912) P = 0.010
MMP-9 (ng/ml) 21.6 (13.3-109) 57.3 (30.2-106) 97.5 (17.4-408) P = 0.091
TIMP-1 (ng/ml) 117.5 (28.7-257) 96.6 (46.4-242) 166 (69.4-346) P = 0.423
MMP-9/TIMP-1 0.35 (0.14-1.36) 0.78 (0.19-1.72) 0.70 (0.22-1.80) P = 0.636
TNF-α (pg/ml) 1.17 (<1.00-4.88) <1.00 (<1.00) <1.00 (<1.00-8.05) P = 0.123
sTNFR1 (pg/ml) 589 (59-996) 205 (36-536) 80 (16-560) P = 0.207
sTNFR2 (pg/ml) 140 (65-469) 196 (118-344) 204 (43-545) P = 0.996
TNFR1 on neutrophils (rMFI) 1.94 (1.46-2.48) 2.70 (2.36-2.94) 1.76 (1.44-2.12) P = 0.076
TNFR2 on neutrophils (rMFI) 1.58 (1.37-1.67) 1.63 (1.35-1.93) 1.34 (1.17-1.49) P = 0.236
BAL IL-8 (pg/ml) <12.5 (<12.5-15.8) <12.5 (<12.5-33.0) 20.3 (<12.5-31.8) P = 0.459
MMP-9 (ng/ml) 0.69 (0.44-1.45) 0.97 (0.58-1.27) 1.38 (0.93-3.87) P = 0.112
TIMP-1 (ng/ml) 1.85 (1.46-3.71) 3.92** (2.71-9.34) 3.46** (2.18-7.85) P = 0.010
MMP-9/TIMP-1 0.51 (0.18-0.77) 0.25 (0.11-0.62) 0.42 (0.11-0.74) P = 0.654
sTNFR1 (pg/ml) 82.2 (75.4-118) 161** (102-203) 92.9 # (73.7-133) P = 0.009
sTNFR2 (pg/ml) 36.0 (24.8-50.2) 77.7** (54.6-110) 69.5* (34.6-88.5) P = 0.003
Macrophages TNF-α (2 -ΔCt) 0.05 (0.04-0.12) 0.02* (0.02-0.03) 0.01* (0.01-0.05) P = 0.027
Macrophages TNFR1 (2 − ΔCt) 0.008 (0.005-0.01) 0.006 (0.005-0.016) 0.004*# (0.004-0.005) P = 0.037
Macrophages TNFR2 (2 − ΔCt) 0.003 (0.001-0.003) 0.003 (0.003-0.004) 0.002 (0.001-0.002) P = 0.055
Results are presented as median and 25th-75th percentiles.P-values indicate comparisons between groups (Kruskal-Wallis test), bold data indicate significance.In BAL fluid IL-6 was below detection limit (<3 pg/ml) with a few exceptions and TNF-α was below detection limit (<0.5 pg/ml) in all samples.*, **, ***indicate P < 0.05 P < 0.01 and P < 0.001, respectively, compared with healthy non- smokers (Mann-Whitney U test).# indicate P < 0.05 compared with smokers without COPD (Mann-Whitney U test).
Figure 3 Relationship between sputum soluble TNFRs and sputum biomarkers. Relationship between sputum concentration of solubleTNF- α receptors and IL-6 and (a, c) and IL-8 (b, d) in healthy non-smokers. Relationship between sputum concentration of sTNFR2 and IL-6 and(e) and IL-8 (f) in smokers with COPD. Rho indicates coefficient of correlation according to Spearman.
Ji et al. Respiratory Research 2014, 15:104 Page 6 of 9http://respiratory-research.com/content/15/1/104

52 Respiratory Therapy Vol. 10 No. 1 n Winter 2015 Respiratory Therapy Vol. 10 No. 1 n Winter 2015 53
An impaired periodontal status was found in both smokers with and without COPD with no major difference between the two groups as previously described.11
SalivaThe level of salivary TNF-α was significantly lower in the two smoker groups than in non- smokers (P < 0.001) whereas IL-8, MMP-9 and TIMP-1 in saliva did not differ between the groups (Table 2). There was a negative correlation between lung function and the salivary levels of IL-8 and MMP-9 in the COPD group (Figure 1). Gingival bleeding correlated positively with IL-8 and MMP-9 levels in saliva of non-smokers (Figure 2).
SputumBoth groups of smokers had higher levels of IL-6 in sputum than had non-smokers (P < 0.001), and sputum IL-8 was higher in COPD patients than in the non-smokers (P = 0.006; Table 3). TNF-α level in sputum was under detection limit in almost all cases. Sputum neutrophil TNFRs expression and sputum sTNFRs did not differ between the groups. The levels of sputum IL-6 and IL-8 were positively correlated with sputum sTNFR1 and sTNFR2 in healthy controls, and with sputum sTNFR2 in COPD patients (Figure 3).
Bronchoalveolar lavage (BAL)In BAL-fluid, IL-8 was under detection limit in most cases and MMP-9 did not differ between the groups (P = 0.112; Table 3). The levels of TIMP-1 were higher in the two smoker groups than in
non-smokers (P = 0.01; Table 3). The macrophage mRNA TNF-α was lower in both smoker groups than in the non-smokers (P = 0.027) while its receptor (TNFR1) was higher in COPD group than the other two groups (P = 0.037; Table 3). sTNFR1 levels in BAL fluid were higher in smokers without COPD than in the other two groups, and sTNFR2 levels were increased in both smoker groups compared with non-smokers (Table 3).
Serum/bloodTNF-α in serum was lower in the COPD group than in other two groups (P = 0.049; Table 4).
The levels of CRP in serum were lower in non-smokers than in the two groups of smokers with no difference between the latter two (P = 0.004; Table 4). Serum MMP-9-level was higher in COPD than in healthy controls (P = 0.006; Table 4).
TNFR1 and TNFR2There was a significant positive correlation between sTNFR1 and sTNFR2 both in BAL fluid and serum in all three groups (Figure 4). In sputum, there was a significant correlation between sTNFR1 and sTNFR2 in healthy controls and in smokers with COPD (Figure 4) but not in smokers without COPD (Rho = 0.476; P = 0.09).
Pooled data from all three groups revealed a positive correlation between TNFR1 and TNFR2 expression on circulating neutrophils (Rho = 0.843; P = 0.0001; data not shown).
DiscussionIn the present study it was shown that smokers have an ongoing inflammation in the central airways (sputum), peripheral airways (BAL fluid), and systemically (blood) and that this inflammatory response is rather associated with smoking than with the presence or absence of chronic airflow limitation.
Although the levels of IL-8 and MMP-9 did not differ between the groups there was a significant negative relationship between saliva levels of IL-8 and MMP-9 and lung function in COPD. The findings may indicate that the inflammatory markers in saliva may be related to disease severity in COPD. A similar relationship has previously been shown between biomarkers in serum and lung function.16 However whether or not that saliva analyses may be useful for analyses of inflammatory markers in COPD has to be further explored. Intriguingly, we found a very strong correlation between IL-8 and MMP-9 in saliva and periodontal inflammation assessed by gingival bleeding in healthy non-smokers but not in the two groups of smokers. This finding indicates that these markers of inflammation in saliva are associated with periodontal inflammation under normal conditions and that this association is masked in smokers when inflammatory activity is triggered by a potent pro- inflammatory stimulus such as tobacco smoke.
The levels of TNF-α in saliva and serum as well as TNF-α mRNA expression in macrophages in BAL fluid were lower in smokers with COPD than in non-smokers. The attenuated TNF-α response was thus demonstrated in different compartments (mouth, serum, alveolar macrophages) by the use of different methods (protein and mRNA expression) clearly indicating a generally diminished TNF production and secretion. It has previously been shown that pro-inflammatory cytokine, e.g. TNF-α, responses to different stimuli are attenuated in macrophages and monocytes from smokers compared with non-smokers.17-19 In a study by Pinto-Plata et al.,20 there was a positive relationship between the blood levels of TNF-α and the severity of the disease in patients with COPD and the patients with moderate disease (GOLD stage II) had the lowest blood levels of TNF-α.21 Di Francia et al.22 demonstrated unaltered TNF-α in patients with severe COPD who did not lose weight while COPD patients with unintentional weight loss had high TNF-α serum levels. Our COPD patients had normal BMI and were in stage II and III with a FEV1 > 40% of predicted value implying that, patients with low BMI and the most severe disease were not included. The clinical effect of TNF-α inhibitors has been shown to be poor in mild and moderate.
COPD23,24 whereas an improved physical performance of TNF-α inhibition has been indicated in COPD patients with severe disease and cachexia.25 It could thus be speculated that the TNF-α response in COPD is bimodal with an attenuated response in moderate disease and an enhanced response in more severely ill patients; in particular those who also experience weight loss. In addition, our COPD patients were in a stable phase with no recent exacerbations. According to Sapey et al.26 TNF-α is quiescent in stable COPD and becomes biologically active during exacerbations which is in agreement with the low TNF-α activity found in our stable COPD patients.
Interestingly, sTNFR1 and sTNFR2 were strongly correlated in sputum, BAL fluid and serum as was TNF-receptor expression on blood neutrophils. We therefore conclude, although the production of TNFRs is assumed to use different signaling
pathways, the regulation and shedding of TNFRs occur in parallel on a cellular level, as assessed by TNFR expression on neutrophils, locally in BAL fluid and sputum and systemically in serum.
The levels of sTNFRs in BAL fluid were higher in both groups of smokers than in non- smokers. It has previously been reported that high levels of sTNFRs may regulate TNF-α formation27 and compete with membrane bound TNFRs.28 Therefore, it seems likely that the high levels of sTNFRs in the smokers may inhibit the production of membrane bound TNFRs. This is in agreement with our finding of lower mRNA expression of TNFRs on BAL macrophages from both groups of smokers compared with non-smokers. In addition, as macrophages are a major producer of TNF-α,6 it could be speculated that macrophages respond to inflammation by regulating the levels of TNFRs along two different lines, enhancement of TNFR shedding and reduced production of membrane bound TNFRs.
The increased levels of the MMP-9 in extracellular matrix is of importance for remodeling processes in COPD, and its expression is considered to be regulated by specific inhibitors, such as TIMP-1.29 We found elevated levels of TIMP-1 in BAL fluid from both groups of smokers compared with healthy non-smokers and increased levels of MMP-9 in serum in the COPD group. Elevated levels of MMP-9 and TIMP-1 have been observed in serum,30 sputum31 and BAL fluid in COPD.32,33 However, there are contradicting results indicating decreased plasma levels of MMP-9 and TIMP-1 in COPD.33 These inconsistent results might be due to the fact that MMP levels may vary over time in COPD.33 Differences in the severity of the disease and smoking habits in the study population may also explain differences between studies.
In conclusion, we demonstrated that saliva, which is easy to collect, might be suitable for studies of biomarkers in smokers with and without COPD. Also, our study provides comprehensive information about different inflammatory biomarkers in different compartments and showed associations of different inflammatory markers both locally and systemically in smokers with and without COPD. An attenuated local and systemic TNF-α response as assessed both by mRNA and protein analyses was demonstrated in moderate COPD. Furthermore, a close relationship between TNF-α receptor expression and other inflammatory markers as well as between two different soluble TNF-α receptors was shown.
References1. Agusti A, Edwards LD, Rennard SI, MacNee W, Tal-Singer
R, Miller BE, Vestbo J, Lomas DA, Calverley PM, Wouters E, Crim C, Yates JC, Silverman EK, Coxson HO, Bakke P, Mayer RJ, Celli B: Persistent systemic inflammation is associated with poor clinical outcomes in COPD: a novel phenotype. PLoS One 2012, 7(5):e37483.
2. Thomsen M, Ingebrigtsen TS, Marott JL, Dahl M, Lange P, Vestbo J, Nordestgaard BG:Inflammatory biomarkers and exacerbations in chronic obstructive pulmonary disease. JAMA 2013, 309(22):2353-2361.
3. Keatings VM, Collins PD, Scott DM, Barnes PJ: Differences in interleukin-8 and tumor necrosis factor-alpha in induced sputum from patients with chronic obstructive pulmonary disease or asthma. Am J Respir Crit Care Med 1996, 153(2):530-534.
4. He ZH, Chen Y, Chen P, Wu GB, Cai S: Local inflammation
exacerbations. According to Sapey et al. [26] TNF-α is qui-escent in stable COPD and becomes biologically activeduring exacerbations which is in agreement with the lowTNF-α activity found in our stable COPD patients.Interestingly, sTNFR1 and sTNFR2 were strongly cor-
related in sputum, BAL fluid and serum as was TNF-receptor expression on blood neutrophils. We thereforeconclude, although the production of TNFRs is assumedto use different signaling pathways , the regulation andshedding of TNFRs occur in parallel on a cellular level,as assessed by TNFR expression on neutrophils, locallyin BAL fluid and sputum and systemically in serum.The levels of sTNFRs in BAL fluid were higher in both
groups of smokers than in non- smokers. It has previ-ously been reported that high levels of sTNFRs mayregulate TNF-α formation [27] and compete with mem-brane bound TNFRs [28]. Therefore, it seems likely thatthe high levels of sTNFRs in the smokers may inhibitthe production of membrane bound TNFRs. This is inagreement with our finding of lower mRNA expression
of TNFRs on BAL macrophages from both groups ofsmokers compared with non-smokers. In addition, asmacrophages are a major producer of TNF-α [6], itcould be speculated that macrophages respond to in-flammation by regulating the levels of TNFRs along twodifferent lines, enhancement of TNFR shedding and re-duced production of membrane bound TNFRs.The increased levels of the MMP-9 in extracellular
matrix is of importance for remodeling processes inCOPD, and its expression is considered to be regulatedby specific inhibitors, such as TIMP-1 [29]. We found el-evated levels of TIMP-1 in BAL fluid from both groupsof smokers compared with healthy non-smokers and in-creased levels of MMP-9 in serum in the COPD group.Elevated levels of MMP-9 and TIMP-1 have been ob-served in serum [30], sputum [31] and BAL fluid inCOPD [32,33]. However, there are contradicting resultsindicating decreased plasma levels of MMP-9 andTIMP-1 in COPD [33]. These inconsistent results mightbe due to the fact that MMP levels may vary over time
Table 4 Inflammatory mediators in serum/blood
Healthy non-smoker Smokers without COPD Smokers with COPD
Serum MMP-9 (ng/ml) 430 (251-577) 490 (382-801) 757** (557-1000) P = 0.006
TIMP-1 (ng/ml) 282 (221-367) 358 (266-442) 338 (298-544) P = 0.104
MMP-9/TIMP-1 1.21 (0.92-1.93) 1.31 (0.96-2.29) 2.13 (1.57-2.81) P = 0.116
CRP (mg/l) 0.75 (0.40-1.20) 1.80** (1.00-2.70) 2.45** (0.73-4.30) P = 0.004
TNF-α (pg/ml) 1.39 (0.72-1.93) 1.22 (1.08-1.53) 0.64*# (<0.5-1.30) P = 0.049
sTNFR1 (pg/ml) 1353 (817-1570) 1322 (1166-1855) 1302 (943-1829) P = 0.848
sTNFR2 (pg/ml) 3499 (2806-3708) 3561 (3097-3919) 3750 (2975-4261) P = 0.826
Blood TNFR1 on monocytes (rMFI) 11.8 (10.5-15.0) 12.5 (9.9-13.7) 13.2 (11.3-15.7) P = 0.600
TNFR2 on monocytes (rMFI) 28.2 (21.3-47.8) 31.1 (25.0-40.9) 44.0 (28.9-52.2) P = 0.342
TNFR1 on neutrophils (rMFI) 6.95 (6.24-9.45) 6.74 (5.42-7.70) 6.69 (5.70-7.92) P = 0.509
TNFR2 on neutrophils (rMFI) 11.8 (8.79-14.6) 8.28 (7.30-9.97) 7.82 (6.58-10.6) P = 0.117
Results are presented as median and 25th-75th percentiles.P-values indicate comparisons between groups (Kruskal-Wallis test), bold data indicate significance.IL-6 and IL-8 were below detection limit (<3 pg/ml, <12.5 pg/ml) in serum in almost all subjects.*, **indicate P < 0.05 and P < 0.01, respectively, compared with healthy non-smokers (Mann-Whitney U-test).# indicate P < 0.05 compared with smokers without COPD (Mann-Whitney U-test).
Figure 4 Relationship between soluble TNFR1 and TNFR2. Relationship between soluble TNFR1 and TNFR2 in sputum (a), BAL fluid (b) andserum (c). Rho indicates coefficient of correlation according to Spearman.
Ji et al. Respiratory Research 2014, 15:104 Page 7 of 9http://respiratory-research.com/content/15/1/104

Ad Page 55
54 Respiratory Therapy Vol. 10 No. 1 n Winter 2015
occurs before systemic inflammation in patients with COPD. Respirology 2010, 15(3):478-484.
5. Lim S, Roche N, Oliver BG, Mattos W, Barnes PJ, Chung KF: Balance of matrix metalloprotease-9 and tissue inhibitor of metalloprotease-1 from alveolar macrophages in cigarette smokers. regulation by interleukin-10. Am J Respir Crit Care Med 2000, 162:1355-1360.
6. Tartaglia LA, Goeddel DV: Two TNF receptors. Immunol Today 1992, 13(5):151-153.
7. Vernooy JH, Kucukaycan M, Jacobs JA, Chavannes NH, Buurman WA, Dentener MA, Wouters EF: Local and systemic inflammation in patients with chronic obstructive pulmonary disease: soluble tumor necrosis factor receptors are increased in sputum. Am J Respir Crit Care Med 2002, 166(9):1218-1224.
8. Churg A, Zhou S, Wright JL: Series “matrix metalloproteinases in lung health and disease”: matrix metalloproteinases in COPD. Eur Respir J 2012, 39(1):197-209.
9. Bergstrom J: Tobacco smoking and chronic destructive periodontal disease. Odontology 2004, 92(1):1-8.
10. Si Y, Fan H, Song YQ, Zhou X, Zhang J, Wang ZM: Association between periodontitis and chronic obstructive pulmonary disease in a Chinese population. J Periodontol 2012, 83(10):1288-1296.
11. Bergstrom J, Cederlund K, Dahlen B, Lantz AS, Skedinger M, Palmberg L, Sundblad BM, Larsson K: Dental health in smokers with and without COPD. Plos One 2013, 8(3):e59492.
12. Strandberg K, Ek A, Palmberg L, Larsson K: Fluticasone and ibuprofen do not add to the effect of salmeterol on organic dust-induced airway inflammation and bronchial hyper-responsiveness. J Intern Med 2008, 264(1):83-94.
13. von Scheele I, Larsson K, Dahlen B, Billing B, Skedinger M, Lantz AS, Palmberg L: Toll-like receptor expression in smokers with and without COPD. Resp Med 2011, 105(8):1222-1230.
14. Larsson BM, Palmberg L, Malmberg PO, Larsson K: Effect of exposure to swine dust on levels of IL-8 in airway lavage fluid. Thorax 1997, 52(7):638-642.
15. Larsson K, Tornling G, Gavhed D, Muller-Suur C, Palmberg L: Inhalation of cold air increases the number of inflammatory cells in the lungs in healthy subjects. Eur Respir J 1998, 12(4):825-830.
16. Vestbo J, Edwards LD, Scanlon PD, Yates JC, Agusti A, Bakke P, Calverley PMA, Celli B, Coxson HO, Crim C, Lomas DA, MacNee W, Miller BE, Silverman EK, Tal-Singer R, Wouters E, Rennard SI: Changes in forced expiratory volume in 1 second overtime in COPD. New Engl J Med 2011, 365(13):1184-1192.
17. Berenson CS, Wrona CT, Grove LJ, Maloney J, Garlipp MA, Wallace PK, Stewart CC, Sethi S:Impaired alveolar macrophage response to Haemophilus antigens in chronic obstructive lung disease. Am J Respir Crit Care Med 2006, 174(1):31-40.
18. Chen H, Cowan MJ, Hasday JD, Vogel SN, Medvedev AE: Tobacco smoking inhibits expression of proinflammatory cytokines and activation of IL-1R-associated kinase, p38, and NF-kappaB in alveolar macrophages stimulated with TLR2 and TLR4 agonists. J Immunol 2007, 179(9):6097-6106.
19. Birrell MA, Wong S, Catley MC, Belvisi MG: Impact of tobacco-smoke on key signaling pathways in the innate immune response in lung macrophages. J Cell Physiol 2008, 214(1):27-37.
20. Pinto-Plata V, Casanova C, Mullerova H, de Torres JP, Corado H, Varo N, Cordoba E, Zeineldine S, Paz H, Baz R, Cortopassi
F, Celli BR: Inflammatory and repair serum biomarker pattern association to clinical outcomes in COPD. Respir Res 2012, 13:71.
21. Standardization of spirometry, 1994 update. Am J Respir Crit Care Med 1995, 152(3):1107-1136.
22. Di Francia M, Barbier D, Mege JL, Orehek J: Tumor necrosis factor-alpha levels and weight loss in chronic obstructive pulmonary disease. Am J Respir Crit Care Med 1994, 150(5 Pt 1):1453-1455.
23. van der Vaart H, Koeter GH, Postma DS, Kauffman HF, ten Hacken NH: First study of infliximab treatment in patients with chronic obstructive pulmonary disease. Am J Respir Crit Care Med 2005, 172(4):465-469.
24. Dentener MA, Creutzberg EC, Pennings HJ, Rijkers GT, Mercken E, Wouters EF: Effect of infliximab on local and systemic inflammation in chronic obstructive pulmonary disease: a pilot study. Respiration 2008, 76(3):275-282.
25. Rennard SI, Fogarty C, Kelsen S, Long W, Ramsdell J, Allison J, Mahler D, Saadeh C, Siler T, Snell P, Korenblat P, Smith W, Kaye M, Mandel M, Andrews C, Prabhu R, Donohue JF, Watt R, Lo KH, Schlenker-Herceg R, Barnathan ES, Murray J: The safety and efficacy of infliximab in moderate to severe chronic obstructive pulmonary disease. Am J Respir Crit Care Med 2007, 175(9):926-934.
26. Sapey E, Ahmad A, Bayley D, Newbold P, Snell N, Rugman P, Stockley RA: Imbalances between Interleukin-1 and Tumor Necrosis Factor Agonists and Antagonists in Stable COPD. J Clin Immunol 2009, 29(4):508-516.
27. Yanbaeva DG, Dentener MA, Creutzberg EC, Wouters EF: Systemic inflammation in COPD: is genetic susceptibility a key factor? COPD 2006, 3(1):51-61.
28. Mukhopadhyay S, Hoidal JR, Mukherjee TK: Role of TNFalpha in pulmonary pathophysiology. Respir Res 2006, 7:125.
29. Brew K, Dinakarpandian D, Nagase H: Tissue inhibitors of metalloproteinases: evolution, structure and function. Biochim Biophys Acta 2000, 1477(1–2):267-283.
30. Navratilova Z, Zatloukal J, Kriegova E, Kolek V, Petrek M: Simultaneous up- regulation of matrix metalloproteinases 1, 2, 3, 7, 8, 9 and tissue inhibitors of metalloproteinases 1, 4 in serum of patients with chronic obstructive pulmonary disease. Respirology 2012, 17(6):1006-1012.
31. Beeh KM, Beier J, Kornmann O, Buhl R: Sputum matrix metalloproteinase-9, tissue inhibitor of metalloprotinease-1, and their molar ratio in patients with chronic obstructive pulmonary disease, idiopathic pulmonary fibrosis and healthy subjects. Respir Med 2003, 97(6):634-639.
32. Sethi S, Maloney J, Grove L, Wrona C, Berenson CS: Airway inflammation and bronchial bacterial colonization in chronic obstructive pulmonary disease. Am J Respir Crit Care Med 2006, 173(9):991-998.
33. D’Armiento JM, Goldklang MP, Hardigan AA, Geraghty P, Roth MD, Connett JE, Wise RA, Sciurba FC, Scharf SM, Thankachen J, Islam M, Ghio AJ, Foronjy RF: Increased matrix metalloproteinase (MMPs) levels do not predict disease severity or progression in emphysema. Plos One 2013, 8(2):e56352.
Streamline yourWorkflow
TM
www.nspirehealth.com • 1-800-574-7374
powered by iFlow
nSpire Health - thinking the way you do.
nSight pulmonary function software suite’s
intuitive design mimics practice workflow,
while its simple and flexible navigation
mirrors a physician’s thinking process.
Anytime/anywhere remote access to
PFT related information via HDweb
on your iPad, Android tablet or any
Internet browser, nSpire Health puts
you back in control of your day,
interpreting patient tests and digitally
signing in under a minute!
nSight™ streamlined PFT testing software
nSight Central™ configurable launch pad
HDweb™ rapid remote data access
HDnet™ EMR/HIS networking & connectivity
iFlow™ PFT accuracy enhancement technology
scan for more information

Ad Page 56
The Vest® and Breathe a Little Easier™ are trademarks or registered trademarks of Hill-Rom Services PTE Ltd. Enhancing Outcomes for Patients and Their Caregivers is a registered trademark of Hill-Rom Services, Inc. The Vest System is o� ered in the home by Advanced Respiratory, Inc, a Hill-Rom company.Hill-Rom reserves the right to make changes without notice in design, speci� cations and models. The only warranty Hill-Rom makes is the express written warranty extended on sale or rental of its products. © 2014 Hill-Rom Services PTE Ltd. ALL RIGHTS RESERVED.
ORDER NUMBER 186921 rev 2 07-JUL-2014 ENG – US
It might be bronchiectasis.Bronchiectasis is a condition where the lungs’ airways are abnormally stretched and scarred resulting in mucus retention. Sometimes when you see COPD, chronic bronchitis, pneumonia, asthma or cystic � brosis, you might also be seeing bronchiectasis.
Learn more by calling 800-426-4224 option 3 or visiting www.thevest.com
Do you see it?
Look again.
Scan and look again. A high-resolution CT scan can help determine a diagnosis of bronchiectasis. Early diagnosis and intervention is the key to slowing the disease progression and helping your patients Breathe a Little Easier.™ The Vest® Airway Clearance System is one therapy option for patients with bronchiectasis.