the internet usage across youth people in turkey: an emprical study
TRANSCRIPT
BASICS OF SOCIOLOGY
THE INTERNET USAGE ACROSS YOUTH PEOPLE IN TURKEY: AN EMPRICAL STUDY
Research Goals
In this paper, we aim to examine the internet usage activities ofyouth people in Turkey. The paper aims to reveal the preferred pasttime in internet, way of the connecting internet and subject of internetactivities. Furthermore, the paper purposes the reveal the how muchfree time young people have in Turkey and how much their free timethey spend on Facebook.
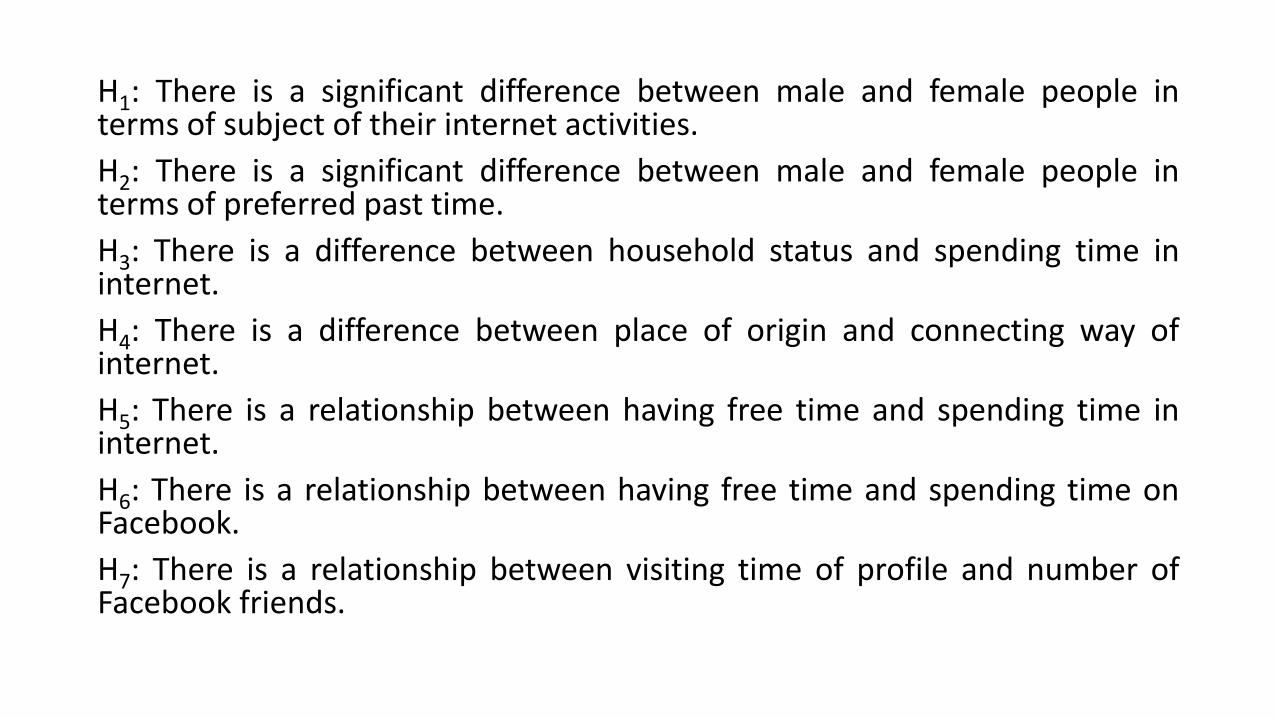
H1: There is a significant difference between male and female people interms of subject of their internet activities.
H2: There is a significant difference between male and female people interms of preferred past time.
H3: There is a difference between household status and spending time ininternet.
H4: There is a difference between place of origin and connecting way ofinternet.
H5: There is a relationship between having free time and spending time ininternet.
H6: There is a relationship between having free time and spending time onFacebook.
H7: There is a relationship between visiting time of profile and number ofFacebook friends.
Sample and Data Collection
For the above mentioned aim, a questionnaire was prepared.The questionnaire consists of two parts. In the first part there aredemographic questions like age, sex, household status and place oforigin. In the second part there are questions aiming to collect dataabout internet habits of participants and there is one scale aboutconnecting way of internet. This scale is five-point Likert (‘1: Never’, ‘5:Always’). There are also two scales about “preferred past time” and“what is the subject of your internet activity”. These scales are two-point Likert (‘1: Yes’, ‘2: No’).
The questionnaire was applied to youth people who are myfriend in Facebook and from Turkey. The questionnaire of this paperwas conducted on 84 youth people who are my friend in Facebookfrom Turkey. Data obtained from questionnaires were analyzed throughstatistical packet program (SPSS) and frequency analysis, descriptiveanalysis, crosstabs, chi-squares, correlation and ANOVA were used toreveal the aim of paper.

Analyses and Results
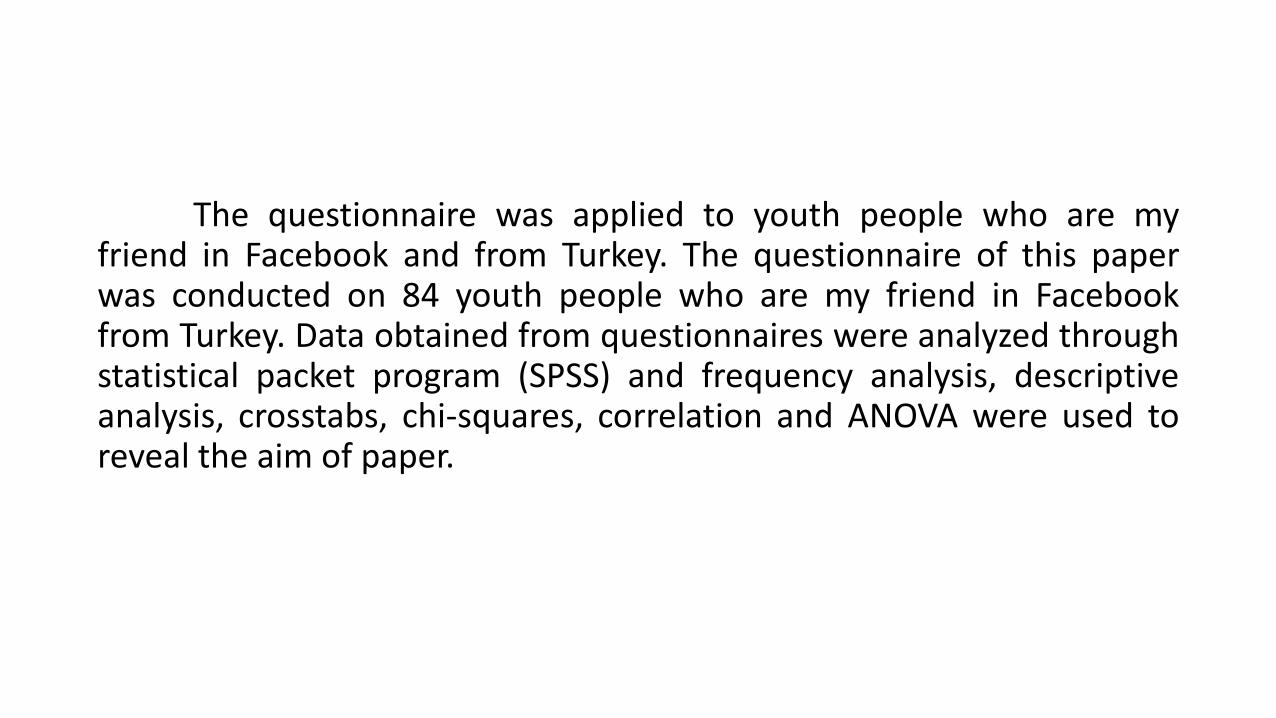
Age of Participants (%)
28,6
50,0
21,4
0.00%
10.00%
20.00%
30.00%
40.00%
50.00%
60.00%
Age
21 and Below 22-25 26 and Above
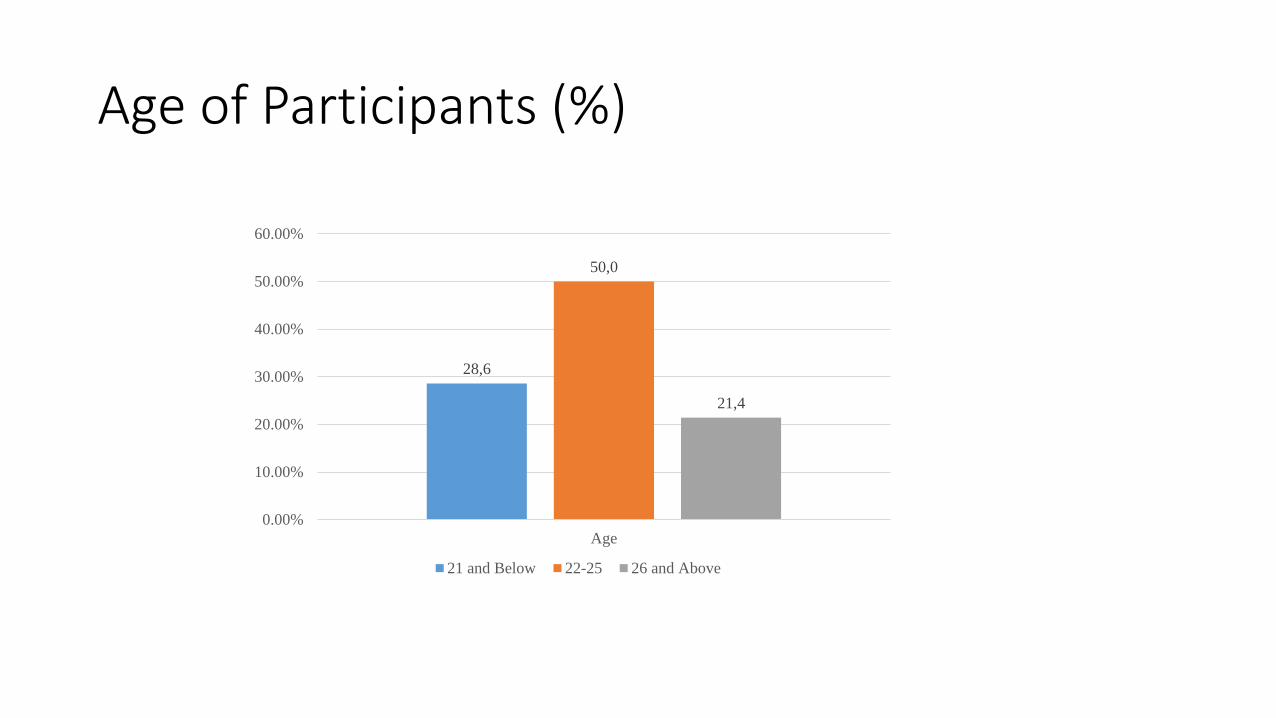
Sex of Participants (%)
57.1
42.9
0
10
20
30
40
50
60
Female Male
Sex
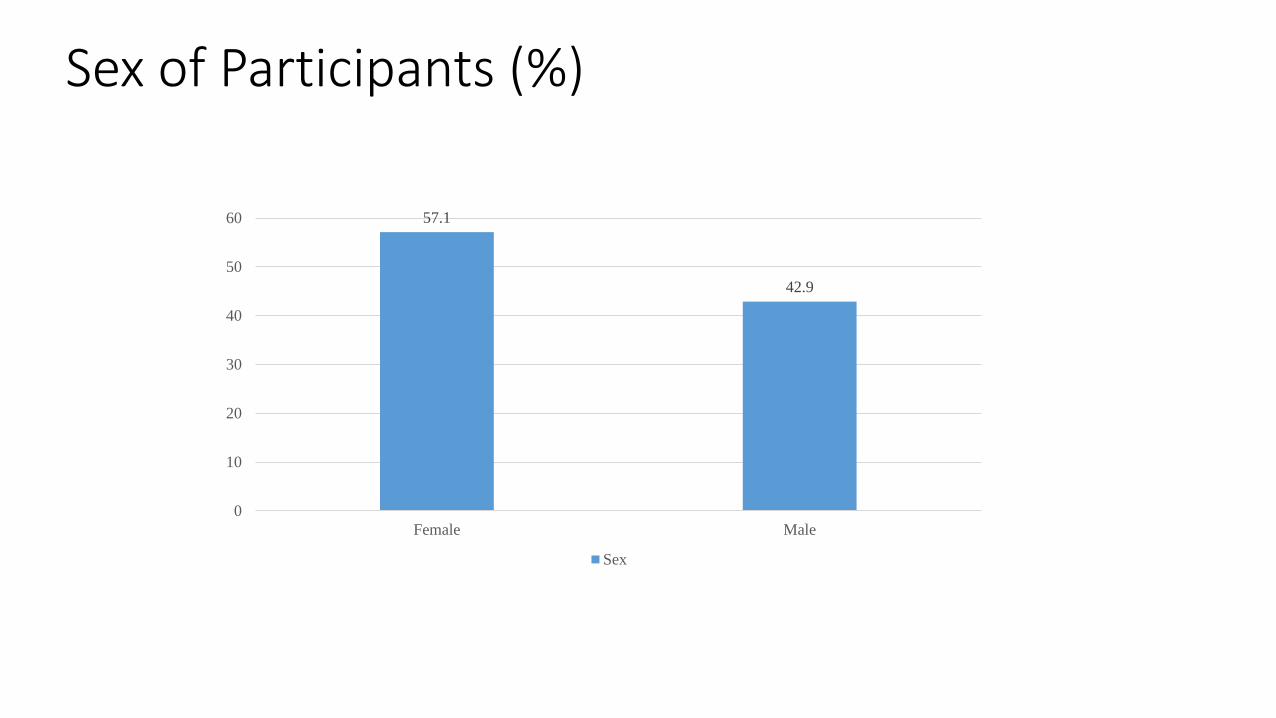
Household Status of Participants (%)
31
33.3
35.7
28
29
30
31
32
33
34
35
36
37
Household Status
Dormitory With Family Alone
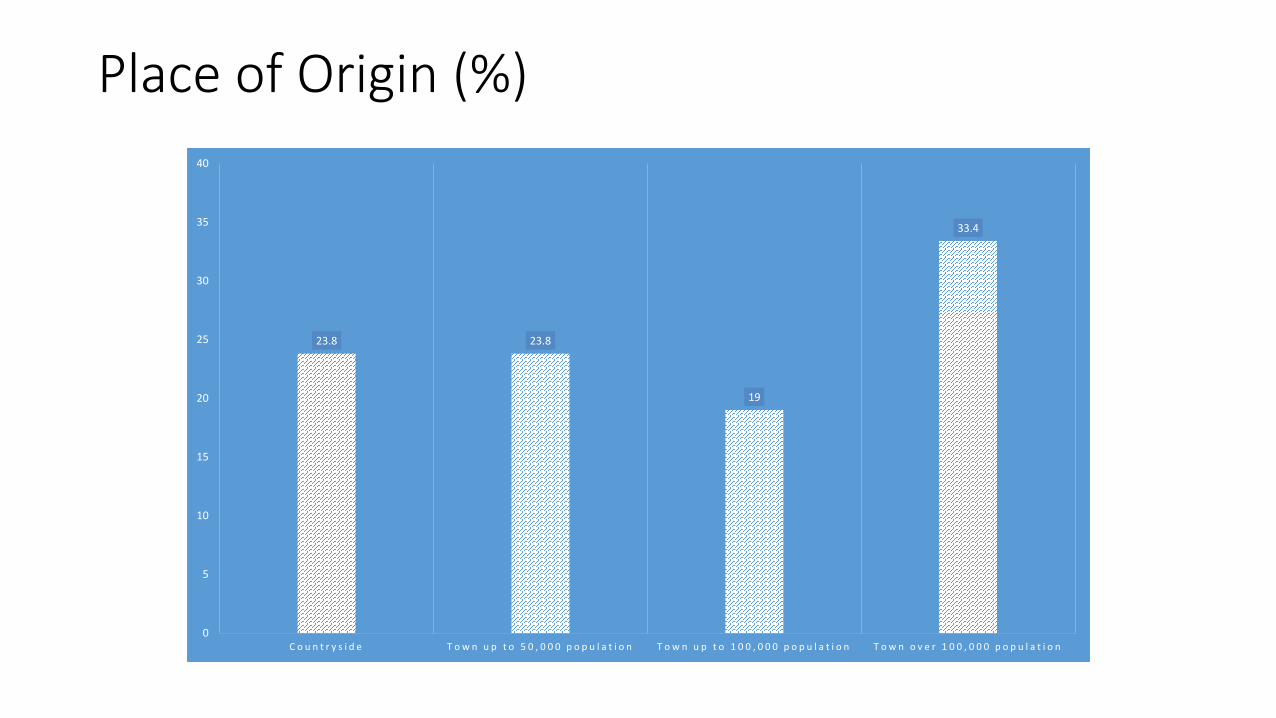
Place of Origin (%)
23.8 23.8
19
33.4
0
5
10
15
20
25
30
35
40
C o u n t r y s i d e T o w n u p t o 5 0 , 0 0 0 p o p u l a t i o n T o w n u p t o 1 0 0 , 0 0 0 p o p u l a t i o n T o w n o v e r 1 0 0 , 0 0 0 p o p u l a t i o n
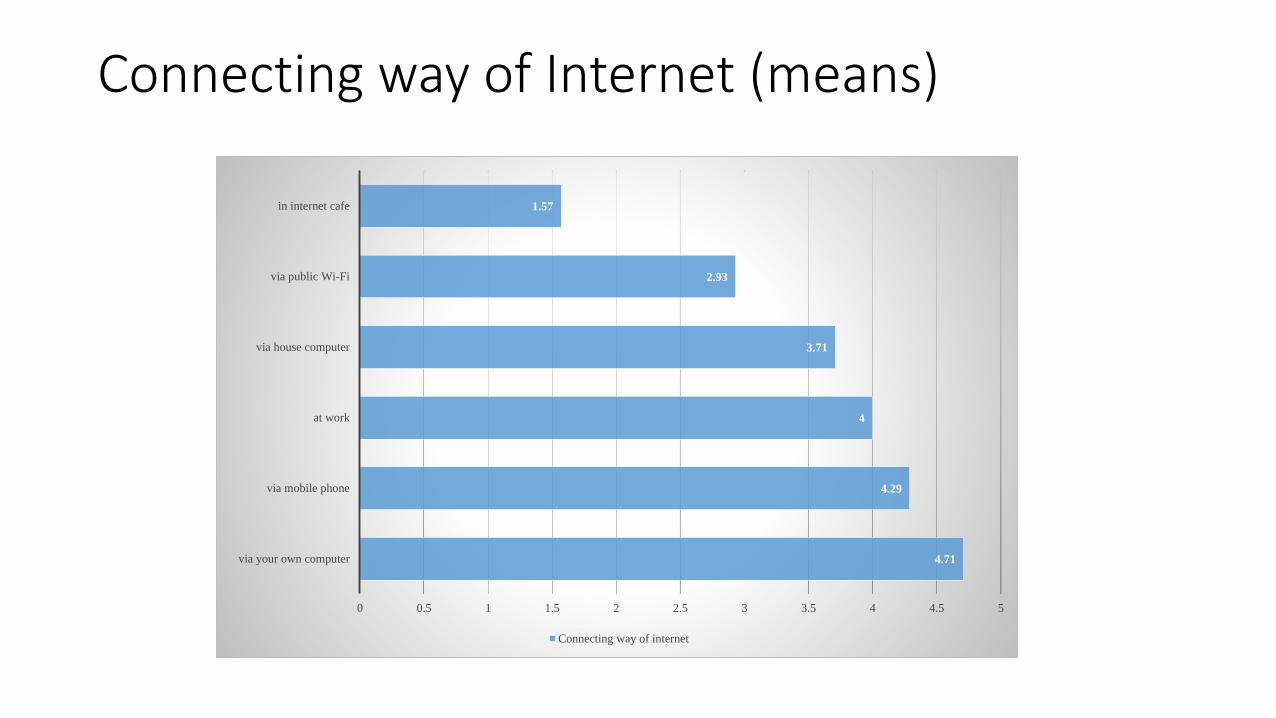
Connecting way of Internet (means)
4.71
4.29
4
3.71
2.93
1.57
0 0.5 1 1.5 2 2.5 3 3.5 4 4.5 5
via your own computer
via mobile phone
at work
via house computer
via public Wi-Fi
in internet cafe
Connecting way of internet
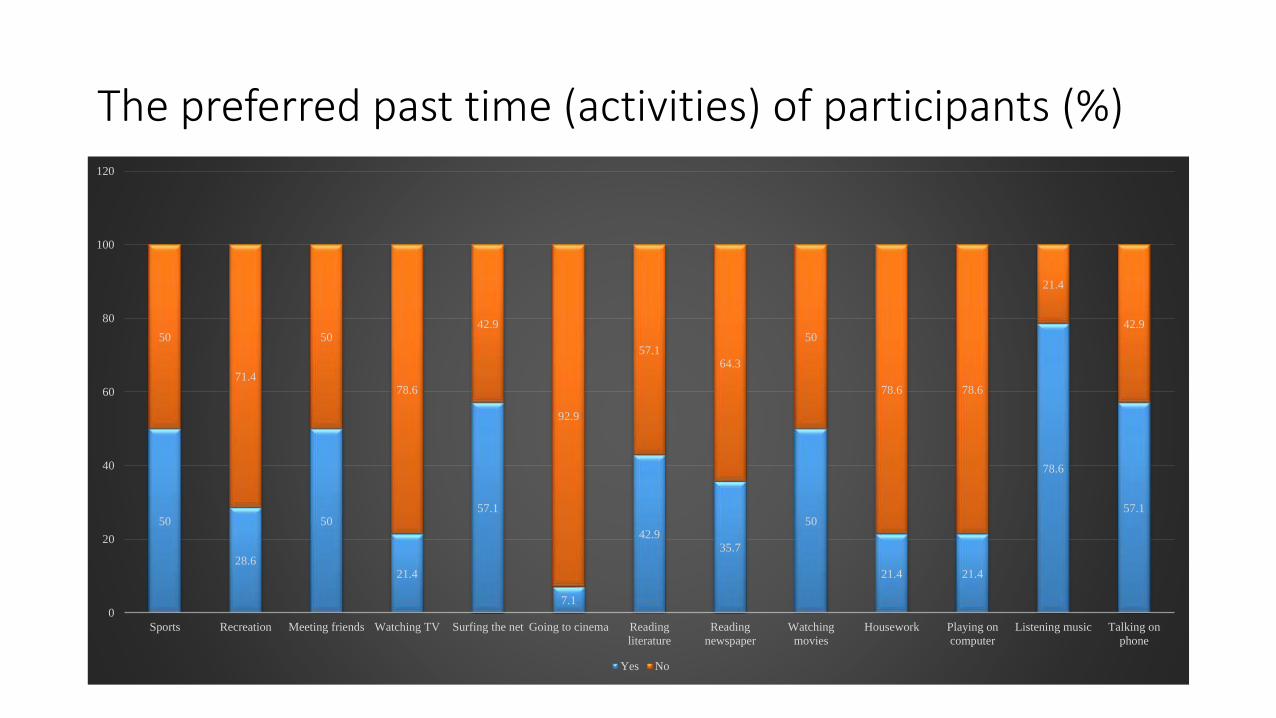
The preferred past time (activities) of participants (%)
50
28.6
50
21.4
57.1
7.1
42.935.7
50
21.4 21.4
78.6
57.1
50
71.4
50
78.6
42.9
92.9
57.164.3
50
78.6 78.6
21.4
42.9
0
20
40
60
80
100
120
Sports Recreation Meeting friends Watching TV Surfing the net Going to cinema Reading
literature
Reading
newspaper
Watching
movies
Housework Playing on
computer
Listening music Talking on
phone
Yes No
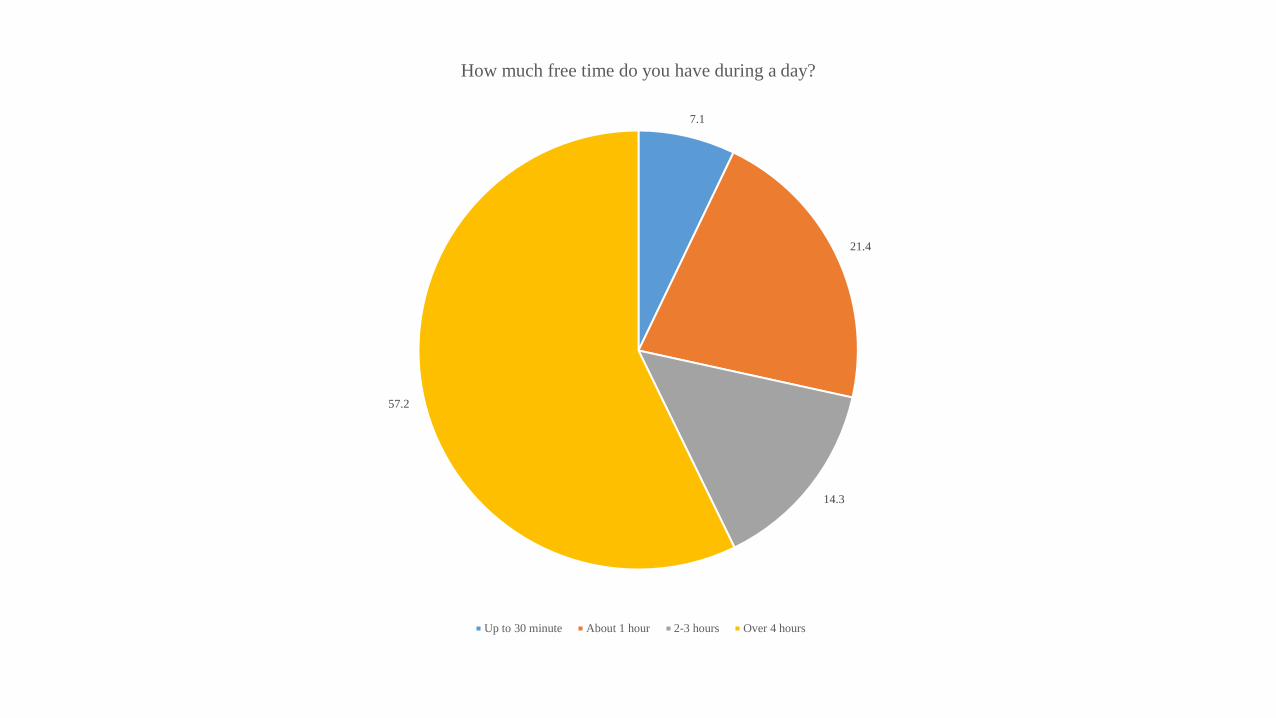
7.1
21.4
14.3
57.2
How much free time do you have during a day?
Up to 30 minute About 1 hour 2-3 hours Over 4 hours
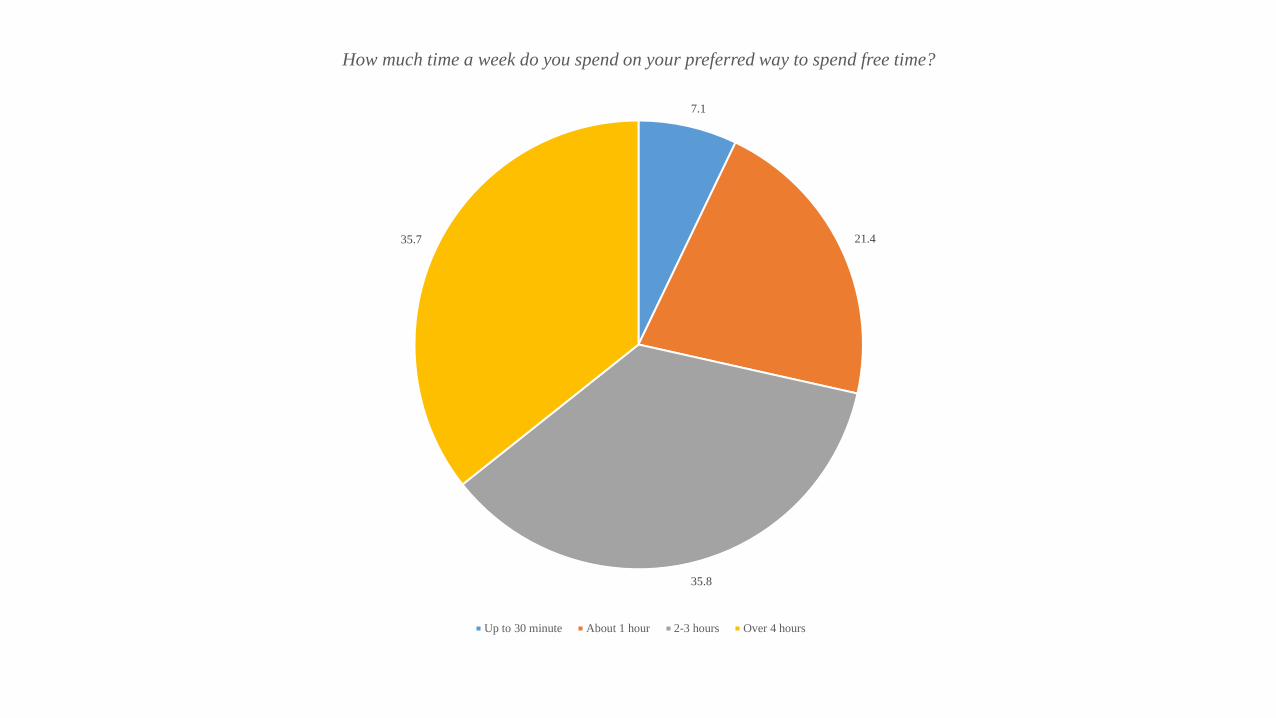
7.1
21.4
35.8
35.7
How much time a week do you spend on your preferred way to spend free time?
Up to 30 minute About 1 hour 2-3 hours Over 4 hours
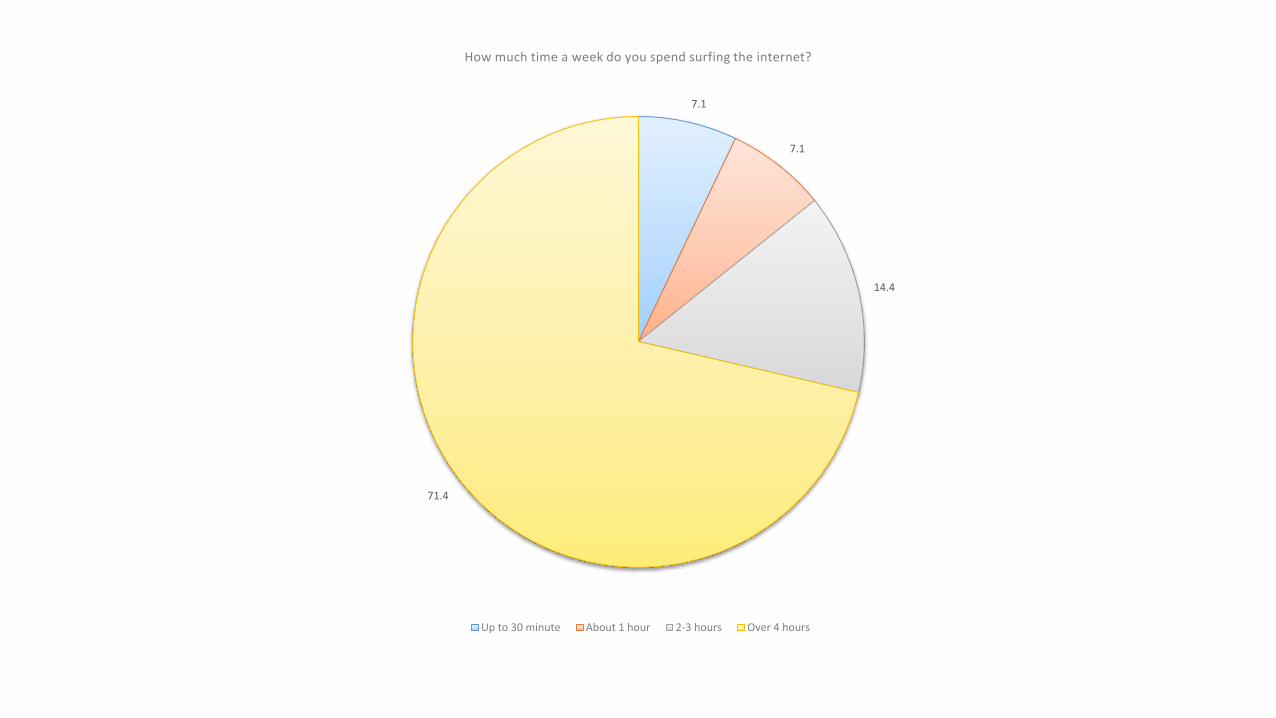
7.1
7.1
14.4
71.4
How much time a week do you spend surfing the internet?
Up to 30 minute About 1 hour 2-3 hours Over 4 hours
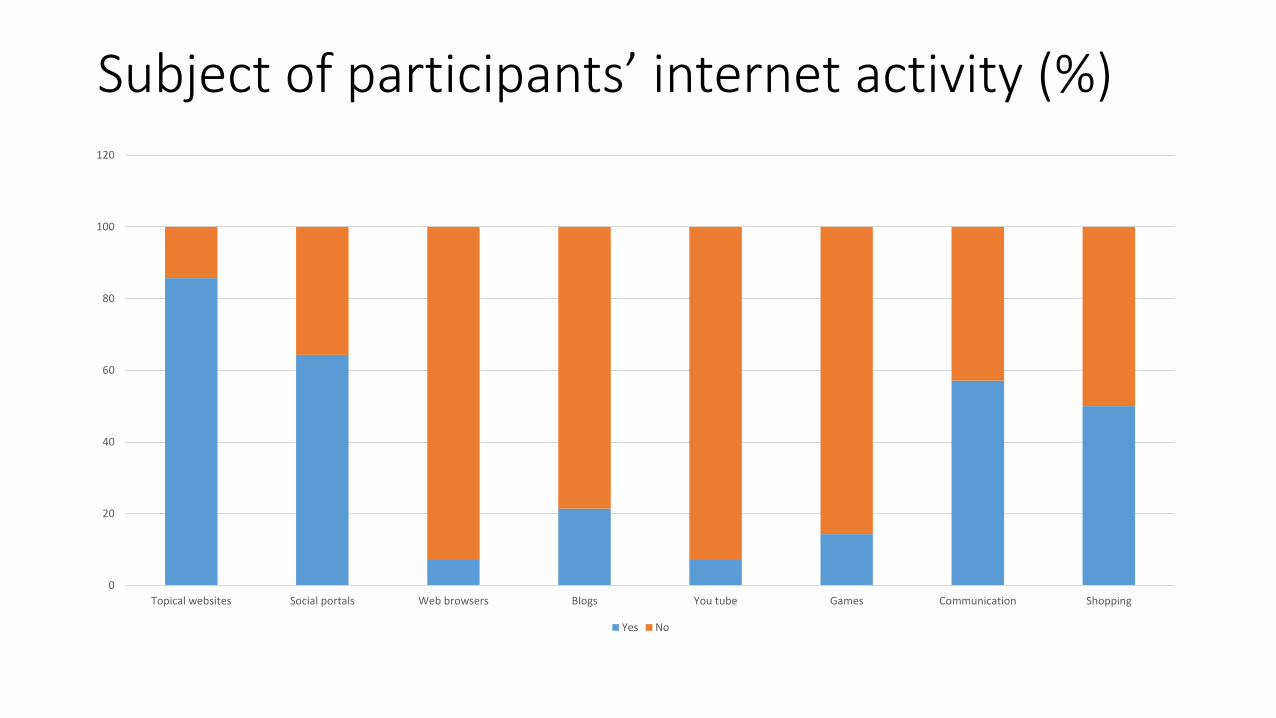
Subject of participants’ internet activity (%)
0
20
40
60
80
100
120
Topical websites Social portals Web browsers Blogs You tube Games Communication Shopping
Yes No
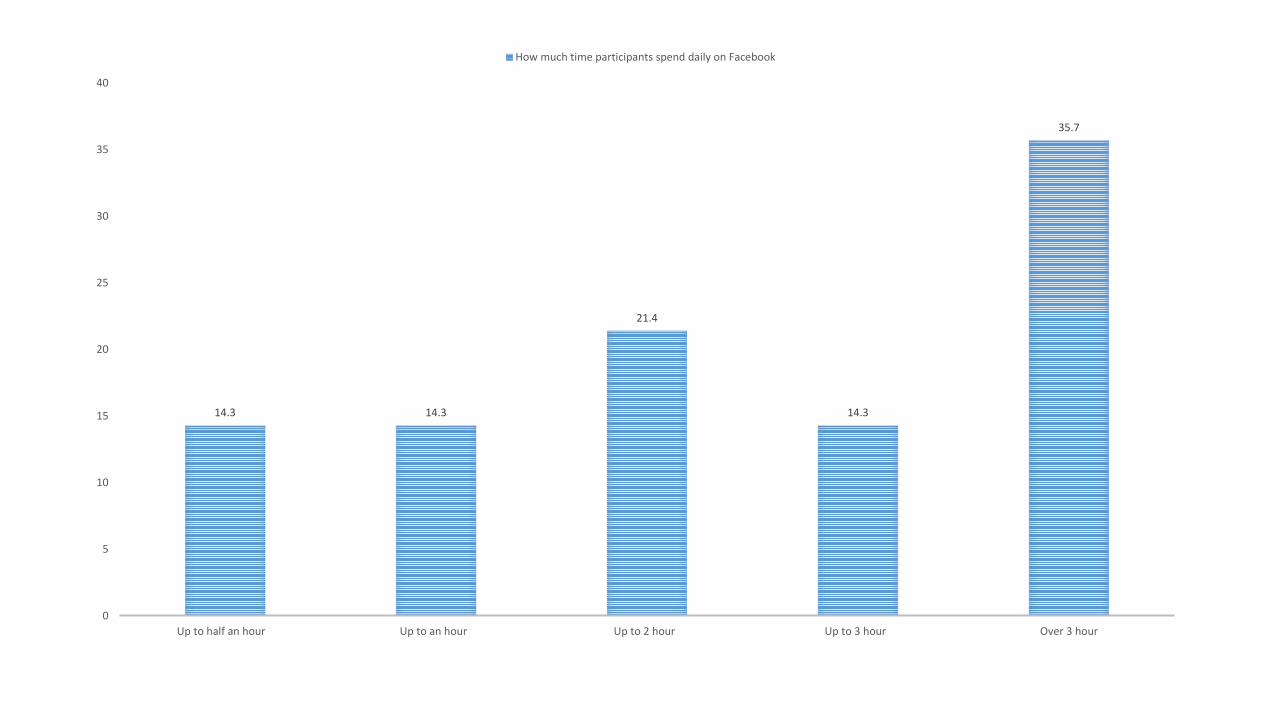
14.3 14.3
21.4
14.3
35.7
0
5
10
15
20
25
30
35
40
Up to half an hour Up to an hour Up to 2 hour Up to 3 hour Over 3 hour
How much time participants spend daily on Facebook
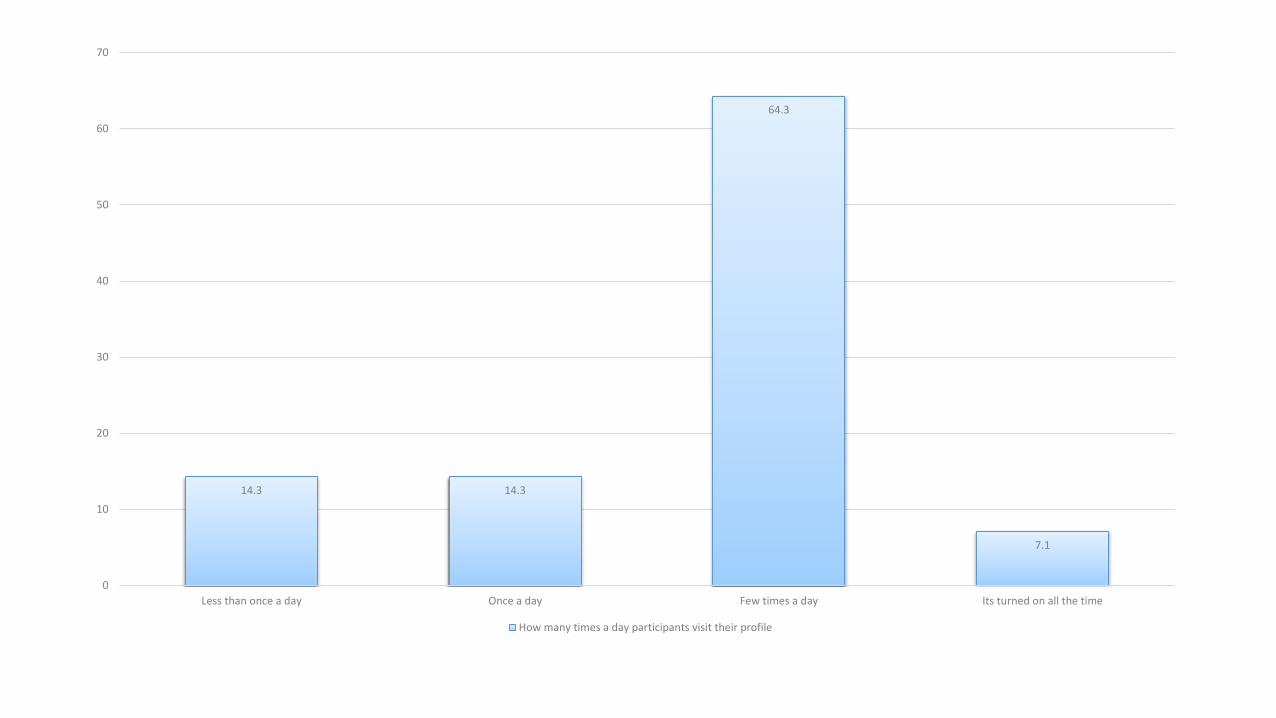
14.3 14.3
64.3
7.1
0
10
20
30
40
50
60
70
Less than once a day Once a day Few times a day Its turned on all the time
How many times a day participants visit their profile
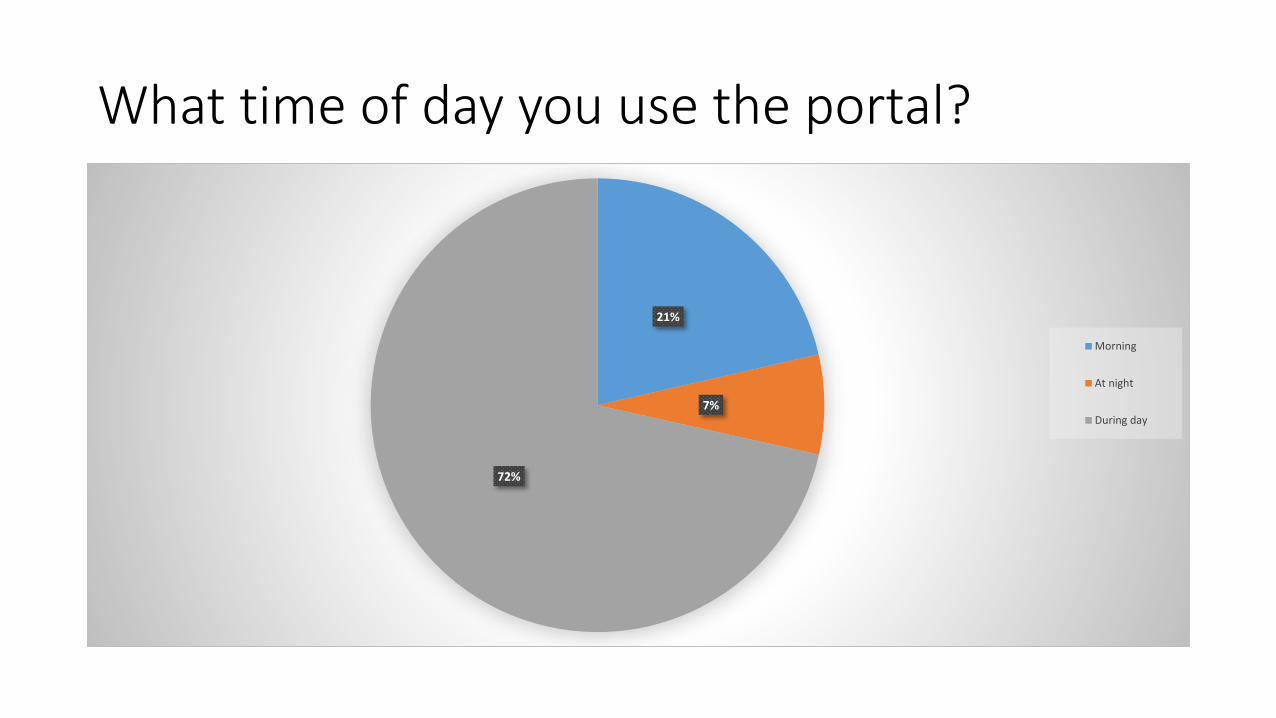
What time of day you use the portal?
21%
7%
72%
Morning
At night
During day
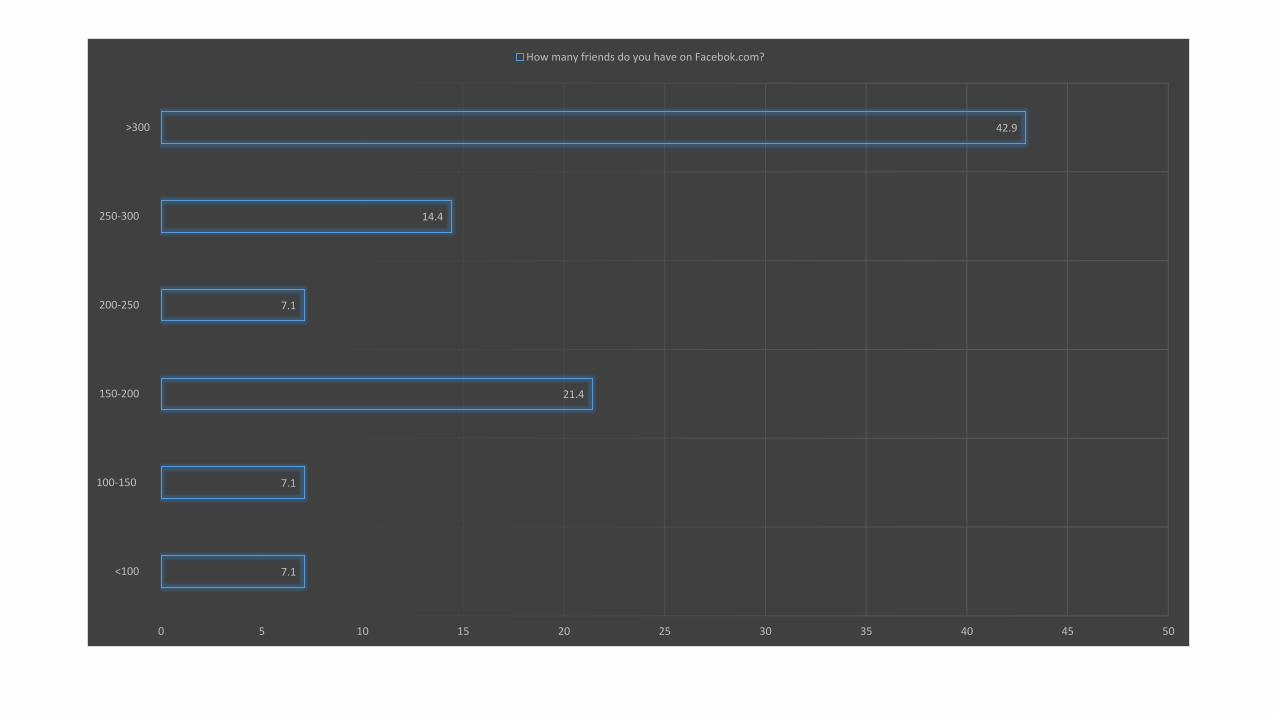
7.1
7.1
21.4
7.1
14.4
42.9
0 5 10 15 20 25 30 35 40 45 50
<100
100-150
150-200
200-250
250-300
>300
How many friends do you have on Facebok.com?
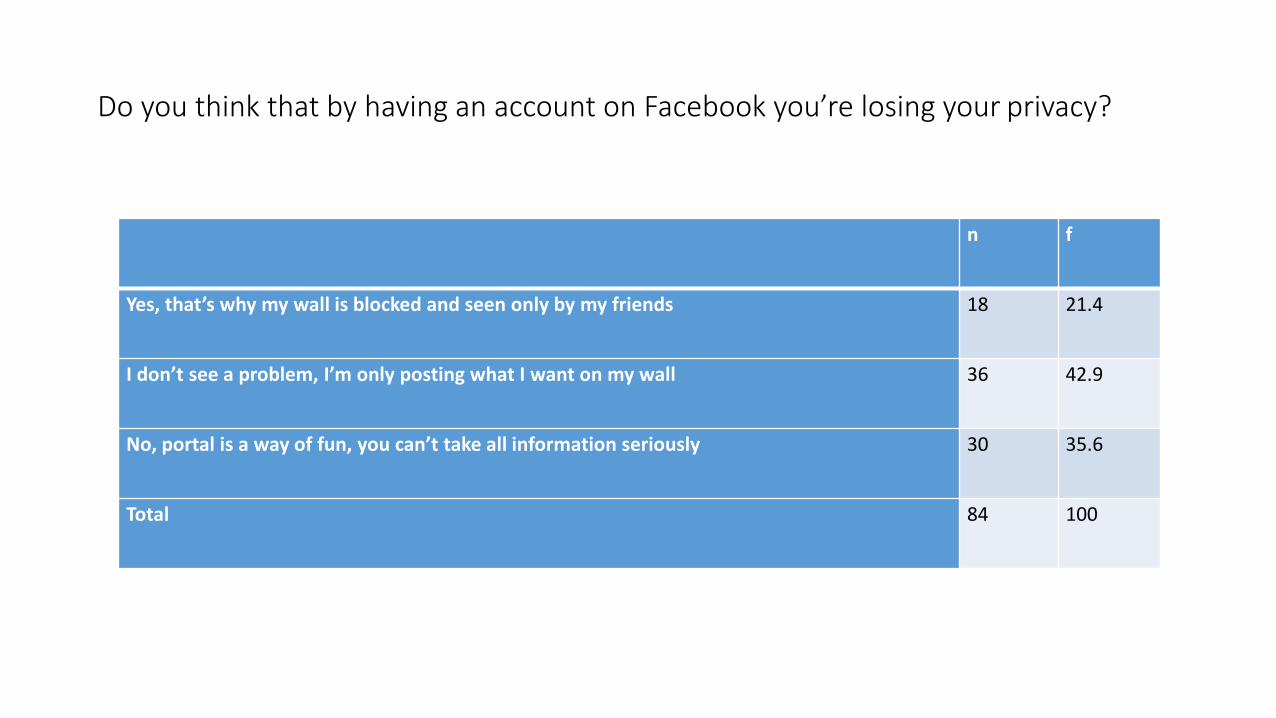
Do you think that by having an account on Facebook you’re losing your privacy?
n f
Yes, that’s why my wall is blocked and seen only by my friends 18 21.4
I don’t see a problem, I’m only posting what I want on my wall 36 42.9
No, portal is a way of fun, you can’t take all information seriously 30 35.6
Total 84 100
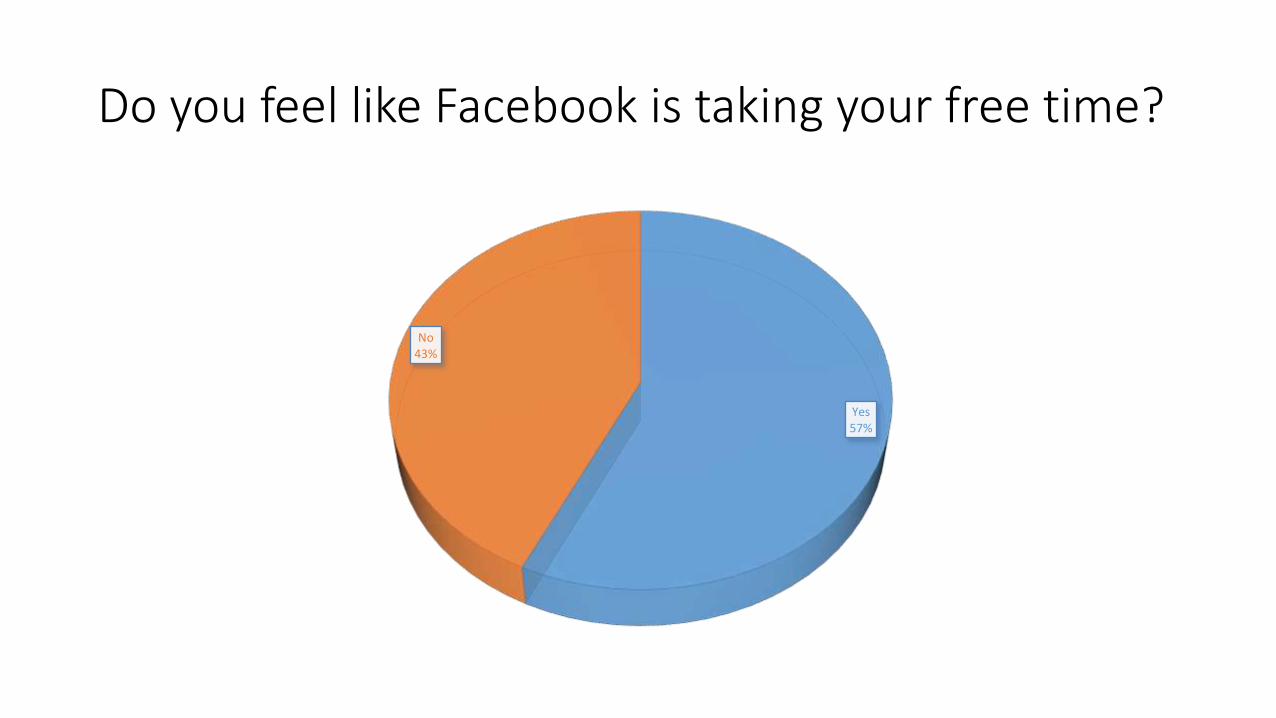
Do you feel like Facebook is taking your free time?
Yes57%
No43%
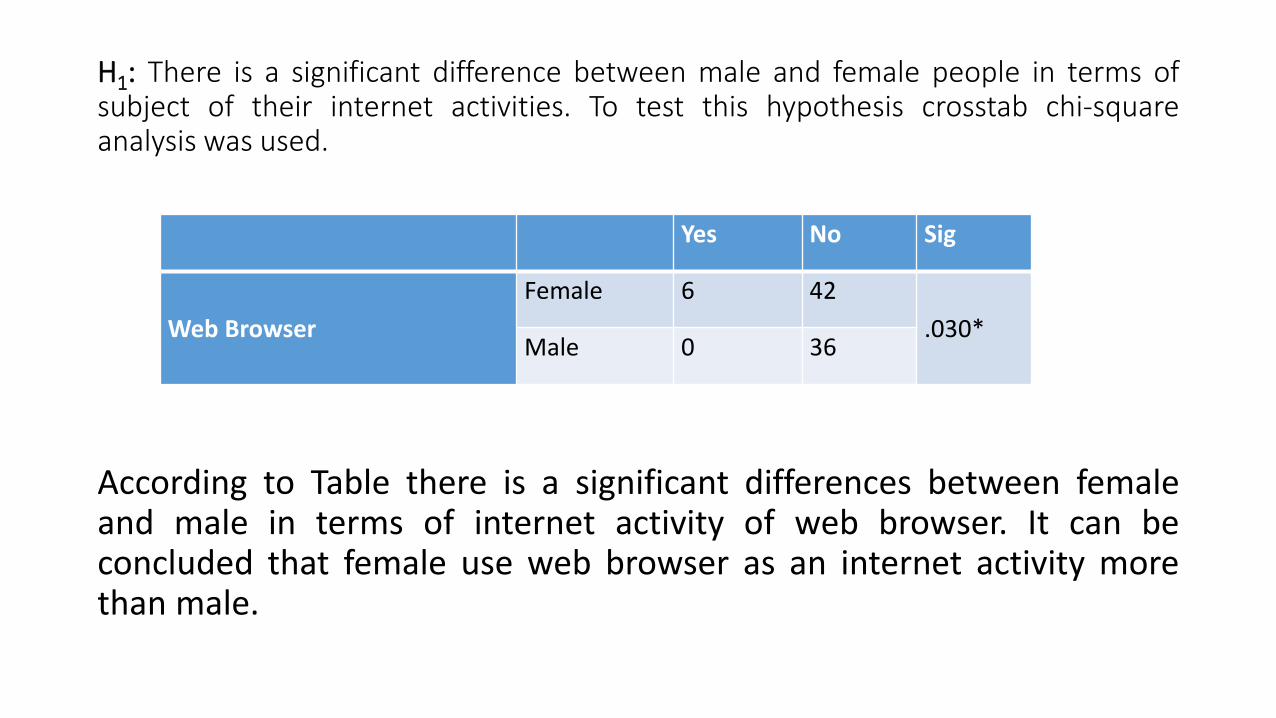
H1: There is a significant difference between male and female people in terms ofsubject of their internet activities. To test this hypothesis crosstab chi-squareanalysis was used.
According to Table there is a significant differences between femaleand male in terms of internet activity of web browser. It can beconcluded that female use web browser as an internet activity morethan male.
Yes No Sig
Web Browser
Female 6 42
.030*Male 0 36
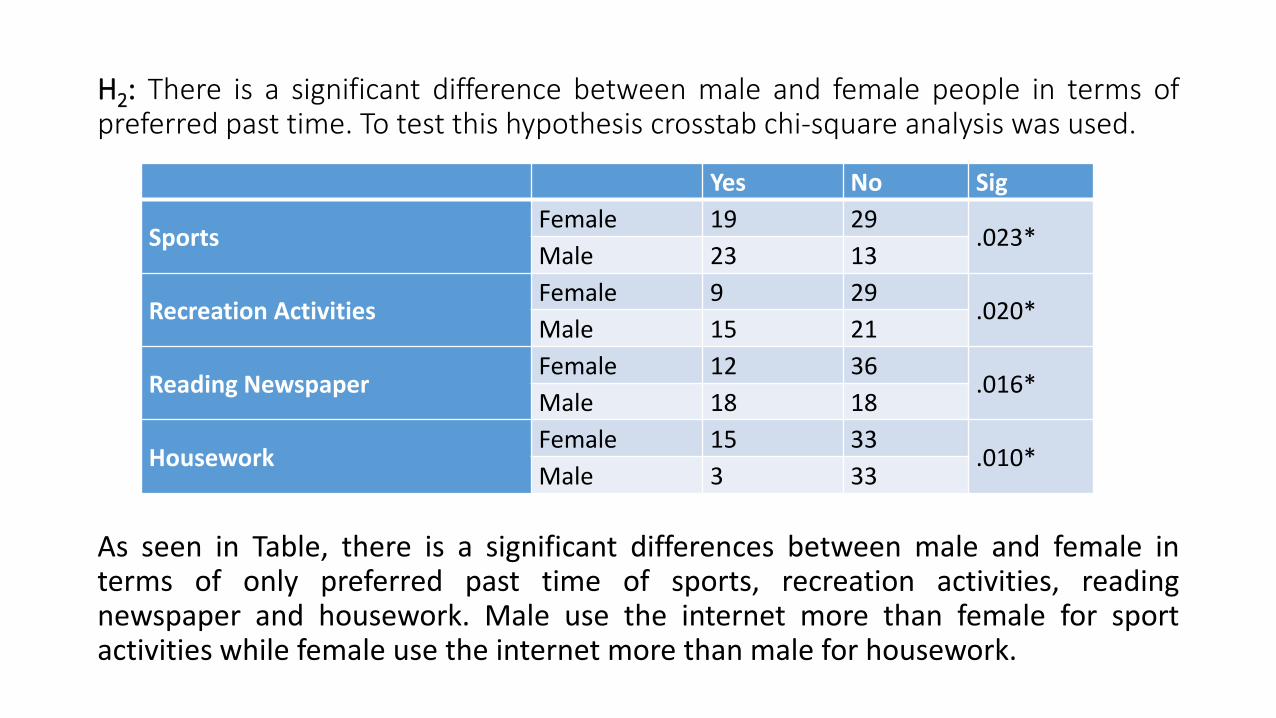
H2: There is a significant difference between male and female people in terms ofpreferred past time. To test this hypothesis crosstab chi-square analysis was used.
As seen in Table, there is a significant differences between male and female interms of only preferred past time of sports, recreation activities, readingnewspaper and housework. Male use the internet more than female for sportactivities while female use the internet more than male for housework.
Yes No Sig
SportsFemale 19 29
.023*Male 23 13
Recreation ActivitiesFemale 9 29
.020*Male 15 21
Reading NewspaperFemale 12 36
.016*Male 18 18
HouseworkFemale 15 33
.010*Male 3 33
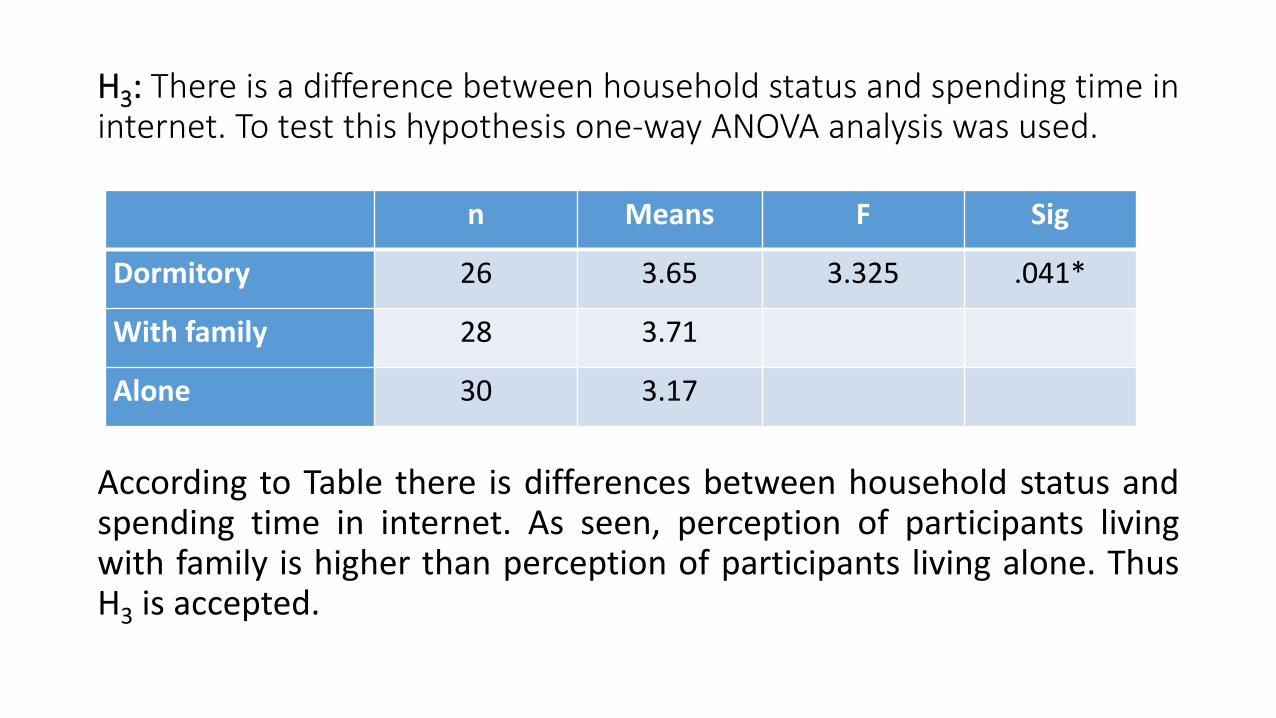
H3: There is a difference between household status and spending time ininternet. To test this hypothesis one-way ANOVA analysis was used.
According to Table there is differences between household status andspending time in internet. As seen, perception of participants livingwith family is higher than perception of participants living alone. ThusH3 is accepted.
n Means F Sig
Dormitory 26 3.65 3.325 .041*
With family 28 3.71
Alone 30 3.17
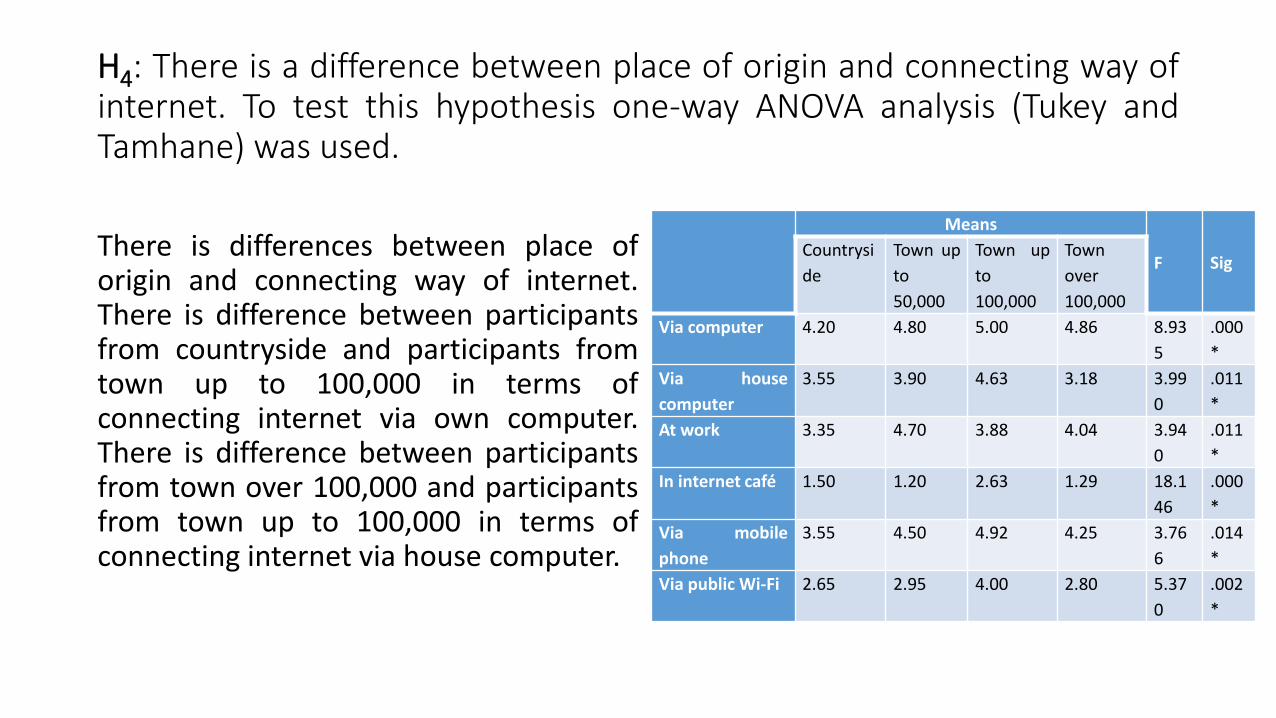
H4: There is a difference between place of origin and connecting way ofinternet. To test this hypothesis one-way ANOVA analysis (Tukey andTamhane) was used.
There is differences between place oforigin and connecting way of internet.There is difference between participantsfrom countryside and participants fromtown up to 100,000 in terms ofconnecting internet via own computer.There is difference between participantsfrom town over 100,000 and participantsfrom town up to 100,000 in terms ofconnecting internet via house computer.
Means
F SigCountrysi
de
Town up
to
50,000
Town up
to
100,000
Town
over
100,000
Via computer 4.20 4.80 5.00 4.86 8.93
5
.000
*
Via house
computer
3.55 3.90 4.63 3.18 3.99
0
.011
*
At work 3.35 4.70 3.88 4.04 3.94
0
.011
*
In internet café 1.50 1.20 2.63 1.29 18.1
46
.000
*
Via mobile
phone
3.55 4.50 4.92 4.25 3.76
6
.014
*
Via public Wi-Fi 2.65 2.95 4.00 2.80 5.37
0
.002
*
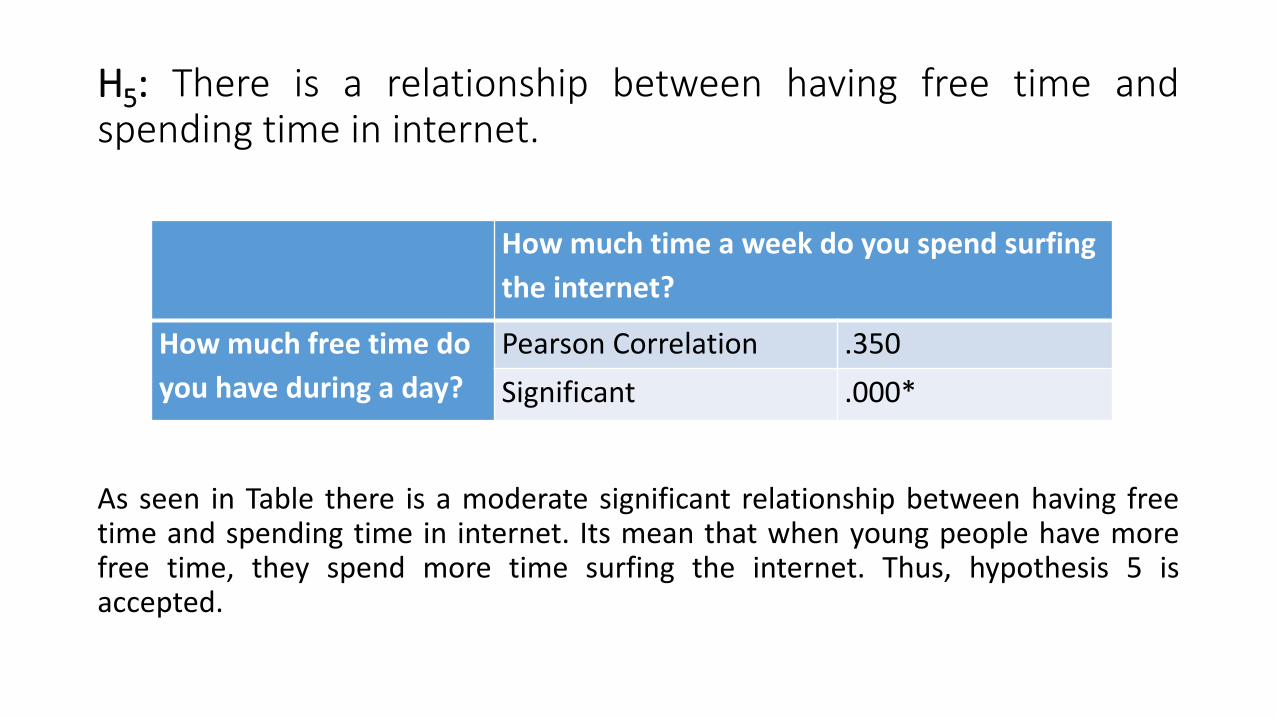
H5: There is a relationship between having free time andspending time in internet.
As seen in Table there is a moderate significant relationship between having freetime and spending time in internet. Its mean that when young people have morefree time, they spend more time surfing the internet. Thus, hypothesis 5 isaccepted.
How much time a week do you spend surfing
the internet?
How much free time do
you have during a day?
Pearson Correlation .350
Significant .000*
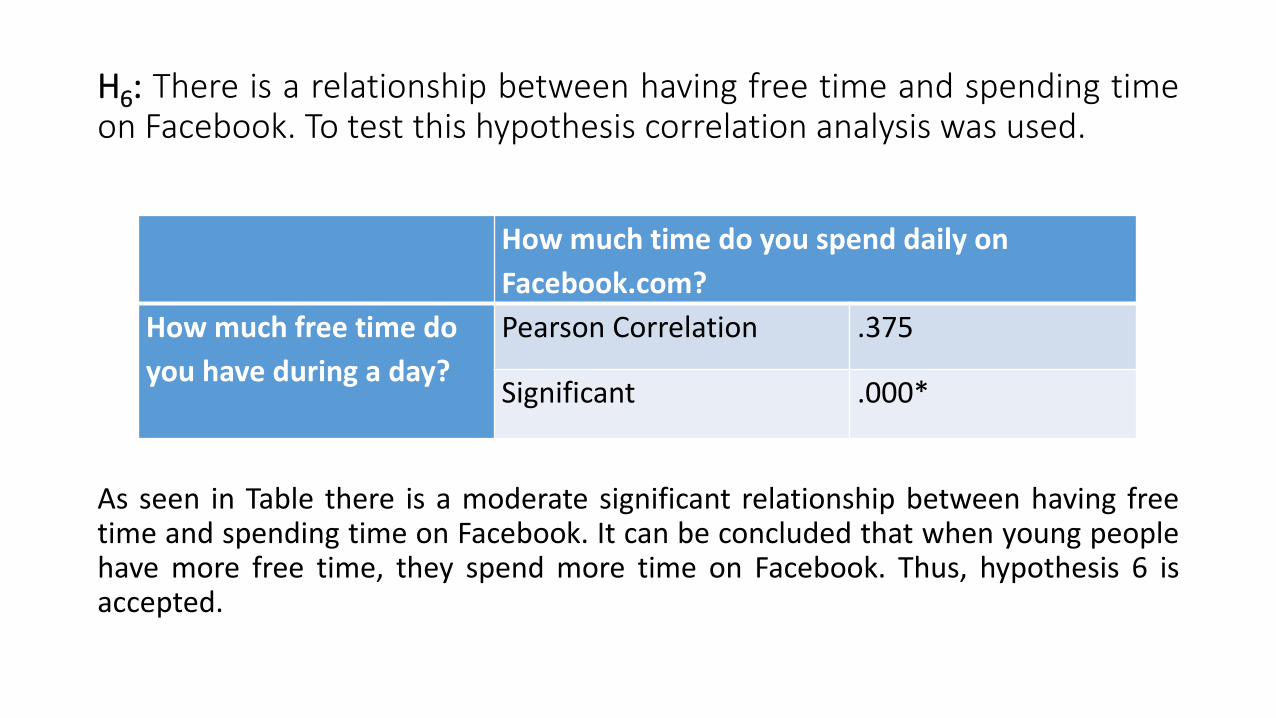
H6: There is a relationship between having free time and spending timeon Facebook. To test this hypothesis correlation analysis was used.
As seen in Table there is a moderate significant relationship between having freetime and spending time on Facebook. It can be concluded that when young peoplehave more free time, they spend more time on Facebook. Thus, hypothesis 6 isaccepted.
How much time do you spend daily on
Facebook.com?
How much free time do
you have during a day?
Pearson Correlation .375
Significant .000*
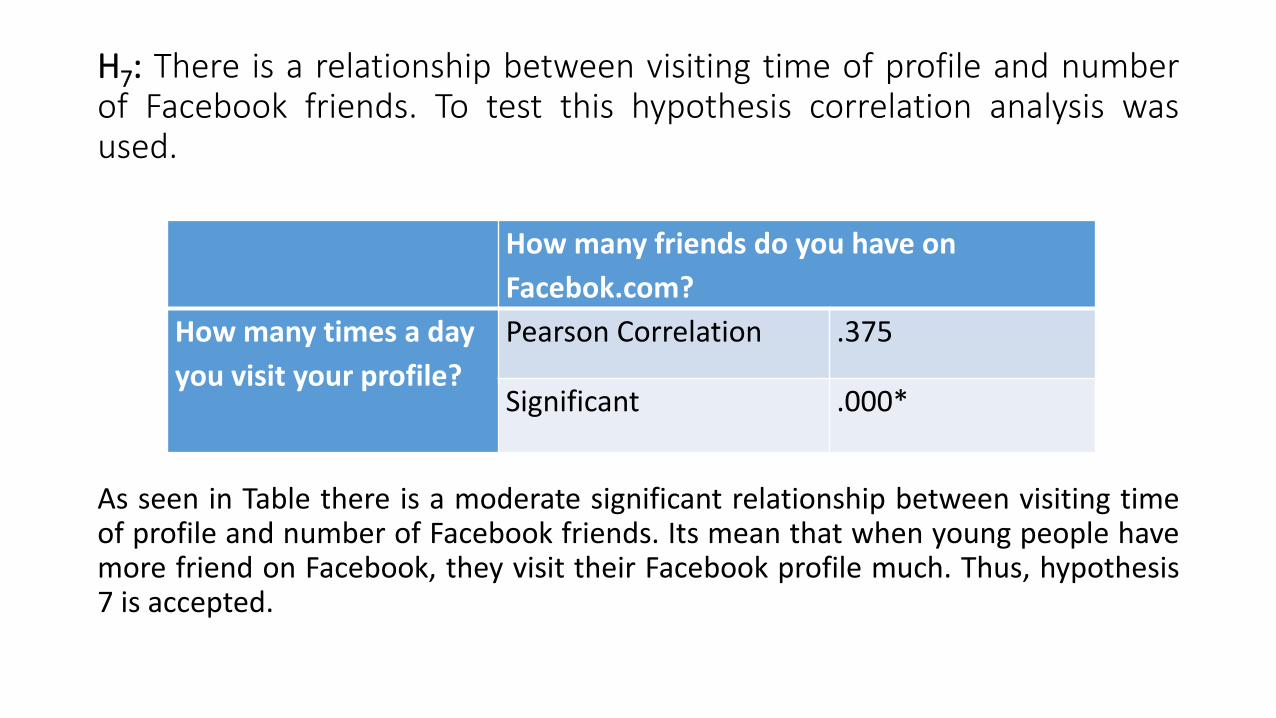
H7: There is a relationship between visiting time of profile and numberof Facebook friends. To test this hypothesis correlation analysis wasused.
As seen in Table there is a moderate significant relationship between visiting timeof profile and number of Facebook friends. Its mean that when young people havemore friend on Facebook, they visit their Facebook profile much. Thus, hypothesis7 is accepted.
How many friends do you have on
Facebok.com?
How many times a day
you visit your profile?
Pearson Correlation .375
Significant .000*