the international colour vision society the meeting …icvs05.free.fr/abstractv6.pdf · we welcome...
TRANSCRIPT

XVIIIth Symposium of the International Colour Vision Society
Dear Participants,We welcome you to the 18th Symposium of the International Colour Vision Society in Lyon at the
Palais des Congrès overlooking the Rhône River. As in past meetings, we will take the next 5 days torecount and hear recounted the latest advances in all aspects of colour vision, from genes to spectralcoding, from neurophysiology to perception, from retina to cortex, from development to evolution, fromhistory to the future, from art to application, from normal to abnormal and anything in between or beyond.We wish you all an exciting scientific meeting, full of discovery, insight and new levels of understanding.We hope also that you will have the time during this short visit to Lyon and its environs, to appreciatesome of its special qualities.
The organisers would like to thank the sponsors for their financial and material support, the teamfrom the Inserm ADR (Anne-Marie Fononi, Christiane Cambon & Hélène Brun) and the students wholoaned their time and helping hands (Cécile Bordier, Julie Petra & Romain Bouet). Also thanks to Marie-Catherine Vidal-Borderiou, Gaëlle Baton from the Office du Tourism and Valerie Duc from the Bureaudes Guides of Lyon. Finally, thanks to Christophe Colombo from the reprography of UPMF for printingthe book.
Kenneth KnoblauchDavid Alleysson
The International Colour Vision Society
President: Joel PokornyGeneral Secretary: Ken KnoblauchTreasurer and Membership Secretary: Anne KurtenbachDaltoniana Editor: Stephen Dain
The meeting is supported by:
IFNL: Institut Fédératif desNeurosciences de Lyon
INSERM: Institut Na-tional de la Santé et de laRecherche Médicale
UPMF: Université Pierre-Mendès France
CRS: Cambridge ResearchSystems
VDL:Ville de Lyon LTC: Lyon Tourisme et Con-gès
1

Contents
Friday, July 88:30 – 12:30 Directors’ Committee Meeting
9:30 Welcome desk open
14:00 Opening of the meeting
Non-classical and classical spectral coding mechanismsModerator: Barry B. Lee
1 14:15 - New developments in circadian photoreception (invited) 11H. M. Cooper
2 14:50 - Do the MC and PC pathways deliberately avoid S-cone input? 11H. Sun, B.B. Lee, H. Smithson, Q. Zaidi
3 15:10 - Temporal sensitivity of macaque ganglion cells; a reappraisal 12B.B. Lee, W. Zucchini, H. Sun
4 15:30 - Topographic (un-)coupling of S- and M-cone mosaics in felids and other mammals 12P.K. Ahnelt, E. Hernd, C. Schubert, A. Kübber-Heiss, A. Schiviz, M. Glösmann
15:50 Coffee break
Rod-cone interactionModerator: Steve L. Buck
5 16:10 - Do rods influence the hue of foveal stimuli? 13S.L. Buck, L.P. Thomas, N. Hillyer, E.M. Samuelson
6 16:30 - Foveal or extrafoveal dominance in rod hue biases? 14L.P. Thomas, S.L. Buck
7 16:50 - Scotopic color perception 14J. Pokorny, M. Lutze, D. Cao, A.J. Zele
8 17:10 - Magnocellular pathway mediates rod suppression of cone flicker detection 15D. Cao, J. Pokorny, A.J. Zele
17:30 – Presentation of the Verriest MedalIntroduction: Joel Pokorny
Verriest Medal Lecture
9 17:45 - Monge 16Professor John D. Mollon
19:00 – Reception Hotel de Ville de Lyon
2

Saturday, July 9Genetics of colour visionModerator: Jay Neitz
10 8:50 - X-Chromosome Inactivation and M/L Cone Ratios in Polymorphic New World Mon-keys and in Knock-In Mice with an M/L Opsin Gene Polymorphism 16G.H. Jacobs, G.A. Williams
11 9:10 - Topographical Maps of L and M Gene Expression in Adult Human Retinas 16M. Neitz, S.D. Balding, S.A. Sjoberg, J. Neitz
12 9:30 - Regulation of L and M Pigment Gene expression 17S.S. Deeb, Y. Lui, T. Hayashi
13 9:50 - An urn model of the development of macaque and human adult L:M cone ratios 18K. Knoblauch, M. Neitz, J. Neitz
14 10:10 - The genetics of colour deficients with unusual anomaloscope matches 18J.L. Barbur, M. Rodriguez-Carmona, K. Mancuso, J. Neitz and M. Neitz
15 10:30 - A novel mutation in the short-wavelength sensitive cone pigment gene associatedwith a tritan colour vision defect 20K.L. Gunther, J. Neitz, M. Neitz
10:50 Coffee break
Chromatic Mechanisms IModerator: Joseph Carroll
16 11:10 - Paradoxical shifts in human colour sensitivity caused by constructive and destructiveinterference between slow and fast signals from the same cone class and by the suppressionof the fast signals 20A. Stockman, E.D. Montag, D.J. Plummer
17 11:30 - Colour appearance shifts induced by different illuminants; effect of field size andadaptation time 21I.J. Murray, A. Daugirdiene, H. Vaitkecicius, J.J. Kulikowski, R. Stanikunas
18 11:50 - Color adaptation contingent on eye saccades 21A. Bompas, J. K. O’Regan
19 12:10 - The gap effect in the parafovea 22M.V. Danilova, J.D. Mollon
12:30 Lunch
3

TestingModerator: Françoise Viénot
20 14:00 - Is it possible to derive the maximum wavelength of M and L photo pigments usingmultiple-Rayleigh matches? 22F. Viénot, L. Serreault
21 14:20 - Illuminant and observer metamerism in colour vision tests 24S.J. Dain
22 14:40 - The colour discrimination limits of "normal" trichromats - newmethod for detectionand classification of minimal deficiencies 24M. Rodriguez-Carmona, J.A. Harlow, J.L. Barbur
23 15:00 - An innovative instrument for the psychophysical measurement of Macular PigmentOptical Density using a CRT display 25P. West, J. Mellerio
24 15:20 - Light scattering effect on contrast sensitivity of different colour Gabor gratings 26G. Ikaunieks, M. Colomb, M. Ozolinsh, G. Krumina
15:40 - Coffee break
16:00 - 16:50 Poster Session I
Chromatic Mechanisms IIModerator: Hannah Smithson
25 17:00 - Colour space mapped by the reverse Stroop effect 26H. Smithson, S. Khan, L.T. Sharpe, A. Stockman
26 17:20 - Normal and dichromatic colour discrimination measured from transient isoluminatvecps 27L.C.L. Silveira, B.D. Gomes, G.S. Souza, C.A. Saito, M. da Silva Filho
27 17:40 - Chromatic vision as a general strategy of colour processing in man and animals 27M. Vorobyev
28 18:00 - Naturalistic Color Discriminations in New World Monkeys Having Different Com-binations of M/L Pigments: Effects of Luminance and Viewing Time 28M.P. Rowe, G.H. Jacobs
29 18:20 - Determinants of chromatic contrast detection in inferred parvocellular pathways 28A.J. Zele, V.C. Smith, J. Pokorny
4

Sunday, July 10Cortical colour computationModerator: Ken Knoblauch
30 9:00 - Surface color perception in three-dimensional scenes with non-uniform spatial andspectral distribution of illumination: Estimating, representing and discounting the illumi-nant (invited) 29L.T. Maloney, K. Doerschner, H. Boyaci
31 9:35 - Cortical computations involving color, orientation and 3D shape (invited) 30Q. Zaidi, A. Li
32 10:10 - Cortical areas involved in the global integration of local color differences evokingcolor transparency 30R. Bouet, M. Dojat, L. Lamalle, C. Segebarth, K. Knoblauch
10:30 - Coffee break
Cortical colour computation (continued)Moderator: Hao Sun
33 10:50 - The perceptual structure of color corresponds to singularities in reflection properties 31D. Philipona, J.K. O’Regan
34 11:10 - Colour constancy is a function of the velocity of a moving surface 31A. Werner
35 11:30 - Color Appearance of Natural Objects 32T. Hansen, S. Walter, K.R. Gegenfurtner
36 11:50 - Illuminant-independent judgements of surface colour in natural scenes 33K. Amano, D.H. Foster, S.M.C. Nascimento
37 12:10 - Color Vision in Flatland: a Model of the Retinal and Cortical Circuitry for CodingColor Computer Implemented for a One-Dimensional Cone Array 33J. Neitz, J. Kuchenbecker, M. Neitz
12:30 - Lunch
13:30 - 23:00 Cultural visit and dinner
5

Monday, July 11Colour AppearanceModerator: Jack S. Werner
38 8:50 - Color shifts induced by S-cone patterns: Spatial structure at the S-cone or postrecep-toral level? 34S.K. Shevell, P. Monnier
39 9:10 - The discoloration illusion 35B. Pinna
40 9:30 - Temporal nulling of induction from spatial patterns modulated in time 36F. Autrusseau, S. K. Shevell
41 9:50 - Induced Steady Color Shifts from Temporally Varying Surrounds 36A.D. D’Antona, S.K. Shevell
42 10:10 - Effects of Motion and Configural Complexity on Color Transparency Perception 37P. Gerardin, P. Roud, S. Süsstrunk, K. Knoblauch
10:30 - Coffee Break
Colour Appearance (continued)Moderator: Steven K. Shevell
43 10:50 - Maximal and minimal hue shifts in the near periphery: is there a link with ambigu-ous and unambiguous (unique) hues? 38N.R.A. Parry, D.J. McKeefry, I.J. Murray
44 11:10 - Colour stimuli perception in presence of light scattering 38M. Ozolinsh, M. Colomb, G. Ikaunieks and V. Karitans
45 11:30 - Resolution of binocular color rivalry: Perceptual misbinding of color and form 39S.W. Hong, S.K. Shevell
46 11:50 - A whiter shade of pale, a blacker shade of dark: Parameters of spatially inducedblackness 40D.L. Bimler, G.V. Paramei, Ch.A. Izmailov
47 12:10 - Remote Induction Effects in Achromatic Color Perception and Their Modulation byLocal Contrast 40M.E. Rudd
12:30 - Lunch Break
6

Acquired DeficienciesModerator: John L. Barbur
48 14:00 - The influence of circulating glucose and oxygen concentrations on cone and rodsensitivity in IDDM diabetics and normal subjects 41A. Kurtenbach, H. Mayser, E. Zrenner
49 14:20 - Color vision in male and female asymptomatic carriers of LHON‘s 11778 mtDNAmutation 42D.F. Ventura, M. Gualtieri, A.G.F. Oliveira, M.F. Costa, P. Quiros, V. Carelli, A. Berezovsky, S.R.
Salomão, A.A. Sadun
50 14:40 - Color discrimination in long term type 1 diabetes mellitus. 42A. Serra, I. Zucca, E.R. Salaris, M. Fossarello
51 15:00 - Functional specialisation for the processing of colour categories in the cortex–evidencefrom clinical studies 43F.G. Veit, G. Plant, J.L. Barbur
15:20 Coffee break
52 15:40 - Clinical color vision tests, Practical tasks and Discriminant analysis 44S. Ramaswamy, J.K. Hovis
53 16:00 - Visual acuity with isoluminant coloured stimuli for amblyopic eye and defocused eye 44G. Krumina, G. Ikaunieks, M. Ozolinsh
16:20 - 17:40 Poster Session II
17:45 - 18:20 Business Meeting
19:30 Banquet: Le Pavillon du Parc - Parc de la tête d’or
7

Tuesday, July 12Natural and artificial colour visionModerator: David Alleysson
54 9:00 - Irregular sampling and photoreceptor non-linearity can "make sense" for color per-ception (invited) 45J. Hérault
55 9:35 - Non linear and uniform filtering for estimating spatial information in the cone mosaic 45D. Alleysson, B. Chaix, J. Hérault
56 9:55 - Theoretical limits of cone-excitation ratios 46A.D. Logvinenko
57 10:15 - Macular Pigment: Nature’s Notch Filter III 46J.D. Moreland, S. Westland
10:35 - Coffee break
58 10:55 - Anomalous trichromats’ judgements of surface colour in natural scenes under dif-ferent daylights 47R.C. Baraas, D.H. Foster, K. Amano, and S.M.C. Nascimento
59 11:15 - Local surface-colour matching in natural scenes correlated with global variance incone-excitation ratios 47D.H. Foster, K. Amano, S.M.C. Nascimento
60 11:35 - Spatial and temporal distributions of illumination in natural scenes 48S.M. Nascimento, D.H. Foster, K. Amano
12:00 Closing of the meeting
8

Posters
61 Repetition (dis)advantage: Does color-opponency count? 50L.H.M. do Canto-Pereira, G.V. Paramei, E. Morya, R.D. Ranvaud
62 Color and brightness perception in the Watercolor and the Craik-O‘Brien-Cornsweet ef-fects 50F.D. Devinck, P.B. Delahunt, J.L. Hardy, L. Spillmann, J.S. Werner
63 Visual evoked potentials to chromatic stimuli in schoolchildren 51M.T. Pompe, B.S. Kranjc, J. Brecelj
64 Evidence for global integration of local color differences in the ventral parahippocampicgyrus 51M. Dojat, L. Piettre, C. Delon-Martin, M. Pachot-Clouard, C. Segebarth, K. Knoblauch
65 Retinal microscotomas revealed with adaptive-optics microflashes 52J. Carroll, J. Lin, J.I. Wolfing, N. Christie, D.R. Williams, W. Makous
66 Multidimensional Scaling reveals a colour dimension unique to deuteranomaly 53J.M. Bosten, J.D. Robinson, G. Jordan, J.D. Mollon
67 Designing a colour discrimination test to assess colour rendering of LED sources 53E. Mahler, J.-J. Ezrati, F. Viénot
68 Linear Dichromacy 54H. Scheibner, S. Cleveland
69 An Adaptation of the Cambridge Colour Test for use with Animals 54K. Mancuso, J. Neitz, M. Neitz
70 Color-vision loss in patients with diabetes mellitus: A novel diagnostic approach 55C.F. Santana, N.N. Oiwa, G.V. Paramei, D. Bimler, M.F. Costa, M. Lago, C. Perina, M. Bernick, M.
Nishi, D.F. Ventura
71 Changes in spatial extent and peak double density of human macular pigment with age 56A.M.G. Baptista, S.M.C. Nascimento, D.H. Foster
72 Colour naming and colour categorisation in case of inherited colour deficiencies 56V. Bonnardel
73 Red-green color vision loss in Duchenne Muscular Dystrophy 57M.F. da Costa, C.F. Santana, A.G.F. de Oliveira, M. Lago, L.C.L. Silveira, M. Zatz, D.F. Ventura
74 Electrophysiological Analysis of Chromatic Opponency in the Retina of Turtle (Pseudemysscripta elegants) with Tetrachromatic Stimulus 58F. Rocha, C. Saito, J.M. de Souza, L.C.L. Silveira, D.F. Ventura
75 Sensitivity to color errors in images of natural scenes 58M.A. Aldaba, J.M.M. Linhares, P.D. Pinto, S.M.C. Nascimento, K. Amano, D.H. Foster
9
76 Psychophysical estimation of the best illumination for appreciation of artistic paintings 59P.D. Pinto, J.M.M. Linhares, J.A. Carvalhal, S.M.C. Nascimento
77 Normal L:M cone ratio variations and the acuity of color vision 59M. Mauck, J. Levin, J. Neitz, M. Neitz
78 Acquired color vision defects and saturation 60M.L.F. de Mattiello, N. Martino
79 Magnocellular and parvocellular involvement in vernier acuity 61M.J.H. Puts, J. Pokorny, V.C. Smith
80 A unique dichromatic color-vision defect with a novel form of the single L-cone/M-conevisual pigment gene 61T. Hayashi, A. Kubo, T. Takeuchi, T. Gekka, S. Goto-Omoto, K. Kitahara
81 Low frequency of CNGA3 mutations in Japanese patients with congenital achromatopsia 62S. Goto-Omoto, T. Hayashi, T. Gekka, T. Takeuchi, A. Kubo, K. Kitahara
82 The influence of test distance on the CN Lantern Test 62J.K. Hovis, S. Ramaswamy
83 Color changes in a 50 year old AO HRR color vision test 63D. Lee
84 Achromatic parvocellular contrast gain in normal and color defective observers: Implica-tions for the evolution of color vision 64M. Lutze, J. Pokorny
85 Macular Pigment: Nature’s Notch Filter II 65S. Westland, J.D. Moreland
86 The Macular Assessment Profile (MAP) test - a new VDU based technique for measuringthe spatial distribution of the macular pigment 65J.A .Harlow, J.L. Barbur, M. Rodriguez-Carmona, A.G. Robson, J.D. Moreland
87 The effect of macular pigment density on yellow-blue and red-green colour discriminationthresholds and other measures of visual performance 66J.K. Kvansakul, M. Rodriguez-Carmona, J.A. Harlow, J.L. Barbur
88 Absence of Magnocellular and Parvocellular Deficits in Schizophrenia 67S. Delord, M.G. Ducato, S. Thime, D. Pins, P. Thomas, K. Knoblauch, M. Boucart
Exhibitors 68
89 "De Visu" software 68F. Tilquin and F. Jauzein
90 Cambridge Research Systems 68
10

1 14:15 - New developments in circadian photoreception (invited)
H. M. CooperInserm U371 Cerveau et Vision, Department of Chronobiology, Chronobiology Platform, IFR19, UCB-Lyon1, IFNL, 18 avenue du Doyen Jean Lépine 69500 Bron, France
In mammals, a palette of non-image forming visual functions including circadian photoentrainment,pupillary light reflex and direct effects of light on behavior (masking) are mediated by the photic infor-mation transmitted from the retina. Early studies on the architecture of retinal projections to the suprachi-asmatic nucleus (SCN), the response properties of photic integration by the circadian timing system, andstudies in blind animals and humans had suggested that novel - non-rod and non-cone retinal photore-ceptors were involved in photic irradiance detection processes. Recent studies have demonstrated that asub-class of retinal ganglion cells that express the photopigment melanopsin are intrinsically photosensi-tive. Melanopsin, originally cloned from amphibian melanophores, is a bireactive photopigment and hasboth an intrinsic photo-isomerase activity and can act as a photosensory opsin using 11-cis retinaldehydeas a chromophore. Studies in different mammals have demonstrated that the peak of sensitivity is locatedin the blue-green region of the spectrum ( 480 nm). In rodents that lack all photoreceptors (rods, conesand melanopsin) circadian photoentrainment and pupillary reflexes are completely absent demonstratingthat only these photopigments are implicated in irradiance detection responses. In animal models thatconserve at least one of the photopigments, responses to light are altered but not abolished, suggestingthat either these photoreceptor systems are redundant or play complementary roles. Ongoing studies inour laboratory on rodents and humans using electrophysiology, pupillary responses, behavior, and lightsuppression of nocturnal melatonin secretion suggest that the interactions between different photorecep-tor systems may be additive and in some cases inhibitory. These interactions and the responses mediatedby different photopigments also depend on several parameters including wavelength, intensity, stimulusduration, and previous exposure to light.
2 14:50 - Do the MC and PC pathways deliberately avoid S-coneinput?
H. Sun1, B.B. Lee1,2, H. Smithson3, Q. Zaidi11State University of New York, State College of Optometry, New York, U.S.A.2Max Planck Institute for Biophysical Chemistry, Gottingen, Germany.3Institute of Ophthalmology, University of College London, London, United Kingdom
There has been a recent suggestion that there is 10% S-cone input to the MC pathways (Chatterjeeand Calloway, 2002). This is relevant to whether the MC pathway underlies a psychophysical luminancechannel and to the specificity of retinal wiring. We used a newly developed technique to measure S-cone inputs to MC and PC ganglion cells. The stimulus is a uniform field of which the chromaticity ismodulated around a circumference in a color plane in clockwise or counterclockwise direction. For acell that receives linear combination of cone inputs, the cone weighting determines its preferred vector,which can be estimated by averaging the clockwise and counterclockwise response phases. We measuredMC cells‘ response phases in a plane defined by L+M axis and S-cone axis and PC cells‘ responsephases in an equiluminance plane at several temporal frequencies. Cone weighting estimates indicated,on average, little or no S cone input. We also measured the errors introduced by using cone fundamentalswith inappropriate macular pigment density and self screening. Chatterjee and Calloway used 2 degcone-fundamentals for their extrafoveal measurements. We found that using 2 deg rather than 10 degSmith-Pokorny cone fundamentals introduced an apparent 10% S-cone input. Finally, we consideredthe implications of the result in terms of retinal circuitry. If a ganglion cell‘s receptive fields receiveindiscriminate inputs from mixed cone types as in the random wiring model, the S-cone input should
11

have the polarity of PC cells‘ surrounds and of MC cells‘ center. This was not consistent with our datafrom either cell type. We suggest that MC and PC ganglion cells‘ receptive fields may have a mechanismto avoid S-cone inputs, as is the case for H1 horizontal cells (Dacey et al. 1996).
Chatterjee, S. and E. M. Callaway (2002). “S cone contributions to the magnocellular visual pathwayin macaque monkey.“ Neuron 35: 1135-1146.
Dacey, D. M., B. B. Lee, Stafford, Pokorny, and Smith (1996). “Horizontal cells of the primate retina:Cone specificity without spectral opponency.“ Science 271: 656-659.
3 15:10 - Temporal sensitivity of macaque ganglion cells; a reap-praisal
B.B. Lee1, W. Zucchini2, H. Sun1
1SUNY Optometry, New York, USA2University of Göttingen, Germany
We previously described the temporal response of ganglion cells to luminance and chromatic modu-lation, using a peak rate measure (Lee et al., JOSA A, 7, 2223-36, 1990). PC cells responded to red-greenmodulation up to 30-40 Hz, much above human chromatic flicker fusion. This led to the suggestion thatthis pathway undergoes central low-pass filtering. It has recently become clear that cells‘ response vari-ability increases rapidly with temporal frequency (Sun et al., Vision Res. 44, 19-23, 2004). We havereanalyzed cell responses in this context. First, we constructed ROC curves from cell Fourier amplitudesto single modulation cycles as compared to blank trials. Cell sensitivity was estimated by fitting Weibullfunctions to data at different contrasts. The resulting temporal response was very low pass with a low-frequency sensitivity of 1-2% cone contrast. The temporal response extended to ˜30 Hz. Such an “idealobserver“ approach has high contrast sensitivity at low temporal frequency, but the fusion frequency isstill high. We then simulated a central peak detector consisting of an integrator with a critical duration of300-400 msec. Its output was then subjected to ROC analysis. The resulting temporal response largelymaintained low-frequency sensitivity, but the temporal response cut off at 10-15 Hz, as in human psy-chophysical data. This type of approach can help constrain central detection mechanisms; we will discussfurther facets of this form of analysis, and its application to the MC pathway and luminance modulation.
4 15:30 - Topographic (un-)coupling of S- and M-cone mosaics infelids and other mammals
P.K. Ahnelt1, E. Herndl, C. Schubert1, A. Kübber-Heiss2, A. Schiviz1, M. Glösmann3
1Dept. Physiology, University of Vienna, Vienna, Austria2Dept. Vet. Pathology, Vet. Univ. Vienna, Vienna Austria3Max Planck Inst. of Brain Res., Frankfurt, Germany
The topography of the two spectral cone subpopulations present in most mammals, representing theancient dichromatic color system, can be studied by anti-opsin antibody labeling. For human and otherdiurnal primate retinas the distribution of S-cones has been found to have largely concentric gradientsalbeit at ratios around 10:1. However, extension of studies to species such as rodents, rabbit or cathave shown spatial independence of the S-cone gradients peaking in other regions than the temporalarea centralis defined by M-cones and related interneurons. To study the variability of S- versus M-cone topographies we have collected eyes and analyzed the spectral topographies from 7 felid species :cheetah, lion, tiger , jaguar, Siberian manuls, Eurasean lynx and domestic cats (obtained from animalsdelivered to veterinary pathology from Austrian animal parks and zoos. In addition data from previous orongoing studies on other mammalian groups are added for comparison beyond phylogenetic relationships.
12

All Felid species have central areas located in the superior temporal quadrant established by M-cones,but the maximum densities varies strongly. Cheetah by far outnumbers other species (max. 41000 M-cones/mm2, as compared to 17000/1300 in Lynx), total estimated cone numbers(9,5 Mio M-cones +1,5Mio S-cones, as compared to 5,5 + 1,5 Mio in tiger) or S-cone proportion 14% (cheetah) versus 2% inmanul. The overall topographic pattern is clearly uncoupled in the two smallest species, the domesticcat and the manul, while it is more congruent in the larger species. The cheetah’s extreme visual streakorganization is unique among felids confirming the species’ specialized adaptation as a diurnal open-terrain speed hunter. Across species, differences in M-/S-gradients appear to correlate with differencesin species size (dorso-ventral a/symmetry), terrestrial versus semi-/arboreal behaviour (elongated versusconcentric gradients) and between open versus closed habitats. Uncoupling is characteristic for smallerspecies with increased predatory risk approaching from the superior visual hemisphere. Thus the degreeof overlap or uncoupling of cone topographies indicates species variant roles for color contrast versusspectral sensitivity functions of the S-pathway. A central region providing enhanced spatial vision mayor may not concur with the maximum short wavelength sensitivity depending on the particular species’ecological position and behaviour. This suggests relative functional and ontogenetic independence of theS-cone systems were basic features of mammalian color system.
5 16:10 - Do rods influence the hue of foveal stimuli?
S.L. Buck, L.P. Thomas, N. Hillyer, E.M. SamuelsonDepartment of Psychology, University of Washington, Seattle, USA
For extrafoveal stimuli, rods produce three separable influences (biases) on the hue percepts deter-mined by cones. To understand both the generality and mechanisms of these rod hue biases, we examinedwhether they are present for small foveal stimuli. The wavelengths associated with spectral unique hues(Ublue, Ugreen and Uyellow) were determined for small disks (e.g., 0.2 ◦ and 0.6◦ diameter presented for1-s duration) presented foveally by means of a psychophysical staircase procedure. The foveal fixationarray was composed of four dim tungsten-illuminant dots, each located 3.4 ◦ from the stimulus location.For each condition we assessed rod influence by comparing unique hue wavelengths under two differentadaptation conditions: during the cone plateau from 3-8 min after a xenon flash bleach (BL) and after 30min of dark adaptation (DA). For this comparison, all stimuli were scotopically matched at a value thatranged from 1.0 to 2.0 log scot trolands, depending on the stimulus condition. For each of three observers,the pattern of rod hue biases was consistent across the two sizes tested but differed for each observer. Oneshowed no rod influence (shifts < ±s.e.). One showed a small Ublue shift (3.6 ±2.7 nm, 3.5 ±2.0 nm).One showed a small Uyellow shift (-3.0±0.8 nm, -2.8 ±1.8 nm). No foveal stimulus tested so far yieldsrod hue shifts of the size and reliability across observers that we have previously found for extrafovealstimuli. We are uncertain as to the source of the present small residual shifts, and even their dependenceon rods. In any case, the absence of reliable and substantial rod hue shifts in the fovea (1) suggests that theeffects observed extrafoveally do not depend on residual cone adaptation by the bleaching light and (2)provides no support for the hypothesis that rod hue biases are mediated by unstimulated but dark-adaptedrods outside the area of the test stimulus, such as has been shown for rod effects on foveal cone-mediatedflicker and acuity. Instead, the results are consistent with the hypothesis that light-initiated rod signalsfrom the area of the test stimulus bias the chromatic pathways.
13

6 16:30 - Foveal or extrafoveal dominance in rod hue biases?
L.P. Thomas, S.L. BuckUniversity of Washington, Department of Psychology, Seattle 98195, USA
We have previously shown green (shift of unique yellow locus), blue (shift of unique green) and shortwavelength red (shift of unique blue) rod hue biases with large, dimly-mesopic, extra foveal stimuli formost of our observers. However, these effects tend to diminish when stimuli are confined to a smallarea of the central fovea. The present study explores (1) whether the fovea dominates over potential rodinfluences on perception of U hues, and (2) whether large stimuli are as effective for revealing rod huebiases when foveally centered as when eccentrically centered. We assessed rod influence by measuringwavelengths if unique green and unique yellow (with 1-s duration, 1 log scot td stimuli and a staircaseprocedure) under cone plateau and dark adaptation conditions. We measured unique hues with foveallycentered 2 deg and 7.4 deg disks, and 7.4 x 2 deg annuli, and 7.4 deg disk at 7 deg eccentricity. The rodgreen bias was typically <10nm and remained fairly constant across spatial configurations, indicatingno special foveal influence. The rod blue bias varied more among observers and spatial configurations,reaching up to 42nm. For some observers, stimuli covering the fovea consistently produced less rod bluebias than extra foveal stimuli. For other observers, they did not. However, across all observers the smallerfovea condition (2 deg) produced the smallest rod blue biases. Thus, the present results add differencesin spatial dependence between green and blue rod biases to the previously demonstrated differences inlight-level dependence and time course. The present conditions provide no evidence of foveal dominancein the case of the rod green bias and inconsistent evidence in the cases of the rod blue bias.
7 16:50 - Scotopic color perception
J. Pokorny, M. Lutze, D. Cao, A.J. ZeleDepartment of Ophthalmology & Visual Science, The University of Chicago, 940 East 57th Street,Chicago, IL 60637, USA
Purpose: Human vision maintains a perceptual stability through the transition between daylight andtwilight conditions in which real world objects, with broad reflectance spectra, do not abruptly changecolor with diminution in light level. Rather there is a gradual reduction in saturation and color gamut withdecreasing light levels. Several studies document rudimentary color vision under scotopic illuminationconditions, presumably mediated by rods and L-cones. Here, hue perceptions of paper color sampleswere determined for a wide range of light levels including very low light levels where the L-cones didnot contribute to color percepts. Methods: The appearances of 24 paper color samples from the OpticalSociety of America Uniform Color Scales (OSA-UCS) were gauged under successively dimmer illumi-nations in 0.5 log unit steps from 10 to .0003 lux. Sufficient time for adaptation was allotted followingeach decrease in illumination. Triads of colors were chosen for this study that photopically appearedred, pink, orange, yellow, green, blue, purple and grey and the samples within each color triad varied inlightness. The 50mm square samples were placed in black mounts that could be moved around on a blacksurface. The samples were 8 − 10◦ of visual angle when viewed directly from 0.30-0.35m. Observerswere instructed to sort the samples into groups that they could categorize with specific color names. Theauthors served as observers. Results: Observers sorted all samples into the same triads as the originallychosen color groups at illumination levels between 10 and 0.32 lux with few exceptions. At .01 lux,the originally chosen red and orange samples were usually correctly identified as either red or orange.The remaining samples tended to be grouped into two categories correlating with the level of reflectanceof the samples. The lowest reflectance samples were grouped and named as black. For 3 observers,high reflectance samples were grouped and named predominately as green or blue-green while the fourthobserver named the high reflectance samples as blue or achromatic. At the two dimmest levels there
14

continued to be conspicuous color percepts. Color categories were reliably assigned on the basis of thescotopic reflectances of the samples. The lowest reflectance samples that did not appear black were clas-sified as orange or yellow (all four observers) and the higher reflectance samples as green or blue-green(three observers), or achromatic or blue (the fourth observer). Conclusions: There are two categories ofcolor appearance and names that result at scotopic light levels. Except for the lowest light levels, therewas a clear division of color appearance between samples predominantly reflecting longer wavelengthsand the other visible samples; rods and L-cones presumably mediated these percepts. At the two lowestlight levels, color appearance was associated with sample scotopic reflectance. Based on the scotopic lu-minous efficiency function, in a dim natural environment the spectral composition of objects with short-and medium-wavelengths appear brighter, and objects with longer wavelengths appear dimmer. Withinput solely from rods, the visual system estimates probable colors based upon prior experience.
8 17:10 - Magnocellular pathway mediates rod suppression of coneflicker detection
D. Cao, J. Pokorny, A.J. ZeleVisual Science Laboratories, Department of Ophthalmology andVisual Science, The University of Chicago,940 East 57th Street, Chicago, IL 60637, USA
Purpose: Dark-adapted rods in a region surrounding a luminance-modulated field suppress flickerdetection. The interaction between rods and each of the cone types is unclear. A number of studies foundthe effect to be more profound for L- than for M-cones. No study considered the interaction with S-cones.In this study, the critical fusion frequencies (CFF) for receptoral [L, M, S] and postreceptoral luminance,[L+M+S], [L+M+S+Rod] and red-green chromatic [L/(L+M)] signals were measured in the presenceof different surround light levels. The experimental design allowed evaluation of the retinogeniculatepathway(s) that show rod suppression of cone flicker detection. Methods: A 2-channel photostimulator,with 4-primaries for a central field and 4 for a surround, allowed independent control of rod and coneexcitation. Receptoral [L], [M], [S] and postreceptoral luminance [L+M+S], [L+M+S+Rod], or chromatic[L/(L+M)] stimuli were temporally modulated in a 2◦ circular field set within a steady 10◦ surroundpositioned at a 6◦ temporal eccentricity. The time averaged center and surround chromaticities weremetameric to the equal-energy-spectrum. The stimulus was sinusoidally modulated about 80 photopicTds, using a 1-sec raised cosine envelope alternated with a 1-sec steady field. The [L], [M], [L+M+S]or [L+M+S+Rod] were modulated at 15% Michelson contrast, the [S] cone was modulated at 30%, andthe [L/(L+M)] signal was modulated at 5%. Observers adjusted the modulation frequency of the 80 Tdcenter to determine the CFF for each stimulus type in the presence of different surround illuminances(0, 0.05, 0.5, 5, 20 or 80 photopic Tds). Measurements followed either 30-min of dark adaptation or2-min of light adaptation to a 10,000 Td broadband light. Results: For [L] or [M] cone modulation andluminance modulation, the CFF was constant for the dark and dim surrounds but increased abruptly whenthe surround retinal illuminance was above cone threshold. Following light adaptation, dim surroundsdid not lower the CFF. The CFF for [S] cone and [L/(L+M)] postreceptoral signals were unaffected bysurround light level or light or dark adaptation. Conclusions: From physiological studies (Yeh et al,1995), magnocellular pathway units would respond vigorously to all stimuli except [S] or [L/(L+M)]modulations; parvocellular pathway units do not respond strongly to the [S] or luminance signals; andkoniocellular pathway units would respond vigorously to [L], [M] and [S]. From this pattern of response,the results indicate that rod-cone interaction in cone mediated flicker detection occurs exclusively in themagnocellular pathway.
Yeh, T., Lee, B.B. & Kremers, J. (1995) Journal of the Optical Society of America A 12, 456.
15

9 17:45 - Monge
Professor John D. MollonUniversity of Cambridge, Cambridge, UK
10 8:50 - X-Chromosome Inactivation andM/LCone Ratios in Poly-morphic New World Monkeys and in Knock-In Mice with anM/L Opsin Gene Polymorphism
G.H. Jacobs, G.A. WilliamsNeuroscience Research Institute, University of California, Santa Barbara
During mammalian development a majority of the genes on one of the two X chromosomes in femaleembryos are inactivated in somatic cells to achieve gene dosage compensation. Unlike their catarrhinecousins, most platyrrhinemonkeys have only a single X-chromosome opsin gene with multiple alleles. X-chromosome inactivation provides heterozygous females of these species with a mixture of M and L conetypes thus allowing a receptor basis for trichromatic color vision. In such animals it is conventional toassume that M/L cone ratios must largely reflect the dynamics of X-chromosome inactivation. To evaluatethat influence we determinedM/L cone ratios in a sample of 60 heterozygous platyrrhinemonkeys. Theseanimals represent a variety of species and embody various combinations of M and L cone types. Coneratios were estimated by determining the relative weightings of M and L cone spectra required to bestfit flicker photometric ERG spectral sensitivity functions. Consistent with a random inactivation process,the mean M/L ratio is close to unity. At the same time, however, significantly unbalanced ratios wererelatively common with ˜10% of animals having 80% or more of one receptor type. A second caseinvolves a polymorphic knock-in mouse engineered to mimic the opsin gene arrangement of platyrrhinemonkeys. M and L cone weightings were determined for a sample of ˜60 heterozygous mice usingtechniques similar to those noted above. The M/L cone weightings in these mice are on average biasedsomewhat in the M-cone direction. Despite that bias, the dispersion of individual cone weights is similarto that seen in the monkeyswith at least 10% of these mice having an 80% or greater contribution from onecone type. If M/L ratios in polymorphicmice and monkeys are completely determined by X-chromosomeinactivation these observations suggest limits on the size of the pool of precursor cells at the time of X-chromosome inactivation.
11 9:10 - TopographicalMaps of L andMGene Expression in AdultHuman Retinas
M. Neitz, S.D. Balding, S.A. Sjoberg, J. NeitzMedical College of Wisconsin Milwaukee, WI USA
Previous measurements of the ratio of L:M messenger RNA in small tissue patches suggested thatthe proportion of L cones rises with increasing eccentricity. Microspectrophotometry results from oneeye also suggest a considerable L cone dominance near the ora serrata compared to the fovea. Here, wereport experiments to produce topographical maps of L and M gene expression for eleven male humandonor retinas that were flat-mounted onto nylon filters printed with a 3-mm 2 grid. Real-time quantitativepolymerase chain reaction (PCR) was used to estimate the relative amount of L in the total L plus MmRNA for each grid square along the horizontal and vertical meridians. Near the ora serrata, the amountof L approached 100% of the L plus MmRNA, and was dramatically higher than near the fovea where thelargest quantities of M pigment mRNA were observed. In the adult macaque retina, a foveal-to-peripheral
16

gradient of L and M gene expression was less striking. Primate retinal development proceeds from thecenter outwards in a wave that is mirrored in the observed gradient of the relative abundance of L pigmentmRNA. Amodel for the mechanism that forms themosaic of L andM cones must explain their topograph-ical distribution. Nathans and colleagues have demonstrated that interaction between the locus controlregion (LCR) and the proximal promoter of the L or M gene is crucial for gene expression. Recent resultsfrom our laboratories investigating the developmental expression pattern of the X-chromosome pigmentgenes from humans and Old World monkeys have provided evidence for a model in which there is a com-petition between gene expression and gene silencing within incipient L and M cone photoreceptors. It isproposed that the probability of a cell becoming L versusM changes over time as a function of the relativeextent to which silencing mechanisms have acted on the genes. Epigenetic modifications that result ingene silencing are heritable. Thus, according to the model, the change in the proportion of L cones witheccentricity is produced because cells that populate the peripheral retina derive from progenitors that haveundergone a greater extent of gene silencing and thus have a greater starting probability of becoming Lcones compared to cells in the center.
12 9:30 - Regulation of L and M Pigment Gene expression
S.S. Deeb, Y. Lui, T. HayashiMedical Genetics, University of Washington, Seattle WA, USA
An essential step in the evolution of full trichromatic color vision in primates was the duplication ofthe ancestral pigment gene to form the L and M pigment gene array on the X chromosome. Previouswork using transgenic mice has indicated that a locus control region, adjacent to this array of genes playsan important role in their mutually exclusive expression in respective cone cells (Smallwood et al. 2002).We now show that cells of the undifferentiated human retinoblastoma cell line WERI exhibit mutuallyexclusive expression of the L and M pigment genes in each cell and therefore are a good model forstudying this process. Furthermore, clonal analysis showed that single WERI cells that express eitherthe L or the M pigment mRNA divide and generate a mixed population with varying ratios of L or Mpigment mRNA-expressing cells. These results suggest, first, that cell division resets L or M pigmentgene expression in a stochastic manner. Second, that determination of L vs. M cone identity may notrequire external or internal molecular cues. Third, aside from having different pigments, L and M conesare not intrinsically different. It was previously shown that thyroid hormone (T3) together with 9 cis-retinoic acid (RA) play an important role in directing photoreceptor cell fate by favoring the formationof L/M cones at the expense of S cones. The mechanism by which this is accomplished is unknown.Using WERI cells as a model, we have shown that thyroid hormone directly induces expression of boththe L and M pigment genes. This suggests that the mechanism by which T3 and RA induce L/M conedifferentiation involves direct induction of expression of L/M cone-specific genes.
Smallwood PM, Wang Y, Nathans J: Role of a locus control region in the mutually exclusive expres-sion of human red and green cone pigment genes. Proc Natl Acad Sci U S A 99:1008-1011, 2002
17

13 9:50 - An urn model of the development of macaque and humanadult L:M cone ratios
K. Knoblauch1, M. Neitz2, J. Neitz21Inserm U371, Cerveau et Vision, Dept. of Cognitive Neurosciences, IFR 19, UCB - Lyon 1, Bron,France2Medical College of Wisconsin, Milwaukee, USA
Purpose: In old world primates, including humans, fetal and adult retinas differ dramatically in L:Mpigment mRNA ratio. There is also tremendous variation in the adult L:M cone ratio. A simple modelthat explains these observations involves a dynamic competition between the L and M gene promotersfor interaction with the locus control region (LCR) in which each time the LCR/promoter complex isdisrupted, the promoters compete anew. When a promoter is not interacting with the LCR, it is exposedto gene silencing. Thus, in an incipient L/M cone, each LCR/promoter interaction changes the relativeprobabilities that L vs M will win in the next round of competition until, finally, the probability of asso-ciation with one or the other promoters is reduced to zero. Methods: The process was modeled as anurn containing an initial ratio of L:M balls. When an L-ball is drawn, r L-balls are added and r M-ballswithdrawn; when an M is drawn s M-balls are added and s L balls withdrawn. These parameters with thetotal number of balls, N, specify a Markov chain with transition matrix of N+1 states and two absorbingstates (for each of L and M). The transition matrix determines the final L:M distribution in which eachball is either L or M. Results: The curve relating final to initial %L-cones is sigmoidal. Changing theL/M replacement rule for a fixed number of states produces parallel shifts along the axis of initial %L.Increasing the number of states (balls in the urn) steepens the curve. A 100-ball urn requires a replace-ment rule of 8/1 for macaque and 2.5/1 for humans to predict the correct final ratios from the initial ratios.For human, the final %L varies from about 0.35 to 0.95 as the replacement rule varies from 2/1 to 4/1.Ninety-nine percent of the cones are committed as L or M in 68 steps for macaque and 84 for human.Thus, the process would near completion at birth for each species if the LCR dissociates once per day.Conclusions: The model predicts that subtle individual differences at the photopigment gene locus thatwould produce small changes in the dynamics of the competition occurring during development couldexplain large individual differences in adult cone ratio.
Support: RPB, NIH grants EY09303, EY09620, EY01931
14 10:10 - The genetics of colour deficients with unusual anomalo-scope matches
J.L. Barbur1, M. Rodriguez-Carmona1, K. Mancuso2, J. Neitz2 and M. Neitz21Applied Vision Research Centre, The Henry Wellcome Laboratories for Vision Sciences, City Univer-sity, London UK.2The Medical College of Wisconsin, Department of Ophthalmology, 925 North 87th Street, MilwaukeeWI, 53226, USA.
The majority of colour deficient observers require either more red or more green light to match thecolour appearance of a spectral yellow field (as in a Nagel match) and this observation is often used todetect and classify the type of colour deficiency involved. "Extreme" colour deficients, on the other hand,can accept unusual matches that are often difficult to explain. Some subjects accept most, but not all of thered-green mixture range, others require significantly more red or green light in the match, but only accepta very narrow range of red-green mixtures that yields a red-green discrimination index (RGI) equivalentto or better than a normal trichromat. Some studies have also reported poor correlation between theparameters of the yellow match and the subject’s ability to discriminate colour differences under more
18

normal conditions of illumination. The purpose of this investigation was to carry out a number of relatedstudies:
• To model the Nagel match and to examine how shifts in lmax, changes in optical density of pho-toreceptors and post-receptors amplification of L and M cone signals can affect the parameters ofthe yellow match and can be used to account for "extreme" anomaloscope matches.
• To investigate how loss of chromatic discrimination sensitivity in congenital colour deficiency cor-relates with the parameters of the yellow match.
• To carry out genetic analysis in a group of extreme colour deficient observers to investigate thecorrelation between predicted and observed colour vision losses.
• To use the genetic predictions to constrain the parameters of the model so as to establish moreclosely the parameter changes needed to account for extreme colour matches
• To investigate and account for the lack of correlation between the parameters of the yellow matchand the subjects‘ loss of chromatic discrimination sensitivity under more normal conditions ofillumination
Nagel matches and colour discrimination thresholds were measured in 225 normal trichromats and 250colour deficient observers. 24 subjects that exhibited extreme or unusual anomaloscope matches wereselected for further study. The loss of chromatic sensitivity was re-examined in each of the 24 subjectsusing the Colour Assessment and Diagnosis (CAD) test under conditions that isolate the use of coloursignals. Genetic analyses were also performed for each of the 24 subjects to estimate the relative numberof L and M genes on the X-chromosome, to predict the spectral separation between L-class pigmentsfor deutans and M-class pigments for protans, and to determine whether there were other amino aciddifferences between L- or M-class pigments that might produce consistent differences in optical densityor in post-receptoral amplification factors among cones.
Predictions based on genetic data in relation to the class and severity of colour vision loss were in com-plete agreement with the measured psychophysical data. All Nagel matches in "extreme" protanomalousobservers could be predicted by appropriate changes in optical density and post-receptoral amplificationin the absence of L-cone photopigment. Extremely good predictions of the mean and narrow range of red-green mixture settings observed in some extreme protanomalous and deuteranomalous observers couldalso be obtained by simple adjustments in lmax and post-receptoral amplification.
All "extreme" anomalous Nagel settings examined in this study are consistent with the genetic dataand can be accounted for by appropriate changes in lmax, photoreceptor optical densities and / or post-receptoral amplification of cone signals. The Nagel match represents a sensitive method of detectingchanges in a number of different parameters, but neither the mean red-green mixture setting nor the RGIshow good correlation with other measures of chromatic discrimination sensitivity. These observationsare consistent with observed changes in model predictions when the spectrally narrow lights are replacedwith broader illuminants.
19

15 10:30 - A novel mutation in the short-wavelength sensitive conepigment gene associated with a tritan colour vision defect
K.L. Gunther, J. Neitz, M. NeitzDepartment of Ophthalmology and Department of Cellular Biology, Neurobiology, and Anatomy, Med-ical College of Wisconsin, Milwaukee, WI 53226 USA
Congenital tritan colour vision deficiency is caused by defects in the function of the short wavelengthsensitive (S) cones. This disorder shows autosomal dominant inheritance, with tremendous phenotypicheterogeneity. It has been shown to be caused by missense mutations in the gene encoding the S conephotopigment, and to date all known amino acid sequence variations in the S cone pigment are associatedwith tritan colour vision deficiency. Here we report the identification of a healthy 30 year old male whomade errors on standard colour vision tests consistent with the presence of a mild tritan colour visiondeficiency. We tested the hypothesis that his colour vision impairment was due to a mutation in the S conephotopigment gene. He was found to be heterozygous for a missense mutation that substituted prolinefor a highly conserved leucine at amino acid position 56 in the S cone photopigment. This mutation wasabsent in 564 S cone photopigment genes from 282 subjects who did not make tritan errors, and who hadnormal colour vision or who had red-green colour vision defects. Thus, we conclude that this missensemutation disrupts the normal function of S cones.
16 11:10 - Paradoxical shifts in human colour sensitivity caused byconstructive and destructive interference between slow and fastsignals from the same cone class and by the suppression of thefast signals
A. Stockman1, E.D. Montag2, D.J. Plummer31Institute of Ophthalmology, University College London, 11-43 Bath Street, London EC1V 9EL, UK.2Rochester Institute of Technology, Center for Imaging Science, Munsell Color Science Laboratory, 54Lomb Memorial Drive, Rochester.3Department of Psychology, University of California San Diego, La Jolla, CA 92093-00109, USA.
Paradoxical shifts in human colour (spectral) sensitivity occur on red background fields. As the inten-sity of the red background is increased from low to moderate levels, the spectral sensitivity for detectingflicker of moderate frequency shifts towards shorter wavelengths, but by more than is predicted by se-lective chromatic adaptation (Eisner & MacLeod, 1981). Remarkably, though, at higher intensity levels,the spectral sensitivity then shifts precipitously back towards longer wavelengths (Stockman, Montag andMacLeod, ARVO, 1991). Here, we show that the effects are due to two factors. First, they are the resultof destructive and constructive interference between slow and fast signals generated by both the M- andthe L-cone types, which, contrary to the conventional model, feed into a common luminance or achro-matic pathway. Since the slow M- and L-cone inputs are always opposite in sign, when one destructivelyinterferes with the fast signals, the other constructively interferes, causing frequency-dependent spectralsensitivity shifts. These shifts are intensity-dependent because the polarity of the slow signals changesfrom L-M to M-L as the intensity of the red field is increased. Second, the paradoxical shift towardslonger wavelengths is also the result of a strong suppression of the fast M-cone signals by intense redfields.
Eisner, A. & MacLeod, D. I. A. (1981) JOSA 71, 705-718.
20
17 11:30 - Colour appearance shifts induced by different illumi-nants; effect of field size and adaptation time
I.J. Murray1, A. Daugirdiene2, H. Vaitkecicius3, J.J. Kulikowski1, R. Stanikunas41Visual Sciences Lab.,Faculty of Life Sciences, PO Box 88. Manchester M60 1QD, UK.2Department of Psychology and Didactics, Vilnius Pedagogical University, Studentu 39, LT-08106 Vil-nius, Lithuania.3Department of General Psychology, Faculty of Philosophy, Vilnius University, Didlaukio 47, 2057 Vil-nius Lithuania.4Institute of Material and Applied Science, Vilnius University, Sauletekio 9, build. 3, 2040 Vilnius,Lithuania.
A successive asymmetric colour-matching task was used to study the changes in colour appearance ofsimulated Munsell samples under different illuminants. Colour shifts were induced with two Planckianilluminants, standard illuminant A (u*= 0.256, v* = 0.524) and illuminant S ( u* = 0.174, v* = 0.392).Observations were made with 10 equally spaced Munsell samples value 7 and chroma 4, on a neutral(N7) background. The set consisted of the following sequence: 10P, 10PB, 10B, 10BG, 10G, 10GY, 10Y,10YR, 10R and 10RP. All 10 Munsell samples were presented in the centre of a computer monitor, sub-tending 2◦, surrounded by a neutral background (N7) subtending either 20 ◦ or 180◦. Data are presentedin CIE LUV space (CIE 1976). Adaptation period varied from 1s to 30s for the smaller field and from1- 60s for the larger field. Colour shifts were measured using a modified Brunswick Ratio (BR). BR wasconsistently higher when the larger field was combined with longer adaptation periods. Supplementaryexperiments showed that the differences between the small and large field data were related to a small butperceptible shift in the colour of the background. The role of photoreceptors was examined by plottingcone contrast ratios for the different viewing conditions. As in previous work, weaker colour constancy isassociated with failures in adaptation of S-cones. A model based on cone-opponent interactions suggeststhere are quantitative, but not qualitative differences between observations made under the small and largefield conditions.
18 11:50 - Color adaptation contingent on eye saccades
A. Bompas, J. K. O’ReganLaboratoire de Psychologie Expérimentale, Université Paris 5, CNRS, France
During a forty minute adaptation phase, we presented briefly and alternatively a red patch on theleft and a green patch on the right of a computer screen and required subjects to perform repeated eyesaccades from one patch to the other. In order to measure partial adaptation to the contingency betweencolor change and direction of eye saccade, a test stage involved the successive presentation of two yellowpatches, either in the left-right or the right-left order. To measure the color change necessary to obtainsubjective equality, the hue of the test patches was manipulated, varying from reddish to greenish yellow.Opposite PSE-shifts were obtained for left-right and right-left eye saccades, being consistent with anadaptation of color judgements on the direction of eye saccades. By manipulating the distance and therespective position of the two patches in the test stage, we showed that the amount of adaptation, asmeasured by the PSE-shift, was dependant on the size and orientation of the eye saccades but not on thedeparture and arrival positions of the saccades. This dependency on the properties of eye saccades arguefor an interpretation in sensorimotor terms of the present effect.
21

19 12:10 - The gap effect in the parafovea
M.V. Danilova1, J.D. Mollon2
1I.P.Pavlov Institute of Physiology, Nab.Makarova, 6, St. Petersburg, 199034 Russia2Department of Experimental Psychology, Downing Street, Cambridge, CB2 3EB UK
In central vision, the discrimination of colours lying on a tritan line is improved if a small gap isintroduced between the two stimulus fields. Boynton et al (1977) called this a ‘positive gap effect‘.The gap effect was negative if the discriminanda differed in luminance and was absent or negative ifthey differed in the ratio of long- and middle-wave cone excitation. The positive gap effect for tritanstimuli disappeared if a forced-choice procedure was used; and Eskew (1989) found that the effect alsodisappeared if the stimuli were brief.
In parafoveal vision, using forced-choice and brief stimuli, we have found a robust gap effect. Thestimulus patches were sectors of an annulus centred on the fixation point. Their width was 2 degrees ofvisual angle and their centres were located on an imaginary circle of 5 degrees radius. Their centre-to-centre separation varied from 2 to 5 degrees in separate experimental blocks. At the smallest separationthey were adjacent. The stimulus duration was 100 ms. The chromaticities of the reference and testpatches were specified in an analogue of MacLeod-Boynton space, using 10-deg fundamentals moresuitable to our parafoveal stimuli. In this space, the grey background corresponded to equal-energywhite. In separate experiments, we measured discrimination along the L/(L+M) and the S/(L+M) axes.Thresholds were measured with spatial two-alternative forced choice and a staircase procedure.
A gap effect was found for both chromatic axes, discrimination being optimal when the centre-to-centre separation of the targets was 3-4 deg. The effect was exaggerated when the width of the testpatches was halved.
Boynton, R. M., Hayhoe, M. M. and MacLeod, D. I. A. (1977) The gap effect: chromatic and achro-matic visual discrimination as affected by field separation. Optica Acta, 24, 159-177.
Eskew, R.T. (1989) The gap effect revisited: slow changes in chromatic sensitivity as affected byluminance and chromatic borders. Vision Research, 29, 717-729.
Support: The Wellcome Trust 072684/Z/03/Z
20 14:00 - Is it possible to derive the maximum wavelength of Mand L photo pigments using multiple-Rayleigh matches?
F. Viénot, L. SerreaultMuséum national d’Histoire naturelle, CRCDG, Paris
Purpose: Measuring the ratio of two particular Rayleigh-type matches, He and Shevell (1994) in-vestigated individual differences in cone photopigments of normal trichromats. They showed that therange of the results for 17 observers was too large to be explained by only individual differences in pho-topigment optical density and pre-receptoral filtering. Their results were accounted for quantitatively bya small difference (3-5 nm) in the max of the L-cone photopigment. In our study, we propose to askobservers to make multiple colour matches, i.e. a series of Rayleigh-type color matches using varioussets of test and primaries, in order to investigate differences in M- and L-photopigments. Methods: Ob-servers were asked to perform colour-matches between a yellow test light and an additive mixture of redand green lights. A three-channel optical system was used and calibrated. A modified Maxwellian viewlayout allowed enlarging the exit beam at the entrance of the pupil so that the observer could see the 10deg matching field in nearly natural viewing. The quasi-monochromatic test and primary lights were ob-tained using interference filters at three of five wavelengths in the medium longwave range of the visiblespectrum. Among the 10 possible layouts that could be achieved with 5 filters, only seven that yieldedphotopic luminance levels were assessed.
22
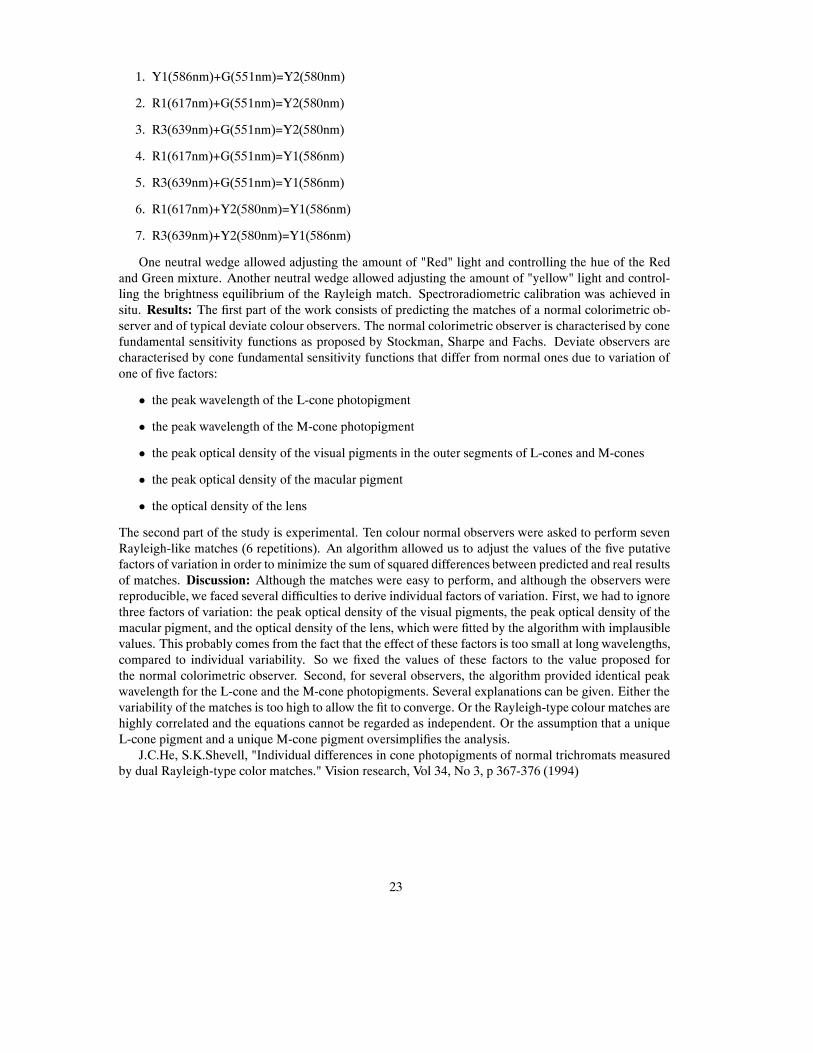
1. Y1(586nm)+G(551nm)=Y2(580nm)
2. R1(617nm)+G(551nm)=Y2(580nm)
3. R3(639nm)+G(551nm)=Y2(580nm)
4. R1(617nm)+G(551nm)=Y1(586nm)
5. R3(639nm)+G(551nm)=Y1(586nm)
6. R1(617nm)+Y2(580nm)=Y1(586nm)
7. R3(639nm)+Y2(580nm)=Y1(586nm)
One neutral wedge allowed adjusting the amount of "Red" light and controlling the hue of the Redand Green mixture. Another neutral wedge allowed adjusting the amount of "yellow" light and control-ling the brightness equilibrium of the Rayleigh match. Spectroradiometric calibration was achieved insitu. Results: The first part of the work consists of predicting the matches of a normal colorimetric ob-server and of typical deviate colour observers. The normal colorimetric observer is characterised by conefundamental sensitivity functions as proposed by Stockman, Sharpe and Fachs. Deviate observers arecharacterised by cone fundamental sensitivity functions that differ from normal ones due to variation ofone of five factors:
• the peak wavelength of the L-cone photopigment
• the peak wavelength of the M-cone photopigment
• the peak optical density of the visual pigments in the outer segments of L-cones and M-cones
• the peak optical density of the macular pigment
• the optical density of the lens
The second part of the study is experimental. Ten colour normal observers were asked to perform sevenRayleigh-like matches (6 repetitions). An algorithm allowed us to adjust the values of the five putativefactors of variation in order to minimize the sum of squared differences between predicted and real resultsof matches. Discussion: Although the matches were easy to perform, and although the observers werereproducible, we faced several difficulties to derive individual factors of variation. First, we had to ignorethree factors of variation: the peak optical density of the visual pigments, the peak optical density of themacular pigment, and the optical density of the lens, which were fitted by the algorithm with implausiblevalues. This probably comes from the fact that the effect of these factors is too small at long wavelengths,compared to individual variability. So we fixed the values of these factors to the value proposed forthe normal colorimetric observer. Second, for several observers, the algorithm provided identical peakwavelength for the L-cone and the M-cone photopigments. Several explanations can be given. Either thevariability of the matches is too high to allow the fit to converge. Or the Rayleigh-type colour matches arehighly correlated and the equations cannot be regarded as independent. Or the assumption that a uniqueL-cone pigment and a unique M-cone pigment oversimplifies the analysis.
J.C.He, S.K.Shevell, "Individual differences in cone photopigments of normal trichromats measuredby dual Rayleigh-type color matches." Vision research, Vol 34, No 3, p 367-376 (1994)
23

21 14:20 - Illuminant and observer metamerism in colour visiontests
S.J. DainSchool of Optometry and Vision Science, University of New South Wales
The paper present at ICVS2003 identified the significant metamerism in the several editions of theHardy-Rand-Rittler pseudoisochromatic plates (HRR) but did not proceed to quantify the consequencesof that metamerism. Metamerism is almost inevitable when a printed colour vision test is reproducedin several editions. The widely used Ishihara pseudoisochromatic plates have also been identified asexhibiting clearly visible variation. Metamerism has two consequences, illuminant based changes inperformance but also changes in performance with observer (less well known) when assessing anomaloustrichromats. This study addresses the effects of illuminant and observer metamerism on the 4 editionsof the HRR and also 4 representative editions of the Ishihara plates. The plates that are resistant to eachform of metamerism are identified and the magnitude of observer metamerism illustrated by analogy withcorrelated colour temperature changes.
22 14:40 - The colour discrimination limits of "normal" trichro-mats - new method for detection and classification of minimaldeficiencies
M. Rodriguez-Carmona, J.A. Harlow, J.L. BarburApplied Vision Research Centre, The HenryWellcome Laboratories for Vision Sciences, City University,London UK.
Colour vision assessment requires a test that (I) provides true isolation of colour signals, (II) is basedon data that describe the statistical limits of colour discrimination in "normal" trichromats, (III) has ad-equate sensitivity to detect "minimal" deficiencies and to classify them, (IV) has enough specificity byminimising measurement variance within normal trichromats, (V) can be used to detect and monitor "sig-nificant changes" in colour discrimination over time. The Colour Assessment and Diagnosis (CAD) testhas been optimised to fulfil these requirements.
The moving, colour-defined stimulus is of the same mean luminance as the surrounding backgroundand is buried in dynamic luminance contrast noise, a technique that isolates the use of colour signals (1,2). The subject‘s task involves direction discrimination of the colour-defined,moving stimuli using a four-alternative, forced-choice procedure. Sixteen colour directions are employed to isolate both yellow-blue(YB) and red-green (RG) chromatic mechanisms. The distribution of colour detection thresholds alongthese directions in normal trichromats provides the information needed to classify minimal deficienciesand to detect Sstatistically significantT changes in chromatic sensitivity in repeated tests.
The statistical limits for the Sstandard normalT CAD observer are based on 234 randomly selectedsubjects (125 males and 109 females, mean age: 30 yrs, SD=10, range: 14 to 60 yrs). Eight of thesesubjects (˜3%) produced RG thresholds that were clearly separated from the cluster of normal trichromatsand were not therefore included in the analysis. The colour thresholds measured in the 225 normaltrichromats were used to calculate the 2.5% and 97.5% limits and the mean threshold values for RG andYB discrimination. The 97.5% limits and the mean standard error associated with RG and YB thresholdswere used to set upper threshold limits for the standard "normal" CAD trichromat. In addition to thegroup of normal trichromats, 250 colour deficient observers were also investigated. CAD thresholds,Ishihara scores and Nagel anomaloscope matches were measured in each subject. These data have beenused to derive multiple comparisons for sensitivity and specificity between the CAD, Ishihara and Nageltests.
24

The findings of this study suggest that the new CAD test and in particular the establishment of thestandard normal CAD observer provides an accurate means of (I) detecting even minimal colour visiondeficiencies that produce variable results with conventional colour vision tests, (II) classifying correctlyRG chromatic sensitivity loss into protanomalous and deuteranomalous categories, with only one error in250 subjects, (III) assessing quantitatively the severity of RG and YB colour vision loss (whether congen-ital or acquired) and (IV) providing automatic detection of significant changes in chromatic sensitivitywhen monitoring progress of disease or treatment.
1. Barbur, J. L., Harlow, A. J. & Plant, G. T. (1994) Proc. R. Soc. Lond B Biol. Sci. 258, 327-334.2. Barbur, J. L. (2004) Prog. Brain Res. 2004. ;144. :243. -59. 144, 243-259.
23 15:00 - An innovative instrument for the psychophysical mea-surement of Macular Pigment Optical Density using a CRT dis-play
P. West1, J. Mellerio2
1 CRS, Rochester, Kent, UK2 Univesrsity of Westminster, London, UK
We describe a new instrument for psychophysical measurement of Macular Pigment Optical Density(MPOD) designed to overcome many of the difficulties usually encountered when performing subjectivephotometry on naïve subjects. The system employs a CRT monitor for stimulus presentation and incor-porates an optical filter that overcomes the usual limitations of the phosphors of a CRT monitor. Partof the broad spectral emission of each of the three CRT phosphors is absorbed by the macular pigment.Therefore when employed as a stimulus for heterochromatic flicker or motion nulling photometry thereis a systematic and significant underestimate in MPOD. To overcome this limitation we have designed aband blocking filter that blocks light between 460-640 nm. When viewed through the filter the spectra ofthe Red and Blue phosphors do not overlap and the Blue component is absorbed by the MP whilst the Redis not. Thus the subjective photometric measurements made using this configuration are close to thosemade with monochromatic lights. Test Stimuli are consecutively presented in concentric arcs between 0and 8 degrees, with central fixation, thus allowing a MPOD profile to be measured. The design brief wasthat the instrument should measure MPOD in large groups of subjects, for example for screening or drugtrials. Therefore we have incorporated two further novel features that improve subject performance andmeasurement robustness. We employ the motion nulling grating method of Cavanagh and Anstis (1983).A chromatic Blue-Red grating is displayed sequentially with a luminance grating. The gratings appear todrift either up or down. The direction of drift is dependant upon the relative perceived luminance of theRed and Blue Component. This stimulus is easy to see and setting luminance for a motion null is easilyto perform: it is ideally suited to the Forced Choice Staircase psychophysical paradigm that we employ.The quality of any psychophysical MPOD estimate relies on knowing the exact retinal eccentricity thatis being measured. We use a video based gaze tracking system to ensure that correct central fixation ismaintained. The stimulus presentation sequence is inhibited unless the subject is accurately maintain-ing central fixation. Subject feed back is provided by a visual cue when fixation is correct. We reportMPOD profile measurements made with the device and compare them to results in the literature usingnear-monochromatic lights (Mellerio, et al, 2002; Moreland et al, 2004).
Anstis, S. & Cavanagh, P. (1983) A minimum motion technique for judging equiluminance. In:Mollon, J.D. & Sharpe, L.T. (Eds.), Colour vision: Psychophysics and physiology. London, AcademicPress, pp. 155-166
Mellerio, J., Ahmadi-Lari, S., van Kuijk, F. J. G. M.,Pauleikhoff, D., Bird, A. C. &Marshall, J. (2002)A portable instrument for measuring macular pigment with central fixation. Cur. Eye Res. 25:37–47
Moreland, J.D. Macular pigment assessment by motion photometry. (2004) Archives of Biochemistryand Biophysics. 430:143–148
25

24 15:20 - Light scattering effect on contrast sensitivity of differentcolour Gabor gratings
G. Ikaunieks1, M. Colomb2, M. Ozolinsh1, G.Krumina1
1Department of Optometry and Vision Science, University of Latvia, Latvia2Laboratoire Régional des Ponts et Chaussées de Clermont-Ferrand, France
To asses the effect of light scattering on perception of colour stimuli with different contrast level,we have measured contrast sensitivity in fog using different colour Gabor gratings. Gratings were red,green, and blue with spatial frequencies 8, 13 and 23 cycles/deg. Experiments were performed in anartificial fog camera at visibility 6, 8 and 11m. Additional indoor experiments were carried out usinglight scattering PDLC polymer dispersed liquid crystal eye occluders that allowed to control the level oflight scattering. The Gabor gratings with different contrast were displayed on LCD monitor. Contrastsensitivity was determined from psychophysical curves. Test subjects should recognize horizontal orvertical orientation of gratings using a 2-alternative forced-choice method. Due to the stronger shortwavelength light scattering in fog the most reduction of contrast sensitivity was expected for blue colourgratings. Light scattering decreased contrast sensitivity of all three colour stimuli. Results showed bettercontrast sensitivity for green and red comparing to blue colour stimuli at all used spatial frequencies.Results for blue colour stimuli showed the most abrupt decrease of contrast sensitivity toward higherspatial frequencies. Additional ERG and VEP studies using reversal monochromatic (red, green, blue)stimuli of different Weber contrast together with scattering induced by PDLC obstacles are in progress.
G. Ikaunieks is thankful to the European Social Fund (ESF) for the support of this study.
25 17:00 - Colour space mapped by the reverse Stroop effect
H. Smithson, S. Khan, L.T. Sharpe, A. StockmanInstitute of Ophthalmology, UCL, UK
In the classic Stroop task, observers are instructed to respond to the ink-colour in which colour-wordsare printed. Conversely, in a reverse Stroop task, observers are instructed to ignore the ink-colour and torespond to the colour-word. In both tasks, response times (RTs) are faster with congruent combinationsin which the word and the ink-colour match, than with incongruent combinations in which the word andthe ink-colour do not match. We hypothesized that facilitation should occur when ink-colour belongs tothe colour category represented by the colour-word and that interference should occur when ink-colourfalls outside this category. Thus, we should be able to map out the cognitive colour space for each colourcategory. In a reverse Stroop task we manipulated ink-colour to measure the transition from facilitation tointerference for multiple combinations of colour-words (RED, ORANGE, YELLOW, GREEN, CYAN,BLUE and PURPLE). Stimuli were presented on a calibrated CRT. In preliminary experiments, we chosecolour stimuli that were the best examples of each colour-word and these were used as the congruent andincongruent extremes for each colour pair. Intermediate ink-colourswere simple colour-mixtures betweenthese extremes. Observers used a joystick to select, as quickly as possible, the coloured response-patchthat corresponded to the colour-word, and RT was recorded. We found that the reverse Stroop taskcan be used to map the boundaries between colour categories and to measure the distortions of thoseboundaries caused by colour induction. The data identify differences between common and uncommoncolour categories, and are broadly consistent across observers.
26

26 17:20 - Normal and dichromatic colour discriminationmeasuredfrom transient isoluminat vecps
L.C.L. Silveira, B.D. Gomes, G.S. Souza, C.A. Saito, M. da Silva FilhoDep. Fisiologia, Universidade Federal do Pará, Belém, Brazil
To compare colour discrimination in humans measured with visual evoked cortical potential (VECP)recordings and psychophysics. Subjects with normal colour vision were tested (n = 6) and the resultscompared with those obtained from one deutan subject. Sinusoidal chromatic gratings were made fromcolour pairs located along 4 different colour directions centered in two reference points (E2, u‘=0.219,v‘=0.48; E3, u‘=0.225, v‘=0.415) were used. Spatial frequency 2 cpd; onset (300 ms) - offset (700 ms)presentation mode. HFP protocol was used to obtain the isoluminance condition for every subject forall colour axes. Monocular VECP was obtained from a bipolar derivation. VECP response amplitudewas plotted against distance in the colour space to find electrophysiological thresholds. At least 8 colourpairs were used and the distance between the pair elements was progressively decreased to provide areliable linear fitting. Psychophysics contrast thresholds were obtained by the adjustment method usingthe same stimuli. As previously described, we found a negative deflection in the VECP related to thecolour contrast: as the contrast decreased, amplitude decreased and latency increased. We estimatedfor each colour axis the respective threshold contrast and plot the results in the colour diagram. Foreach subject, colour discrimination thresholds were plotted in the C.I.E. 1976 diagram, forming ellipticalcontours. VECP threshold for the zero amplitude level was slightly lower than psychophysics thresholds.Colour discrimination thresholds were very high in the deutan direction for the Daltonic subject with bothmethods. The present work extends the use of transient VECPs as a tool to evaluate human colour vision.The VECP results were consistent with psychophysics methods.
SUPPORTED BY CNPq and CAPES.
27 17:40 - Chromatic vision as a general strategy of colour process-ing in man and animals
M. VorobyevVision, Touch and Hearing Reserch Centre, University of Queensland, Australia
Perceptual separation of chromatic aspects of colour (hue and chroma) from luminance is a fundamen-tal property of human colour vision. It has been suggested that chromatic vision is an ancient mechanismthat helps animals to perceive colours largely invariant in conditions of patchy illumination in forestsand shallow water (Maximov, 2000). However, little research has been done to find if non-human ani-mals with colour vision perceive chromatic aspects of colour separately from luminance. Here I showthat birds and bees have chromatic and luminance mechanisms that are functionally similar to ours. Inhumans, birds and bees, stimuli subtending large visual angles are discriminated on the basis of theirchromatic properties— large variations in the intensity of light stimuli are ignored. In contrast, high spa-tial resolution vision is mediated by a luminance channel that is sensitive to changes in stimulus intensity,but is not sensitive to variation in the chromatic aspects of colour. The spatial resolution of chromaticand luminance channels varies greatly among different animal groups. Because colour vision in birdsand bees evolved independently, separate processing of chromatic aspects of colour from luminance isunlikely to be a consequence of constraints imposed on colour processing. I conclude that chromaticvision probably evolved independently in different animals to achieve colour constancy in conditions ofpatchy illumination.
Maximov V.V. (2000) Phyl. Trans. R. Soc. London. B 335: 1239-1242
27

28 18:00 - Naturalistic Color Discriminations in New World Mon-keys Having Different Combinations of M/L Pigments: Effectsof Luminance and Viewing Time
M.P. Rowe, G.H. JacobsNeuroscience Research Institute and Department of Psychology, University of California at Santa Barbara
X-linked photopigment polymorphism produces six different color vision phenotypes in most speciesof New World monkey. In callitrichids, the three alleles underlying these phenotypic differences arepresent at unequal frequencies suggesting that selective pressures beyond heterozygous-advantage maybe at play in these populations. Earlier we investigated this hypothesis with functional substitution, the useof a computer monitor to synthesize colors as they would appear to humans with monkey visual pigmentsinstead of their own (Rowe and Jacobs, 2004). The stimuli were derived from measurements of eco-logically relevant fruit and foliage. We found that, for some test conditions, discrimination performancedepended on the relative spectral positioning of the substituted M and L pigment pair. The M/L pigmentpair that has its absorption peaks separated by only 6 nm performed relatively poorly. More recent exper-iments have involved a systematic examination of two variables, luminance of the test fields and stimuluspresentation time. Under some conditions, discriminability of the simulated fruits did not depend uponwhich phenotype was simulated. Conditions which favored phenotypes with the larger pigment peakseparations tended to be those featuring higher luminance and shorter presentation times. These resultsindicate that an understanding of the selection pressures affecting photopigment allele frequencies willrequire careful study of the conditions that provide particular alleles with an advantage. Monkeys maycompensate for genetic disadvantages by preferentially performing activities under conditions in whichsuch disadvantages are minimized.
Rowe, M.P. and Jacobs, G.H. (2004). "Cone Pigment Polymorphism in New World Monkeys: AreAll Pigments Created Equal?", Visual Neuroscience, 21:217-222.
29 18:20 - Determinants of chromatic contrast detection in inferredparvocellular pathways
A.J. Zele, V.C. Smith, J. PokornyDepartment of Ophthalmology & Visual Science, The University of Chicago, 940 East 57th Street,Chicago, IL 60637, USA
Purpose: PC-pathway discrimination for equiluminant chromatic stimuli is controlled by the chro-maticity difference between the test field and the surround or border elements adjacent to the test field.Discrimination is best at the surround chromaticity and is independent of the size of the surroundingfield. The value of border contrast is presumably related to ongoing eye movements generating retinalborder contrast signals that are used by higher order processes for discrimination. The current studyinvestigates the effect of the proximity in space and time of the test field to the surround on chromaticcontrast discrimination. Methods: Chromatic contrast discrimination was assessed by a four-alternativespatial forced choice procedure. Thresholds were measured for a small test square presented in an innerquadrant (a corner located at the field center) or an outer quadrant (a corner and two borders abutting thesurround) of a larger square pedestal that replaced a rectangular surround. The pedestal was presented asa Pulsed-Pedestal replacing the surround or as a Steady-Pedestal within the equiluminant surround. Tem-poral presentation was a single cycle of a 1.5 sec raised cosine envelope and pedestals varied in L-conechromaticity at equiluminance (115 effective Td). The surroundwas either metameric to the equal energyspectrum, or of higher (l = 0.76) or lower (l = 0.62) L-cone chromaticity on a constant S-cone line. Ob-servers were required to identify the test quadrant where the square was detected. Results: Inner quadrant
28

tests: For the Pulsed-Pedestal paradigm, discrimination was the best at the surround chromaticity, whichis comparable to previous results. For the Steady-Pedestal paradigm, discrimination functions were flatterand less dependent on test or surround chromaticity. These functions indicate almost complete adaptationto the square-array and result in optimal or near-optimal discrimination at all test chromaticities. Outerquadrant tests: Results for both the Pulsed- and Steady-Pedestal were like the Pulse-Pedestal data forinner quadrant tests, with best discrimination at the surround chromaticity. Conclusions: Local chro-matic spatial structure is an important determinant of chromatic discrimination for steadily viewed lights.Discrimination is best when a test is entirely embedded in a surround of the same chromaticity. Bor-ders or surrounds dominate and degrade chromatic discrimination. However, borders provide a sustainedchromatic contrast signal and prevent fading of steadily viewed images.
30 9:00 - Surface color perception in three-dimensional scenes withnon-uniform spatial and spectral distribution of illumination:Estimating, representing and discounting the illuminant (invited)
L.T. Maloney1,2, K. Doerschner1, H. Boyaci31Department of Psychology, New York University2Center for Neural Science, New York University3Department of Psychology, University of Minnesota
Researchers studying surface color perception have typically used stimuli that consist of a small num-ber of matte patches (real or simulated) embedded in a plane perpendicular to the line of sight (a ‘Mon-drian‘, Land & McCann, 1971). Reliable estimation of surface properties analogous to color is a difficultif not impossible computational problem in such limited scenes (Maloney, 1999). In more realistic, three-dimensional scenes the problem is not intractable, in part because considerable information about thespatial and spectral distribution of the illumination is usually available. We describe a series of experi-ments that (1) explore how the human visual system discounts the spatial and spectral distribution of theillumination (SSDI) in judging matte surface color and (2) what cues the visual system uses in estimatingthe SSDI of in a scene. We find that the human visual system uses information from shading, cast shadowsand specular reflections in estimating the SSDI and, when more than one cue type is present, combinesthese cues effectively. The SSDI can be very complex in scenes with many different light sources. Weexamine (3) the limits of human visual representation of the SSDI, reporting an experiment intended totests these limits. Our results indicate that the human visual representation of the SSD of the illuminationin a scene is well-matched to the task of perception of matte surface color perception.
Land, E. H. & McCann, J. J. (1971), Lightness and retinex theory. Journal of the Optical Society ofAmerica, 61,1-11.
Maloney, L. T. (1999), Physics-based approaches to modeling surface color perception. In Gegen-furtner, K. R., & Sharpe, L. T. [Eds] (1999), Color Vision: From Genes to Perception. Cambridge, UK:Cambridge University Press, pp. 387-422.
29

31 9:35 - Cortical computations involving color, orientation and 3Dshape (invited)
Q. Zaidi1 , A. Li21 SUNY College of Optometry, New York, NY2 Queens College, CUNY, Flushing, NY
The human visual system has the remarkable ability to accurately perceive 3-D shapes in 2-D images.There is a controversy over whether purely chromatic information is sufficient for this process. To pro-vide definitive answers to this question, we examine the cortical computations involved in identificationof 3-D curvatures and slants. For shape from texture variations, we show empirically that the critical stepis the extraction of signature orientation flows around lines of maximum surface curvature (Li, & Zaidi,Three-dimensional shape from non-homogeneous textures: carved and stretched surfaces. Journal of Vi-sion, 4(10), 860-878, 2004). In images with putatively equiluminant orientation flows, 3-D shape can beperceived, but there is no way to guarantee the absence of luminance artifacts over the complete extent ofthe image. Instead, we exploit a special case where the image contains achromatic orientation flows, but3-D shape perception is hindered due to masking by neighboring non-critical orientation modulations.We show that in this case, correct shape perception requires 3-5 times more total cone-contrast for achro-matic flows than for chromatic flows, which rules out all possible luminance artifacts. The results showthat chromatic flows are masked significantly by achromatic orientation modulations, even if it is onlyhalf as much as masking of achromatic flows. Identification of 3-D shapes thus requires orientation selec-tive neurons that are tuned to combinations of chromatic and luminance stimulation (Johnson, Hawken &Shapley, Cone inputs in macaque primary visual cortex. J Neurophysiol. 91(6):2501-14, 2004). Orien-tation flows are also the critical component in shape identification from shading (Ben-Shahar & Zucker,On the Perceptual Organization of Texture and Shading Flows: From a Geometrical Model to CoherenceComputation, Proc. IEEE Conf. on Computer Vision and Pattern Recognition, Vol. 1: 1048-1055, 2001)and specular reflections (Fleming, Torralba & Adelson, Specular reflections and the perception of shape.Journal of Vision, 4(9), 798-820, 2004). These flows, however, extend around lines of minimum surfacecurvature, and are thus orthogonal to the flows extracted from texture deformations. For both types of flowextraction, we will show the successes and failures of population-coding and template-matching models.In particular, we will show the integral role played by neurons responsive to chromatic stimulation in thecomputation of 3-D shape from monocular 2-D images.
32 10:10 - Cortical areas involved in the global integration of localcolor differences evoking color transparency
R. Bouet1, M. Dojat2, L. Lamalle2, C. Segebarth2, K. Knoblauch1
1InsermU371, Cerveau et Vision, Dept. of Cognitive Neurosciences, IFR 19, UCB - Lyon1, Bron France,2UM 594 Inserm-UJF, Neuroimagerie Fonctionnelle et Métabolique, Université Joseph Fourier, GrenobleFrance
Purpose: Surface color perception requires the global integration of local tristimulus contrasts aswell as top-down processes to differentiate shadows, illuminance gradients and transparent layers fromthe intrinsic spectral characteristics of the surface. We exploit the phenomenon of color transparencyto identify cortical areas involved in the integration of local contrasts to extract global surface charac-teristics. Methods: Nine observers participated in an fMRI study (3 Tesla Bruker scanner, FunctionalT2*weighted EPI images: TR = 3 s, TE = 14 ms, flip angle = 80◦, voxel size = 3x3x3.3 mm3, StructuralMPRage sequence: TR = 12ms, TE = 4.6 ms,voxel size = 1 mm3). The stimulus was a 10.3 deg field ofrandomly placed colored disks (1.2 deg). Within an annular test region (1.0 and 6.9 deg, inner and outer
30

diameters, respectively), the disks were modulated (0.67 Hz) either coherently (evoking the appearanceof a transparent overlay) or incoherently, along one of two axes in color space (near either the LM or Saxis) at one of three modulation levels. Nine randomly chosen stimuli were presented in a block (27 sec).A scan session consisted of 20 blocks, alternating beween coherent and incoherent blocks, during which180 functional scans were acquired. For each observer, one structural scan and 4 functional scan sessionswere acquired. In half of the scan sessions, a dark contour (2.6 min) was added to the inner and outeredges of the annular test region. These conditions comprised a factorial design permitting the comparisonof region segmentation by coherent chromatic change with that generated by a real contour. Results:Neither the interaction nor the main effect of contour resulted in significant differential activations. Thefactor coherence resulted in significant differential activity in multiple visual areas in ventral occipitalcortex, including striate and extra-striate areas. Significant activity was also observed bilaterally in theparahippocampal gyrus (right: [19, -50, 0 mm] and left: [-15,-50,1], MNI coordinates), confirming previ-ous results obtained by us (all results corrected p = 0.05). Conclusions: The activations observed cannotbe attributed simply to a saliency effect linked to coherent contrast modulations as the introduction of acontour to increase the salience of the test region generated no significant differential pattern of activa-tion. The distribution of activity observed supports a role for a ventro-occipital network in the integrationof local cues in transparency perception. The activity of the parahippocampus links the extraction of atransparent layer with a site activated by object-related properties of an image.
33 10:50 - The perceptual structure of color corresponds to singu-larities in reflection properties
D. Philipona, J.K. O’ReganLaboratoire de Psychologie Expérimentale, Université Paris 5, 92774Boulogne-BillancourtCedex, France
One of the most basic aspects of color vision, namely the special role of the colors red, green, blueand yellow, is usually assumed to have a purely neuronal cause. We will show a fact that suggests afundamentally different origin: from the viewpoint of human photopigments, red, green, blue and yellowsurfaces alter light in a simpler way than all other surfaces. This is demonstrated by constructing a bio-logical restriction of the physicist‘s notion of reflectance that takes into account the statistical constraintssatisfied by natural illuminants and the limitations induced by human photopigments. Using a dataset ofnatural and artificial reflectances, we then show numerically that the existence and the identity of foursingular hues is actually to be expected from trichromatic theory alone, independently of any opponentmechanisms. This approach very directly provides correct quantitative predictions for psychophysicaldata about unique hues, hue cancellation, and cross-cultural data about color naming.
34 11:10 - Colour constancy is a function of the velocity of a movingsurface
A. WernerUniversity Eye Hospital Tübingen, Experimental Ophthalmology, 72076 Tübingen,Germany
Recently it has been demonstrated that colour constancy increases significantly if a surface movesacross a textured background (Werner, 2004), as compared to an equivalent static condition (typicalMondrian presentation). This was found to be selective for object motion, suggesting the involvement ofhigher order motion mechanisms. Different motion processes can be distinguished on grounds of theirtemporal characteristics. In order to evaluate the involved motion processes, the temporal tuning of theeffect of motion on colour constancy was determined. The background pattern consisted of a static het-erochromatic checkerboard pattern (18 x 18 deg, Lmean = 19.3 cd/m 2) in front of which a testfield (1.8
31

x 1.8 deg, Ltest = 19.3 cd/m 2) moved horizontally with constant speed. The chromaticity of the testfieldwas identical to the mean chromaticity and was under standard condition achromatic (u* = 0.197, v* =0.468). Colour constancy was tested for a simulated homogenous illumination change across the entiretest-pattern from D65 towards a perceptually green illumination (u* = 0.166, v* = 0.472) resulting ina chromaticity shift of testfield and background along an equiluminant L/M axis (∆E ∗ uv = 22.88).Colour constancy was measured using a hue cancellation method for the achromatic appearance of thetestfield after a 5 s adaptation period to the new illumination, whereby the testfield moved continuouslywith one of 8 different speeds (0.3 to 14 deg sec-1). Three subjects with normal colour vision (CambridgeColour Test) and normal visual acuity participated in the experiments. Colour constancy was found toincrease nearly linearly with speed, reached a maximum value around 2 deg sec-1 and then dropped offsharply at higher speeds. The corner value for higher velocities (velocity at which the motion inducedincrease of colour constancy has dropped to 1
2 of its maximum value) is equivalent to a temporal fre-quency of 2 Hz. It is therefore consistent with the temporal properties of the relatively slow third ordermotion/feature tracking system, which can be linked to tracking the position of objects moving across ascene (Lu & Sperling, 2001; Seiffert & Cavanagh, 1999).
The study was supported by the DFG (grant # We 1710 1/1) and the fortuene programme (Faculty ofMedicine, University of Tübingen; grant # 1059).
Lu, Z.-L. & Sperling, G. (2001) Journal of the Optical Society of America, A, 18, 2331-2370.Seiffert, A. & Cavanagh, P. (1999) Vision Research, 39, 4172-4185 Werner, A. (2004) Journal of
Vision, 4, 58.
35 11:30 - Color Appearance of Natural Objects
T. Hansen, S. Walter, K.R. GegenfurtnerDept. of Psychology, University of Giessen
Assigning a basic color name to an object and rating the amount of a particular hue is a fundamentalvisual capability. Traditional measurements of color appearance have used increment flashes or isolumi-nant stimuli of a homogeneous color. Natural objects, however,
do not contain a single color, but are characterized by a distribution of different chromatic hues. Herewe study color appearance using photographs of various natural fruit objects.
The stimuli were briefly presented on a CRT monitor. The stimuli were either homogeneous spots,or digital photographs of fruit objects (banana, orange, etc) and were displayed on a homogeneous whitebackground. In some of the experiments, the luminance of the background was varied above and belowthe medium gray. The chromaticity of the stimuli was varied in 36 equally spaced chromatic directionsin the isoluminant plane of the DKL color space. For each stimuli, subjects rated the amount of red,green, blue and yellow in the stimulus in a scale from 0 to 8. On a given run, each stimulus was presentedtwice in random order, and each run was repeated 5 times for a total of 10 judgments for each chromaticdirection.
In agreement with earlier studies we have found that the peak ratings for each color do not coincidewith the cardinal axis of DKL color space. Further, ratings generally do not differ depending on thebackground luminance. Here we only found a small effect for yellowish color directions, which receivehigher ratings at higher relative luminance values. For the fruit objects, we found a selective increase inthe rated color appearance in the direction of the natural fruit color. For example, the average rate foryellow was 5.14 (64%) for the color spots compared to 6.68 (84%) for the banana image.
We conclude that the distribution of hues within natural objects can have a profound effect on colorappearance and needs to be taken into account when predicting color appearance.
32

36 11:50 - Illuminant-independent judgements of surface colour innatural scenes
K. Amano1, D.H. Foster1, S.M.C. Nascimento2
1 Computational Neuroscience Group, Faculty of Life Sciences, University of Manchester, ManchesterM60 1QD, United Kingdom.2 Department of Physics, Gualtar Campus, University of Minho, 4710-057 Braga, Portugal.
Observers can readily judge surface colour in images of natural scenes during illuminant changes(Amano et al., 2004). Some theories of such judgements assume that the spectral properties of the il-luminant are used by the observer (D’Zmura and Iverson, 1993; Maloney, 1999). To test this hypothe-sis, a surface-colour-matching experiment was performed in which the illuminant was unambiguous andclearly visible to the observer. Images of natural urban scenes were presented on a computer-controlledcolour monitor with 10-bit resolution per gun. The scenes were reproduced from data obtained with ahigh-resolution hyperspectral imaging system (Foster et al., 2004). The colours of sky and test-surfaceswere manipulated independently. Sky colour was chosen from the daylight locus, so that it was initiallyneutral, bluish, reddish, or more reddish. Test-surface colour was chosen so that it was initially neutral,reddish, bluish, greenish, or yellowish. Each experimental session used just one sky colour and one test-surface colour, yielding twenty conditions in all. In each trial of each experimental session, two imagesof a natural scene were presented in sequence, each for 1 s with no interval, under two different daylightilluminants: the first with correlated colour temperature 25000 K, the second 6700 K. The spectral re-flectance of the test surface in the second image was changed randomly, consistent with a local changein daylight. The images, viewed at 100 cm, subtended approx. 17 ◦ - 14◦ at the eye. The observer‘s taskwas to decide whether the test surface in the two images was the same. Performance by 6 observers withnormal colour-vision was quantified with a constancy index in which 1 represents perfect constancy and 0perfect inconstancy. Mean performance over observers ranged from 0.56 to 0.88. There was, however, nosignificant effect of sky colour (F(3, 15) = 1.3, p> 0.3) or of test-surface colour (F(4, 20) = 0.8, p> 0.5).This result suggests that surface-colour judgements in natural scenes can be performed independently ofthe inferred illuminant, consistent with a theory based on relational judgements (Foster, 2003).
Amano, K., Foster, D. H. and Nascimento, S. M. C. (2004) Perception, 33, Suppl. 65.D’Zmura, M. and Iverson, G. (1993) Journal of the Optical Society of America A, 10, 148-2165.Maloney, L. T. (1999) Color Vision: From Genes to Perception, Cambridge University Press, 387-
416.Foster, D. H., Nascimento, S. M. C. and Amano, K. (2004) Visual Neuroscience, 21, 331-336.Foster, D. H. (2003) Trends in Cognitive Sciences, 7, 439-443.Supported by the EPSRC (grant nos. GR/R39412/01 and EP/B000257/1)
37 12:10 - Color Vision in Flatland: a Model of the Retinal andCortical Circuitry for Coding Color Computer Implemented fora One-Dimensional Cone Array
J. Neitz, J. Kuchenbecker, M. NeitzMedical College of Wisconsin, Milwaukee
How does the visual system represent color? What operations does it perform to transform cone sig-nals into a color code? What forms the circuits? To address these questions we have developed a modelfor the neural coding of color in which the cortical circuits for red-green color vision arise by hijack-ing the preexisting blue-yellow system. The model extends a random wiring hypothesis for red-greencolor vision that others have proposed. The initial assumption is that ancestors to modern primates had
33

a preexisting midget ganglion-cell system that signals differences in quantal catch between an individualcone photoreceptor and the average of its neighbors. Thus, if L and M cones are randomly distributed,any cone cell that has some neighbors of the other spectral type will automatically form the basis for aspectrally opponent ganglion cell. This solves the problem of deconfounding color and intensity infor-mation from the cones without any L/M cell-type specific postsynaptic neurons in the retina. However,the spectrally different cones are at slightly different spatial locations and this introduces a new confoundof color and luminance-edges at the level of the ganglion cells–diffuse colored light can produce exactlythe same response in a spectrally opponent ganglion cell as a dark/white edge. To deconfound the gan-glion cell signals, the cortex must perform an operation on the ganglion-cell input (which arrives via theLGN) that is analogous to that carried out by the midget ganglion-cell circuit on the cone signals. Thus,our model extends the random wiring hypothesis to the cortex by introducing a circuit that indiscrimi-nately differences the response from an individual neural input and the average of its neighboring inputs.This forms cortical circuits that resolve the confound between diffuse colored light and luminance edges,which is inherent to ganglion responses, without introducing any cell-type specific L/M connections andwithout invoking Hebbian learning to inform the appropriate neural wiring. Six different circuits, corre-sponding to 6 distinct percepts–black, white, red, green, yellow and blue, are imposed by the character ofthe peripheral receptor mosaic and by post-receptoral elements early in the neural pathway as a naturalconsequence of the proposed cortical circuitry that indiscriminately compares the activity of a cell withits immediate neighbors. Unexpectedly, in a departure from earlier random wiring theories that did notconsider higher processing, the model predicts that L/M opponent ganglion-cells without S cone inputwill not contribute to circuits for hue perception formed in the cortex; instead, they form circuits thatrespond to edges. These are presumably responsible for the percepts of black and white edges. As in theDeValois and DeValois multistage color model, all four hue percepts are the result of circuits with inputfrom S cones and the relationship between cone inputs and hue percepts are as they have proposed Ured,(L+S)-M; green, M-(L+S), blue (M+S)-L and yellow L-(M+S). This model extends the DeValois modelin proposing a straightforwardmechanism to form these circuits. Quite simply, midget ganglion cells thathave inhibitory S cone input in their surround become the basis for hue circuits in the cortex. The coneforming the receptive field center can be either L or M; ganglion cells can be either ON or OFF center.The resulting four possible combinations correspond to our four hues. An M cone center with S and Lsurround through a ON-center ganglion cell makes M-(S+L) Ugreen; the same receptive field throughan OFF-center ganglion cell makes (S+L)-MUred. An L cone center with an M and S surround makesL-(M+S)Uyellow; that receptive field through an OFF-center cell produces (M+S)-L Ublue. To demon-strate that the model functions as predicted, we have developed a computer program that implements itin a simplified visual system with a one-dimensional cone photoreceptor mosaic. The behavior of thecomputer model closely matches human hue perception.
Acknowledgments: Supported by R03EY014056
38 8:50 - Color shifts induced by S-cone patterns: Spatial structureat the S-cone or postreceptoral level?
S.K. Shevell1, P. Monnier21Visual Science Laboratories, University of Chicago, Chicago, IL 60637, USA2Department of Psychology, Florida Atlantic University, Jupiter, FL 33458, U.S.A.
Purpose: This study investigated chromatic induction from an inhomogeneous background pattern.The background had a pattern detected by only S cones. Previous studies showed a background with anS-cone pattern induced strong color shifts in a nearby test area (Monnier & Shevell, 2003). In previ-ous work, the S-cone patterns were composed with constant L- and M-cone stimulation over the entirebackground; in terms of L and M cones, therefore, the background was uniform. S-cone stimulation was
34

varied over space to produce the S-cone-isolated background pattern. These S-cone-isolated patterns,however, established spatial structure (the pattern) at both the receptoral level (S-cone stimulation) andthe postreceptoral level ( S/(L+M) ). Here, these two levels of pattern representation were unconfoundedto determine whether color shifts induced by S-cone-isolated patterns were due to spatial structure at thereceptoral or postreceptoral level. Methods: The color appearance of a test field was measured withseveral different background patterns composed of concentric circles alternating between two chromatic-ities. Pattern 1 had both S-cone and post-receptoral S/(L+M) variation. Pattern 2 had post-receptoralvariation (as in Pattern 1) but no S-cone variation. Pattern 3 had S-cone variation (as in Pattern 1) butno post-receptoral S/(L+M) variation. The properties of Patterns 2 and 3 were achieved by adjustingthe luminances of the two chromaticities composing the pattern. Color shifts induced by these patternswere measured using asymmetric matching. Results: Pattern 1 induced large shifts in color appearance,corroborating previous studies. Similar shifts were produced by Pattern 2 (only postreceptoral spatialstructure) but not by Pattern 3 (S-cone spatial structure). Conclusion: The large shifts in color appear-ance induced by S-cone patterns are mediated by signals in a postreceptoral S-cone pathway. Theseresults are consistent with a cortical neural mechanism with +s/-s spatial antagonism, as found in V1(Conway, 2001) and V2 (Soloman, Peirce & Lennie, 2004).
Conway B. R. (2001) Journal of Neuroscience, 21, 2768-2783.Monnier P. & Shevell S. K. (2003) Nature Neuroscience, 6, 801-802.Soloman, Peirce & Lennie (2004) Journal of Neuroscience, 24, 148-160.Supported by NIH grant EY-04802.
39 9:10 - The discoloration illusion
B. PinnaUniversity of Sassari, Dept. of Sciences of Languages, Italy
The watercolor illusion is a long-range assimilative spread of color (coloration effect) emanating froma thin colored line running contiguous to a darker chromatic contour and imparting a figural effect acrosslarge areas stronger than the one induced by Gestalt grouping and figure-ground principles. The figuraleffect is due to the asymmetric luminance contrast principle (Pinna, 1995): all else being equal, givenan asymmetric luminance contrast profile on both sides of a boundary (as is the case with the watercolorillusion made up of two juxtaposed parallel lines), the region whose luminance gradient is less abrupt isperceived as a figure, while the complementary more abrupt region is perceived as a background. Thisnew principle strengthens the unilateral border ownership. When six different chromatic lines are placedparallel and contiguous on a white background to create a gradient of luminance contrast (e.g. from darkblue to light blue), the coloration disappears, whereas, a clear "lighting" illusion emerges with light anddark regions that model the volume by strengthening the 3D appearance of the inner region. Under thesenew conditions, if the inner region is physically tinted with a light chromatic color (e.g. light red), theinner region appears white: the light red totally discolors. The effect disappears when the gradient isreversed and the length is reduced. Through psychophysical experiments the discoloration illusion hasbeen systematically measured. The results showed that the effect is not due to simultaneous contrast,differs from Craik-O’Brien-Cornsweet illusion, and depends on the "lighting" of the inner region. It issuggested that multiple lines stimulating neurons, selective for asymmetric edge profiles may signal notonly border ownership (von der Heydt et al., 2003) but also the phenomenal "lighting".
35

40 9:30 - Temporal nulling of induction from spatial patterns mod-ulated in time
F. Autrusseau1,2 , S.K. Shevell11Visual Science Laboratories, The University of Chicago, 940 E. 57th Street, Chicago, IL 606372IRCCyN-IVC, Ecole Polytechnique de l‘Université de Nantes Rue Ch. Pauc, La Chantrerie BP 5060944306 Nantes Cedex 3
Introduction: Asymmetric color matching shows that receptive-field organization accounts for largecolor shifts induced by chromatic patterns (Monnier & Shevell, 2003). Here, we used temporally-variedchromatic inducing light to infer receptive-field organization using a method that does not require a colorjudgment. Methods: Time-varying chromatic induction from a background was nulled by adding time-varying chromatic light within the test area. The phase and amplitude of this added light were adjustedby the observer to null the perceived temporal variation in the test. The whole stimulus was composedof a test ring flanked on each side by 4 concentric circles, alternating between chromaticities initiallyappearing "purple" and "lime". The inducing chromaticities differed in only S-cone stimulation. In vari-ous conditions, either the contiguous or noncontiguous chromaticity was temporally varied sinusoidallyfrom "purple" to "lime". The observer‘s task was to adjust the test ring‘s amplitude and phase in orderto null its perceived temporal modulation. Result and Conclusion: The results showed that contiguous-chromatic temporal modulation required an out-of-phase nulling modulation of the test ring, implyingassimilation. Non-contiguous-chromatic modulation required in-phase modulation of the test ring, im-plying contrast. The experiments here also showed that increasing temporal frequency from 0.5 to 4Hzdid not appreciably affect the induced color shifts. Overall, these results corroborate the +s/-s corticalreceptive-field organization inferred in previous studies that used asymmetric color matching. The re-sponse of this type of cortical receptive field increases with S-cone stimulation at its center and decreaseswith S-cone stimulation in the surround.
Monnier P. & Shevell S. K. (2003) Nature Neuroscience, 6, 801-802.This research was supported by PHS grant EY-04802.
41 9:50 - Induced Steady Color Shifts from Temporally VaryingSurrounds
A.D. D’Antona, S.K. ShevellVisual Science Laboratories, University of Chicago, Chicago, IL 60637, U.S.A.
Introduction: With a center-surround spatial configuration, varying the chromaticity of the surroundslowly over time induces apparent temporal chromatic variation into a physically constant gray center.The magnitude of the induced temporal modulation in the center is strongly attenuated when the surroundis at temporal frequencies above 3 Hz (DeValois, Webster, DeValois, & Lingelbach, 1986). Though thecenter does not appear to vary over time when the surround is modulated at these high frequencies, thecenter may still undergo a steady shift in chromatic appearance. This would occur if a nonlinear processprecedes the site of neural attenuation of temporally varying inducing signals. The present study inves-tigated whether a steady color shift was induced by a chromatically varying surround at high temporalfrequencies. Methods: Induced color shifts were measured as a function of the temporal frequency ofthe surround. The test field was an equal-energy white (EEW) annulus within a larger circular surround.Both borders of the annulus were separated from the surround by a thin dark gap (3 min.). The surroundwas temporally modulated along the L/(L+M) direction of MacLeod-Boynton space at 6% Michelsoncontrast. Several different temporal frequencies were tested, ranging from 0.5 to 37.5 Hz. The time av-erage of the surround was EEW. The observer adjusted the chromaticity of a separate annulus to match
36

the appearance of the test field. One match was to the peak and a separate match was to the trough ofinduced temporal modulation in the test annulus. If there was no apparent temporal modulation, the ob-server matched the steady appearance of the test annulus. Results and Conclusion: The measurementscorroborate the low pass attenuation (above ˜3 Hz) of induced temporally varying modulation from achromatic surround (DeValois et al., 1986). At temporal frequencies above 3 Hz, however, color shiftswere induced in the test area that appeared steady. A possible explanation for steady color shifts from atemporally varying chromatic surround is nonlinear temporal processing that precedes the low-pass atten-uation of induced temporal variation. The low-pass filter attenuates the high frequency component fromthe inducing surround but not a DC signal that results in a steady color shift.
DeValois R.L., Webster M.A., DeValois K.K., & Lingelbach B. (1986) Vision Research, 26: 887-897.Supported by NIH grant EY-04802.
42 10:10 - Effects of Motion and Configural Complexity on ColorTransparency Perception
P. Gerardin1, P. Roud1, S. Süsstrunk1, K. Knoblauch2 ,1EPFL, School of Computer and Communication Sciences, CH-1015 Lausanne, Switzerland2Inserm U371, Cerveau et Vision, Dept. of Cognitive Neurosciences, IFR 19, UCB - Lyon 1, Bron,France
Purpose: The General Convergence Model (GCM) (D’Zmura et al., 1997) predicts that systematicchromatic changes in a linear color space, such as translation and convergence (or a combination of both),lead to the perception of transparency. While this model is neither a necessary nor a sufficient conditionfor perceptual transparency (Chen & M. D’Zmura, 1998; F. Faul & V. Ekroll, 2002), it describes in asimple fashion a large number of color changes that do evoke transparency. We tested whether motionand configural complexity affect perceived transparency generated by this model. Methods: Severalchromatic changes consistent or not with the GCM were generated. The stimuli consisted of a bipartiteor a checkerboard configuration (10x10 deg), displayed in the center of the monitor, with a central staticor moving overlay (5x5 deg). The CIE LUV space was chosen to specify three vector lengths. Five chro-matic transformations were considered: translation, convergence, shear, divergence and rotation. Threedifferent luminance levels (vectors point to a higher, equal or lower luminance) were also explored. Atotal of 720 stimuli were presented to three observers. Subjects sat in a dark room, in front of the monitorat 50cm from the screen. The set of all patches was presented in a randomized sequence. For each patch,the observer judged whether the overlay was transparent or not. The relation between the classificationjudgments and the stimulus categories was evaluated using a log-linear model. Results: The main resultsshowed that observers’ responses are influenced by each of the above cited parameters. Convergencesappear significantly more transparent when motion is added for bipartite configurations, or when theyare generated in a checkerboard configuration. Translations are influenced by both configuration andmotion. Shears are observed as opaque, except when short vector lengths are combined with motion,then the overlay tends to be transparent. Divergences are strongly affected by motion and vector lengths,and rotations by a combination of checkerboard configuration with luminance level and vector length.Conclusions: Our results reveal different conditions which evoke opacity or transparency, that is whenmotion is added, or when stimulus configuration is changed. These results question the generality of theGCM across configurations when non-color cues change, and indicate that adding motion and stimuluscomplexity are not neutral with respect to the chromatic shifts evoking transparency. Thus, studies thathave used motion to enhance transparency may yield different results from those that did not about thecolor shifts supporting transparency perception. The same might be supposed for stimulus complexity.
V.J. Chen & M. D’Zmura (1998) Test of a convergence model for color transparency. Perception,27:595–608.
37

M. D’Zmura, P. Colantoni, K. Knoblauch, & B. Laget (1997) Color Transparency. Perception,26:471–492.
F. Faul and V. Ekroll (2002) Psychophysical model of chromatic perceptual transparency based onsubstractive color mixture. J. Opt. Soc. Am. A, 19(6):1084–1095.
43 10:50 - Maximal and minimal hue shifts in the near periphery:is there a link with ambiguous and unambiguous (unique) hues?
N.R.A. Parry1, D.J. McKeefry2, I.J. Murray31Vision Science Centre, Manchester Royal Eye Hospital, UK2Dept of Optometry, University of Bradford, UK3Visual Sciences Lab, Faculty of Life Sciences, University of Manchester, UK
Colour perception changes markedly as a function of retinal eccentricity. The magnitude of the per-ceptual shift depends strongly on hue and is largely defined by shifts in hue and saturation. We recentlyreported the independence of the saturation and hue effects (Journal of Vision, 2004, 4(11), 10a; FallVision Meeting abstract). The use of very large stimuli minimises the saturation shift whilst the hue shiftappears to be independent of stimulus size and luminance. Furthermore, the stimuli that show maximumhue shift are not the same as those that show maximum saturation shift. To explore the notion that theinvariant hues (those which do not shift with eccentricity) may be linked with unique hues, we studiedthe peripheral colour vision of 9 colour-normal subjects, measuring their shifts in colour appearance andtheir unique hue functions.
In the colour appearance experiment, S matched a 1deg nasal test spot (diameter 1deg) with an 18degnasal probe spot (diameter 3deg). Test and probe were flashed simultaneously on a white 12.5cd/sq mbackground for 380ms. S had free control over hue, saturation and luminance of the probe. 25 testchromaticities were equally spaced around a hue circle in MBDKL colour space. All 9 Ss showed similarhue and saturation functions. Four regions of colour space showed maximal hue shifts: to match testswith chromatic angles of 75deg and 255deg (approx blue and yellow), the mean probe hue was 30degand 224deg (negative hue shifts), while 150deg and 330deg tests needed smaller positive hue shifts ofbetween 5 and 10deg. There were 4 intermediate null points (showing no hue shift), with chromaticangles of 123, 170, 300 and 358deg. The same probe stimulus was used in a simple colour namingtask, in which S assigned one of 4 colour names (red, green, blue or yellow) to each of 21 hues aroundthe colour circle, randomly repeated 10 times. These gave rise to R, G, B and Y unique hue functionswhose maxima showed a close relationship with the invariant hues previously measured. Green showedthe poorest correspondence, and is known to show the greatest variation in unique hues. The hues thatvaried most with eccentricity showed a close relationship with the least unique hues (i.e. those whichwere equally likely to be called either of two adjacent colours). Whilst it might be argued that invarianthues may anchor our perception and be the candidates for unique hues, it is an equally attractive notionthat those colours which show the greatest variation may be those which are most ambiguous.
44 11:10 - Colour stimuli perception in presence of light scattering
M. Ozolinsh1, M. Colomb2, G. Ikaunieks1 and V. Karitans11University of Latvia, Department of Optometry and vision science,LV-1063 Riga, LATVIA2Laboratoire Régional des Ponts et Chaussées de Clermont-Ferrand, 63017 Clermont-Ferrand, France
Perception of different colour contrast stimuli (Landolt-C red, green, blue and yellow letters on white(grey) background) was studied in adverse viewing conditions: in a fog chamber in Clermont-Ferrand;and in laboratory where controlled light scattering decreasing the visual acuity at similar level was in-
38

duced by means of PDLC polymer disperse liquid crystal eye occluders (Ozolinsh and Papelba, 2004).Parallel to that other measurements: the presence of the red-green-blue (L/M and M/S) cone system sen-sitivity changes to the LCD display R, G, and B channel emission spectra in fog, and the decrease ofthe colour stimuli contrast sensitivity increasing the fog density were performed in both experimentalconditions.
Blue (shortest wavelength) light is scattered in fog at the greatest extent, that can cause determina-tion of vision quality especially for the monochromatic blue stimuli. However if the blue stimuli werepresented on the white background visual acuity in fog for blue Landolt-C optotypes was the highest ascompared to red and green optotypes. The colour intensity of Landolt-C optotypes presented on LCDscreen was chosen corresponding to the blue, green and red colour contributions in achromatic whitestimulus (equal computer R, G or B values for chromatic stimuli as in the achromatic white background).Thus the blue stimuli had the greatest intensity contrast, and besides: blue stimuli on white backgroundcorrespond to uniform stimuli blue distribution within all stimuli area either within white backgroundor within stimuli C optotype area and sequently the greater shorter wavelength scattering does not alterblue stimuli perception. Search time of different colour stimuli and dynamic visual acuity (up to stimulispeed 30 degree/sec) also were determined in simulated fog conditions using scattering obstacles withcontrollable degree of light scattering. These experiments also revealed the smallest increase of visualsearch times and better dynamic visual acuity in fog for blue-white colour contrast stimuli comparingwith red-white and green-white combinations used in road and traffic signs.
Ozolinsh, M. & Papelba G. (2004), Ferroelectrics, 304, 207–212.
45 11:30 - Resolution of binocular color rivalry: Perceptual mis-binding of color and form
S.W. Hong, S.K. ShevellVisual Science Laboratories, University of Chicago
Purpose: How are separate neural representations of color and form combined to give a unifiedpercept? Dichoptic presentation of rivalrous chromatic gratings with low luminance contrast reveals per-ceptual misbinding of color and form. This implies (1) resolution of color rivalry goes beyond simplecolor dominance and color mixture and (2) luminance contrast affects binding of color and form. Meth-ods: An equiluminant square-wave red/gray grating was presented to the left eye and an equiluminantblue/gray grating to the right eye (the two chromatic components were in phase). After an initial per-cept of rivalry (less than 30 sec) these stimuli resulted in a perceived red/blue grating. This two-colorperceived grating is not consistent with previous studies of dichoptic presentation of two chromaticities,which report either binocular color rivalry or binocular color mixture (Ikeda & Sagawa, 1979; de Weert& Wade, 1988). Instead, the percept reveals misbinding of the color presented to each eye to the fusedperceived form. In experiments here, observers dichoptically viewed for 1 minute two rivalrous 2cyc/deggratings with different chromaticities. The visibility time was measured for four percepts: left-eye stimu-lus, right-eye stimulus, fusion of the two colors, or a two-color (e.g. red/blue) grating. The chromaticitiesand luminance contrast of the gratings were varied systematically. Results: The percept of a two-colorgrating (misbinding) was not observed (1) with only S-cone contrast in the grating or (2) with Michelsonluminance contrast in the grating above 20%. In general, either misbinding (at low luminance contrast)or color mixture (at high luminance contrast) was observed, but not both of them. Conclusions: The per-ceived two-color gratings show that the two rivalrous chromaticities are both represented neurally whencolor and form are combined to give a unified percept. "Resolution" of competing chromatic signals fromthe two eyes is not restricted to color dominance and color mixture. The transition from misbinding tocolor mixture caused by increasing luminance contrast implies that luminance contrast at edges has animportant role in the correct localization of color and form.
39

Ikeda, M. & Sagawa, K. (1979) Journal of Optical Society America, 69, 316-321.de Weert, C.M.M. & Wade, N.J. (1988) Vision Research, 28, 1031-1040.This research was supported by PHS grant EY-04802.
46 11:50 - A whiter shade of pale, a blacker shade of dark: Para-meters of spatially induced blackness
DL. Bimler1, G.V. Paramei2, Ch.A. Izmailov31 Department of Health and Human Development, Massey University, New Zealand2 Hanse Institute for Advanced Study, Delmenhorst, Germany3 Department of Psychophysiology,Moscow State University, Moscow, Russia
The surface-mode property of "Blackness" is induced by simultaneous contrast with adjacent, moreluminant subtends. Numerous studies have shown that the degree of blackness induced within an achro-matic test field is a function of the relative luminance of the adjacent chromatic inducing field, but notof its hue. The converse may not be true for chromatic test fields, where susceptibility to blackening hasbeen reported to vary with wavelength. In the present study we questioned whether ’white’ and ’black’sensory components function as opposites in blackness appearance. We recorded the appearance of acentral monochromatic test field (with wavelength ranging across the visible spectrum) while a broad-band white annulus was set to six luminance levels ranging across three log steps. Three colour-normalobservers followed a colour-naming technique. All six opponent-hue names and their combinations wereresponse options; blackness and whiteness in the test field could therefore be reported independently. Ofprimary interest were the achromatic responses, which revealed the ‘white-to-black‘ dimension when rep-resented within a multidimensional space, but in addition a quality (dimension) of ’desaturation’. Com-pared against chromatic properties of the test field, the results provide evidence that blackness inductionis a function of field brightness (not luminance). This confirms observations made by Shinomori et al.(1997) using a different procedure. These findings have implications for the stage of visual processinginvolved in blackness induction. This necessarily occurs downstream from the origin of the Brightnesssignal from a combination of opponent-process channels.
Shinomori, K., Schefrin, B. E. & Werner, J. S. (1997) Journal of the Optical Society of America A,14, 372-387.
47 12:10 - Remote Induction Effects in Achromatic Color Percep-tion and Their Modulation by Local Contrast
M.E. RuddDepartment of Psychology, Box 351525, University of Washington, Seattle, WA 98195-1525
Distance-dependent edge integration models (Reid & Shapley, 1988; Rudd & Arrington, 2001; Rudd& Zemach, 2004) assert that the achromatic color of a square surrounded by a frame is computed froma weighted sum of the contrasts, or log luminance ratios, at the inner and outer edges of the frame, witha larger weight given to the inner edge. Rudd and Arrington (2001) further posited that the weight givento the outer edge decreases in proportion to the log luminance ratio of the inner edge, an edge interactioneffect that they referred to as ‘blockage.‘ Here, the blockage assumption was tested in an achromaticcolor matching experiment involving two dark squares, each surrounded by a light frame. The framesurrounding the left (matching) square was wider than the frame surrounding the right (target) square.Two observers adjusted the matching square luminance to achieve an appearance match to the target asa function of the background luminance, which was varied over a range spanning the frame luminance.
40

For this display, all distant-dependent edge integration models predict that the target appearance, as mea-sure by the observer‘s matching disk settings, will decrease monotonically with increasing backgroundluminance. Consistent with this prediction, both observers‘ average match settings decreased as a linearfunction of the background luminance on a log-log scale. When the experiment was repeated with targetsquares of different luminances, the estimated weight given to the outer edge was found to be modulatedby the local luminance ratio of the inner frame border, as predicted by the blockage model, but not byother edge integration models. However, the direction of the modulation was not always consistent withthe blockage hypothesis. Depending on the contrast polarities of the inner and outer frame edges, andthe background level, the effect could be one of either blockage or enhancement. To account for thesefindings, a neural model is proposed in which the modulation of remote induction effects by local contrastresults from additive and subtractive gain control processes operating between oriented spatial filters thatencode the log luminance ratios at edges.
Reid, R. C., & Shapley, R. (1988). Vision Research, 28, 115-132.Rudd, M. E., & Arrington, K. F.(2001). Vision Research, 41, 3649-3662.Rudd, M. E., & Zemach, I. K. (2004). Vision Research, 44, 971-981.
48 14:00 - The influence of circulating glucose and oxygen concen-trations on cone and rod sensitivity in IDDM diabetics and nor-mal subjects
A. Kurtenbach, H. Mayser, E. ZrennerDepartment of Pathophysiology of Vision and Neuro-ophthalmology, University Eye Hospital, 72076Tuebingen, Germany
Visual function is critically dependent on a continuous oxygen supply to maintain the large energyrequirements of the photoreceptors. A reduction of the oxygen supply is thought to play a major role inthe development of a diabetic retinopathy. In this study we asked if it is possible to ameliorate early visualdeficits in diabetics by increasing their blood oxygen level, and what effect this, as well as an increasedglucose level, has on the sensitivity of the photoreceptors in normal subjects. Cone and rod function weremonitored by recording dark adaptation curves while inhaling either air (20% O2 + 80% N2) or 100%oxygen. Pupils were dilated and the increment threshold for a green and a red stimulus, subtending 120deg, was measured alternatively every minute for 40 mins after an initial 3 min bleach of around 5.24 logtds. The results of 12 IDDM patients with no (10) or mild (2) retinopathy (mean age 25.0 years) werecompared to those of an age-matched control group of 12 healthy, non-smoking, subjects (mean age 24.75years). Additionally, using a glucose clamp technique, we repeated the experiment in 10 of the controlsubjects with elevated blood glucose concentrations (mean 160 mmolL-1). Oxygen inhalation led to adecrease in threshold for both the cone plateau and the final threshold in the results of the diabetic groupbut had less effect on the results of the control group. The cone plateau, but not the absolute thresholdwas significantly dependent on the glucose level of the blood in control subjects, showing a decreasein threshold with elevated blood glucose. These results show that oxygen inhalation improves both rodand cone sensitivity in diabetics without retinopathy. Cone but not rod sensitivity is dependent on theconcentration of circulating glucose.
41

49 14:20 - Color vision in male and female asymptomatic carriersof LHON‘s 11778 mtDNA mutation
D.F. Ventura1, M. Gualtieri1, A.G.F. Oliveira1, M.F. Costa1, P. Quiros2, V. Carelli3, A. Berezovsky4, S.R.Salomão4, A.A. Sadun2
1Dept. of Experimental Psychology, University of São Paulo, São Paulo, Brazil2Keck School of Medicine, University of Southern California, Los Angeles, CA;3University of Bologna, Bologna, Italy;4Federal University of São Paulo, São Paulo, Brazil
Leber’s hereditary optic neuropathy is a maternally inherited disease, associated with mitochondrialDNA point mutations and characterized by sudden and profound loss of visual acuity and dyschromatop-sia. Only a small percentage of a pedigree becomes affected, with a much greater penetrance in men,(from a 2.5:1 to a 5:1 ratio of affected males to females, in different studies). Here we investigate thepossibility of visual losses in clinically asymptomatic 11778 LHON carriers of both genders from a re-cently discovered extensive family living in a rural area in Brazil. Colour thresholds were determinedmonocularly with the Cambridge Colour Test (CCT) in 27 LHON carriers (10 male and 17 female) and76 age-matched controls (39 male and 37 female). Inclusion criteria were absence of known ophthalmo-logical complaints and 20/30 bc VA or better. We used the Trivector procedure of the CCT (CRSLtd),with a VSG 2/5 card and a Sony Trinitron video monitor, calibrated with a Minolta CS1000 photome-ter. McAdam Ellipses were obtained from carriers with altered Trivector thresholds. Abnormal protanand/or deutan thresholds were found in 83% of the carriers (57% protan and 76% deutan), those withhigher thresholds also had elevated tritan thresholds (45%). Male thresholds were significantly largerthan female’s (Student t test; p<.05). Color vision abnormalities found in asymptomatic LHON carriersare consistent with the hypothesis that LHON should be considered as a chronic disease shared by themajority of the carriers, which may undergo an acute phase, triggered by mechanisms still unknown, ina small part of these patients. The higher penetrance of the disorder in males is reflected in the greateramount of losses compared to females.
50 14:40 - Color discrimination in long term type 1 diabetes melli-tus.
A. Serra, I. Zucca, E.R. Salaris, M. FossarelloInstitute of Ophthalmology University of Cagliari, 09124 Cagliari (Italy)
Recently we had the opportunity to re-examine a number of patients suffering from type 1 diabetesmellitus who were admitted to our Clinic in 1979-82 and in 1997 for a study of visual performance; in thatstudy also color discrimination was thoroughly evaluated. Now the color discrimination was tested againto analyse the possible changes that occurred in the meantime. Nine informed and very collaborativepatients, 7 female and 2 males (aged 40-58 yrs) suffering from type 1 diabetes mellitus were re-examinedfor the present study. Each subject was given a complete ophthalmic examination, including slit-lamp,tonometry, fluorescein retinal angiography, refraction, V.A., and ocular motility. All subjects were testedfor color vision discrimination using Ishihara plates, Farnsworth-Munsell (FM) 100-hue test and theLanthony desaturated 15-hue test. The results show that all patients but one, had good metabolic controlwithout retinopathy or mild retinopathy; in spite of long term duration of the disease (24-30 yrs) colordiscrimination is not consequently impaired, but in some cases have had an improvement. We wonder ifthe progressive better metabolic control and the informed participation of the patients like autoregulationare responsible of the improvement.
42

51 15:00 - Functional specialisation for the processing of colour cat-egories in the cortex–evidence from clinical studies
F.G. Veit1, G. Plant2, J.L. Barbur11Applied Vision Research Centre, The Henry Wellcome Laboratories for Vision Sciences, City Univer-sity, London UK2National Hospital for Neurology and Neurosurgery, Queen Square, London, UK
"Opponent" processing of cone photoreceptor signals in neural substrates located early in the visualpathways is sufficient to generate two, polarity-sensitive signals that describe the four distinct "cardinaldirections" in colour space. Cone contrasts based on thresholds for detection of yellow-blue and red-greencolour changes show convincingly that equal S-cone increments and decrements lead to the perceptionof "blue" and "yellow" stimulus colours, respectively, whilst positive and negative L-M cone contrastsignals of equal magnitude yield "red" and "green" colours, in the absence of S-cone signal changes.Many studies support the implication that the same neural substrates generate polarity sensitive signalsthat describe red-green and yellow-blue perceived colours, both in the retina and in the lateral geniculatenucleus (1-3). The processing of opponent colour signals and the generation of perceived primary coloursin extra striate areas of the cortex is less well understood. Double-opponent cells in the primary visualcortex often possess both spatial and chromatic antagonistic organisation, but many other cells in V2and more anterior areas of the cortex respond selectively only to a narrow range of wavelengths andare therefore no longer chromatically "opponent" (4). Studies in patients with diseases of the retina andthe optic nerve tend to produce symmetric loss of red-green or / and yellow-blue chromatic sensitivity.Generally this is also the case in patients with cortical lesions when loss of colour vision is involved(5). In order to establish how damage to extra striate areas of the cortex may affect the processing ofchromatic signals, we measured thresholds for detection of moving, colour-defined stimuli at the foveaand in each of the four quadrants (˜6 degrees away from fixation) in 20 subjects with cortical damage.Chromatic thresholds were measured with the CAD test using stimulus conditions that isolate the use ofcolour signals. The results reveal a number of interesting findings suggesting that selective damage toneural substrates in the cortex can cause differential loss of colour, contrast acuity and first-order motionsensitivity. More specifically the results show that: T Severe loss of red-greenwith almost normal yellow-blue sensitivity was observed in ten of these subjects. T Two subjects showed significantly greater lossof "red" than "green" sensitivity. The loss can also be location specific i.e., the loss may only affect thefoveal region or one of the four quadrants. Three subjects show the opposite effect when the loss ofsensitivity affects mostly "green" stimuli. T Four subjects showed significantly greater loss of sensitivityfor "yellow", but not for "blue" stimuli. T Chromatic sensitivity was spared selectively in two subjectsthat exhibited massive loss of contrast acuity and motion sensitivity at the same location in the visualfield. The results show that the processing of chromatic signals in the cortex involves distinct neuralsubstrates that map different regions of the visual field as has been shown in imaging studies (6). Inaddition, the results suggest that the processing of different colour categories is also carried out in distinctneural substrates and that selective damage to brain tissue can result in loss of chromatic sensitivity thataffects selectively the perception of single colour categories. “Functional specialisation“ in distinct areasof the cortex has been proposed to account for the intensive processing of specific stimulus attributes andthe selective loss of visual function that follows destruction of such areas (7). The findings from this studysuggest that this principle is an inevitable consequence of the need to extract unique stimulus features atsome level of visual processing. More importantly the results imply that different neural substrates areinvolved in processing red-green and yellow-blue discrimination as well as single colour categories.
1. Smith, V. C. & Pokorny, J. (1975) Vision Research 15, 161-171.2. De Valois, R. L. & De Valois, K. K. (1975) in Handbook of Perception, eds. Carterette, E. D. &
Friedman, M. P. (Academic Press, New York), pp. 117-166.3. Derrington, A. M., Krauskopf, J. & Lennie, P. (1984) J. Physiol. (Lond) 357:241-65, 241-265.
43

4. Kiper, D. C., Fenstemaker, S. B. & Gegenfurtner, K. R. (1997)Visual Neuroscience 14, 1061-1072.5. Barbur, J. L., Harlow, A. J. & Plant, G. T. (1994) Proc. R. Soc. Lond B Biol. Sci. 258, 327-334.6. McKeefry, D. J. & Zeki, S. M. (1997) Brain 120, 2229-2242.7. Zeki, S. M. (1978) Nature 274, 423-428.
52 15:40 - Clinical color vision tests, Practical tasks and Discrimi-nant analysis
S. Ramaswamy, J.K. HovisSchool of Optometry, University of Waterloo, Waterloo, Ontario, Canada
The purpose of this study is to determine which clinical color vision test can best predict the colornaming performance on two slightly different sets of VDT colors. The first color set consisted red, yellow,green, blue-green, dark-blue, purple, white and grey. The second set consisted red, yellow, orange, green,dark green, light blue, dark blue and grey. One hundred color-normals and fifty two color-defectivesparticipated in the study. Pass/Fail criteria for the color naming task was established based on number andtypes of color normal errors. Discriminant analysis was performed to determine how well clinical testspredict performance of the color defective group on the color identification tasks. The analysis showedthat the combination of the Adams D-15, Farnsworth D-15 and HRR (third edition) were significantpredictors of performance for the first color set with a specificity of 0.82 and a sensitivity of 0.75. Thestepwise analysis showed that the minimum number of tests required to predict the performance was two,the Adams D-15 and Farnsworth D-15. The specificity and sensitivity was 0.82 and 0.75 respectively.For the second color set, the combination of the Farnsworth D-15, Adams D-15, HRR (third edition) andCN Lantern were significant predictors of performance with a specificity of 0.96 and sensitivity of 0.67.The stepwise analysis showed that the minimum number of tests required to predict the performance wasonly the Farnsworth D-15 with a specificity and sensitivity of 0.96 and 0.67 respectively.
The results were unexpected considering that the first color set had lower failure rate than the secondcolor set. One would expect the less sensitive test to be the best predictor to separate the pass/fail in thefirst color set and the more sensitive test for the second color set. The reason why different tests emergedas best predictors for the first and second color sets was because the Discriminant analysis works tooptimize the sensitivity and specificity of the clinical tests. For the first color set, the Adams D15 isweighted higher because its higher sensitivity compensates for the higher specificity of the FarnsworthD-15, adding the Farnsworth D-15 marginally improves the specificity of the clinical tests. In contrast, forthe second color set, the Farnsworth D-15 emerges as the minimum test because its specificity is higherthan the Adams D-15 and this compensates the Adams D-15‘s higher sensitivity. Although discriminateanalysis does indicated which clinical test(s) can best separate between groups on a color-related task, onestill has to look at both the sensitivity and specificity values to determine whether discriminate analysismodel should be applied.
53 16:00 - Visual acuity with isoluminant coloured stimuli for am-blyopic eye and defocused eye
G. Krumina, G. Ikaunieks, M. OzolinshUniversity of Latvia, Department of Optometry and Vision science, Riga, LATVIA
In real eye examination the visual acuity usually is determined using standard charts with black let-ters on a white background. At the same time Westheimer et al (2003) have applied the reversed-contrastchart (white letters on a black background) to show improving of visual acuity for older subjects. Visualacuity established by colour stimuli should be worse comparing to black-white stimuli, due to lowering of
44

the chart luminance contrast. We estimated difference in visual acuity with coloured stimuli comparingto that for high contrast black-white stimuli for real amblyopia and blurring cases. Tests were generatedon computer screen. Visual acuity was detected using different charts in two ways: standard achromaticstimuli (black symbols on a white background) and isoluminant coloured stimuli (white symbols on ayellow background, grey symbols on blue, green or red background). Thus isoluminant tests had colourcontrast only but hadn‘t luminance contrast. Visual acuity evaluated with the standard method and colourtests were studied for subjects with good visual acuity, if necessary using the best vision correction. Thesame was performed for subjects with induced blurring and real amblyopia. Blurring was realized withoptical lenses placed in front of the good seen eye or in front of the best vision correction. Experimentswere performed when eyes were adapted to dark room conditions and in the normal lightened room (ap-proximately 200-300 lx). The obtained results applying the isoluminant colour charts revealed worseningof the visual acuity comparing with the visual acuity estimated with a standard high contrast method(black symbols on a white background): 2.4± 0.8 times decrease for defocusing, however only 1.7± 0.3times for real amblyopia.
54 9:00 - Irregular sampling and photoreceptor non-linearity can"make sense" for color perception (invited)
J. HéraultLaboratoire des Images et des Signaux, INPG, Grenoble, France
Let us think about the problem that Nature had to design a functional retina: which kind of trick wouldbe optimal (or not so bad) to sample our three-dimensional world plus the wavelengths axis onto the twodimensions of a retina? Even if Shannon‘s theorem had existed several millions years ago, it would nothave been of any help. In this talk I will address two problems: the one of the spatio-chromatic samplingand the one of compensating for the wide lighting‘s intensity range. For the first one, I will show howthe irregular disposal of the three cone types on the retinal surface can lead to interesting properties aboutcolor coding (e.g. color-oppositions) and how this coding passes through the retinal spatio-temporal filter(high-pass filtering of luminance and low-pass filtering of chrominance). Concerning the second problem,I will show how the photoreceptor‘s compression law, able to adapt according to the temporal and spatialcontexts, may lead to a robust color coding scheme and particularly to a simple color constancy processtied to the early stage of the visual system.
55 9:35 - Non linear and uniform filtering for estimating spatialinformation in the cone mosaic
D. Alleysson1, B. Chaix2, J. Hérault21 Laboratoire de Psychologie et Neurcognition, Grenoble, France2 Laboratoire des images et des signaux, Grenoble, France
In the cone mosaic, spatial and chromatic information is mixed, i.e., the achromatic map (defined asthe spatial information without chromatic content) is confounded with the chromatic map (distributionof chromatic information at constant luminance). We have previously shown (Alleysson & al., 2005)that in case of a regular arrangement of chromatic samples in the mosaic, a linear algorithm is able toextract achromatic spatial information and to interpolate chromatic information. In fact, the regularity ofchromatic samples permits the localization of luminance and chromatic-opponent signals in the Fourierspectrum which in turn permits their separation using uniform linear filtering. However, in the case of anirregular arrangement, luminance and chrominance are no longer localized and a non linear algorithm isneeded. Which non linear algorithm is best? We show that a non linear normalisation of photoreceptor
45

response follow by a uniform linear filtering is able to estimate accurately the achromatic information inthe cone mosaic.
Alleysson, D, Susstrunk, S and Herault, J (2005) IEEE Trans. Image Processing, vol. 14, no 4.
56 9:55 - Theoretical limits of cone-excitation ratios
A.D. LogvinenkoDepartment of Vision Sciences, Glasgow Caledonian University
The ratios of cone excitations produced by light reflected from two different surfaces remain "almostinvariant" under changes in illumination, both for Musell colour samples (Foster and Nascimento, 1994)and also for surfaces in natural scenes (Nascimento, Ferreira, and Foster, 2002). However, an importantissue remains open: to what extent does this invariance of cone-excitation ratio depend on the populationfrom which the sample is drawn? In an attempt to address this problem, we calculated the maximumof all the possible cone-excitation ratios (i.e. for all possible reflectances) for various sets of daylightspectra (correlated colour temperatures 4300-25000 K). The resulting ratios are far from invariant. Itshould be mentioned, however, that the maximum of deviation from the cone-excitation ratio invariancewas achieved for ideal surfaces which either reflect all the light (for some wavelengths), or none (for therest of the wavelengths). Such surfaces cannot be implemented in reality.
Foster, D. H. & Nascimento, S. M. C. (1994) Proc. R. Soc. London Ser. B 257, 115-121.Nascimento, S. M. C., Ferreira, F. P., & Foster, D. H. (2002) J. of Opt. Soc. Am. A 19, 1484-1490.
57 10:15 - Macular Pigment: Nature’s Notch Filter III
J.D. Moreland1, S. Westland2
1MacKay Institute, Keele University, UK2School of Design, University of Leeds, UK
The effect of changes in macular pigment (MP) in Normal and Anomals, assessed using a data setof 1782 reflectance spectra of natural and man-made colours, was reported at the Cambridge ICVSSymposium1. It was found that increases in MP enhanced differences in both L and M cone responses:the effect being largest for Deuteranomals and smallest for Protanomals. Using cone fundamentals de-fined by the Stockman & Sharpe2 photopigment template, chromaticities are computed for Normals andputative Protanomals (for whom the anomalous L pigment is shifted between the normal L andM spectrallocations). The chromaticity diagram (an analogue of the MacLeod-Boynton3 cone excitation diagramadjusted to be approximately uniform for Normals) is sampled by a rectangular array of square cells. Cellsize is set equal to one centred on Source C that contains just 29 of the 1782 colours from the data set.Changes in chromaticity variance, for 100 cells (containing at least 5 colours), are mapped in Normaland Protanomalous colour spaces. The response of putative Protanomals to increases in MP is a contin-uous function of the anomalous L pigment location. A geographic analysis of local variance confirmsthe presence of systematic patterns: L-M cone enhancement factors show valley characteristics centredon the illuminant and oriented towards the centre of the MP transmission notch. S cone factors are allcompressive: least for colours closest to the MP chromaticity and in approximately parallel zones.
1Moreland, J.D. and Westland, S. (2003) Macular pigment: Nature’s notch filter. In Eds J D Mollon,J Pokorny, and K Knoblauch. pp273-278 Oxford University Press, Oxford.
2Stockman, A. & Sharpe, L.T. (2000). Spectral sensitivities of the middle- and long-wavelengthsensitive cones derived from measurements in observers of known genotype. Vision Research, 40, 1711-1737.
3MacLeod, D.I.A. and Boynton, R.M. (1979). Chromaticity diagram showing cone excitation bystimuli of equal luminance. J Opt Soc Amer, 69, 1183-6.
46

58 10:55 - Anomalous trichromats’ judgements of surface colour innatural scenes under different daylights
R.C. Baraas1*, D.H. Foster2, K. Amano2, and S.M.C. Nascimento3
1Department of Optometry and Visual Science, Buskerud University College, 3611 Kongsberg, Norway2Computational Neuroscience Group, Faculty of Life Sciences, University of Manchester, ManchesterM60 1QD, UK3Department of Physics, Gualtar Campus, University of Minho, 4710-057 Braga, Portugal.
Are anomalous trichromats disadvantaged in their ability to judge surface colour in natural scenes? Toaddress this question, simulations of natural scenes were presented on a high-resolution colour monitorwith 10-bit resolution per gun. The DeMarco-Pokorny-Smith cone fundamentals for anomalous trichro-mats (DeMarco et al., 1992) were used to calibrate a colour monitor for deuteranomalous and protanom-alous observers, and the Smith-Pokorny cone fundamentals (Smith & Pokorny, 1975) were used for nor-mal trichromatic observers. Eighteen scenes (which included rocks, foliage, and buildings) were obtainedwith a hyperspectral imaging system (Foster et al., 2004). Illuminants were drawn from the daylight lo-cus. In each trial, two images were presented in sequence, each for 1 s, with no interval: in the first image,the correlated colour temperature of the illuminant was 25000 K or 4000 K, in the second, it was 6700 K.The spectral reflectance of a surface in the second image was changed randomly, from trial to trial, in away quantified by an equivalent local change in daylight. The size and position of the test surface, whichwas indicated to the observer, varied with the scenes tested. The observer‘s task was to decide whetherthe test surface in the successive images was the same. Seven deuteranomalous, seven protanomalous,and twelve normal trichromats participated in the study. Surface-colour matching was quantified in termsof a colour-constancy index for which 1 represents perfect constancy and 0 perfect inconstancy. The over-all discrimination ability of deuteranomalous observers was no different from that of normal trichromatswith the two illuminant changes tested here. Mean constancy index values (SEM) were 0.85 (0.02) and0.80 (0.02), respectively, for the 6700 K to 25000 K illuminant change, and 0.77 (0.04) and 0.75 (0.03)for the 6700 K to 4000 K illuminant change. Protanomalous observers‘ performance was poorer, with amean index of 0.62 (0.04) for the 6700 K to 25000 K illuminant change, and 0.63 (0.05) for the 6700 Kto 4000 K illuminant change. There seems to be no impairment of deuteranomalous observers‘ abilityto judge surface colour under different daylights on natural scenes. In contrast, protanomalous observersseem at a significant disadvantage.
Supported by the Wellcome Trust (grant no. 064669/Z/01/Z).DeMarco et al., 1992, J. Opt. Soc. Am. A, 9, 1465-1476Smith & Pokorny, 1975, Vision Res., 15, 161-171Foster et al., 2004, Visual Neurosci., 21, 331-336*The experimental work was conducted at the University of Manchester, while RCB was a postdoc-
toral researcher.
59 11:15 - Local surface-colour matching in natural scenes corre-lated with global variance in cone-excitation ratios
D.H. Foster1, K. Amano1, S.M.C. Nascimento2
1Computational Neuroscience Group, Faculty of Life Sciences, University of Manchester, ManchesterM60 1QD, UK2Department of Physics, Gualtar Campus, University of Minho, 4710-057 Braga, Portugal
What factors influence our judgements of surface colour in natural scenes under different daylights?It might be expected that average scene hue, colourfulness, and the variation in these factors would all be
47

significant explanatory factors (Golz & MacLeod, 2002). To explore this issue, surface-colour matchingwas performedwith images of natural scenes presented on a colourmonitor with 10-bit resolution per gun.The scenes were recordedwith a fast hyperspectral imaging system (Foster, Nascimento&Amano, 2004),giving an estimate of reflectance at 10-nm intervals at each point in a 1344 x 1024 digital representation.Scenes included flowers, foliage, trees, fields, and buildings, and each was recorded with a small sphereinserted in the field of view that was used subsequently as a test surface. In each trial, two images ofa scene were presented in sequence, each for 1 s, with no interval. The images differed in illuminant,first a daylight with correlated colour temperature 25000 K and then 6700 K (other conditions were alsotested). The spectral reflectance of the test surface in the second image was changed randomly in a wayquantified by an equivalent local change in daylight. Observers (12 in all) reported whether there was anilluminant change or one accompanied by a change in the surface-colour of the test surface (initially grey,or reddish, greenish, bluish, or yellowish). In terms of a colour-constancy index in which 1 representsperfect constancy and 0 perfect inconstancy, average observer performance ranged from 0.69 to 0.97over 21 scenes. This variation in performance was not correlated with the mean hue of the scenes orwith their mean chroma, or with the variance in either of these quantities. It was, however, significantlycorrelated with the variance in cone-excitation ratios across pairs of surfaces sampled randomly fromthe whole scene: the larger the variance, the poorer the matches. The constancy of cone-excitationratios is known to influence observers‘ judgements about illuminant and reflectances changes inMondrianpatterns (Nascimento & Foster, 1997). The present result suggests that performance in local surface-colour matching in natural scenes also depends on the global stability of these ratios.
Foster, D.H., Nascimento, S.M.C., & Amano, K. (2004). Visual Neuroscience, 21, 331-336.Golz, J., & MacLeod, D.I.A. (2002). Nature, 415, 637-640.Nascimento, S.M.C., & Foster, D.H. (1997). Proceedings of the Royal Society of London Series B,
264, 1395-1402.
60 11:35 - Spatial and temporal distributions of illumination in nat-ural scenes
S.M. Nascimento1, D.H. Foster2, K. Amano2
1Department of Physics, University of Minho, Braga, PORTUGAL,2Faculty of Life Sciences, University of Manchester, Manchester, UNITED KINGDOM.
The illumination in natural environments varies in a complex manner with time and location due todiverse physical factors, which include occlusion, mutual reflection, and solar elevation. The precise char-acterization of the range of this variation is important in understanding how human vision might functionoptimally in the natural world. The goal of this work was to characterize the spatial and temporal distri-butions of surface illumination in natural scenes. To this end, images of rural and of urban environmentswere obtained with a hyperspectral imaging system in the Minho region of Portugal (Foster, Nascimento& Amano, 2004). Spectral-radiance functions at each pixel were estimated from planar grey referencesurfaces located in the scene and from calibration data obtained with a telespectroradiometer. The illu-mination for different locations and directions was estimated from several grey spheres inserted into thescene. To quantify the variation of illumination with time, the same scene was imaged over one completeday at regular time intervals. The CIE 1931 (x, y) chromaticities of the illumination and the correspond-ing correlated colour temperatures were computed as a function of location, direction and time of the day.Within the same scene, standard deviations of illumination chromaticities were less than 0.04 in CIE (x,y) units and about the same in both axis directions. Standard deviations of illumination chromaticitiesduring the day for each location and direction were less than 0.05, with those in the y direction beingsmaller than those in the x direction. For the conditions tested in this study, the variation in the spec-tral composition of surface illumination within natural scenes was similar in extent over space and time,
48

suggesting that the visual mechanisms subserving colour perception have a common operating range.Foster, D.H., Nascimento, S.M., & Amano, K. (2004). Information limits on neural identification of
colored surfaces in natural scenes. Vis Neurosci, 21 (3), 331-336.
49

Poster
61 Repetition (dis)advantage: Does color-opponency count?
L.H.M. do Canto-Pereira1, G.V. Paramei2, E. Morya1, R.D. Ranvaud1
1Departamento de Fisiologia e Biofísica, Instituto de Ciências Biomédicas I, Universidade de São Paulo,Brazil2Hanse Institute for Advanced Study, Delmenhorst, Germany
Inhibitory effect (slowering RTs by 5 ms) has been reported when a target is preceded by a cue ofthe same color and location. The color-based repetition disadvantage was found using red and blue non-isoluminant stimuli. Here we investigate whether this phenomenon depends on the chromatic subsysteminvolved, L/M or S-cone, by employing isoluminant colors varying along either axis. Nineteen normaltrichromats were exposed to 4ž-stimuli. Expt1 replicated Law et al.‘s (1995) study: After fixating ma-genta, either red or blue cue was presented, followed by magenta Sneutral attractor T and, finally, by redor blue target. In Expt2, violet and yellow, cue or target, varied along the S-cone isolating axis. In Expt3,purple and turquoise, cue or target, varied along the orthogonal L/M axis. In Expt1 color repetition indeedresulted in slower RTs (4.7 ms, p=0.038). In Expt2, however, no significant color repetition effect wasfound (p=0.39). RTs to violet and yellow were not significantly different, though tending towards slowerresponses (2ms) for violet repetition, but faster responses (5ms) for yellow. Finally, Expt3 also showedno color repetition effect (p=0.58). However, RTs were overall faster for purple than for turquoise (22ms,p<0.0001). Furthermore, responses tended to be slower for purple repetition (4ms, p>0.05), but faster forturquoise (7ms, p>0.05). The findings demonstrate that color repetition is not always inhibitory, but mayturn facilitatory depending on the colors employed. For color, disengagement of attention is an unlikelymechanism to explain previously reported inhibition of return, or repetition disadvantage. An alternative,perceptual explanation is suggested: Within the chromatic subsystem, response (dis)advantagemay resultfrom an imbalance of excitation and inhibition - depending on the opponent colors and cue-attractor-targetconstellation.
Law, M. B., Pratt, J. & Abrams, R. A. (1995) Perception & Psychophysics, 57, 402-408.
62 Color and brightness perception in theWatercolor and the Craik-O‘Brien-Cornsweet effects
F.D. Devinck1, P.B. Delahunt1, J.L. Hardy1, L. Spillmann2, J.S. Werner11Section of Neurobiology, Physiology and Behavior, Department of Ophthalmology and Visual Science,University of California, Davis, 4860 Y Street, Suite 2400 Sacramento, CA 95817, USA2Brain Research Unit, University of Freiburg, Hansastrasse 9, D-79104 Freiburg, Germany
Introduction: Brightness and color induction were measured using a matching method to determinethe strength of a variety of visual phenomena: Craik-O‘Brien-Cornsweet (COCE), Watercolor (WCE)and Cusp effect (WCE with spatial smoothing). In the present experiments, these patterns were examinedto find out whether the double contour of the WCE is processed by the visual system similarly to a COCEsawtooth. Indeed, it is well know that the human spatial contrast sensitivity function for chromatic grat-ings is low-pass. Thus, we examined whether the double contour of the WCE might be smoothed by thevisual system like a COCE sawtooth to yield long-range color spreading. Method: For all experiments,a neutral white background was used (CIE x,y = 0.30, 0.33) with a mean luminance of 45 cd/m2. Theluminance contrast of the contours were specified in units of Weberian contrast. Contours were adjustedto obtain a luminance contrast of 0.44, thus, the COCE contours has 0.44 for the brighter contour and-0.44 for the darker contour, whereas the luminance contrast for the WCE and the Cusp is only -0.44. To
50

use the same luminance contrast between the background and the inducing contour for all patterns, wemeasured only the negative side of the COCE. All these patterns were presented with three different con-tour widths (0.18, 0.36 and 1.36 deg). Three sets of experiments were performed using a color-matching(Experiment 1) and a color- and brightness-matching task (Experiment 2) for the chromatic patterns, butalso a brightness-matching method for the achromatic stimuli (Experiment 3). Results: Over differentcontour widths, color shifts of the WCE followed closely the color of the inducing contour while this wasnot the case for the COCE and for the wider edges of the Cusp pattern. When color and brightness werematched, the magnitude of color spreading did not change with brightness for the COCE, but decreasedfor theWCE and was around the mean background for the SmoothWCE. With some achromatic patterns,brightness spreading became stronger with decreasing contour width. Conclusion: This research sug-gests that color and brightness are mediated by different mechanisms for the three patterns. Thus, WCEcannot be accounted for by COCE.
63 Visual evoked potentials to chromatic stimuli in schoolchildren
M.T. Pompe, B.S. Kranjc, J. BreceljEye Clinic, University Medical Centre, Ljubljana, Slovenia
The aim was to introduce into the study on the parvocellular visual system in schoolchildren VEPrecordings to appropriate chromatic stimuli. Children (7-19 years) with normal colour vision were ex-amined, 30 binocularly and 30 monocularly. To study the specificity of the method, five children withcongenital anomalous colour vision were also examined. Isoluminant red-green (R-G) and blue-yellow(B-Y) stimuli were introduced. Isoluminant point was determined for each child subjectively by usingheterochromatic flicker photometry, and objectively from recordings. The stimulus was a 7 deg largecircle composed of horizontal sinusoidal gratings, with spatial frequency 2 cycles/deg and 90% contrast.VEP were recorded from Oz (mid occipital), O2 (right occipital) and O1 (left occipital) positions. Theproperties (latency and amplitude) of the major negative component (N1) were analysed. Results for R-Gand B-Y stimulation were compared in each child. N1 properties were compared between youngest (agegroup 7-9 years) and oldest children examined (age group 16-19 years). Comparison between the twogroups was made for monocular and binocular stimulation. N1 latency after B-Y stimulation was foundsignificantly longer than after R-G stimulation when tested monocularly or binocularly. The N1 latencyand amplitude values were bigger in the younger than in the older group, both to R-G and B-Y stimula-tion. On the other hand, in the deuteranomalous and protanomalous children N1 component was muchless evident after R-G than after B-Y stimulation. We conclude that VEP to chromatic stimuli may bereliable enough for further studies on the parvocellular visual system in children.
64 Evidence for global integration of local color differences in theventral parahippocampic gyrus
M. Dojat1, L. Piettre1, C. Delon-Martin1, M. Pachot-Clouard1, C. Segebarth1, K. Knoblauch2
1UM 594 Inserm-UJF, Neuroimagerie Fonctionnelle et M‘etabolique, Universit‘e Joseph Fourier, Greno-ble France2Inserm U371, Cerveau et Vision, Dept. of Cognitive Neurosciences, IFR 19, UCB – Lyon1, Bron France
Purpose: The visual system segments a scene, distinguishing surface properties from changes inviewing conditions. An example is color scission that requires i) the integration of local tristimulus dif-ferences to extract the global color of a transparent layer, and ii) the assignment of two colors to thesame area of the retinal image (one for the transparent layer and one for the underlying surface). Toidentify candidate cortical areas involved in color scission, we manipulated local tristimulus differences
51

in color patterns to induce color transparency jointly with functional MRI.Methods: Twelve observerswith normal color vision were examined at 1.5 T on a clinical MR scanner in 2 experiments. Exp 1was aimed at localizing the functional responses produced by the introduction of chromatic contrast,Exp 2 at identifying functional responses related to color scission. For each experiment, 4 event-relatedfMRI scans were performed. During each scan, 3 different types of 0.5 sec events (images, 33 of eachtype) were presented, in pseudo-random fashion, at 2.5 sec intervals. For Exp 1, events corresponded tochromatic patterns, achromatic patterns and a Null-event (an isolated fixation cross). For Exp 2, Trans-parency events corresponded to chromatic patterns (composed of 23 colored rectangles), for which thetristimulus values in a central square test region underwent the same translation in tristimulus space, Non-transparency events, for which the tristimulus values in the central square region underwent a shearingtransformation, and a Null-event. Absolute chromatic contrasts were the same around the test region,only their coherence being modified. For functional scans, an EPI GRE MR sequence was used (1.5T,TR/TE/Flip=2.5s/45ms/70◦, FOV=256mm, matrix=64x64, head coil). The volume of interest was com-posed of 28 adjacent transverse slices with Voxel size 4*4*5 mm 3. Results: For Exp 1, the groupanalysis for chromatic versus achromatic events showed significant bilateral activation within the poste-rior fusiform gyri (Talairach coordinates (TC), left: -28, -71, -13, right: 28, -70, -9), confirming resultsreported previously by others. Activation was also found in the superior parietal gyrus. For Exp 2, the[translation - shear] contrast revealed activation within the left parahippocampal gyrus ((TC, -16, -48, 2),i.e., distinct from that induced by the [chromatic - achromatic] contrast in Exp 1. No differential activa-tion was detected in area V1/V2, for either the [translation - shear] contrast or the reverse. The [shear- translation] contrast indicated activation within the superior, right posterior parietal gyrus (TC, 32, -6831). Specific analyses in the regions of interest sensitive to chromatic contrast, as previously delineatedon the basis of the results of Exp 1, revealed no significant differences between translation vs shear, i.e.,no differential involvement of the “chromatic sensitive“ regions in color scission. Conclusions: Corticalareas identified to be differentially activated by manipulation of the coherence of local tristimulus differ-ences so as to modulate the perception of a transparent overlay were found to be located in the anteriorpart of the parahippocampal gyrus. The neural areas activated by transparency are separable from thoseareas differentially activated when subjects view chromatic versus achromatic patterns.
65 Retinal microscotomas revealed with adaptive-optics microflashes
J. Carroll1, J. Lin1, J.I. Wolfing1, N. Christie2, D.R. Williams1, W. Makous11Center for Visual Science, University of Rochester, USA2University of North Carolina School of Medicine, USA
We previously identified a dichromat (AOS1) with a genetic defect believed to cause degeneration ofone class of cone photoreceptor after foveal development is complete. Retinal photographs of the conemosaic made with adaptive optics revealed lacunae, equal in size to one or more cones, which likelyrepresent the loci of the missing cone class. Here we used adaptive optics to test whether this patienthas corresponding microscotomas in his visual field. Frequency-of-seeing curves were measured withdisks subtending either 0.75 or 7.5 arc minutes, flashed for 45 msec with 550 nm light of randomlyvarying energy. Stimuli were randomly presented at any of 8 equally spaced loci 0.5 deg from fixation.A high data acquisition rate was achieved by randomly presenting 0 to 4 flashes per trial. By correctingfor the eye’s aberrations, adaptive optics produced retinal images of the small spot that were 3.4 µmwhh, small enough to be largely confined within the typical cone diameter at this eccentricity. Twoother dichromats and 5 trichromats were also tested. The frequency-of-seeing the small spots by AOS1approached an asymptote of 74% detection, compared with 91% for the control subjects. This reductionis consistent with the observation that the lacunae occupy approximately 29% of AOS1’s cone mosaic.We hypothesize that the unseen flashes fell on the lacunae identified photographically. That the large
52

spots always stimulated some cones is shown by the fact that the asymptotic frequency-of-seeing was96% for AOS1 and 95% for the control subjects. AOS1’s threshold for the small spot was 45% higherthan that of the control subjects, reliably different from the controls’ (p < 0.01, t test) but not reliablydifferent from that expected given AOS1’s reduced complement of cones. AOS1’s threshold for largespots, however, was twice as great as the controls’ threshold, a difference that is reliable and also reliablygreater (p < 0.01, t-test) than the difference for small spots. This unexpected finding shows that spatialsummation in AOS1’s visual system is less than normal.
66 Multidimensional Scaling reveals a colour dimension unique todeuteranomaly
J.M. Bosten1, J.D. Robinson1, G. Jordan2, J.D. Mollon1
1Department of Experimental Psychology, University of Cambridge, Downing Street Cambridge, CB23EB2The Henry Wellcome Building for Neuroecology, University of Newcastle Upon Tyne, Newcastle UponTyne, NE2 4HH
Multidimensional scaling (MDS) has previously been used to disclose the subjective colour spaceof normal and anomalous observers (e.g. Paramei and Cavonius, 1999), but such studies have alwayshad a phenotypic bias: the stimuli have been selected to be discriminable for the normal observer. Inthe present study, we included stimuli with reflection spectra that were near-metamers for normals butwere calculated to be distinguishable by deuteranomalous observers. The 15 stimulus surfaces wereprepared by mixing acrylic paints and were presented under a broad-band amber illuminant intended tominimise variation at short wavelengths. Normal observers, deuteranomalous observers, and carriers ofdeuteranomaly were asked to rate (on a scale of 1-10) the subjective difference of each possible pair.In the case of deuteranomalous observers, MDS analysis revealed a dimension not available to normalobservers.
Dimensions including S/(L+M), S/(L’+L), L/M and L’/L were modelled, and the stimuli were orderedalong them. These ordinal positions were then correlatedwith the ranks of the stimuli along the observers’subjective dimensions. L’/L correlated highly significantly with the first dimension of deuteranomals(0.707 ≤ r ≤ 0.929) and S/(L+L’) correlated significantly with their second dimension (0.459 ≤ r ≤0.757), whereas S/(L+M) correlated significantly with the first dimension for normals (0.579 ≤ r ≤0.748). Since the stimuli were designed to minimise variation in L/M, the second dimension of normalsdid not correlate with this or any other dimension modelled, and smooth stress curves suggest that thenormals’ second dimension is likely to represent noise.
Paramei, G. V. and Cavonius, R. C. (1999) Perception and Psychophysics, 61, 1662-1674.
67 Designing a colour discrimination test to assess colour renderingof LED sources
E. Mahler1, J.-J. Ezrati2, F. Viénot11Muséum national d’Histoire naturelle, CRCDG, Paris, France2Centre de Recherche et de Restauration des Musées de France, Paris, France
Recently we proposed a method to score the colour rendering properties of LED lighting using aColour Discrimination Index (to be presented at AIC 2005). We set an experiment where we asked 57colour normal observers to perform the desaturated Panel D15 from Lanthony (DD15) illuminated withvarious LED clusters:
53

• RGB LED cluster (RGB),
• RGBAmber LED cluster (RGBA),
• two-phosphor cold White LED + Amber LED cluster (2PWA),
and with a control continuous spectrum light. The method allowed us to classify light sources accordingto their efficiency to discriminate small colour differences better than the CIE Colour Rendering Index. Italso revealed severe failures of RGB LED clusters for colour rendering. Half of the observers performedsignificantly worse with RGB LED sources than with continuous lights of the same colour temperature.
Here we propose to design a colour discrimination test dedicated to the evaluation of lighting qual-ity. We manufactured a desaturated Panel-like discrimination test with 32 caps equally distributed alonga colour circle in CIELAB (L*=80, C*ab=constant, DeltaEab=3±0.9 CIELAB units between adjacentcaps). Such a design was possible through careful control of a regular inkjet printer. Compared with theDD15 that is designed to highlight confusion lines, the 32 caps test with equal hue steps allows to reveallow discrimination efficiency of a light source in any region of the hue circle.
68 Linear Dichromacy
H. Scheibner, S. ClevelandInst. für Neuro- und Sinnesphysiologie, Heinrich-Heine-Universität, Düsseldorf
Colour phenomena may be represented by the association of a linear space (vectorial colour space)with a projective space (chromaticity chart/diagram). Dichromacy, though simpler than trichromacy,offers a rich structure, involving as it does the interplay of the two elements of the projective plane, pointsand straight lines. Some examples will be presented.
69 An Adaptation of the Cambridge Colour Test for use with Ani-mals
K. Mancuso, J. Neitz, M. NeitzMedical College of Wisconsin, Milwaukee
Behavioral testing has provided information about the dimensionality, acuity, and biological basisof color vision in many species of mammal. Recently, molecular biological techniques have presentednew opportunities for addressing questions concerning the neural mechanisms involved in color coding,thereby rousing renewed interest in animal color vision testing. For example, we are conducting experi-ments to determine whether gene-therapy can be used to transform an adult dichromatic squirrel monkeyinto a trichromat. Measuring and comparing both pre- and post-therapy color vision profiles will be nec-essary for evaluating the effects of the treatment. To this end, we have modified the Cambridge ColourTest to make it suitable for use with animals. Here we describe experiments that fulfill the dual purposeof collecting pre-therapy color vision data for squirrel monkeys and assessing the validity and reliabilityof the testing method when used with non-human primates. The test is a computer controlled, CRT-basedassessment tool that preserves the advantages of psuedoisochromatic plates (Reffin, Astell and Mollon,1991). Because the chromatic stimuli and the achromatic backgrounds consist of small dots that vary inlightness, animals are not able to use luminance differences to make correct discriminations. Thus, incontrast to the usual methods for animal color vision testing that have been used previously, the Cam-bridge Colour Test does not require that time be spent in the equation of luminance for each chromaticstimulus examined. Furthermore, the CRT-based design of the testing apparatus can be easily replicatedand applied for use with a wide variety of species. In the present experiments, the squirrel monkeys‘
54

pre-therapy behavioral results agreed with the predictions for their color vision based on genetic analysisand ERG spectral sensitivity data. Repeated measurements of color vision behavior on individual animalswere highly consistent. Thus, an adaptation of the Cambridge Colour Test provides a valid and reliablemethod for testing color vision in animals.
Reffin, J.P., Astell, S. and Mollon, J. D. (1991) In Colour Vision Deficiencies X, 69-76, Eds: Drum,B., Moreland, J. D. and Serra, A., Kluwer, Dordrecht.
70 Color-vision loss in patients with diabetes mellitus: A novel di-agnostic approach
C.F. Santana1, N.N. Oiwa3, G.V. Paramei4, D. Bimler5, M.F. Costa2, M. Lago2, C. Perina7, M. Bernick6,M. Nishi6, D.F. Ventura1,2
1Psicologia Experimental, Depto. Psicologia Experimental, Instituto de Psicologia, Universidade de SãoPaulo, São Paulo, Brasil2Núcleo de Neurociências e Comportamento, Depto. Psicologia Experimental, Instituto de Psicologia,Universidade de São Paulo, São Paulo, Brasil3Depto. Física Geral, Instituto de Física, Universidade de São Paulo, São Paulo, Brasil4Hanse Institute for Advanced Study, Delmenhorst, Germany5Department of Health and Human Development, Massey University, New Zealand6Hospital Universitário, Universidade de São Paulo, São Paulo, Brasil7Depto. Psicologia, Universidade Estadual Paulista, Bauru, Brasil
Color-vision impairmentwas diagnosed in patients with type 2 diabetes mellitus (DM)without retinopa-thy by assessing the type and degree of distortions of individual color spaces. DMs (n=32) and age-matched controls (n=15) were tested monocularly in both eyes; all underwent ophthalmologic examina-tion. Farnsworth (D15) and Lanthony (D15d) sets of caps were used in the triadic procedure (Bimler &Kirkland, 2004): the 32 caps from both tests were shuffled; random triads were presented to subjects, whochose the most dissimilar ("odd-one-out") cap in a triad. Subjective dissimilarities between the caps werecomputed from these choices. A non-metric multidimensional scaling (Statistica, StatSoft) procedurewasused to reconstruct two-dimensional individual and group color spaces with the axes interpreted as theR/G and B/Y perceptual opponent systems. Compared to controls, 50% of DMs revealed a configurationwith compression along the B/Y dimension (acquired tritan defect) and, in 55% of these patients, com-pression of the R/G dimension was also revealed. These numbers are higher than those when the D15dwas performed in the original procedure, as an arrangement test: 24% with B/Y and, from these, 25%with R/G loss were revealed. The degree of the space compression varied dramatically among individ-ual patients. The present findings agree with earlier studies demonstrating deterioration of blue-yellowdiscrimination in DMs (e.g. Kurtenbach et al., 2002). However, the proposed method of testing, whichincludes caps varying in saturation and lightness, as well as elaborated representation of results as colorspaces, provides a vehicle for more differentiated, quantitative diagnosis of severity of color-vision loss.Along with fundoscopy, individual color spaces may serve for screening early functional changes andthereby support a treatment strategy.
55

71 Changes in spatial extent and peak double density of humanmacular pigment with age
A.M.G. Baptista1, S.M.C. Nascimento1, D.H. Foster21Department of Physics, University of Minho, Braga, Portugal,2Faculty of Life Science, University of Manchester, Manchester, United Kingdom
The function of macular pigment (MP) is not fully understood but appears to be fundamental formaintaining normal retinal function. The MP spatial extent and peak density have been studied withthe aid of several physical and psychophysical techniques and for different populations but these studieshave produced data with large variability (Hammond, B. R. et al., 1997; Chang, Y. et al., 2002; Robson,A. G. et al., 2003). The purpose of the present work was to estimate the changes in spatial distributionand peak double density of macular pigment with age. A fundus imaging system with high spatial andspectral resolution was adapted to form an indirect ophthalmoscope. An area of the retina of about 15deg was illuminated sequentially by light from a xenon lamp filtered by a fast tunable liquid-crystal filter(VariSpec, VS-VIS2-10-HC-35-SQ, Cambridge Research & Instrumentation) at two wavelengths, 490and 540 nm. Spectral images of the fundus were acquired in 2 sec with a low-noise Peltier-cooled digitalcamera (Hamamatsu, model C4742-95-12ER) with a spatial resolution of 1344 x 1024 pixels and 12-bit output. The retinas of 33 healthy subjects were divided into 3 groups with different average ages,22.5 (N = 12), 35.9 (N = 12) and 57.8 (N = 9) years, and each imaged with this system. The spatialdistribution of the macular pigment was derived for each subject by comparison of the estimated fovealspectral reflectance at each pixel at 490 nm with that at 540 nm. With this procedure, the double opticaldensity as a function of the location in the retina was obtained. The full width at half maximum (FWHM)in the horizontal and vertical meridians and the peak double density were used to characterize the MP.The mean FWHM in the horizontal and vertical meridians and the mean peak double density showeda large inter-subject variability, but a tendency for slightly larger spatial distributions with age, a trendconsistent with that found by Chang, Y. et al.(2002).
72 Colour naming and colour categorisation in case of inheritedcolour deficiencies
V. BonnardelDivision of Psychology, University of Sunderland, Saint Peter‘s Campus, Sunderland, SR6 ODD, UK.
Colour naming has been shown to be accurate among dichromatic subjects despite the fact that, mostoften, these observers lack the ability to discriminate among red - green hues (Jameson & Hurvich, 1978).This result is interpreted as the expression of the normative language system developed from learningsubtle visual cues available despite an impoverished colour system.
In this study, consensus analysis was used to quantitatively appreciate the normative effect of languageon colour categorisation among colour deficient observers and compare it with that observed in normaltrichromats.
Four young adults (1 female and 3 males) diagnosed as deutan type (Colour Deficient, CD group) onIshihara isochromatic plates and a control group of four normal trichomat observers (Normal Trichomat,NT group) were asked to sort or name 140 Munsell chips (20 hues each at 7 values, at the maximumchroma) over three tasks performed in the same order. First, a Free Sorting Task (FST) with an unlimitednumber of categories; second, a Constrained Sorting Task (CST) where the number of categories waslimited to 8; and third, a Constrained Naming Task (CNT) using the 8 English basic colour terms. Alltests were performed under the standard D65 illuminant.
For each task and each participant, grouping matrices are obtained in which the entry of each cell is
56

1, if two samples were placed in the same category, and 0 otherwise. From these matrices, two 12 x 12correlation matrices (one for each participant group) are computed, and the square root of the averagecorrelation within any given subset of correlations is computed to provide an approximation of the sharedknowledge (or consensus) among subjects within that group (Romney et al., 1999).
The general consensus across tasks and participants is slightly lower in the CD group (61%) thanin NT group (68%). In the two groups, the consensus specific to each task is lower than the generalconsensus for the FST (55%, CD and 60%, NT), is increased in the CST (64%, CD and 72%, NT) andis the highest in the FST (76%, CD and 86%, NT). In both groups, colour naming greatly increases theconsensus among participants in sorting out the colour samples into categories. However, the mismatchbetween the normal trichromat colour vocabulary and the phenomenal experience of colour of colourdeficient observers imposes a limit to the normative effect of language on colour categorisation.
Jameson, D. & Hurvich, L. M. (1978). Dichromatic color language: "Reds" and "Greens" don‘t lookalike but their colors do. Sensory Processes, 2, 146-155.
Romney, A. M., Moore, C. C., Batchelder, W. H., & Hsia, TL. (1999). Statistical methods for charac-terizing similarities and differences between semantic structures. Proceedings of the National Academyof Sciences, 97, 518 - 523.
73 Red-green color vision loss in Duchenne Muscular Dystrophy
M.F. da Costa1, C.F. Santana1, A.G.F. de Oliveira1, M. Lago1, L.C.L. Silveira3, M. Zatz2, D.F. Ventura1
1Depto. Psicologia Experimental, Instituto de Psicologia e Núcleo de Neurociências e ComportamentoUniversidade de São Paulo, São Paulo, Brasil;2Centro de Estudos do Genoma Humano, Instituto de Biologia, Universidade de São Paulo, São Paulo,Brasil;3Depto de Neurofisiologia, Universidade Federal Pará, Belém, Pará, Brasil.
Red-green color defect and Duchenne Muscular Dystrophy (DMD) are X-linked diseases caused byunlinked genes. About 65-70% of DMD patients have a deletion in the dystrophin gene, which resultsin the absence of the protein dystrophin. Alterations in the electroretinogram of DMD subjects withdeletions downstream exon 30 have been recently shown. Our aim is to evaluate color vision in DMDsubjects with a battery of color vision tests, and try to relate the findings with the type of gene deletion.The patients were classified in 3 groups: no deletions (n=20); deletion upstream exon 30 (n=7); deletiondownstream exon 30 (n=27). Controls were 35 age-matched subjects. Color vision was evaluated with:Cambridge Colour Test (CCT), Neitz Anomaloscope, Ishihara and AO H-R-R plates. Color vision lossesmeasured by the CCT were found in 34/54 (63%) subjects, the majority of which (27/34, 79%) had ared-green defect, confirmed by the Anomaloscope results (Wilcoxon test - Trivector p= .602; Ellipse p<.999). The AO H-R-R and Ishihara plates were less sensitive, revealing respectively, 24% and 16% ofred-green color vision losses; and these results did not correlate with the Rayleigh matches (AO H-R-Rp= .016; Ishihara p< .001). With the color vision test battery used we observed that red-green losseswere more frequent and more severe in subjects with deletions downstream exon 30, involving the retinaldystrophin isoform Dp260. These results suggest a secondary effect of the dystrophin mutation in retinalfunction.
57

74 Electrophysiological Analysis of Chromatic Opponency in theRetina of Turtle (Pseudemys scripta elegants) with Tetrachro-matic Stimulus
F. Rocha1,2, C. Saito2, J.M. de Souza1, L.C.L. Silveira2, D.F. Ventura1,2
1Dept. of Experimental Psychology, University of São Paulo, São Paulo, Brazil2Dept. Fisiologia, Universidade Federal do Pará, Belém, Pará, Brasil.
Purpose: To investigate the influence of the input ultraviolet (UV) in the color-coding of recordingsin ganglion cells and to describe the types of combinations of chromatic opponency in the turtle (Pseude-mys scripta elegants) retina. Methods: Intracellular recordings were made in everted eyecup prepara-tions. The retinas were superfused with oxygenated ringer solution (pH 7,5) and stimulated by opticalsystem with centered spots, and annuli of light of same number of number of quanta in UV (370nm),blue (450nm), green (540nm), and red (620nm), at three intensities, largely according to the proceduresdescribed by Ventura and cols. (2001). After this recording, whenever possible, Neurobiotin was injectediontoforetically with positive current pulses of 2mA at the frequency of 1 Hz. Retinas with injected gan-glion cells were dissected, fixed by immersion during 1 hour in 4% paraformaldehyde in 0.1M phosphatebuffer, and then incubated in Cy3-streptavidin, for subsequent observation in confocal microscope (Zeissmodel LSM3/4). The labeled cells were morphologically classified according to Ammermüller and Kolb(1995). Results: 42 recordings from cells were obtained, among them: 10 ganglion cells presented sometype of chromatic opponency, two news combinations were found (UV+BGR-; B+UVGR-); 15 ganglioncells and eight amacrine cells were ON in response; one ganglion cell (tri-stratified) had an ON/OFFresponse; six ganglion cells and two amacrine cells had an OFF response. In the morphological com-parison, we identified G2, G18 and G22 cells described previously by Ammermüller and Kolb (1995).Conclusions: The chromatic opponency using UV ligth had already been confirmed in previous studies(Ventura and cols., 2001). This study broadens the knowledge about the physiology of color coding inmorphologically identified ganglion cells, in tetrachromatic organisms.
75 Sensitivity to color errors in images of natural scenes
M.A. Aldaba1, J.M.M. Linhares1, P.D. Pinto1, S.M.C. Nascimento1, K. Amano2, D.H. Foster21Department of Physics, Minho University, Campus de Gualtar, 4710-057 Braga, Portugal2Computational NeuroscienceGroup, Faculty of Life Sciences, Moffat Building, University ofManchester,M60 1QD, UK
Color errors occur in all image-reproduction processes and their visual significance may be an im-portant factor in influencing perceived image quality. Sensitivity to these errors has been estimated usingpictorial images that due to a constrained camera gamut provide chromatically limited representationsof real scenes. The purpose of the present work was to estimate sensitivity to these color errors usingpictures synthesized from hyperspectral images of natural scenes that have no gamut constraints. Imagesof rural and urban environments were obtained by a hyperspectral imaging system (Foster, Nascimento& Amano, 2004) with a low-noise Peltier-cooled digital camera with a spatial resolution of 1344Œ1024pixels (Hamamatsu, C4742-95-12ER), and a fast-tunable liquid-crystal filter (VariSpec, model VS-VIS2-10HC-35-SQ, Cambridge Research & Instrumentation, Inc., MA, USA) mounted in front of the lens. Thespectral-radiance from each pixel of the images was estimated from a gray reference surface present in thescene and from calibration data obtained with a telespectroradiometer. These radiance values were thenconverted to points within the approximately uniform CIELAB color space. From each original image,a set of approximated images with variable chromatic errors was generated by chromatically segmentingeach original CIELAB representation into cubes of side ∆E ∗ab of 4 and adding to each color located
58

inside each cube a vector with the same ∆E ∗ab but with random direction from cube to cube withinthe image. Thus, each approximation could be characterized by a specific ∆E ∗ab. The images weredisplayed on a calibrated 17-inch, RGB color monitor controlled by computer with raster-graphics cardproviding 24 bits per pixel in true-color mode. In each trial of the psychophysical experiment the ob-server was presented with a pair of images, corresponding to the original and one approximation, and hadto indicate whether the images were the same or not. It was found that discrimination between original anapproximated images needed a ∆E ∗ab of about 2.5 for rural scenes and even smaller for urban scenes.Even in complex scenes observers appear sensitive to small chromatic errors.
Foster, D.H., Nascimento, S.M., & Amano, K. (2004). Information limits on neural identification ofcolored surfaces in natural scenes. Vis Neurosci, 21 (3), 331-336.
76 Psychophysical estimation of the best illumination for apprecia-tion of artistic paintings
P.D. Pinto, J.M.M. Linhares, J.A. Carvalhal, S.M.C. NascimentoDepartment of Physics, University of Minho, Braga, Portugal
The visual impression of an artistic painting is strongly influenced by the spectral profile of the il-luminant. The aim of this work was to determine the illuminant preferred by observers when seeingart paintings and to investigate how their preferences correlate with the chromatic diversity of the paint-ings. Oil paintings from the collection of the Museum Nogueira da Silva, Braga, were imaged by ahyperspectral imaging system. The hyperspectral imaging system had a low-noise Peltier-cooled digitalcamera with a spatial resolution of 1344Œ1024 pixels (Hamamatsu, C4742-95-12ER), and a fast-tunableliquid-crystal filter (VariSpec, model VS-VIS2-10HC-35-SQ, Cambridge Research & Instrumentation,Inc., MA, USA) mounted in front of the lens. The spectral reflectance of each pixel of the paintings wasestimated from a gray reference surface present in the scene. Illuminant spatial non-uniformities werecompensated using measurements of a uniform surface imaged in the same location as the paintings. Theradiance reflected from each painting under six different illuminants, CIE Standard Illuminants A, B, Cand D65, Solux and tungsten light, was estimated. In each case, the number of discernible colors wasestimated by computing the painting representation in CIELAB space and by counting the number ofnon-empty unit cubes in that space. The images resulting from these manipulations were displayed on acalibrated 17-inch, RGB color monitor controlled by a computer raster-graphics card providing 24 bitsper pixel in true-color mode. In each experimental trial, the observer was presented with a pair of im-ages, corresponding to two different illuminants and had to indicate the preferred image. Five observerswith normal color vision participated in this study. It was found that observers systematically preferredthe CIE Standard Illuminant D65 which produced the larger number of perceived colors. These resultssuggest that the ideal light source for illumination of this type of art paintings may correspond to the oneproducing larger chromatic diversity.
77 Normal L:M cone ratio variations and the acuity of color vision
M. Mauck, J. Levin, J. Neitz, M. NeitzMedical College of Wisconsin, Milwaukee, WI USA
There is enormous variation in the proportion of L to M cones among males with normal color vision,ranging from about 45% to 95% L (or about a 20 fold range in L:M cone ratio). It is expected thatindividuals with a only a small proportion of L or M cones would have relatively fewer neurons carryingred-green chromatic signals and it has been reported that biased L:M cone ratios are associated withreduced chromatic contrast sensitivity (Gunther, KL & Dobkins, KR, 2002). Paradoxically, however, it
59

has been reported that subjects are able to perform well on standard color vision tests in spite of havingbiased cone ratios. For example, individuals with even the most extreme ratios can have error scores ofless than 20 on the FM 100 hue test, classifying them as having superior color vision. Here we reportresults of experiments to test the hypothesis that individuals with highly biased cone ratios are able touse the relatively unrestricted time limits and large stimulus sizes in standard color vision tests to helpcompensate for having a reduced number of red-green chromatic signal carriers in the visual pathway.A modified version of the Cambridge Colour Test was used in which thresholds to three different colorswere measured for three different stimulus presentation durations (2000 ms, 120 ms, and 60 ms), andtwo different sizes, subtending 5.5◦ and 2.75◦ of visual angle. Subjects with biased L:M cone ratiosperformed more poorly than those with ratios nearer 1:1 for all stimulus sizes and durations. However,the difference in performance increased substantially when stimulus duration was reduced. Individualswith extreme ratios performed most poorly compared to those with more nearly equal ratios under thecondition in which the stimuli were both brief and small. We conclude that individuals with biased L:Mcone ratios can perform well on standard color vision tests in which the colored areas are large andviewing time is relatively unrestricted; however, their disadvantaged color discrimination capacity can beexposed by limiting stimulus size and duration.
Gunther, K.L., and Dobkins, K. R. (2002). Vision Research 42(11):1367-78.
78 Acquired color vision defects and saturation
M.L.F. de Mattiello1, N. Martino2
1Consejo Nacional de Investigaciones Científicas y Técnicas2Fundación de Investigaciones Visuales,
The classic surface tests used to assess chromatic anomalies seek to keep the quantitative magnitudesof color constant by assigning values to their qualitative magnitude or hue. In a previous paper, Mattielloand Gonella (1970) suggested increasing the saturation of Panel D-15 for ergonomic purposes, provingthat the errors made with Panel D-15 or the P. Lanthony desaturated test were thus mitigated. Thisled to thought being given to the use of saturation scales in just-noticeable steps to measure the depth ofanomalies, an idea proved long ago byM.Marré (1973) for retinal disorders, by means of optical systems.Saturation scales, which are easy to build and measure, could replace certain commercial tests that, sametime, are difficult to come by. In order to verify this assertion, 12 scales were analyzed, distributedbetween 400 and 700 nm, with a variable colorimetric purity of 0 and 1 and constant luminance and hue.It was interesting to test a defective population of people in the 70 to 75 age range who presented chronicillness requiring varied medication. This particular choice was based on the fact that the subject of oldage is once more being analyzed but without considering being given to these circumstances. The task ofthe observers was merely to inform of the color threshold by observing the saturation scales in increasingand decreasing order and one cap at time
To date 30 eyes have been observed, and it has been noticed that greater saturation is required atintermediate frequencies, and very little at extreme frequencies. In the critical zone the cases presentconsiderable variability that allows the sensitivity of the proposed test to be broadly endorsed. A Tableindicating the ophthalmological data of the observers and their basic medication completes the study. TheTable allows some conclusions to be drawn on the effects of drugs on color vision, while highlighting thedifficulty of reaching a definite judgment when more than one drug is used.
de Mattiello, MLF and Gonella, A. (1970) Size and saturation scales in test for diagnosis of colorvision deficiencies. Mod. Prob. Ophtalmol. !7:185-192.
Marré, M. (1973) The investigation of acquired colour vision deficiencies, in Color 73, London, A.Hilger:99-135.
60

79 Magnocellular and parvocellular involvement in vernier acuity
M.J.H. Puts, J. Pokorny, V.C. SmithDepartment of Ophthalmology & Visual Science, The University of Chicago, 940 East 57th Street,Chicago, IL 60637, USA
Purpose: In a vernier acuity task, observers are required to resolve an offset between two objects.For luminance-defined stimuli under optimal conditions, offset thresholds can be in the hyperacuity range,with offsets smaller than predicted from cone spacing in the retinal mosaic. Vernier thresholds for equilu-minant stimuli are poorer than for luminance-defined stimuli, and are not in the hyperacuity range. Similarvernier thresholds for chromatic vernier stimuli and luminance defined vernier stimuli degraded by op-tical blur are found when stimuli are scaled in terms of threshold detection (Krauskopf & Farell, 1991),suggesting a common neural system mediates both. Physiological studies (Lee, Wehrhahn, Westheimer,et al., 1995) showed that MC cell responses correlate to human psychophysical hyperacuity performanceand it has been proposed that MC cells can provide accurate information for vernier performance underequiluminance (Sun & Lee, 2004). Here, an alternative proposal is evaluated: might the PC system medi-ate luminance vernier acuity for offsets not in the hyperacuity range?Methods: Two vertical bars (15minby 10 min), one placed above the other, were presented on a 1 deg square pedestal for 40 ms. Horizontaloffset of the two bars ranged from 15 sec to 100 sec. Pedestal luminances ranges between 8 to 17 cd/m2,above and below the adapting background luminance of 12 cd/m2. In the Pulsed-Pedestal Paradigm,the pedestal was presented synchronously with the stimulus. The pulsed pedestal favors PC mediation(Pokorny & Smith, 1997). In the Steady-Pedestal Paradigm, the pedestal was presented continuously andeither the MC or PC system might mediate vernier acuity. In both paradigms, the contrast threshold toresolve each Vernier offset was measured as a function of pedestal contrast. Results: The data showed adifferent signature for Vernier offsets less than 40 sec (i.e. hyperacuity offsets) than for larger offsets. Forthe pulsed-pedestal, the threshold deteriorated more dramatically as a function of pedestal amplitude forthe smaller than for the larger offsets. Conclusions: For luminance-defined stimuli, vernier thresholds inthe hyperacuity range may be mediated by the MC system. Vernier thresholds evaluated under conditionsthat do not produce hyperacuity may be mediated by the PC system.
Krauskopf, J., & Farell, B. (1991) Vision Research, 31 (4), 735-750.Lee, B.B., Wehrhahn, C., Westheimer, G., & Kremers, J. (1995) Vision Research, 35, 2743-2758.Pokorny, J., & Smith, V.C. (1997) Journal of the Optical Society of America A, 14, 2477-2486.Sun, H., & Lee. B.B (2004) Visual Neuroscience, 21, 315-320.
80 A unique dichromatic color-vision defect with a novel form ofthe single L-cone/M-cone visual pigment gene
T. Hayashi, A. Kubo, T. Takeuchi, T. Gekka, S. Goto-Omoto, K. KitaharaDepartment of Ophthalmology, Jikei University School of Medicine, Tokyo, Japan
In individuals with normal color vision, long- (L) and middle-wavelength-sensitive (M) visual pig-ment genes are arranged in a head-to-tandem array on the X chromosome. The dichromatic red-greencolor vision deficiencies are usually associated with a single pigment gene (a 5‘L-M3‘ hybrid gene forprotanopia or an L gene for deuteranopia). A total of 88 male dichromatic subjects (31 protanopes and 56deuteranopes) have been clinically diagnosed using a Nagel model I anomaloscope. Here we report onedichromatic subject who presented a unique pattern of color matching. The subject accepted not only theentire matching range but also an extended yellow-scale range at each midpoint (i.e. 20 to 32 scale unitsat the green primary and 3.5 to 6 at the red primary). The slopes of regression lines were in the rangeof -0.34 to -0.23; the mean slopes for protanopes and deuteranopes were -0.38 and -0.01. Clinically,best-corrected visual acuity was 1.5, and no abnormal findings were observed on a fundus examination,
61

Goldmann kinetic perimetry andGanzfeld full-field electroretinography. Long-range PCR was performedto determine whether the first gene in the array is L or 5‘L-M3‘ hybrid, and whether the downstream geneis M or 5‘M-L3‘ hybrid. The promoter region and each of 6 exons were amplified by PCR followed bysequencing. The subject had a novel form of the single pigment gene with the L promoter that consistsof the L-gene exons 1 to 3 (S180), the M-gene exon 4 and a unique arrangement of exon 5 (V249, I274,F275, Y277, V279 from the L gene and A285, P298, F309 from the M gene). No mutation was foundin the single gene. It is possible that unequal crossing over occurs commonly at this locus due to highhomology of the L and M genes. The hybrid position within exon 5 indicates that a recombination eventmay have occurred between amino acid positions 279 and 285.
81 Low frequency of CNGA3 mutations in Japanese patients withcongenital achromatopsia
S. Goto-Omoto, T. Hayashi, T. Gekka, T. Takeuchi, A. Kubo, K. KitaharaDepartment of Ophthalmology, Jikei University School of Medicine, Tokyo, Japan
Congenital achromatopsia is a stationary retinal disorder with autosomal recessive inheritance and ischaracterized by loss of color discrimination, low visual acuity, photophobia and nystagmus. It has beendemonstrated that mutations in the CNGA3, CNGB3 and GNAT2 genes were associated with the disorderin mainly European population. Here we tested the hypothesis that CNGA3 mutations are involved inJapanese patients with congenital achromatopsia. A total of 14 patients from 13 Japanese pedigrees wereparticipated in this study. DNA from venous blood samples was prepared. We analyzed CNGA3 genefor mutation screening with PCR-single-strand conformation polymorphism followed by sequencing. Inonly one 22-year-old female patient with complete achromatopsia (rod monochromacy), we identifiedcompound heterozygous mutations (p.R436W and p.L633P), one (p.L633P) of which was novel andnot found in 100 Japanese control individuals. No mutations in the CNGB3 and GNAT2 genes wereidentified in the patient. Clinically, best-corrected visual acuity was 0.1 in both eyes. In color visiontests, the patient identified only the first plate in Ishihara plates. The Farnsworth Panel D-15 showed theconfusion along the scotopic axis. No specific finding was observed in funduscopy. Ganzfeld full-fieldelectroretinograms (ERGs) showed normal responses in scotopic and bright-flash ERGs but no responsein 30-Hz flicker ERG. Spectral sensitivity on a white background revealed only one peak at around 500nm that fits the absorption spectrum of human rhodopsin. The L633 within the cGMP-binding site isconserved among other mammalian CNGA3 proteins. Therefore, we conclude that the p.L633P is adisease-causing mutation. This is the first report of a Japanese patient with CNGA3 mutations. Thefrequency (7%, 1/14) of CNGA3 mutations was less than that (25-33%) in European patients.
82 The influence of test distance on the CN Lantern Test
J.K. Hovis, S. RamaswamySchool of Optometry University of Waterloo Waterloo, ON Canada
Introduction: Colored signal lights remain the primary device for conveying information to loco-motive engineers on both the main track and in the yards. Sighting distances for the signal lights on themain track typcially vary from 0.3 to 1.0 km. The relatively small size and low brightness contrast makeidentification of signal lights on the main track very challenging for person with a congenital red-greendefect. However, in the yard, the sighting distances are shorter and are usually less than 0.2 km. Onewould expect that correct identification of signal lights within the yard would be somewhat easier. Be-cause of the difference in the sighting distances between the main track and yard, it may be appropriateto have two different test distances for a railway lantern test. The purpose of this study is to determine
62

whether the lantern test distance affects the pass/fail results for the CN Lantern test (CNLan). Methods:The CNLan presents triplets of color lights which could be any combination of red, green and yellow. Atthe normal test distance of 4.6 m, the point brilliance of the test lights is equivalent to sighting distancesranging from 0.32 to 0.64 km. At a test distance of 2.3 m, the CNLan is equivalent to sighting distancesranging from 0.16 km to 0.32 km. Subjects were asked to identify the color of each light at each distance.There were 67 individuals with congenital red-green color vision defects who participated in the first partof the study. Sixty-six percent of the subjects repeated the experiment 10 days later. Results There wasa significant (p<0.05) decrease in the mean number of errors from 7.6 to 4.3 as the distance decreased.There was also a corresponding increase in the percentage of subjects who passed from 9.0% at 4.6 mto 20.9% at the 2.3 m viewing distance. None of the subjects who passed at the longer distance failed atthe shorter distance. Interestingly the majority of individuals passing at the longer distance had a protandefect, whereas individuals who passed at the shorter distance were equally divided between protan anddeutan defects. The replication results were statistically identical to the first session (p>0.05). Conclu-sion Decreasing the CNLan viewing distance by 50% does decrease the number of errors and increasethe pass rate. Nevertheless, the majority of color-defective individuals still fail the test. Although shortterm learning effects cannot be totally ruled out, the replication results suggest that the reduction in errorsat the shorter test distance is not due to practice effects.
83 Color changes in a 50 year old AO HRR color vision test
D. LeeIllinois College of Optometry, Chicago, IL, USA
The original AO HRR color vision test (second edition) was validated by many studies, and consid-ered one of the best designed plate tests. It is still accepted by many governmental agencies for colorvision certification. In their 1954 publication, Hardy, Rand, and Rittler stated that specially compoundedinks containing no linseed oil were used for printing to avoid color changes with time. Fifty years later, itis both important and interesting to determine whether the wear and tear causes significant color changes.The chance finding of a never-used second edition (unsealed in 2002, courtesy of Dr. Joel Pokorny) offersan opportunity to assess the color changes. A GretagMacbeth Spectrolino spectrophotometer was usedto measure the chromaticities of the never-used book, and an extensively-used (well maintained) book.Four plates (#4, 7, 13, 16), selected from the four sections of the test, were analyzed. The colored dotsfrom each of the 8 plates were plotted on a CIE chromaticity diagram. Isocolor lines were drawn toevaluate chromatic alignment. Chromaticities for plates #4 and 7 are significantly different between thetwo books. In terms of chromatic alignment, the never-used book is better for plate 7, but worse for plate4. Chromaticities for plates #13 and 16 are essentially identical between books, all with good alignmentwith the isocolor lines. The overall comparison shows that the chromatic alignment characteristics of theextensively-used book are not worse than the never-used book. Since colors in these plates have to bealigned with both the protan and deutan axes, any significant color changes would have disturbed thisdelicate requirement. The findings of many plates with good alignment, and the lack of differences onplates #13 and 16 between books, suggest that there are no significant color changes over time. Differ-ences between books on plates #4 and 7, which contain desaturated colors, were likely the result of colorvariation from the original printing process.
63

84 Achromatic parvocellular contrast gain in normal and color de-fective observers: Implications for the evolution of color vision
M. Lutze, J. PokornyVisual Science Laboratories, Department of Ophthalmology&Visual Science, The University of Chicago,940 East 57th Street, Chicago, IL 60637, USA
Purpose: Parvocellular (PC) neurons are far more responsive to chromatic (L-M) than to luminance(L+M) stimuli. A luminance modulation is not an optimal stimulus for a chromatically opponent re-ceptive field as revealed by measurements in PC cells showing achromatic contrast gain to be lowerthan chromatic contrast gain. In considering the evolution of color vision, some have suggested thatPC-pathway chromatic contrast gain is matched to the chromatic content of the natural environment toavoid response saturation with large shifts in chromaticity. Anomalous trichromats, with less than normalseparation of their L- and M-cone spectral sensitivities, should have diminished chromatic input to PC(L-M) cells and dichromats, with missing L- or M-cones, should have no chromatic input to PC (L-M)cells. When the constraint that PC neurons limit an observer‘s contrast gain to accommodate the range ofchromaticities in natural images is removed, is there an improvement in achromatic processing in colordefectives? Methods: This study employed a psychophysical method designed to isolate parvocellular(PC) vs magnocellular (MC) responses to achromatic stimuli (Pokorny & Smith, 1997). The stimulusdisplay included four 1◦ squares on a large steady uniform background and, on a trial, one square dif-fered in contrast from the other three. The observer‘s task was to choose the square that was different.Thresholds were measured as a function of the contrast of the four-square array to the background. In thePulsed-Pedestal condition, the stimulus array appeared only during the trial period, with the test squareat a higher or a lower retinal illuminance than the other three. In the Steady-Pedestal condition, the stim-ulus array was continuously presented within the background with only the retinal illuminance of the testsquare changed. Seven color defective observers, (2 protanopes, 2 deuteranopes, 1 protanomalous, and2 deuteranomalous) and 4 color-normals served as observers. Results: For the pulsed-pedestal condi-tion, isolating PC responses, data from all observers showed a V-shape, with greatest threshold sensitivitywhen the squares were equal to the background compared to when the squares had positive or negativecontrast. There were no systematic differences in the slopes of the V-shaped functions between normaland color defective observers, implying no differences in PC achromatic contrast gain. Conclusions: PCpathway achromatic contrast gain appears to be the same in human normal and anomalous trichromatsand dichromats. There was no enhancement of achromatic processing in the PC system in color defec-tives, implying that factors other than the environmental chromaticity gamut Stunes T the PC system. PCachromatic contrast gains of dichromatic and trichromatic New-World primates have been shown to besimilar to each other, and to contrast gain measured in macaque (Lee et al, 2000; Blessing et al, 2004).Thus PC pathway contrast gain parameters may have arisen in a non-trichromatic ancestor common toboth old and new world primates.
Blessing, E.M., Solomon, S.G., Hashemi-Nezhad, M. et al. (2004) Journal of Physiology, 557 (Pt 1),229-245.
Lee, B.B., Silveira, L.C., Yamada, E.S et al. (2000) Journal of Physiology (London), 528 (Pt 3),573-590.
Pokorny, J, & Smith, V.C. (1997) Journal of the Optical Society of America A 14:2477.
64

85 Macular Pigment: Nature’s Notch Filter II
S. Westland2, J.D. Moreland1
1MacKay Institute, Keele University, UK2School of Design, University of Leeds, UK
The effect of changes in macular pigment (MP), assessed using a database of 1782 reflectance spectraof natural and man-made colours, was reported at the Cambridge ICVS Symposium 1. The population ofcolours was divided equally into 25 local areas in an analogue of the MacLeod-Boynton 2 cone excitationdiagram using the Normal and Anomalous cone fundamentals of De Marco, Pokorny and Smith 3 andapplying the von Kries correction (VKC) for adaptation. Changes in mean local and global variance andin mean colour spacing were reported. VKC produced changes in mean local variance and in colourspacing that were incompatible with Moreland and Dain’s4 experimental finding of "tritan" confusions,associated with high MP. These findings are re-assessed here. It was found that removing VKC restoredcompatibility. A geographic analysis of local variance for Normals indicated the presence of systematicpatterns but with only 25 colour areas the resolution was low.
1Moreland, J. D. and Westland, S. Macular pigment: Nature‘s notch filter. In Eds J D Mollon, JPokorny, and K Knoblauch. pp273-278 (2003) Oxford University Press, Oxford.
2MacLeod, D. I. A. and Boynton, R. M. (1979. Chromaticity diagram showing cone excitation bystimuli of equal luminance. J Opt Soc Amer, 69, 1183-6.
3DeMarco, P., Pokorny, J. and Smith, V. C. (1992). Full-spectrum cone sensitivity functions forX-chromosome-linked anomalous trichromats. J Opt Soc Amer A, 9, 1465-76.
4Moreland, J. D. and Dain, S. L. (1995). Macular pigment contributes to variance in 100 hue tests.Doc Ophthal Proc Ser, 57, 517-22.
86 The Macular Assessment Profile (MAP) test - a new VDU basedtechnique for measuring the spatial distribution of the macularpigment
J.A. Harlow1, J.L. Barbur1, M. Rodriguez-Carmona1, A.G. Robson2, J.D. Moreland3
1Applied Vision Research Centre, The Henry Wellcome Laboratories for Vision Sciences, City Univer-sity, London UK.2Moorfields Eye Hospital, London UK.3MacKay Institute of Communication&Neuroscience, School of Life Sciences Keele University, Stafford-shire ST5 5BG UK.
Findings from recent studies suggest that the retention of lutein and zeaxanthin in the retina followingsupplementation with carotenoids is particularly evident in the near periphery of the visual field (1).This finding is of interest given the role carotenoids may play in improving visual function (2) and inretarding some of the destructive processes in the retina that lead to age-related macular degeneration (3).Although the effect of macular pigment (MP) on colour matches has long been recognised, the extentto which MP diminishes yellow-blue chromatic discrimination sensitivity remains controversial. Themeasurement of MP optical density therefore remains of great interest, and this is often performed usingoptical systems for heterochromatic flicker photometry (HFP) that employ short- and long-wavelength(SW and LW, respectively), narrow-band lights. 2D profiles of MP optical density are more difficultto measure using optical systems, largely because of the mechanical constraints imposed on generatingstimuli of varying size at a number of locations in the visual field. The use of full, square-wavemodulationalso makes it difficult to set a flicker null point and this affects the accuracy of the match. MP systems
65

based on visual display units have numerous advantages and can be designed to overcome most of theproblems associated with optical systems, but their use in MP measurement has been limited, largelybecause of the restricted luminance range of the blue phosphor and the extended spectral bandwidth ofthe blue and green phosphors. The latter causes the MP density to be underestimated (4). In order toovercome these problems we designed a new MAP test using a visual display that can be arranged toachieve high luminance with stable operation. A Snotch T optical filter was incorporated in the designto separate the three phosphor outputs into two beams that can be modulated independently: one beamthat is absorbed selectively by the MP (i.e., the SW beam) and the other that is not (i.e., the LW beam).A mean luminance level of 30 cd/m2 can be achieved using this system with a maximum range of 1.3log units for the SW beam. Stimuli of varying sizes are generated within the uniform background at thesame location on the display using only 15% modulation of the long-wavelength beam and appropriatecounter phase modulation of the short wavelength beam. The fixation stimulus is moved appropriatelyso as to position the flickering stimulus at a number of locations around it. Two techniques have beendeveloped and tested. The first is based on nulling the flicker generated by the long-wavelength beam byappropriate adjustment of the short-wavelength beam. The second method is based on measurement offlicker detection thresholds (20 Hz flicker) at each location for each of the two beams. The latter techniqueprovides a more accurate estimate of flicker thresholds, but takes longer to perform. A model was alsodeveloped to predict the expected relationship between peak MP density and that measured using thedisplay-based technique. MP data measured using these two techniques, together with comparison dataobtained in the same subjects using a Moreland anomaloscope modified for motion photometry. Sincethe Moreland anomaloscope employs narrow band stimuli, we were also able to test the model and toproduce the calibration curve needed to convert the display estimates of MP density to expected peakvalues.
1. Schalch, W., Rodriguez-Carmona, M., Harlow, J. A., Barbur, J. L. & Koepcke, W. (2004) Inves-tigative Ophthalmology & Visual Science (ARVO abstract), 45, 1296.
2. Kvansakul, J., Edgar, D. F., Barbur, J. L., Schalch, W., Barker, F. M. & Kopcke, W. (2004)Investigative Ophthalmology & Visual Science (ARVO abstract), 45, 4340.
3. Snodderly, D. M. (1995) Am. J. Clin. Nutr. 62, 1448S-1461S.4. Moreland, J. D., Robson, A. G. & Kulikowski, J. J. (2001) Color Research and Application 26,
S261-S263.
87 The effect of macular pigment density on yellow-blue and red-green colour discrimination thresholds and other measures ofvisual performance
J.K. Kvansakul, M. Rodriguez-Carmona, J.A. Harlow, J.L. BarburApplied Vision Research Centre, The Henry Wellcome Vision Laboratories for Vision Sciences, CityUniversity, London, UK.
The macular pigment (MP) exhibits band-pass spectral absorption characteristics with peak absorp-tion in the short-wavelength range, thus acting as a pre-receptoral filter for blue light. Large, inter subjectvariation in macular pigment optical density (MPOD) has been reported with differences as large as onelog unit, as revealed from colour matching experiments (1). Absorption of blue light by the MP thereforeaffects trichromatic colour matches, but the extent to which this also affects chromatic discriminationsensitivity (as mediated by either the red-green (RG) or the yellow-blue (YB) chromatic mechanisms)remains less well understood (2,3). Dietary supplementation of carotenoids, mainly lutein (L) and zeax-anthin (Z), causes an increase in MP in the retina (4). In this investigation we have examined how themean absorption of short-wavelength light by the MP in subjects with normal diets affects chromatic sen-
66

sitivity. We have also examined whether increased MPOD levels following supplementation with L and/ or Z affects YB chromatic discrimination sensitivity and other measures of visual performance such ascontrast acuity. Chromatic detection thresholds, contrast acuity, wavefront aberrations, sensitivity to scat-tered light and MPOD profiles were measured in 24 normal trichromats. In a separate study, ten placebosubjects were compared with 17 subjects who received L / Z supplementation for six months. MPOD pro-files were measured up to an eccentricity of ±8◦ using a new flicker nulling technique implemented on ahigh brightness CRT display. Comparison of the MPOD-profiles before and after supplementation revealsa substantial increase of MPOD in the supplemented groups (p = 0.005) with the greatest and almost uni-form percentage increase within a disc region of s4o centered at the fovea. The improvement in contrastacuity was also statistically significant (p=0.001) in the group of subjects receiving L supplementation.All subjects showed excellent RG chromatic sensitivity that was independent of MPOD. Unexpectedly,YB thresholds were also normal and showed no correlation with MPOD. A model for threshold chromaticdiscrimination based on appropriate combinations of cone contrast signals was developed and the modelpredicts no significant change in YB chromatic sensitivity, even for MPOD levels as high as one log unit.The model also predicts a small increase in RG chromatic sensitivity that may however be too small tomeasure experimentally. The results show that MPOD can be increased significantly by supplementationwith carotenoids and that supplementation can cause a significant reduction in achromatic contrast acuitythresholds. YB and RG thresholds, on the other hand, remain largely unaffected by the MP, even for highMPOD levels. The model accounts for the absence of correlation between MPOD and YB thresholdsand predicts a small reduction in RG thresholds when MP is high. The findings suggest that at photopiclevels of light adaptation an increase in MPOD does not affect detrimentally human chromatic contrastsensitivity and that achromatic contrast acuity thresholds may actually be reduced.
1. Ruddock KH. Evidence for macular pigmentation from colour matching data. Vision Research1963;3:417-29.
2. Moreland JD, Dain SL.Macular pigment contributes to variance in 100-hue tests. Doc.Ophthalmol.Proc.Ser.1995;57:517-22.
3. Wolffsohn JS, Cochrane AL, Khoo H, Yoshimitsu Y, Wu S. Contrast is enhanced by yellow lensesbecause of selective reduction of short-wavelength light. Optom.Vis.Sci. 2000;77:73-81.
4. Sommerburg O, Keunen JEE, Bird AC, van Kuijk FJGM. Fruits and vegetables that are sources forlutein and zeaxanthin: the macular pigment in human eyes. Br J Ophthalmol 1998;82:907-10.
88 Absence of Magnocellular and Parvocellular Deficits in Schizo-phrenia
S. Delord1, M.G. Ducato2, S. Thimel,2, D. Pins2, P. Thomas2, K. Knoblauch3, M. Boucart21Equipe de Psychologie Cognitive, Laboratoire de Psychologie (EA 3662), U.F.R. des Sciences de l’Homme,Université Bordeaux 2, Bordeaux, France2Laboratoire de Neurosciences Fonctionnelles et Pathologies, FRE 2726CNRS, Université Lille 2, CHRUde Lille, Lille, France3Inserm U 371, Cerveau et Vision, Department of Cognitive Neurosciences, IFR 19, UCB Lyon 1, Bron,France.
Early visual processing in parvocellular and magnocellular streams can be experimentally isolatedby exploiting their different contrast gain properties (Pokorny and Smith, 1997, JOSA, 14). We testedpsychophysically whether the global magnocellular dysfunction reported in schizophrenia (e.g. Schwartzet al., 2001, Frontiers in Bioscience, 6) also affects such early processes. Seven schizophrenic patientsand 24 controls participated. The task was to discriminate the slightly brighter square target among four.Target luminance threshold was determined in 3 conditions: target was pulsed for 17 ms together with the3 squares (pulse paradigm), target was presented on a steady background composed of 4 uniform squares
67

(steady paradigm), or target was presented alone (no background paradigm). The first study replicatedprevious results demonstrating that magnocellular and parvocellular processing could be dissociated incontrol participants. Moreover, no evidence for an early magnocellular deficit in the schizophrenic pa-tients could be detected as the thresholds of all schizophrenic observers were within normal limits inthe steady paradigm (presumed magnocellular mediation), as well as in the pulse paradigm (presumedparvocellular mediation). Magnocellular dysfunction, if present in schizophrenia, must concern moreintegrated processes, possibly at the level of parvocellular and magnocellular interactions.
89 "De Visu" software
F. Tilquin and F. JauzeinActualisation des Connaissances des Enseignants en Science (ACCESS) Institut National de RecherchePédagogique (INRP) Lyon, France
Pedagogic objectivesWe have developed a free software tool written in Delphi with advice fromKenKnoblauch (Inserm U371, Cerveau et Vision, Lyon) and David Alleysson (Laboratoire de Psychologie etNeuroCognition (LPNC) Université Pierre Mendès-France (UPMF), Grenoble) to introduce students tobasic principles of color vision. The target audience is secondary school students (14 to 18 years old). InFrance, vision is one of the neuroscience courses taught in high school, but approached mainly throughphysics. With this software, we are trying to interest students and make them understand that seeing is aconstruction by the brain, not only a problem of photoreception. As we think that the scientific knowledgeis now available to explain many visual phenomena, related to motion perception, colour perception andsome visual illusions, this software can provide a provocative introduction, which will help students todelve into the scientific aspects of vision.
Contents The software provides 7 interactive demonstrations. Retina processing at the level of thecone photoreceptors: Students can build artificial sensitivity curves of the cones or choose a pattern ofcolour sensitivities and look at theoretical consequences on natural scenes. Students can also comparethe discrimination capacity of the cones and the MPK systems; Influence of context on color perception:Students create screen patches of different colours and place them in various colored backgrounds; Detec-tion of color vision deficiencies: Students has to create a colour as near as possible to a reference colour;Illusions of colour perception; Motion Illusions; Successive contrast: Students look at a coloured picturefor a while, and describe after-image sensations perceived by looking at a grey screen; Lateral inhibitionin receptive fields.
90 Cambridge Research Systems
68

IndexAhnelt, P.K., 12Aldaba, M.A., 58Alleysson, D., 45Amano, K., 33, 47, 48, 58Austrusseau, F., 36
Balding, S.D., 16Baptista, A.M.G., 56Baraas, R.C., 47Barbur, J.L., 18, 24, 43, 65, 66Berezovsky, A., 42Bernick, M., 55Bimler, D.L., 40, 55Bompas, A., 21Bonnardel, V., 56Bosten, J.M., 53Boucart, M., 67Bouet, R., 30Boyaci, H., 29Brecel, J., 51Buck, S.L., 13, 14
Cao, D., 14, 15Carelli, V., 42Carroll, J., 52Carvalhal, J.A., 59Chaix, B., 45Christie, N., 52Cleveland, S., 54Colomb, M., 26, 38Cooper, H. M., 11
D’Antona, A.D., 36da Costa, M.F., 42, 55, 57da Silva Filho, M., 27Dain, S.J., 24Danilova, M.V., 22Daugirdiene, A., 21de Mattiello, M.L.F., 60de Oliveira, F., 57de Souza, J.M., 58Deeb, S.S., 17Delahunt, P.B., 50Delon-Martin, C., 51Delord, S., 67Devinck, F.D., 50do Canto-Pereira, L.H.M., 50
Doerschner, K., 29Dojat, M., 30, 51Ducato, M.G., 67
Ezrati, J.J., 53
Fossarello, M., 42Foster, D.H., 33, 47, 48, 56, 58
Gegenfurtner, K.R., 32Gekka, T., 61, 62Gerardin, P., 37Glösmann, M., 12Gomes, B.D., 27Goto-Omoto, S., 61, 62Gualtieri, M., 42Gunther, K.L., 20Gustavo, A, 57
Hérault, J., 45Hansen, T., 32Hardy, J.L., 50Harlow, J.A., 24, 65, 66Hayashi, T., 17, 61, 62Hernd, E., 12Hillyer, N., 13Hong, S.W., 39Hovis, J.K., 44, 62
Ikaunieks, G., 26, 38, 44Izmailov, Ch.A., 40
Jacobs, G.H., 16, 28Jauzein, F., 68Jordan, G., 53
Kübber-Heiss, A., 12Karitans, V., 38Khan, S., 26Kitahara, K., 61, 62Knoblauch, K., 18, 30, 37, 51, 67Kranjc, B.S, 51Krumina, G., 26, 44Kubo, A., 61, 62Kuchenbecker J., 33Kulikowski, J.J., 21Kurtenbach, A., 41
69

Kvansakul, J.K., 66
Lago, M., 55, 57Lamalle, L., 30Lee, B.B., 11, 12Lee, D., 63Levin, J., 59Li, A., 30Lin, J., 52Linhares, J.M.M., 58, 59Logvinenko, A.D., 46Lui, Y., 17Lutze, M., 14, 64
Mahler, E., 53Makous, W., 52Maloney, L.T., 29Mancuso, K., 18, 54Martino, N., 60Mauck, M., 59Mayser, H., 41McKeefry, D.J., 38Mellerio, J., 25Mollon, J.D., 16, 22, 53Monnier, P., 34Montag, E.D., 20Moreland, J.D., 46, 65Morya, E., 50Murray, I.J., 21, 38
Nascimento, S.M.C., 33, 47, 48, 56, 58, 59Neitz, J., 16, 18, 20, 33, 54, 59Neitz, M., 16, 18, 20, 33, 54, 59Nishi, M., 55
O’Regan, J.K., 21, 31Oiwa, N.N., 55Oliveira, F., 42Ozolinsh, M., 26, 38, 44
Pachot-Clouard, M., 51Paramei, G.V., 40, 50, 55Parry, N.R.A., 38Perina, C., 55Philipona, D., 31Piettre, L., 51Pinna, B., 35Pins, D., 67Pinto, P.D., 58, 59Plant, G., 43
Plummer, D.J., 20Pokorny, J., 14, 15, 28, 61, 64Pompe, M.T., 51Puts, M.J.H., 61
Quiros, P., 42
Ramaswamy, S., 44, 62Ranvaud, R.D., 50Robinson, J.D., 53Robson, A.G., 65Rocha, F., 58Rodriguez-Carmona, M., 18, 24, 65, 66Roud, P., 37Rowe, M.P., 28Rudd, M.E., 40
Süsstrunk, 37Sadun, A.A., 42Saito, C.A., 27, 58Salaris, E.R., 42Salomão, S.R., 42Samuelson, E.M., 13Santana, C.F., 55, 57Scheibner, H., 54Schiviz, A., 12Schubert, C., 12Segebarth, C., 30, 51Serra, A., 42Serreault, L., 22Sharpe, L.T., 26Shevell, S.K., 34, 36, 39Silveira, L.C.L., 27, 57, 58Sjoberg, S.A., 16Smith, V.C., 28, 61Smithson, H., 11, 26Souza, G.S., 27Spillman, L., 50Stanikunas, R., 21Stockman, A., 20, 26Sun, H., 11, 12
Takeuchi, T., 61, 62Thime, S., 67Thomas, L.P., 13, 14Thomas, P., 67Tilquin, F., 68
Vaitkevicius, H., 21Veit, F.G., 43
70

Ventura, D.F., 42, 55, 57, 58Viénot, F., 22, 53Vorobyev, M., 27
Walker, S., 32Werner, A., 31Werner, J.S., 50West, P., 25Westland, S., 46, 65Williams, D.R., 52Williams, G.A., 16Wolfing, J.I., 52
Zaidi, Q., 11, 30Zatz, M., 57Zele, A.J., 14, 15, 28Zrenner, E., 41Zucca, I., 42Zucchini, W., 12
71