paper 2009/04 - minimum colour vision requirements for ... · caa paper 2009/04 minimum colour...
TRANSCRIPT

CAA Paper 2009/04
Minimum Colour Vision Requirements for
Professional Flight Crew
Recommendations for new colour vision standards
www.caa.co.uk
Safety Regulation Group


Federal Aviation Administration
CAA PAPER 2009/04
Minimum Colour Vision Requirements for
Professional Flight Crew
Recommendations for new colour vision standards
Based on a report prepared for the CAA by:
Prof John Barbur & Dr Marisa Rodriguez-Carmona
Applied Vision Research Centre,The Henry Wellcome Laboratories for Vision Sciences,Northampton Square, London EC1V 0HB.
Dr Sally Evans, UK Civil Aviation Authority, Safety Regulation Group, Aviation House, Gatwick Airport South, RH6 0YR, UK.
Dr Nelda Milburn
FAA, Civil Aerospace Medical Institute, AAM-510PO Box 25082Oklahoma City, OK 73125, USA.
Safety Regulation Group
May 2009

CAA Paper 2009/04 Minimum Colour Vision Requirements for Professional Flight Crew
© Civil Aviation Authority 2009
All rights reserved. Copies of this publication may be reproduced for personal use, or for use within acompany or organisation, but may not otherwise be reproduced for publication.
To use or reference CAA publications for any other purpose, for example within training material forstudents, please contact the CAA at the address below for formal agreement.
ISBN 978 0 11792 173 3
Published May 2009
Enquiries regarding the content of this publication should be addressed to:Medical Department, Safety Regulation Group, Civil Aviation Authority, Aviation House, Gatwick AirportSouth, West Sussex, RH6 0YR.
The latest version of this document is available in electronic format at www.caa.co.uk/publications,where you may also register for e-mail notification of amendments.
Published by TSO (The Stationery Office) on behalf of the UK Civil Aviation Authority.
Printed copy available from: TSO, PO Box 29, Norwich NR3 1GN www.tso.co.uk/bookshopTelephone orders/General enquiries: 0870 600 5522 E-mail: [email protected] orders: 0870 600 5533 Textphone: 0870 240 3701

CAA Paper 2009/04 Minimum Colour Vision Requirements for Professional Flight Crew
Part Page Date Part Page Date
Page iii
iii May 2009
Contents 1 May 2009
Contents 2 May 2009
Foreword 1 May 2009
List of Figures and Tables 1 May 2009
List of Figures and Tables 2 May 2009
Executive Summary 1 May 2009
Executive Summary 2 May 2009
Executive Summary 3 May 2009
Executive Summary 4 May 2009
Executive Summary 5 May 2009
Glossary 1 May 2009
Glossary 2 May 2009
1 May 2009
2 May 2009
3 May 2009
4 May 2009
5 May 2009
6 May 2009
7 May 2009
8 May 2009
9 May 2009
10 May 2009
11 May 2009
12 May 2009
13 May 2009
14 May 2009
15 May 2009
16 May 2009
17 May 2009
18 May 2009
19 May 2009
20 May 2009
21 May 2009
22 May 2009
23 May 2009
24 May 2009
25 May 2009
26 May 2009
27 May 2009
28 May 2009
29 May 2009
30 May 2009
31 May 2009
32 May 2009
33 May 2009
34 May 2009
35 May 2009
36 May 2009
37 May 2009
38 May 2009
39 May 2009
40 May 2009
41 May 2009
42 May 2009
43 May 2009
44 May 2009
45 May 2009
46 May 2009
47 May 2009
48 May 2009
49 May 2009
50 May 2009
51 May 2009
52 May 2009
53 May 2009
54 May 2009
55 May 2009
56 May 2009
57 May 2009
58 May 2009
59 May 2009
May 2009
List of Effective Pages

INTENTIONALLY LEFT BLANK

CAA Paper 2009/04 Minimum Colour Vision Requirements for Professional Flight Crew
Contents
Executive Summary 1
Glossary 1
Abbreviations 1
Nomenclature 2
Minimum Colour Vision Requirements for
Professional Fight Crew
Introduction 1
The use of colour in aviation 1Current colour vision requirements and assessment methods in aviation 2Problems identified with current assessment methods and procedures 3A new approach based on recent advances in colour vision testing 3A new colour vision test 3Identification of the most safety-critical and demanding colour vision tasks 3Brief description of the most common occupational colour vision tests 9The CAD test 14Summary of congenital colour vision deficiencies 20Acquired colour vision deficiencies 20
Subjects and Methods 22
Summary of tests employed in this study 22PAPI and PSL simulator 22Testing procedure 25
Results 27
Computing an index of overall chromatic sensitivity 34
Discussion 37
Colour vision concerns in aviation 37Advances in assessment of colour vision 38Safe colour vision limits in aviation 38Benefit analysis of using the new approach 41
Contents Page 1May 2009

CAA Paper 2009/04 Minimum Colour Vision Requirements for Professional Flight Crew
Conclusions 45
Definitions 46
Acknowledgements 56
References 57
Contents Page 2May 2009

CAA Paper 2009/04 Minimum Colour Vision Requirements for Professional Flight Crew
Foreword Page 1
Foreword
This report describes the third phase of a project to determine ‘Minimum Colour VisionRequirements for Professional Flight Crew’. It is a study to produce standards and a new testfor chromatic sensitivity that can be used to quantify the severity of an individual’s colourdeficiency. The research was necessary because of the lack of reliable, standardised tests andthe absence of information on the specific colour vision needs of professional flight crew.
The project was initiated by UK CAA who published the first two phases as CAA Paper 2006/04. Part 1 ‘The Use of Colour Signals and the Assessment of Colour Vision Requirements inAviation’ details an examination as to whether the current colour vision tests and standards forprofessional pilots are still appropriate for modern aviation. Part 2 ‘Task Analysis’ determinesthe colour vision demands on the flight crew when operating modern aeroplanes, taking twoaircraft types as case studies: the Airbus A321 and Boeing 757.
This third phase of the work has been co-sponsored by the FAA. It has produced the minimumcolour vision requirements for modern flight crew, and a new colour assessment and diagnosistest. The new test provides an accurate assessment of the applicant’s colour vision andexcludes only those applicants with colour deficiency characteristics that are likely to affectperformance on the flight crew task. If the new standard and tests were to be adopted, it isanticipated that, on average, 35% of applicants currently excluded on the basis of conventionalcolour vision tests would be accepted as safe to fly.
May 2009

INTENTIONALLY LEFT BLANK

CAA Paper 2009/04 Minimum Colour Vision Requirements for Professional Flight Crew
List of Figures and Tables
Figure 1a and 1b: The Precision Approach Path Indicator (PAPI) signal lights and Visual Approach Slope Indicator (VASI lights that are used to inform pilots of the correct glide path for landing 4
Figure 2a and 2b: Photograph of PAPI lights and parking lights 5/6
Figure 3: Ishihara pseudoisochromatic plates 9
Figure 4: Dvorine pseudoisochromatic plates 10
Figure 5: Photograph of the Nagel anomaloscope (Model I, Schmidt and Haensch, Germany) and illustration of the Nagel anomaloscope split field 11
Figure 6: Scatter plot of Nagel matching midpoints versus RGI for 231 observers 13
Figure 7a and 7b: Schematic representation and photograph of the Aviation Light Test (ALT) 14
Figure 8: Frequency distributions of the Yellow-Blue (YB) and Red-Green (RG) chromatic thresholds obtained in 250 observers with ‘normal’ trichromatic vision 15
Figure 9: Data showing the 97.5 and 2.5% statistical limits that define the “standard” normal CAD test observer 16
Figure 10: Chromatic thresholds for two colour vision deficient observers with minimal colour vision deficiency 17
Figure 11: Chromatic thresholds for two colour vision deficient observers with severe colour vision deficiency 18
Figure 12: Graph showing Red-Green (RG) and Yellow-Blue (YB) thresholds expressed in CAD Standard Normal units for the population of subjects tested as part of this study 19
Figure 13: Effect of age on the YB and RG chromatic thresholds for normal trichromats under normal daylight conditions 20
Figure 14: Examples of subjects with acquired loss of chromatic sensitivity 21
Figure 15: 1931 CIE-x,y colour space diagram showing the recommendedchromaticity boundaries for the colours of light signals 23
Figure 16: Schematic representation of PAPI simulator 24
Figure 17: Graphs showing the CIE-x,y chromaticity coordinates of the Red and White PAPI lights under the effect of neutral density filtering and current setting of the lamp 25
Figure 18: Schematic representation of the Precision Approach Path Indicator (PAPI) simulator test (left) and PAPI Signal Lights Test (PSL) (right) 26
List of Figures and Tables Page 1May 2009

CAA Paper 2009/04 Minimum Colour Vision Requirements for Professional Flight Crew
Figure 19: The number of plates read correctly on the Ishihara test (24 plates) is compared to performance on the PAPI simulator test separately for normals, deutan and protan colour vision observers 27
Figure 20: PAPI % correct scores plotted as a function of the number of plates read correctly on the Dvorine test for normals, deutan and protan observers 28
Figure 21: The number of presentations identified correctly on the Aviation Light Test (ALT) compared to performance on the PAPI simulator test 29
Figure 22: PAPI test scores plotted against an index of red-green chromatic sensitivity based on the Nagel anomaloscope range 30
Figure 23: Graphs showing performance of normal, deutans and protan observers on the PAPI (standard white) versus CAD test sensitivity (1/threshold) 31
Figure 24: Graphs showing comparisons between standard and modified PAPI white versus the CAD test sensitivity values 32
Figure 25: Graphs showing R=W and W=R errors only made on the PSL versus the RG CAD sensitivity 33
Figure 26: Justification for proposed limits on the CAD test 35
Figure 27: Summary of deutan subjects’ results if the proposed pass/fail criteria of 6 RG CAD threshold units is accepted 38
Figure 28: Summary of protan subjects’ results if the proposed pass/fail criteria of 12 RG CAD threshold units is accepted. 39
Table 1: Percentage of colour deficient observers that fail Ishihara and HW tests 40
Table 2: Predicted outcome per thousand applicants using current CAA / JAR guidelines 40
Table 3: Predicted outcome per thousand applicants using the new, CAD based pass / fail limits 41
Table 4: Percentage of colour deficient observers that fail Ishihara, Dvorine and ALT tests (using FAA pass / fail criteria) 42
Table 5: Contingency tables showing results of Ishihara, Dvorine and ALT tests and the corresponding pass / fail PAPI scores 42
Table 6: Pass / fail scores on Ishihara and Dvorine compared against the ALT 43
Table 7: Predicted outcome per thousand applicants when using Ishihara, Dvorine and ALT tests 43
List of Figures and Tables Page 2May 2009

CAA Paper 2009/04 Minimum Colour Vision Requirements for Professional Flight Crew
Executive Summary
This report describes the findings of the third phase of the project sponsored by the UnitedKingdom Civil Aviation Authority (CAA) on “Minimum Colour Vision Requirements forProfessional Flight Crew”. Parts I and II have already been published1 and cover “The Use ofColour Signals and Assessment of Colour Vision Requirements”, and “Task Analysis”,respectively. This third part of the project, “Recommendations for New Colour VisionStandards”, involved collaboration and co-sponsorship by the Federal Aviation Administration(FAA).
Minimum colour vision requirements for professional flight crew have been established byassessing the level of colour vision loss above which subjects with colour deficiency no longerperform the most safety-critical, colour-related tasks within the aviation environment with thesame accuracy as normal trichromats.
The new CAD (Colour Assessment & Diagnosis) test provides accurate assessment of theapplicant’s colour vision. The results of the test establish with high specificity whether thesubject’s red-green and yellow-blue colour vision falls within the normal range and the classand severity of colour vision loss in subjects with colour deficiency. The results of the test alsoindicate whether the applicant’s colour vision meets the minimum requirements for safeperformance that have emerged as necessary from this investigation. If the new, experiment-based, pass / fail colour limits were adopted as minimum requirements for professional flightcrew, 36% of deutan subjects and 30% of protan subjects would be classed as safe to fly.Given the higher prevalence of deutan deficiencies, these findings suggest that 35% of colourdeficient applicants would be classed as safe to fly.
Background
The use of colour in aviation for coding of signals and information is important, hence the needto set adequate colour vision requirements to ensure that flight crew are able to discriminateand recognise different colours, both on the flight deck and externally. Concern has, however,been expressed during the past few years that the current colour vision standards, at leastwithin JAA (Joint Aviation Authorities) member states2 are not appropriate since most testsand pass limits only screen for normal red/green colour vision. Since the incidence ofcongenital yellow/blue deficiency is extremely low (see Table 1), the absence of red/greendeficiency is virtually equivalent to normal trichromacy. Subjects with minimal colourdeficiencies often fail normal trichromacy tests and the great majority are therefore preventedfrom becoming pilots, although many of these subjects may well be able to perform safety-critical tasks, as well as normal trichromats, when presented with the same, suprathresholdcolour signals. In principle, these subjects should be allowed to fly. To include some individualswith minimum colour deficiency that may well be safe to fly, some authorities have eitherrelaxed the pass limits on tests designed to screen for normal colour vision (e.g. Ishihara,Dvorine) or they have introduced less demanding tests that applicants with mild colour visiondeficiency can pass. This approach does justice to some applicants, but not to others. Existing,conventional colour screening tests employed by most authorities cannot be used to quantifyaccurately the severity of colour vision loss and this makes it difficult to set reliable pass / faillimits. With very few exceptions, no red/green colour deficient applicants pass either theIshihara or the Dvorine colour screening tests with zero errors. The same applies toanomaloscope matches when strict criteria are employed (e.g. when the applicant sets anappropriate red/green mixture field to match the colour appearance of a yellow,
1. CAA Paper 2006/04, published August 2006.2. JAR requirements on this subject are still applicable under EASA, transition of the relevant text to an EASA document is
anticipated by 2012.
Executive Summary Page 1May 2009
CAA Paper 2009/04 Minimum Colour Vision Requirements for Professional Flight Crew
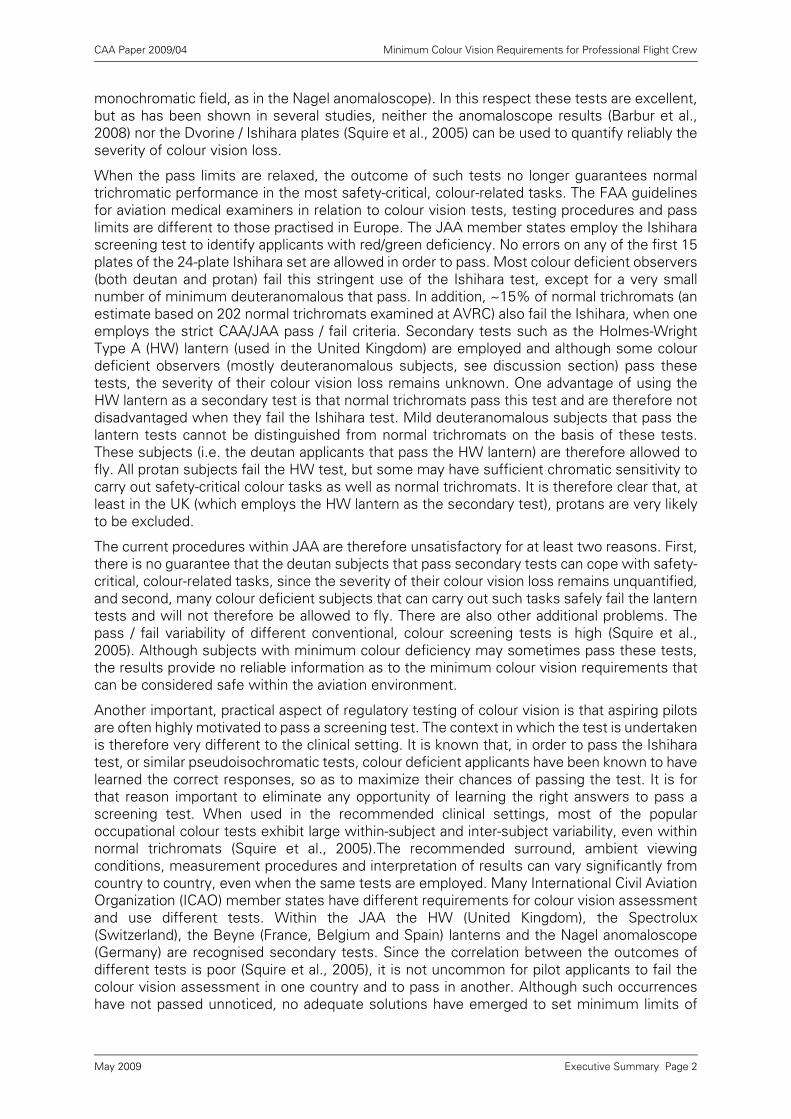
monochromatic field, as in the Nagel anomaloscope). In this respect these tests are excellent,but as has been shown in several studies, neither the anomaloscope results (Barbur et al.,2008) nor the Dvorine / Ishihara plates (Squire et al., 2005) can be used to quantify reliably theseverity of colour vision loss.
When the pass limits are relaxed, the outcome of such tests no longer guarantees normaltrichromatic performance in the most safety-critical, colour-related tasks. The FAA guidelinesfor aviation medical examiners in relation to colour vision tests, testing procedures and passlimits are different to those practised in Europe. The JAA member states employ the Ishiharascreening test to identify applicants with red/green deficiency. No errors on any of the first 15plates of the 24-plate Ishihara set are allowed in order to pass. Most colour deficient observers(both deutan and protan) fail this stringent use of the Ishihara test, except for a very smallnumber of minimum deuteranomalous that pass. In addition, ~15% of normal trichromats (anestimate based on 202 normal trichromats examined at AVRC) also fail the Ishihara, when oneemploys the strict CAA/JAA pass / fail criteria. Secondary tests such as the Holmes-WrightType A (HW) lantern (used in the United Kingdom) are employed and although some colourdeficient observers (mostly deuteranomalous subjects, see discussion section) pass thesetests, the severity of their colour vision loss remains unknown. One advantage of using theHW lantern as a secondary test is that normal trichromats pass this test and are therefore notdisadvantaged when they fail the Ishihara test. Mild deuteranomalous subjects that pass thelantern tests cannot be distinguished from normal trichromats on the basis of these tests.These subjects (i.e. the deutan applicants that pass the HW lantern) are therefore allowed tofly. All protan subjects fail the HW test, but some may have sufficient chromatic sensitivity tocarry out safety-critical colour tasks as well as normal trichromats. It is therefore clear that, atleast in the UK (which employs the HW lantern as the secondary test), protans are very likelyto be excluded.
The current procedures within JAA are therefore unsatisfactory for at least two reasons. First,there is no guarantee that the deutan subjects that pass secondary tests can cope with safety-critical, colour-related tasks, since the severity of their colour vision loss remains unquantified,and second, many colour deficient subjects that can carry out such tasks safely fail the lanterntests and will not therefore be allowed to fly. There are also other additional problems. Thepass / fail variability of different conventional, colour screening tests is high (Squire et al.,2005). Although subjects with minimum colour deficiency may sometimes pass these tests,the results provide no reliable information as to the minimum colour vision requirements thatcan be considered safe within the aviation environment.
Another important, practical aspect of regulatory testing of colour vision is that aspiring pilotsare often highly motivated to pass a screening test. The context in which the test is undertakenis therefore very different to the clinical setting. It is known that, in order to pass the Ishiharatest, or similar pseudoisochromatic tests, colour deficient applicants have been known to havelearned the correct responses, so as to maximize their chances of passing the test. It is forthat reason important to eliminate any opportunity of learning the right answers to pass ascreening test. When used in the recommended clinical settings, most of the popularoccupational colour tests exhibit large within-subject and inter-subject variability, even withinnormal trichromats (Squire et al., 2005).The recommended surround, ambient viewingconditions, measurement procedures and interpretation of results can vary significantly fromcountry to country, even when the same tests are employed. Many International Civil AviationOrganization (ICAO) member states have different requirements for colour vision assessmentand use different tests. Within the JAA the HW (United Kingdom), the Spectrolux(Switzerland), the Beyne (France, Belgium and Spain) lanterns and the Nagel anomaloscope(Germany) are recognised secondary tests. Since the correlation between the outcomes ofdifferent tests is poor (Squire et al., 2005), it is not uncommon for pilot applicants to fail thecolour vision assessment in one country and to pass in another. Although such occurrenceshave not passed unnoticed, no adequate solutions have emerged to set minimum limits of
Executive Summary Page 2May 2009

CAA Paper 2009/04 Minimum Colour Vision Requirements for Professional Flight Crew
colour vision sensitivity that can be considered operationally “safe” within specifiedenvironments. The lack of adequate solutions to this problem explains why some authoritiesunknowingly insist on normal trichromacy (which is largely what is achieved when currentpass/fail limits are employed with Ishihara as the primary test and HW lantern as the secondarytest).
The FAA guidelines are more liberal and allow for the use of various pseudoisochromatic plates(e.g. Ishihara, Dvorine, AOC-HRR, Richmond 1983-edition, 15 plates, etc) with relaxed pass/fail limits (e.g. the applicant has to make seven or more errors in order to fail the Ishihara orDvorine tests). Alternative tests such as Farnsworth lantern (FALANT), Keystone Orthoscope,etc can also be used as acceptable substitutes. As far as the FAA guidelines are concerned,the analysis of results is restricted to the FAA approved tests that have been included in thisinvestigation (i.e. Ishihara and Dvorine). In addition, the Aviation Lights Test (i.e. a modifiedFarnsworth lantern that has been developed to screen air traffic controllers, see Figure 7 in fullreport) was also included in this investigation.
New developments
Advances in understanding human colour vision (Barbur, 2003) and the development of novelmethods to measure accurately the loss of chromatic sensitivity (Barbur et al., 1994) haveprompted the CAA to sponsor new studies to examine how colour vision loss can bemeasured accurately and also to establish minimum colour vision requirements for civilaviation professional pilots. As a result of the progress made in these studies it is now possibleto define the variability that exists within normal colour vision and to detect with confidenceand classify accurately even the smallest congenital colour vision deficiencies that sometimespass undetected in conventional, occupational colour vision tests. More importantly, it is nowpossible to achieve the aim of the project, i.e., to quantify the severity of colour vision loss andto recommend minimum colour vision requirements by establishing the level of colour visionloss when colour deficient observers can no longer perform the most safety-critical, colour-related tasks with the same accuracy as normal trichromats.
A number of developments that have emerged from the studies carried out during the last fewyears have made it possible to achieve the aim of this project:
• A Colour Assessment and Diagnosis (CAD) test that employs novel techniques to isolatethe use of colour signals and measures accurately both red-green (RG) and yellow-blue (YB)chromatic sensitivity has been developed and validated (see Figure 9).
• A study that compared outcome measures in the most common, occupational colour visiontests, in both normal trichromats and in a large number of colour deficient observers, hasimproved our understanding of current limitations. The findings from this study also justifythe need for a test that can be used to measure accurately the subject’s chromaticsensitivity and the variability expected within the colour normal population (Squire et al.,2005).
• The establishment of colour discrimination limits for normal vision i.e., the standard normalCAD observer based on RG and YB colour detection thresholds measured in ~250 normaltrichromats provides a template for detection of abnormal sensitivity (Rodriguez-Carmonaet al., 2005) (see Figure 8). In addition, similar measurements in over 300 colour deficientobservers that participated in several projects related to colour vision provided the dataneeded to describe the differences in the severity of colour vision loss withindeuteranomalous and protanomalous observers (see Figure 12).
• Identification of the most important, safety-critical, colour-related tasks for pilots and faithfulreproduction of such tasks in the laboratory made it possible to establish experimentally thesafe limits of colour vision loss. The visual task analysis carried out as part of this studyidentified the Precision Approach Path Indicator (PAPI) as the most important, safety-criticaltask that relies largely on colour vision. At some airports, colour signals are also used for
Executive Summary Page 3May 2009

CAA Paper 2009/04 Minimum Colour Vision Requirements for Professional Flight Crew
aligning the aircraft when approaching the parking area, and in such cases correct colourrecognition is critical to the safe accomplishment of this task. There are many other tasksthat involve the use of colour signals, but they involve larger stimuli, the viewing is undermore favourable conditions of light adaptation and other cues make the colour coding lesscritical. In the case of the PAPI lights, it is essential that the pilot distinguishes accuratelythe number of “white” and “red” lights. Moreover, the pilot needs to recognise the fouradjacent lights as “white”, when too high, and as “red”, when too low. The PAPI lights taskis demanding since the lights can be very small (i.e. subtend a very small visual angle at theeye) and are often seen against a dark background (see Figure 18) when colourdiscrimination sensitivity is known to be poor.
• Colour discrimination limits (based on the CAD test) that can be classified as safe for pilotsin civil aviation have been established. This was achieved by measuring and relating PAPItask performance and colour discrimination sensitivity as assessed on CAD, signal lightsand a number of other colour vision tests (see description below) in 40 protanomalous, 77deuteranomalous and 65 normal trichromats. There are other visual tasks that can beclassed as safety-critical, but in general these involve larger and brighter lights and aretherefore easier to carry out. These tasks either rely on colour discrimination (such as thered-green parking lights) or, in some cases, the tasks benefit from the use of colour signalsas redundant information (such as the “green” runway threshold lights). In addition to thered-green parking and the green runway threshold lights there are also a number of otherrunway lights; the red-white centre-line lights, the green-yellow lead-off lights and the redstopway lights. The tasks that involve these additional lights have not been simulated in thelaboratory, but as argued in the main report, they are either less demanding in terms ofcolour discrimination or the colour signals are only used to reinforce the functionalsignificance of the lights.
• Data showing correlation between PAPI scores and CAD sensitivity thresholds are shownin Figure 23 for normal, deuteranomalous and protanomalous observers.
Principal conclusions
• Subjects with red/green congenital colour deficiency exhibit an almost continuous loss ofchromatic sensitivity. The loss of sensitivity (when expressed in Standard Normal (CAD)units (SN units) is greater in protanomalous than deuteranomalous observers (Figure 12).
• When the ambient level of light adaptation is adequate, normal aging does not affectsignificantly either RG or YB thresholds below 60 yrs of age (see Figure 13).
• Analysis of PAPI results shows that the use of a modified “white” light results in significant,overall improvements in PAPI performance, particularly within normal trichromats anddeuteranomalous observers. The modified (or colour corrected white) is achieved simply byadding a colour correction filter to the standard white lights produced by the source. Thefilter employed in this study decreased the colour temperature of the standard white (usedin PAPI systems) by 200 MIREDS (micro reciprocal degrees).
• The deuteranomalous subjects investigated in this study with CAD thresholds < 6 SN unitsand the protanomalous subjects with CAD thresholds < 12 SN units perform the PAPI testas well as normal trichromats.
• 43 of the 77 deuteranomalous subjects failed the PAPI test. 29 out of the remaining 34subjects that passed the PAPI test had CAD thresholds < 6 SN units.
• 20 of the 40 protanomalous subjects failed the PAPI test. 13 out of the remaining 20subjects that passed the PAPI test had CAD thresholds < 12 SN units.
• A small number of deuteranomalous (5) and protanomalous (7) observers with thresholdshigher than 6 and 12 SN units, respectively, passed the PAPI test. All these subjects do,however, exhibit poor overall, RG chromatic sensitivity in all the other colour tests
Executive Summary Page 4May 2009

CAA Paper 2009/04 Minimum Colour Vision Requirements for Professional Flight Crew
employed in the study and are therefore likely to be disadvantaged in many othersuprathreshold visual performance tasks that involve colour discrimination.
• The results suggest that subjects with minimum colour deficiency that does not exceed 6SN units for deuteranomalous observers and 12 SN units for protanomalous observersperform the PAPI test as well as normal trichromats. If these findings were adopted as pass/ fail limits for pilots ~35% of colour deficient applicants would be classed as safe to fly.
• The administration of the CAD test eliminates the need to use any other primary orsecondary tests. It is proposed that a rapid, reduced version of the CAD test (labelled fast-CAD) is administered first to establish whether the applicant passes with no errors the 6 SNlimit established for deutan subjects. Deutans represent ~ 6% of colour deficients and 36%of deutan subjects pass the recommended CAD limit (see Table 3). When one includesnormal trichromats, ~ 94% of all applicants will pass the fast-CAD screening test and beclassified as safe to fly. This process is very efficient since the fast-CAD test is simple tocarry out and takes less than 30 seconds to complete. The definitive CAD test (which takesbetween 6 to 8 minutes for RG sensitivity) is administered only when the applicant fails thefast-CAD screening test. The latter establishes the class of colour deficiency involved andwhether the applicant’s threshold is below the pass / fail limit established for protansubjects. In addition, the CAD test provides the option to test the applicants YB colourvision. This option reveals whether the applicant’s YB discrimination sensitivity falls withinthe normal range. In view of the increased use of colour in aviation, testing for normal YBthresholds can also be of relevance to aviation safety.
Executive Summary Page 5May 2009

INTENTIONALLY LEFT BLANK

CAA Paper 2009/04 Minimum Colour Vision Requirements for Professional Flight Crew
Glossary
1 Abbreviations
AGL Aeronautical Ground Lighting
ALT Aviation Light Test
ATC Air Traffic Controller
ATCO Air Traffic Control Officer
AVRC Applied Vision Research Centre (City University)
CAA Civil Aviation Authority
CAD Colour Assessment and Diagnosis test
CIE Commission Internationale de l’Eclairage
CS Chromatic Sensitivity
FAA Federal Aviation Administration
ICAO International Civil Aviation Organization
JAA Joint Aviation Authorities
JAR Joint Aviation Requirements
L-cones Long-wavelength sensitive cones
LC Luminance Contrast
MIRED Micro Reciprocal Degrees
M-cones Medium-wavelength sensitive cones
NTSB National Transportation Safety Board
PAPI Precision Approach Path Indicator
RG Red-Green
S-cones Short-wavelength sensitive cones
SI Système International d'Unités (International System of Units)
SN Standard Normal
UK United Kingdom
YB Yellow-Blue
Glossary Page 1May 2009
CAA Paper 2009/04 Minimum Colour Vision Requirements for Professional Flight Crew
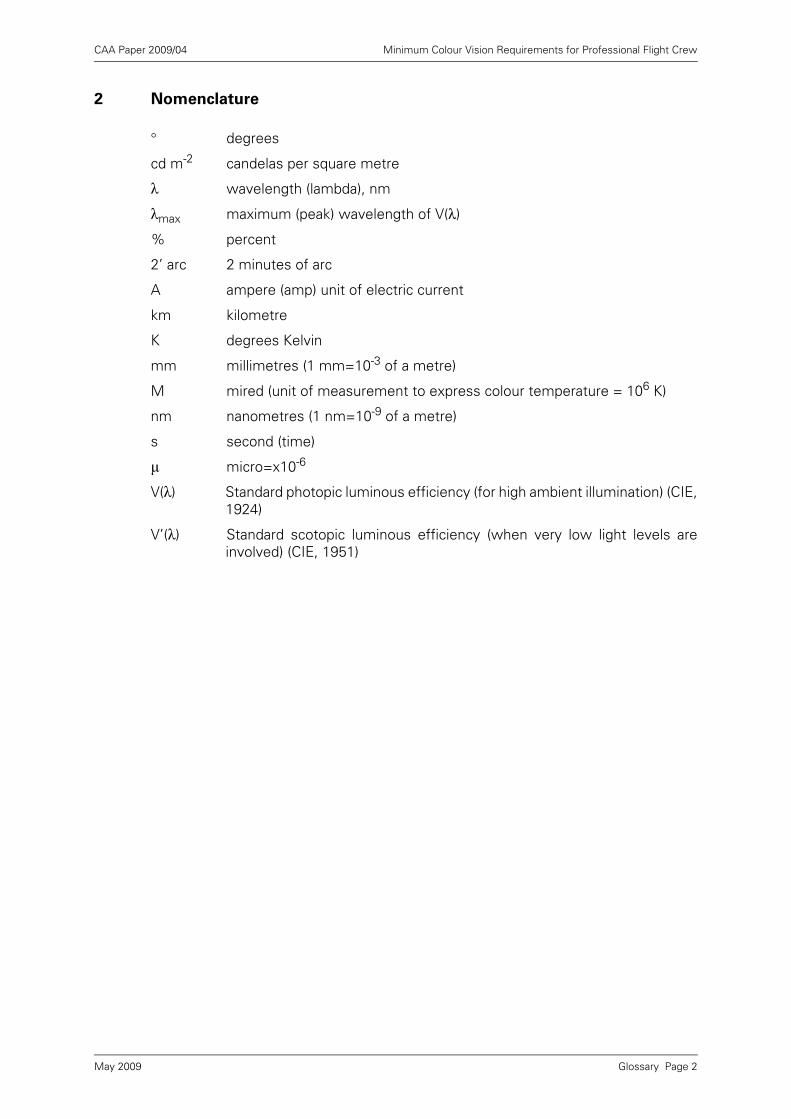
2 Nomenclature
° degrees
cd m-2 candelas per square metre
λ wavelength (lambda), nm
λmax maximum (peak) wavelength of V(λ)
% percent
2’ arc 2 minutes of arc
A ampere (amp) unit of electric current
km kilometre
K degrees Kelvin
mm millimetres (1 mm=10-3 of a metre)
M mired (unit of measurement to express colour temperature = 106 K)
nm nanometres (1 nm=10-9 of a metre)
s second (time)
μ micro=x10-6
V(λ) Standard photopic luminous efficiency (for high ambient illumination) (CIE,1924)
V’(λ) Standard scotopic luminous efficiency (when very low light levels areinvolved) (CIE, 1951)
Glossary Page 2May 2009

CAA Paper 2009/04 Minimum Colour Vision Requirements for Professional Flight Crew
Minimum Colour Vision Requirements for Professional
Flight Crew
1 Introduction
1.1 Occupational colour vision standards were introduced in aviation in 1919 (by TheInternational Commission for Air Navigation). These standards reflected both theneeds and the methods available for colour vision assessment at the time. Concernhas been expressed during the last few years that the current JAR (Joint AviationRequirements)1 colour vision standards may be too stringent and, at the same time,also variable. The tests employed do not always reflect the tasks pilots encounter intoday’s aviation environment. An examination of current standards and techniquesemployed to assess colour vision requirements suggests the need for a more unifiedcolour vision test to provide a measure of colour vision loss that relates directly to themost safety-critical, colour-related tasks within the aviation environment (Cole, 1993).The current colour vision standards and accepted JAA (Joint Aviation Authorities)colour vision tests for professional flight crew have been reviewed by the UnitedKingdom Civil Aviation Authority (UK CAA). This report follows other CAA documentspublished in 2006: “Minimum Colour Vision Requirements for Professional FlightCrew”: Part I: The Use of Colour Signals and the Assessment of Colour VisionRequirements in Aviation and Part 2: Task Analysis.
1.2 The use of colour in aviation
1.2.1 The use of colour in the aviation environment is important since it makes possible theefficient coding of signals and information and this, in turn, enhances visualperformance, provided the subjects can make use of colour signals. Humans withnormal trichromatic colour vision possess three distinct classes of conephotoreceptors. These contain short (S), middle (M) and long (L) wavelength sensitivephotopigments with appropriate peak absorption wavelengths (λmax). Variant L- and /or M-cone genes can cause significant shifts in λmax and this in turn can cause largechanges in chromatic sensitivity. In addition to λmax changes, other factors such asthe amount of pigment present in photoreceptors can also affect chromaticsensitivity. Red/green deficiency is the most common type and is caused by eitherthe absence of or the abnormal functioning of L- or M-cones. The correspondingcondition is normally described as protan or deutan deficiency, respectively. Colourvision deficiency affects approximately 8% of men and less than 1% of women (seeTable in Section 4.4).
1.2.2 Aviation accidents have high social and economic costs, especially if the accidentinvolves large passenger aircraft. Rigorous safety standards have been establishedover decades to decrease the probability of aviation accidents. An important strategyin achieving high levels of safety in aviation is to build redundancy in equipment andthe interpretation of signals and other information by pilots and other personnel.Colour is used extensively to code information in the aviation environment and pilotsare normally expected to have good colour discrimination. Even when other cues arealso available, the ability to use colour information increases redundancy and in sometasks this improves considerably the level of visual performance that can be achieved.Some accidents have been linked to loss of colour vision (National TransportationSafety Board, 2004)2. There is also some evidence to suggest that the likelihood of
1. JAR requirements on this subject are still applicable under EASA, transition of the relevant text to an EASA document isanticipated by 2012.
Page 1May 2009

CAA Paper 2009/04 Minimum Colour Vision Requirements for Professional Flight Crew
accidents is increased in pilots that are colour deficient (Vingrys & Cole, 1986). Otherstudies have shown that subjects with colour vision deficiencies make more errorsand are slower in recognising aviation signals and colour coded instrument displays(Vingrys & Cole, 1986; Cole & Maddocks, 1995; Squire et al, 2005). There are also asmall number of tasks in which colour information is not used redundantly andtherefore the correct interpretation of colour signals becomes very important.
1.3 Current colour vision requirements and assessment methods in aviation
1.3.1 The International Civil Aviation Organization (ICAO) requires Contracting States tomaintain a colour vision standard to ensure pilots can recognise correctly the coloursof signal lights used in aviation: ‘The applicant shall be required to demonstrate theability to perceive readily those colours the perception of which is necessary for thesafe performance of duties’ (ICAO, 2001b). Many ICAO member states have differentrequirements for colour vision assessment and employ different tests as thestandard.
1.3.2 In Europe, there is agreement amongst the 38 members of the JAA to apply the samestandards, at least in terms of primary tests. The current JAA colour visionrequirements (Section 1; JAR-FCL 3, 2002) use the Ishihara pseudo-isochromatic test(Section 1.8.1 of this report) as a screening test for colour vision. The JAA use the first15 plates of the 24-plate version of the Ishihara pseudo-isochromatic test, with noerrors as the pass criteria. If the applicant fails this test then either a lantern test orthe Nagel anomaloscope test is used. The three lanterns recommended by the JAAare the Holmes-Wright Type A (United Kingdom), the Spectrolux (Switzerland) and theBeyne (France, Belgium and Spain). The subjects pass when they make no errors onthe corresponding lantern test. For the Nagel Anomaloscope (Section 1.8.3 of thisreport): “This test is considered passed if the colour match is trichromatic and thematching range is 4 scale units or less…” (See Appendix 14 to subpart B; JAR-FCL 3,2000). The tests currently employed by JAA member states and the correspondingpass/fail criteria are fully described in the report by the CAA (Civil Aviation Authority,2006a).
1.3.3 In the USA, the Federal Aviation Administration (FAA) guidelines are more liberal andthe approved primary tests include Ishihara, Dvorine, AOC-HRR, Richmond, etc. Thepass limits are also more relaxed which favours some applicants with mild colourdeficiency. Other tests include the Farnsworth Lantern, Keystone Orthoscope, etc. Inexceptional cases this can then be followed by the more practical Signal Light GunTest (SLGT), usually carried out in an airport tower. This approach does justice tosome applicants, but not to others (see Section 4). The disadvantage of this moreliberal approach is that when the pass limits are relaxed, the pass / fail outcome of thescreening tests no longer guarantees normal performance in the most safety-critical,colour-related tasks.
1.3.4 Follow up colour vision tests may be carried out for renewal of Class 1 medicalcertificates. Within the JAA, the Ishihara plates which screen only for red/greendeficiency are normally used for this assessment. Any yellow-blue loss (eithercongenital or acquired) will not therefore be picked up by this test (Section 1.11 of thisreport). Since changes in chromatic sensitivity are often indicative of early stagesystemic (e.g. diabetes) or ocular diseases (e.g. glaucoma, age-related maculardegeneration), it is recommended that both red-green and yellow-blue coloursensitivity should be assessed with every medical examination and any significantchanges noted. The data can then be used to detect when the progression of anyinherent condition yields colour thresholds that fall outside the range established fornormal vision.
2. NTSB Report AAR-04-02 concerning an accident in 2002, recommendations A 04-46 and A 04-47.
Page 2May 2009

CAA Paper 2009/04 Minimum Colour Vision Requirements for Professional Flight Crew
1.4 Problems identified with current assessment methods and procedures
Current colour vision requirements vary from country to country, even within the JAAmember states. The correlation between the outcomes of different tests is poor andtherefore it is not uncommon for pilot applicants to fail the colour vision assessmentin one country and to pass in another (Squire et al, 2005). This is not completelyunexpected given the large inter-subject variability, the different factors that cancontribute to loss of chromatic sensitivity and the different characteristics of thevarious colour vision tests. The lack of standardisation often causes confusionamongst applicants and provides the opportunity to attempt several tests in order topass one of the many colour vision standards.
1.5 A new approach based on recent advances in colour vision testing
Advances in the understanding of human colour vision (Barbur, 2003) and thedevelopment of novel methods to measure accurately the loss of chromaticsensitivity (Barbur et al, 1994) have prompted the UK CAA and the FAA of the USA tosponsor new studies to examine how colour vision loss can be measured accuratelyand also to establish minimum colour vision requirements for professional pilots. Aspart of the CAA funded study, the current accepted JAA colour vision requirementsfor professional flight crew have been reviewed and the variability associated with themost common occupational colour vision tests assessed, both in normal trichromatsand in subjects with red/green colour deficiency. The aim of the current project wasto establish minimum limits of colour vision sensitivity that can be considered to beoperationally “safe” within the aviation environment. This joint report follows otherCAA documents published in 2006 (CAA 2006/04): ‘Minimum Colour VisionRequirements for Professional Flight Crew’, Part I: The Use of Colour Signals and theAssessment of Colour Vision Requirements in Aviation and Part 2: Task Analysis.
1.6 A new colour vision test
Ideal colour vision assessment requires a test that (i) provides true isolation of coloursignals and quantifies the severity of colour vision loss, (ii) is based on data thatdescribe the statistical limits of colour discrimination in “normal” trichromats so as tobe able to differentiate minimal colour vision loss due to congenital and acquireddeficiencies from fluctuations expected within normal trichromats, (iii) has enoughsensitivity to detect “minimal” deficiencies and to classify accurately the class ofdeficiency involved, and (iv) can be used to detect and monitor “significant changes”in colour sensitivity over time. The Colour Assessment and Diagnosis (CAD) test hasbeen developed and improved over several years to fulfil these requirements (Section1.9 of this report).
1.7 Identification of the most safety-critical and demanding colour vision tasks
1.7.1 An important aspect of this study was to investigate whether subjects with minimalcolour vision loss were able to carry out the most demanding, safety-critical, colourrelated tasks with the same accuracy as normal trichromats. If the findings indicatethat “normal” colour vision is not required to carry out such tasks, it then becomesimportant to establish the limits of colour vision loss that can still be considered safewithin the aviation environment.
Page 3May 2009

CAA Paper 2009/04 Minimum Colour Vision Requirements for Professional Flight Crew
1.7.2 The approach adopted in this investigation was to relate the accurate assessment ofcolour vision loss to the subject’s ability to carry out the safety-critical, colour basedtasks within a specified environment when the use of other than colour cues wasminimised. A visual task analysis was carried out (CAA, 2006a) to identify andcharacterise the most important safety-critical, colour-related tasks for flight crew.The PAPI and the parking signal lights were found to be the most safety-critical,colour-related tasks when no redundant information is available to carry out the task.An earlier study by Cole and Maddocks (1995) has also identified the PAPI lights asthe most safety-critical, colour-related task. The PAPI lights provide the pilot withaccurate glide slope information on final approach to landing using four lights each ofwhich can be seen as either red or white. Two whites and two reds indicate correctapproach path, too many reds indicate that the approach height is too low and toomany whites indicate that the approach height is too high. The geometry of the PAPIsignal system is shown in Figure 1a (see also Figure 2a).
1.7.3 An alternative system i.e. the VASI (Visual Approach Slope Indicator) is sometimesused in North America and Australia. The VASI is more expensive and requires morespace. There are several versions of the VASI system, but the main task of the pilotremains the discrimination of horizontal bars of well defined red and white lights (seeFigure 1b). The more favourable geometry and the greater angular separation of the
The Precision Approach Path Indicator (PAPI) signal lights that are used to inform pilots of the correct glide path for landing. This is an efficient system since it consists only of four lights, each of ~ 8” diameters, spaced 9m apart. The angular subtense of the lights remains relatively unchanged beyond ~ 800m, but the retinal illuminance of the lights decreases. The output of the lamps can be adjusted using 6 preset lamp current settings. The disadvantage is that the correlated colour temperature of the lamp changes significantly and this affects mostly the colour of the “white” lights (see Section 2).
Figure 1a The Precision Approach Path Indicator (PAPI)
The Visual Approach Slope Indicator (VASI) and the more sophisticated T-VASI systems. The correct angle of approach is indicated as red over white. The T-VASI requires more space and is more expensive, but the use of colour provides only redundant information.
Figure 1b The Visual Approach Slope Indicator (VASI)
Too lowSlightly lowOn slopeSlightly highToo high
Too lowSlightly lowOn slopeSlightly highToo high
Too lowSlightly lowOn slopeSlightly highToo high
too high
too low
on slope
on slope
slightly high
very high
high
slightly low
well belowglide path
low
very low
VASI T-VASItoo high
too low
on slope
on slope
slightly high
very high
high
slightly low
well belowglide path
low
very low
on slope
slightly high
very high
high
slightly low
well belowglide path
low
very low
slightly low
well belowglide path
low
very low
VASI T-VASI
Page 4May 2009

CAA Paper 2009/04 Minimum Colour Vision Requirements for Professional Flight Crew
lights make the VASI colour discrimination task less demanding than the PAPI. In theT-VASI version of the system the changing geometry of the lights provides therequired approach slope information, hence the colour coding is used redundantly.The PAPI lights system is visually more demanding, the angular subtense of each ofthe four red / white lights corresponds to the smallest retinal image that can beproduced by the optics of the eye and the red / white colour coding is used non-redundantly. This project has therefore focused on the PAPI lights as the most safety-critical, colour-coded task for pilots.
Figure 2a Photograph of PAPI lights viewed from ground level. Photograph taken atSussex Flight Centre, Shoreham Airport (December 2006).
1.7.4 Other uses of signal lights within the aviation environment
There are many other colour signals that are used in the aviation environment toenhance conspicuity, code information and group objects of interest together. Thesesituations are less safety-critical, involve the use of larger stimuli under morefavourable conditions of light adaptation and the same information is also available insome other ways (e.g. text or audible signals). The PAPI signal system, on the otherhand, offers no redundancy – at night there is no other unique cue in addition to colourdiscrimination to help the pilot recognise the red and white light signals reliably inorder to determine visually whether the aircraft is on the correct approach path forlanding.
a) Parking Lights
Parking the aircraft requires the correct alignment of the aircraft with the line ofapproach. The pilot is aided in this task by the red-green parking lights. Both lightsare seen as green when the aircraft is positioned correctly for approach. A red-green combination (see photograph of parking lights in Figure 2b) signals that theaircraft has to veer slowly (towards the green light) to ensure that the pilot seestwo green lights.
Page 5May 2009

CAA Paper 2009/04 Minimum Colour Vision Requirements for Professional Flight Crew
This is a colour-related, safety-critical task simply because no other redundant cuesare available; however, the lights are bright, the colour difference between thelights is large and the lights subtend a large visual angle at the eye. Consequentlythe colour discrimination task is less demanding and it is therefore expected thatobservers with minimum colour vision deficiency may well be able to carry out thistask with the same accuracy as normal trichromats. This task was not investigatedin this study.
b) Runway and taxiway lights
The lighting of runways and taxiways involves the use of colour signals, but the useof colour for coding is often redundant. The correct information is also provided bythe geometry of the lights. Runway lighting is used for landing and take-off. Onapproach, the lighting of the runway provides essential information that yieldsoutline views of the geometry of the runway. On touch-down the lights formunique geometric lines and shapes that convey specific information. A particularrunway may have some or all of the following lights:
• Runway Edge Lights are white (or amber) and run the length of the runwayon each side.
• Runway Threshold Lights are green and indicate the starting point for theavailable landing distance.
• Runway End Lights are red and delineate the extremity of the runway that isavailable for manoeuvring.
• Runway Centre-line Lights start white, become red-white intermittent andthen red only, towards the end of available runway for take-off.
• Touchdown Zone Lights consist of rows of white light bars (with three ineach row) on either side of the centre-line over the first 914 m of the runway(or to the midpoint, whichever is less).
• Stopway Lights are four unidirectional red lights equally spaced across thewidth to mark the end of any stopway associated with a runway used atnight.
Photograph of the red and green parking lights that are used at airports to indicate to the pilot the correct line of approach for parking the aircraft at the stand. The pilot sees two green lights when the aircraft is positioned correctly for approach. A red-green combination (as shown in the photograph) signals that the aircraft has to veer slowly right (towards the green light) whereas a green on the left and a red on the right signals the need to veer slightly to the left (again towards the green light). This task description illustrates clearly that the pilot has to be able to discriminate between the red and green lights. The angular subtense of the parking lights is much larger than the PAPI and the retinal illuminance generated is also higher. This colour discrimination task is therefore likely to be less demanding.
Figure 2b Photograph of the red and green parking lights
Page 6May 2009

CAA Paper 2009/04 Minimum Colour Vision Requirements for Professional Flight Crew
Runway edge lights provide perspective cues on approach and are less demandingthan the PAPI light system; runway lighting becomes visible from several kms andoften aids the pilot’s visual search to locate the PAPI lights. The colour of therunway threshold lights is largely redundant because these green lights cannot beconfused with any other similar lights in terms of location, geometry and shape,but the green colour may well reinforce their function. Touchdown zone lighting isadded in order to improve texture and perspective and to give flight crew anindication of the area within which a landing must be initiated. The geometry andlocation of the runway end lights in relation to other lights is, again, sufficient toindicate their function. The colour of the runway centre-line lights changes from‘white’ on touch down to alternating ‘white-red’ lights and then finally to ‘red’ lightswhen the aircraft advances towards the end of the runway. The colour of the lightsindicates the position of the aircraft on the runway and this information is importantin some situations (e.g. when take-off has to be abandoned, especially inconditions of poor visibility). Runway signal lights tend to be larger and brighterthan PAPI lights and this makes the discrimination of colour differences lessdemanding. It has therefore been assumed that if the applicants can discriminatethe red and white PAPI lights from 5kms, they should also be able to discriminatewith no difficulty the red and white lights on the runway centre line.
For night operations, taxiways at most airports are equipped with lights that mayinclude some or all of the following:
• Taxiway Edge Lighting is blue to outline the edges of taxiways during periodsof darkness or restricted visibility.
• Taxiway Centre-line Lighting is green and provides centre-line guidance ontaxiways and aprons and when entering or vacating a runway.
• Stop-bar Lights are a single row of red, flush or semi-flush inset lightsinstalled laterally across the entire taxiway showing red towards theintended direction of approach. Following the traffic controller’s clearance toproceed, the stop-bar is turned off and the centre-line lead-on lights areturned on.
• Runway Guard Lights are either a pair of elevated flashing amber lightsinstalled on either side of the taxiway, or a row of in-pavement yellow lightsinstalled across the entire taxiway, at the runway holding position marking attaxiway / runway intersections.
Taxiway lights are seen from much shorter distances when the aircraft movesslowly on the ground. The discrimination by the pilot of the centre taxiway line asgreen and the edge as blue is not an essential requirement to carry out the tasksafely, but the use of appropriate colours may well emphasise the function of thelights. There is therefore little doubt that an acceptable level of colourdiscrimination is needed which can enhance the conspicuity of light signals, evenwhen colour is used redundantly and the tasks are less demanding or safetycritical. The stop-bar and runway guard lights both play an important role inpreventing runway incursions. In addition, the flashing aspect of the guard lightsadds conspicuity to these signals, but may also distract the pilot from interpretingother signals. The most common causes of runway incursions do not involve theincorrect interpretation of colour signals since colour is used redundantly and ittherefore simply adds to the conspicuity of the lights. Other factors such as lack ofcommunication between ATC and pilot, lack of familiarity with airport layout,tiredness, lack of attention and poor cockpit procedures for maintaining orientationin low visibility conditions (ICAO NAM / CAR / SAM Runway Safety/IncursionConference, Mexico City, October 2002) can all contribute to runway incursions.
Page 7May 2009
CAA Paper 2009/04 Minimum Colour Vision Requirements for Professional Flight Crew
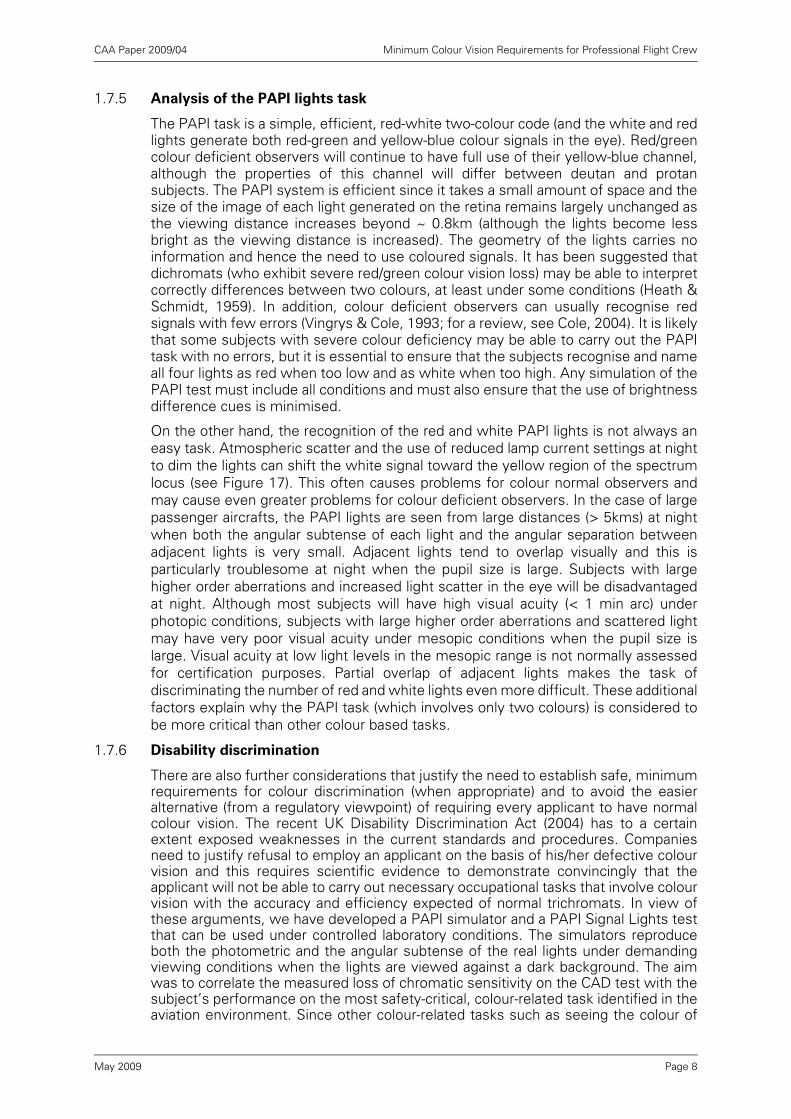
1.7.5 Analysis of the PAPI lights task
The PAPI task is a simple, efficient, red-white two-colour code (and the white and redlights generate both red-green and yellow-blue colour signals in the eye). Red/greencolour deficient observers will continue to have full use of their yellow-blue channel,although the properties of this channel will differ between deutan and protansubjects. The PAPI system is efficient since it takes a small amount of space and thesize of the image of each light generated on the retina remains largely unchanged asthe viewing distance increases beyond ~ 0.8km (although the lights become lessbright as the viewing distance is increased). The geometry of the lights carries noinformation and hence the need to use coloured signals. It has been suggested thatdichromats (who exhibit severe red/green colour vision loss) may be able to interpretcorrectly differences between two colours, at least under some conditions (Heath &Schmidt, 1959). In addition, colour deficient observers can usually recognise redsignals with few errors (Vingrys & Cole, 1993; for a review, see Cole, 2004). It is likelythat some subjects with severe colour deficiency may be able to carry out the PAPItask with no errors, but it is essential to ensure that the subjects recognise and nameall four lights as red when too low and as white when too high. Any simulation of thePAPI test must include all conditions and must also ensure that the use of brightnessdifference cues is minimised.
On the other hand, the recognition of the red and white PAPI lights is not always aneasy task. Atmospheric scatter and the use of reduced lamp current settings at nightto dim the lights can shift the white signal toward the yellow region of the spectrumlocus (see Figure 17). This often causes problems for colour normal observers andmay cause even greater problems for colour deficient observers. In the case of largepassenger aircrafts, the PAPI lights are seen from large distances (> 5kms) at nightwhen both the angular subtense of each light and the angular separation betweenadjacent lights is very small. Adjacent lights tend to overlap visually and this isparticularly troublesome at night when the pupil size is large. Subjects with largehigher order aberrations and increased light scatter in the eye will be disadvantagedat night. Although most subjects will have high visual acuity (< 1 min arc) underphotopic conditions, subjects with large higher order aberrations and scattered lightmay have very poor visual acuity under mesopic conditions when the pupil size islarge. Visual acuity at low light levels in the mesopic range is not normally assessedfor certification purposes. Partial overlap of adjacent lights makes the task ofdiscriminating the number of red and white lights even more difficult. These additionalfactors explain why the PAPI task (which involves only two colours) is considered tobe more critical than other colour based tasks.
1.7.6 Disability discrimination
There are also further considerations that justify the need to establish safe, minimumrequirements for colour discrimination (when appropriate) and to avoid the easieralternative (from a regulatory viewpoint) of requiring every applicant to have normalcolour vision. The recent UK Disability Discrimination Act (2004) has to a certainextent exposed weaknesses in the current standards and procedures. Companiesneed to justify refusal to employ an applicant on the basis of his/her defective colourvision and this requires scientific evidence to demonstrate convincingly that theapplicant will not be able to carry out necessary occupational tasks that involve colourvision with the accuracy and efficiency expected of normal trichromats. In view ofthese arguments, we have developed a PAPI simulator and a PAPI Signal Lights testthat can be used under controlled laboratory conditions. The simulators reproduceboth the photometric and the angular subtense of the real lights under demandingviewing conditions when the lights are viewed against a dark background. The aimwas to correlate the measured loss of chromatic sensitivity on the CAD test with thesubject’s performance on the most safety-critical, colour-related task identified in theaviation environment. Since other colour-related tasks such as seeing the colour of
Page 8May 2009

CAA Paper 2009/04 Minimum Colour Vision Requirements for Professional Flight Crew
the parking lights or the discrimination of runway, centre-line, red and white lights areless demanding, it is assumed that the pilot will also be able to perform correctlythese tasks. In principle, this approach should make it possible to recommend pass/fail limits based on the observer’s ability to carry out the most safety-critical anddemanding PAPI task.
1.8 Brief description of the most common occupational colour vision tests
For a full description of colour vision tests used in aviation please refer to CAA Paper2006/04 (2006a) and for a list of tests accepted by the FAA see the FAA guide forAviation Medical Examiners (2008). The following colour vision tests will be describedhere since they have been used along with the CAD test in this study. These are theIshihara and Dvorine pseudoisochromatic plate tests, Nagel Anomaloscope and theAviation Lights Test (ALT). Measures of colour discrimination performance computedfrom the results of these tests will be examined and compared with the subject’sscores on the PAPI simulator. The same PAPI simulator was also used to produce amore demanding signal lights test that required the subject to name one of sixdifferent coloured lights, as described in Section 2 of this report. The latter will bereferred to as the PSL (PAPI Signal Lights) test.
1.8.1 Ishihara plate test
1.8.1.1 The Ishihara pseudoisochromatic plate test consists of a series of numbers outlinedby different coloured dots as shown in Figure 3. This is the most widely acceptedscreening test for red/green colour deficiency and uses camouflage to exploit thecolour confusions of colour deficient observers (Sloan & Habel, 1956; Belcher et al,1958; Frey, 1958; Birch, 1997). The Ishihara test consists of single or double-digitnumbers that have to be identified verbally and pathways for tracing for those whocannot read numbers. The 24-plate test version consists of the following: plate 1 fordemonstration of visual task, plates 2-15 for screening, plates 16-17 for protan/deutanclassification. The Ishihara test employs a range of designs, such as transformation,vanishing or hidden digit. In the vanishing type plate (Figure 3, middle) a figure is seenby colour normals, but not by colour deficients; the reverse of this, the hidden figuredesign, is harder to design and not always so effective. More complex patterns arecontained in transformation plates (Figure 3, left), with careful placement of the colourdots giving an apparent transformation of the perceived figure; normal trichromatssee one figure and colour deficient people see a different figure in the same design.Positive evidence of colour deficiency is given by transformation designs whereasvanishing designs give negative evidence. In the classification plate design (Figure 3,right), protans only see the number on the right side of each plate and deutans onlysee the number on the left.
1.8.1.2 The test is limited to red/green deficiency and cannot be used to assess loss ofyellow-blue sensitivity.
Figure 3 Ishihara pseudoisochromatic plates; left, transformation design; middle,vanishing design; right, protan/deutan classification plate. Please notethat these may not be reproduced accurately here as the printed colourand the viewing illuminant will be different.
Page 9May 2009

CAA Paper 2009/04 Minimum Colour Vision Requirements for Professional Flight Crew
1.8.1.3 The test is viewed at about two-thirds of one metre (arm’s length) distance using aMacBeth easel lamp for illumination. The first 25 plates of the 38-plate test versionwere used in this investigation. The book is placed in the tray beneath the lamp andthe illumination, equivalent to CIE Standard Illuminant C (representing averagedaylight), is incident at an angle of 45° to the plate surface. The illuminant used isimportant because the selected reflectances of the patches on the plates have beenchosen with reference to this illuminant. The examiner instructs the person beingtested to report the number they can see as the pages are turned, and warns thesubject that on some occasions they may not see a number. The first introductoryplate is used to demonstrate the visual task. This plate is designed so that anyone,including colour deficient subjects should see this number. With a viewing time ofabout 4 seconds allowed for each plate, undue hesitation on the part of the subject isthe first indication of colour deficiency.
1.8.2 Dvorine plate test
1.8.2.1 The Dvorine test is based on pseudoisochromatic principles and is similar to theIshihara test. It has 15 numeral plates, consisting of 1 initial plate that demonstratesthe visual task, 12 plates for screening and 2 plates for protan/deutan classification(see Figure 4). These plates are of the vanishing type. The font of the numerals isslightly different to the Ishihara plates and is believed to be easier to read.
1.8.2.2 The Dvorine test is administered in a similar manner to the Ishihara test. The platesare positioned at arm’s length, perpendicular to the line of sight, under daylightillumination or a Macbeth easel lamp. The subject is instructed to read the numerals(all plates have a numeral)
.
Figure 4 Dvorine pseudoisochromatic plates; left and right, vanishing design;middle, protan/deutan classification plate. Please note that the colour ofthe plates may not be reproduced accurately in this document or in printsince the printed reflectances and the viewing illuminant will be different.
1.8.2.3 Pseudoisochromatic plate tests provide a simple, readily available, inexpensive andeasy to administer screener mostly for red/green deficiencies. However, plate teststend to be relatively easy to learn, and this encourages cheating. The spectral qualityof the light source illuminating the plates is also important. Plates may be degradedby fingerprints, dust and excessive light exposure. In general, subjects with minimalcolour vision loss tend to show greater variability on repeated tests by comparisonwith normal trichromats and on some occasions can even pass these tests (Squire etal, 2005).
Page 10May 2009

CAA Paper 2009/04 Minimum Colour Vision Requirements for Professional Flight Crew
1.8.3 Nagel Anomaloscope
1.8.3.1 The Nagel anomaloscope (Figure 5) is based on colour matching and is the standardclinical reference test for identifying and diagnosing red/green colour deficiencyrecommended by the National Research Council - National Academy of Sciences(NRC-NAS) Committee on Vision (1981). This instrument produces a disc stimulus thatconsists of two half fields and is viewed in an optical system. The top half of this discis illuminated by a mixture of spectrally narrow red and green wavelengths, and thelower half is illuminated by spectrally narrow yellow light. Two control knobs are used,one to alter the red-green colour mixture ratio of the top field, and the other to alterthe luminance of the yellow lower field (see Figure 5). The test is administered in twostages. Usually only one eye (i.e. the dominant eye) is fully tested and the other eyeis then checked to ensure the same deficiency. This confirms that the loss of colourvision is congenital. Following familiarisation with the instrument controls, the subjectis then asked to alter both the control knobs until the two halves of the circle matchcompletely in both colour and brightness. The subject is not asked to name thecolours. A few matches are made, with the examiner "spoiling" the match after eachsetting. About ten seconds are allowed for each match and then, to minimize theeffect of chromatic after images, the subject looks away from the instrument into thedimly lit room for a few seconds before the procedure is repeated. The second stageof the test is to determine the limits of the matching range. The initial matches madeby the subject are used as a guide by the examiner to set the red/green mixture rationear to the estimated limits of the range. The subject has to just alter the luminanceof the lower yellow half of the field and see if an exact 'match' in both colour andbrightness can be made with the set red/green mixture in the upper half. The ratio ofthe red/green mixture field is altered systematically by the examiner until the limits ofthe matching range are found. The matching range is recorded from the matchinglimits on the red/green mixture scale and the midpoint calculated.
Figure 5 Photograph of the Nagel anomaloscope (Model I, Schmidt and Haensch,Germany) and illustration of the Nagel anomaloscope split field. Thepercentage mixture of red to green in the top half and the luminance ofthe yellow bottom field can be changed until a match of the two fields canbe perceived.
1.8.3.2 Ideally, the red/green 'match' parameters should provide enough information todetermine whether a person has normal or defective red/green colour vision; whethercolour deficiency is deutan or protan; and, whether the subject is a dichromat(absence of a cone-type) or anomalous trichromat (anomalous cone-type). The size ofthe red-green matching range is often taken as an indicator of chromatic sensitivityloss. The red-green discrimination index (RGI), a parameter relating to the matchingrange, has been introduced in this study and provides an indication of the subject’sability to discriminate red-green colour differences:
, where rsubject is the subject’s mean matching range.
The RGI ranges from a value very close to 1 for normal sensitivity, to 0 for a dichromatthat accepts any red/green mixture setting as a match to the yellow field.
Red670 nm
Green546 nm
Yellow589 nm 2 degrees
− subjectrRGI=1
74
Page 11May 2009

CAA Paper 2009/04 Minimum Colour Vision Requirements for Professional Flight Crew
1.8.3.3 A more appropriate measure of red/green sensitivity based on the Nagel is obtainedsimply by dividing the mean normal matching range (rmean) obtained by averagingresults for a large number of normal trichromats by the subject’s range (rsubject). Themean normal matching range for the Nagel anomaloscope used in this study isapproximately 4 scale units. Hence the new measure of chromatic sensitivitybecomes:
Nagel sensitivity =
1.8.3.4 A scatter plot of Nagel midpoints on the red-green scale versus RGI allows one toseparate a clear cluster of subjects, with midpoints between 36 and 44 units, on thered/green mixture scale, that are likely to be normal trichromats (see Figure 6).Dichromats will accept the full range of red/green mixtures as a match with the yellowfield (i.e. RGI=0), as they have only one photopigment in the spectral range providedby the instrument. Deuteranopes are distinguished from protanopes as the intensityof the yellow they set for both ends of the red/green scale is fairly similar whereasprotanopes set the luminance of the yellow very low to make a match at the red endof the scale and much higher at the green end. This is because protans tend to seered as fairly dark as they have reduced long wavelength sensitivity. If a colour matchwithin the normal range is not achieved, the subject is classed as an anomaloustrichromat. Two separate distributions are formed either side of the normal range asprotanomalous trichromats require significantly more red light in their colour mixtureand deuteranomalous trichromats require more green (see Figure 6). The RGI ormatching range provides some measure of the severity of the colour discriminationdeficit on the Nagel anomaloscope, although it is well known that the correlationbetween the size of the matching range and the subject’s ability to discriminatecolours under more natural conditions is generally poor (Wright, 1946).
1.8.3.5 The principal advantage of the anomaloscope is that unlike the previous tests, theparameters of the yellow match can be used to classify accurately the type of colourdeficiency involved.
mean
subject
rr
Page 12May 2009

CAA Paper 2009/04 Minimum Colour Vision Requirements for Professional Flight Crew
Figure 6 Scatter plot of matching midpoints versus RGI for 231 observers; 70subjects formed a cluster that is separated from all other subjects byhaving a midpoint around 40 and a high RGI. The abbreviations in thelegend refer to deuteranomalous (DA), protanomalous (PA), and normaltrichromat (N) subjects. The value of the luminance setting on the yellowscale provides additional information to separate deutan and protan colourdeficient observers. The data show clearly that according to the Nageltest, many deutan and protan subjects have RG chromatic sensitivity thatis indistinguishable from the range of values measured in normaltrichromats.
1.8.4 Aviation Lights Test (ALT)
1.8.4.1 The Aviation Lights Test is a modified Farnsworth Lantern (Milburn & Mertens, 2004)to meet the FAA’s signal colour (USDOT-FAA, 1988) and International Civil AviationOrganization (ICAO, 1988) specifications for the red, green, and white signal lightcolours on aircraft. The chromaticity coordinates of the ALT are shown plotted inFigure 11. Originally the test was employed for secondary screening of air trafficcontrol specialist applicants.
1.8.4.2 Nine vertically separated pairs of coloured lights (see Figure 7) are presented to theexaminee, who is seated 8 ft (~ 2.4m) away from the lantern. The constant verticalseparation of the 2 apertures is 13mm, or 18.3 minutes of arc at the recommendedviewing distance. Each pair of lights subtends a visual angle of 3 min arc. There arethree colours: red, green and white. Each series of nine pairs was presented threetimes in random order making a total of 27 presentations.
0 10 20 30 40 50 60 70Nagel Midpoint on RG scale
0
0.1
0.2
0.3
0.4
0.5
0.6
0.7
0.8
0.9
1
DAPANDichromat
RG
DichromatsRGI=0
ExtremeAnomaloustrichromat
Minimalanomaloustrichromat
RG
I
0 10 20 30 40 50 60 70Nagel Midpoint on RG scale
0
0.1
0.2
0.3
0.4
0.5
0.6
0.7
0.8
0.9
1
DAPANDichromat
RG
DichromatsRGI=0
ExtremeAnomaloustrichromat
Minimalanomaloustrichromat
RG
I
Page 13May 2009

CAA Paper 2009/04 Minimum Colour Vision Requirements for Professional Flight Crew
(b) (a)
Figure 7 (a) Schematic representation of the different pairs of lights presented inthe Aviation Lights Test (ALT). The lantern can show 9 differentcombinations (as shown) three times giving a total of 27 presentations, (b)Photograph of the ALT lantern.
1.8.4.3 Before the ALT test is carried out the subject is shown each of the three test lightcolours. Light pairs numbered 1 and 2 are shown (see Figure 7a) while saying: “thisis green over red” and “this is white over green,” respectively. The examinee has toname correctly the colours of the lights shown (with a pass criterion of not more thanone error) in all 27 presentations. If the colour of either or both lights in a pair wasidentified incorrectly, this was counted as one error.
1.8.4.4 The ALT is administered in a very dim room that approximates the light level of the airtraffic control (ATC) tower cab at night.
1.9 The CAD test
The Colour Assessment and Diagnosis (CAD) test has been described in an earlierCAA report (CAA, 2006a). The CAD test is implemented on a calibrated visual displayand consists of coloured stimuli of precise chromaticity and saturation that arepresented moving along each of the diagonal directions of a square foreground regionmade up of dynamic luminance contrast (LC) noise. The subject’s task is to report thedirection of motion of the colour-defined stimulus by pressing one of four appropriatebuttons. Randomly interleaved staircase procedures are used to adjust the strengthof the colour signals involved according to the subject’s responses in order todetermine the thresholds for colour detection in each direction of interest so as toestablish reliable estimates of red-green and yellow-blue colour thresholds. The CADtest has a number of advantages over conventional tests both in terms of isolation ofcolour signals as well as sensitivity and accuracy:
a) Isolation of colour signals
It is very important to isolate the use of colour signals by masking any luminancecontrast cues. Although the coloured stimuli generated are isoluminant for thestandard CIE observer, the large variation in L:M spatial density ratio within normaltrichromats (i.e. 0.6 to 13; Carroll et al, 2002) and the variation in cone spectralresponsivity functions in colour deficient observers introduce variations in theperceived luminance contrast of most coloured stimuli. This is simply because theresulting luminance efficiency function V(λ) is likely to vary both amongst normaltrichromats and within colour deficient observers. The CAD test employs dynamicLC noise and this masks effectively the detection of any residual luminancecontrast signals that may be present in the coloured test target. The meanluminance of the foreground remains unchanged, both spatially as well as in time,and equal to that of the surround background field. The technique isolates the use
1 2 3 4 5 6 7 8 9G/R W/G G/W G/G R/G W/R W/W R/W R/R
( ) S f ff f
Page 14May 2009

CAA Paper 2009/04 Minimum Colour Vision Requirements for Professional Flight Crew
of colour signals and ensures that the subject cannot make use of any residual LCsignals. The dynamic LC noise does not affect the threshold for detection of coloursignals, but masks very effectively the detection of luminance contrast signals(Barbur et al, 1994; Barbur, 2004).
b) Measurement of chromatic detection thresholds
An efficient, four-alternative, forced-choice procedure is used to measure subject’schromatic detection thresholds in a number of carefully selected directions in theCIE – (x,y) chromaticity chart. Thresholds are measured along 16 interleaveddirections in colour space. These are grouped together so as to test red-green (RG)and yellow-blue (YB) colour sensitivity. Threshold ellipses are computed andplotted using the standard CIE 1931 chromaticity chart. The use of 16, randomlyinterleaved colour directions makes the technique statistically robust andeliminates any other possible cues, so that the subject has to rely entirely on theuse of colour signals. The output of the CAD test also diagnoses accurately theclass of colour deficiency involved. If the latter is not needed, one only needs totest two colour directions to screen for red/green colour deficiency.
c) The statistical limits of chromatic sensitivity within “normal” trichromats
Chromatic discrimination thresholds have been measured in over 450 observers,including 250 normal trichromats and 200 colour defective observers (Figure 12).Figure 8 shows the distribution of YB and RG chromatic thresholds obtained in the250 normal trichromatic subjects. Figure 9 shows the statistical limits for the‘standard normal’ (SN) observer on the CAD test plotted in the 1931 CIE-x,y colourchart (Rodriguez-Carmona et al, 2005; Rodriguez-Carmona, 2006). The variability inboth RG and YB thresholds is shown by the grey shaded ellipse, which representsthe region of the CIE chart where we expect to find 95% of normal trichromats.The 2.5% and 97.5% limits define the boundaries of this region. The medianchromatic discrimination threshold ellipse is also plotted. The median thresholdvalue is important since it represents the Standard Normal (SN) observer. Asubject’s thresholds can then be expressed in SN units and this makes it possibleto assess the severity of colour vision loss, i.e. an observer with a RG threshold of2 SN units requires twice the colour signal strength that is needed by the averagestandard CAD observer. Figure 9 is an extremely useful representation in that itprovides a CAD test template for the SN observer. Any subject’s results provideinstant diagnosis of either normal or deficient colour vision when plotted on thistemplate.
Figure 8 Frequency distributions of the YB and RG chromatic thresholds obtainedin 250 observers with ‘normal’ trichromatic vision. The mean, standarddeviation (SD) and median are shown
0 5 10 15 20YB CAD thresholds
0
10
20
30
40
50
No.
ofob
serv
ers
Mean = 11.4SD = 2.67Median = 11.1
2 3 4 5 6 7RG CAD thresholds
0
10
20
30
No.
ofob
serv
ers
Mean = 4.50SD = 0.78Median = 4.37
0 5 10 15 20YB CAD thresholds
0
10
20
30
40
50
No.
ofob
serv
ers
Mean = 11.4SD = 2.67Median = 11.1
2 3 4 5 6 7RG CAD thresholds
0
10
20
30
No.
ofob
serv
ers
Mean = 4.50SD = 0.78Median = 4.37
Page 15May 2009

CAA Paper 2009/04 Minimum Colour Vision Requirements for Professional Flight Crew
Figure 9 Data showing the 97.5 and 2.5% statistical limits that define the“standard” normal CAD test observer. The dotted, black ellipse is basedon the median RG and YB thresholds measured in 250 observers. Thegrey shaded area shows the limits of variability of 95% of theseobservers. The deuteranopic, protanopic and tritanopic confusion bandsare displayed in green, red and blue, respectively. The backgroundchromaticity (x,y) is indicated by the black cross (0.305, 0.323). Thecoloured symbols show data measured for a typical normal trichromat.
d) Detection of colour vision loss that falls outside normal range
The distribution of thresholds along the directions examined provides enoughinformation to classify even minimal deficiencies that would otherwise remainundetected using conventional colour vision tests. For example, Figure 10 showsresults of two minimal colour vision deficient observers that fall just outside thenormal range indicated by the shaded grey area. The subject on the left (subjectCC) has a Nagel range of 16-18 and passes the Ishihara, whereas the subject onthe right (subject SH) has a Nagel range of 40-42 units but fails the Ishihara with 2errors. Although both subjects are classified as minimum deuteranomalous on theCAD test, their classification on the other two tests is less clear. The first subjectis classified as normal on Ishihara and deuteranomalous on the Nagel (but with amixture range that is smaller than the average normal trichromat). The secondsubject is classified as normal on the Nagel, but slightly red/green deficient on theIshihara.
0.28 0.29 0.3 0.31 0.32 0.33x
0.3
0.31
0.32
0.33
0.34
0.35
y
DeuteranopeProtanopeTritanope2.5% < P < 97.5%"Standard Observer"Normal trichromat
CIE - (x, y)
Page 16May 2009

CAA Paper 2009/04 Minimum Colour Vision Requirements for Professional Flight Crew
Figure 10 Chromatic thresholds for two colour vision deficient observers withminimal colour vision deficiency. The data for the average normaltrichromat is shown as a black contour.
e) Diagnosis of the type of deficiency involved
The CAD test identifies the type of deficiency involved by the elongation of thesubject’s results either along the deuteranopic (Figure 11, left) or protanopic(Figure 11, right) confusion bands. In the case of absolute minimumdeuteranomalous deficiencies the distribution of the thresholds is as shown inFigure 10. In the case of minimum protanomalous deficiencies the thresholds aremuch larger and extend sufficiently along in the protanopic direction indicating adiagnosis of minimum protanomaly with no ambiguity. The agreement with theNagel for screening and classification of the class of congenital red/greendeficiency is ~99%.
0.28 0.29 0.3 0.31 0.32 0.33
x
0.3
0.31
0.32
0.33
0.34
0.35
y
DeuteranopeProtanopeTritanope2.5% < P < 97.5%"Standard Observer"subject's data
CC0.28 0.29 0.3 0.31 0.32 0.33
x
0.3
0.31
0.32
0.33
0.34
0.35
y
SH0.28 0.29 0.3 0.31 0.32 0.33
x
0.3
0.31
0.32
0.33
0.34
0.35
y
DeuteranopeProtanopeTritanope2.5% < P < 97.5%"Standard Observer"subject's data
CC0.28 0.29 0.3 0.31 0.32 0.33
x
0.3
0.31
0.32
0.33
0.34
0.35
y
SH
Page 17May 2009

CAA Paper 2009/04 Minimum Colour Vision Requirements for Professional Flight Crew
Figure 11 Chromatic thresholds for two colour vision deficient observers withsevere colour vision deficiency. The largest chromatic displacementsaway from background chromaticity, as set by the isoluminant conditionand the limits imposed by the phosphors of the display, are shown as greylines. The extent of colour vision loss is related to the elongation along theprotanopic or the deuteranopic confusion band and suggests that thegreater the elongation, the lower the level of chromatic sensitivity.
f) Quantifying the severity of colour vision loss
The severity of red-green and yellow-blue loss of colour vision is proportional to thecolour signal strength needed for threshold detection. For example, subjects inFigure 11 show more severe loss (i.e. higher thresholds or lower chromaticsensitivity) than the subjects shown in Figure 10. The severity of colour vision losscan be quantified with respect to the standard normal observer (Figures 8 and 9).Chromatic sensitivity varies greatly within colour deficient observers fromcomplete absence of red-green discrimination, in the case of dichromats, to almostnormal sensitivity in subjects with thresholds not much larger than 2 SN units.Figure 12 shows the subject’s RG threshold in SN CAD units along the abscissa,plotted against the YB threshold along the ordinate in 450 observers. The resultsshow that the RG thresholds vary almost continuously from very close to ‘normal’to extreme values which can be 25 times larger than the standard normalthreshold. The YB thresholds, on the other hand, vary very little as expected in theabsence of yellow-blue loss or acquired deficiency. Interestingly, the RGthresholds show some correlation with YB thresholds in normal trichromats,suggesting that subjects with high RG chromatic sensitivity are also likely to exhibithigh YB sensitivity. The loss of sensitivity (when expressed in Standard Normal(CAD) units (SN units) is greater in protanomalous than deuteranomalousobservers (Figure 12)
0.19 0.23 0.27 0.31 0.35 0.39x
0.21
0.25
0.29
0.33
0.37
0.41
y
ProtanopeTritanopeDeutanope2.5% < P < 97.5%"Standard Observer"subject's data
0.19 0.23 0.27 0.31 0.35 0.39x
0.21
0.25
0.29
0.33
0.37
0.41
y
0.19 0.23 0.27 0.31 0.35 0.39x
0.21
0.25
0.29
0.33
0.37
0.41
y
ProtanopeTritanopeDeutanope2.5% < P < 97.5%"Standard Observer"subject's data
0.19 0.23 0.27 0.31 0.35 0.39x
0.21
0.25
0.29
0.33
0.37
0.41
y
Page 18May 2009

CAA Paper 2009/04 Minimum Colour Vision Requirements for Professional Flight Crew
.
Figure 12 Graph showing Red-Green (RG) and Yellow-Blue (YB) thresholdsexpressed in CAD Standard Normal units for the population of subjectstested as part of this study. The spread of the data along the abscissaillustrates the large variation that exists amongst subjects with deutan-and protan-like deficiencies.
g) Effects of light level and stimulus size
Both the ambient light adaptation level and the size of the coloured stimulus canaffect chromatic sensitivity. In general, as the light level is reduced and / or thestimulus size is decreased the RG and YB thresholds increase. The YB thresholdsare affected most at lower light levels. Both background luminance and stimulussize have been optimised for the CAD test so that no significant improvement inchromatic sensitivity results by increasing either the light level or stimulus size.Any small variations in either light level or stimulus size will not therefore altersignificantly the subject’s RG and YB thresholds (Barbur et al, 2006). However,older subjects are likely to show more rapid effects as the light level is reducedsimply because the retinal illuminance in these subjects is already low as a resultof small pupil sizes and increased pre-receptoral absorption of blue light.
h) The effects of aging on red-green and yellow-blue loss of chromatic
sensitivity
The effect of aging for YB and RG chromatic thresholds in normal trichromats isshown in Figure 13. These results show that up to the age of 60 years there is littlecorrelation between the subject’s age and chromatic sensitivity. A small effect canbe observed when examining YB thresholds (but the correlation with age remainsvery poor) and virtually absent in the case of RG thresholds. The age rangeexamined is representative of the typical working life of pilots. Colour vision isusually assessed in demanding occupational environments. Loss of colour visionlater in life is described as acquired colour deficiency and can be caused by anumber of factors including both systemic diseases and specific diseases of theeye (such as diabetes, glaucoma, age-related macular degeneration, etc.). Sinceloss of chromatic sensitivity usually precedes the reliable detection of anystructural changes using fundus imaging, regular screening for acquired colourvision loss may be of great clinical value. In view of these findings, it makes senseto recommend that in addition to assessing colour vision at the start of the workingcareer, periodic re-assessments should also be done, simply as a way of testingfor acquired deficiencies.
0 5 10 15 20 25RG threshold units
0
1
2
3
4
5
YBth
resh
old
units
Type of colour vision:NormalsDeutansProtans
0 1 2 30
1
2
3
0 5 10 15 20 25RG threshold units
0
1
2
3
4
5
YBth
resh
old
units
Type of colour vision:NormalsDeutansProtans
0 1 2 30
1
2
3
Page 19May 2009

CAA Paper 2009/04 Minimum Colour Vision Requirements for Professional Flight Crew
Figure 13 Effect of age on the YB and RG chromatic thresholds for normaltrichromats under normal daylight conditions. The best-fit line is shownfor both sets of data. The correlation coefficients (r2) for the YB and RGthresholds are 0.06 and 0.005, respectively.
1.10 Summary of congenital colour vision deficiencies
1.10.1 Congenital colour vision deficiencies remain unchanged throughout life and arelargely determined by changes in the spectral responsivity of cone photoreceptorsthat are determined genetically. There are a number of other factors that can affectchromatic sensitivity, such as the optical density of photoreceptors, post-receptoralamplification of cone signals or pre-receptoral filters that are spectrally selective andreduce the amount of light that reaches the cone photoreceptors in the eye (Alpern &Pugh, Jr., 1977; Alpern, 1979; Neitz & Jacobs, 1986; Barbur, 2003). These factors areall likely to contribute to the variability measured both within normal and colourdeficient observers.
1.10.2 Congenital yellow/blue colour vision deficiency is very rare (with an incidence of 1 in13000 to 65000; Sharpe et al, 1999) and usually implies the absence of S-cones. Lossof YB sensitivity with age, on the other hand, is very common and is often associatedwith toxicity or disease (see below).
1.11 Acquired colour vision deficiencies
Acquired deficiencies tend to affect both RG and YB colour discrimination, althoughfrequently the YB loss is greater and more apparent. Acquired colour deficiencies aremost commonly caused by systemic (e.g. diabetes, multiple sclerosis) and otherdiseases that are specific to the eye (e.g. glaucoma, age-related maculardegeneration, optic neuritis, etc.). Acquired deficiency affects predominantly oldersubjects. Acquired loss can sometimes be expressed in subjects with congenitalcolour deficiencies. If congenital colour deficiency is present, the identification ofacquired colour deficiency and the classification of the congenital component aremore difficult. In such cases, the use of larger stimuli and dynamic luminance contrastnoise that achieves a high level of luminance contrast masking with saturated colourscan reveal both the type of congenital deficiency and the acquired loss of chromatic
10 20 30 40 50 60
Age (years)
0
1
2
3
4
RG
thre
shol
ds
RG threshold (r^2=0.005)
1
2
3
4
YBth
resh
olds
YB threshold (r^2=0.06)
Page 20May 2009

CAA Paper 2009/04 Minimum Colour Vision Requirements for Professional Flight Crew
sensitivity (Barbur et al, 1997). There are other differences as well. Acquired loss ofcolour sensitivity is generally non-uniform over the retina in the same eye and oftenaffects one eye more severely than the other. One can also separate the congenitaland the acquired loss by carrying out the CAD test in each eye both at the fovea andin the near periphery of the visual field or / and by using more than one stimulus size.The congenital component remains largely unchanged, whereas the acquiredcomponent varies with stimulus size, retinal location and eye tested. Since theyellow-blue sensitivity is most affected, the CAD is particularly suitable forinvestigating acquired deficiency since it tests for both red-green and yellow-blueloss.
Figure 14 below shows examples of acquired colour vision deficiencies.
Figure 14 Examples of subjects with acquired loss of chromatic sensitivity. The datashown on the top left graph is from a subject with diabetes; top rightshows data from the left eye from a subject with Age Related MacularDegeneration (ARMD); and bottom graph shows data from a subject withboth congenital and acquired colour vision loss (note the differencebetween the two eyes).
0.26 0.28 0.3 0.32 0.34 0.36x
0.28
0.3
0.32
0.34
0.36
0.38
y
Diabetic subjectBL (binocular)
0.26 0.28 0.3 0.32 0.34 0.36x
0.28
0.3
0.32
0.34
0.36
0.38
y
ARMD subjectJW (left eye)
0.26 0.28 0.3 0.32 0.34 0.36x
0.28
0.3
0.32
0.34
0.36
0.38
y
Diabetic subjectBL (binocular)
0.26 0.28 0.3 0.32 0.34 0.36x
0.28
0.3
0.32
0.34
0.36
0.38
y
ARMD subjectJW (left eye)
0.15 0.2 0.25 0.3 0.35 0.4 0.45 0.5x
0.18
0.23
0.28
0.33
0.38
0.43
0.48
0.53
y
CG (Acquired + Congenital)Right eye Left eye
Page 21May 2009
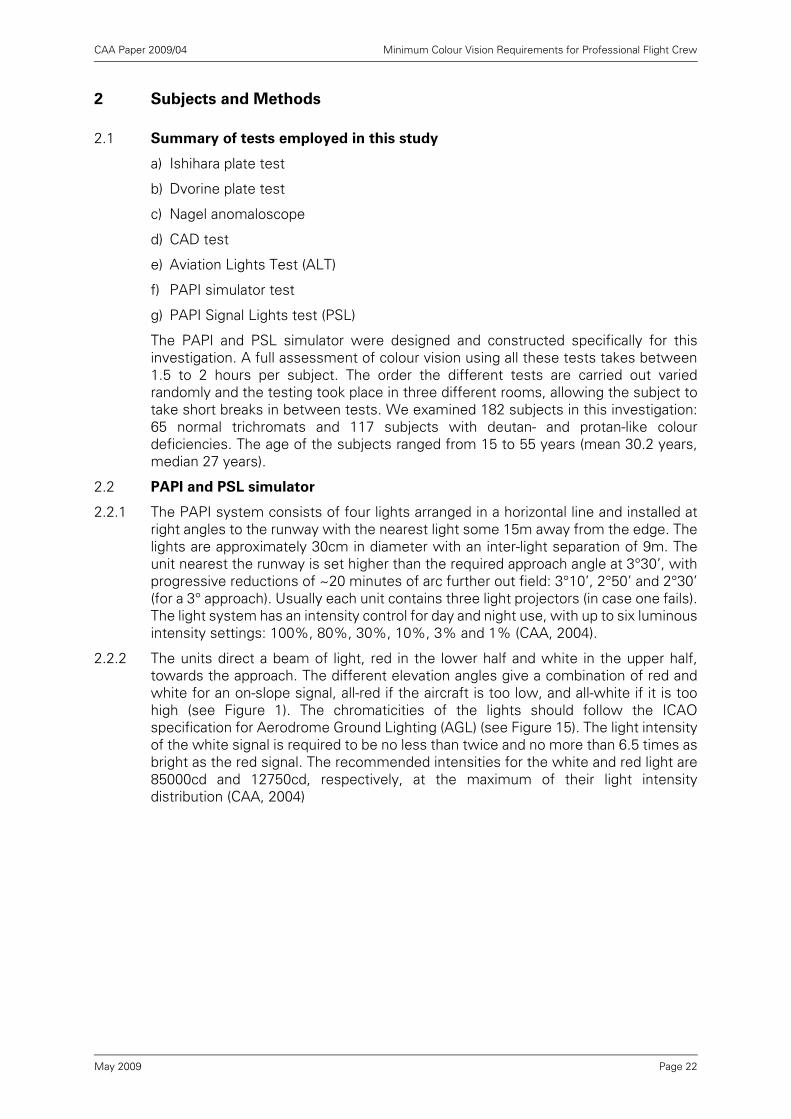
CAA Paper 2009/04 Minimum Colour Vision Requirements for Professional Flight Crew
2 Subjects and Methods
2.1 Summary of tests employed in this study
a) Ishihara plate test
b) Dvorine plate test
c) Nagel anomaloscope
d) CAD test
e) Aviation Lights Test (ALT)
f) PAPI simulator test
g) PAPI Signal Lights test (PSL)
The PAPI and PSL simulator were designed and constructed specifically for thisinvestigation. A full assessment of colour vision using all these tests takes between1.5 to 2 hours per subject. The order the different tests are carried out variedrandomly and the testing took place in three different rooms, allowing the subject totake short breaks in between tests. We examined 182 subjects in this investigation:65 normal trichromats and 117 subjects with deutan- and protan-like colourdeficiencies. The age of the subjects ranged from 15 to 55 years (mean 30.2 years,median 27 years).
2.2 PAPI and PSL simulator
2.2.1 The PAPI system consists of four lights arranged in a horizontal line and installed atright angles to the runway with the nearest light some 15m away from the edge. Thelights are approximately 30cm in diameter with an inter-light separation of 9m. Theunit nearest the runway is set higher than the required approach angle at 3°30’, withprogressive reductions of ~20 minutes of arc further out field: 3°10’, 2°50’ and 2°30’(for a 3° approach). Usually each unit contains three light projectors (in case one fails).The light system has an intensity control for day and night use, with up to six luminousintensity settings: 100%, 80%, 30%, 10%, 3% and 1% (CAA, 2004).
2.2.2 The units direct a beam of light, red in the lower half and white in the upper half,towards the approach. The different elevation angles give a combination of red andwhite for an on-slope signal, all-red if the aircraft is too low, and all-white if it is toohigh (see Figure 1). The chromaticities of the lights should follow the ICAOspecification for Aerodrome Ground Lighting (AGL) (see Figure 15). The light intensityof the white signal is required to be no less than twice and no more than 6.5 times asbright as the red signal. The recommended intensities for the white and red light are85000cd and 12750cd, respectively, at the maximum of their light intensitydistribution (CAA, 2004)
Page 22May 2009

CAA Paper 2009/04 Minimum Colour Vision Requirements for Professional Flight Crew
.
Figure 15 1931 CIE-x,y colour space diagram showing the recommendedchromaticity boundaries for the colours of light signals (CIE, 2001a; CIE,2001b). The signal colours used in the laboratory set-up are also plottedand the effect of varying the current (i.e. the output intensity of the laps)is shown for the white light.
2.2.3 A schematic of the laboratory set-up developed to simulate the PAPI and PSL tests isshown in Figure 16. A four-channel optical system was developed using an airfieldhalogen lamp (JF6.6A100W/PK30d) as the single light source. The light is then splitup and channelled using two beam-splitters (BS) so as to generate four beams. Eachbeam of light passes through two motorised filter wheels; colour (CW) and neutraldensity (NDW) wheels. The CW has six different filters: red, modified white (~3900K),blue, green, yellow and standard white (~2400K). Each NDW has neutral densityfilters with the following optical density (OD) values: 0.0, 0.3, 0.6, 1.0, 1.3, and 1.6.During the calibration procedure, the luminous intensity of each beam was measuredwith each filter in place to account for the actual and not the nominal absorption ofeach filter.
2.2.4 The angular subtense of each light was 1.36’ at a viewing distance of 4m. Beyond ~0.8km the angular subtense of the real PAPI lights approaches the diffraction limit ofthe eye. The size of each light on the retina remains relatively unchanged as theapproach distance is increased, but the light flux captured from each light isdecreased. On approach the PAPI lights are first seen as a small continuous line untilthe angular separation between adjacent lights is resolved by the eye (typically lessthan 2’ taking into consideration pupil size and optical aberrations). In order toreproduce the geometry of the real PAPI lights in the laboratory for a viewing distance
0 0.1 0.2 0.3 0.4 0.5 0.6 0.7 0.8 0.9
x
0
0.1
0.2
0.3
0.4
0.5
0.6
0.7
0.8
0.9
y
Signal lights: GreenRedBlueCC WhiteYellowWhiteEffect of currentALT
700
600
550
520
480
450 1931 CIE-x,y
Page 23May 2009

CAA Paper 2009/04 Minimum Colour Vision Requirements for Professional Flight Crew
of 4m, the adjacent lights (centre to centre) were separated by ~ 6.5mm. Thiscorresponds to an angular separation of 5.5’ which translates to an approach distanceof 5.54km in the case of the real PAPI lights. This design therefore requires the pilotto locate and recognise the white and red PAPI lights from 5.54km when the size ofthe image of each light on the retina is determined by the point-spread-function (PSF)of the eye. A larger approach distance was not chosen in order to minimize the effectsof higher order aberrations and increased scatter in the eye have on the retinal imagesof the lights. When the pupil size is large, the higher order aberrations in the eye canbe quite large and this causes the PSF to broaden and the visual acuity to decrease.The light distribution in adjacent PAPI lights can overlap significantly and this in turnmakes it more difficult for the subject to process the colour of each light. Since alarger approach distance would produce even more overlap, a distance of 5.54km thatis considered to be safe was selected for the study.
Figure 16 Schematic representation of PAPI simulator designed and constructed forthis study. Light emerging from each arm of the lamp house is divided intotwo channels via beam splitters (BS) to produce four independentchannels. Each channel has a colour wheel (CW) and a neutral densitywheel (NDW) which are controlled by the computer. After passingthrough appropriate filters, the light from each channel is focused into anoptical fibre head which are attached to the viewing panel so as tosimulate the PAPI lights.
2.2.5 The optical fibre heads form a line located at the centre of a black plate which providesa dark uniform surround (see Figure 16). The whole system is encased and ventilatedby two fans to prevent overheating and to reach a steady state temperature asneeded for stable lamp operation. The intensities of the red and white lights wereadjusted using ND filters so that the simulated PAPI lights appear as intense as thereal PAPI when viewed in the dark from a distance of 5.54km. The calculationsinvolved assumed that in the absence of significant ambient light, the pupil of the eyewould in general be large (~ 6 mm). In addition, the intensities of the coloured lightsalso varied randomly by ±0.3 OD with respect to the nominal values to eliminate thedetection of brightness cues.
Page 24May 2009
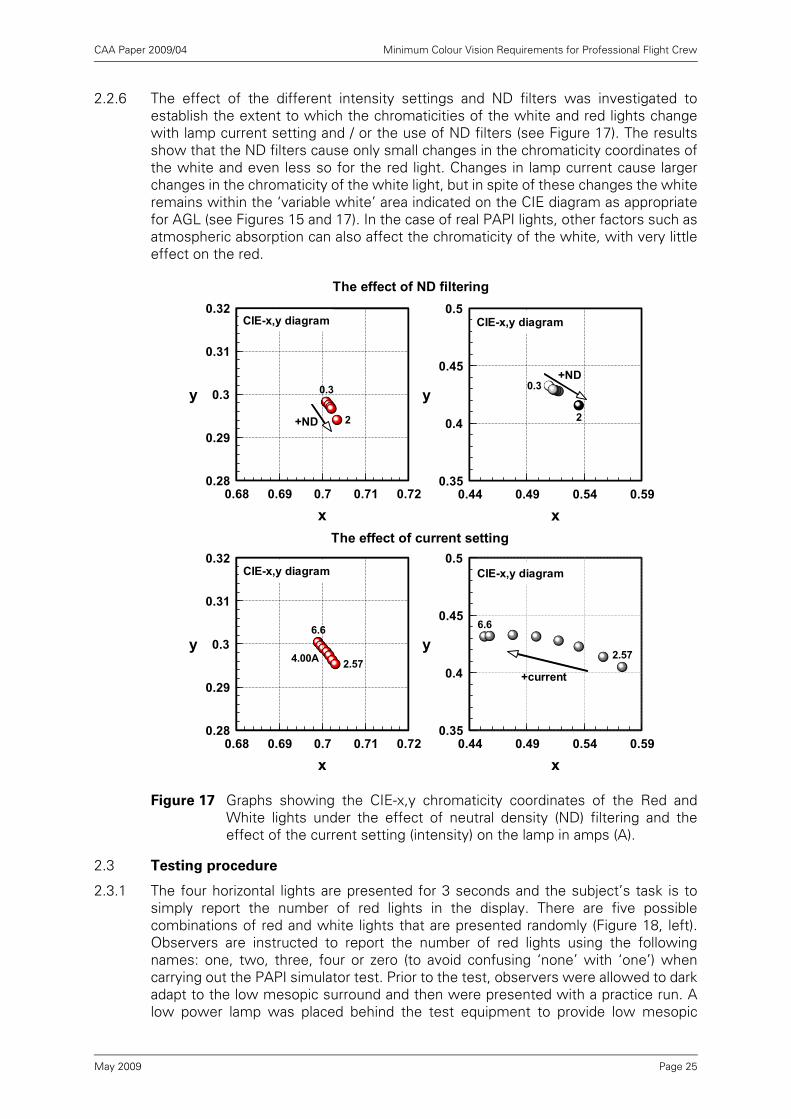
CAA Paper 2009/04 Minimum Colour Vision Requirements for Professional Flight Crew
2.2.6 The effect of the different intensity settings and ND filters was investigated toestablish the extent to which the chromaticities of the white and red lights changewith lamp current setting and / or the use of ND filters (see Figure 17). The resultsshow that the ND filters cause only small changes in the chromaticity coordinates ofthe white and even less so for the red light. Changes in lamp current cause largerchanges in the chromaticity of the white light, but in spite of these changes the whiteremains within the ‘variable white’ area indicated on the CIE diagram as appropriatefor AGL (see Figures 15 and 17). In the case of real PAPI lights, other factors such asatmospheric absorption can also affect the chromaticity of the white, with very littleeffect on the red.
Figure 17 Graphs showing the CIE-x,y chromaticity coordinates of the Red andWhite lights under the effect of neutral density (ND) filtering and theeffect of the current setting (intensity) on the lamp in amps (A).
2.3 Testing procedure
2.3.1 The four horizontal lights are presented for 3 seconds and the subject’s task is tosimply report the number of red lights in the display. There are five possiblecombinations of red and white lights that are presented randomly (Figure 18, left).Observers are instructed to report the number of red lights using the followingnames: one, two, three, four or zero (to avoid confusing ‘none’ with ‘one’) whencarrying out the PAPI simulator test. Prior to the test, observers were allowed to darkadapt to the low mesopic surround and then were presented with a practice run. Alow power lamp was placed behind the test equipment to provide low mesopic
0.3
2
0.68 0.69 0.7 0.71 0.72
x
0.28
0.29
0.3
0.31
0.32
y 0.3
2
0.44 0.49 0.54 0.59
x
0.35
0.4
0.45
0.5
y+ND
+ND
6.6
2.57
0.68 0.69 0.7 0.71 0.72
x
0.28
0.29
0.3
0.31
0.32
y6.6
2.57
0.44 0.49 0.54 0.59
x
0.35
0.4
0.45
0.5
y
CIE-x,y diagram CIE-x,y diagram
The effect of ND filtering
The effect of current setting
CIE-x,y diagram CIE-x,y diagram
+current4.00A
Page 25May 2009

CAA Paper 2009/04 Minimum Colour Vision Requirements for Professional Flight Crew
conditions of ambient illumination. The black, immediate surround around the PAPIlights was dark (i.e. mean luminance ~ 0.005 cd/m2). Subjects were encouraged torespond only after an auditory cue signalled the end of the 3 second viewing period.The PAPI test was carried out twice, once with the standard white (~2400K) and oncewith a modified white light (higher colour temperature of ~3900K).
Figure 18 Schematic representation of the Precision Approach Path Indicator (PAPI)simulator test (left) and PAPI Signal Lights (PSL) test (right). The PAPI testpresents 5 different conditions (as shown) twelve times giving a total of60 presentations. The PSL presents 6 different conditions (as shown)twelve times giving a total of 72 presentations. The intensities of thelights varied randomly by ±0.3 OD with respect to the nominal values toeliminate the detection of brightness cues.
2.3.2 The PSL test uses similar parameters to the PAPI lights test. In this test six possiblecolours are presented (standard white, modified white, red, green, blue and yellow).The chromatic properties of the lights lie within the boundaries for the recommendedsignal lights for AGL (CAA, 2004) as shown in Figure 15. The PSL addresses the issueof correct colour naming when all lights have the same chromaticity as opposed tothe ability to distinguish and categorise some of the four lights as red and the othersas white on the bases of some perceived differences between the lights. The PSLtests whether the applicant can recognise and name reds as ‘red’ and whites as‘white’ for the same conditions and geometry as the PAPI lights, but when all thelights are of the same colour. The conditions when all four PAPI lights have the samecolour to indicate “far too low” (all reds) or “far too high” (all whites) are clearly veryimportant. Observers were instructed to report the colour of the lights as either: red,green, yellow, blue or white.
2.3.3 There were two whites, the standard white as produced by the lamp and a modifiedwhite produced by raising the colour temperature of the standard white by 200MIREDS. This is achieved by using a colour correction filter that modifies the spectralcontent of the tungsten light to make it more like daylight. Prior to the test, observerswere presented with a practice run. All the colours were shown to the subject andnamed by the examiner during the practice run and the subject was allowed to reviewany of the lights and to ask the examiner to confirm their colour. The results for thePAPI and PSL are recorded as the percent correct.
PAPI test
10
2
43
PAPI test
10
2
43
PSL test
WCC
R
Y
GB
PSL test
WCC
R
Y
GB
Page 26May 2009

CAA Paper 2009/04 Minimum Colour Vision Requirements for Professional Flight Crew
3 Results
3.1 The colour vision of each subject was examined using five different colour vision testsas well as the PAPI and PSL simulator tests. Results from each of the five tests werethen examined in relation to the subject’s performance on the PAPI to establish whichtest yields the best prediction of performance in the PAPI task.
Figure 19 The number of plates read correctly expressed as a percentage on theIshihara test (24 plates) is compared to performance on the PAPIsimulator test separately for normals, deutan and protan colour visionobservers. The x-axis for the top graph has been expanded to showclearer the errors made by normals.
80 85 90 95 1000
20
40
60
80
100PA
PI(%
Cor
rect
)
0 20 40 60 80 1000
20
40
60
80
100
PAPI
(%C
orre
ct)
0 20 40 60 80 100Ishihara % correct (all 24 plates)
0
20
40
60
80
100
PAPI
(%C
orre
ct)
Normals
Deutans
Protans
Ishihara (% Correct) 2811
2
Page 27May 2009

CAA Paper 2009/04 Minimum Colour Vision Requirements for Professional Flight Crew
3.2 Performance on the PAPI task is computed as number of correct reports out of a totalof 60 presentations.
3.3 The results summarised in Figure 19 show that normal trichromats can also makeerrors, both on the PAPI and the Ishihara tests (i.e. five subjects produce one error,one subject produces two errors and one other subject produces three errors on thePAPI). The rest of the normal subjects score 100% correct on the PAPI test. Resultsfor deutan colour deficient observers reveal that all subjects with scores > 70% (i.e.16 or more correct plates out of 24 on the Ishihara 24-plate test) pass the PAPI witha score of 100% correct. Results for protan observers show that four subjects withscores greater than 40% pass the PAPI test. Overall the results reveal very poorcorrelation between the subjects’ performance on the Ishihara and the PAPI testscores. Many of the subjects that pass the PAPI task can score anything from 0 to95% correct on the Ishihara test.
3.4 Comparisons of data from the Dvorine plate test with the PAPI simulator show similarresults to those obtained with the Ishihara test (Figure 20). Three normals obtain lessthan 100% on the Dvorine test (but pass the PAPI with no errors). Deutan and protancolour deficient subjects need more than 65 and 50%, respectively, on the Dvorineplate test to achieve 100% on PAPI. Since the prediction of the class of deficiency(protan or deutan) involved is poor with both Ishihara and Dvorine tests, it is difficultto know which of the two limits one should apply to any colour deficient subject.
Page 28May 2009

CAA Paper 2009/04 Minimum Colour Vision Requirements for Professional Flight Crew
Figure 20 PAPI percentage correct scores plotted as a function of the number ofplates read correctly on the Dvorine test (expressed as a percentage) fornormals, deutan and protan observers.
80 85 90 95 1000
20
40
60
80
100
PAPI
(%C
orre
ct)
0 20 40 60 80 1000
20
40
60
80
100
PAPI
(%C
orre
ct)
0 20 40 60 80 100Dvorine % correct (all 14 plates)
0
20
40
60
80
100
PAPI
(%C
orre
ct)
Normals
Deutans
Protans
Dvorine (% Correct)
3
41
4
Page 29May 2009

CAA Paper 2009/04 Minimum Colour Vision Requirements for Professional Flight Crew
3.5 Figure 21 plots the PAPI scores against the subjects’ performance on the ALT test.All normals secure 100% score on the ALT, but not on the PAPI test. Results fordeutan observers show that out of 77 subjects tested, only 18 pass the ALT (with apass criterion of one or no errors). Fourteen of the 18 subjects that pass the ALT alsopass the PAPI. Results for protans show that all 40 subjects tested failed the ALT testand that only one subject achieved a score higher than 80%, although just over 50%of protans passed the PAPI.
Figure 21 The number of presentations identified correctly on the Aviation LightTest (ALT) from a total of 27 presentations is compared to performanceon the PAPI simulator test separately for normals, deutan and protancolour vision observers.
80 85 90 95 1000
20
40
60
80
100PA
PI(%
Cor
rect
)
0 20 40 60 80 1000
20
40
60
80
100
PAPI
(%C
orre
ct)
0 20 40 60 80 100ALT (% correct)
0
20
40
60
80
100
PAPI
(%C
orre
ct)
Normals
Deutans
Protans
ALT (% Correct) 59
10
Page 30May 2009

CAA Paper 2009/04 Minimum Colour Vision Requirements for Professional Flight Crew
Figure 22 PAPI test scores plotted against an index of red-green chromaticsensitivity based on the Nagel anomaloscope range. Results are againshown separately for normals, deutan and protan observers. Numbersnext to some symbols indicate number of subjects with overlapping datapoints.
3.6 Figure 22 compares PAPI scores with a measure of RG sensitivity based on the Nagelanomaloscope range. Only a few deutan and protan observers pass the PAPI withNagel sensitivity > 0.6 (deutan) and > 0.4 (protan). The Nagel anomaloscope test isexcellent at distinguishing between deutan and protan like deficiencies, but fails toquantify reliably the severity of colour vision loss and does not test for yellow/bluedeficiency.
0 0.5 1 1.5 20
20
40
60
80
100
PAPI
(%C
orre
ct)
0 0.5 1 1.5 20
20
40
60
80
100
PAPI
(%C
orre
ct)
0 0.5 1 1.5 2Nagel (4/rg range)
0
20
40
60
80
100
PAPI
(%C
orre
ct)Normals
Deutans
Protans
Nagel sensitivity
619151132
Page 31May 2009
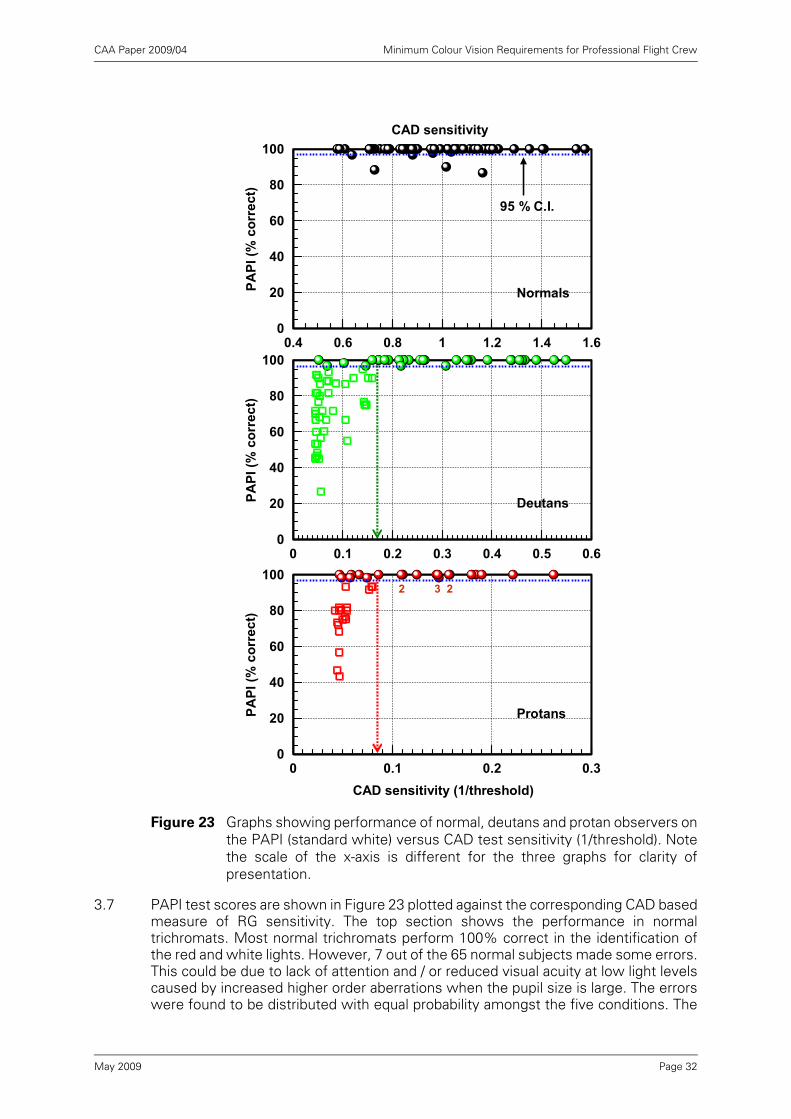
CAA Paper 2009/04 Minimum Colour Vision Requirements for Professional Flight Crew
Figure 23 Graphs showing performance of normal, deutans and protan observers onthe PAPI (standard white) versus CAD test sensitivity (1/threshold). Notethe scale of the x-axis is different for the three graphs for clarity ofpresentation.
3.7 PAPI test scores are shown in Figure 23 plotted against the corresponding CAD basedmeasure of RG sensitivity. The top section shows the performance in normaltrichromats. Most normal trichromats perform 100% correct in the identification ofthe red and white lights. However, 7 out of the 65 normal subjects made some errors.This could be due to lack of attention and / or reduced visual acuity at low light levelscaused by increased higher order aberrations when the pupil size is large. The errorswere found to be distributed with equal probability amongst the five conditions. The
0 0.1 0.2 0.3 0.4 0.5 0.60
20
40
60
80
100
PAPI
(%co
rrec
t)
0 0.1 0.2 0.3CAD sensitivity (1/threshold)
0
20
40
60
80
100
PAPI
(%co
rrec
t)
0.4 0.6 0.8 1 1.2 1.4 1.60
20
40
60
80
100
PAPI
(%co
rrec
t)
Normals
Deutans
Protans
CAD sensitivity
95 % C.I.
32 2
Page 32May 2009

CAA Paper 2009/04 Minimum Colour Vision Requirements for Professional Flight Crew
blue dotted line in Figure 23 shows the 95% confidence interval. The lower sectionscompare the performance on the PAPI test with the corresponding CAD measure ofRG sensitivity for subjects with deutan- and protan-like deficiencies. The sensitivitylimits beyond which deutans and protans perform the PAPI test as well as normaltrichromats are 0.17 (RG threshold ~ 6 SN units) and 0.085 (RG threshold ~ 12 SNunits), respectively. These limits are indicated by dotted vertical lines in Figure 23.
Figure 24 Graphs showing comparisons between standard and modified white(colour-corrected white) versus the CAD test sensitivity values.
3.8 Figure 24 shows the benefit of replacing the standard white light in the PAPI test withthe colour-corrected (CC) white. Higher PAPI performance scores were obtained withthe CC white in all subject groups. All, but one normal trichromat, scored 100%correct on the PAPI test when using the CC white. Figure 24 shows the overallimprovement observed in the deutan group. All deutans obtain 80% correct or higherand many score 100% correct with the CC white. The improvement is, however, verysmall among protanomalous observers, particularly among subjects with severedeficiency (i.e. those with RG sensitivity less than 0.05 units). The improvementswere statistically significant in normal trichromats (p=0.019) and deutans (p=0.000).Protans also showed slightly higher PAPI performance scores with the CC white, butthe improvement failed to reach statistical significance (p=0.224).
0.4 0.6 0.8 1 1.2 1.4 1.60
20
40
60
80
100
0 0.1 0.2 0.3 0.4 0.5 0.60
20
40
60
80
100
0 0.1 0.2 0.3CAD Sensitivity (1/threshold)
0
20
40
60
80
100
Normals
Deutans
Protans
Standard White Modified White
0 0.1 0.2 0.3 0.4 0.5 0.60
20
40
60
80
100
PAPI
(%co
rrec
t)
0 0.1 0.2 0.3CAD sensitivity (1/threshold)
0
20
40
60
80
100
PAPI
(%co
rrec
t)
0.4 0.6 0.8 1 1.2 1.4 1.60
20
40
60
80
100
PAPI
(%co
rrec
t)
3
Page 33May 2009

CAA Paper 2009/04 Minimum Colour Vision Requirements for Professional Flight Crew
3.9 The PSL test was introduced to examine the condition when all four PAPI lights havethe same colour. In this condition the subjects can no longer make use of perceiveddifferences between two adjacent colours presented simultaneously without beingable to name the correct colour. The results in Figure 25 show that subjects do notoften confuse reds with whites or whites with reds. Four protan subjects with severeloss of chromatic sensitivity (i.e. CAD RG sensitivity less than 0.05 units) make W=Rand R=W errors and six deutan subjects with CAD RG sensitivity less than 0.15 unitsmake errors on W=R.
Figure 25 Graphs showing R=W and W=R errors only made on the PSL versus theRG CAD sensitivity.
3.10 Computing an index of overall chromatic sensitivity
3.10.1 The threshold signal needed to just see the coloured stimulus is expressed by directcomparison with the median threshold for normal trichromats. This approach has theadvantage that a threshold <1 indicates colour discrimination better than the standardnormal trichromat whereas values >1 indicate precisely the increase in thresholdsignal with respect to the normal observer. Sensitivity is usually defined as thereciprocal of the signal strength needed to just see the stimulus. The normalised CADthreshold falls within the range ~ 0.7 (i.e. better than normal sensitivity) to amaximum of 23.7 (a value limited by the phosphor limits of the display). It is thereforereasonable to use the reciprocal of the CAD threshold as a measure of chromaticsensitivity which ranges from just above 1, for subjects with better than normalsensitivity, to ~ 0.04 for subjects with very slight or absent chromatic sensitivity. Inthe case of the most common occupational colour vision tests, loss of chromaticsensitivity is more difficult to quantify because the tests do not measure the smallest
0 0.2 0.4 0.60
20
40
60
80
100
PSL
only
R&
W(%
corr
ect)
0 0.1 0.2 0.3CAD Sensitivity (1/threshold)
0
20
40
60
80
100
PSL
only
R&
W(%
corr
ect)
Deutans
Protans
CAD sensitivity
Page 34May 2009

CAA Paper 2009/04 Minimum Colour Vision Requirements for Professional Flight Crew
colour signal strength needed to detect the stimulus. Instead, most occupationaltests yield scores of correct responses that are indicative of the subject’s overallchromatic sensitivity. In spite of these limitations, it is of great interest to derive anindex of mean chromatic sensitivity based on the subject’s performance in severalcolour vision tests. With this aim in mind, we used the parameters of each test toderive the best measure of average chromatic sensitivity which ranges from around1, for normal trichromats, to close to zero, for subjects with very limited or completeabsence of colour discrimination:
Ishihara: Fraction of plates named correctly
Dvorine: Fraction of plates named correctly
ALT: Fraction of stimulus pairs named correctly
Nagel: See definition of RGI (i.e. red-green discrimination index)CAD: Reciprocal of threshold signal when measured in standard normal CAD units
3.10.2 Using this approach we were able to quantify the subject’s average chromaticsensitivity as derived from the above tests which we take as the best availablemeasure of the subject’s overall ability to cope with a variety of colour vision tasks.This measure of average chromatic sensitivity has been used to further justify theselection of minimum colour vision requirements that can be classed as safe withinthe aviation environment and the exclusion of the very few subjects with poor overallRG chromatic sensitivity that pass the PAPI test.
3.10.3 Figure 26 shows that the very few subjects that pass the PAPI with CAD sensitivitiesless than 0.2 (deutan) and 0.1 (protan) have poor overall chromatic sensitivity. Theresults also show that the pass / fail limits proposed on the basis of the CAD testensure that the colour deficient subjects that pass have an overall chromaticsensitivity greater than ~ 0.7 (deutans) and greater than ~ 0.5 (protans)
Page 35May 2009

CAA Paper 2009/04 Minimum Colour Vision Requirements for Professional Flight Crew
.
Figure 26 Justification for limits chosen. The top two diagrams compare PAPI (%correct) versus CAD test (sensitivity units=1/RG CAD threshold); colourdeficient subjects to the right of the dotted line perform the PAPI test aswell as normal trichromats do. CAD sensitivity of 0.2 and 0.1 correspondsto 6 and 12 CAD threshold units, respectively, for deutans and protans.Note the change of horizontal scale units for protan observers. Thebottom two diagrams compare: left, CAD RG threshold units and right,PAPI performance, versus the “mean” or overall colour sensitivity ascomputed by averaging the subject’s performance on the Ishihara,Dvorine, ALT and Nagel anomaloscope tests.
0 0.1 0.2 0.3CAD sensitivity (1/threshold)
0
20
40
60
80
100
PAPI
(%co
rrec
t)
Protans
0 0.1 0.2 0.3 0.4 0.5 0.6CAD Sensitivity
0
20
40
60
80
100
PAPI
(%co
rrec
t)
NormalsDeutans
0 0.2 0.4 0.6 0.8 1Mean colour sensitivity
0
20
40
60
80
100
PAPI
(%co
rrec
t)
0 0.2 0.4 0.6 0.8 1Mean colour sensitivity
0
5
10
15
20
25
CA
DR
Gth
resh
old
units
Page 36May 2009

CAA Paper 2009/04 Minimum Colour Vision Requirements for Professional Flight Crew
4 Discussion
4.1 Colour vision concerns in aviation
4.1.1 Colour enhances object conspicuity and can also be used to code information. Inovercrowded displays or complex visual scenarios, colour allows segmentation andgrouping operations which enhance and speed up the acquisition and processing ofvisual information (Firth, 2001). The primary signal colours in aviation are red, greenand white with blue and yellow as supplementary colours (CAA, 2006b). ICAOrequires member nations to maintain a colour standard to ensure pilots can recognisethe colours of signal lights used in aviation (ICAO, 2006). Further, it acknowledgesthat the requirements are open to interpretation and at present there is no clearlydefined line that specifies the class and severity of colour deficiency beyond whichthe applicant is no longer safe to fly (for a full review see CAA, 2006a). This is partlydue to the varied task requirements and the technological advances in the use ofcolour in the aviation industry.
4.1.2 There are a number of currently approved JAA and FAA colour vision tests thatapplicants have to pass in order to be licensed to fly. In this investigation we assessed182 subjects using several colour vision tests and the results reveal both inter-subjectvariability and poor consistency amongst the various tests. Comparison of theoutcome from Ishihara and the Dvorine tests show that significant variability remainseven when, at least in principle, the tests are very similar. These findings expose thefacts that colour deficient subjects can produce very different scores on the two testsand that normal trichromats can make more errors on one test, but not on the other.Further, the pseudoisochromatic tests designed for screening are not suitable toeither diagnose accurately the class of deficiency, or to quantify the severity of colourvision loss (Belcher et al, 1958; Birch, 1997).
4.1.3 The measures of chromatic discrimination on the CAD and Nagel anomaloscopereveal very poor correlation. Some colour deficient observers that require a lot of redor green in the match can only accept a narrow, red-green range that is a characteristicof normal red/green colour vision. Figure 22 confirms well-known observations(Wright, 1946) in that the measure of chromatic sensitivity based on the Nagel rangeoverestimates the subject’s ability to discriminate red-green colour differences undermore natural conditions of illumination. Subjects with severe loss of chromaticsensitivity, as measured on the CAD test, can have RGI (Nagel) values that are similarto those measured in normal trichromats. The JAR pass criterion of 4 scale units(RGI=0.95) suggests that some normals are likely to fail, and more worryingly, thatsome severe colour deficient subjects are likely to pass.
4.1.4 Figure 21 shows comparisons between the ALT and the PAPI simulator tests. Theresults suggest that the ALT is a more challenging test, i.e. the average percentcorrect scores are lower on the ALT than on the PAPI test. However, normals werefound to make no errors on the ALT. The fact that colour deficient subjects performworse on the ALT than on the PAPI could be due to the increased number of colourspresented on the ALT (three instead of two) and the very dark immediate surround inwhich the apertures of the lights presented are encased in the ALT.
4.1.5 These discrepancies among the various screening tests can be attributed partly to thedifferences in the methods of assessing colour vision. These include differences instimulus configuration, background lighting conditions and also the differentinstructions given to subjects. The results from this study justify the recent concernsexpressed by ICAO (1999) and CAA (2006a) in relation to some aspects of colourassessment in aviation. The results confirm earlier findings from a study thatexamined three lantern types accepted by the JAA and found that the same individual
Page 37May 2009

CAA Paper 2009/04 Minimum Colour Vision Requirements for Professional Flight Crew
can pass some of the tests and fail others (Squire et al, 2005). The study also showedthat some normal trichromats that fail the initial screening may also fail the secondarytest and that the outcome of regulatory assessment depends on which secondarycolour vision test is used, which varies between countries. The observedinconsistency in results between the currently approved colour vision tests istherefore unsatisfactory, both in terms of flight safety issues, as well as beingpotentially unfair to some pilot applicants.
4.2 Advances in assessment of colour vision
Red-green chromatic sensitivity varies from ‘normal’ performance to total ‘colour-blindness’, with an almost continuum of colour impairment between these twoextremes. Amongst congenital colour deficient observers, the loss of RG coloursensitivity varies along a continuous scale (see Figure 12). This is the most commontype of colour vision deficiency, affecting 8% of the male population (< 1% females)(see Table in Section 4.4). Yellow-blue deficiencies affecting the S-cone are very rare(1 in ~20000) and are most often related to acquired colour vision defects, as a resultof eye disease, or as a side effect of toxicity or medication (see Section 1.11 in thisreport). Acquired deficiencies tend to be age-dependent and, when unnoticed, maycompromise safety within certain occupations. Follow up colour vision tests arecarried out for some revalidation/renewal examinations for Class 1 medicalcertification (JAR-FCL 3, 2006). Current civil aviation tests are not designed to detector measure YB sensitivity so any anomalies due to YB loss or disease are likely toremain undetected. Yellow-blue discrimination has also become more importantbecause of the extensive use of different colours in the modern aviation environment.
4.3 Safe colour vision limits in aviation
4.3.1 The PAPI system built for this investigation reproduces the red and white lights underconditions simulating the spectral composition, the angular subtense and the retinalilluminance of real PAPI lights viewed from 5.54km. Comparisons between theperformance on the PAPI and CAD tests reveal the minimum level of chromaticdiscrimination below which subjects with red/green colour deficiency no longerperform the PAPI task with the same accuracy as normal trichromats. Figure 23shows that deutans and protans with a RG threshold of less than 6 and 12 CAD units,respectively, perform the PAPI simulator test in a similar way to normal trichromats.The PSL test addresses the question as to whether subjects can also name correctlythe colour of the PAPI lights when all lights are of the same colour, either red or white.Figure 25 shows how the ability to name correctly the white and red lights on the PSLtest relates to the subject’s RG discrimination sensitivity on the CAD test. Colourdeficient subjects do not have difficulty with this condition and no subject with RGthreshold units less than 6 and 12, for deutans and protans, respectively, confuseR=W or W=R when all four lights are the same colour. The PAPI and PSL tests alsoinclude a CC white to investigate whether the use of a more ‘bluish’ white canimproved performance. The results show that this is indeed the case for both PAPIand PSL tests in all subject groups.
4.3.2 Using the proposed pass and fail limits of 6 and 12 RG CAD threshold units, fordeutans and protans, respectively, 29 out of 77 deutans and 13 out of 40 protanswould pass the PAPI simulator test using the standard white (Figure 27). However, 5deutans and 7 protans (Figure 28) with RG thresholds larger than the proposed safelimits also pass the PAPI. An important question is whether these subjects aredisadvantaged unfairly if the new pass / fail limits were to be adopted. There is littledoubt that these subjects have severely reduced RG colour discrimination (asrevealed in all the colour vision tests employed in this investigation). The overall lossof chromatic sensitivity becomes increasingly more severe as the subject’s
Page 38May 2009

CAA Paper 2009/04 Minimum Colour Vision Requirements for Professional Flight Crew
thresholds increase beyond the recommended limits. These subjects are thereforelikely to be disadvantaged in other, less safety-critical, visual tasks that involve colourdiscrimination. By computing an average chromatic discrimination performance on abattery of colour vision tests we are able to examine whether these subjects havepoor overall colour discrimination performance. Figure 26 shows that the very fewsubjects that pass the PAPI with CAD threshold limits greater than 6 (deutan) and 12(protan) units have poor overall chromatic sensitivity. The results also show that thepass / fail limits proposed on the basis of the CAD test ensure that the colour deficientsubjects that pass have an overall RG chromatic sensitivity greater than ~ 0.7(deutans) and greater than ~ 0.5 (protans).
4.3.3 The use of the colour-corrected white condition increases quite significantly thenumber of subjects that pass the PAPI test. For deutans (Figure 27), with thresholdshigher than 6 units, 28 subjects pass instead of only 5 with the standard whitecondition. Similarly, for protans (Figure 28), 10 pass in the modified condition, insteadof 7 for the standard white condition. Overall, the CC white condition improvesperformance of the PAPI test for all subject groups. This improvement is, however,more significant for deutan than protan colour deficient observers.
4.3.4 The analysis shown graphically in Figures. 27 & 28 reveal that 37.6% of subjects withdeutan-like deficiency and 32.5% of subjects with protan-like deficiency would beclassified as safe to fly under the new research-based pass/fail limits. When using thecurrent PAPI systems (i.e. PAPI with the standard white light), 44% of deutansubjects pass the PAPI test and according to the proposed pass/fail limit of 6 SN CADunits 85% of these subjects (i.e. the deutans that passed the PAPI) would beclassified as safe to fly. Similarly, 50% of subjects with protan-like deficiency pass thePAPI test and according to the pass / fail limit of 12 SN CAD units 65% of thesesubjects would be classed as safe to fly.
Figure 27 Summary of deutan subjects’ results if the proposed pass/fail criterion of6 RG CAD threshold units is accepted.
PAPI (standard white)
77
Overall < 6 > 6
pass
fail
CAD threshold range
0
43 43
34
5
29
PAPI (standard white)
77
Overall < 6 > 6
pass
fail
CAD threshold range
0
43 43
34
5
29
PAPI (modified white)
77
Overall
pass
fail
< 6 > 6
CAD threshold range
0
26 26
57
28
29
PAPI (modified white)
77
Overall
pass
fail
< 6 > 6
CAD threshold range
0
26 26
57
28
29
Page 39May 2009

CAA Paper 2009/04 Minimum Colour Vision Requirements for Professional Flight Crew
Figure 28 Summary of protan subjects’ results if the proposed pass/fail criterion of12 RG CAD threshold units is accepted.
4.3.5 So far 386 colour deficient observers have been examined on the CAD test as part ofthis as well as other ongoing studies. Two hundred and fifty-five (255) of thesesubjects had deutan and the remaining 131 had protan deficiencies. If the proposedlimits of 6 and 12 SN CAD units for deutan and protan subjects, respectively, wereapplied to this larger group, 36.1% of deutans and 29.8% of protans would pass theselimits. These findings suggest that 35% of the total number of colour deficientsubjects investigated should be certified as safe to fly. The percentages shown aboveare very close to those estimated from the smaller number of colour deficientsubjects (n = 117) that participated in the PAPI study.
4.3.6 The proposed pass / fail limits relate accurate measurements of chromatic sensitivityto the subjects’ performance on the most critical colour vision task in aviation. Thelimits ensure that the subjects that pass can also perform the PAPI task with the sameaccuracy as normal trichromats. In addition, the proposed limits ensure that allsubjects that fail according to these limits have poor, overall chromatic discriminationsensitivity.
Overall < 12 > 12
CAD threshold range
40
pass
fail
PAPI (modified white)
0
17 17
23
10
13
Overall < 12 > 12
CAD threshold range
40
pass
fail
PAPI (modified white)
0
17 17
23
10
13
Overall < 12 > 12
CAD threshold range
40
pass
fail
PAPI (standard white)
0
20 20
20
7
13
Overall < 12 > 12
CAD threshold range
40
pass
fail
PAPI (standard white)
0
20 20
20
7
13
Page 40May 2009

CAA Paper 2009/04 Minimum Colour Vision Requirements for Professional Flight Crew
4.4 Benefit analysis of using the new approach
4.4.1 Analysis based on CAA / JAA pass criteria and guidelines
The following table shows the different classes and relative distribution of colourdeficient subjects that make up ~ 8% of the male population (Sharpe et al., 1999).
*Results based on 202 normal trichromats when employing the strict CAA/JAA passcriteria (i.e., no errors, no misreadings in the first 15 plates of the 24-plate version).
Table 1 Percentage of colour deficient observers that fail Ishihara and HW tests.
4.4.1.1 The data in Table 2 are based on the strict CAA/JAA pass criteria for Ishihara test. Asimilar analysis using the FAA pass/fail criteria for Dvorine, Ishihara and ALT tests willbe shown separately. Interestingly, only 7% of the colour deficients pass the Holmes-Wright (HW) lantern, and there is no clear evidence to suggest that all of thesesubjects are safe to fly.
4.4.1.2 One hundred and sixty-three (163) colour deficients (i.e. 110 deutan and 53 protansubjects) have been investigated using the HW lantern in all of our studies. All protansfailed, but only 99 of 110 deutan subjects failed the HW lantern. These findings makeit possible to predict the number of colour deficient subjects that are classified as safeto fly using current assessment procedures:
Table 2 Predicted outcome per thousand applicants using current CAA/JAR guidelines.
4.4.1.3 Table 3 shows the predicted outcome when the same 1000 applicants are examinedon the CAD test and the pass / fail criteria employed are based on the findings fromthis study. The current procedures that employ a secondary test whenever theapplicant fails the primary test results in 22% of the applicants having to take thesecondary test. The new procedure based on the CAD pass / fail limits does not
Protanope Deuteranope Tritanope P-nomalous D-nomalous T-nomalous Total1 1.1 0.002 1 4.9 0 8.002
†Gegenfurtener, K.R. & Sharpe, L.T. "Color Vision, from Genes to Perception" : Cambridge University Press.
Percentage of normal trichromats that fail the Ishihara test* 15.8 Percentage of protan-like subjects that fail the Ishihara test 100 Percentage of deutan-like subjects that fail the Ishihara test 99 Percentage of normal trichromats that fail the Holmes-Wright lantern test 0 Percentage of protan-like subjects that fail the Holmes-Wright lantern test 100 Percentage of deutan-like subjects that fail the Holmes-Wright lantern test 90
Accepted Prevalence of Colour Vision Deficiencies†
Other facts based on normal trichromats and colour deficient subjects studies at AVRC
No. that fail No. that fail No. classed as
Applicants 1000 Ishihara HW safe to fly
Normals 920 145 0 920Deutans 60 59 53 6Protans 20 20 20 0Total 1000 225 73 926
221007
Percentage of applicants that undergo secondary tests = Percentage of deutan subjects that pass secondary tests = Percentage of protan subjects that pass secondary tests = Percentage of total colour deficient subjects that pass =
Predicted outcome per 1000 applicants using current assessment methods
Page 41May 2009

CAA Paper 2009/04 Minimum Colour Vision Requirements for Professional Flight Crew
require any secondary test. The analysis in Table 3 shows that 36% of deutan and30% of protan subjects meet the pass/fail criteria established experimentally and cantherefore be classed as safe to fly. Given the higher prevalence of deutan subjectswithin the male population, these findings suggest that 35% of all colour deficientsubjects pass the new guidelines and are therefore safe to fly.
4.4.1.4 If the HW secondary test is replaced by the Nagel anomaloscope test (using thecurrent JAA pass/fail limits for midpoint and range), the percentage of colour deficientsubjects that are classified as safe to fly decreases to less than 2%. If the HW lanterntest is replaced with other, less demanding secondary tests, the percentage of colourdeficient subjects that pass can increase to more than 10%. There is, however, noguarantee that the colour deficient subjects that pass these secondary tests can carryout the most safety-critical, colour-related tasks.
Table 3 Predicted outcome per thousand applicants using the new, CAD based pass / fail limits.
4.4.2 Analysis based on FAA pass / fail criteria and guidelines
4.4.2.1 The FAA pass/fail criteria are more liberal and were selected deliberately to be fair tothose colour deficient applicants that may well be able to carry out safety-critical,colour-related tasks with the same accuracy as normal trichromats. The criteria arenot, however, based on the PAPI task and employ a large number of recommendedtests that fail to correlate well when used to quantify the severity of colour vision loss.This means that some of the applicants fail some tests and pass others. In thisinvestigation we have included two of FAA’s most popular tests, the Ishihara and theDvorine pseudoisochromatic plates. The ALT (i.e. a Farnsworth lantern (FALANT) withmodified filters designed to produce lights with chromaticities specified for aviationsignal lights (Milburn & Mertens, 2004)) was included in the study. Normal trichromatspass both the FALANT and the ALT lanterns, but no data are available to describe howthe deutan and protan subjects examined in this study perform on the FALANT test.The following analysis is, however, of great interest since it provides a usefulcomparison of expected outcomes when FAA guidelines are followed.
4.4.2.2 Table 4 lists the percentage of normals, deutan and protan subjects that fail each ofthe three tests: Ishihara, Dvorine and ALT, according to the FAA criteria. The firstobservation of interest is that the Dvorine test passes the largest number of deutanand protan subjects. The Ishihara is more demanding for both deutan and protansubjects, and all protan subjects fail the ALT test. In the following sections weexamine the correlation between the outcome of each of these tests and thecorresponding PAPI pass / fail scores for the 182 subjects investigated.
No. that pass No.that fail set No. classed as
Applicants 1000 CAD as normals CAD limits safe to fly
Normals 920 920 0 920Deutans 60 0 38 22Protans 20 0 14 6Total 1000 920 52 948
0363035
** % deutan subjects that pass CAD (pass < 6 SNU) = 36.1** % protan subjects that pass CAD (pass < 12 SNU) = 29.8
Percentage of of deutan colour deficients that pass =
Percentage of total colour deficient subjects that pass = Percentage of protan colour deficients that pass =
Predicted outcome per 1000 applicants using CAD pass / fail criteria**
Percentage of applicants that undergo secondary tests =
Page 42May 2009

CAA Paper 2009/04 Minimum Colour Vision Requirements for Professional Flight Crew
Table 4 Percentage of colour deficient observers that fail Ishihara, Dvorine and ALT tests (using FAA pass / fail criteria for the Dvorine and the 24-plate Ishihara test).
4.4.2.3 The contingency tables below (i.e. Table 5) show that only one deutan subject (i.e.less than 1%) passes the Ishihara according to the FAA criterion and fails the PAPI.Not unexpectedly, the same subject also passes the Dvorine test and fails the PAPI.Of equal interest is the observation that 31% of colour deficients (deutan and protan)fail the Ishihara, but pass the PAPI. The results also show that only 24% of the colourdeficients that fail the Dvorine test pass the PAPI. It is also of interest to investigatethe outcome if the ALT were used as a secondary test for those deutan and protanpilot applicants that fail either Ishihara or Dvorine tests using the FAA pass / failcriteria.
Table 5 Contingency tables showing results of Ishihara, Dvorine and ALT tests and the corresponding pass/fail PAPI scores.
090
Percentage of deutans that fail the Ishihara test 81.8 Percentage of normal trichromats that fail the Dvorine plates 0 Percentage of protans that fail the Dvorine test 82.5 Percentage of deutans that fail the Dvorine test 75.3 Percentage of normal trichromats that fail the ALT 0 Percentage of protans that fail the ALT 100 Percentage of deutans that fail the ALT 77.9
Other percentages based on the FAA pass / fail guidelines* Percentage of normal trichromats that fail the Ishihara test Percentage of protans that fail the Ishihara test
*The results listed in the table are based on the FAA pass limits for Ishihara / Dvorine tests (fail equals 7 or more errors). Percentages based on 65 normal trichromats and 117 colour deficients (i.e., 77 deutan and 40 protan subjects). All protans failed the ALT test, but only 60 out of 77 deutans failed the same test (pass classification on the ALT requires no more than one error on 27 trials).
Pass Fail P F P F
Pass 62 3 P 4 0 P 13 1
Fail 0 0 F 16 20 F 20 43
P F P F P F
P 62 3 P 7 0 P 18 1
F 0 0 F 13 20 F 15 43
P F P F P F
P 62 3 P 0 0 P 17 0
F 0 0 F 20 20 F 16 44
Number of subjects that pass/fail each test (i.e., a pass requires less than 7 errors on Ishihara; less than 7 errors on Dvorine; one or no errors on ALT)
Deutans (77)
Protans (40)
Protans (40) Deutans (77)
Deutans (77)
Normals (65)
Normals (65)PAPI
PAPI
ALT
ALT
ALT
Dvo
rine
PAPI PAPI
PAPI
PAPI
Dvo
rine
Dvo
rine
PAPI
Protans (40)
Ishi
hara
PAPI
Ishi
hara
Ishi
hara
PAPINormals (65)
Page 43May 2009

CAA Paper 2009/04 Minimum Colour Vision Requirements for Professional Flight Crew
4.4.2.4 This analysis should strictly be carried out using the applicant’s performance data onthe FALANT test, but in the absence of such data, the ALT test provides the nearest,useful substitute. Findings from a recent study (Cole and Maddocks, 2008) suggestthat some subjects that pass the FALANT lantern test can confuse red and whitesignals and may not therefore perform the PAPI task as well as normal trichromats.Table 6 compares the subjects pass/fail results on Ishihara and Dvorine against thecorresponding pass/fail results on the ALT. The results show that it is possible to passIshihara or Dvorine and then to fail the ALT. In the case of Dvorine, six deutan andseven protan subjects pass the test only to fail the ALT. Interestingly, the reverse tothis also happens. Four deutans that fail the Dvorine pass the ALT and six deutans thatfail the Ishihara also pass the ALT.
Table 6 Pass/fail scores on Ishihara and Dvorine compared against the ALT.
4.4.2.5 These findings reveal clearly the lack of agreement that exists when using differentoccupational colour screening tests and the difficulties involved if one wished to usesuch data to predict performance in other tasks such as the PAPI.
Table 7 Predicted outcome per thousand applicants when using Ishihara, Dvorine and ALT tests.
4.4.2.6 Table 7 shows the predicted outcome per thousand applicants when using Ishihara,Dvorine and ALT tests. Although the FALANT is an accepted FAA alternative test, theALT test (used by FAA for assessing air traffic controllers) was employed in this study.The ALT fails all protan subjects and passes only 16% of deutan applicants. Theresults are of interest since they show clearly that an applicant is most likely to passthe Dvorine test, followed by ALT and Ishihara when only deutan subjects areconsidered. In the case of protan deficiency, an applicant is again most likely to passthe Dvorine followed by Ishihara, but all protans fail the ALT test.
Pass Fail P F P F
Pass 65 0 P 0 4 P 11 3
Fail 0 0 F 0 36 F 6 57
P F P F P F
P 62 0 P 0 7 P 13 6
F 0 0 F 0 33 F 4 54
ALT
Dvo
rine
Dvo
rine
Dvo
rine
Ishi
hara
Ishi
hara
Ishi
hara
Normals (65)ALT
Protans (40)ALT
Deutans (77)
Number of subjects that pass/fail each test (i.e., a pass requires less than 7 errors on Ishihara; less than 7 errors on Dvorine; one or no errors on ALT)
Normals (65)ALT
Protans (40)ALT
Deutans (77)ALT
No. that fail No. that fail No. that fail Safe to fly Safe to fly Safe to fly
Applicants 1000 Ishihara Dvorine ALT Ishihara Dvorine ALT
Normals 920 0 0 0 920 920 920Deutans 60 49 45 47 11 15Protans 20 18 17 20 2 3 0Total 1000 67 62 67 933 938 933
18.3 25.0 21.710.0 15.0 0.016.3 22.5 16.3
Percentage of deutan subjects classed safe to fly according to each testPercentage of protan subjects that are classed safe to flyPercentage of all colour deficient subjects classed safe to fly
Predicted outcome per 1000 applicants using the FAA criteria
13
Page 44May 2009
CAA Paper 2009/04 Minimum Colour Vision Requirements for Professional Flight Crew
5 Conclusions
5.1 The aim of this project was to develop new methods for accurate assessment ofcolour vision and to provide evidence-based guidelines for minimum colour visionrequirements for flight crew. The current diversity in colour vision testing methodsand standards demonstrates the need to adopt more objective assessmenttechniques internationally and to set minimum colour vision requirements that areboth safe and fair to the applicants.
5.2 The CAA/JAA3 guidelines are strict and consequently only 10% of deutan applicantsare classified as safe to fly (see Table 2). The applicants that pass are likely to performthe PAPI task as well as normal trichromats. The current CAA / JAA procedures havesome disadvantages. A large percentage of applicants fail the primary tests and haveto take lengthy secondary tests that vary in various member states. This introducessome variability in that the same subjects can pass some secondary tests and failothers. Some of these subjects may not necessarily be able to carry out the PAPItasks as normal trichromats. Equally important, a large percentage of colour deficientsthat can carry out the safety-critical, colour-related tasks fail the tests and aretherefore unfairly disadvantaged.
5.3 The FAA guidelines are more liberal and, as a result, more colour deficient applicantspass. In the case of Dvorine and Ishihara tests, less than 1% of the applicants thatpass these tests fail the PAPI. All colour deficient applicants that pass the ALT testalso pass the PAPI (see Table 5). The current FAA guidelines also have somedisadvantages. The colour vision tests employed provide only an approximatemeasure of the severity of colour vision loss and the pass / fail limits have not beenvalidated against the PAPI. The FAA accepts 14 different tests (FAA guide for AviationMedical Examiners, 2008). The use of so many tests that may not correlate well witheach other (when used to assess the severity of colour vision loss) increasesvariability and gives rise to odd outcomes when an applicant passes one test and failsanother. Although the number of colour deficient applicants that pass can increasesignificantly, this increase is test specific and often dependent on the use of theSignal Light Gun test that has not been validated against the PAPI task.
5.4 The results also show that one cannot treat as equivalent subjects with deutan- andprotan-like deficiencies. Therefore, minimum colour vision requirements must be setseparately for each class of deficiency.
5.5 The principal findings of this study can be summarised as follows:
• Subjects with red/green congenital colour deficiency can exhibit an almostcontinuous loss of chromatic sensitivity
• The loss of red/green chromatic sensitivity is greater in subjects with protancongenital colour deficiency when compared to the deutan class. Unlike manyconventional colour vision tests, the CAD test cannot be learned and hence theoutcome depends entirely on the subject’s chromatic sensitivity. The test providesthe means to classify protan and deutan subjects and also quantifies the severityof colour vision loss.
• 94% of all applicants are likely to complete the CAD test in less than 20 seconds(using the fast-CAD option) which is based on screening for minimum coloursensitivity in the deutan category. The remaining applicants are expected to failfast-CAD. The definitive-CAD test takes 12 to 15 minutes to complete and provides
3. JAR requirements on this subject are still applicable under EASA, transition of the relevant text to an EASA document isanticipated by 2012.
Page 45May 2009
CAA Paper 2009/04 Minimum Colour Vision Requirements for Professional Flight Crew
the information needed to establish whether the subjects that fail (i.e. ~ 4% of allapplicants) have protan colour deficiency and have residual chromatic sensitivitywithin the established pass limit for protan subjects.
• Below 60 years of age, normal ageing does not affect significantly either RG or YBthresholds, provided adequate levels of ambient illumination are employed.
• Use of a modified “white” light results in significant, overall improvements in PAPIperformance, particularly within normal trichromats and deuteranomalousobservers.
• A comparison between the PAPI and CAD tests shows that deutan subjects withCAD thresholds < 6 SN units and protan subjects with CAD thresholds < 12 SNunits can perform the PAPI test as well as normal trichromats.
• A small number of deutan and protan observers with thresholds higher than 6 and12 SN units, respectively, passed the PAPI test, but these subjects exhibit pooroverall chromatic sensitivity and are therefore likely to be affected unfavourably inother visual performance tasks that involve colour discrimination.
• If these findings were adopted as pass / fail limits for pilots ~ 35% of colourdeficient applicants would be certified as safe to fly.
6 Definitions
(From CIE Publication No. 17.4, 1987; Hunt, 1998; SAE ARP4032, 1998; Wyszecki andStiles, 2000, The Concise Oxford English Dictionary, 1990; JAR-FCL 3, 2002))
Achromatic colour: Colour devoid of hue. (The names white, grey, black, neutral andcolourless are commonly used for these colours.)
Achromatic stimulus: Colour stimulus chosen because it usually yields a colourperception that is devoid of hue under the desired observing conditions.
Adaptation: Visual process whereby approximate compensation is made forchanges in the luminances and colours of stimuli, especially in the case of changes inilluminants.
Additive mixing: Addition of colour stimuli on the retina in such a way that theycannot be perceived individually.
Anomalous trichromat: Person with anomalous trichromatism.
Anomalous trichromatism: Form of trichromatic vision in which colourdiscrimination is less than normal.
Aeromedical Section (AMS): Each JAA Member State will include within itsAuthority one or more physicians experienced in aviation medicine. Such physiciansshall either form part of the Authority, or be duly empowered to act on behalf of theAuthority. In either case they shall be known as the Aeromedical Section (AMS).
Authorised Medical Examiner (AME): Medical Examiners, qualified and licensed inthe practise of medicine, who are authorised by the Authority in each JAA MemberState to carry out aeromedical testing.
Brightness: This is the attribute of a visual sensation according to which an areaappears to exhibit more or less light. It is the perceptual correlate of luminance and,hence, can only be measured via human observations and not via instrumentation.Variations in brightness range from 'bright' to 'dim'.
Chroma: The colourfulness of an area judged in proportion to the brightness of asimilarly illuminated area that appears to be white or highly transmitting.
Page 46May 2009

CAA Paper 2009/04 Minimum Colour Vision Requirements for Professional Flight Crew
Chromatic adaptation: Visual process whereby approximate compensation is madefor changes in the colours of stimuli, especially in the case of changes in illuminants.
Chromatic colour: Colour exhibiting hue (as distinct from those commonly calledwhite, grey, black, neutral and colourless).
Chromatic discrimination: The ability to observe differences between colours.
Chromatic sensitivity: The degree of responsiveness to slight changes in colour.
Chromaticity: Property of a colour stimulus defined by its chromaticity co-ordinates.
Chromaticity co-ordinates: The chromaticity co-ordinates, x,y,z, for a colour are theratios of each tristimulus value of the colour to their sum in the CIE system. Thetristimulus values (X, Y, and Z) are based on the amounts of each of three referencelights needed to make an additive colour mix that will match the colour in question.Since the sum of the chromaticity co-ordinates always equals 1, only two co-ordinatesneed be given to describe a colour. This serves to completely describe twopsychophysical qualities of every colour: dominant wavelength and excitation purity.These correspond to the perceptual qualities of hue and saturation. A third term, theY tristimulus value is the luminance of the colour.
Chromaticity diagram: This is a graphic representation of all possible colours on atwo-dimensional diagram. Using two of the three chromaticity co-ordinates (forexample, x and y in the CIE 1931 system) each colour will plot as a single point on thisdiagram. Colours of similar dominant wavelength and excitation purity (andcorrespondingly similar hue and saturation) will plot close to one another. The morewidely spaced apart two colours are, the more different they will appear from oneanother in terms of hue and saturation. Chromaticity diagrams in the CIE system donot account for luminance and hence two colour stimuli having the same dominantwavelength and excitation purity but different luminances will plot at the same point.(See x,y diagram and CIE 1931 x,y chromaticity diagram.)
Chromaticness: 1.The attribute of a visual sensation according to which the(perceived) colour of an area appears to be more or less chromatic. 2.Chromaticnesshas also been used as an alternative term to colourfulness (obsolete). 3. Perceptualcolour attribute consisting of the hue and saturation of a colour.
CIE: This is an international organization responsible for colorimetry and photometrystandards. The initials stand for: Commission International de l' Eclairage whichtranslates as International Commission on Illumination.
CIE standard illuminant C: An illuminant having the relative spectral powerdistribution intended to represent average daylight.
CIE standard illuminant D65: An illuminant having the relative spectral powerdistribution intended to represent average daylight. This supersedes CIE Illuminant Cas it is intended to be more representative of daylight in the ultra-violet region (Figure6). This is most significant for colours that fluoresce.
CIE standard photometric observer: Ideal observer whose relative spectralsensitivity function conforms to the photopic or scotopic spectral luminous efficiencyfunction.
CIE 1931 x,y chromaticity diagram: (see x,y diagram and Chromaticity diagram)
CIE 1931 standard colorimetric observer: Ideal observer whose colour matchingproperties correspond to the CIE colour-matching functions for the 2° field size.
Colorimetric purity, pc: Quantity defined by the expression pc=Ld/(Ld+Ln) where Ldand Ln are the respective luminances of the monochromatic stimulus and of aspecified achromatic stimulus that match the colour stimulus considered in anadditive mixture. (In the case of purple stimuli, the monochromatic stimulus is
Page 47May 2009

CAA Paper 2009/04 Minimum Colour Vision Requirements for Professional Flight Crew
replaced by a stimulus whose chromaticity is represented by a point on the purpleboundary.)
Colour: This is that aspect of visual perception by which an observer may distinguishdifferences between two structure-free fields of view of the same size and shape,such as may be caused by differences in the spectral composition of the radiantenergy concerned in the observation. In this sense, the term colour is sometimesreferred to as perceived colour to distinguish it from colour used in the sense ofpsychophysical colour.
Psychophysical colour is specified by the tristimulus values of the radiant power(colour stimulus) entering the eye.
Colour constancy: Effect of visual adaptation whereby the appearance of coloursremains approximately constant when the level and colour of the illuminant arechanged.
Colour-matching functions: The tristimulus values, with respect to three givenprimary colour stimuli, of monochromatic stimuli of equal radiance, regarded asfunctions of the wavelength.
Colour stimulus: Radiant power of given magnitude and spectral composition,entering the eye and producing a sensation of colour.
Colour temperature: The temperature of a Planckian radiator whose radiation hasthe same chromaticity as that of a given stimulus. Tc, Unit Kelvin, K
Colour vision deficiencies: This is a decreased ability to discriminate and identifycertain colours, relative to the normal observer. It varies in form according to theparticular colours that are confused and in severity according to the magnitude ofcolour differences that cannot be discriminated. It is usually inherited, but may alsoresult from the effects of disease, drugs, and ageing. Reduced sensitivity to light ofcertain colours is sometimes involved.
Colour vision deficiencies are categorised in terms of their impact on colour-matchingand colour-discrimination performance. The population can be divided into threegroups: trichromats, dichromats, and monochromats. Monochromats are extremelyrare and can only discriminate brightness differences. The colour confusions whichdichromats make are severe. There are two main types of dichromats: those thatconfuse colours along the red/green axis of the chromaticity diagram, and those thatconfuse colours along the blue/yellow axis. Trichromats can be divided into normaltrichromats who have normal colour vision, and anomalous trichromats who havereduced colour discrimination ability falling between normal trichromats and thedichromats. Anomalous trichromats may also be categorised as red/green or blue/yellow types according to their patterns of colour confusion and may be furthercategorised according to the severity of their deficiency that may range from mild(near-normal colour discrimination ability) to severe (near-dichromatic levels of colourconfusion). Twenty-five percent of red/green deficients, both dichromats andanomalous trichromats, have a marked loss of sensitivity to red light.
Inherited colour vision deficiency affects approximately 8% of the male and 0.4% ofthe female populations. Approximately 3% of private pilots, 2% of commercial pilots,and 1% of airline transport pilots are known to have some type of colour visiondeficiency (SAE ARP4032, 1998). Over 99.9% of inherited colour vision deficienciesare of the red/green type. Almost all colour deficient pilots would, therefore, beexpected to have deficiencies of the red/green type. Acquired colour visiondeficiencies are of unknown frequency in the population. They are more often of ablue/yellow than the red/green type, may be temporary, and are those due to disease
Page 48May 2009

CAA Paper 2009/04 Minimum Colour Vision Requirements for Professional Flight Crew
and drug effects. They are usually associated with a significant visual acuity loss. Age-related deficiencies are often associated with reduced sensitivity to blue light.
Colour vision tests: These are examinations that investigate the ability of a personto see colour and how they perceive it. There are several different types of tests, fromlaboratory-based tests, to clinical and occupational. They all have different test criteriaand purposes. Some tests are used simply for screening, so just differentiatingbetween normal and colour deficient people, others test how certain colours areperceived through colour naming or colour organization, whilst a few actually grade,classify and define the type of colour vision a person has.
Colourfulness: Attribute of a visual sensation according to which an area appears toexhibit more or less of its hue.
Complementary colour stimulus: Two colour stimuli are complimentary when it ispossible to reproduce the tristimulus values of a specified achromatic stimulus by anadditive mixture of these two stimuli.
Complementary wavelength: The wavelength of the monochromatic stimulus that,when additively mixed in suitable proportions with the colour stimulus considered,matches the specified achromatic stimulus.
Every colour stimulus has either a complementary wavelength or a dominantwavelength. Some, but not all, colour stimuli have both.
Cones: Photoreceptors in the retina that contain light-sensitive pigments(photopigments) capable of initiating the process of photopic vision. There are threetypes: L-cones ('red'), M-cones ('green') and S-cones ('blue').
Congenital red/green colour defect: Inherited form of colour vision deficiencycausing confusion of colours along the red/green axis of the chromaticity diagram.The deficiency is connected to the X-chromosome so is passed down through thefemale line. The defect only becomes apparent when the full compliment of X-chromosomes is affected so it is predominant in males (who only have one X-chromosome) and females (who have two X-chromosomes) are usually only carriers.(See Red/green colour vision deficiencies - congenital.)
Contrast:
Chromatic: the chromaticity difference between two areas such as a symbol and itsbackground. This includes the difference in dominant wavelength and excitationpurity between two colours.
Luminance: the relative luminance difference between two areas. It can be definedin several different ways.
Dark: Adjective denoting low lightness.
Daylight illuminant: Illuminant having the same, or nearly the same, relative spectralpower distribution as a phase of daylight.
Defective colour vision: Abnormal colour vision in which there is a reduced ability todiscriminate some or all colours (see Colour vision deficiencies).
Deutan: Adjective denoting deuteranopia or deuteranomaly.
Deuteranomalous trichromats: Person with deuteranomaly.
Deuteranomaly: Congenital defective colour vision in which discrimination of thereddish and greenish contents of colours is reduced, without any colours appearingabnormally dim. The M-cone ('green') is abnormal.
Deuteranope: Person with deuteranopia.
Page 49May 2009

CAA Paper 2009/04 Minimum Colour Vision Requirements for Professional Flight Crew
Deuteranopia: Congenital defective colour vision in which discrimination of thereddish and greenish contents of colours is absent, without any colours appearingabnormally dim. The M-cone ('green') is missing.
Dichromat: Person with Dichromatism.
Dichromatism: Defective colour vision in which all colours can be matched usingadditive mixtures of only two matching stimuli. One of the three cone types ismissing.
Dim: Adjective denoting low brightness.
Dominant wavelength: The wavelength of the monochromatic stimulus that, whenadditively mixed in suitable proportions with the specified achromatic stimulus,matches the colour stimulus considered. Dominant wavelength correlates with thehue of a colour. It is the spectrum colour one would mix with the reference white inorder to make a colour match. Spectrum colours are those colours that are producedby passing white light through a prism and appear on the boundaries of the CIEchromaticity diagrams.
Efficiency: The efficiency of a colour vision test is its overall predictive value.
Equal energy white: Stimulus consisting of equal amounts of power per smallconstant-width wavelength interval throughout the spectrum.
Excitation purity: The excitation purity of a colour stimulus is the ratio of two lengthson a chromaticity diagram. The first length is the distance between the pointrepresenting the chromaticity of a specified achromatic stimulus and thatrepresenting the chromaticity of the colour stimulus considered; the second length isthe distance along the same direction and in the sense from the first point to the edgeof the chromaticity diagram.
Fluorescence: Process whereby materials absorb radiant power at one wavelengthand immediately re-emit it at another (usually longer) wavelength.
Fovea: Central part of the retina that contains almost exclusively cones, and formingthe site of most distinct vision. It subtends an angle of about 1.5° in the visual field.
Foveola: Central region of the fovea that contains only L- and M-cones and is limitedto a diameter of about 0.3 mm; it subtends an angle of about 1° in the visual field
High-ambient lighting conditions: The maximum ambient illumination in a transportaircraft flight deck is at least 86,000 lux, while in a bubble-canopy aircraft the value isat least 107,500 lux. These figures, of course, are mediated by such factors as sunaltitude, transmittance of the windshields or canopy and angle of incidence of light tothe display.
Hue: Attribute of a visual sensation according to which an area appears to be similarto one, or to proportions of two, of the perceived colours red, yellow, green and blue.Hue is independent of both saturation and brightness.
Illuminance: A measure of the amount of light incident at a point of a surface. Thiscan be measured by instrumentation. The SI units are lumens per square meter (lux),abbreviated as Ix.
Intensity: 1. Luminous intensity - luminous flux per unit solid angle, the SI unit oflight. Unit: candela, cd. 2. General term used to indicate the magnitude of a variable.
Isomeric matching colour stimuli: Colour stimuli that look exactly the same andhave identical spectral composition and tristimulus values.
L-cones: Long wavelength cones. Commonly referred to as 'red' photoreceptors.
Page 50May 2009

CAA Paper 2009/04 Minimum Colour Vision Requirements for Professional Flight Crew
Light: 1. That aspect of radiant energy of which a human observer is aware throughthe visual sensations that arise from the stimulation of the retina of the eye by theradiant energy. 2. Adjective denoting high lightness.
Lightness: The attribute of a visual sensation according to which the area in whichthe visual stimulus is presented appears to emit more or less light in proportion to thatemitted by a similarly illuminated area perceived as a "white" stimulus. In a sense,lightness may be referred to as relative brightness. Variations in lightness range from'light' to 'dark'.
Luminance: The amount of light emitted, transmitted or reflected from a display, lightsource, or other object. It can be measured by instrumentation. The SI units arecandelas per square metre (cdm-2).
Luminous efficiency: Ratio of radiant flux weighted according to the V(l) function, tothe radiant flux.
M-cones: Medium wavelength cones. Commonly referred to as 'green'photoreceptors.
Macula (macula pigment): Layer of photostable pigment covering parts of the retinain the foveal region. Wide variation of density from person to person.
Maxwellian View: A special kind of viewing that occurs when a visual instrumentprojects an image onto the retina by first focusing the light into a small portion of theeye's pupil. In order to examine visual function without the normal optical limitationsimposed by diffraction and aberrations of the eye, clinical optometrists and visionscientists have adopted and modified the technique known as Maxwellian view.Diffraction effects are avoided by focusing all of the light into a small spot that fits wellwithin the pupil of the eye.
Mesopic vision: Vision intermediate between photopic and scotopic vision. (Both thecones and rods are active to differing degrees depending on the level of mesopic lightadaptation.)
Metameric matching colour stimuli: Spectrally different colour stimuli that haveidentical tristimulus values so look exactly the same.
Monochromat: Observer who is completely unable to discriminate stimuli by theircolour. Two or all of the three cone types are missing.
Monochromatic (radiation) stimulus: Monochromatic radiant power of givenmagnitude and single wavelength (or frequency), entering the eye and producing asensation of light or colour. (See Spectrum colours (spectrum)).
Monochromatism: Defective colour vision in which all colours can be matched usingonly a single matching stimulus.
Munsell system: A colour order system.
Nanometre, nm: Very small unit of length equal to 10-9 metre commonly used foridentifying wavelengths of the spectrum.
Neuron: Nerve cell.
Neutral colours: Adjective for all colours with x,y, chromaticity co-ordinates along thestraight line on the CIE 1931 chromaticity diagram that joins the neutral point with thepurple boundary, through the white used for the match. As long as there is noperceived lightness difference, all these colours look the same as each other and thesame as neutral grey.
Neutral point: This is the spectral wavelength that matches equal energy white forcolour deficients. Further specified by the colour temperature of the white light usedfor the match.
Page 51May 2009
CAA Paper 2009/04 Minimum Colour Vision Requirements for Professional Flight Crew
Non-self-luminous colour stimulus: Stimulus that consists of an illuminated object,which does not produce light.
Normal trichromats: Person with normal colour vision.
Normal colour vision: The ability that the majority (92%) of the population have ofseeing and interpreting colour.
Optical axis (of the eye): The direction defined by a line passing through the opticalelements of the eye.
Photometer: Optical radiation detector constructed to mimic the spectral responseof the eye.
Photometry: Photometry is the measurement of light, which is defined aselectromagnetic radiation which is detectable by the human eye. It is thus restrictedto the wavelength range from about 360 to 830 nanometres. Photometry is just likeradiometry except that everything is weighted by the spectral response of the eye (Vland V'l function). Visual photometry uses the eye as a comparison detector, whilephysical photometry uses either optical radiation detectors constructed to mimic thespectral response of the eye, or spectroradiometry coupled with appropriatecalculations to do the eye response weighting. Typical photometric units includelumens (luminous flux), lux (illuminance), candelas (luminous intensity).
Photon: A quantum of light or of other electromagnetic radiation.
Photopic vision: Vision by the normal eye when it is adapted to levels of luminanceof at least several candelas per square metre (daylight). (The cones are the principlephotoreceptors that are active in photopic vision.)
Photoreceptors: Light receptors in the retina of the eye; either rods or cones.
Photopigments (light-sensitive pigments): Pigments in the photoreceptors. Thereare three types of cone photopigments. It is the interaction of these pigments andlight that initiates the visual process.
Power: Energy per unit time.
Primary colour stimuli (primaries): Colour stimuli by whose additive mixture nearlyall other colour stimuli may be completely matched in colour. These colour stimuli areoften chosen to be either red, green, and blue, or red, green, and violet.
Primary visual cortex: A region at the back of the brain to which all visual informationis initially sent for basic processing e.g. shape, before being sent on to other regionsfor more specialised processing, e.g. colour and motion.
Protan: Adjective denoting protanopia or protanomaly.
Protanomaly (protanomalous trichromatism): Congenital defective colour visionin which discrimination of the reddish and greenish contents of colours is reduced,with reddish colours appearing abnormally dim. The L-cone ('red') is abnormal.
Protanope: Person with protanopia.
Protanopia: Congenital defective colour vision in which discrimination of the reddishand greenish contents of colours is absent, with reddish colours appearing abnormallydim. The L-cone ('red') is missing.
Purity: A measure of the proportions of the amounts of the monochromatic stimulusand of the specified achromatic stimulus that, when additively mixed, match thecolour stimulus considered. (In the case of purple stimuli, the monochromaticstimulus is replaced by a stimulus whose chromaticity is represented by a point onthe purple boundary.)
Page 52May 2009

CAA Paper 2009/04 Minimum Colour Vision Requirements for Professional Flight Crew
Purple boundary: The line in a chromaticity diagram that represents additive mixtureof monochromatic stimuli from the two ends of the spectrum, according towavelengths of approximately 380 and 780 nm.
Purple stimulus: Stimulus that is represented in any chromaticity diagram by a pointlying within the triangle defined by the point representing the specified achromaticstimulus and the two ends of the spectral locus, which correspond approximately tothe wavelengths 380 and 780 nm.
Radiometry: The measurement of optical radiation, which is electromagneticradiation within the frequency range between 3×10¹¹ and 3×10¹⁶ Hz. This rangecorresponds to wavelengths between 10 and 106 nanometres (nm), and includes theregions commonly called the ultraviolet, the visible and the infrared. Two out of manytypical units encountered are watts/m2 (irradiance) and watts/steradian (radiantintensity).
Radiant: Adjective denoting measures evaluated in terms of power.
Rayleigh match: Involves matching a spectral (or nearly spectral) yellow light to amixture of spectral (or nearly spectral) red and green lights. Although only twoprimaries are used, a perfect match can be achieved. The primaries and test lightoccur at wavelengths to which the S-cone photopigment is not sensitive. As only twophotopigments (M-cones and L-cones) are active, for normal colour vision, only twoprimaries are required. This Rayleigh match system differentiates normal trichromatsfrom observers with all types of congenital red/green colour defect and allowsclassification of congenital red/green defects and is used in instruments such as theNagel anomaloscope.
Red/green colour vision deficiencies - congenital: Group term for protan anddeutan deficiencies. The most common defects of colour vision, they share acommon mode of inheritance and similar colour confusions in the red-yellow-greenrange. (See Congenital red/green colour defects.)
Redundant coding: The repetition of information provided in one code by anothercode. Values of the two codes can be correlated with each other either totally orpartially. A multidimensional display combining numeric and colour codes provides agood example of redundant coding. If the numeric code consists of the digits onethrough six and the colour code consists of six different colours, then the uniqueassignment of one of the six colours to each of the six digits would produce completeredundancy. Knowing either the digit or the colour would provide completeinformation. However, if only three colours were used and each colour was assignedto two of the six digits, then the colour code would be only partially redundant withthe numeric code. Knowledge of the colour of a symbol would only constrain therange of possible numeric values, thus providing only partial information as to theexact numeric value.
Reflection: Return of radiation by a medium without change of frequency (that iswithout fluorescence).
Relative spectral power distribution: Spectral power per small constant-widthwavelength interval throughout the spectrum relative to a fixed reference value.
Retina: Light sensitive layer on the inside of the back of the eye; it contains thephotoreceptors and nerve cells that transmit the visual signals to the optic nerve.
Rods: Photoreceptors in the retina that contain a light-sensitive pigment(photopigment) capable of initiating the process of scotopic vision.
S-cones: Short wavelength cones. Commonly referred to as 'blue' photoreceptors.
Page 53May 2009

CAA Paper 2009/04 Minimum Colour Vision Requirements for Professional Flight Crew
Saturation: Colourfulness of an area judged in proportion to its brightness. Theattribute of a visual sensation that permits a judgment to be made of the degree towhich a chromatic stimulus differs from an achromatic stimulus regardless of theirbrightness.
Scotopic vision: Vision by the normal eye when it is adapted to levels of luminanceless than some hundredths of a candela per square metre (darkness). (The rods arethe principle photoreceptors that are active in scotopic vision.)
Self-luminous colour stimulus: Stimulus that produces its own light.
Sensitivity: The sensitivity of a colour vision test is the percentage of colour deficientsubjects correctly identified as such.
Signal: Information conveyed to the brain, usually in a prearranged or recognisableformat, e.g. visual, colour (chromatic) and audio signals are forms of information thatthe brain can interpret as having a certain meaning, from simply recognising whatcolour something is, to that colour having a certain meaning attached to it, such asred meaning danger.
Signal light: Light used in transport systems for conveying information to theobserver. as defined by the CIE standards 0.2.2, 1975 and the updated S004/E-2001,2001. These standards specify 'the allowable colours for steady signal lights andflashing signal lights where the duration of the on period is at least one second'. Theyare 'applicable to the colours of signal lights used in sea, road, air and rail transportsystems including signal lights on ships, aircraft, motor vehicles and trains, where therecognition of colour is essential.' The standards 'can also be used for guidance onthe selection of the colours of light signals and warning lights on instrument panels invehicles and the colours used in visual display terminals when recognition of thecolour code is important to interpreting the information displayed.' (CIE S004/E-2001,2001)
Specificity: The specificity of a colour vision test is the percentage of normal colourvision subjects correctly identified as such.
Spectral: Adjective denoting that monochromatic concepts are being considered.
Spectral hues: Monochromatic stimuli throughout the spectrum represented as thespectral locus in a CIE chromaticity diagram. (See spectrum colours.)
Spectral locus: Locus in a chromaticity diagram of the points that representmonochromatic stimuli throughout the spectrum. (See spectrum colours and spectralhues.)
Spectral luminous efficiency, V(λ), V'(λ): Weighting functions used to derivephotometric measures from radiometric measures in photometry. Normally the V(λ)function is used, but, if the conditions are such that the vision is scotopic, the V'(λ)function is used and the measures are then distinguished by the adjective 'scotopic'and the symbols by the superscript '.
Spectral power distribution: Spectral power per small constant-width wavelengthinterval throughout the spectrum.
Spectrum colours (spectrum): Those colours that are produced by passing whitelight through a prism and appear on the boundaries (spectral locus) of the CIEchromaticity diagrams. (See monochromatic stimulus and spectral hues.)
Stimulus: A thing that evokes a specific functional reaction in an organ or tissue(usually a visual stimulus in this report).
Page 54May 2009

CAA Paper 2009/04 Minimum Colour Vision Requirements for Professional Flight Crew
Subtractive mixing of colorants: Production of colours by mixing colorants in sucha way that they each subtract light from some parts of the spectral power distributionused to illuminate them.
Système International d'Unités: International System of Units (internationalabbreviation SI), for the recommended practical system of units of measurement. Thebase units are a choice of seven well-defined units that by convention are regardedas dimensionally independent: the metre, the kilogram, the second, the ampere, thekelvin, the mole, and the candela. Derived units are those formed by combining baseunits according to the algebraic relations linking the corresponding quantities. Thenames and symbols of some of the units thus formed can be replaced by specialnames and symbols which can themselves be used to form expressions and symbolsof other derived units.
Trichromatic matching: Action of making a colour stimulus appear the same colouras a given stimulus by adjusting three components of a colour mixture.
Tristimulus values: Amounts of the three additive matching stimuli (see Additivemixing), in a given trichromatic system, required to match or to specify the stimulusconsidered.
Tritan: Adjective denoting tritanopia or tritanomaly.
Tritanomaly: Congenital defective colour vision in which discrimination of the bluishand yellowish contents of colours is reduced. The S-cone ('blue') is abnormal.
Tritanopia: Congenital defective colour vision in which discrimination of the bluishand yellowish contents of colours is absent. The S-cone ('blue') is missing.
Unique hues: Hues that cannot be further described by the use of hue names otherthan its own (also referred to as unitary hue). There are four unique hues, each ofwhich shows no perceptual similarity to any of the others; they are: red, green,yellow, and blue. A light (colour stimulus) perceived to be unique red is judged to beneither yellow nor blue. Similarly, unique yellow is neither red nor green; unique greenis neither yellow nor blue; and unique blue is neither green nor red. The hueness of alight (colour stimulus) can be described as combinations of two unique hues; forexample, orange is yellowish-red or reddish-yellow. Sometimes, non-unique huessuch as orange are referred to as binary hues.
V(λ) function: Weighting function used to derive photometric measures fromradiometric measures in photometry.
V'(λ) function: Weighting function used to derive scotopic photometric measuresfrom radiometric measures in photometry.
Visual axis: The direction defined by a line joining the centre of the fovea to thecentre of the pupil of the eye; the visual axis is offset from the optical axis of the eyeby about 4°.
Wavelength: The distance between two successive points of a periodic wave in thedirection of propagation in which the oscillation has the same phase. The wavepropagates a distance equal to one wavelength during every period. Thus, the productof wavelength and frequency is equal to the velocity of the wave.
Whiteness: Attribute of a visual sensation according to which an area appears tocontain more or less white content.
x,y diagram: Chromaticity diagram in which the x,y chromaticity co-ordinates of theCIE XYZ system are used. (See CIE 1931 x,y chromaticity diagram.)
Page 55May 2009

CAA Paper 2009/04 Minimum Colour Vision Requirements for Professional Flight Crew
7 Acknowledgements
We thank Dr A. Evans (ICAO), Dr H. Courteney (CAA) and Dr N. Milburn (FAA) for theirsupport with many aspects of this investigation. We also wish to acknowledge thevaluable contribution each of the persons listed below has made to the projectthrough progress review meetings and valuable criticism and comments on the finalreport:
Ms J. Birch City University, UK
Mr A. Chorley CAA, UK
Dr D. Connolly Qinetiq Ltd., UK
Dr H. Courteney CAA, UK
Dr A. Evans ICAO, Canada
Mr S. Griffin CAA, UK
Mr A. Harlow City University, UK
Dr I. Moorhead Qinetiq Ltd., UK
Ms M. O’Neill-Biba City University, UK
Dr J. Pitts CAA, UK
Dr R. Scott RAF, UK
Mr S. Williams CAA, UK
Page 56May 2009

CAA Paper 2009/04 Minimum Colour Vision Requirements for Professional Flight Crew
8 References
Alpern, M. (1979). Lack of uniformity in colour matching. J Physiol 288, 85-105.
Alpern, M. & Pugh, E. N., Jr. (1977). Variation in the action spectrum of erythrolabeamong deuteranopes. J Physiol 266, 613-646.
Barbur, J. L., Rodriguez-Carmona, M., Harlow, J. A., Mancuso, K., Neitz, J., & Neitz,M. (2008). A study of unusual Rayleigh matches in deutan deficiency. VisualNeuroscience 25, accepted for publication.
Barbur, J. L. (2003). Understanding colour -Normal and Defective Colour Vision.Trends Cogn Sci. 7, 434-436.
Barbur, J. L. (2004). 'Double-blindsight' revealed through the processing of color andluminance contrast defined motion signals. Prog.Brain Res 144, 243-259.
Barbur, J. L., Cole, V. A., & Plant, G. T. (1997). Chromatic discrimination in subjectswith both congenital and acquired colour vision deficiencies. In Colour visiondeficiencies XIII, ed. Cavonius C.R., pp. 211-223. Kluver Academic Publishers,Dordrecht, Netherlands.
Barbur, J. L., Harlow, A. J., & Plant, G. T. (1994). Insights into the different exploits ofcolour in the visual cortex. Proc.R.Soc.Lond B Biol.Sci. 258, 327-334.
Barbur, J. L., Rodriguez-Carmona, M., & Harlow, A. J. (2006). Establishing thestatistical limits of 'Normal' chromatic sensitivity. CIE Expert Symposium, CIEProceedings 75 Years of the Standard Colorimetric Observer.
Belcher, S. J., Greenshields, K. W., & Wright, W. D. (1958). Colour vision survey usingthe Ishihara, Dvorine, Bostrom and Kugelberg, Bostrom, and American-Optical Hardy-Rand-Rittler tests. Br J Ophthalmol 42, 355-359.
Birch, J. (1997). Efficiency of the Ishihara test for identifying red-green colourdeficiency. Ophthalmic.Physiol.Opt. 17, 403-408.
Carroll, J., Neitz, J., & Neitz, M. (2002). Estimates of L:M cone ratio from ERG flickerphotometry and genetics. J.Vis. 2, 531-542.
CIE. Colours of Light Signals. Report S 004/E-2001. CIE Central Bureau, Vienna,Austria. 2001a
CIE. International recommendations for color vision requirements for transport.Report 143. International Commission on Illumination, CIE technical report, Vienna,Austria. 2001b
Civil Aviation Authority, Safety Regulation Group. CAP 168 - Licensing of Aerodromes.Chapter 6, 2004
Civil Aviation Authority, Safety Regulation Group. Minimum colour vision requirementfor professional Flight Crew - Part 1 The use of colour signals and the assessment ofcolour vision requirements in aviation. Paper 2006/04. 2006a
Civil Aviation Authority, Safety Regulation Group. Minimum colour visionrequirements for professional Flight Crew - Part 2 Task Analysis. Paper 2006/04.2006b
Cole, B. L. (1993). Does defective colour vision really matter? In Colour visiondeficiences XI, ed. Drum, B., pp. 67-86. Kluwer Academic, Dordrecht.
Cole, B. L. (2004). The handicap of abnormal colour vision. Clin.Exp.Optom. 87, 258-275.
Page 57May 2009

CAA Paper 2009/04 Minimum Colour Vision Requirements for Professional Flight Crew
Cole, B. L. & Maddocks, J. D. (1995). Protans and PAPI: Recognition of a two colourcode by persons with defective colour vision. In Colour Vision Deficiencies XII, ed.Drum, B., pp. 501-510. Kluwer Academic Publishers, Dordrecht, Netherlands.
Cole B. L, Maddocks J. D. (2008). Color vision testing by Farnsworth lantern andability to identify approach-path signal colors. Aviat Space Environ Med, 79, 585-590.
Federal Aviation Administration, Version V of the Guide for Aviation MedicalExaminers (2008). Examination techniques and criteria for qualification, Item 52: ColorVision. http://www.faa.gov/about/office_org/headquarters_offices/avs/offices/aam/ame/guide/app_process/exam_tech/item52/et/
Firth, J. Colour vision concerns in aviation, clinical concerns on colour coding inaviation. NATO, RTO Technical Report 16. Operational Colour Vision in ModernAviation Environment. 2001
Frey, R. G. (1958). Most suitable pseudoisochromatic table for practice. Comparativestudies on applicability of Bostrom, Bostrom-Kugelber, Hardy-Rand-Ritter, Ishihara,Rabkin and Stilling tables. Albrecht.Von.Graefes Arch.Ophthalmol 160, 301-320.
Heath, G. & Schmidt, I. (1959). Signal color recognition by color defective observers.Am J Optom.Arch Am Acad.Optom. 36, 421-427.
ICAO. Review of the visual and colour perception requirements for medicalcertification. ANC Task No. MED-9601. 11-1-1999
International Civil Aviation Organization. Technical airworthiness manual. (2nd ed.-1987 Document 9051-AN/896), Amendment 10. Montreal, Quebec, Canada. 1988
International Civil Aviation Organization (ICAO). International Standards andRecommended Practices. Annex 1 to the convention on International Civil Aviation -Personnel Licensing. 10th ed. 2006.
JAR-FCL 3. Flight Crew Licensing (Medical). Section 2 Subparts A, B and C - JAAManual of Civil Aviation Medicine. Chapter 17. 2000
JAR-FCL 3. Flight Crew Licensing (Medical). Section 1 Subpart B - Class 1 MedicalRequirements. (Amendment 2). 2002
Milburn, N. J. and Mertens, H. W. Predictive validity of the Aviation Lights Test fortesting pilots with color vision deficiencies. DOT/FAA/AM-04/14. 2004
National Research Council-National Academy of Sciences, Committee on Vision.Procedures for testing color vision. Report of working group 41. Washington, DC.1981
National Transportation Safety Board. FedEx Boeing 727 crashed during landing atTallahassee, Florida. Safety recommendation: NTSB/AAR-04/02. 2004
Neitz, J. & Jacobs, G. H. (1986). Polymorphism of the long-wavelength cone in normalhuman colour vision. Nature 323, 623-625.
Rodriguez-Carmona, M. (2006). Variability of chromatic sensitivity: fundamentalstudies and clinical applications. PhD thesis, City University, London, UnitedKingdom.
Rodriguez-Carmona, M., Harlow, A. J., Walker, G., & Barbur, J. L. (2005). TheVariability of Normal Trichromatic Vision and the Establishment of the 'Normal' Range.Proceedings of 10th Congress of the International Colour Association, Granada(Granada, 2005) 979-982.
Page 58May 2009

CAA Paper 2009/04 Minimum Colour Vision Requirements for Professional Flight Crew
Sharpe, L. T., Stockman, A., Jagle, H., & Nathans, J. (1999). Opsin genes, conephotopigments, color vision, and color blindness. In Color Vision: from genes toperception, eds. Gegenfurtner, K. R. & Sharpe, L. T., pp. 3-52. Cambridge UniversityPress, Cambridge.
Sloan, L. L. & Habel, A. (1956). Tests for color deficiency based on thepseudoisochromatic principle; a comparative study of several new tests.AMA.Arch.Ophthalmol 55, 229-239.
Squire, T. J., Rodriguez-Carmona, M., Evans, A. D. B., & Barbur, J. L. (2005). Colorvision tests for aviation: comparison of the anomaloscope and three lantern types.Aviat.Space Environ.Med. 76, 421-429.
U.S.Department of Transportation - federal Aviation Administration. Federal aviationregulations. Part 23, Sec 23.1397. Washington, DC. 1988
Vingrys, A. J. & Cole, B. L. (1986). Origins of colour vision standards within thetransport industry. Ophthalmic Physiol Opt 6, 369-375.
Vingrys, A. J. & Cole, B. L. (1993). The ability of colour vision defective observers torecognise an optimised set of red, green and white signals lights. In Colour VisionDeficiencies XI, ed. Drum, B., pp. 87-95. Kluwer Academic Publishers, Dordrecht,Netherlands.
Wright, W. D. (1946). Researches on Normal and Defective Colour Vision, HenryKimpton, London.
Page 59May 2009

INTENTIONALLY LEFT BLANK