the institutional effects of incarceration: spillovers...
TRANSCRIPT

Original Investigation
The Institutional Effects of Incarceration:Spillovers From Criminal Justice to Health
Care
JASON S CHNITTKER, ∗ CHRI STOPHER UGGEN, †
SARAH K .S . SHANNON, ‡
and S UZY M AVES MCELRATH †
∗University of Pennsylvania; †University of Minnesota; ‡University of Georgia
Policy Points:
� The steady increase in incarceration is related to the quality and func-tioning of the health care system. US states that incarcerate a largernumber of people show declines in overall access to and quality of care,rooted in high levels of uninsurance and relatively poor health of formerinmates.
� Providing health care to former inmates would ease the difficultiesof inmates and their families. It might also prevent broader adversespillovers to the health care system.
� The health care system and the criminal justice system are related inreal but underappreciated ways.
Context: This study examines the spillover effects of growth in state-levelincarceration rates on the functioning and quality of the US health care system.
Methods: Our multilevel approach first explored cross-sectional individual-level data on health care behavior merged to aggregate state-level data regardingincarceration. We then conducted an entirely aggregate-level analysis to addressbetween-state heterogeneity and trends over time in health care access andutilization.
Findings: We found that individuals residing in states with a larger numberof former prison inmates have diminished access to care, less access to special-ists, less trust in physicians, and less satisfaction with the care they receive.These spillover effects are deep in that they affect even those least likely to
The Milbank Quarterly, Vol. 93, No. 3, 2015 (pp. 516-560)c© 2015 Milbank Memorial Fund. Published by Wiley Periodicals Inc.
516

The Institutional Effects of Incarceration 517
be personally affected by incarceration, including the insured, those over 50,women, non-Hispanic whites, and those with incomes far exceeding the federalpoverty threshold. These patterns likely reflect the burden of uncompensatedcare among former inmates, who have both a greater than average need forcare and higher than average levels of uninsurance. State-level analyses solidifythese claims. Increases in the number of former inmates are associated simul-taneously with increases in the percentage of uninsured within a state and in-creases in emergency room use per capita, both net of controls for between-stateheterogeneity.
Conclusions: Our analyses establish an intersection between systems of careand corrections, linked by inadequate financial and administrative mechanismsfor delivering services to former inmates.
Keywords: spillover, incarceration, health care.
B y now the consequences of incarceration are wellestablished for former inmates,1,2 their families,3-5 and groupssuch as African American males.6 This research rightly em-
phasizes the extreme concentration of incarceration among an alreadysegregated, disadvantaged, and underserved population. Incarcerationis, indeed, more common among African American males with low lev-els of education, and they suffer most of the damage of incarceration.6,7
Furthermore, former inmates return to a relatively small number ofcommunities, meaning that most of the collateral consequences of in-carceration remain localized, even when severe.8-10 But no matter howaccurate the focus on concentration, segregation, and the persistence ofdisadvantage may be, it implicitly casts incarceration as a problem onlyfor the relatively small circle of people immediately surrounding pris-oners. Even the strongest moral case against mass incarceration relieson observations of this sort, as when some argue that incarceration isiatrogenic in increasing crime in neighborhoods where crime already iscommon.8
In contrast, in this article we ask how incarceration affects the healthcare system as a whole: not the health of individual inmates or theirfamilies, but the broader functioning of the health care system availableto everyone. By following in a line of research addressing ties betweenthe prison system and other social systems, we assess the broader socialcosts of incarceration. Other researchers have shown far-reaching effectsof incarceration on labor market and political institutions. For example,
518 J. Schnittker et al.
Western and Beckett11 showed that high rates of criminal punishmentcan reduce the unemployment rate in the short term while raising it inthe long term, thereby characterizing the prison system as a labor marketinstitution. Similarly, Uggen and Manza12 showed how rising rates ofpunishment and felon voting restrictions have affected elections, tiltingthe partisan balance in the US Senate by diluting the voting strength ofalready underrepresented groups.
Like labor markets and politics, the health care system is a foun-dational institutional setting, with great complexity, generally widegeographic service areas, and critical importance to the functioning ofsociety. The health care system also, of course, provides a sharp contrast tothe prison system: the mandate and jurisdiction of the 2 systems are verydifferent, and few would consider the two as residing in the same sectoror sharing the same concerns.4 Yet consideration of the health care systemis essential to evaluating the total social costs of incarceration13 and, onthe flip side, to recognizing the social currents that affect medicine. Likeother consequences of incarceration, the spillover effects on health carethat we document in this article are hidden from mainstream society—perhaps even more so because they are beyond the purview of any oneinstitution—but they are nonetheless quite powerful. Although formerinmates and their families certainly suffer the most with respect to healthcare, their situation also affects the care of those far removed from them.
Background
Spillover effects occur when the behavior of some members of a com-munity affect the situation of others. By bridging individuals and insti-tutions, a spillover effect is similar to a neighborhood effect, in whichresidence in a defined geography affects the individuals there throughcollective processes, such as peer-group influence or socialization.14 Insetting the stage for a health care spillover, we thus must consider boththe social context of incarceration and the relationship between the be-havior of individual health care consumers and the functioning of theorganizations that serve them. Several processes are relevant, includingthe effects of incarceration on health, health care in prison settings, andthe availability of health services outside prison. Financial mechanismsare also important to understanding potential spillovers, including therelationships of incarceration, insurance, and uncompensated care. Buta more immediate question is whether the population of former inmatesis sufficiently large to produce spillovers of this sort. Accordingly, we

The Institutional Effects of Incarceration 519
will review trends in incarceration before turning to the relationshipbetween incarceration and health care consumption.
The Rise of Incarceration
The incarceration rate has risen precipitously since the mid-1970s.13 In2012, more than 2.4 million prisoners and parolees were under supervi-sion, 8 times more than in 1968.15-18 Although the “stock” of currentprisoners is perhaps the most common way to think of incarceration,the “flow” of inmates in and out of prisons also is relevant. Becausethe vast majority of inmates are eventually returned to the community,any consideration of long-term spillover effects must also consider thenumber of former inmates, which also has risen precipitously over time.In 2004, more than 4 million people had previously been in prisonor were on parole but were no longer under correctional supervision,representing 1.9% of the adult population and 3.5% of the adult malepopulation.15 This, too, represents a remarkable shift over earlier lev-els. Until the mid-1970s, the number of ex-prisoners remained stableat approximately 1 million, but since 1978 the number has approx-imately quadrupled. Recent years have seen some fluctuation in theprison population, but the absolute level remains high and the differ-ence is small. In 2013, for example, 623,337 prisoners were releasedfrom state and federal prisons, and 631,168 individuals were admittedto them.19
The overall level of incarceration is striking, but there is considerablevariation between states and between demographic groups. Some ofthe largest states also have the highest incarceration rates, like Texasand California, both of which house more than 160,000 prisoners.20
Similarly, Florida has just under 100,000 people in prison and alsoone of the faster-growing incarceration rates. Despite the nationwideincrease in incarceration, some states have remained relatively stableover time, thereby producing a substantial between-state variation. In2013 the highest incarceration rate was in Louisiana, with a rate of 870per 100,000 and the lowest rate was in Maine, with 145 per 100,000.19
These between-state differences reflect many factors, quite apart fromstate differences in crime rates. The size of the prison population isdriven by each state’s sentencing policies, administrative procedures,and, to some degree, political preferences for incarceration over otherforms of punishment.20

520 J. Schnittker et al.
Incarceration is also highly concentrated among already disadvantagedgroups. African American males are much more likely to be incarcer-ated than their non-Hispanic white counterparts. In 2004, 2.9% of theadult population was currently or had previously been in prison or wason parole, but among African Americans this figure was 10.2%.15 ForAfrican American men, this figure climbs to 17.1%. By one estimate,about 32% of African American men born in 2001 will go to prison intheir lifetimes, compared with about 6% of white men.16 Comparingincarceration with other events of the life course further illustrates itsimpact. African American men born between 1965 and 1969, for ex-ample, are more likely to have a prison record than a bachelor’s degree(22% versus 13%).7
The Social and Institutional Bases for SpilloverEffects
Although the number of current and former prisoners has risen precipi-tously, these groups combined still represent only about 3% of the adultpopulation.15 Yet a population of this size is sufficient to shape unem-ployment figures, which are usually below 10% and for which smalldifferences are politically and economically meaningful. Conceivably,even a relatively small number of former inmates can affect the eco-nomics of health care if former inmates are sicker than other membersof the community, if they have especially costly illness configurations,or if they continue to use health services even when their ability to payfor those services is compromised.
The potential spillover effects of incarceration on health care arepremised not only on the size of prison populations. They also rest onthe particular health care needs of former inmates, on how they consumecare, and on who does or does not pay for the services they receive. Inall 3 ways, former inmates are unique, and it is the confluence of thesefactors that sets the stage for spillovers. In sufficient numbers, formerinmates may increase the burden of uncompensated care, diminish thefinancial stability of local providers, force providers to cut services orclose altogether, and thereby reduce the quality or availability of servicesto others. These incarceration effects are magnified by how the insurancesystem intersects with prison demographics. More than 90% of USprison inmates are male, and about half of them have children.21,22
Because health insurance is provided largely through employers and

The Institutional Effects of Incarceration 521
because many families obtain insurance through the policy of a singleemployed subscriber, the incarceration of a large number of working-age fathers (and, increasingly, mothers) ripples outward to affect theavailability of health insurance to families.
Perhaps the strongest evidence for spillover effects on health careconcerns community uninsurance rates, for which there are both a strongconceptual foundation23 and compelling empirical evidence.24,25 In thecase of community uninsurance, spillover effects begin with the behaviorof uninsured individuals and propagate outward to other consumers,largely through financial mechanisms. Uninsurance is a major barrierto health care. It reduces the likelihood of visiting a physician andthe likelihood of providers being compensated for the services theyrender.26,27 Yet uninsurance does not prevent the consumption of carealtogether, and it is not, on average, a reflection of less need. Thosewithout health insurance generally report worse health than do thosewith insurance; they continue to visit physicians and hospitals; and bylaw, patients cannot be turned away for emergency care on the basis oftheir ability to pay.28 If the uninsured population is sufficiently largeand providers are unable to absorb the cost of uncompensated care,hospitals and other providers may reduce the availability and/or qualityof services they offer, thereby reducing the services available to others.Spillover effects of this sort have been documented in several ways, suchas by linking a community’s uninsurance rate to the likelihood of insuredindividuals reporting an unmet need for care (a multilevel approach)24
and by linking the size of the uninsured population in a region toservices available in hospitals within that region (an aggregate-levelapproach).23
The case for incarceration-based spillover effects reflects many of thesame influences. For instance, both types of spillovers are ultimatelyrooted in the financial dimensions of care. But incarceration’s spilloversare likely magnified beyond uninsurance because incarceration mightsimultaneously affect access to care, the need for care, and the demandfor care. While in prison, inmates are provided with health care ser-vices, and on average, they consume more services than they did beforebeing admitted.29,30 For many inmates, prison represents an improve-ment in overall access to care, especially for those who are ordinarilyunderserved.31 Overall mortality among African Americans, for exam-ple, is lower in prison than outside,31 although to be sure, much of thisdecline stems from deaths related to accidents, homicide, and drugs and

522 J. Schnittker et al.
alcohol rather than causes of death amenable to care.32 Even so, incar-ceration might increase the demand for health care through at least 3key mechanisms: (1) if it has a negative effect on health after release andthereby increases the real demand for care33,34; (2) if, through testing,it reveals illnesses that had been previously unknown to inmates35-38;and (3) if prisoners are encouraged to seek treatment as part of theirreintegration efforts or are required to seek treatment for specific healthissues, such as substance abuse.39-41
It is unlikely that all these influences affect inmates simultaneouslyin all instances. For example, HIV testing varies among prisons, evenamong prisons in the same system.37 Furthermore, in some instances thedemand for treatment outside prison might be quite small, even amongformer inmates who plainly require treatment. Along these lines, onestudy found that most HIV-infected inmates who received antiretroviraltherapy (ART) medications in prison failed to fill their prescriptions afterrelease, even when those prescriptions were free or low cost.42 Indeed,a robust literature has documented the many ways that even the bestdischarge planning fails to prevent lapses in treatment. Yet the potentialfor spillovers rests on the net effect, and in this regard, some aspects ofincarceration are clear. It is well established, for example, that the healthcare needs of former inmates are, in fact, high. Furthermore, their needfor care might increase after release if prisons maintain active testingregimens. It is also evident that the level of access provided in prison formost illnesses is unlikely to be maintained after release. To understandspillovers, we need to know whether the barriers to access are largeenough to prevent former inmates from seeking services altogether. Thisseems unlikely, but it is important to understand the precise nature ofthe bridge between health care inside prison and health care outsideprison.
Former inmates’ access to health care is limited in part by their nothaving insurance. They often are unemployed, and of those who do findwork, few are able to secure positions with good benefits.43 Althoughfederal and state programs are available to help provide health care tothose who cannot afford it, such safety-net services are limited and maybe especially so for former inmates.44 Far more states terminate ratherthan suspend Medicaid benefits when inmates begin their sentence,leaving a gap in care after release until the former inmates reenroll.45-47
Although most states, at a minimum, support Medicaid enrollment afterrelease, not all states do. One study reported that about one-third of the

The Institutional Effects of Incarceration 523
state prison systems that terminate or suspend Medicaid do not provideassistance in resuming benefits.47
Despite these barriers, however, former inmates do consume healthcare. Former inmates with health conditions tend to be heavy consumersof health services, and they often utilize health care in cost-intensiveways.30 For example, many use emergency rooms for care,30,48,49 some-times more frequently than using regular providers.50 These utilizationpatterns reflect the limited services available to former inmates, as wellas their unique needs, which are difficult to treat even under ideal con-ditions. For instance, former inmates often have comorbid psychiatricdisorders, complicating the treatment of other illnesses.51 Furthermore,many suffer from chronic illnesses that in themselves are associated withexpensive treatments, including HIV and hepatitis B and C.30 Even ifHIV-infected former inmates fail to fill ART prescriptions, they mightreturn to the hospital when their condition worsens and their treatmentbecomes more expensive. Even a small number of complex cases canaffect a hospital’s delivery of services. In the case of emergency roomvisits, for instance, frequent users represent only 4.5% to 8% of patientsbut make up 21% to 28% of visits.52 Heavy emergency room users aredemographically similar to the former inmate population, suggestingimportant overlaps in these populations.52
Figure 1 summarizes our conceptual model of spillovers betweenincarceration and health care. Incarceration decreases access to healthcare following release and possibly increases the demand for ser-vices. In turn, former inmates’ utilization of services increases theamount of uncompensated care in the community. When providersrespond to this uncompensated care by reducing services and/or di-minishing the quality of their offerings, spillover effects are theresult.
Although the potential for spillovers is strong, it is not a logicalnecessity flowing inescapably from the situation of former inmates tothe market for health services. Spillovers of this sort depend on howthe local market for health care is organized and how it responds. Inboth respects, incarceration effects could be blunted. Furthermore, theinstitutional effects of incarceration on health care begin to diverge evenmore from incarceration’s other institutional effects and therefore deserveemphasis.

524 J. Schnittker et al.
Fig
ure
1.C
once
ptua
lMod
elLi
nkin
gIn
carc
erat
ion
toH
ealt
hC
are
Spil
love
rE
ffec
ts

The Institutional Effects of Incarceration 525
Residential Segregation and MarketSegmentation
The irony of health care that is not apparent in other institutional effectsof incarceration is that the residential segregation of former inmatesmight limit, rather than facilitate, the potential for spillover effectsin health care insofar as segregation leads to market segmentation. Inparticular, if those hospitals providing care to former inmates are gener-ally distinct from those providing care to others, there may be no needfor the latter to reduce services because their revenues would not beaffected by the former inmates’ situation. In this case, well-resourcedconsumers can avoid hospitals servicing uninsured individuals, result-ing in a segmented market but no average decline in services across theentire market. Although we have no direct evidence for this, we do haverelated evidence regarding race, segregation, and hospitals. Hospitalcare for African Americans is concentrated in a relatively small num-ber of hospitals,53 and hospital segregation is strongly correlated withresidential segregation.54,55 Furthermore, the burden of uncompensatedcare has become more concentrated over time, suggesting that insuredpersons seek services in more financially secure private hospitals andthe uninsured go elsewhere.56 In short, the factors that make prisons sopowerful in perpetuating economic disadvantage may be the same forcesthat blunt spillovers in health care.
Likewise, spillover effects might be blunted if the needs of formerinmates differ significantly from those of other consumers. If formerinmates are more likely to use specific services, providers might cutthose services, thereby minimizing their exposure to former inmatesand preventing cuts to other services. Whether the mix of services usedby former inmates differs substantially from that of other consumers isunclear. Although former inmates suffer from some diseases at especiallyhigh rates, especially addiction and psychiatric disorders, their utiliza-tion patterns likely reflect the wide range of conditions from which theyare more likely to suffer.34 Yet the possibility of different utilizationpatterns means that any empirical exploration of spillover effects re-quires the simultaneous examination of multiple dimensions of healthcare consumption.

526 J. Schnittker et al.
The Empirical Dimensions of Spillover Effects
Testing for spillovers requires 2 elements. First, it requires multileveldata containing aggregate information on the size of the former inmatepopulation matched to individual-level data. Spillover effects are bestdemonstrated by matching information on individuals’ actual utilizationwith information on aggregate-level characteristics. This allows analyststo adjust for other characteristics of the individual that drive healthcare consumption. Yet aggregate-level data alone can be deployed toaddress between-state heterogeneity, which is also a concern, since thestate is the level at which correctional and many public health policiesare administered.
For this study, we used a 2-fold design. In Part 1, we focused onindividual-level data, showing how individuals actually behave in re-gions with a large number of former inmates, controlling extensivelyfor individual-level factors. In Part 2, we explored whether traces ofthese individual-level patterns were detectable in the key aggregatedata, controlling extensively for aggregate-level characteristics. In par-ticular, we tested how changes in the former inmate population affectedchanges in the health care system, thereby holding constant all fixedstate-level characteristics. In this way, the first part allowed us to exam-ine between-individual heterogeneity, and the second part allowed us toexamine between-state heterogeneity.
Second, testing for spillovers requires granular information on uti-lization patterns. Although previous research demonstrated the spillovereffects of community uninsurance using basic reports of unmet need,24
additional measures allow for more fine-grained conclusions. Dependingon the amount of revenue strain and the characteristics of the market,hospitals might be selective in the services they cut. For example,routine primary care visits are less sensitive to scale, as most markets canaccommodate more than 1 provider. In this situation, hospitals mightcut back instead on emergency room services, which have an importantcommunity benefit but are less profitable.57,58 Similarly, certainspecialty services require a large consumer base and therefore might beespecially vulnerable to financial considerations. Mammography screen-ing is a good example, as it is capital intensive. As a result, the numberof screening facilities has been declining over time,59 and the averagewait for first-time mammograms has increased.60 Although someregions maintain excess capacity, the percentage of women living in

The Institutional Effects of Incarceration 527
poor-capacity areas has risen.61 Distinctions across service units are im-portant to our study because they allow us to test the limits of spillovereffects: if the size of the former inmate population is not sufficientlylarge, providers might cut back on specialty care but retain primarycare.
Process-related information provides additional leverage. The casehas been made that community uninsurance diminishes the willingnessof individuals to claim health as a right.23 Similar arguments have beenraised with respect to incarceration and neighborhood cohesion, withsome people arguing—if not empirically demonstrating—that massincarceration undermines social bonds.8,9 The testable corollary withrespect to health care is that large-scale incarceration might underminetrust in physicians by introducing doubt about whether the physicianhas the patient’s best interests in mind or is, instead, consideringrevenue.
The outcomes we used have other helpful features. For instance, tothe extent that we can demonstrate a relationship between incarcerationand services intended for older women, such as mammography, theevidence for spillovers is stronger, as incarceration disproportionatelyaffects young men. No single outcome can provide a perfect test,and each is subject to multiple simultaneous influences. Moreover,unmet need is plainly determined by many factors apart from thoseemphasized in our framework, including the ability of individuals toschedule convenient appointments. Nevertheless, examining a richset of outcomes and predictors enabled us to draw reasonable andappropriately cautious inferences about the existence and extent ofspillovers.
Data, Methods, and Results
As noted, our analysis was based on 2 levels of data. At the individuallevel, we used a large, nationally representative survey of individuals. Atthe state level, we constructed estimates of the number of former inmatesby state and year, to which we appended other state-level measures. In thefirst part of our analysis, we merged these 2 data sources into a multilevelmodel. In the second part, we used only aggregate-level data in a time-series cross-sectional approach. After describing the data common toboth, we will discuss each of these parts.

528 J. Schnittker et al.
Estimates of the Number of Former Inmates byState and Year
Both parts of our analysis include estimates of mass incarceration at thestate level. In this regard, our framework required specific and unusualdata. It is easy to find state-level incarceration rates, which serve as thefoundation for evidence regarding mass incarceration. To understandspillovers, however, it is better to measure the number of former inmatesrather than the number of current inmates. These 2 numbers are corre-lated, of course, but only the former inmates contribute to the specificspillovers we described. We estimated the number of former inmateswithin a state based on demographic life tables applied to each statefor each year as described previously.15 Each annual cohort of prison re-leases was reduced for recidivism and mortality, and subsequent cohortsrefreshed the population. Our recidivism rate is duration specific andis based on national studies. We assumed most former inmates will bereincarcerated, but we also assumed the recidivism rate will fall withtime since release. We also assumed a higher rate of mortality amongformer inmates than among those who did not serve prison time. Bothof these assumptions are consequential to our estimates, although in aconservative direction. They reduce the risk of overestimating the num-ber of ex-prisoners in state populations, but as we show, the estimates arestill quite high. Furthermore, recidivism and mortality adjustments donot directly affect between-state variation, because we assigned the samerates to all states. We used the same procedure to estimate the numberreleased from community supervision as a sensitivity test, because com-munity supervision is correlated with state punitiveness but should notyield the same spillovers as prison. Figure 2 is a map of the percentagefor 2010, by state, of the adult population that are ex-prisoners (PanelA), as well as the percentage of uninsured (Panel B).
Part 1
The Community Tracking Study (CTS) was designed to examinethe effects of changing health care markets on individuals62 and hasbeen used to study, among many other topics, the spillover effectsof uninsurance.24,63 The popularity of the CTS for this purpose is nosurprise. The CTS is a nationally representative household survey that

The Institutional Effects of Incarceration 529
Figure 2. Percentage of Former Inmates and Uninsured by State,United States, 2010

530 J. Schnittker et al.
has been conducted since 1996 in ongoing (approximately) 2-year crosssections. Each of the surveys contains a large number of respondents(no fewer than 37,000 per year for the waves used here) and collectsinformation on health, health insurance, health care utilization, andsociodemographic background. The CTS instrument was designed tocover the relevant features of health care delivery. The CTS also allowsresearchers to link state-level data to individual observations. Althoughadditional waves of the CTS were collected after 2003, alterationsto the sampling design prohibit linking state-level information topost-2003 waves. Our analyses used data from 1996/1997, 1998/1999,2000/2001, and 2003 (for simplicity, we refer to the waves spanning 2years by their initial year of collection).
The CTS sample was collected in stages and across clusters, select-ing 60 sites to provide a nationally representative sample (within thecontinental United States) and randomly sampling households in thesesites. These site-based samples were supplemented by an independentnational sample of households not tied to the sites. Most of these siteswere metropolitan areas (9 were not). Although the survey instrumentasked some questions about the experiences of the children living in thehousehold, as reported by adults, our analyses were limited to the adultself-reports. Because of the CTS’s complex and geographically nestednature, we used survey weights in all the models.
Individual-Level Influences
Behavioral models regard health care utilization as a function of 3 cat-egories of influences: (1) perceived need for services, (2) predisposingfactors, and (3) enabling factors.64,65 By design, all 3 factors are wellrepresented in the CTS. For perceived need, we controlled for self-ratedpoor health, generally regarded as the single strongest predictor of healthcare utilization.66 For predisposing factors, we controlled for age, yearsof education, race/ethnicity (non-Hispanic white, black, Hispanic, andother), marital status, and sex. For enabling factors, we controlled forhousehold income, residence in a large metropolitan area (more than200,000 residents), and health insurance, using uninsured as the refer-ence category and dividing the insured by policy type: Medicare, privateinsurance, military insurance, or other public insurance (the bulk ofwhich is Medicaid). We also controlled for the year of the survey.

The Institutional Effects of Incarceration 531
These controls are needed to address the set of relevant influences, butincluding all of them together affected our interpretations. In particu-lar, we expected our interpretations to be conservative to the extent thatincarceration has other social, economic, and health effects. For instance,if higher incarceration in a region increased the spread of infectiousdisease, then controlling for health at the individual level would partlycontrol for one spillover effect of incarceration. Similarly, if incarcera-tion adversely altered the composition of health insurance policies in amarket, then controlling for type of health insurance, especially Medi-caid, would partly control for one spillover of incarceration. In short, thetotal spillover effect of incarceration may be greater than we estimated,even though we favored more statistical control over less. The same alsoapplies to some of our state-level influences.
State-Level Influences
Our most important variable at the state level is the percentage offormer inmates in the population. But in order to estimate the effects ofincarceration per se, we had to control for state-level characteristics thatare associated with the number of former inmates and perhaps also withhealth care. We therefore controlled for the percentage of the populationthat is African American, the percentage living below the poverty line,the percentage of unemployed, and the average state-level income (in2000 dollars, set in $10,000 units). We also controlled for the percentageof uninsured, but as a potential mechanism rather than as a control. Weassumed that incarceration increased the risk of not having insuranceand, therefore, that some of the total effect of incarceration would passthrough state-level uninsurance rates. Nevertheless, we hypothesizedthat incarceration matters even beyond its relationship with uninsurance.Other state-level control variables might render some of our conclusionsconservative. If one believes, for example, that the percentage livingbelow the poverty line is partly a consequence of incarceration, includingit as a control variable will displace part of incarceration’s spillover effect.
Health Care Utilization and Process
We estimated the influence of state- and individual-level influences onmultiple indicators of health care utilization and process. These outcomesvary along several dimensions, including type of service and setting.

532 J. Schnittker et al.
Exploring different kinds of services allowed us to evaluate spillovereffects regardless of whether they operated at an institutional level (eg,hospitals cut services) or a provider level (eg, physicians decide to practiceelsewhere). All the dependent variables are coded dichotomously for easeof comparison and comprehension.
Utilization. We examined 6 indicators of health care utilization, ofwhich 3 refer to general utilization and 3 refer to specialized services.Unmet need refers to self-reports of forgoing or delaying necessary care.Respondents were asked, “During the past 12 months, was there anytime that you didn’t get the medical care you needed?” This variablereflects a direct report of diminished access, but it conflates a perceivedneed for care with utilization. The remaining variables measure behaviorstrictly. Respondents were asked whether, over the preceding 12 months,they had visited a doctor (not including an emergency room or overnightstay in a hospital) or they had spent the night in a hospital (not includingfor the delivery of a child). To test the specificity of spillover effects, wealso considered the utilization of specialized services. Respondents wereasked whether, over the preceding 12 months, they had had surgery or hadvisited a mental health professional, including a psychiatrist, psychologist,psychiatric nurse, or clinical social worker. Women over the age of 40were also asked whether they had received a mammogram in the last year(this question was not asked in 2003, reducing the available sample formodels that use mammography).
Process. Beyond affecting utilization, spillover effects may result ina decline in the quality of services received or how those services weredelivered. To test this idea, we examined indicators of the health careprocess. Respondents were asked whether they had a usual place forcare. (A usual place indicates a more robust health care market.) We alsoexamined whether respondents were satisfied with their care (if they visiteda health care provider), satisfied with their choice of a primary care physician,satisfied with their choice of a specialist (if they needed or saw a specialist),and whether they trusted their doctor to “put [their] medical needs aboveall other considerations when treating [their] medical problems” (if theyhad a usual physician or had visited a physician in the previous 12months). Respondents were coded as satisfied if they reported being“very satisfied” (the modal response for each satisfaction question) and asmistrusting if they disagreed “somewhat” or “strongly” that their doctorcould be trusted.

The Institutional Effects of Incarceration 533
Results
Tables 1 and 2 show the initial basis for spillover effects on health careutilization and process-related outcomes, respectively. The tables presentcoefficients for both the individual- and state-level variables, althoughsubsequent tables display only state-level coefficients (even though allthe same individual-level covariates are also included in the model).Table 1 begins with unmet need, perhaps the most common outcome inresearch assessing access to care. As noted, reports of unmet need are afunction of both a self-assessed need for care and whether that need forcare was met. This confluence of potentially countervailing influencesis apparent in the coefficients: whereas income reduces the likelihood ofreporting unmet need, education increases it, even though education andincome are positively correlated. Although African Americans have lessaccess to care and worse health, they are less likely than whites to reportan unmet need. Other coefficients present a more consistent pattern,including those coefficients that are the focus of this study. Uninsuranceis one of the largest barriers to care. All of the insurance coefficients arestatistically significant and greater in magnitude than the estimates forall other categorical covariates except self-rated poor health.
Outside these characteristics, however, the percentage of former in-mates in a state is consistently and positively related to unmet need. Theaverage marginal effect of a unit change in the percentage of ex-prisonersis 0.007 (dy/dx[.102]). In comparison with the other covariates, themarginal change from uninsurance to other public insurance is −0.052.Other studies found that a percentage-point increase in the uninsured re-sulted in a 2% increase in the odds of reporting unmet need (exp[0.020]= 1.02, Table 4, Pagan and Pauly24), whereas we found that each ad-ditional percentage point of ex-prisoners resulted in an 11% increase inthe odds of reporting unmet need (exp[0.102] = 1.11). The ex-prisonercoefficient is also statistically significant controlling for state-level fac-tors correlated with it, including the percentage of African Americans,the percentage of unemployed, and the percentage below the povertyline. (We explore the mediating effects of state-level uninsurance later.)
The relationship between incarceration and health care quality isapparent for all but one of the remaining utilization outcomes. Indi-viduals in states with a large number of former inmates are less likelyto visit a doctor, spend the night in a hospital, undergo surgery, andreceive a mammogram. There is no relationship between the percentage

534 J. Schnittker et al.
Tab
le1.
Logi
tR
egre
ssio
nM
odel
sof
Uti
liza
tion
-Rel
ated
Var
iabl
eson
Indi
vidu
al-
and
Stat
e-Le
vel
Cov
aria
tes,
1996
-200
3C
omm
unit
yTr
acki
ngSt
udy
Vis
ited
Vis
ited
Psy
chia
tric
Un
met
Nee
dD
octo
rH
osp
ital
Surg
ery
Mam
mog
ram
Car
e
Indi
vidu
al-L
evel
Infl
uenc
esIn
sura
nce
(ver
sus
none
)M
edic
are
−1.2
95**
*1.
742 *
**0.
879 *
**0.
918 *
**0.
901 *
**0.
640 *
**(0
.060
)(0
.041
)(0
.029
)(0
.039
)(0
.054
)(0
.078
)P
riva
te−1
.060
***
1.20
4 ***
0.37
9 ***
0.70
1 ***
1.18
7 ***
0.34
3 ***
(0.0
30)
(0.0
30)
(0.0
27)
(0.0
29)
(0.0
42)
(0.0
60)
Mil
itar
y−0
.585
***
1.07
6 ***
0.58
8 ***
0.78
2 ***
1.22
4 ***
0.94
4 ***
(0.1
72)
(0.1
04)
(0.0
48)
(0.0
63)
(0.0
86)
(0.0
98)
Pub
lic
−0.5
12**
*1.
458 *
**0.
805 *
**0.
908 *
**1.
138 *
**1.
115 *
**(0
.033
)(0
.035
)(0
.031
)(0
.036
)(0
.039
)(0
.060
)P
oor
heal
th1.
092 *
**0.
648 *
**1.
070 *
**0.
561 *
**−0
.020
0.96
2 ***
(0.0
29)
(0.0
25)
(0.0
18)
(0.0
16)
(0.0
19)
(0.0
26)
Age
−0.0
14**
*0.
010 *
**0.
015 *
**0.
006 *
**0.
018 *
**−0
.018
***
(0.0
01)
(0.0
01)
(0.0
00)
(0.0
01)
(0.0
01)
(0.0
01)
Bla
ck−0
.085
**−0
.106
***
0.03
2−0
.332
***
0.11
3 ***
−0.5
06**
*(0
.032
)(0
.028
)(0
.031
)(0
.022
)(0
.027
)(0
.055
)H
ispa
nic
−0.3
15**
*−0
.480
***
−0.1
24**
*−0
.368
***
0.23
2 ***
−0.3
81**
*(0
.054
)(0
.025
)(0
.030
)(0
.053
)(0
.036
)(0
.074
)O
ther
0.24
2 ***
−0.3
27**
*−0
.086
**−0
.263
***
−0.1
72**
*−0
.300
***
(0.0
65)
(0.0
31)
(0.0
31)
(0.0
46)
(0.0
39)
(0.0
55)
Mar
ried
0.09
6 ***
0.04
1 **
−0.1
27**
*0.
061 *
**0.
315 *
**−0
.447
***
(0.0
27)
(0.0
13)
(0.0
18)
(0.0
13)
(0.0
17)
(0.0
26)
Con
tinu
ed

The Institutional Effects of Incarceration 535
Tab
le1.
Con
tinu
ed
Vis
ited
Vis
ited
Psy
chia
tric
Un
met
Nee
dD
octo
rH
osp
ital
Surg
ery
Mam
mog
ram
Car
e
Fem
ale
0.28
4 ***
0.90
3 ***
0.00
20.
200 *
**0.
247 *
**(0
.017
)(0
.012
)(0
.020
)(0
.012
)(0
.015
)La
rge
city
0.11
0 ***
0.06
3 ***
−0.0
20−0
.015
0.12
0 ***
0.22
1 ***
(0.0
24)
(0.0
18)
(0.0
47)
(0.0
21)
(0.0
38)
(0.0
38)
Edu
cati
on0.
043 *
**0.
062 *
**−0
.006
0.03
2 ***
0.06
6 ***
0.08
1 ***
(0.0
06)
(0.0
03)
(0.0
04)
(0.0
03)
(0.0
04)
(0.0
05)
Ln(F
amil
yin
com
e)−0
.039
***
0.07
7 ***
−0.0
27**
*0.
019 *
**0.
046 *
**−0
.032
***
(0.0
06)
(0.0
03)
(0.0
06)
(0.0
06)
(0.0
09)
(0.0
06)
Yea
r0.
001
0.00
30.
012 *
**0.
013 *
**0.
054 *
**−0
.015
***
(0.0
05)
(0.0
04)
(0.0
03)
(0.0
04)
(0.0
08)
(0.0
05)
Stat
e-L
evel
Infl
uenc
es%
Bel
owpo
vert
y0.
012
0.00
70.
002
−0.0
09**
0.02
6 ***
0.00
6(0
.007
)(0
.005
)(0
.006
)(0
.004
)(0
.006
)(0
.009
)In
com
e−0
.075
0.14
5 ***
−0.0
95**
−0.0
89**
*0.
166 *
**0.
300 *
**(0
.043
)(0
.031
)(0
.037
)(0
.026
)(0
.034
)(0
.058
)%
Une
mpl
oyed
−0.0
41*
−0.0
110.
015
−0.0
10−0
.051
**0.
022 *
(0.0
16)
(0.0
10)
(0.0
08)
(0.0
08)
(0.0
20)
(0.0
13)
%A
fric
anA
mer
ican
−0.0
12**
*0.
007 *
**0.
008 *
**0.
003 *
*0.
004 *
**−0
.004
(0.0
02)
(0.0
01)
(0.0
02)
(0.0
01)
(0.0
02)
(0.0
02)
%E
x-pr
ison
ers
0.10
2 ***
−0.0
75**
*−0
.118
***
−0.0
61**
*−0
.081
***
−0.0
44(0
.020
)(0
.018
)(0
.021
)(0
.017
)(0
.029
)(0
.046
)C
onst
ant
−4.5
00−9
.366
−26.
336
−29.
050
−112
.667
26.8
03O
bser
vati
ons
179,
012
179,
012
179,
012
179,
012
46,1
8417
9,01
2
*p<
.05;
**p<
.01;
***p
<.0
01(2
-tai
led
test
)

536 J. Schnittker et al.
Tab
le2.
Logi
tR
egre
ssio
nM
odel
sof
Pro
cess
-Rel
ated
Var
iabl
eson
Indi
vidu
al-
and
Stat
e-Le
vel
Cov
aria
tes,
1996
-200
3C
om-
mun
ity
Trac
king
Stud
y
Sati
sfie
dSa
tisf
ied
Wit
hSa
tisf
ied
Wit
hP
hys
icia
nU
sual
Pla
ceW
ith
Car
eC
hoi
ceof
Doc
tor
Ch
oice
ofSp
ecia
list
Mis
tru
st
Indi
vidu
al-L
evel
Infl
uenc
esIn
sura
nce
(ver
sus
none
)M
edic
are
1.22
4 ***
0.80
7 ***
1.29
0 ***
1.30
6 ***
−0.7
74**
*(0
.039
)(0
.026
)(0
.047
)(0
.053
)(0
.035
)P
riva
te1.
144 *
**0.
496 *
**0.
787 *
**0.
935 *
**−0
.394
***
(0.0
29)
(0.0
19)
(0.0
25)
(0.0
35)
(0.0
25)
Mil
itar
y1.
415 *
**0.
468 *
**0.
410 *
**0.
537 *
**−0
.101
(0.1
05)
(0.0
42)
(0.0
87)
(0.1
06)
(0.0
96)
Pub
lic
1.40
2 ***
0.61
8 ***
0.67
2 ***
0.78
1 ***
−0.3
37**
*(0
.045
)(0
.022
)(0
.036
)(0
.061
)(0
.046
)P
oor
heal
th0.
254 *
**−0
.427
***
−0.4
67**
*−0
.581
***
0.49
4 ***
(0.0
25)
(0.0
13)
(0.0
21)
(0.0
27)
(0.0
32)
Age
0.01
4 ***
0.01
2 ***
0.00
5 ***
0.01
6 ***
−0.0
05**
*(0
.001
)(0
.000
)(0
.001
)(0
.001
)(0
.001
)B
lack
−0.0
85**
−0.1
36**
*−0
.065
−0.1
82**
*0.
106 *
**(0
.030
)(0
.020
)(0
.035
)(0
.044
)(0
.029
)H
ispa
nic
−0.6
98**
*−0
.083
**−0
.229
***
−0.0
470.
201 *
**(0
.033
)(0
.027
)(0
.044
)(0
.050
)(0
.031
)O
ther
−0.4
70**
*−0
.369
***
−0.2
08**
*−0
.409
***
0.20
6 ***
(0.0
44)
(0.0
32)
(0.0
57)
(0.0
81)
(0.0
47)
Mar
ried
0.31
1 ***
0.00
30.
043 *
*0.
107 *
**0.
039 *
(0.0
23)
(0.0
13)
(0.0
15)
(0.0
31)
(0.0
19)
Con
tinu
ed

The Institutional Effects of Incarceration 537
Tab
le2.
Con
tinu
ed
Sati
sfie
dSa
tisf
ied
Wit
hSa
tisf
ied
Wit
hP
hys
icia
nU
sual
Pla
ceW
ith
Car
eC
hoi
ceof
Doc
tor
Ch
oice
ofSp
ecia
list
Mis
tru
st
Fem
ale
0.56
7 ***
0.06
2 ***
0.00
60.
001
−0.1
65**
*(0
.016
)(0
.007
)(0
.015
)(0
.030
)(0
.018
)La
rge
city
−0.1
94**
*−0
.048
**−0
.125
***
−0.0
500.
156 *
**(0
.054
)(0
.017
)(0
.032
)(0
.037
)(0
.024
)E
duca
tion
0.02
7 ***
−0.0
17**
*−0
.015
***
−0.0
040.
011 *
*(0
.004
)(0
.003
)(0
.004
)(0
.007
)(0
.004
)Ln
(Fam
ily
inco
me)
0.08
2 ***
0.03
4 ***
0.03
5 ***
0.04
2 ***
−0.0
19**
(0.0
04)
(0.0
06)
(0.0
04)
(0.0
10)
(0.0
07)
Yea
r−0
.008
0.02
2 ***
0.03
4 ***
0.01
7 *−0
.051
***
(0.0
10)
(0.0
03)
(0.0
08)
(0.0
07)
(0.0
06)
Stat
e-L
evel
Infl
uenc
es%
Bel
owpo
vert
y−0
.009
0.01
00.
004
−0.0
020.
022 *
**(0
.011
)(0
.006
)(0
.007
)(0
.007
)(0
.007
)In
com
e0.
041
0.02
5−0
.029
−0.0
380.
061
(0.0
62)
(0.0
41)
(0.0
50)
(0.0
47)
(0.0
35)
%U
nem
ploy
ed0.
044 *
−0.0
27**
*−0
.020
−0.0
12−0
.001
(0.0
19)
(0.0
08)
(0.0
12)
(0.0
11)
(0.0
12)
%A
fric
anA
mer
ican
0.00
60.
006 *
**0.
014 *
**0.
017 *
**−0
.013
***
(0.0
03)
(0.0
01)
(0.0
02)
(0.0
02)
(0.0
01)
%E
x-pr
ison
ers
−0.1
57**
*−0
.128
***
−0.1
46**
*−0
.198
***
0.16
7 ***
(0.0
30)
(0.0
21)
(0.0
19)
(0.0
28)
(0.0
20)
Con
stan
t14
.247
−43.
516
−65.
791
−32.
408
98.3
30O
bser
vati
ons
179,
012
166,
087
175,
482
74,2
4316
1,18
9
*p<
.05;
**p<
.01;
***p
<.0
01(2
-tai
led
test
)
538 J. Schnittker et al.
of ex-prisoners and the likelihood of seeking care from a mental healthprofessional. Notably, however, this question pertains to a wider varietyof potential service providers, including clinical social workers, suggest-ing a broader market than is available for the other outcomes. There islittle variation in the size of the relationship between the percentage ofex-prisoners and the outcomes, although the relationship is somewhatstronger for visiting a hospital than for visiting a physician.
Table 2 estimates the same models for the process-related outcomes.The individual-level coefficients fit well-established patterns from thetreatment-disparities literature. African Americans, for instance, are lesslikely than whites to have a usual place for care, to be satisfied withtheir care and choices, and to trust their physician. Family income isalso positively associated with better health care experiences.
In addition, however, the percentage of ex-prisoners within a statesignificantly diminishes the quality of care. It does so across each of theprocess outcomes: having a usual place for care, being satisfied with thecare received, and being satisfied with the choice of primary care physi-cian and specialist. The percentage of ex-prisoners also increases thelikelihood of mistrusting one’s physician. The strength of this relation-ship is consistent across outcomes. A percentage-point increase in thenumber of ex-prisoners within a state, for example, decreases the odds ofhaving a usual place for care by approximately 14%, a difference largerthan that between African Americans and whites. All of the ex-prisonercoefficients for the process-related outcomes exceed in absolute mag-nitude the same coefficients for the utilization-related outcomes. Thesingle largest coefficient is for satisfaction with choice of a specialist,which is expected insofar as financial strains are especially consequentialfor specialized services.
Table 3 turns to the mediating effects of uninsurance. State-leveluninsurance should explain some of the ex-prisoner coefficient, but we donot expect uninsurance to reduce the coefficient to zero. Consistent withthis, controlling for uninsurance decreases the ex-prisoner coefficientfor most of the outcomes, but almost all the coefficients that weresignificant without controls remain significant with controls. The ex-prisoner coefficient for unmet need, for instance, is reduced by abouthalf but remains significant. The most robust coefficients for state-level uninsurance apply to the process outcomes, but even there, thecoefficient for the percentage of uninsured is much smaller than thecoefficient for the percentage of ex-prisoners. With regard to the breadth

The Institutional Effects of Incarceration 539
Tab
le3.
Logi
tR
egre
ssio
nof
Uti
liza
tion
-an
dP
roce
ss-R
elat
edO
utco
mes
onIn
divi
dual
-an
dSt
ate-
Leve
lIn
flue
nces
,W
ith
Con
trol
sfo
rU
nins
uran
ce,1
996-
2003
Com
mun
ity
Trac
king
Stud
y
Pan
elA
.Uti
liza
tion
Ou
tcom
es
Un
met
Vis
ited
Vis
ited
Psy
chia
tric
Nee
dD
octo
rH
osp
ital
Surg
ery
Mam
mog
ram
Car
e
%E
x-pr
ison
ers
0.05
6*−0
.052
***
−0.1
12**
*−0
.060
***
−0.0
56−0
.019
(0.0
22)
(0.0
19)
(0.0
22)
(0.0
17)
(0.0
32)
(0.0
50)
%U
nins
ured
0.02
3***
−0.0
12**
*−0
.003
−0.0
01−0
.011
*−0
.112
*(0
.004
)(0
.003
)(0
.004
)(0
.005
)(0
.004
)(0
.005
)P
anel
B.P
roce
ssO
utc
omes
Usu
alSa
tisf
ied
Sati
sfie
dW
ith
Sati
sfie
dW
ith
Ph
ysic
ian
Pla
ceW
ith
Car
eC
hoi
ceof
Doc
tor
Ch
oice
ofSp
ecia
list
Mis
tru
st
%E
x-pr
ison
ers
−0.0
86**
−0.0
96**
*−0
.090
***
−0.1
31**
*0.
098*
**(0
.031
)(0
.021
)(0
.019
)(0
.029
)(0
.020
)%
Uni
nsur
ed−0
.367
***
−0.0
15**
*−0
.029
***
−0.0
33**
*0.
035*
**(0
.005
)(0
.003
)(0
.004
)(0
.005
)(0
.005
)
*p<
.05;
**p<
.01;
***p
<.0
01(2
-tai
led
test
)A
llm
odel
sal
soin
clud
eth
eco
ntro
lvar
iabl
esde
scri
bed
inTa
bles
1an
d2.

540 J. Schnittker et al.
of incarceration effects, the only outcome for which the coefficient forthe percentage of ex-prisoners is eliminated is mammogram utilization.
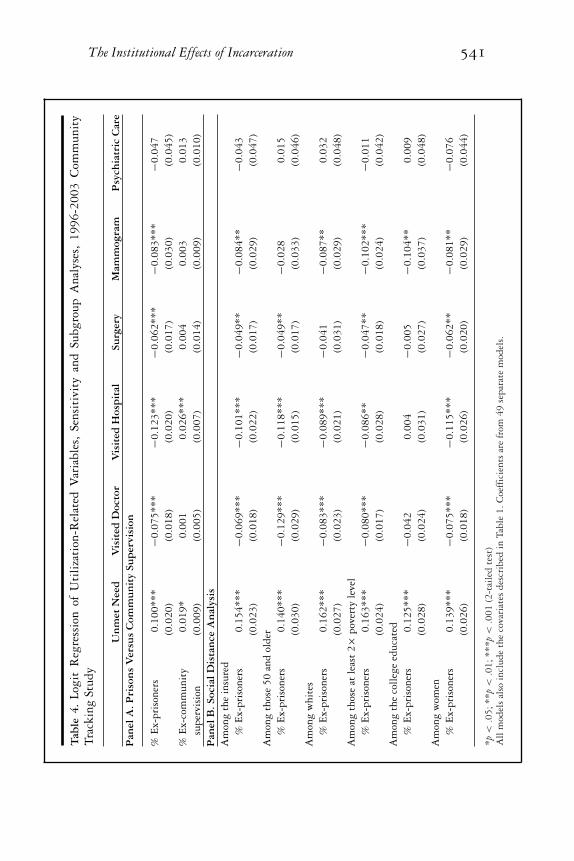
Finally, Tables 4 and 5 present 2 types of sensitivity tests, one regard-ing the effect of prison relative to other modes of correctional supervision(presented in Panel A) and the other regarding the potential for mar-ket segmentation (presented in Panel B). To distinguish the effects ofprison per se from other forms of punishment (and also to distinguishthe effects of simply living in a more punitive state from living in a statewhere prison is used more frequently), we estimated the percentage ofindividuals within a state who had been convicted of a felony but werepunished with community supervision rather than prison. The 2 forms ofpunishment are likely very different with respect to health. Communitysupervision does not entail exposure to the prison environment, but italso does not entail the same access to health care and it still results in acriminal record. For this reason, we expected the effects of the percentageof ex-community supervision to be between those of the percentage ofex-prisoners.
The second test explicitly addressed the breadth of spillover effects.If the effects we have shown are truly reflective of spillovers and thus areapplied to the entire market rather than specific consumers, they shouldbe observed even among those furthest removed from incarceration. Moststudies of the spillover effects of community uninsurance, for instance,consider the situation of the insured. In a parallel fashion, we examinedthe ex-prisoner effect among the insured. In addition, we examined theex-prisoner effect among older persons (aged 50 or older), whites, thosewith incomes at least 200% of the federal poverty line, those with atleast a 4-year college degree, and women. In this way, we explored themoderating influence of social distance as an instrument for evaluatingthe breadth of spillovers. Of course, we had already done this to a limiteddegree by examining the ex-prisoner effect on mammograms, but herewe expanded the scope of this idea. If the spillover effects of incarcerationapply to the entire market, we should observe significant effects in eachof these subpopulations.
Table 4 presents utilization-related outcomes. The models includeall the control variables presented in Table 1, although we show onlythe coefficients for the percentage of ex-prisoners (and the percentageof ex-community supervision in the first set of models). As expected,the effects of being an ex-prisoner exceeded those of being under ex-community supervision. In no case was the effect of being an ex-prisoner
The Institutional Effects of Incarceration 541T
able
4.Lo
git
Reg
ress
ion
ofU
tili
zati
on-R
elat
edV
aria
bles
,Se
nsit
ivit
yan
dSu
bgro
upA
naly
ses,
1996
-200
3C
omm
unit
yTr
acki
ngSt
udy
Un
met
Nee
dV
isit
edD
octo
rV
isit
edH
osp
ital
Surg
ery
Mam
mog
ram
Psy
chia
tric
Car
eP
anel
A.P
riso
ns
Ver
sus
Com
mu
nit
ySu
per
visi
on
%E
x-pr
ison
ers
0.10
0 ***
−0.0
75**
*−0
.123
***
−0.0
62**
*−0
.083
***
−0.0
47(0
.020
)(0
.018
)(0
.020
)(0
.017
)(0
.030
)(0
.045
)%
Ex-
com
mun
ity
0.01
9 *0.
001
0.02
6 ***
0.00
40.
003
0.01
3su
perv
isio
n(0
.009
)(0
.005
)(0
.007
)(0
.014
)(0
.009
)(0
.010
)P
anel
B.S
ocia
lDis
tan
ceA
nal
ysis
Am
ong
the
insu
red
%E
x-pr
ison
ers
0.15
4 ***
−0.0
69**
*−0
.101
***
−0.0
49**
−0.0
84**
−0.0
43(0
.023
)(0
.018
)(0
.022
)(0
.017
)(0
.029
)(0
.047
)A
mon
gth
ose
50an
dol
der
%E
x-pr
ison
ers
0.14
0 ***
−0.1
29**
*−0
.118
***
−0.0
49**
−0.0
280.
015
(0.0
30)
(0.0
29)
(0.0
15)
(0.0
17)
(0.0
33)
(0.0
46)
Am
ong
whi
tes
%E
x-pr
ison
ers
0.16
2 ***
−0.0
83**
*−0
.089
***
−0.0
41−0
.087
**0.
032
(0.0
27)
(0.0
23)
(0.0
21)
(0.0
31)
(0.0
29)
(0.0
48)
Am
ong
thos
eat
leas
t2×
pove
rty
leve
l%
Ex-
pris
oner
s0.
163 *
**−0
.080
***
−0.0
86**
−0.0
47**
−0.1
02**
*−0
.011
(0.0
24)
(0.0
17)
(0.0
28)
(0.0
18)
(0.0
24)
(0.0
42)
Am
ong
the
coll
ege
educ
ated
%E
x-pr
ison
ers
0.12
5 ***
−0.0
420.
004
−0.0
05−0
.104
**0.
009
(0.0
28)
(0.0
24)
(0.0
31)
(0.0
27)
(0.0
37)
(0.0
48)
Am
ong
wom
en%
Ex-
pris
oner
s0.
139 *
**−0
.075
***
−0.1
15**
*−0
.062
**−0
.081
**−0
.076
(0.0
26)
(0.0
18)
(0.0
26)
(0.0
20)
(0.0
29)
(0.0
44)
*p<
.05;
**p<
.01;
***p
<.0
01(2
-tai
led
test
)A
llm
odel
sal
soin
clud
eth
eco
vari
ates
desc
ribe
din
Tabl
e1.
Coe
ffic
ient
sar
efr
om49
sepa
rate
mod
els.

542 J. Schnittker et al.T
able
5.Lo
git
Reg
ress
ion
ofP
roce
ss-R
elat
edV
aria
bles
,Sen
siti
vity
and
Subg
roup
Ana
lyse
s,19
96-2
003
Com
mun
ity
Trac
king
Stud
y
Usu
alSa
tisf
ied
Sati
sfie
dW
ith
Sati
sfie
dW
ith
Ph
ysic
ian
Pla
ceW
ith
Car
eC
hoi
ceof
Doc
tor
Ch
oice
ofSp
ecia
list
Mis
tru
stP
anel
A.P
riso
ns
Ver
sus
Com
mu
nit
ySu
per
visi
on
%E
x-pr
ison
ers
−0.1
54**
*−0
.124
***
−0.1
41**
*−0
.193
***
0.16
2 ***
(0.0
30)
(0.0
20)
(0.0
18)
(0.0
27)
(0.0
19)
%E
x-co
mm
unit
y−0
.030
***
−0.0
23**
*−0
.046
***
−0.0
34*
0.03
7 ***
supe
rvis
ion
(0.0
09)
(0.0
06)
(0.0
10)
(0.0
15)
(0.0
09)
Pan
elB
.Soc
ialD
ista
nce
An
alys
isA
mon
gth
ein
sure
d%
Ex-
pris
oner
s−0
.167
***
−0.1
35**
*−0
.157
***
−0.2
32**
*0.
167 *
**(0
.029
)(0
.021
)(0
.020
)(0
.027
)(0
.019
)A
mon
gth
ose
50an
dol
der
%E
x-pr
ison
ers
−0.1
19**
*−0
.104
***
−0.1
81**
*−0
.138
***
0.17
2 ***
(0.0
24)
(0.0
17)
(0.0
26)
(0.0
41)
(0.0
32)
Am
ong
whi
tes
%E
x-pr
ison
ers
−0.1
53**
*−0
.149
***
−0.2
10**
*−0
.258
***
0.20
3 ***
(0.0
31)
(0.0
32)
(0.0
25)
(0.0
26)
(0.0
27)
Am
ong
thos
eat
leas
t2×
pove
rty
leve
l%
Ex-
pris
oner
s−0
.164
***
−0.1
21**
*−0
.163
***
−0.2
02**
*0.
182 *
**(0
.026
)(0
.023
)(0
.025
)(0
.038
)(0
.024
)A
mon
gth
eco
lleg
eed
ucat
ed%
Ex-
pris
oner
s−0
.115
**−0
.158
***
−0.0
71*
−0.0
97**
0.19
4 ***
(0.0
38)
(0.0
26)
(0.0
36)
(0.0
33)
(0.0
23)
Am
ong
wom
en%
Ex-
pris
oner
s−0
.156
***
−0.1
15**
*−0
.168
***
−0.2
34**
*0.
158 *
**(0
.032
)(0
.019
)(0
.021
)(0
.034
)(0
.024
)
*p<
.05;
**p<
.01;
***p
<.0
01(2
-tai
led
test
)A
llm
odel
sal
soin
clud
eth
eco
vari
ates
desc
ribe
din
Tabl
e2.
Coe
ffic
ient
sar
efr
om49
sepa
rate
mod
els.

The Institutional Effects of Incarceration 543
reduced a great deal, and in all cases the absolute value of the ex-prisonercoefficient exceeded that of ex-community supervision. The remainingmodels revealed remarkably robust associations across subgroups. Ofthe coefficients that were significant in the initial specification, only 4were insignificant in the sensitivity analysis, despite, in many cases, asubstantial reduction in the sample size. The effects of incarceration thusspill over to those least likely to be personally affected by it, includingthe insured, older persons, whites, the well educated, the non-poor, andwomen. In all these subsamples, the coefficients generally paralleled thecoefficients drawn from the entire sample.
The same was true of the process-related outcomes, presented inTable 5. Indeed, the percentage of ex-prisoner coefficients were partic-ularly robust with respect to these outcomes: all the ex-prisoner coeffi-cients remained statistically significant, regardless of the subpopulation.Of the subpopulations we explored, the college educated were perhapsleast susceptible to the influence of the ex-prisoner population. But evenin this case, the effects were significant and the coefficients were reducedat most by just over 50% (in the case of being satisfied with the choiceof specialist).
Part 2
The analyses presented thus far are premised on the idea that spilloversfrom incarceration to health care reflect incarceration per se and notsome other aggregate-level characteristic. The models presented in Part1 are strong on individual-level controls, but they are vulnerable tothe influence of unobserved state-level influences. A more appropriatetest for between-state heterogeneity would try to capture all potentialinfluences at the state level, recognizing the complex set of potentialinfluences.
In Part 2, we estimated models that address unobserved heterogeneityin a rigorous way. We did so by looking at trends in 2 key outcomesrelated to our model but observed entirely at the aggregate level. Whatthese outcomes lost in terms of specificity, they gained in statisticalcontrol. We first considered ex-prisoner effects on state-level uninsur-ance rates, a key mechanism in our framework (which was based ona series in the March Current Population Survey but reweighted bythe State Health Access Data Assistance Center).67 We next considered

544 J. Schnittker et al.
ex-prisoner effects on emergency room utilization per 1,000 state res-idents (this series was based on the American Hospital Association’sAnnual Survey but drawn for our study from the Kaiser State HealthFacts online database).68 Interpreted in tandem, the 2 outcomes allowedus to see the process we described: Does incarceration increase uninsur-ance even as it also increases emergency room use?
Each outcome is observed over time, from 1987 to 2010 for thepercentage of uninsured and from 1999 to 2010 for emergency roomvisits. Although the start dates for the 2 series differed, we wished touse as much time-series data as possible. The fact that we observedthese outcomes over time allowed us to estimate the effects of changein the independent variables on change in the dependent variables. Thisalso allowed us to control for unobserved influences. Specifically, weincluded state fixed-effects, which eliminated the influence of all stablestate-level characteristics. This was especially important to our researchquestions, as state-level characteristics, such as political culture, safety-net service generosity, and overall policy environment, might vary inways that affect both health care and criminal justice.69 Furthermore,most influences of this sort are enduring over time, and most of thevariation is between states, meaning that state-level fixed-effects willeliminate their influence.
It is also clear, however, that some influences of this sort are dynamic.For instance, state-level demographic composition can change in mean-ingful ways, as can the health of state economies. Furthermore, previousresearch points to important dynamic policy influences: at the statelevel, growth in incarceration is associated with retrenchment in thewelfare system.70,71 For this reason, we also controlled for time-variantdemographic and policy-related influences. For the former we includedthe percentage of unemployed, the percentage below the poverty line,the percentage of African Americans, the percentage of Hispanics, andthe violent crime rate. For the latter, we included indicators of thegenerosity of the state’s welfare system, drawn from the University ofKentucky Center for Poverty Research National Welfare Data.72 Weincluded controls for the maximum monthly Temporary Assistance forNeedy Families (TANF) benefit for a 4-person household, adjusted forinflation to reflect 2000 dollars. We also controlled for the ratio of thestate minimum wage to the federal minimum wage, thereby evaluatingthe relative generosity of state-level income supports. Both variablesare related to poverty, which we already statistically controlled, but

The Institutional Effects of Incarceration 545
presumably also reflect the generosity of states with respect to otherneeds. There was considerable variation between states and over time inboth of these quantities.
The unit of analysis in Part 2 is state-years. The spatial and temporalproperties of this type of data make ordinary least squares regressionproblematic. In particular, state-level errors are both geographically andtemporally correlated. To address this, we used a panel-corrected stan-dard errors approach, which allows for correlated errors between states,as well as state-specific heteroskedasticity. Furthermore, we dealt withover-time dynamics in 2 ways, each allowing for a different type of rela-tionship between incarceration and health care outcomes over time. Foreach outcome, we present results from both a lagged dependent variablemodel, which assumes a more gradual impact on the outcome, and afirst-order autoregressive model (AR1), which assumes an immediateimpact.73 Both are plausible specifications for estimating incarcerationspillovers, and differences between the two are instructive.
Results
Table 6 shows the results. First, we found a positive association betweenthe number of ex-prisoners in a state and the state-level uninsurance rate(but not between the number formerly under community supervisionand the state-level uninsurance rate). The coefficient is significant atthe .05 level only when assuming an enduring impact rather than animmediate impact. To be sure, the coefficient was the same when we as-sumed an immediate impact (ie, under the AR1 specification), althoughthe standard error was larger and the coefficient did not reach statisticalsignificance by conventional standards. Each percentage-point increasein the ex-prisoner population led to a 0.32 percentage-point increase inthe uninsured population.
The second pair of models predicts emergency room visits. If growth inthe former inmate population was positively associated with an increasein the number of uninsured individuals but did not affect (or evenreduced) the demand for care, its estimated impact would be weaker.Our models revealed, however, that an increase in the percentage ofex-prisoners was associated with an increase in the rate of ER visits percapita. In this case, the relationship was larger when we assumed animmediate impact, perhaps reflecting the particularly strong needs ofthose recently released from prison.74 For each percentage-point increase

546 J. Schnittker et al.
Table 6. Panel-Corrected Standard Errors Regression of State-LevelHealth Care System Variables on Felon Estimates and Other IndependentVariables
Percentage Uninsured Emergency Room Visits
Lagged Auto- Lagged Auto-Dependent regressive Dependent regressive
Variable Model (AR1) Variable Model (AR1)
% Ex-prisoners .316* .316 17.567+ 28.174*(.148) (.200) (10.110) (12.515)
% Ex- −.039 −.098 1.003 1.682community (.066) (.082) (1.455) (1.677)supervision
% Below .227*** .251*** .003 −.218poverty (.031) (.031) (.952) (.945)
% Unemployed .130** .177*** 1.340 2.462*(.043) (.055) (1.150) (1.136)
% African −.103 −.028 11.093** 12.402**American (.103) (.141) (4.033) (4.342)
% Hispanic .102** .155*** .304 1.223(.036) (.043) (1.825) (2.695)
Violent crime −.0001 .0006 .0851* .1006*rate (.0006) (.0007) (.0383) (.0438)
Maximum −.0009 −.0026*** −.1138** −.1355***TANF (.0006) (.0008) (.0371) (.0406)benefit
State minimum .810* .774 39.490 39.468wage/federalminimumwage
(.409) (.528) (25.594) (23.513)
Lagged .346*** .354*dependent (.049) (.176)variable
Rho (ρ) .336 .428State
fixed-effects
√ √ √ √
Constant 6.156* 8.602* −88.019 10.332Observations 1,150 1,200 550 600States 50 50 50 50Years 1987-2010 1987-2010 1999-2010 1999-2010
+p < .10; *p < .05; **p < .01; ***p < .001 (standard errors in parentheses)

The Institutional Effects of Incarceration 547
in the ex-prisoner population, there were around 28 more ER visitsfor every 1,000 residents. The coefficient under the first model is notsignificant under conventional standards, although it would be if weused a 2-tailed p-value of less than .10. The relationship seems large,although a single individual can make several visits to the ER. Theobserved range in values was as high as 901 visits per year. In the caseof this model, a single former inmate would need to visit the ER 2to 4 times per year. This number is not implausible: among Medicaidbeneficiaries under the age of 65, approximately 15% made 2 or moreER visits in a year, and 5% had 4 or more.75 If the presence of formerinmates in a household also increases ER use by family members, the rateof ER use by inmates need not be this high. Overall, the patterns foundin Table 6 were consistent with the patterns shown at the individuallevel, albeit with much greater control for between-state heterogeneity(and much less insight regarding individual-level influences).
Discussion
Our study established a robust relationship between the number of ex-prisoners within a state and the functioning and quality of its healthcare system. Although this finding contributes to particular substantiveresearch literatures, we start with its broadest implications.
As is the case for labor markets and political institutions, our studydemonstrates that the correctional system affects another system thatwould seem, on its face, far removed from criminal justice. The absolutenumber of former prisoners within a state is usually small, especiallyrelative to the number of people who have more direct problems withaccess to care. For example, the percentage of uninsured exceeds the per-centage of ex-prisoners by at least 5% and, in many states, by more than15%. Yet the number of ex-prisoners is sufficiently large to affect theexperiences of other health care consumers. This connection is perhapseven more remarkable given the considerable heterogeneity within re-gional health care markets, a characteristic that might ordinarily bluntthe potential for spillovers. In any region, for example, the quality ofservice providers varies, as does how consumers decide where and whento seek care. Yet regardless of their personal situation, individuals areaffected by the number of people who cycle through the prison system.

548 J. Schnittker et al.
These spillovers are deep as well as broad and are not limited to aparticular type of service. A general indicator of health care quality isreporting an unmet need for care. An even more sensitive indicatorof spillover effects is whether an individual has difficulty receivingspecialty care or technology-intensive screenings. We found spillovereffects for virtually all these indicators, from basic access to care, toreferrals, to the source of care, to the quality of care. We found thatin states with a larger percentage of former inmates, people were lesslikely to report a usual place for care, to be satisfied with the care theyreceived, to report satisfaction with their choice of health care provider,and to be convinced that their physician had their best interests in mind.Although some studies suggest that incarceration undermines the socialfabric of neighborhoods,76 our study is one of the few to empiricallydemonstrate effects on trust among agents not directly tied to criminaljustice.
From the perspective of the incarceration literature, these spilloversmight be surprising. In recent years, punishment research has focusedon the dramatic increase in incarceration and its heavy concentrationamong young African American men. Incarceration, then, is sometimesinterpreted as an expanding institution oriented to the penalization ofpoverty.77 This research also emphasizes that former inmates usuallyreturn to a relatively small number of communities that are alreadydisadvantaged and segregated.10 From these observations, incarcerationis seen as deepening existing forms of inequality: already disadvantagedmen are further harmed by a criminal record; their families suffer as aresult of their absence and their diminished socioeconomic prospects;and the communities to which they return are further stigmatized forhaving high rates of both crime and incarceration. These themes arerelevant to health care, too, inasmuch as health care is also sensitive topoverty. But these themes do not set the stage for spillover effects perse and, on the contrary, make some spillovers unlikely. It thus would beuseful to consider how the institutional effects documented here differfrom those documented elsewhere.
Because the communities in which incarceration is common are oftenisolated from the hospitals that provide services to other communities,78
the potential for spillover effects could be minimal. That is, segregationcould blunt spillovers in health care rather than provide a pathway forthem, as segregation does for economic outcomes. Our results show,

The Institutional Effects of Incarceration 549
however, that the health care system is not immune from incarceration,despite any market segmentation. Similarly, most of the work on theinstitutional effects of incarceration argues that incarceration exacerbatesexisting inequality. Yet spillover effects with respect to health care appearto affect the entire market for services rather than the experiences of aparticular subset of consumers.
These results also speak to debates regarding the paradoxical effectsof prisons as social service institutions.4 One strand of the incarcerationliterature shows that the prison system represents a real improvementin the social services available to many inmates, albeit one that is lostonce inmates are released.79 Similarly, some people argue that the prisonsystem provides an opportunity to deliver screening and treatment to anunderserved and otherwise difficult-to-reach population.40 The resultsof our study do not diminish these opportunities, but they do suggestthat efforts to improve the health of inmates will be shortsighted ifthey fail to provide support after release or if they focus too narrowlyon specific services. For instance, efforts to improve care for inmates todate have referred largely to the risk of spreading infectious disease, aswell as the potential cost savings of rigorous prison health programs.41
Likewise, some evidence shows that ex-prisoners with HIV who are notprovided with services upon release see a rebound in their viral loads80
and that programs providing postrelease services save costs by preventingnew infections.81 These arguments are compelling, but perhaps an evenmore persuasive case could be made if spillover effects of this sort werenot limited to infectious disease. Viewing former inmates broadly ashealth care consumers in a revenue-sensitive system implies a muchdifferent set of possibilities than regarding them narrowly as diseasevectors in neighborhoods.
Our results point to another paradox: systems that may be progres-sive from the standpoint of punishment may not be as progressive fromthe standpoint of health. We found a sharp difference in the effects ofcommunity supervision and prison. Ordinarily, community supervisionis seen as a less severe form of punishment and a more affordable al-ternative to incarceration. The appeal of such programs has grown asthe costs of maintaining overcrowded prisons have risen. Our resultssuggest that community supervision does not result in spillover effectsin the same fashion as prison does, but community supervision nonethe-less has some negative effects and, in certain instances, could lead toworse outcomes. The lower average effect of community supervision

550 J. Schnittker et al.
likely masks considerable between-state heterogeneity, as the characterof community supervision varies. Not all states provide health care tothose under supervision, and some serving under community supervi-sion might benefit from the consolidated health services made availablein some prison settings. It is likely that virtually all those who wereonce under community supervision suffered the detrimental effects ofa criminal record, especially on employment, which could ultimatelydiminish access to care. In evaluating alternative punishments and theircosts, it is essential to consider linkages between criminal justice andhealth care.
Limitations
Our study has several limitations, some of which affected how we in-terpreted the findings. The first pertains to geography. We focused onstate-level indicators of incarceration and health insurance, but thereis a potential asymmetry between what we could gather at the statelevel and the actual topography of care. We used state-level data be-cause the state is the level at which correctional policy and many publichealth insurance programs, including Medicaid, are administered. Forthis reason, the policy levers for redressing spillover effects reside largelywith states. Yet some spillover effects almost certainly occur in a muchsmaller geographic area. Consumers tend to visit providers that are nearto them, and physicians are affiliated with hospitals close to their ownpractices.82 As a result, our state-level indicators are imperfectly corre-lated with the market experiences of the CTS respondents. This made ourresults conservative, but it also pointed to some useful sensitivity tests.We found significant relationships between incarceration and health careeven among well-resourced patients, including the well educated, whoare less likely to be restricted to providers in their immediate area.
It also was useful to compare our estimates of the effects of unin-surance with those based on smaller geographic units. Using the 2000Community Tracking Study, Pagan and Pauly24 estimated, as we did,the spillover effects of aggregate uninsurance on unmet need. But theyfocused on communities rather than states. Despite using a geogra-phy more tailored to the actual market for care, they discovered effectsof community uninsurance that are similar in magnitude to those pro-duced by our models. One explanation for the empirical consistency over
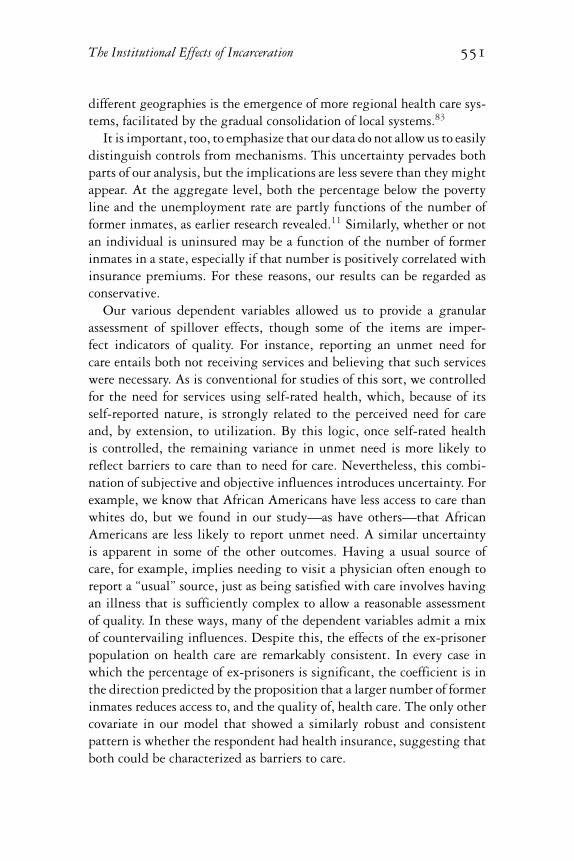
The Institutional Effects of Incarceration 551
different geographies is the emergence of more regional health care sys-tems, facilitated by the gradual consolidation of local systems.83
It is important, too, to emphasize that our data do not allow us to easilydistinguish controls from mechanisms. This uncertainty pervades bothparts of our analysis, but the implications are less severe than they mightappear. At the aggregate level, both the percentage below the povertyline and the unemployment rate are partly functions of the number offormer inmates, as earlier research revealed.11 Similarly, whether or notan individual is uninsured may be a function of the number of formerinmates in a state, especially if that number is positively correlated withinsurance premiums. For these reasons, our results can be regarded asconservative.
Our various dependent variables allowed us to provide a granularassessment of spillover effects, though some of the items are imper-fect indicators of quality. For instance, reporting an unmet need forcare entails both not receiving services and believing that such serviceswere necessary. As is conventional for studies of this sort, we controlledfor the need for services using self-rated health, which, because of itsself-reported nature, is strongly related to the perceived need for careand, by extension, to utilization. By this logic, once self-rated healthis controlled, the remaining variance in unmet need is more likely toreflect barriers to care than to need for care. Nevertheless, this combi-nation of subjective and objective influences introduces uncertainty. Forexample, we know that African Americans have less access to care thanwhites do, but we found in our study—as have others—that AfricanAmericans are less likely to report unmet need. A similar uncertaintyis apparent in some of the other outcomes. Having a usual source ofcare, for example, implies needing to visit a physician often enough toreport a “usual” source, just as being satisfied with care involves havingan illness that is sufficiently complex to allow a reasonable assessmentof quality. In these ways, many of the dependent variables admit a mixof countervailing influences. Despite this, the effects of the ex-prisonerpopulation on health care are remarkably consistent. In every case inwhich the percentage of ex-prisoners is significant, the coefficient is inthe direction predicted by the proposition that a larger number of formerinmates reduces access to, and the quality of, health care. The only othercovariate in our model that showed a similarly robust and consistentpattern is whether the respondent had health insurance, suggesting thatboth could be characterized as barriers to care.

552 J. Schnittker et al.
The Affordable Care Act and the Possibility ofReform
The health care landscape has changed since 2010 (when our aggregate-level analyses ended). The Affordable Care Act (ACA) was passed in2010, and its rollout is ongoing. The ACA affects ex-prisoners in severalways, including by expanding Medicaid, by requiring most individualsto obtain health insurance, and by creating health insurance exchangesthat will enable low-income individuals to purchase insurance. Althoughthese elements might mitigate some of the difficulties that former in-mates face, they clearly will not eliminate them. Simulations consideringthe take-up of Medicaid among former inmates estimate that 22% to34% of former inmates would enroll in an insurance plan.84 Amongthose not eligible for Medicaid, 24% would be eligible for insurance taxcredits that might allay the cost of buying private, nonemployer cover-age through an exchange. The ACA is an improvement over the statusquo, but it is not a cure for the problems introduced by incarceration.We should not expect it to eliminate the spillover effects found here,although it might dampen their impact.
The fact that an unusually ambitious reform initiative fails to elim-inate the problem does not mean that the spillover effects of incarcer-ation are out of reach of policy. On the contrary, the spillover effectsof incarceration on health care are subject to perhaps more points ofmelioration than are many other spillover effects of incarceration. Fur-thermore, spillovers with respect to health care may be less subject tothe political forces that make other aspects of prison reform difficult.The political effects of incarceration, for instance, ultimately dependon felon disenfranchisement laws. Eliminating these specific institu-tional effects of incarceration, therefore, depends on eliminating thosespecific laws. Similarly, reducing the labor market effects of incarcer-ation depends partly on restricting the ability of employers to dis-criminate on the basis of a criminal record. In the case of health care,however, efforts to reduce spillover effects need not be directed towardonly current or former inmates or laws pertaining to criminal justice.The expansion of the already existing health care safety net, includingMedicaid, would surely ease many of the financial pressures underly-ing spillovers. In this regard, some advocates recommend suspendingrather than terminating Medicaid benefits for inmates, which wouldmake it easier for them to regain benefits upon release.45 It is also

The Institutional Effects of Incarceration 553
worth emphasizing that the politics of the Affordable Care Act—whichare plainly quite strong—may be at least partly related to incarcera-tion, insofar as felon disenfranchisement can tilt elections in favor ofpoliticians less open to Medicaid expansion.85 It is very unlikely thatenfranchising former inmates would have been enough to shift electionsso that most states accepted the Medicaid expansion.12 Yet felon disen-franchisement represents another mechanism by which political factorscan accentuate disadvantage in ways that redound on the health caresystem.
Conclusion
The case for providing additional resources to former inmates is oftenmade in light of the harm done by a criminal record: incarceration under-mines employment, wages, and health, and, by extension, the well-beingof children, families, and communities. We found this case compellingon its own merits, but our study adds to the debate by expanding theledger. We showed that incarceration affects those institutions directlyresponsible for health and well-being and that individuals far removedfrom the criminal justice system are affected as well. We also showedthat the institutional effects of incarceration are not limited to a finite setof pathways and, indeed, that it is worth considering a more expansiveframework for understanding institutional effects. While the effects ofincarceration on unemployment rates are premised on keeping inmatesout of the labor market, the effects of incarceration on health care arepremised on the fact that inmates will always be in the market for healthservices. Similarly, whereas the institutional effects of incarceration onvoting might increase inequality, the effects of incarceration on healthcare lower its quality for everyone. Finally, whereas neighborhood seg-regation ordinarily deepens the impact of incarceration, the effects ofincarceration on health care spread well beyond local boundaries.
Although we did not emphasize health outcomes, the pathways wedocumented with respect to health care likely undermine health as well.Reducing access to care compromises the health of former inmates inthe first instance, but in the long run it may affect the health of otherstoo. These results thus suggest a corollary to Dostoyevsky’s famousadmonition.86 Just as a society’s degree of civilization may be judged

554 J. Schnittker et al.
by its prisons, so too may its number of prisoners affect its capacity toprovide a civilized level of care.
References
1. Western B. Punishment and Inequality in America. New York, NY:Russell Sage; 2006.
2. Wakefield S, Uggen C. Incarceration and stratification. Ann RevSociol. 2010;36:387-406.
3. Wildeman C. Parental imprisonment, the prison boom, andthe concentration of childhood disadvantage. Demography.2009;6:265-281.
4. Comfort M. Punishment beyond the legal offender. Ann Rev LawSoc Sci. 2007;3:271-296.
5. Hagan J, Dinovitzer R. Collateral consequences of imprisonmentfor children, communities, and prisoners. In: Tonry M, PetersiliaJ, eds. Crime and Justice: A Review of Research. Vol 26. Chicago, IL:University of Chicago Press; 1999:121-162.
6. Pettit B. Invisible Men: Mass Incarceration and the Myth of BlackProgress. New York, NY: Russell Sage; 2012.
7. Pettit B, Western B. Mass imprisonment and the life course:race and class inequality in U.S. incarceration. Am Sociol Rev.2004;69:151-169.
8. Clear TR. Imprisoning Communities: How Mass Incarceration MakesDisadvantaged Places Worse. New York, NY: Oxford UniversityPress; 2007.
9. Roberts DE. The social and moral cost of mass incarceration inAfrican American communities. Stanford Law Rev. 2004;56:1271-1305.
10. Sampson RJ, Loeffler C. Punishment’s place: the local concentra-tion of mass incarceration. Daedalus. 2010;139:20-31.
11. Western B, Beckett K. How unregulated is the U.S. labor mar-ket? The penal system as a labor market institution. Am J Sociol.1999;104:1030-1060.
12. Uggen C, Manza J. Democratic contraction? Political consequencesof felon disenfranchisement in the United States. Am Sociol Rev.2002;67:777-803.
13. National Research Council. The Growth of Incarceration in the UnitedStates: Exploring Causes and Consequences. Washington, DC: NationalAcademies Press; 2014.
14. Mayer SE, Jencks C. Growing up in poor neighborhoods: howmuch does it matter? Science. 1989;243:1441-1445.

The Institutional Effects of Incarceration 555
15. Uggen C, Manza J, Thompson M. Citizenship, democracy, and thecivic reintegration of criminal offenders. Ann Am Acad Polit Soc Sci.2006;605:281-310.
16. Bonczar TP. Prevalence of Imprisonment in the U.S. Population, 1974–2001. Washington, DC: US Department of Justice, Bureau ofJustice Statistics; 2003.
17. Carson EA, Golinelli D. Prisoners in 2012: Trends in Admissionsand Releases, 1991–2012. Washington, DC: U.S. Department ofJustice; 2013.
18. Maruschak LM, Bonczar TP. Probation and Parole in the UnitedStates, 2012. Washington, DC: US Department of Justice, Bureauof Justice Statistics; 2013.
19. Carson EA. Prisoners in 2013. Washington, DC: US Departmentof Justice, Bureau of Justice Statistics; 2014.
20. Warren J, Gelb A, Horowitz J, Riordan J. One in 100: Behind Barsin America 2008. Washington, DC: Pew Center on the States, PewCharitable Trusts; 2008.
21. Glaze LE, Maruschak LM. Parents in Prison and Their Minor Chil-dren. Washington, DC: US Department of Justice, Bureau of JusticeStatistics; 2008.
22. Guerino P, Harrison PM, Sabol WJ. Prisoners in the United States.Washington, DC: US Department of Justice, Bureau of JusticeStatistics; 2011.
23. Institute of Medicine. A Shared Destiny: Community Effects of Unin-surance. Washington, DC: National Academies Press; 2003.
24. Pagan JA, Pauly MV. Community-level uninsurance and the un-met medical needs of insured and uninsured adults. Health ServRes. 2006;41:788-803.
25. Pagan JA, Asch DA, Brown CJ, Guerra CE, Armstrong K. Lack ofcommunity insurance and mammography screening rates amonginsured and uninsured women. J Clin Oncol. 2008;26:1865-1870.
26. Institute of Medicine. Coverage Matters: Insurance and Health Care.Washington, DC: National Academies Press; 2001.
27. Schoen C, DesRoches C. Uninsured and unstably insured: theimportance of continuous insurance coverage. Health Serv Res.2000;35:187-206.
28. Fields WW, Asplin BR, Larkin GL, et al. The Emergency MedicalTreatment and Labor Act as a federal health care safety net program.Acad Emerg Med. 2001;8:1064-1069.
29. Wilper AP, Woolhandler S, Boyd JW, et al. The health and healthcare of US prisoners: results of a nationwide survey. Am J PublicHealth. 2009;99:666-672.

556 J. Schnittker et al.
30. Mallik-Kane K, Visher CA. Health and Prisoner Reentry: How Phys-ical, Mental, and Substance Abuse Conditions Shape the Process of Rein-tegration. Washington, DC: Urban Institute Press; 2008.
31. Patterson E. Incarcerating death: mortality in the U.S. state cor-rectional facilities, 1985–1998. Demography. 2010;47:587-607.
32. Rosen DL, Wohl DA, Schoenbach VJ. All-cause and cause-specificmortality among black and white North Carolina state prisoners,1995–2005. Ann Epidemiol. 2011;21:719-726.
33. Schnittker J, John A. Enduring stigma: the long-term effects ofincarceration on health. J Health Soc Behav. 2007;16:115-130.
34. Massoglia M. Incarceration as exposure: the prison, infectiousdisease, and other stress-related illnesses. J Health Soc Behav.2008;16:56-71.
35. Andrus JK, Fleming DW, Knox C, et al. HIV testing in prisoners:is mandatory testing mandatory? Am J Public Health. 1989;79:840-842.
36. Dixon PS, Flanigan TP, DeBuono BA, et al. Infection with thehuman immunodeficiency virus in prisoners: meeting the healthcare challenge. Am J Med. 1993;95:629-635.
37. Rosen DL, Schoenbach VJ, Wohl DA, White BL, Stewart PW,Golin CE. An evaluation of HIV testing among inmates in theNorth Carolina prison system. Am J Public Health. 2009;99:S452-S459.
38. Hammett TM. HIV/AIDS and other infectious diseases amongcorrectional inmates: transmission, burden, and an appropriateresponse. Am J Public Health. 2006;96:974-978.
39. Gaes GG, Kendig N. The skill sets and health care needs of releaseoffenders. In: Travis J, Waul M, eds. Prisoners Once Removed: TheImpact of Incarceration and Reentry on Children, Families, and Commu-nities. Washington, DC: Urban Institute Press; 2003:105-153.
40. Freudenberg N. Jails, prisons, and the health of urban populations:a review of the impact of the correctional system on communityhealth. J Urban Health. 2001;78:214-235.
41. Hammett T. Making the case for health interventions in correc-tional facilities. J Urban Health. 2001;78:236-240.
42. Baillargeon J, Giordano TP, Rich JD, et al. Accessing antiretroviraltherapy following release from prison. JAMA. 2009;301:848-857.
43. Pager D, Western B, Bonikowski B. Discrimination in a low-wagelabor market: a field experiment. Am Sociol Rev. 2009;74:777-799.
44. Lutzsky AW, Holahan J, Wiener JM. Health Policy for Low-IncomePeople: Profiles of 13 States. Washington , DC: Urban Institute Press;2002.

The Institutional Effects of Incarceration 557
45. Wakeman S, McKinney M, Rich J. Filling the gap: the impor-tance of Medicaid continuity for former inmates. J Gen Intern Med.2009;24:860-862.
46. Morrissey JP, Dalton KM, Steadman HJ, Cuddeback GS, HaynesD, Cuellar A. Assessing gaps between policy and practice in Med-icaid disenrollment of jail detainees with severe mental illness.Psychiatr Serv. 2006;57:803-808.
47. Rosen DL, Dumont DM, Cislo AM, Brockmann BW, Traver A,Rich JD. Medicaid policies and practices in US state prison sys-tems. Am J Public Health. 2014;104:418-420.
48. Mallik-Kane K. Returning Home Illinois Policy Brief: Health andPrisoner Reentry. Washington, DC: Urban Institute Justice PolicyCenter; 2005.
49. Wang EA, Hong CS, Shavit S, Sanders R, Kessell E, Kushel MB.Engaging individuals recently released from prison into primarycare: a randomized trial. Am J Public Health. 2012;102:e22-e29.
50. Conklin T, Lincoln T, Tuthill R. Self-reported health and priorhealth behaviors of newly admitted correctional inmates. Am JPublic Health. 2000;90:1939-1941.
51. Meyer JP, Qiu J, Chen NE, Larkin GL, Altice FL. Emergencydepartment use by released prisoners with HIV: an observationallongitudinal study. PLoS ONE. 2012;7:e42416.
52. LaCalle E, Rabin E. Frequent users of emergency departments:the myths, the data, and the policy implications. Ann Emerg Med.2010;56:42-48.
53. Jha A, Orav J, Li Z, Epstein AM. Concentration and quality ofhospitals that care for elderly black patients. Archives Intern Med.2007;167:1177-1182.
54. Smith DB. The racial segregation of hospital care revisited: Medi-care discharge patterns and their implications. Am J Public Health.1998;88:461-463.
55. Stevens R. In Sickness and in Wealth: Amerca’s Hospitals in the Twen-tieth Century. New York, NY: Basic Books; 1989.
56. Cunningham PJ, Tu HT. A changing picture of uncompensatedcare. Health Aff. 1997;16:167-175.
57. Needleman J. Nonprofit to for-profit conversions by hospitals,health insurers, and health plans. Public Health Rep. 1999;114:108-119.
58. Derlet RW. Overcrowding in emergency departments: increaseddemand and decreased capacity. Ann Emerg Med. 2002;39:430-432.
59. Lipscomb J. Managed care market penetration, spillover effects,and the quality of cancer care. J Natl Cancer Inst. 2005;97:242-244.
558 J. Schnittker et al.
60. Joy JE, Penhoet EE, Pettiti DB. Saving Women’s Lives: Strategies forImproving Breast Cancer Detection and Diagnosis. Washington, DC:Institute of Medicine and National Research Council; 2005.
61. Eberth JM, Eschbach K, Morris JS, Nguyen HT, Hossain MM,Elting LS. Geographic disparities in mammography capacity in theSouth: a longitudinal assessment of supply and demand. Health ServRes. 2014;49:171-185.
62. Center for Studying Health System Change. Community TrackingStudy Household Survey, 1996–2003 (computer file). Washing-ton, DC: Center for Studying Health System Change (producer);Ann Arbor, MI: Interuniversity Consortium for Political and SocialResearch (distributor); 2003.
63. Cunningham PJ, Kemper P. Ability to obtain medical care for theuninsured: how much does it vary across communities? JAMA.1998;280:921-927.
64. Andersen R, Newman JF. Societal and individual determinantsof medical care utilization in the United States. Milbank Q.1973;51:95-124.
65. Andersen RM. Revisiting the behavioral model and access to med-ical care: does it matter? J Health Soc Behav. 1995;36:1-10.
66. Miilunpalo S, Vuori I, Oja P, Pasanen M, Urponen H. Self-rated health status as a health measure: the predictive value ofself-reported health status on the use of physician services andon mortality in the working-age population. J Clin Epidemiol.1997;50:517-528.
67. State Health Access Data Assistance Center. Comparing stateunisurance estimates: SHADAC-enhanced CPS and CPS (issuebrief no. 21). Minneapolis, MN: University of Minnesota; 2010.
68. Kaiser Family Foundation. The Kaiser Family Foundation statehealth facts. Menlo Park, CA: Kaiser Family Foundation; 2013.http://kff.org/statedata/. Accessed August 2013.
69. Barker V. The politics of punishing: building a state governancetheory of American imprisonment variation. Punishment & Society.2006;8:5-33.
70. Beckett K, Western B. Governing social marginality: welfare, in-carceration, and the transformation of state policy. Punishment Soc.2001;3:43-59.
71. Sugie NF. Punishment and welfare: paternal incarceration andfamilies’ receipt of public assistance. Soci Forces. 2012;90(4):1403-1427.
72. University of Kentucky Center for Poverty Research. UKCPRnational welfare data, 1980–2013. Lexington, KY: Gatton

The Institutional Effects of Incarceration 559
College of Business and Economics, University of Kentucky; 2014.http://www.ukcpr.org/data. Accessed November 5, 2014.
73. Beck N, Katz JN. Modeling dynamics in time-series cross-sectional political economy data. Social science working paper no.1304. Pasadena, CA: California Institute of Technology; 2009.
74. Binswanger IA, Stern MF, Deyo RA, et al. Release from prison—ahigh risk of death for former inmates. N Engl J Med. 2007;356:157-165.
75. Garcia TC, Bernstein AB, Bush MA. Emergency department vis-its and visitors: who used the emergency room in 2007? NCHSdata brief no. 38. Hyattsville, MD: National Center for HealthStatistics; 2010.
76. Rose DR, Clear TR. Incarceration, reentry, and social capital: socialnetworks in the balance. In: Travis J, Waul M, eds. Prisoners OnceRemoved: The Impact of Incarceration and Reentry on Children, Fam-ilies, and Communities. Washington, DC: Urban Institute Press;2003:313-341.
77. Wacquant L. Punishing the Poor: The Neoliberal Government of SocialInsecurity. Durham, NC: Duke University Press; 2009.
78. Sarrazin MV, Campbell M, Rosenthal GE. Racial differences inhospital use after acute myocardial infarction: does residential seg-regation play a role? Health Aff. 2009;28:w368-w378.
79. Abraham LK. Mama Might Be Better off Dead: The Failure of HealthCare in Urban America. Chicago, IL: University of Chicago Press;1993.
80. Stephenson BL, Wohl DA, Golin CE, Tien H-C, Stewart P, KaplanAH. Effect of release from prison and re-incarceration on the viralloads of HIV-infected individuals. Public Health Rep. 2005;120:84-88.
81. Varghese B, Peterman T. Cost-effectiveness of HIV counseling andtesting in US prisons. J Urban Health. 2001;78:304-312.
82. Wennberg JE, Cooper MM. The Dartmouth Atlas of Health Carein the United States. Chicago, IL: American Hospital Publishing,1996.
83. Cuellar AE, Gertler PJ. Trends in hospital consolidation: the for-mation of local systems. Health Aff. 2003;22:77-87.
84. Cuellar AE, Cheema J. As roughly 700,000 prisoners are releasedannually, about half will gain health coverage and care under federallaws. Health Aff. 2012;31:931-938.
85. Manza J, Uggen C. Locked Out: Felon Disenfranchisement and AmericanDemocracy. New York, NY: Oxford University Press; 2006.
86. Dostoyevsky F. The House of the Dead (1862). London: Penguin;1985.

560 J. Schnittker et al.
Funding/Support: This research was funded in part by a Robert Wood JohnsonFoundation Health Investigator Award to Jason Schnittker and ChristopherUggen.
Conflict of Interest Disclosures: All authors have completed and submitted theICMJE Form for Disclosure of Potential Conflicts of Interest. No disclosureswere reported.
Acknowledgments: The authors thank audiences at Rutgers University, the Uni-versity of Wisconsin, and the International Sociological Association for helpfulcomments.
Address correspondence to: Jason Schnittker, University of Pennsylvania, Depart-ment of Sociology, 3718 Locust Walk, Philadelphia, PA 19104-6299 (email:[email protected]).