institutional spillovers, public financial support and r&d
TRANSCRIPT

Paper to be presented at the DRUID 2012
on
June 19 to June 21
at
CBS, Copenhagen, Denmark,
Institutional Spillovers, Public Financial Support and R&D Cooperation
Strategies in Spanish FirmsROCIO PRIETOBANK OF SPAIN
PUBLIC SECTOR AND FISCAL [email protected]
Maite Martínez-Granado
NAIDER and University of the Basque Country
Yolanda Rebollo-SanzUniversidad Pablo de OlavideDepartamento de Economía
AbstractWe explore the role of public support on innovating firm´s decisions to engage in R&D cooperation, differentiatingbetween institutional and private R&D cooperation. In particular, we explore the role of institutional incoming spillovers,legal protection for innovations, and financial public support in affecting firm?s decisions to cooperate in R&D. For thatpurpose, we use the Spanish Technological Innovation Panel and apply a multivariate probit estimation in order tocontrol for potential simultaneities on firm?s decisions. We find that unless one controls for these simultaneity biases,one would overestimate the incidence of the public variables considered on the probability of undertaking R&D

cooperation, both public and private. Once this simultaneity biases are taken into account we still find that institutionalincoming spillovers foster R&D cooperation, but public subsidies and the use of legal protection of innovations just affectR&D cooperation with public institutions. These effects remain to be economically relevant. For instance, for the averagefirm, the probability of undertaking R&D cooperative agreements with public institutions increases from 7% to 40% wheninstitutional spillovers are rated as high, from 10% to 24% when the firm receives public subsidies and from 12% to 24%when the firm has made use of legal methods for protecting innovations. The probability of undertaking R&D cooperativeagreements with private institutions increases from 20% to 34% when institutional spillovers are rated as high.
Jelcodes:L53,-
1
Institutional Spillovers, Public Financial Support and
R&D Cooperation Strategies in Spanish Firms
October 2011
Abstract:
We explore the role of public support on innovating firm´s decisions to engage in R&D
cooperation, differentiating between institutional and private R&D cooperation. In particular,
we explore the role of institutional incoming spillovers, legal protection for innovations, and
financial public support in affecting firm’s decisions to cooperate in R&D. For that purpose, we
use the Spanish Technological Innovation Panel and apply a multivariate probit estimation in
order to control for potential simultaneities on firm’s decisions. We find that unless one controls
for these simultaneity biases, one would overestimate the incidence of the public variables
considered on the probability of undertaking R&D cooperation, both public and private. Once
this simultaneity biases are taken into account we still find that institutional incoming spillovers
foster R&D cooperation, but public subsidies and the use of legal protection of innovations just
affect R&D cooperation with public institutions. These effects remain to be economically
relevant. For instance, for the average firm, the probability of undertaking R&D cooperative
agreements with public institutions increases from 7% to 40% when institutional spillovers are
rated as high, from 10% to 24% when the firm receives public subsidies and from 12% to 24%
when the firm has made use of legal methods for protecting innovations. The probability of
undertaking R&D cooperative agreements with private institutions increases from 20% to 34%
when institutional spillovers are rated as high.

2
1. Introduction and motivation
R&D cooperation is a business strategy that has several positive effects associated: through the
exploitation of synergies or the sharing of costs and risks, there is evidence that it enhances
inputs (R&D expenditures in-house) and outputs (innovations introduced) of the R&D process
(see Becker and Dietz, 2004). In addition, research cooperation does not only imply purely
economic profits at a firm-level but it also generates continuous flows of knowledge and
technology that benefit the firms involved, in particular, and the whole economy (Ordover and
Willlig, 1985; Jacquemin, 1988; Shapiro and Willig, 1990, Cassiman, 1998), in general.
In this context the public support of the cooperative R&D might have a double dividend since it
leverages in-house resources for R&D and it increases the probabilities of success. The
complexity of the cooperative R&D process makes that the public support can take different
forms: first, the support can be financial; second, the support can materialize through the
knowledge generated in public research institutions that spills over firms, promoting the transfer
of knowledge and improving the absorptive capacity of the firms; third, the support can take the
form of regulations that foster the appropriability of the new knowledge by the firms (e.g. legal
protection for innovations).
In this paper we investigate the role of different types of public support on the innovative firm´s
decision to engage in R&D cooperation. In particular, using the Spanish Technological
Innovation Panel (PITEC) we explore the role of institutional incoming spillovers (the
importance of the knowledge coming from public research institutions), legal protection for
innovations, and financial public support in the decision of Spanish firms to cooperate in R&D.
This paper contributes to the empirical literature on R&D cooperation in several aspects.
Firstly, when measuring the role of different public instruments in fostering the undertaking of
R&D cooperative agreements we do not exclusively focus on the receipt of financial support.
Secondly, the econometric approach followed to control for endogeneity issues depart from the
two step approach typically applied in the literature (Cassiman and Veugelers, 2002;
Abramovsky, et al, 2005; Belderbos et al, 2004). In particular, we estimate a multivariate probit
model that jointly determines the decision to engage in two types of R&D cooperation –
institutional versus private-, as well as it controls for potential simultaneity problems when
measuring the influence of certain public instruments on innovating firm´s decisions to engage
in R&D cooperation. Thirdly, our analysis includes both firms belonging to the manufacturing
sector and firms from the service sector.
We find that unless one controls for these simultaneity biases, one would overestimate the
incidence of the public variables considered on the probability of undertaking R&D

3
cooperation, both public and private. Once this simultaneity biases are taken into account we
still find that institutional incoming spillovers foster R&D cooperation with public and private
institutions. Meanwhile public subsidies seem to foster R&D cooperation only with public
institutions: for the average firm, the probability of undertaking R&D cooperative agreements
with public institutions increases from 7% to 40% when institutional spillovers are rated as
high, from 10% to 24% when the firm receives public subsidies and from 12% to 24% when the
firm has made use of legal methods for protecting innovations. The probability of undertaking
R&D cooperative agreements with private institutions increases from 20% to 34% when
institutional spillovers are rated as high. Regarding the effects of institutional incoming
spillovers, some interesting differences emerge between public and private cooperation.
Institutional incoming spillovers have a larger effect on cooperation with research institutes.
Firms cooperating with public institutions seem to attach a higher importance to institutional
incoming spillovers, while institutional incoming spillovers seem to affect the likelihood of
private cooperation to a lesser extent.
This paper is structured as follows. Section 2 includes the review of the existing literature in the
field of cooperation in innovation. Section 3 contains the description of the data and its
descriptive analysis. Section 4 explains the econometric strategy that has been applied in this
study and Section 5 shows the results obtained from the estimations. Section 6 includes the
main conclusions that could be derived from the analysis and finally, the different appendixes
are provided.
2. Theoretical Background and Previous Empirical Literature
During the last decades inter-firm collaboration has boomed at the same time that international
competition has intensified. In particular, cooperation in research has increased at a very fast
rate (Caloghirou et al, 2003) driving an interest for the topic among economist, business
analysts and policy decision makers. That is why different strands of the literature have
theoretically and empirically analyzed the behaviour of firms with respect to collaborative
R&D. Hagedoorn et al (2000) or Caloghirou et al (2003) classify and revise some of the main
reasons behind firm cooperation in R&D from the point of view of the management (transaction
costs and strategic management) and industrial organization literature. We will centre in this last
strand.
From the industrial organization perspective, firms tend to collaborate with others in R&D
projects when the benefits of cooperating are above the costs of doing so. In this respect, IO
theoretical models tend to focus on the timing (Martin, 1994, 1999) or extend (D’Aspremont
and Jacquemin, 1988) of innovation: firms collaborate since cooperation accelerates innovation
or because with cooperation they spend more on R&D and are increasingly more profitable
4
compared to non-cooperating firms (see Cassiman and Veugelers, 2002). The key point of this
perspective is the reduction of the costs of knowledge generation for the firm by spreading this
cost and the risk associated to R&D projects (see Sakakibara, 1997).
An important ingredient in this literature is the particular nature of technological knowledge.
Markets do not perfectly work with this intangible for two reasons: The presence of externalities
(spillovers) and the presence of opportunism and uncertainty. In the first case, the producer of a
new or improved product or process is unable to fully internalise the incremental benefits
flowing to buyers or to other agents. Spillovers flow from external sources to the firm (incoming
spillovers) and from the firm to external agents (outgoing spillovers). In the second case, the
buyer and the seller of knowledge have different incentives: on the one hand, the buyer needs to
have extensive information of the new technology before buying it; on the other hand, the seller
might be reluctant to disclose all the details of a technology before the transaction is complete
since that will reduce its value. This contraposition of interest is exacerbated when property
rights are not well enforced.
The key aspects that determine cooperation in this framework are the extension of the generated
spillovers and the degree to which firms have internal capabilities to successfully capitalise the
returns from innovation (absorptive capacity and appropriability). Most of the theoretical
literature finds that spillovers increase the profitability of cooperation in R&D when they are
high enough (De Bondt and Veugelers, 1991). Moreover, firms might attempt to minimise
outgoing spillovers while maximising incoming spillovers (Cassiman et al, 2002, Amir et al,
2003). To maximise incoming spillovers the firms can invest in absorptive capacity (own R&D
as in Cohen and Levinthal, 1989, or broadening their research scope as in Kamien and Zang,
2000).
Nevertheless, while the level of spillovers influences the decision of a firm to cooperate in
R&D, the decision to cooperate also affects the level of incoming and outgoing spillovers in an
important way. A cooperative agreement increases the incoming spillovers. This might be the
result of information sharing between partners. In addition, empirical evidence (Cassiman and
Veugelers, 2002) has shown that absorptive capacity of and individual firm increases the
importance of these incoming spillovers. Partners in a cooperative agreement also have more
effective protection against outgoing spillovers. This suggests that firms that engage in a
cooperative agreement invest in protecting the information transferred and created in the
cooperative agreement. Furthermore, the effects of incoming and outgoing spillovers, depend on
the type of research partner. In cooperative agreements with research organizations or
universities, the level of incoming spillovers is an important factor. This is related to the more
generic nature of these information flows. When cooperating with suppliers or customers,
partners worry more about the outgoing spillovers.

5
In summary, the IO literature suggests that spillovers increase the incentives to cooperate,
especially if the firms are able to increase the incoming information flows. The effects of
appropriability seem more ambiguous: on the one hand imperfect appropriability increases the
potential benefits of cooperative R&D agreements but on the other hand increases the incentive
of firms to free ride on each other’s R&D investments, reducing therefore the cooperation rate.
With respect to the empirical literature on R&D cooperation, some studies have focused on the
effect of R&D cooperation (e.g., sales of innovative products as in Lööf and Heshmati, 2002, or
Aschhoff and Schmidt, 2008, sales growth as in Cincera et al, 2003, or productivity growth as in
Belderbos et al, 2004a) but most of the it concentrates on explaining the determinants of R&D
cooperation. In general, product complementarities and complementarities in technology do
have a positive effect on R&D, as the ability of share costs and risks, the size and R&D
intensity, even when controlling for the possible simultaneity of the last one.
Concentrating on the effect of spillovers, Cassiman and Veugelers (2002) measure them as the
publicly available information for the innovation process of the firm in a sample of Belgian
manufacturing firms. They find a significant relation between the propensity to cooperate and
the incoming spillovers. Additionally, they find that the higher the degree of appropriability of
research the higher the probability of cooperation. The authors distinguish to some extend
between public and private vertical cooperation (with suppliers or customers). Abramovsky et al
(2009) confirm the previous results with data for Spain, Germany, UK and France,
distinguishing between cooperation with research institutions, suppliers and customers and
competitors. They also consider the effect that public support has on cooperation and find that it
increases the probability of cooperation particularly with research institutions. None of these
two studies allow for possible correlation of the different strategic types of cooperation while
they do allow for the possible endogeneity of the main explanatory variables (appropriability,
incoming spillovers) using two step methods. Belderbos et al (2004b), with data of Dutch firms,
allow for correlation between different strategic types of cooperation. Their results are in line
with the ones from the other studies: incoming spillovers are an important determinant of R&D
cooperation. They distinguish between different types of spillovers depending on its origin
(institutional or public, from the competitors, from the customers or from the suppliers) and find
that each type of incoming spillover influences mainly its particular type of cooperation.
Institutional spillovers (the ones considered in the previous mentioned papers) influence
positively any type of cooperation.
With respect to the empirical literature for Spain, Bayona et al (2001) look at the determinants
of cooperation in a sample of Spanish manufacturing firms. They found that motivations for
R&D cooperation are mainly due to technological complexity, with the objective of risk sharing
and of finding financial resources. More recently, Lopez (2008) analyses the effect of spillovers

6
on the cooperation decisions of manufacturing firms and finds a positive effect (smaller when
accounting by endogeneity). The effect is only important in R&D cooperation between firms
and research institutions. Appropriability has also a positive effect although the level of legal
protection of the industry influences negatively R&D cooperation.
Summing up, the theoretical models point out that public policies might have a role in fostering
R&D cooperation agreements, given the positive effects it has on innovation. Nevertheless,
when considering the causal effect of these public policies one must be aware of the potential
endogeneity problems from the side of the firm. Furthermore, there is little empirical literature
that carefully studies the incidence of different public policies, beyond the receipt of financial
support, on the probability of undertaking R&D cooperative agreements.
3. The Database and Main Descriptive Statistics
The database used in the analysis contains firm-level information from The Technological
Innovation Panel (PITEC). This database is derived from the Community Innovation Survey
(CIS), which is conducted by the Spanish Statistical Institute (INE) once a year, and it examines
the technological innovative activities of Spanish firms since 2003. This survey contains
questions characterizing the R&D strategies of firms: whether they innovate or not, how they
acquire knowledge and technology, as well as whether they cooperate or not. In addition, the
data allow identifying the motives of and obstacles to innovation, sources of technological
information as well as mechanism used to protect the results of innovation.
In relation to the cooperation behaviour, in each questionnaire (2003-2008), the firm is asked
whether it has cooperated in R&D during the previous three years. We analyze the determinants
of R&D cooperation that has been carried out by the Spanish firms making use of the 2007
survey1. The panel dimension allows us to use the 2004 survey in order to include some lagged
information about two variables -R&D intensity and Size- since they contain annual information
This way, we will have a final sample that is composed of firms that are interviewed in the 2007
survey, but which also were present in the survey of 2004.
The final database contains 6410 innovative firms. Throughout the paper we define innovative
firms as those who introduced a product or process innovation, or engaged in innovative
activities during the period 2005-2007, including those who started but subsequently abandoned
their innovation activities within that period of time2. Furthermore, we examine the
1 Despite having a more recent data file -2008- at our disposal, we have decided to work with the 2007 survey in
order to ensure that our results were not biased by the economic recession that started in 2008. 2 This kind of sample selection is common within the existing literature in the current field of study. It should be
noticed though that the interpretation of our results may be cautious since they will be applied only to actively
innovative firms.

7
determinants of R&D cooperation among a sub-sample lacking any cooperative agreements in
the period of time previous to the analyzed one, i.e., 2002-2004 (new cooperation sample). This
approach enables the assessment the factors that determine the creation of strictly new R&D
cooperative agreements since the effect of any past cooperation is removed. The new
cooperation sample contains 3388 innovative firms.
3.1 Descriptive Statistics/Summary Statistics
A description of all the variables used throughout the analysis and of its summary statistics can
be found in Appendix A1 and Appendix A2.
Table 1 shows that cooperation is a business strategy implemented by 34.24% of the full sample
of innovative firms. This share drops to 20.45% for the innovative firms that did not collaborate
in the past period (2002-2004). It can also be noticed that, among those 34.24% of cooperating
firms, the most preferred strategy consists on reaching agreements with both private companies
and public institutions (46.33% of the cooperating firms). Regarding the new cooperation
sample, firms seem to have a preference for private cooperation (41.41%). The option of
institutional cooperation as an exclusive strategy is less common than the rest.
Table 1: Distribution of R&D Cooperation
Full Sample New Cooperation Sample
Cooperating Firms 2195 (34.24%) 693 (20.45%)
Non-cooperating Firms 4215 (65.76%) 2695 (79.55%)
Total 6410 3388
Institutional Cooperation only 405 (18.45%) 151 (21.79%)
Private Cooperation only 772 (35.17%) 287 (41.41%)
Institutional and Private Cooperation 1017 (46.33%) 255 (36.80%)
Total of Cooperative Firms 2195 693
From now on, the characteristics we focus on are measures of institutional incoming spillovers,
financial public support and legal protection of innovation. Institutional incoming spillovers
measure the importance that firms have placed on the information coming from public
institutions for their innovation activities. We constructed a variable that takes value one if a
high or intermediate importance is given to this source of information and zero otherwise3.
Financial public support refers to funds that the firms may have received for their innovation
activities. Finally, legal protection of innovation measures the extent to which firms have made
use of the different tools at their disposal aiming at protecting their innovations. In particular,
this variable takes the unit value when the firm requested a patent, and/or demanded copyrights,
and/or registered a trademark and/or industrial models and zero otherwise.
3 As in Cassiman and Veugelers (2002) or Abramovsky (2005).

8
Table 2 shows the distribution of firms according to the importance they placed on the
information flows coming from the institutions (institutional incoming spillovers). It can be
observed that a 35.43% stated that institutional spillovers were highly/intermediately important
when carrying out their innovation activities. In the case of the new cooperation sample, a
smaller proportion did so (28.16%). Table 3 describes the relationship between the importance
placed on the institutional spillovers and R&D cooperation. Among the firms who considered
institutional spillovers decisive in innovating, a 60% undertook a cooperative agreement. This
percentage is a bit smaller in the case of newly cooperating firms (41.82%). However, the fact
that the largest proportion corresponds to the case in which firms collaborate not only with
institutions but also with other firms needs to be stressed.
Table 2: Institutional Spillovers
Full Sample
New Cooperation
Sample
High/Intermediate Importance of Institutional Spillovers 2271 (35.43%) 954 (28.16%)
Low/None Importance of Institutional Spillovers 4139 (64.57%) 2434 (71.84%)
Total 6410 3388
Table 3: R&D Cooperation and Institutional Spillovers
High/Intermidiate
Importance on
Institutional Spillovers
(Full Sample)
High/Intermidiate Importance
on Institutional Spillovers
(New Cooperation Sample)
Non-Cooperating Firms 906 (39.89 %) 555 (58.18%)
Cooperating Firms 1365 (60.11%) 399 (41.82%)
Institutional Cooperation only 319 (14.05%) 114 (12.02%)
Private Cooperation only 216 (9.51%) 88 (9.12%)
Institutional and Private Cooperation 830 (36.55%) 197 (21.14%)
Total 2271 954
Table 4 summarizes the different public financial support sources for innovation activities.
Almost a 40% of the innovative firms have received any type of financial support from the
public sector for their innovation projects (33% in the new cooperation sample).
Table 4: Financial Public Support for Innovation Activities
Full Sample
New Cooperation
Sample
Without Financial Support 3885 (60.61%) 2270 (67.00%)
With Financial Support 2525 (39.39%) 1118 (33.00%)
Non-Cooperating Firms 1178 (46.65 %) 729 (65.21%)
Cooperating Firms 1347 (53.35%) 389 (34.79%)
Institutional Cooperation only 261 (10.348%) 91 (8.14%)
Private Cooperation only 302 (11.96%) 113 (10.11%)
Institutional and Private Cooperation 784 (31.05%) 185 (16.55%)
Total 6410 3388

9
Among those firms with any public financial support, 53.35% undertook R&D agreements for
innovation plans (34.79% of the firms in the new cooperation sample). Disaggregating by the
type of collaboration, it seems that there are a larger proportion of financially supported firms
who jointly associated with private and institutional entities for R&D activities. It seems
therefore that public funding is positively correlated with cooperation, although the causality of
this relation would be discussed in next section.
In addition to the financial support, innovation can also be publicly promoted through the
availability of different legal protection methods, such as patents and trademarks. The following
table (Table 6) shows that almost a 30% of the innovative firms (both in the full sample and in
the new cooperation sample) did use some of these means in order to protect their innovations.
Table 6: Legal Protection of Innovation
Full Sample New Cooperation Sample
No Legal Protection 4500 (70.20%) 2415 (71.28%)
Legal Protection 1910 (29.80%) 973 (28.72%)
Non-Cooperating Firms 1036 (54.24 %) 696 (71.53%)
Cooperating Firms 874 (45.76%) 277 (28.47%)
Institutional Cooperation only 146 (7.64%) 59 (6.06%)
Private Cooperation only 234 (12.25%) 99 (10.17%)
Institutional and Private Cooperation 493 (25.81%) 119 (12.23%)
In this case, our two samples behave in a quite different way. Among the innovative firms who
legally protected their innovations, a 45.76% cooperate in R&D activities whereas if those firms
did not formerly cooperate, then only a 28.47% cooperates when innovation has been protected.
Nonetheless, it seems that in both cases, the largest proportion of firms cooperate with their
private equals and institutions.
4. Econometric Approach
Instead of the traditional approach to model cooperation as a probit model (that might or might
not include some endogenous variable) we propose a multivariate probit model (MVP), that
jointly determines the decision to engage in R&D cooperation and other firm’s decisions such
as the use of public financial support for R&D, legal protection for innovations and institutional
incoming spillovers.
In order to correctly identify the causal effects of these variables on the firm’s propensity to
engage in R&D cooperative agreements one must take into account the existence of
simultaneity biases. The empirical literature has already pointed out the importance of taking
into account the endogeneity of incoming and outcoming spillovers (see for instance, Belderbos
10
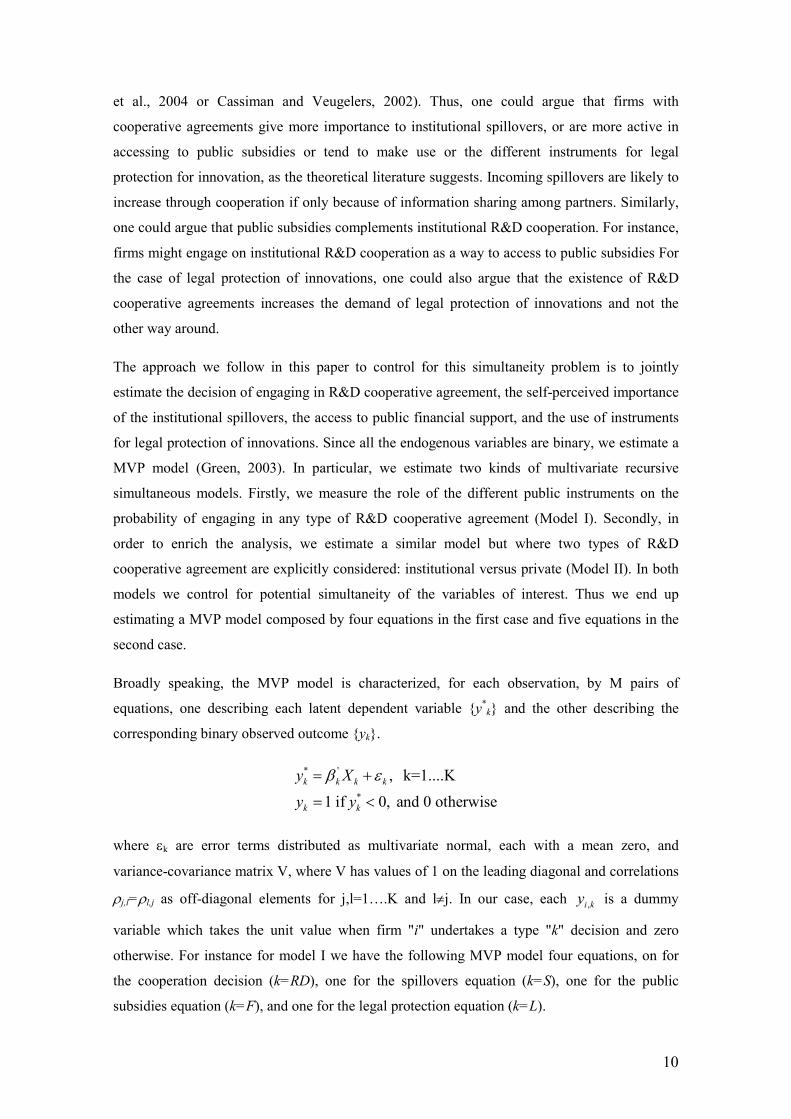
et al., 2004 or Cassiman and Veugelers, 2002). Thus, one could argue that firms with
cooperative agreements give more importance to institutional spillovers, or are more active in
accessing to public subsidies or tend to make use or the different instruments for legal
protection for innovation, as the theoretical literature suggests. Incoming spillovers are likely to
increase through cooperation if only because of information sharing among partners. Similarly,
one could argue that public subsidies complements institutional R&D cooperation. For instance,
firms might engage on institutional R&D cooperation as a way to access to public subsidies For
the case of legal protection of innovations, one could also argue that the existence of R&D
cooperative agreements increases the demand of legal protection of innovations and not the
other way around.
The approach we follow in this paper to control for this simultaneity problem is to jointly
estimate the decision of engaging in R&D cooperative agreement, the self-perceived importance
of the institutional spillovers, the access to public financial support, and the use of instruments
for legal protection of innovations. Since all the endogenous variables are binary, we estimate a
MVP model (Green, 2003). In particular, we estimate two kinds of multivariate recursive
simultaneous models. Firstly, we measure the role of the different public instruments on the
probability of engaging in any type of R&D cooperative agreement (Model I). Secondly, in
order to enrich the analysis, we estimate a similar model but where two types of R&D
cooperative agreement are explicitly considered: institutional versus private (Model II). In both
models we control for potential simultaneity of the variables of interest. Thus we end up
estimating a MVP model composed by four equations in the first case and five equations in the
second case.
Broadly speaking, the MVP model is characterized, for each observation, by M pairs of
equations, one describing each latent dependent variable {y*k} and the other describing the
corresponding binary observed outcome {yk}.
* '
*
, k=1....K
1 if 0, and 0 otherwise
k k k k
k k
y X
y y
β ε= +
= <
where εk are error terms distributed as multivariate normal, each with a mean zero, and
variance-covariance matrix V, where V has values of 1 on the leading diagonal and correlations
ρj,l=ρl,j as off-diagonal elements for j,l=1….K and l≠j. In our case, each ,i ky is a dummy
variable which takes the unit value when firm "i" undertakes a type "k" decision and zero
otherwise. For instance for model I we have the following MVP model four equations, on for
the cooperation decision (k=RD), one for the spillovers equation (k=S), one for the public
subsidies equation (k=F), and one for the legal protection equation (k=L).
11
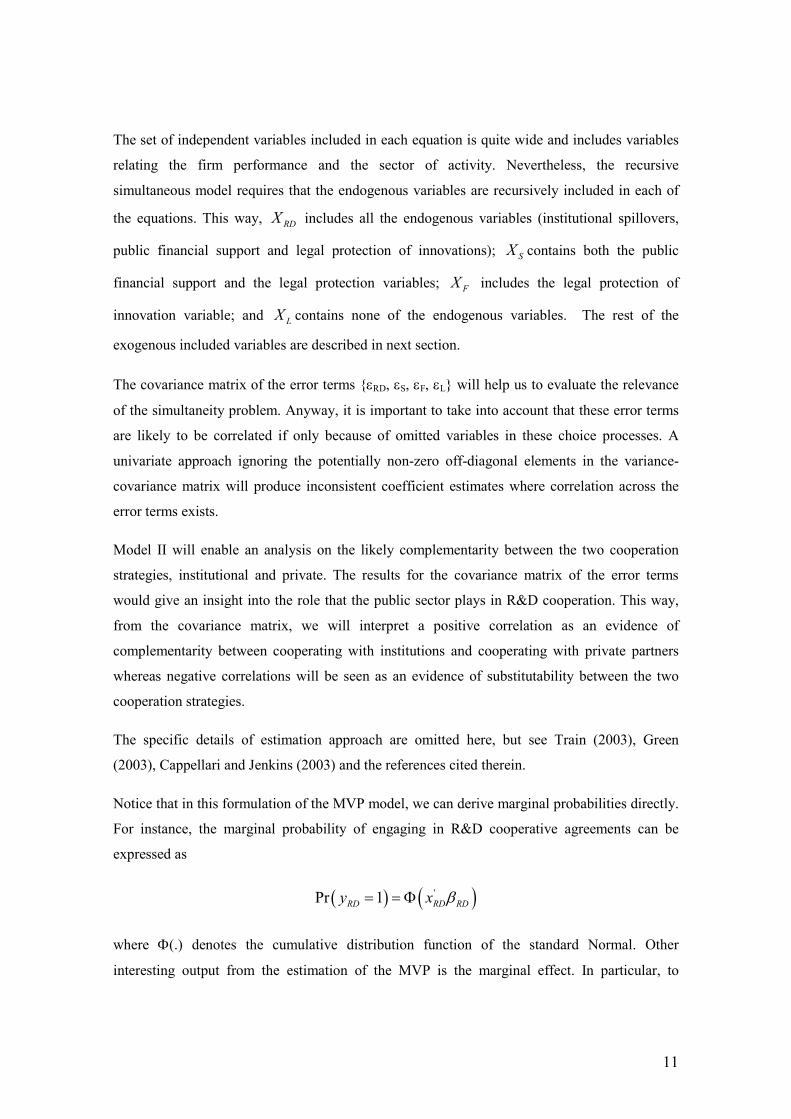
The set of independent variables included in each equation is quite wide and includes variables
relating the firm performance and the sector of activity. Nevertheless, the recursive
simultaneous model requires that the endogenous variables are recursively included in each of
the equations. This way, RDX includes all the endogenous variables (institutional spillovers,
public financial support and legal protection of innovations); SX contains both the public
financial support and the legal protection variables; FX includes the legal protection of
innovation variable; and LX contains none of the endogenous variables. The rest of the
exogenous included variables are described in next section.
The covariance matrix of the error terms {εRD, εS, εF, εL} will help us to evaluate the relevance
of the simultaneity problem. Anyway, it is important to take into account that these error terms
are likely to be correlated if only because of omitted variables in these choice processes. A
univariate approach ignoring the potentially non-zero off-diagonal elements in the variance-
covariance matrix will produce inconsistent coefficient estimates where correlation across the
error terms exists.
Model II will enable an analysis on the likely complementarity between the two cooperation
strategies, institutional and private. The results for the covariance matrix of the error terms
would give an insight into the role that the public sector plays in R&D cooperation. This way,
from the covariance matrix, we will interpret a positive correlation as an evidence of
complementarity between cooperating with institutions and cooperating with private partners
whereas negative correlations will be seen as an evidence of substitutability between the two
cooperation strategies.
The specific details of estimation approach are omitted here, but see Train (2003), Green
(2003), Cappellari and Jenkins (2003) and the references cited therein.
Notice that in this formulation of the MVP model, we can derive marginal probabilities directly.
For instance, the marginal probability of engaging in R&D cooperative agreements can be
expressed as
( ) ( )'Pr 1RD RD RDy x β= = Φ
where Φ(.) denotes the cumulative distribution function of the standard Normal. Other
interesting output from the estimation of the MVP is the marginal effect. In particular, to

12
evaluate the marginal effect of a particular covariate on the marginal probability, we calculate
the linear prediction and use the following expression:
( )( ) 1
1
/ ˆ ˆ' *k
k k
E y Xx
xφ β β
∂=
∂
we then averaged out the marginal effect for each observation (Green, 2003).
For the new cooperation sample case, the mere sample selection implies that the effect of any
past cooperation is removed. Thus, we are able to eliminate the endogeneity problems we have
just put forward, and, then, estimating our models I and II without considering the institutional
spillovers, public subsidies and legal protection variables as endogenous is acceptable. This
Therefore we estimate a univariate probit model for Model I and a bivariate one for Model II. In
addition to this, these estimations will help us in assessing the factors that purely determine the
decision of a firm of undertaking new agreements in R&D activities. Nonetheless, restricting the
sample to those firms who did not cooperate in the previous period would exclude the firms
who persistently cooperate in R&D -successful cooperative projects- and which are the more
likely to undertake R&D agreements. Therefore, comparisons between the model with the full
sample and the one with this sample should be made cautiously.
4.1 Variables
In accordance with the theoretical and empirical review, a wide range of explanatory variables
has been included in our estimations. This set of variables can be put into two groups: one with
the variables that are fundamental by the mere goal of the analysis, and the other that is
composed of variables that enable the control of the individual heterogeneity that is present in
the database in order to identify the causal effect of interest correctly. Among the former group
we can find the spillovers as well as the different instruments of public intervention.
In addition to the Institutional Spillovers variable, we have disaggregated each type of spillovers
in accordance with the source they come from.
Among this first set of explanatory variables, we can also find those related to the different
channels of Public Support for Innovation. In particular, we have included variables associated
with the public financial and two more regressors which capture the different measures at the
firms’ disposal for the support of their innovation activities provided by the public sector. These
are the variables Legal Protection of Innovation and Location in Technology Park. The legal
protection variable is a proxy for which is known in the literature as outgoing spillovers. With
reference to the latter variable, we expect it to have positive effects on R&D cooperation since
13
such locations may imply a competitive advantage when R&D activities are to be carried out
and overall, when collaborative agreements at that respect are to be reached.
Finally, among the control variables we include regressors that describe the obstacles to
innovation -Organizational, Difficulty in Finding a Partner, Risks, Costs-, the individual
characteristics of the firm -R&D Intensity, Size4, High-Intermediate Technological Intensity,
High-Tech Services, Public, Private Multinational, Research Association, Large, National
Market, Enterprise Group, Foreign Head Office, Novelty, Researchers- and the characteristics
of the industry to which the firm belongs -Industry Concentration, Cooperating Firms’ Sales
Ratio, Open Access Spillovers Mean-. For a more detailed description, see Appendix A.
. Main Results
In this section we discuss the results from the estimation of the models proposed in Section 3.
We take into account a broad set of possible explanatory variables, but we concentrate
particularly on the impact of different types of public instruments to foster R&D cooperation:
the effect of institutional incoming spillovers, the effect of public finance of R&D projects and
the effect of the legal protection of innovation. We estimate the model for cooperation without
distinguishing the type of partner (Model I) and distinguishing between cooperation with public
research institutions and cooperation with private agents (Model II). In order to enrich the
analysis, we also present the results of the estimation for a subsample of firms that do not have
previous cooperative experience.
5.1. Determinants of R&D cooperation: Full Sample
The estimated models (Model I and Model II) include a range of explanatory variables
supported by previous theoretical and empirical work, but final model specification remain
rather exploratory given the lack of straightforward theoretical predictions available. The full set
of estimates, with all other controls of heterogeneity, is reported in the Appendix B.
Recall that, the multivariate probit specification allows for systematic correlations between the
different equations. Some correlations maybe due to complementarities (positive correlations)
or to substitutabilities (negative correlation) between these different firm’s decisions. For
instance, the benefits of engaging in private R&D cooperative agreements might drop when
firms easily have access to public subsidies. Or the benefits of engaging in private R&D
cooperative agreements might increase when having legal protection for innovations.
Nevertheless, statistically significant correlations also arise if there are unobservable firm-
specific characteristics that affect several firm’s decisions but that are not easily captured by the
4 Notice that both R&D intensity and Size are lagged variables. That is, they contain information about the R&D intensity and size of the innovative firms included in the 2004 survey.

14
econometrician. The multivariate probit model takes these correlations into account, although it
is not able to distinguish between the two sources of correlation. What we certainly know is that
if correlation exists, the estimates of separate (probit) equations are inefficient and offer
inconsistent results.
Looking at Table B.1 (Appendix B) one can observe that some of the estimated correlation
coefficients, ρjk, between the different endogenous variables considered in the MVP model are
statistically significant. This support the notion of interdependence between different firms
decisions, which may be due to substitutabilities in firm’s strategies but also to omitted firm-
specific factors affecting all types of firm’s decisions. Anyway, this result supports the need to
control for potential endogeneity when estimating the model.
In particular, we obtain that the unobservable factors which decrease the probability of receiving
financial public support increase the probability of giving high importance to institutional
spillovers. In addition, these unobservable factors also increase the probability of making use of
legal instruments for protection of innovations. These facts point that a certain relationship
exists between the importance placed on the institutional spillovers and the receipt of financial
public subsidies among the innovative firms, and that this public subsidies receipt is also
correlated with the use of legal protection methods.
In fact, the relevance of the causal effect of the different public instruments considered in the
analysis changes dramatically when one take into accounts these potential correlations. When
we take into account the aforementioned simultaneity problems, the influence of public
subsidies and the use of legal methods for protecting innovations on the propensity to engage in
R&D cooperative agreements are no longer direct. Indeed, financial public support has a
positive effect on the probability of R&D cooperation through the positive influence it exerts on
the importance placed on the institutional spillovers. At the same time, legal protection of
innovations may help firms to engage in R&D cooperative agreements via its influence on the
probability of receiving financial public subsidies. Overall, it can be observed that once we
control for endogeneity problems, the effect of our interest variables on the probability of R&D
cooperation change significantly.
Table 11 presents the marginal effects of the main explanatory variables on the marginal
probability of R&D cooperation, while keeping everything else constant. In order to show the
need to control for endogeneity issues we present the results for the probit model and for the
MVP model as described in previous section. The first column corresponds to the estimation
without controlling by endogeneity and the second to the results with controls of endogeneity
for the variables related to the public sector. Thus, according to the estimates in the first column,
the presence of incoming spillovers, the use of national and European public subsidies and the
use of legal protection methods have all a positive impact in the probability of engaging in

15
cooperative R&D. However some of the effects disappear once we control by the endogeneity
of the variables of interest. The only variable that remains statistically significant is the
institutional incoming spillovers. In particular, we obtain that to have placed a high importance
on the institutional spillovers increases the marginal probability of cooperation in 21 percent
points. For instance, the estimated marginal probability of having R&D cooperative agreements
increases from 23% to 49% when a firm highly values institutional spillovers5.
Table 11. Model I: Estimated Marginal Effects of the public sector on the –Marginal-
Probability of R&D Cooperation. Full Sample.
Probit Model MVP Model
Use of Legal Protection Methods 0.0491*** 0.0856
Financial Public Subsidies 0.1774*** 0.1069
Institutional Spillovers 0.2830*** 0.2116***
Note 1: (*) The estimated coefficient is significant at 10% level. (**) The estimated coefficient is significant at 5%
level. (***) The estimated coefficient is significant at 1% level The numbers reported are marginal effects6 of the
explanatory variables on the probability of R&D cooperation.
Table 12 contains the marginal effect of our main explanatory variables on the marginal
probability of institutional (universities, research centres, technological centres, etc.) and private
R&D cooperation, again without and with controls of endogeneity. The results from this
estimation help to understand to some extend the results from Table 11 (in Appendix B, we
display the full set of results). It is worth mentioning that, contrary to the general R&D
cooperation case, the effects of our variables of interest on the probability of institutional R&D
cooperation are direct. That is, once we control for endogeneity, the effect of public subsidies
and the use of legal methods for protection of innovations on the probability of institutional
R&D cooperation are direct while the effects on the probability of private R&D cooperation are
indirect: financial support affects private R&D cooperation though the institutional spillovers
and legal protection of innovation affects private R&D agreements through public subsidies.
This way, cooperation with institutions seems to be directly affected by the public sector.
From Table 12, it can be observed that, allowing for endogeneity or not, the effect of the
variables of interest is different in the propensity to cooperate with public institutions or with
private agents indicating the appropriateness of differentiating between these two cooperation
types. In particular, when no controls for endogeneity are included, the effect of the public
sector is larger in the probability of cooperating with public research institutions than in the
probability of cooperating with other private agents.
5 This marginal probability is calculated for the averaged firm. 6 These marginal effects are the average of the individual marginal effects. Median marginal effects were also
compute in order to check whether non-linearities were important but small divergences were found. Therefore, we
have opted to show the average of the individual marginal effects.

16
From now on, we focus on the results obtained controlling for endogeneity. From Table 12 one
can observe that institutional incoming spillovers have a positive and significant effect in both
types of R&D cooperation, although its impact is larger in the case of institutional or public
R&D cooperation7 . In fact, institutional spillovers is the only variable with a significant
marginal effect on the propensity to engage in private R&D cooperative agreements.
Interestingly, when we focus on institutional R&D cooperation, the marginal effect of the
incoming institutional spillovers is larger than the one for the receipt of public subsidies: 0.2447
for the first case and 0.1083 for the second case. For instance, the estimated marginal
probability of public R&D cooperation increases from 7% to 40% when institutional spillovers
are rated important. This is consistent with the notion that for firms which cooperate with public
institutions, science is more important as a source of knowledge and therefore, also institutional
spillovers play an important role –they tend to be more generic in nature. When it comes to the
private R&D cooperation, this probability increases from 20% to 34%. Public subsidies have a
significant and positive impact but only on the probability of institutional cooperation. Again
this effect is economically relevant. For instance, the estimated marginal probability of
undertaking public R&D cooperative agreements increases from 10.45% to 24% when having
financial support. With respect to legal protection of innovations (outgoing spillovers), they also
seem important in deciding to cooperate with public institutions. In particular, the estimated
marginal probability of cooperating with public institutions in R&D projects increases from
12% to 24% when legal methods for protecting innovations are used.
Table 12: Model II: Estimated Marginal Effects on the -Marginal- Probability of R&D
Cooperation by type of partner. Full Sample.
Marginal Effects on Institutional R&D Cooperation
Biprobit Model MVP Model
Use of Legal Protection Methods 0.0384*** 0.0979*
Financial Public Subsidies 0.1244*** 0.1083**
Institutional Spillovers 0.2442*** 0.2447***
Marginal Effects on Private R&D Cooperation
Biprobit Model MVP Model
Use of Legal Protection Methods 0.0297** 0.0302
Financial Public Subsidies 0.1113*** 0.1382
Institutional Spillovers 0.1251*** 0.1208*
Same as Note 1
The results from the previous literature for Spain suggest that incoming spillovers have only an
effect on cooperation with research institutions (See, for instance, Abramovsky et al (2009) or
Lopez (2008)). Firms who find institutional spillovers more important tend to cooperate more
precisely with these institutions since they will benefit more from this cooperation. We have
7 Belderbos et al (2004) find that institutional spillovers are important for any type of cooperation agreement.

17
found, however, that institutional spillovers have significant and positive influence on both
public and private R&D cooperation, although the effect is much more important in the former
case. Regarding the use of legal protection methods, we find that it has a significant and positive
effect on the probability of cooperating with public institutions. Nevertheless, it seems to have
no impact on the probability of private cooperation. This variable tried to reflect the degree of
appropriability of knowledge by the firm, since it represents the use by the firm of the existent
IP legal protection methods available. However, it does not measure the effectiveness of the
protection methods, so some caution should be taken when identifying that variable with
appropriability, that in previous empirical evidence has been found a clear determinant of
cooperation.
Relating the effect of the public subsidies, the results are also in line with previous evidence.
For example, Fölster (1995) found that subsidies that require cooperation in the form of result-
sharing agreements significantly increase the likelihood of R&D cooperation while other
programs that do require cooperation but not result-sharing agreements do not increase the
likelihood of cooperation. In our data set we do not have information on this extend but a
positive o null effect of subsidies on the probability of cooperation will be coherent with Fölster
results.
With respect to other variables included in the estimation (see Appendix B) that are worth to
mention, it is interesting to mention that public firms or research oriented firms tend to
collaborate more. More interesting is the effect of the intensity of R&D: the higher the intensity
the higher the probability of any type cooperation although the effect is decreasing. This result
is also in line with previous empirical evidence and it is associated to the absorptive capacity of
the firm: it shows that not only is important the presence of incoming spillovers but the capacity
of the firm to manage this knowledge flows. Size has a U shape effect on the probability of any
type of cooperation, again in relation with this absorptive capacity: a minimum size is needed to
extract all the benefits from cooperation.
5.2. Determinants of R&D cooperation: New Cooperation Sample
Tables 13 and 14 contain the marginal effects from the estimations of Model I and II but only
with a subsample of firms that did not cooperate before (period 2002-2004). Notice that, with
this sample, there is no need to estimate a simultaneous recursive model since the mere sample
selection implies that the effect of any past cooperation is removed. This procedure will
then reduce any bias still present due to the endogeneity problems. Interestingly, it also can help
to highlight the determinants of new R&D cooperation agreements. The results are broadly in
line with those of the previous section.

18
Contrary to the previous cases, the three explanatory variables of our interest have a significant
and positive effect on the probability of both private and public R&D cooperation. The largest
effect corresponds to the institutional spillovers, which increase the estimated marginal
probability of R&D cooperation from 12% to 33%. When we distinguish between institutional
and private cooperation, the estimated marginal probability goes from 4% to 24% in the former
case and from 10% to 21% in the latter. Public subsidies have also a relevant effect. For
instance, the estimated marginal probability of cooperating in R&D goes from 13% to 25%
when a firm receives financial support.
Table 13: Estimated Marginal Effects on the –Marginal- Probability of R&D Cooperation.
New Cooperation Sample.
Probit Model
Use of Legal Protection Methods 0.0913***
Financial Public Subsidies 0.1720***
Institutional Spillovers 0.2770***
Same as Note 1
Table 14: Estimated Marginal Effects on the –Marginal- Probability of Institutional and
Private Cooperation. New Cooperation Sample.
Marginal Effects on Institutional R&D
Cooperation
Biprobit Model
Use of Legal Protection Methods 0.0399***
Financial Public Subsidies 0.0846***
Institutional Spillovers 0.1619***
Marginal Effects on Private R&D Cooperation
Biprobit Model
Use of Legal Protection Methods 0.0418**
Financial Public Subsidies 0.0819***
Institutional Spillovers 0.0974***
Same as Note 1
6. Conclusions
This paper provides new evidence in the field of the motivations that lead firms to engage in
cooperative agreements for their R&D activities. Empirical studies that properly analyze the
importance that different tools of public support to innovation play in cooperation decisions
undertaken by firms are limited. In particular, we wonder whether institutional spillovers, public
financial support and the existence of legal protection of innovation positively influence R&D
cooperative agreements. The increasing importance of R&D collaborations among firms and/or

19
research institutions as a way of developing successful technological innovations justifies our
interest in analyzing their determinants. Additionally, both the database and the econometric
strategy applied are two other important novelties of our study.
In order to address these questions, we have made use of the information contained in the
PITEC and probabilistic models have been estimated. Precisely, two different multivariate
probit models have been estimated. One of them for the case of R&D cooperation itself and the
other one for two possible strategies of collaboration in R&D: institutional cooperation versus
private cooperation. We estimate a multivariate probit model in order to allow simultaneous
decisions to be present and also to control for the potential endogeneity problems that some of
our independent variables may incorporate. In this sense, we believe that cooperation decisions
among firms are influenced by a series of variables that can also be determined by the
cooperation choice itself. For instance, information flows coming from the public institutions
may help R&D cooperation, but, on the other hand, cooperation itself may generate additional
information flows from and directed to institutions. We will consider that three of our
independent variables are potentially endogenous: institutional spillovers, financial support and
legal protection of innovation. Therefore, a structural model of R&D cooperation and a number
of public-related variables is constructed in order to reduce this potential endogeneity bias. A
model for R&D cooperation itself is going to be estimated as well as a model for institutional
cooperation versus private cooperation.
The empirical results presented on the relationship between R&D cooperation and different
public instrument that are related with R&D activities suggest that the correction for
endogeneity of spillovers, access to public finance and legal protection of innovations are
crucial. In this sense, this control allows us to determine that the effects of two of our variables
of interest on the probability of R&D cooperation are not direct. In particular, the receipt of
public subsidies is positively correlated with R&D cooperation through the importance placed
on the institutional spillovers. Likewise, legal protection of innovation affects the probability of
R&D cooperation through the existence of financial public support. However, these indirect
relations are not present in the case on institutional cooperation, where the effects are direct.
Firms which rate institutional incoming spillovers more importantly are more likely to
cooperate in R&D. Institutional incoming spillovers have a significantly positive effect on
cooperation with research institutes but also on cooperation with other firms. In addition our
analysis finds that financial support increases the likelihood of R&D institutional cooperative
agreements. More importantly, the economic incidence of these public instruments on the
marginal probability of undertaking R&D should not be underestimated. For instance, for the
average firm, the probability of undertaking R&D cooperative agreements with public
institutions increases from 7% to 40% when institutional spillovers are rated as high, from 10%

20
to 24% when the firm receives public subsidies and from 12% to 24% when the firm has made
use of legal methods for protecting innovations.

21
Appendix A1. Variables Description
Variable Definition
R&D Cooperation 1 if the innovative firm cooperated in R&D in 2005-2007 and 0 otherwise
Institutional Cooperation 1 if the innovative firm cooperated in R&D with public institutions
8 in 2005-
2007 and 0 otherwise
Private Cooperation 1 if the innovative firm cooperated in R&D with private institutions
9in 2005-
2007 and 0 otherwise
Competitors Spillovers 1 if the firm placed high or intermediate importance on the information
coming from competitors for their innovation activities and 0 otherwise
Vertical Spillovers
1 if the firm placed high or intermediate importance on the information
coming from customers and/or suppliers for their innovation activities and 0
otherwise
Research Experts Spillovers 1 if the firm placed high or intermediate importance on the information
coming from research experts for their innovation activities and 0 otherwise
Institutional Spillovers 1 if the firm placed high or intermediate importance on the information
coming from public institutions for their innovation activities and 0 otherwise
Internal Spillovers
1 if the firm placed high or intermediate importance on the information
coming from the own firm or from a firm belonging to the same enterprise
group for their innovation activities and 0 otherwise
Open Access Spillovers
1 if the firm placed high or intermediate importance on the information
coming from conferences, fairs, exhibitions, journals or technical/trade press,
professional/industry associations for their innovation activities and otherwise
Organizational
1 if the firm placed high or intermediate importance on the lack of skilled
staff, the lack of technology information and/or the lack of information about
the market as factors that made their innovation activities difficult to carry out
and 0 otherwise
Difficulty in Finding a Partner
1 if the firm placed high or intermediate importance on the difficulty in
finding a partner as a factor that made their innovation activities difficult to
carry out and 0 otherwise
Risks
1 if the firm placed high or intermediate importance on the uncertainty with
respect to the demand for innovative goods/services in the market as a factor
that made their innovation activities difficult to carry out and 0 otherwise
Costs
1 if the firm placed high or intermediate importance on the lack of fund within
the firm or enterprise group, the lack of external funding and/or the high costs
of innovation as factors that made their innovation activities difficult to carry
out and 0 otherwise
Public Financial Support 1 if the firm received financial support for the innovation activities and 0
otherwise
Legal Protection of Innovation 1 if the firm requested a patent, and/or demanded copyrights, and/or registered
a trademark and/or industrial models and 0 otherwise
Location in Technology Park 1 if the firm is located in a technology park and 0 otherwise
R&D Intensity Intramural (internal) R&D expenditures/Turnover (lagged to 2004)
Tamaño Ln(turnover/100) (lagged to 2004)
Industry 1 if the firm belongs to the industrial sector and 0 otherwise
High/Intermediate
Technological Intensity
1 if the firm belongs to the high/intermediate technological intensity
manufacturing sector and 0 otherwise
High-Tech Services 1 if the firm belongs to the high-tech services sector and 0 otherwise
Public 1 public firm
Private Multinational 1 private firm with at least 50% of foreign capital sharing
Research Association 1 research association and other Research institutions
8 Public institutions are universities or other higher education centers, public research organizations and/or
technologic centers. 9 These are: customers, suppliers, competitors, Research experts ( consultants or commercial
laboratories)and firms belonging to the same enterprise group

22
Large 1 if the number of employees is equal or larger than 200 in 2007 and 0
otherwise
National Market 1 if the firm sold its products/services in the national market and 0 otherwise
Enterprise Group 1 if the firm belongs to an enterprise group and 0 otherwise
Foreign Head Office 1 firm belonging to an enterprise groups whose head office is outside Spain
Head Office 1 firm belonging to an enterprise group and being the head office of the group
Novelty 1 if the firm introduced new products in the market and 0 otherwise
Researchers 1 if the firm’s researchers account for more than 50% of the total R&D staff of
the firm and 0 otherwise
Industry Concentration Cumulative market share of the five firms with the largest market share in
2007, by sector (two digits CNAE-93 )
Cooperating Firms’ Sales Ratio Cooperating firms’ average turnover/Average turnover, by sector (two digits
CNAE-93). In logs.
Open Access Spillovers Mean Average of the importance placed on information coming from conferences,
fairs, exhibitions, journals or technical/trade press, professional/industry
associations for their innovation activities by sector (two digits CNAE-93)

23
Appendix A2. Summary statistics
Table A2.1. Full Sample
Cooperating Firms
Non-
cooperating
Firms
Cooperating
Firms
Institutional
Cooperation
Private
Cooperation
Spillovers
Competitors 0.4875 0.5148 0.5143 0.3326
Vertical 0.8278 0.8235 0.8647 0.6721
Research Experts 0.4451 0.5000 0.4550 0.2318
Institutional 0.6219 0.8080 0.5847 0.2150
Internal 0.9048 0.9149 0.9150 0.7530
Open Access 0.6433 0.6906 0.6607 0.4261
Obstacles to Innovation
Organizational 0.6269 0.6470 0.6333 0.5480
Difficulty in Finding a Partner 0.4100 0.4444 0.4075 0.3122
Risks 0.5772 0.6034 0.5702 0.5348
Costs 0.7954 0.8368 0.7937 0.7352
Public Support for Innovation
Financial Support 0.6137 0.7349 0.6070 0.2795
Legal Protection of Innovation 0.3982 0.4494 0.4064 0.2458
Location in Technology Park 0.0670 0.0879 0.0743 0.0256
Firms Characteristics
R&D Intensity 0.1247 0.1614 0.1251 0.0611
Size 11.5623 11.4359 11.7253 11.2722
Industry 0.6337 0.6449 0.6266 0.6795
High/Intermediate Technological Intensity 0.3112 0.3256 0.3141 0.2921
High-Tech Services 0.1321 0.1646 0.1381 0.0880
Public 0.0374 0.0352 0.0380 0.0166
Private Multinational 0.1303 0.1104 0.1442 0.1141
Research Association 0.0319 0.0464 0.0363 0.0052
Large 0.3148 0.2940 0.3505 0.2610
National Market 0.9667 0.9648 0.9653 0.9703
Enterprise Group 0.5216 0.4951 0.5629 0.3779
Foreign Head Office 0.1599 0.1350 0.1783 0.1374
Head Office 0.1194 0.1167 0.1274 0.0712
Novelty 0.5194 0.5556 0.5372 0.3253
Researchers 0.3699 0.4219 0.3644 0.2679
Industry Characteristics
Industry Concentration 0.0131 0.0132 0.0129 0.0134
Cooperating Firms’ Sales Ratio 1.0278 1.0281 1.0282 1.0282
Open Access Spillovers Mean 0.2587 0.2559 0.2583 0.2626
N 2195 1422 1789 4215

24
Table A.2.2: New Cooperation Sample
Cooperating Firms
Non-
cooperating
Firms
Cooperating
Firms
Institutional
Cooperation
Private
Cooperation
Spillovers
Competitors 0.4300 0.4360 0.4576 0.3599
Vertical 0.8009 0.7808 0.8506 0.6942
Research Experts 0.4315 0.4951 0.4336 0.2323
Institutional 0.5758 0.7660 0.5258 0.2059
Internal 0.8918 0.8892 0.9059 0.7818
Open Access 0.6104 0.6527 0.6162 0.4545
Obstacles to Innovation
Organizational 0.6306 0.6379 0.6384 0.5570
Difficulty in Finding a Partner 0.4040 0.4310 0.3875 0.3028
Risks 0.5916 0.6084 0.5830 0.5469
Costs 0.8139 0.8571 0.8100 0.7599
Public Support for Innovation
Financial Support 0.5613 0.6798 0.5498 0.2705
Legal Protection of Innovation 0.3997 0.4384 0.4022 0.2583
Location in Technology Park 0.0404 0.0567 0.0443 0.0241
Firms Characteristics
R&D Intensity 0.0998 0.1230 0.0967 0.0627
Size 11.3096 11.2079 11.4620 11.1500
Industry 0.6681 0.6773 0.6224 0.7217
High/Intermediate Technological Intensity 0.3189 0.3202 0.3321 0.3288
High-Tech Services 0.0996 0.1059 0.1052 0.0894
Public 0.0303 0.0345 0.0332 0.0148
Private Multinational 0.1270 0.0788 0.1513 0.1080
Research Association 0.0188 0.0246 0.0203 0.0033
Large 0.2496 0.2340 0.2841 0.2145
National Market 0.9740 0.9680 0.9779 0.9722
Enterprise Group 0.4675 0.4212 0.5166 0.3451
Foreign Head Office 0.1501 0.1010 0.1771 0.1284
Head Office 0.1111 0.1084 0.1107 0.0646
Novelty 0.4906 0.5271 0.4982 0.3481
Researchers 0.3709 0.3990 0.3727 0.2961
Industry Characteristics
Industry Concentration 0.0130 0.0131 0.0120 0.0132
Cooperating Firms’ Sales Ratio 1.0269 1.0261 1.0273 1.0305
Open Access Spillovers Mean 0.2606 0.2587 0.2606 0.2614
N 693 406 542 2695

25
Appendix B: Results
B.1. Model I
Full Sample New Cooperation
Sample
Probit MVP Probit
R&D cooperation Robust Coef. Std. Error Robust Coef. Std. Error Robust
Coef.
Std.
Error
Competitors Spillovers 0.0253 0.0410 0.0250 0.0409 -0.1078* 0.0610
Vertical Spillover 0.1677*** 0.0475 0.1688*** 0.0475 0.0843 0.0704
Research Experts Spillovers 0.1042** 0.0421 0.1318** 0.0514 0.1620** 0.0628
Institutional Spillovers 0.7699*** 0.0416 0.7332*** 0.1659 0.7199*** 0.0619
Open Access Spillovers 0.0647 0.0411 0.0801* 0.0443 0.0197 0.0607
Internal Spillovers 0.2382*** 0.0535 0.2503*** 0.0553 0.1777** 0.0807
Organizational 0.0752* 0.0400 0.0718* 0.0409 0.0687 0.0587
Dificulty in Finfing a Partner 0.0813** 0.0406 0.0868** 0.0413 0.1479** 0.0599
Costs 0.0018 0.0467 0.0031 0.0468 0.0410 0.0709
Cooperating Firms’ Sales
Ratio -0.7923 0.8125
R&D Intensity 0.5330** 0.1568 0.5572** 0.1993 0.3655 0.2861
R&D Intensity2 -0.1740** 0.0552 -0.1859** 0.0648 -0.2265 0.1450
Size -0.2235** 0.0975 -0.2357** 0.0994 -0.0765 0.1528
Size2 0.0126** 0.0043 0.0129** 0.0043 0.0037 0.0069
Public Financial Support 0.4827*** 0.0387 0.3703 0.2354 0.4459*** 0.0563
Legal Protection of
Innovation 0.1337*** 0.0397 0.2965 0.2845 0.2368*** 0.0574
High/Intermediate
Technological Intensity 0.0391 0.0459 0.0352 0.0472 0.0150 0.0683
High-Tech Services -0.1891** 0.0720 -0.1758** 0.0742 -0.3152** 0.1094
Industry -0.2189*** 0.0509 -0.2153*** 0.0523 -0.2109** 0.0838
Public 0.4701*** 0.1174 0.4878*** 0.1183 0.3607** 0.1782
Private Multinational 0.0607 0.0602 0.0630 0.0634 0.1458 0.0918
Research Association 0.4221** 0.1633 0.4304** 0.1646 0.8258** 0.2982
Large -0.0904 0.0577 -0.0896 0.0580 -0.0456 0.0889
Industry Concentration 1.0027 0.6701 1.0706 0.6933 0.9657 0.9585
Enterprise Group 0.3105*** 0.0441 0.3113*** 0.0447 0.3072*** 0.0667
Researches 0.0694 0.0396 0.0690* 0.0394 0.0918 0.0569
Location in Technology Park 0.0969 0.0907 0.1156 0.0930 -0.1988 0.1462
Novelty 0.2255*** 0.0383 0.1993** 0.0688 0.1627** 0.0568
Constant -0.7289 0.5530 -0.6498 0.5700 -0.5890 1.1186
26
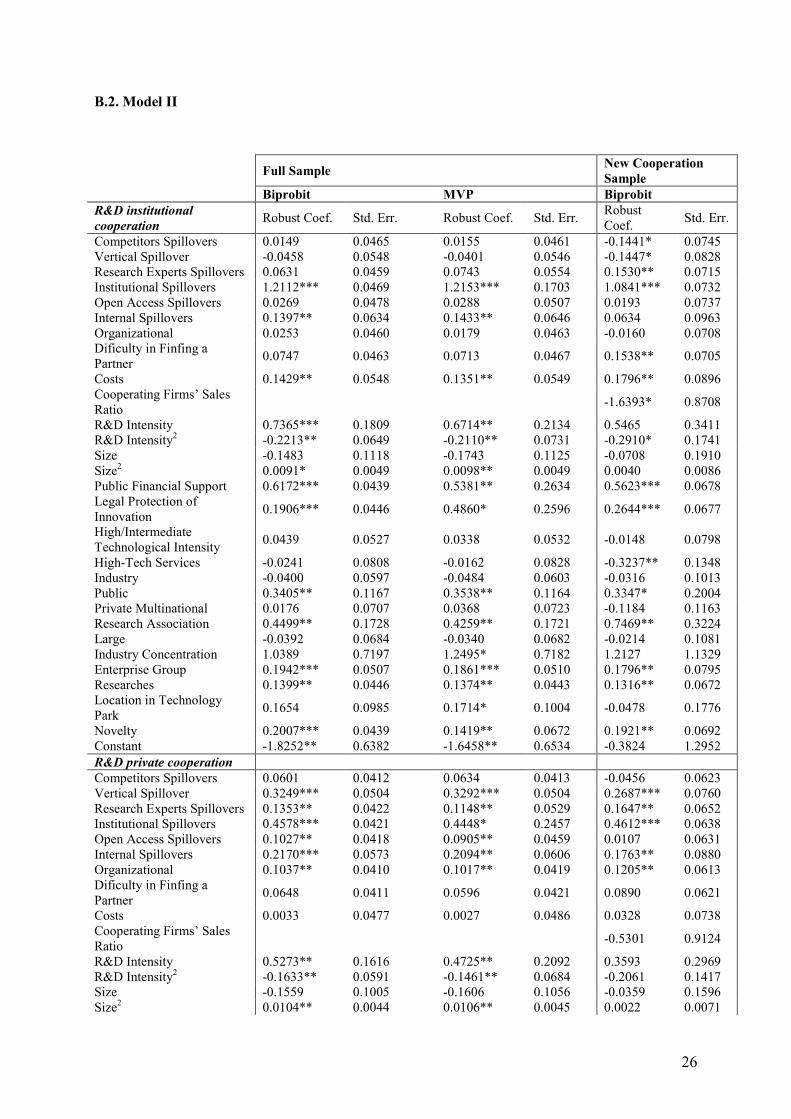
B.2. Model II
Full Sample New Cooperation
Sample
Biprobit MVP Biprobit
R&D institutional
cooperation Robust Coef. Std. Err. Robust Coef. Std. Err.
Robust
Coef. Std. Err.
Competitors Spillovers 0.0149 0.0465 0.0155 0.0461 -0.1441* 0.0745
Vertical Spillover -0.0458 0.0548 -0.0401 0.0546 -0.1447* 0.0828
Research Experts Spillovers 0.0631 0.0459 0.0743 0.0554 0.1530** 0.0715
Institutional Spillovers 1.2112*** 0.0469 1.2153*** 0.1703 1.0841*** 0.0732
Open Access Spillovers 0.0269 0.0478 0.0288 0.0507 0.0193 0.0737
Internal Spillovers 0.1397** 0.0634 0.1433** 0.0646 0.0634 0.0963
Organizational 0.0253 0.0460 0.0179 0.0463 -0.0160 0.0708
Dificulty in Finfing a
Partner 0.0747 0.0463 0.0713 0.0467 0.1538** 0.0705
Costs 0.1429** 0.0548 0.1351** 0.0549 0.1796** 0.0896
Cooperating Firms’ Sales
Ratio -1.6393* 0.8708
R&D Intensity 0.7365*** 0.1809 0.6714** 0.2134 0.5465 0.3411
R&D Intensity2 -0.2213** 0.0649 -0.2110** 0.0731 -0.2910* 0.1741
Size -0.1483 0.1118 -0.1743 0.1125 -0.0708 0.1910
Size2 0.0091* 0.0049 0.0098** 0.0049 0.0040 0.0086
Public Financial Support 0.6172*** 0.0439 0.5381** 0.2634 0.5623*** 0.0678
Legal Protection of
Innovation 0.1906*** 0.0446 0.4860* 0.2596 0.2644*** 0.0677
High/Intermediate
Technological Intensity 0.0439 0.0527 0.0338 0.0532 -0.0148 0.0798
High-Tech Services -0.0241 0.0808 -0.0162 0.0828 -0.3237** 0.1348
Industry -0.0400 0.0597 -0.0484 0.0603 -0.0316 0.1013
Public 0.3405** 0.1167 0.3538** 0.1164 0.3347* 0.2004
Private Multinational 0.0176 0.0707 0.0368 0.0723 -0.1184 0.1163
Research Association 0.4499** 0.1728 0.4259** 0.1721 0.7469** 0.3224
Large -0.0392 0.0684 -0.0340 0.0682 -0.0214 0.1081
Industry Concentration 1.0389 0.7197 1.2495* 0.7182 1.2127 1.1329
Enterprise Group 0.1942*** 0.0507 0.1861*** 0.0510 0.1796** 0.0795
Researches 0.1399** 0.0446 0.1374** 0.0443 0.1316** 0.0672
Location in Technology
Park 0.1654 0.0985 0.1714* 0.1004 -0.0478 0.1776
Novelty 0.2007*** 0.0439 0.1419** 0.0672 0.1921** 0.0692
Constant -1.8252** 0.6382 -1.6458** 0.6534 -0.3824 1.2952
R&D private cooperation
Competitors Spillovers 0.0601 0.0412 0.0634 0.0413 -0.0456 0.0623
Vertical Spillover 0.3249*** 0.0504 0.3292*** 0.0504 0.2687*** 0.0760
Research Experts Spillovers 0.1353** 0.0422 0.1148** 0.0529 0.1647** 0.0652
Institutional Spillovers 0.4578*** 0.0421 0.4448* 0.2457 0.4612*** 0.0638
Open Access Spillovers 0.1027** 0.0418 0.0905** 0.0459 0.0107 0.0631
Internal Spillovers 0.2170*** 0.0573 0.2094** 0.0606 0.1763** 0.0880
Organizational 0.1037** 0.0410 0.1017** 0.0419 0.1205** 0.0613
Dificulty in Finfing a
Partner 0.0648 0.0411 0.0596 0.0421 0.0890 0.0621
Costs 0.0033 0.0477 0.0027 0.0486 0.0328 0.0738
Cooperating Firms’ Sales
Ratio -0.5301 0.9124
R&D Intensity 0.5273** 0.1616 0.4725** 0.2092 0.3593 0.2969
R&D Intensity2 -0.1633** 0.0591 -0.1461** 0.0684 -0.2061 0.1417
Size -0.1559 0.1005 -0.1606 0.1056 -0.0359 0.1596
Size2 0.0104** 0.0044 0.0106** 0.0045 0.0022 0.0071

27
Public Financial Support 0.4073*** 0.0396 0.5088 0.3206 0.3890*** 0.0584
Legal Protection of
Innovation 0.1086** 0.0401 0.1113 0.3272 0.1944** 0.0595
High/Intermediate
Technological Intensity 0.0561 0.0469 0.0531 0.0484 0.0627 0.0721
High-Tech Services -0.1064 0.0734 -0.1127 0.0768 -0.2277** 0.1141
Industry -0.2153*** 0.0519 -0.2202*** 0.0542 -0.2381** 0.0872
Public 0.3860** 0.1153 0.3788** 0.1180 0.4022** 0.1860
Private Multinational 0.0674 0.0603 0.0713 0.0646 0.1941** 0.0922
Research Association 0.6022*** 0.1632 0.5831*** 0.1662 0.8327** 0.3083
Large -0.0244 0.0584 -0.0268 0.0594 0.0212 0.0924
Industry Concentration 0.6575 0.7142 0.7017 0.7565 0.2247 1.0559
Enterprise Group 0.3603*** 0.0448 0.3552*** 0.0452 0.3591*** 0.0693
Researches 0.0438 0.0404 0.0412 0.0404 0.0866 0.0599
Location in Technology
Park 0.1970** 0.0903 0.1847** 0.0936 -0.1446 0.1522
Novelty 0.2471*** 0.0386 0.2422** 0.0757 0.1503** 0.0580
Constant -1.4690** 0.5768 -1.4501** 0.6093 -1.3775 1.2230
N 6410 6410 3388