the information dashboard framework · the information dashboard framework ... a department of...
TRANSCRIPT
THE INFORMATION DASHBOARD FRAMEWORK
Austin Riddle Texas Center for Applied Technology
Technology Transition Workshop
Jackson, MS 25 July 2012
A Department of Homeland Security Science and Technology National Center of Excellence
Research with
The Power of Information/Data Fusion
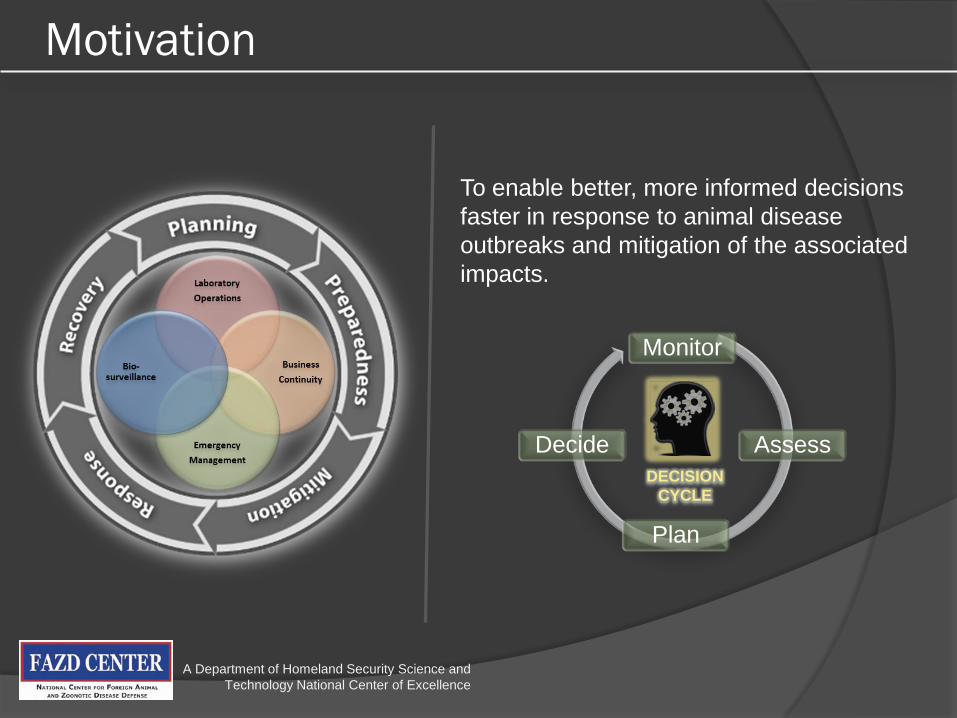
Motivation
A Department of Homeland Security Science and Technology National Center of Excellence
To enable better, more informed decisions faster in response to animal disease outbreaks and mitigation of the associated impacts.
Monitor
Assess
Plan
Decide DECISION
CYCLE

What is needed?
A Department of Homeland Security Science and Technology National Center of Excellence
Provide tools for command and control
Transform data into information
Ensure that this information is provided to the decision-maker wherever he or she is located in a timely manner and in the correct context
Support Precision Information Environments (DHS) for shared situational awareness
Develop Transformational Architecture

How Can This Be Done?
A Department of Homeland Security Science and Technology National Center of Excellence
Identify rich network of authoritative data sources and predictive models. Predictive models and data used to transform data into information
Provide a means to access this data and predictive models on lightweight mobile computing devices. Supporting the decision-maker anytime, anywhere
Use innovative visual analytics to provide highly expressive representations of model output. Quicker understanding of model output leads to shorter decision cycle and better decisions
Collect, Aggregate, Filter, Present
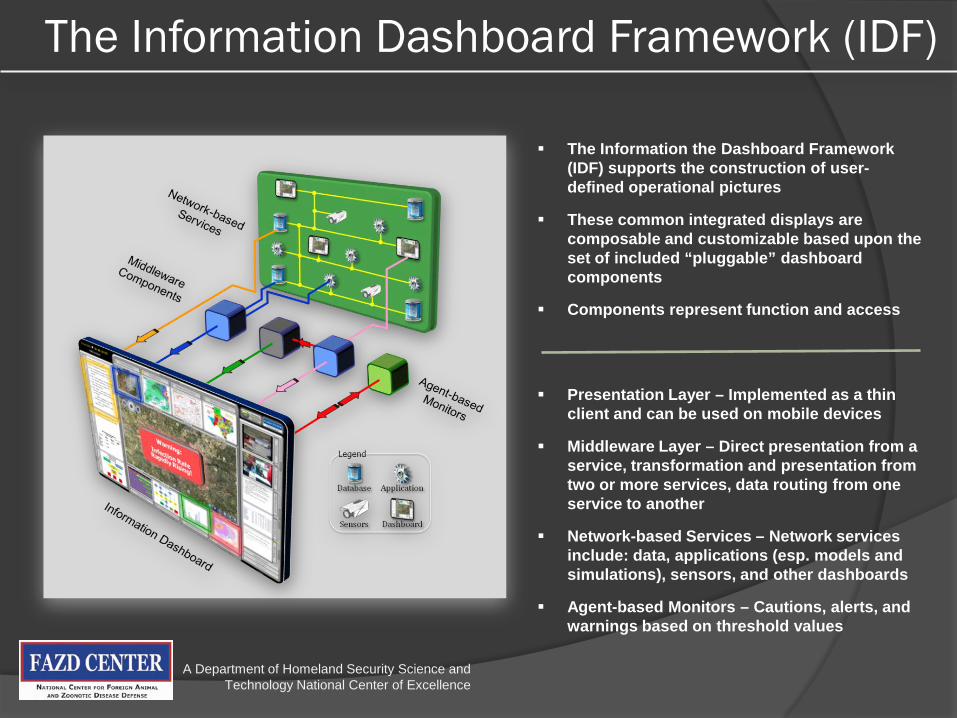
The Information Dashboard Framework (IDF)
A Department of Homeland Security Science and Technology National Center of Excellence
Presentation Layer – Implemented as a thin client and can be used on mobile devices
Middleware Layer – Direct presentation from a service, transformation and presentation from two or more services, data routing from one service to another
Network-based Services – Network services include: data, applications (esp. models and simulations), sensors, and other dashboards
Agent-based Monitors – Cautions, alerts, and warnings based on threshold values
The Information the Dashboard Framework (IDF) supports the construction of user-defined operational pictures
These common integrated displays are composable and customizable based upon the set of included “pluggable” dashboard components
Components represent function and access
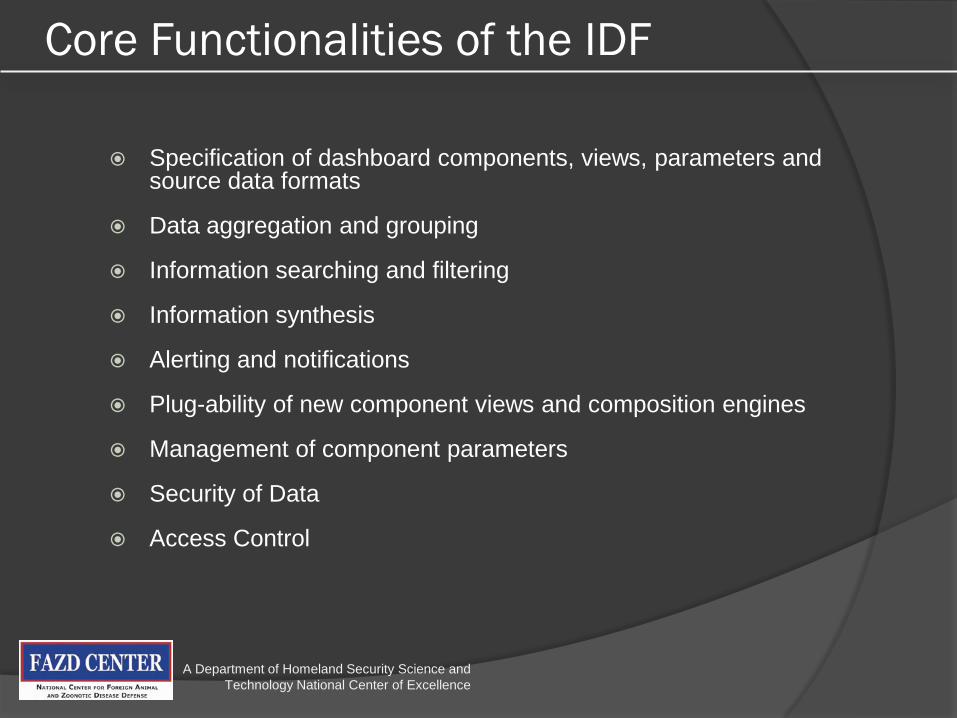
Core Functionalities of the IDF
Specification of dashboard components, views, parameters and source data formats
Data aggregation and grouping
Information searching and filtering
Information synthesis
Alerting and notifications
Plug-ability of new component views and composition engines
Management of component parameters
Security of Data
Access Control
A Department of Homeland Security Science and Technology National Center of Excellence

Evolution of the IDF
A Department of Homeland Security Science and Technology National Center of Excellence
Dynamic Preparedness System (2007)
Bio-surveillance Common Operating Picture (2009)
Coast Guard Display System (2010)
Electronic Warfare Battle Manager (2011)
Emergency Response Support System (2010)
Bio-surveillance Field Entry System (2010)
Laboratory Capacity Estimation Model (2011)

Bio-surveillance Common Operating Picture (BCOP)
A Department of Homeland Security Science and Technology National Center of Excellence
Built for the National Bio-Surveillance Intelligence Center (NBIC) at DHS in response to the H1N1 outbreak
The first fully functional dashboard built using the Information Dashboard Framework (IDF)
Used to document biological incidents around the world
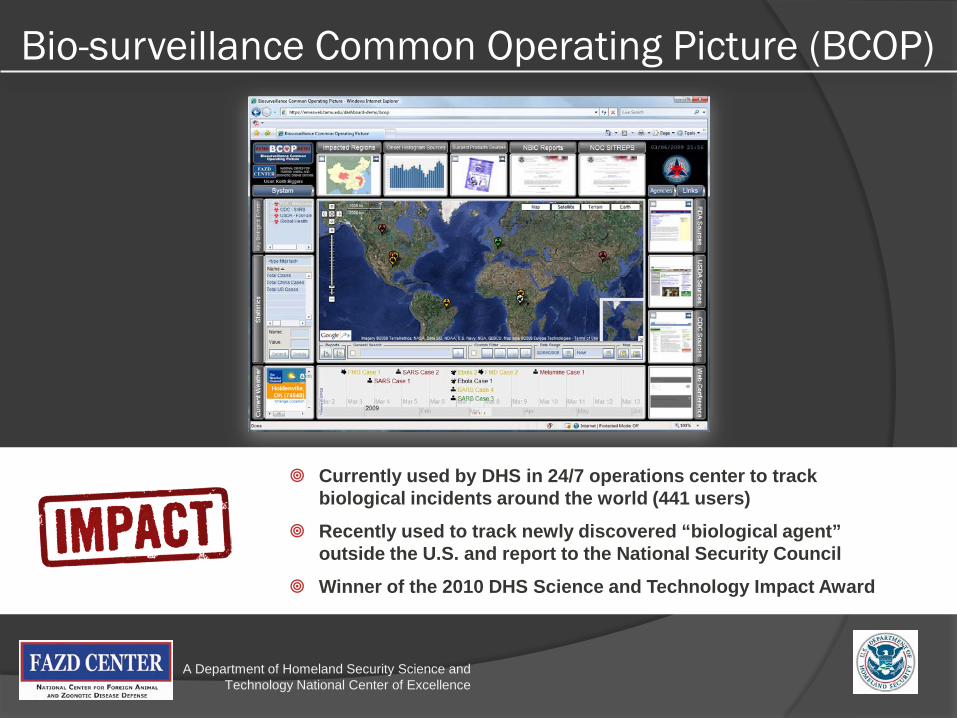
Currently used by DHS in 24/7 operations center to track biological incidents around the world (441 users)
Recently used to track newly discovered “biological agent” outside the U.S. and report to the National Security Council
Winner of the 2010 DHS Science and Technology Impact Award
Emergency Response Support System (ERSS)
A Department of Homeland Security Science and Technology National Center of Excellence
Provides a web-based tool for large and small-scale incident management
Developed around a service-oriented architecture and allows integration of bio-surveillance information, various tools for incident management, real-time information to support continuity of operations, and many other external references to support incident management.
To be used as an operational tool during a response, as an analysis tool after an event is complete, and as a training tool to prepare for possible future incidents
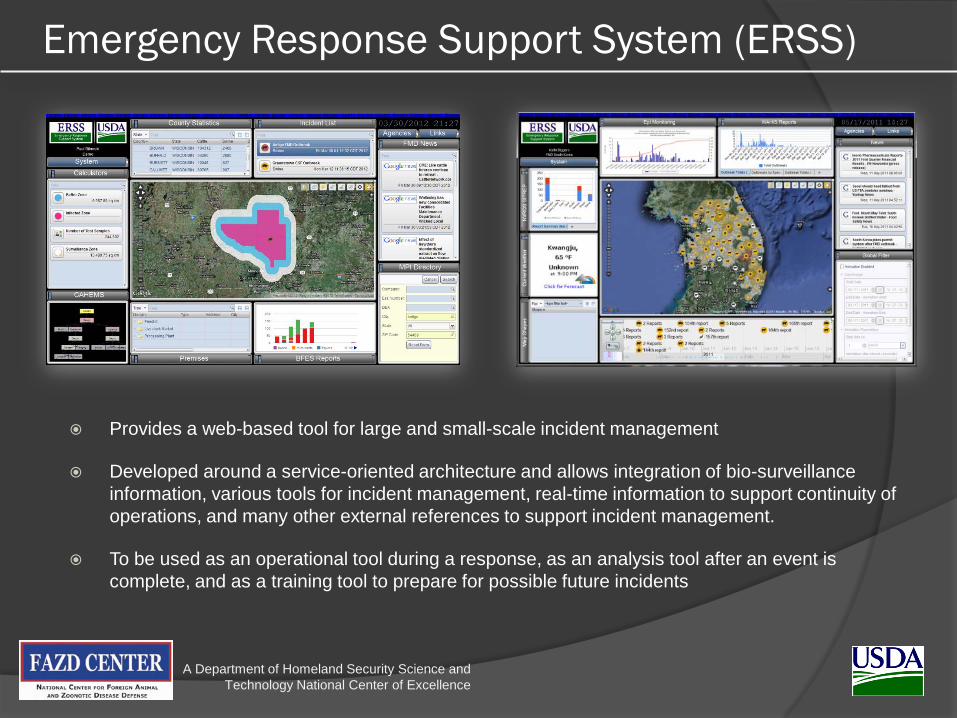
Provides real-time shared situational awareness between NCAHEM (command center at Riverdale, MD) and states engaged in animal disease response
Key component of USDA’s (Veterinary Services) strategic information technology plan for creating service-oriented enterprise for managing animal disease outbreaks

Laboratory Capacity Estimation Model (LCEM)
A Department of Homeland Security Science and Technology National Center of Excellence
Used to gain a real-time, realistic estimate of individual laboratory and laboratory network capacity for high-impact animal diseases
Enables individual laboratories to fully define their processes
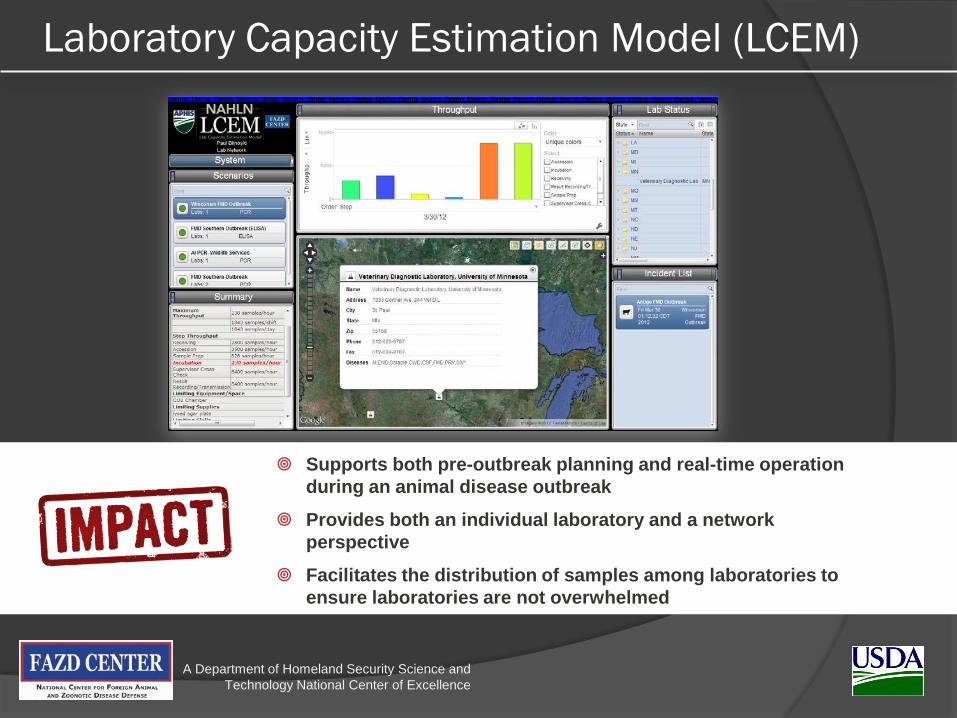
Supports both pre-outbreak planning and real-time operation during an animal disease outbreak
Provides both an individual laboratory and a network perspective
Facilitates the distribution of samples among laboratories to ensure laboratories are not overwhelmed
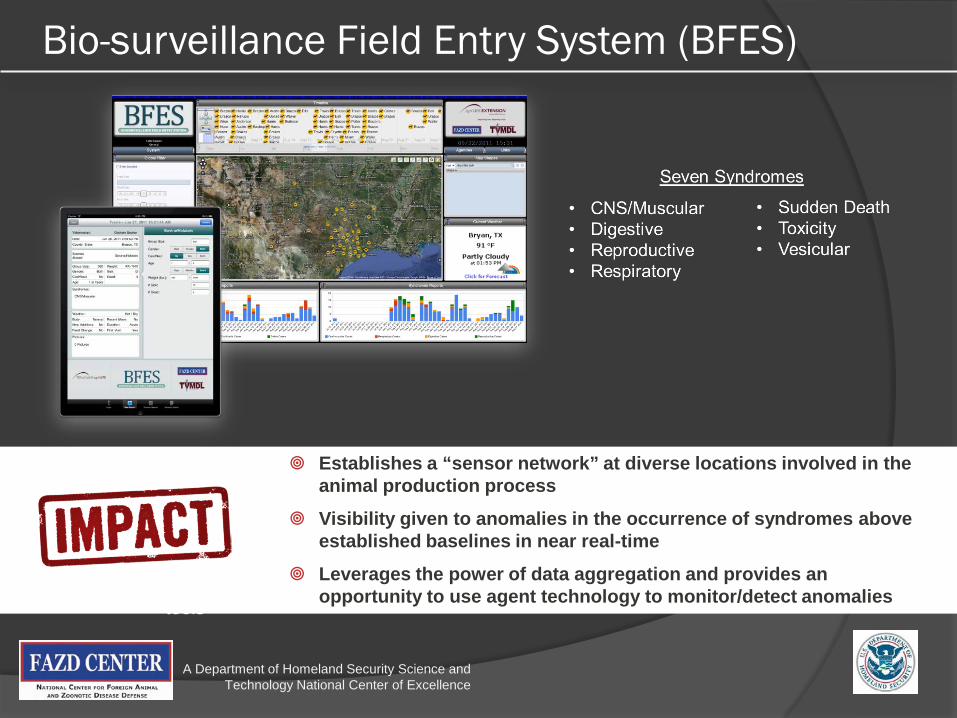
Bio-surveillance Field Entry System (BFES)
A Department of Homeland Security Science and Technology National Center of Excellence
Allows for the collection and analysis of syndromic surveillance data
Offers a mobile application for individuals to input information about a symptomatic animal from within a clinical setting or from the field
Provides epidemiologists and analysts with the capability to aggregate and analyze the collected data through the use of various visual, geospatial, and temporal analysis tools
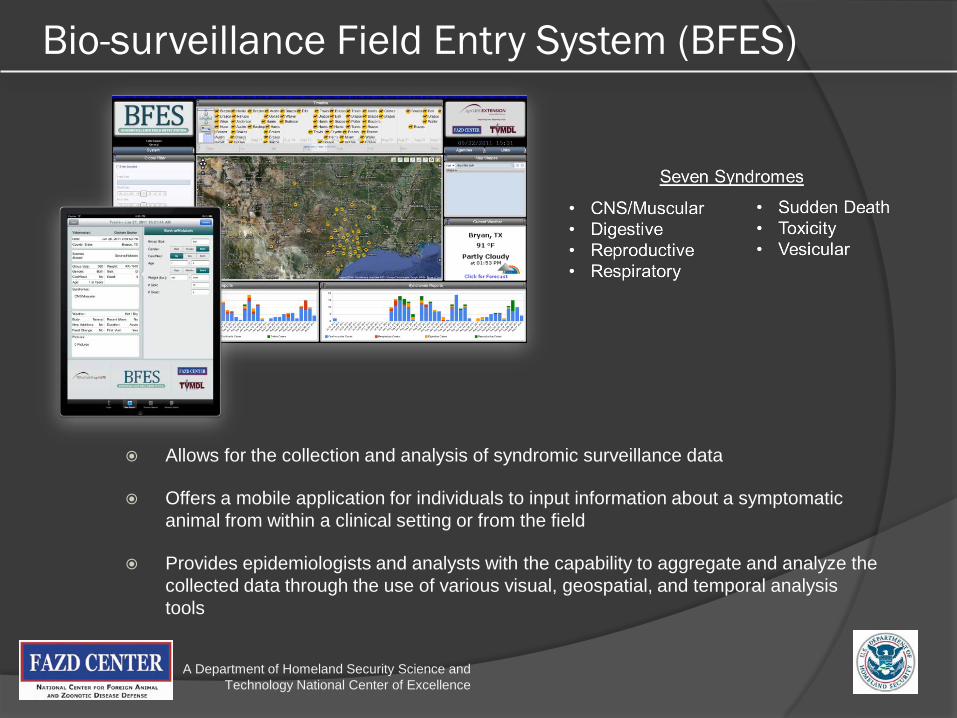
Establishes a “sensor network” at diverse locations involved in the animal production process
Visibility given to anomalies in the occurrence of syndromes above established baselines in near real-time
Leverages the power of data aggregation and provides an opportunity to use agent technology to monitor/detect anomalies
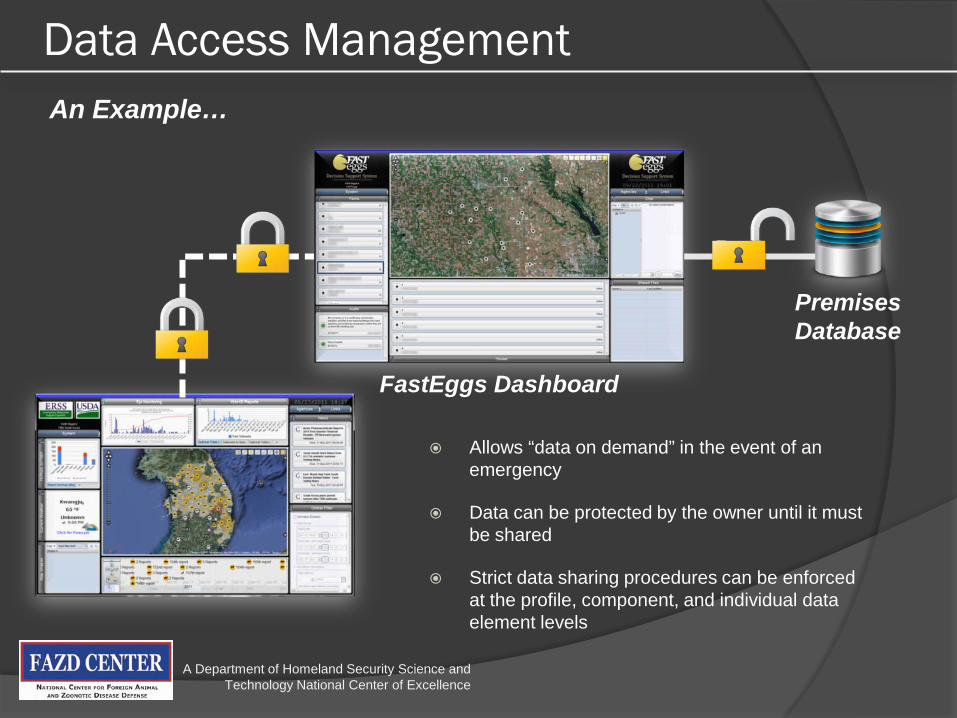
Data Access Management
A Department of Homeland Security Science and Technology National Center of Excellence
FastEggs Dashboard
Premises Database
Allows “data on demand” in the event of an emergency
Data can be protected by the owner until it must be shared
Strict data sharing procedures can be enforced at the profile, component, and individual data element levels
An Example…
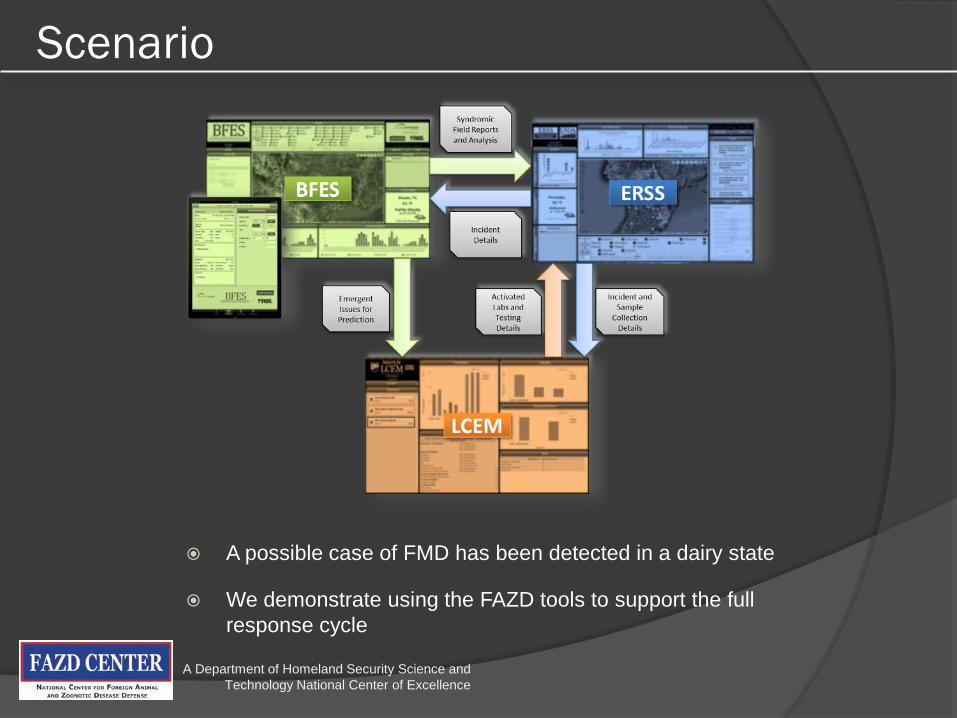
Scenario
A Department of Homeland Security Science and Technology National Center of Excellence
A possible case of FMD has been detected in a dairy state
We demonstrate using the FAZD tools to support the full response cycle
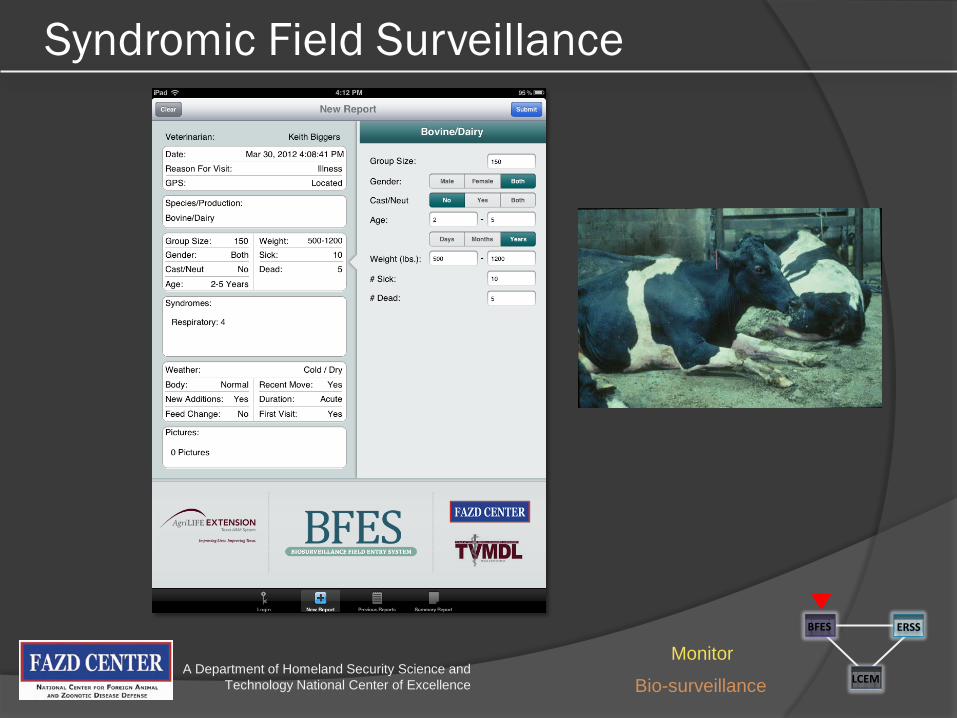
Syndromic Field Surveillance
A Department of Homeland Security Science and Technology National Center of Excellence LCEM
ERSS BFES
Monitor
Bio-surveillance
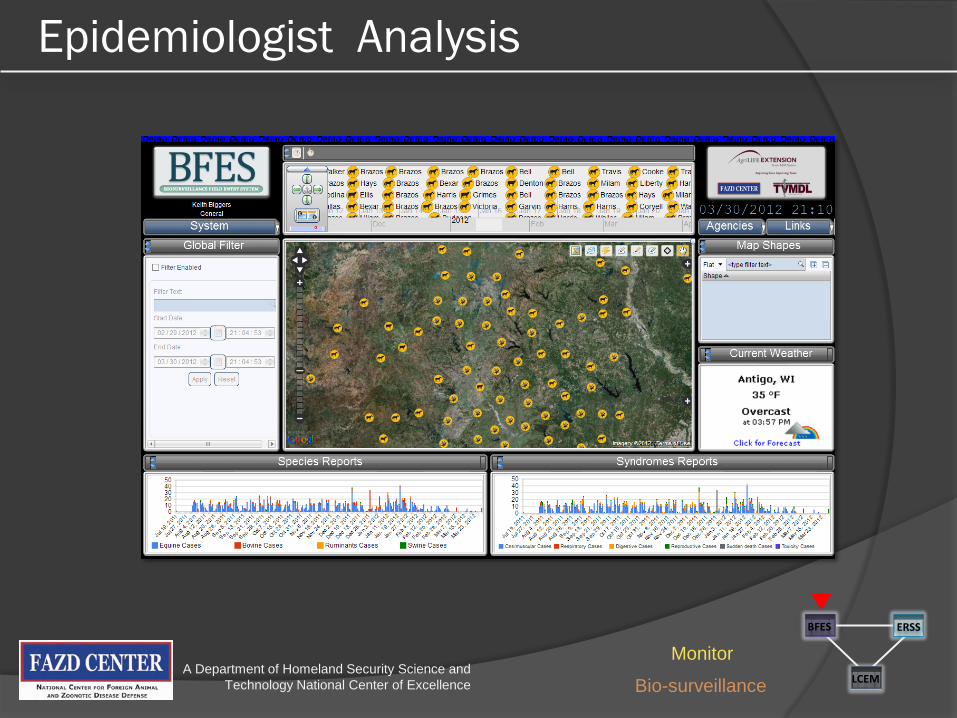
Epidemiologist Analysis
A Department of Homeland Security Science and Technology National Center of Excellence LCEM
ERSS BFES
Monitor
Bio-surveillance
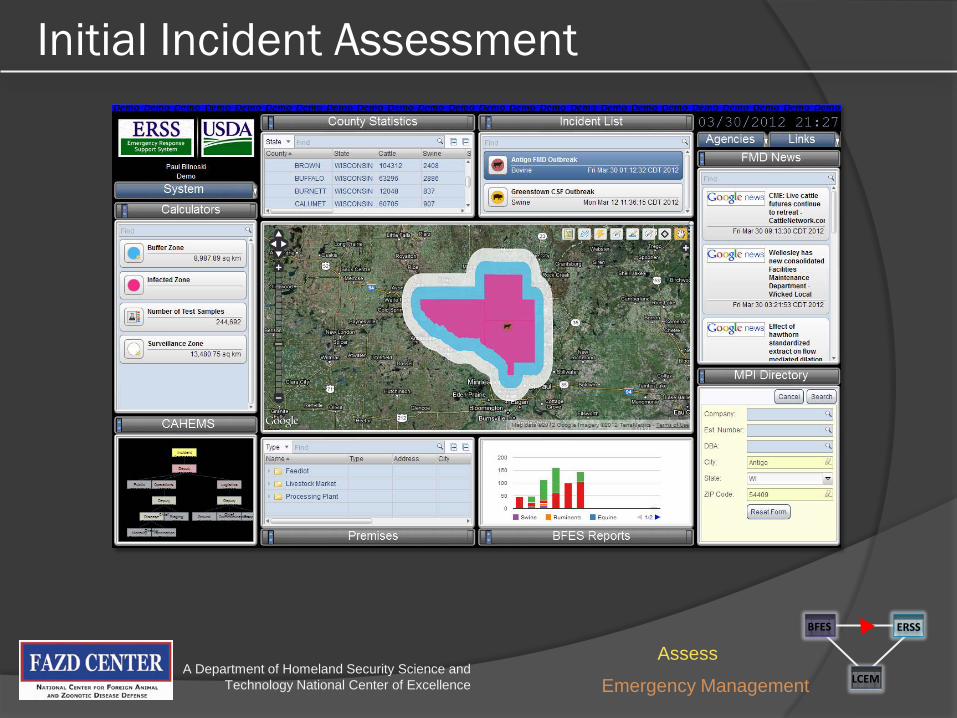
Initial Incident Assessment
A Department of Homeland Security Science and Technology National Center of Excellence LCEM
ERSS BFES
Assess
Emergency Management
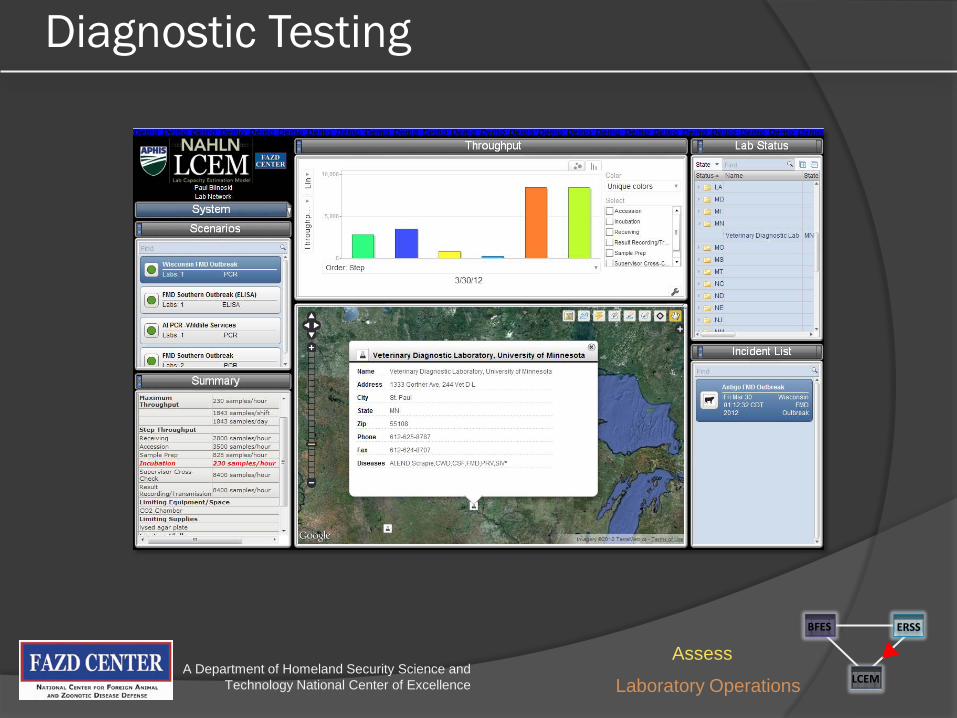
Diagnostic Testing
A Department of Homeland Security Science and Technology National Center of Excellence LCEM
ERSS BFES
Assess
Laboratory Operations
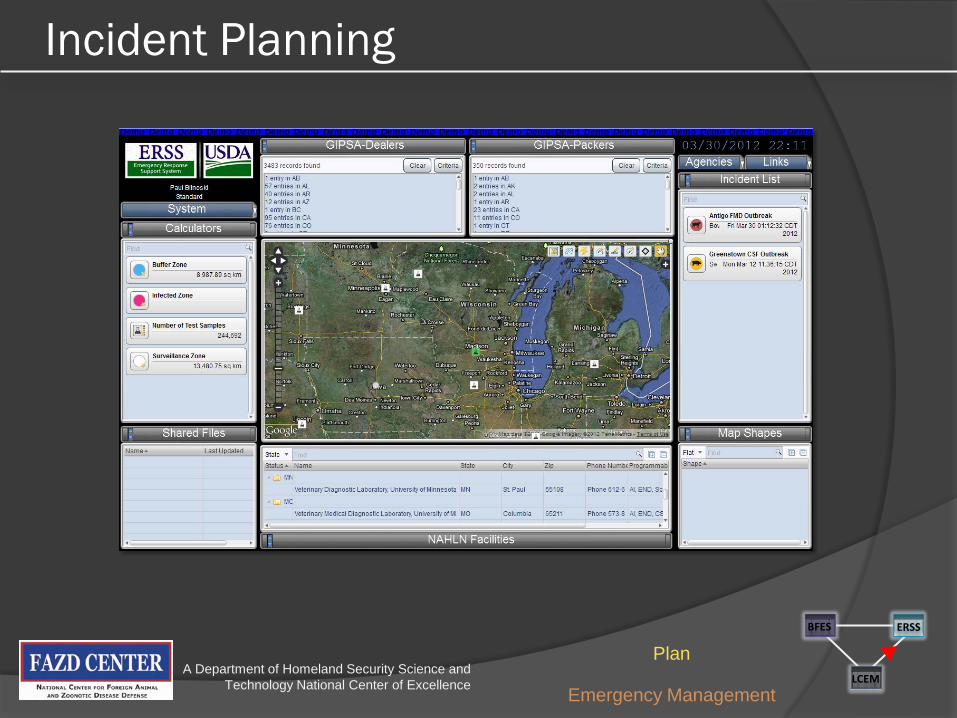
Incident Planning
A Department of Homeland Security Science and Technology National Center of Excellence LCEM
ERSS BFES
Plan
Emergency Management
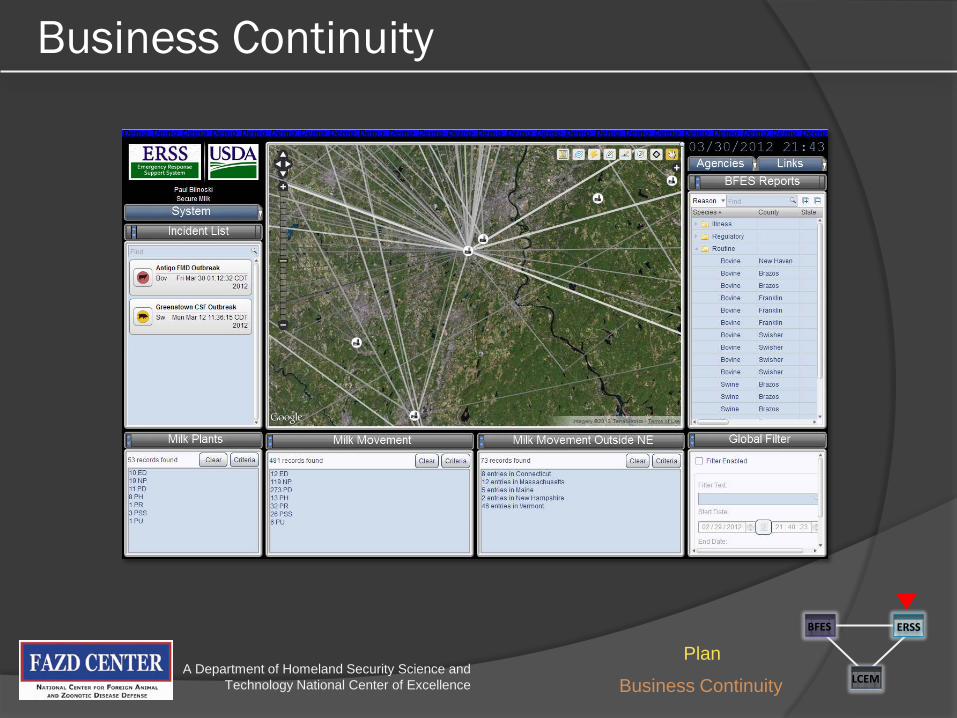
Business Continuity
A Department of Homeland Security Science and Technology National Center of Excellence LCEM
ERSS BFES
Plan
Business Continuity

Incident Management
A Department of Homeland Security Science and Technology National Center of Excellence LCEM
ERSS BFES
Direct
Emergency Management

Current Directions Engage to Excel (E2E) – Business Continuity
• Document information/data requirements needed by stakeholders to establish business continuity and identify potential sources for information/data from other communities
• Establish an operational test bed (information sharing environment (ISE)) among stakeholders to field a prototype system that demonstrates all of the data/information linkages (horizontal and vertical) across stakeholders and suite of tools focused on business continuity operations (including risk management)
• Partnership with the Center for Food Security and Public Health at Iowa State
Laboratory Capacity Estimation Model (LCEM) II
• Improved budget/accounting capability into the software to support trade-off analysis for alternatives to improving throughput capacity in the laboratories
• Enhanced monitoring of consumable laboratory supplies and reagents available in individual laboratories
• Support for NAHLN distributed exercise involving laboratories
A Department of Homeland Security Science and Technology National Center of Excellence
Current Directions (continued)
Enhanced Passive Surveillance
• Extend current program by an additional 20 iPads to veterinarians in Texas and New Mexico with greater diversity in data streams
• Enhance the analyst workstation (IDF-based) by improve tool suite
A Department of Homeland Security Science and Technology National Center of Excellence